Advantage Solutions Inc. · NASDAQ:ADV
Advantage Solutions — Conyers Park II Acquisition — SPAC Merger (October 2020)
44 slides from Advantage Solutions's SPAC merger presentation, Oct 1, 2020
Slide 1: Analyst Day Presentation October 2020
Analyst Day Presentation October 2020
Slide 2: Disclaimer (1/2)
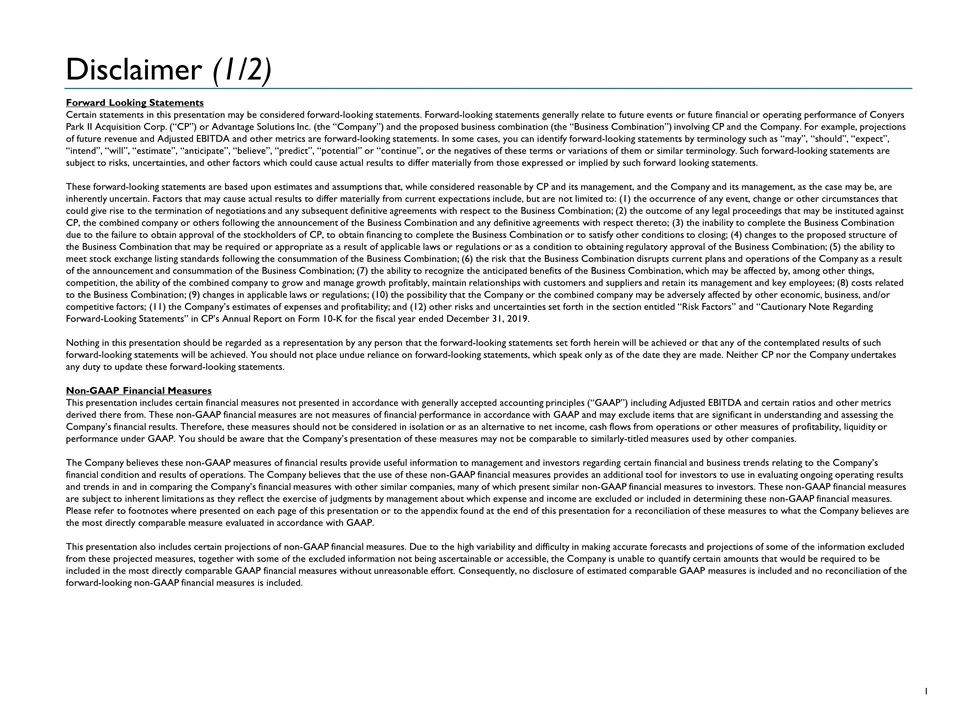
Disclaimer (1/2) Forward Looking Statements Certain statements in this presentation may be considered forward-looking statements. Forward-looking statements generally relate to future events or future financial or operating performance of Conyers Park II Acquisition Corp. (“CP”) or Advantage Solutio
Slide 3: Disclaimer (2/2)
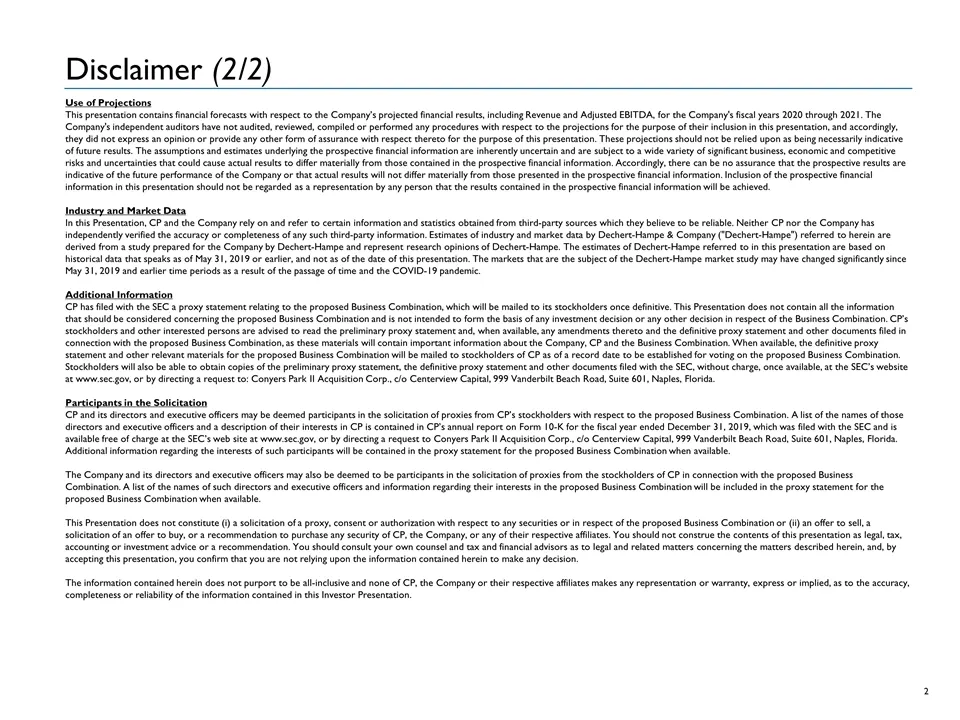
Disclaimer (2/2) Use of Projections This presentation contains financial forecasts with respect to the Company’s projected financial results, including Revenue and Adjusted EBITDA, for the Company's fiscal years 2020 through 2021. The Company's independent auditors have not audited, reviewed, compil
Slide 4: Today’s Participants
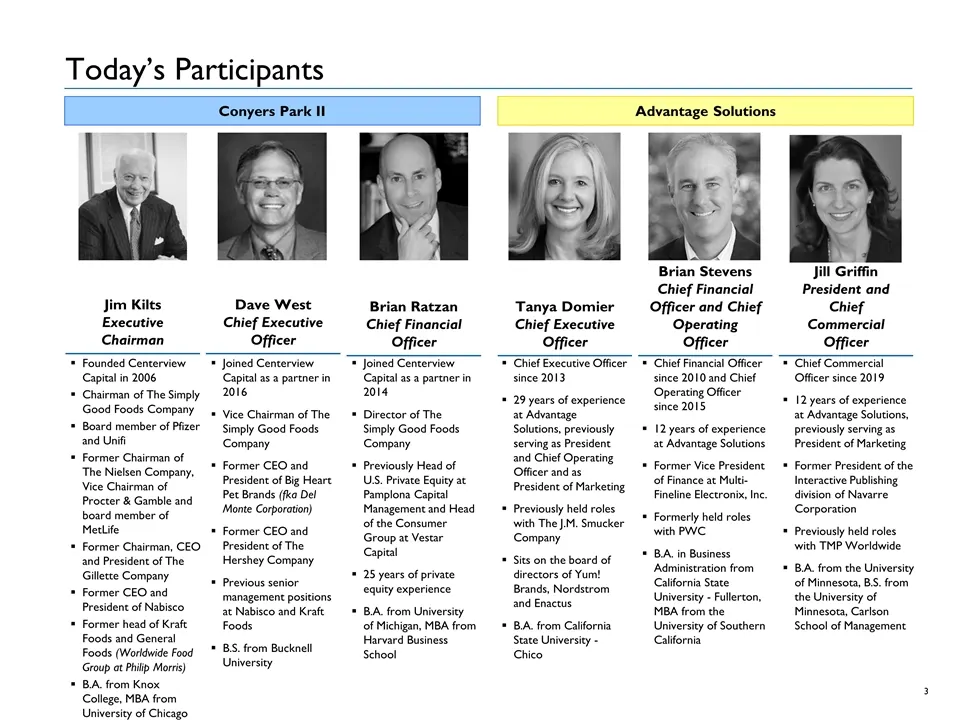
Today’s Participants Advantage Solutions Conyers Park II Founded Centerview Capital in 2006 Chairman of The Simply Good Foods Company Board member of Pfizer and Unifi Former Chairman of The Nielsen Company, Vice Chairman of Procter & Gamble and board member of MetLife Former Chairman, CEO and Presid
Slide 5: Today’s Agenda
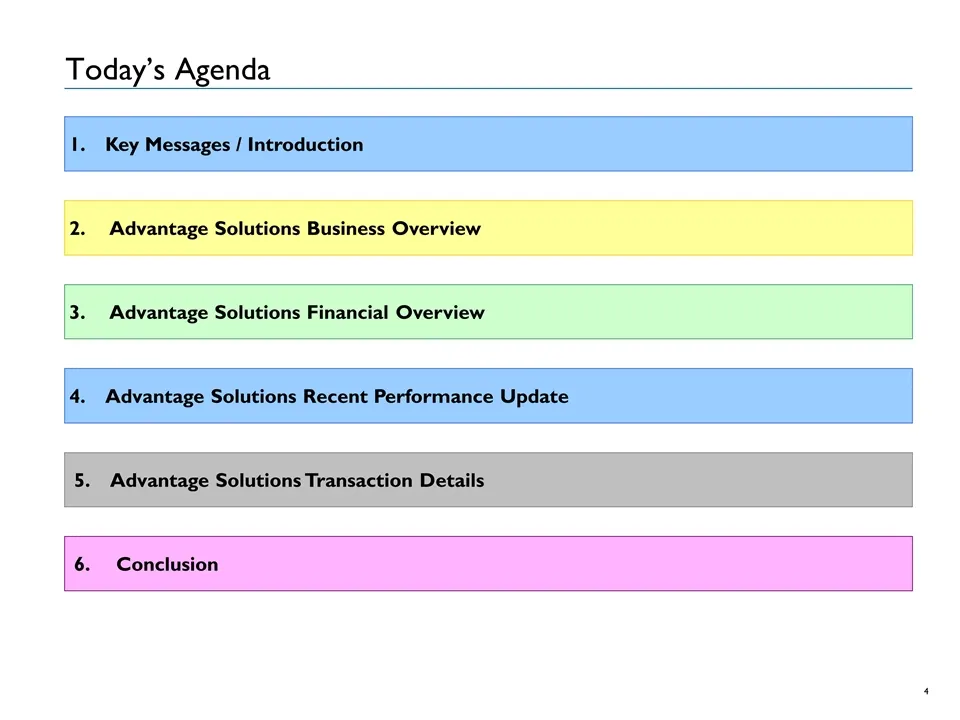
Today’s Agenda 2. Advantage Solutions Business Overview Advantage Solutions Transaction Details Key Messages / Introduction 3. Advantage Solutions Financial Overview 6. Conclusion Advantage Solutions Recent Performance Update

Slide 6: Key Messages / Introduction
Key Messages / Introduction Section 1
Slide 7: Thoughts on the business combination of Conyers Park II with Advantage
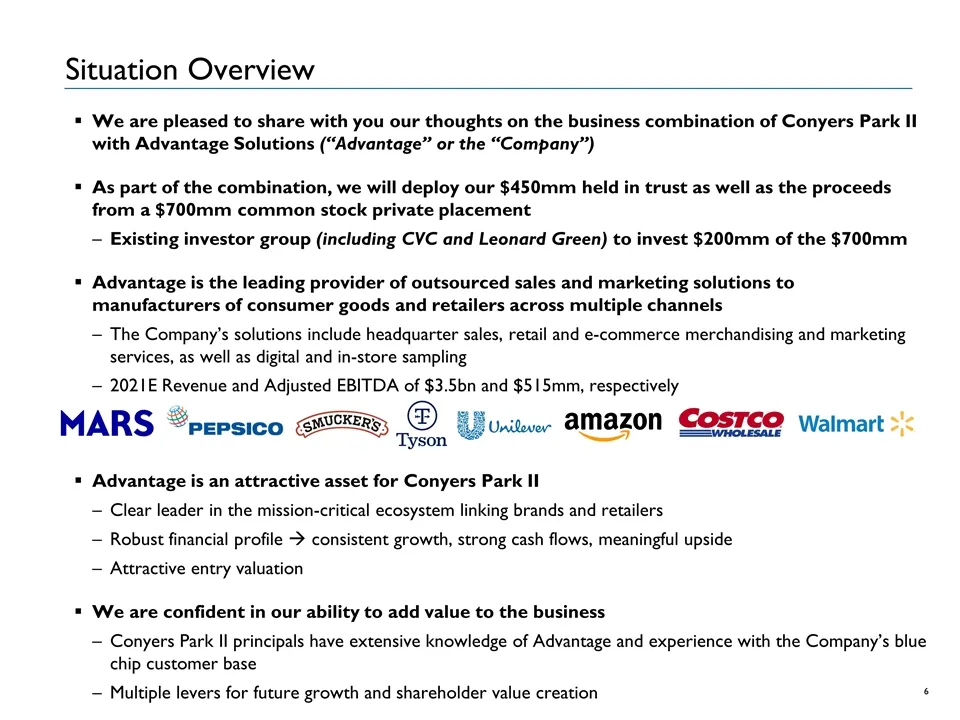
We are pleased to share with you our thoughts on the business combination of Conyers Park II with Advantage Solutions (“Advantage” or the “Company”) As part of the combination, we will deploy our $450mm held in trust as well as the proceeds from a $700mm common stock private placement Existing inves
Slide 8: Our Investment Thesis
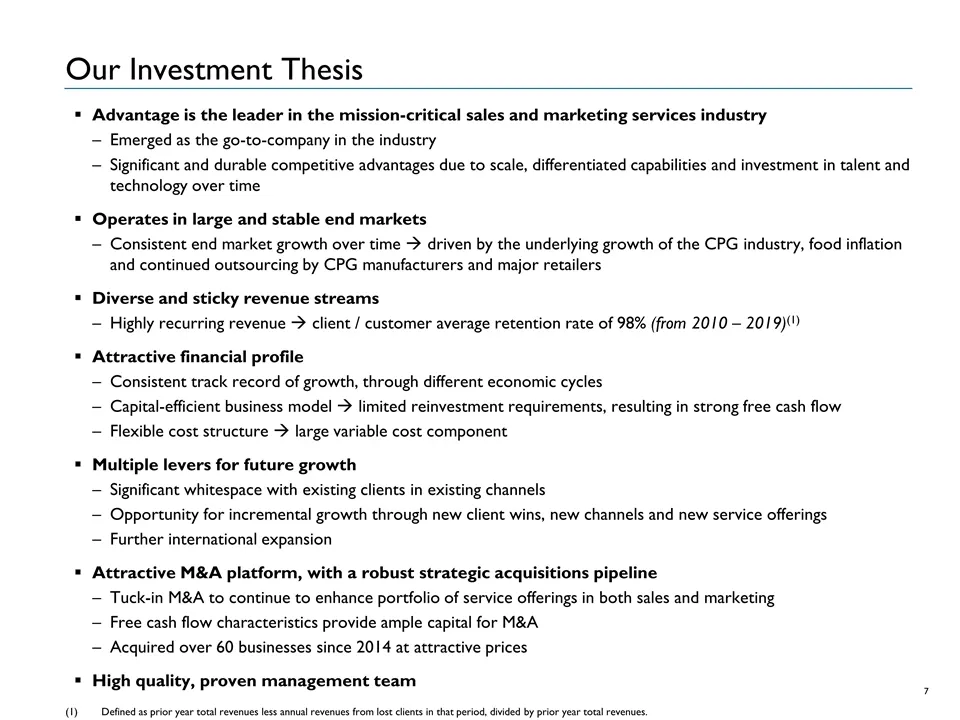
Our Investment Thesis Advantage is the leader in the mission-critical sales and marketing services industry Emerged as the go-to-company in the industry Significant and durable competitive advantages due to scale, differentiated capabilities and investment in talent and technology over time Operates
Slide 9: Why We Believe Advantage Is a Terrific Business and a Terrific Value
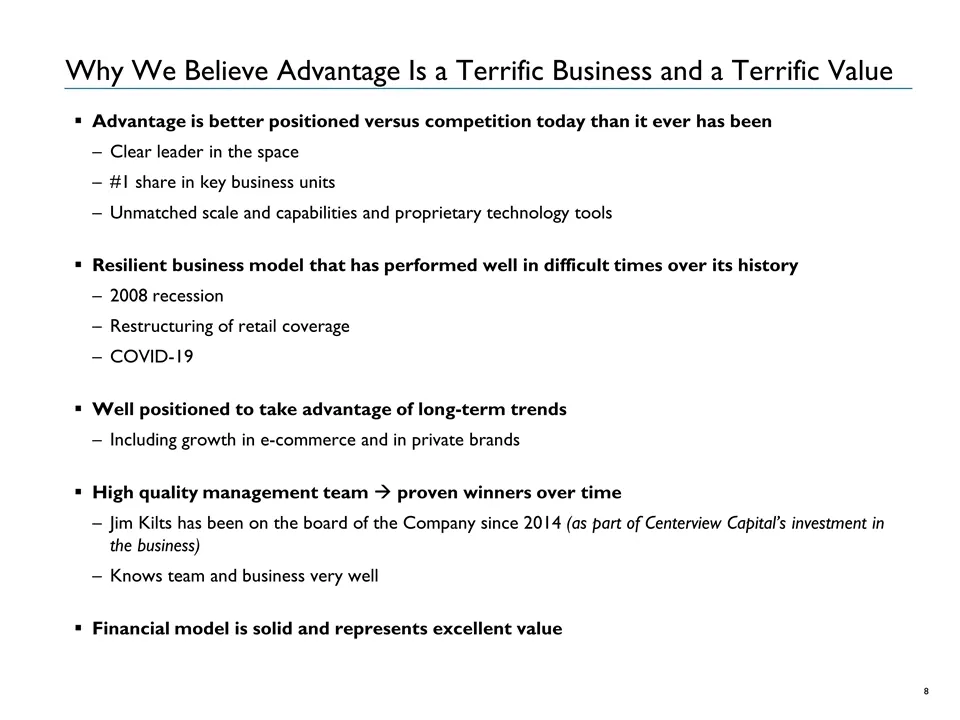
Why We Believe Advantage Is a Terrific Business and a Terrific Value Advantage is better positioned versus competition today than it ever has been Clear leader in the space #1 share in key business units Unmatched scale and capabilities and proprietary technology tools Resilient business model that
Slide 10: Transaction Overview
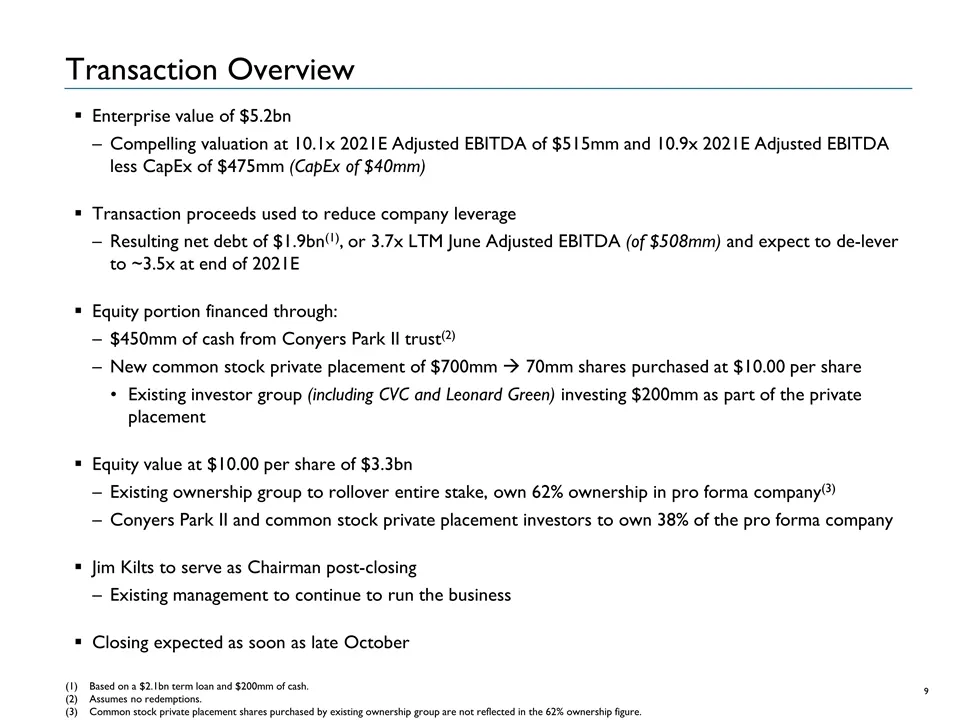
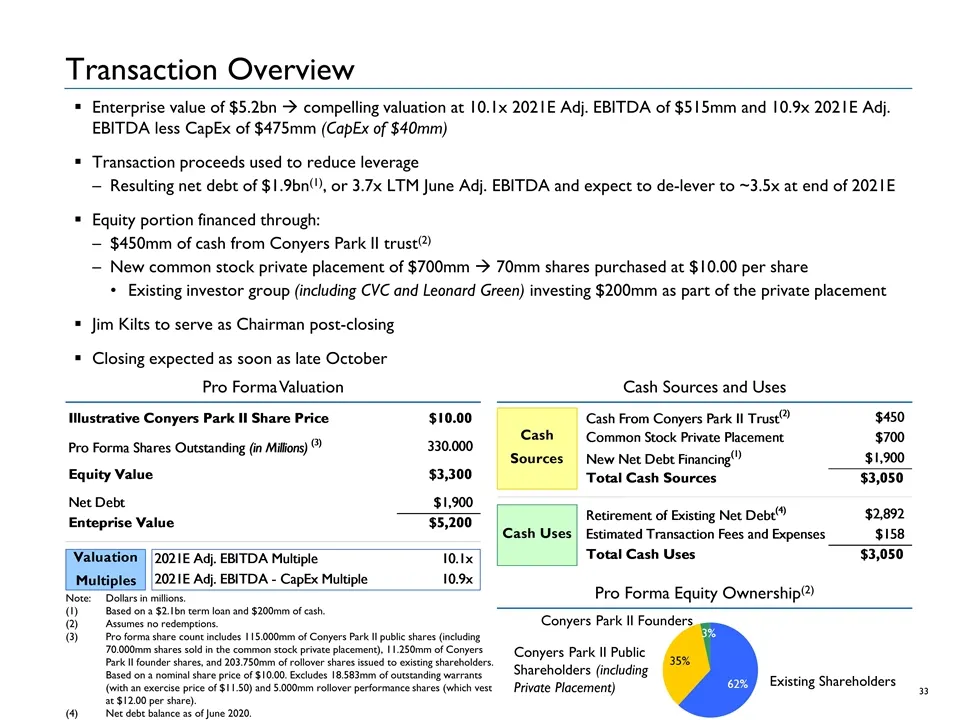
Transaction Overview Enterprise value of $5.2bn Compelling valuation at 10.1x 2021E Adjusted EBITDA of $515mm and 10.9x 2021E Adjusted EBITDA less CapEx of $475mm (CapEx of $40mm) Transaction proceeds used to reduce company leverage Resulting net debt of $1.9bn(1), or 3.7x LTM June Adjusted EBITDA (
Slide 11: Advantage Solutions Business Overview
Advantage Solutions Business Overview Section 2
Slide 12: Company Snapshot
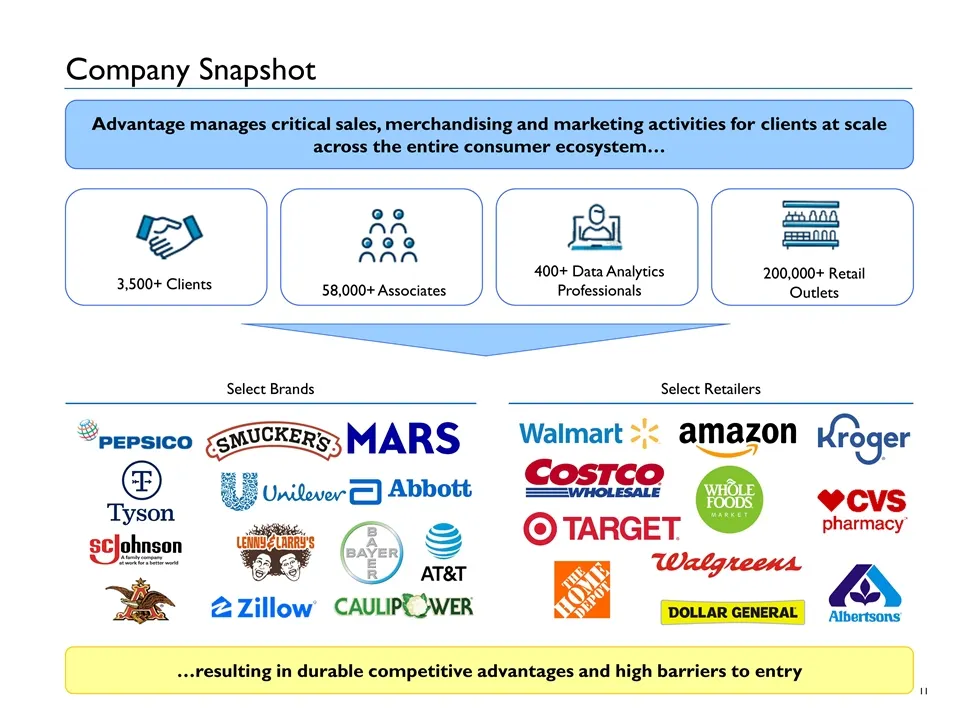
Company Snapshot 400+ Data Analytics Professionals …resulting in durable competitive advantages and high barriers to entry Advantage manages critical sales, merchandising and marketing activities for clients at scale across the entire consumer ecosystem… 3,500+ Clients 200,000+ Retail Outlets 58,000
Slide 13: What Advantage Does
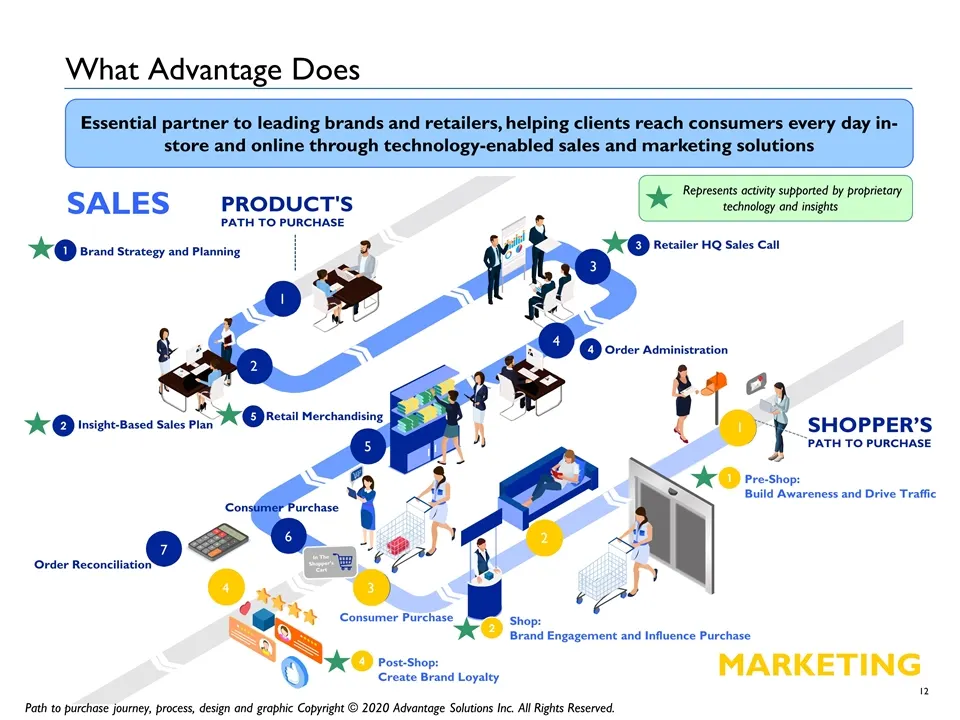
What Advantage Does Essential partner to leading brands and retailers, helping clients reach consumers every day in-store and online through technology-enabled sales and marketing solutions SHOPPER’S PATH TO PURCHASE Pre-Shop: Build Awareness and Drive Traffic Shop: Brand Engagement and Influence Pu
Slide 14: We Divide Advantage Into Two Operating Segments
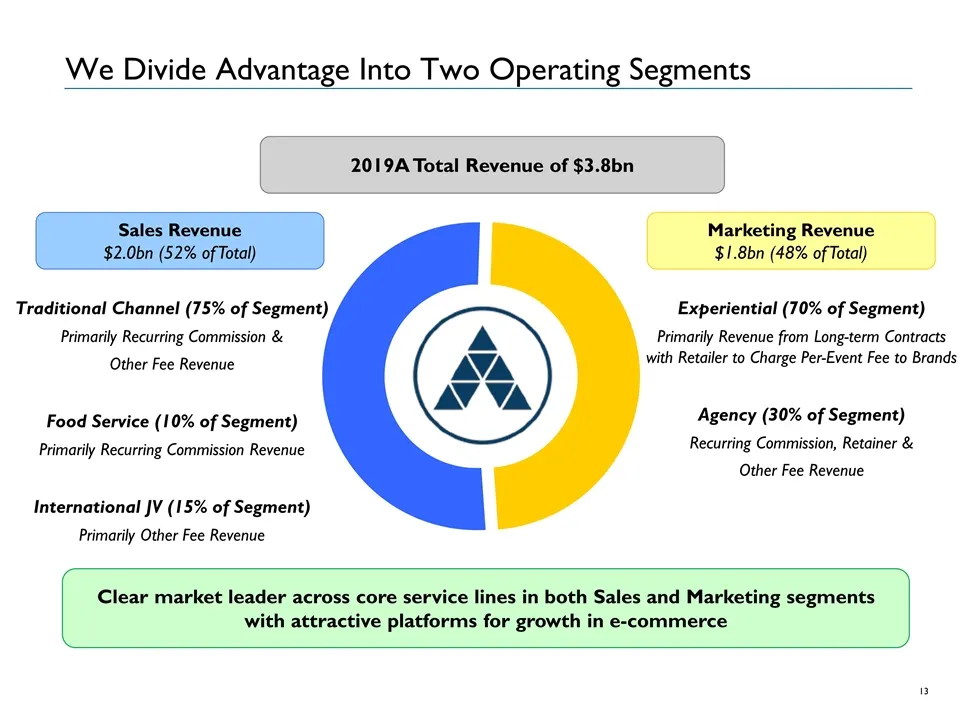
We Divide Advantage Into Two Operating Segments 2019A Total Revenue of $3.8bn Clear market leader across core service lines in both Sales and Marketing segments with attractive platforms for growth in e-commerce Sales Revenue $2.0bn (52% of Total) Marketing Revenue $1.8bn (48% of Total) Traditional
Slide 15: Our Sales Business: Leader in Essential Sales and Merchandising Services
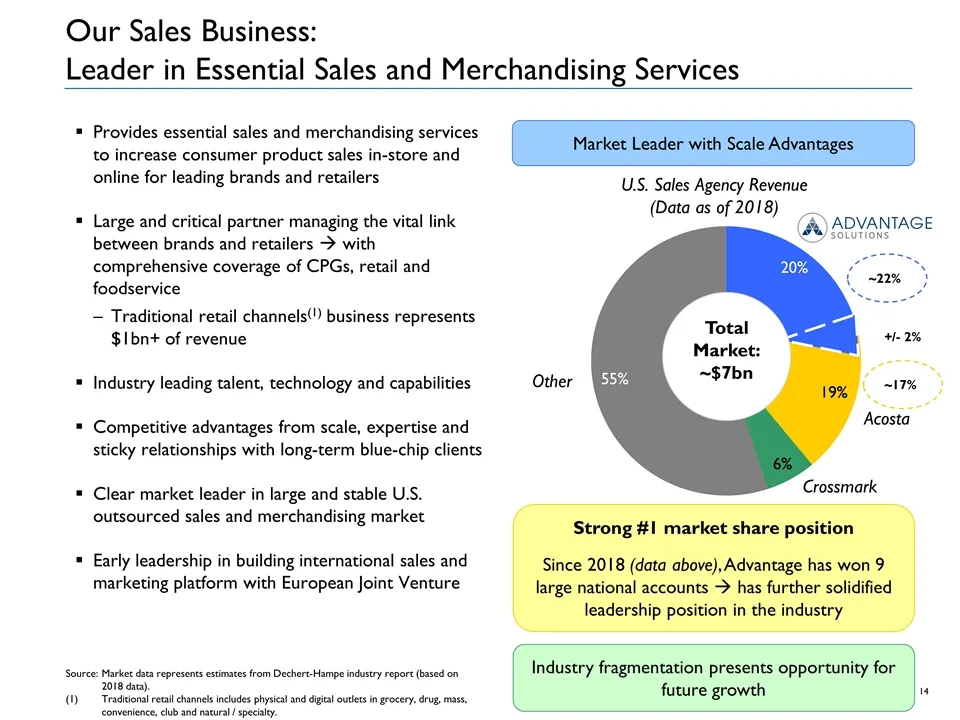
Our Sales Business: Leader in Essential Sales and Merchandising Services U.S. Sales Agency Revenue (Data as of 2018) Acosta Crossmark Other Source: Market data represents estimates from Dechert-Hampe industry report (based on 2018 data). (1)Traditional retail channels includes physical and digital o
Slide 16: Our Marketing Business: Leader in Attractive Large and Growing Categories
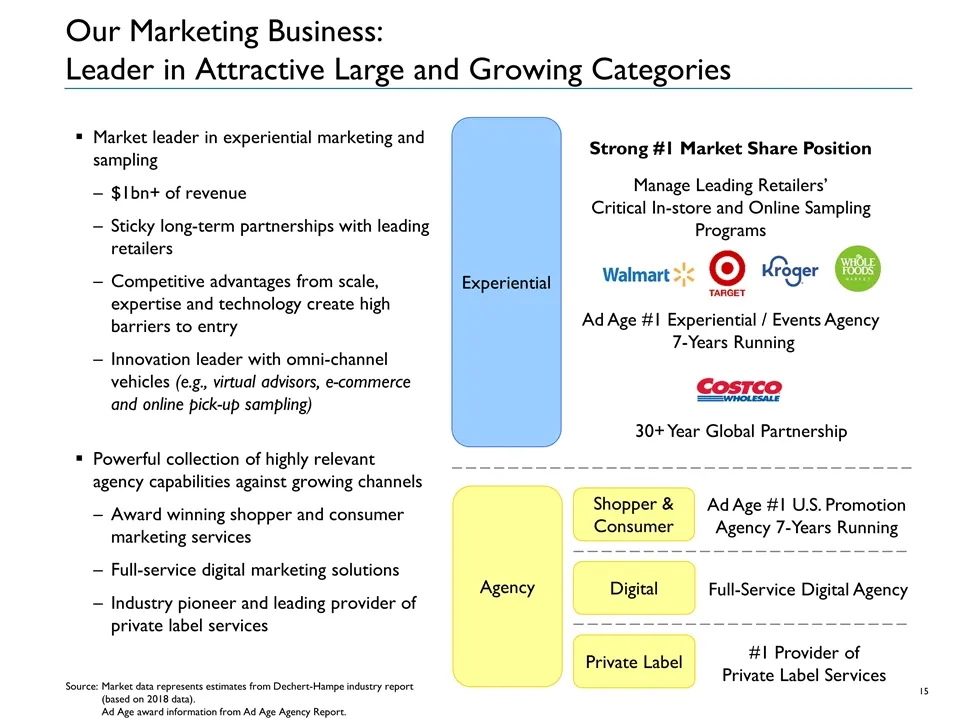
Our Marketing Business: Leader in Attractive Large and Growing Categories Market leader in experiential marketing and sampling $1bn+ of revenue Sticky long-term partnerships with leading retailers Competitive advantages from scale, expertise and technology create high barriers to entry Innovation le
Slide 17: How Advantage Services the E-commerce Market
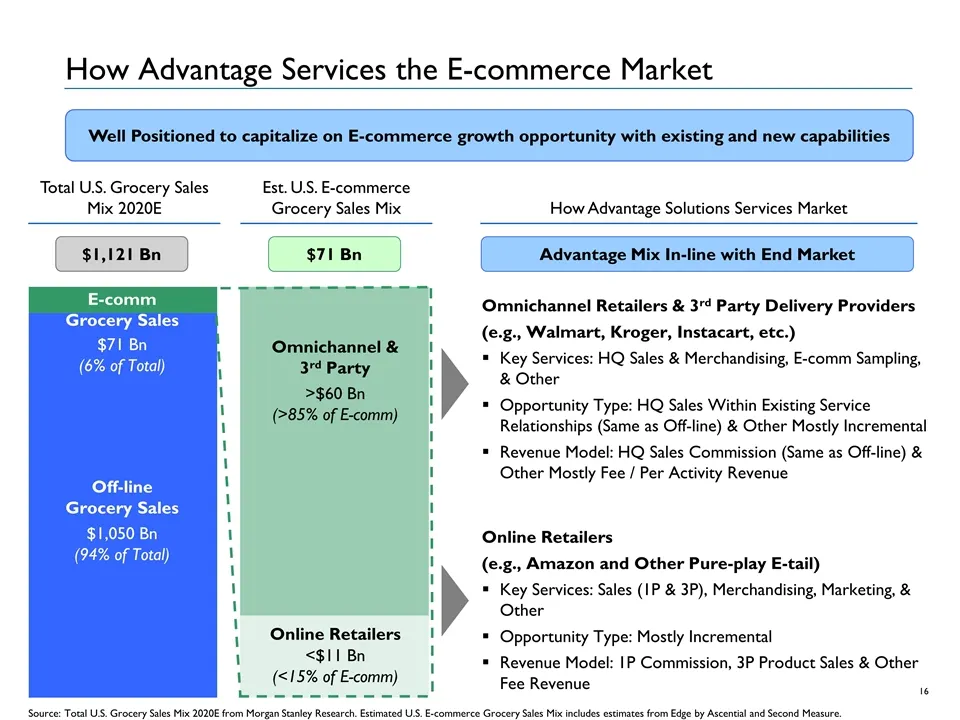
How Advantage Services the E-commerce Market Total U.S. Grocery Sales Mix 2020E Est. U.S. E-commerce Grocery Sales Mix How Advantage Solutions Services Market Online Retailers (e.g., Amazon and Other Pure-play E-tail) Key Services: Sales (1P & 3P), Merchandising, Marketing, & Other Opportunity Type:
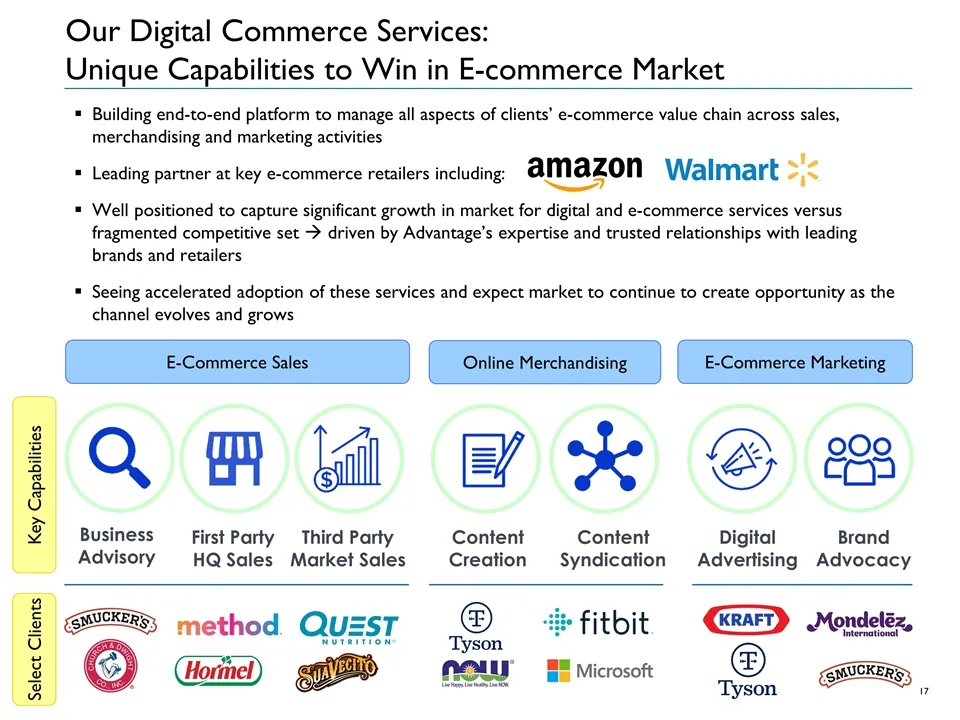
Slide 18: Our Digital Commerce Services: Unique Capabilities to Win in E-commerce
Our Digital Commerce Services: Unique Capabilities to Win in E-commerce Market Building end-to-end platform to manage all aspects of clients’ e-commerce value chain across sales, merchandising and marketing activities Leading partner at key e-commerce retailers including: Well positioned to capture
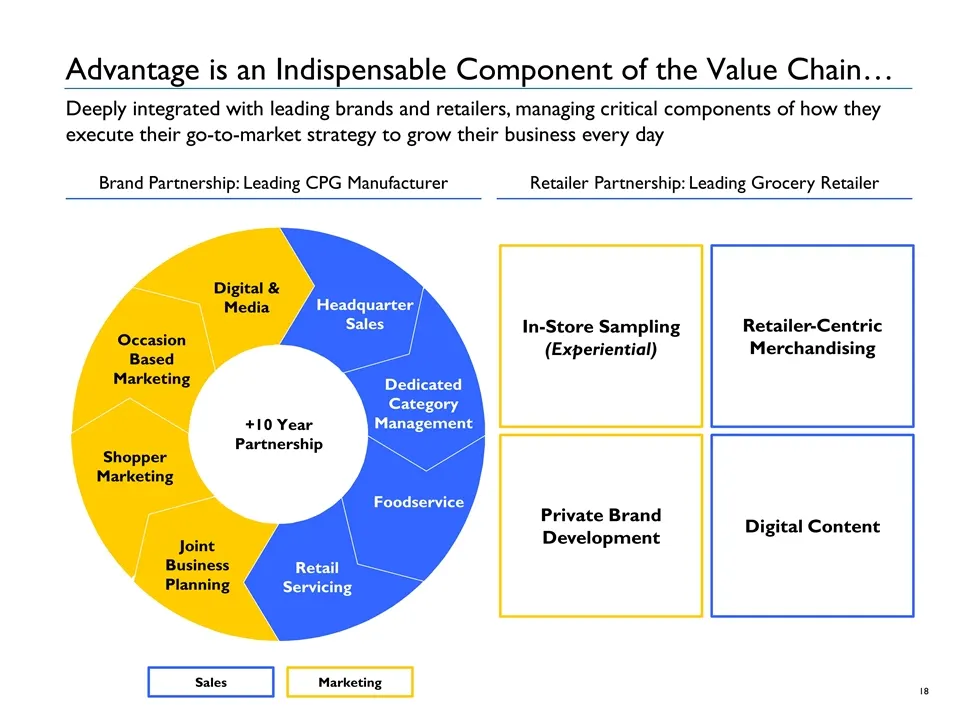
Slide 19: Advantage is an Indispensable Component of the Value Chain
Advantage is an Indispensable Component of the Value Chain… Deeply integrated with leading brands and retailers, managing critical components of how they execute their go-to-market strategy to grow their business every day Brand Partnership: Leading CPG Manufacturer Retailer Partnership: Leading Gro
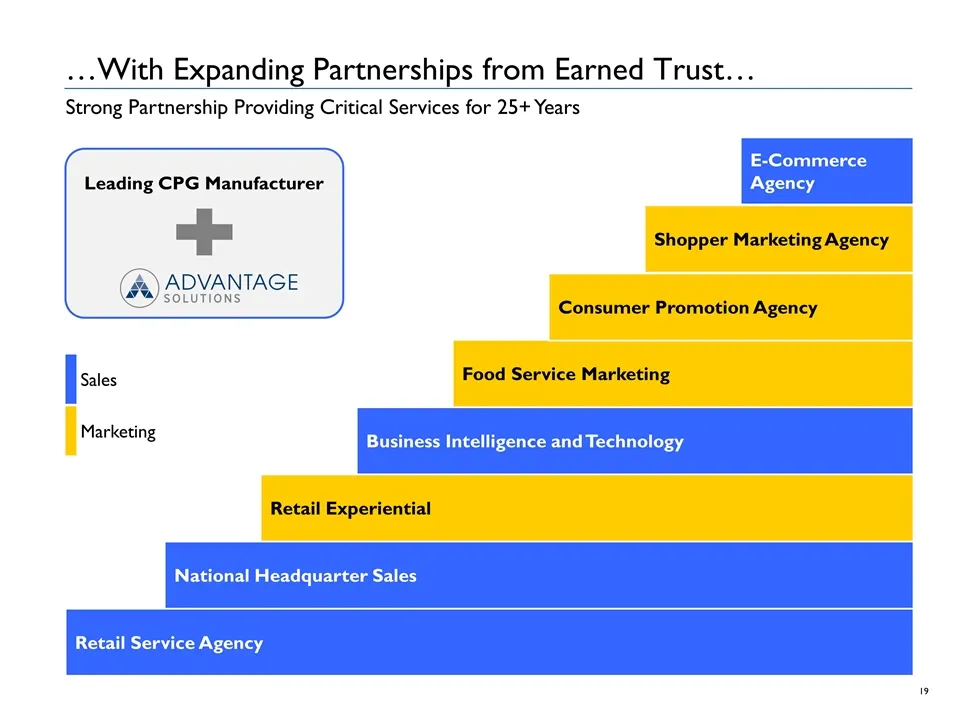
Slide 20: With Expanding Partnerships from Earned Trust
…With Expanding Partnerships from Earned Trust… Retail Service Agency National Headquarter Sales Retail Experiential Business Intelligence and Technology Food Service Marketing Consumer Promotion Agency Shopper Marketing Agency E-Commerce Agency Sales Marketing Strong Partnership Providing Critical
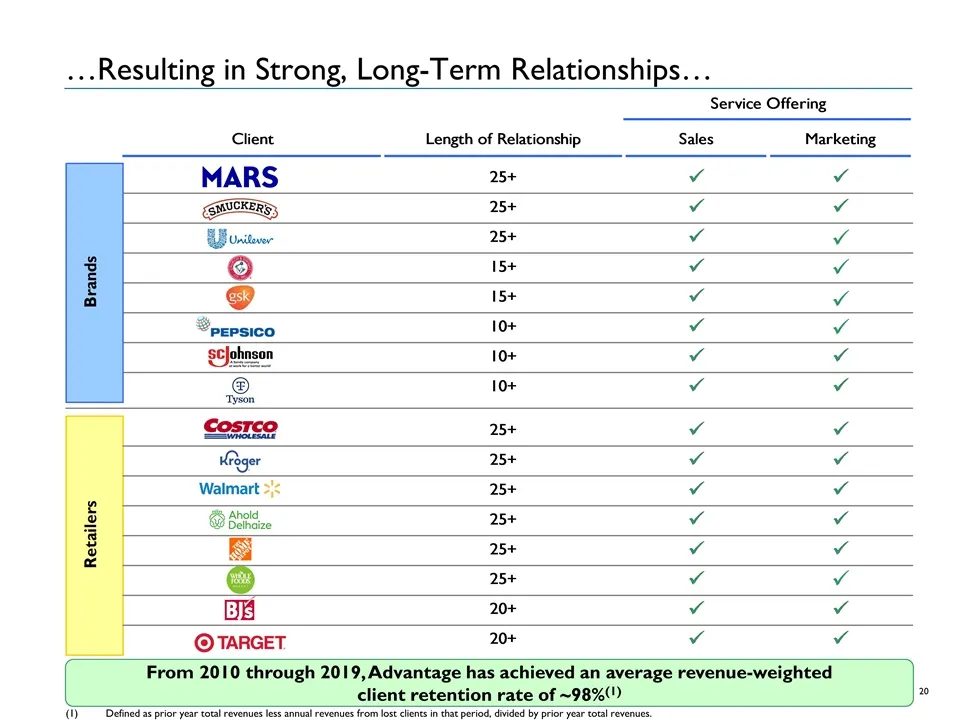
Slide 21: Resulting in Strong, Long-Term Relationships
…Resulting in Strong, Long-Term Relationships… (1) Defined as prior year total revenues less annual revenues from lost clients in that period, divided by prior year total revenues. From 2010 through 2019, Advantage has achieved an average revenue-weighted client retention rate of ~98%(1)
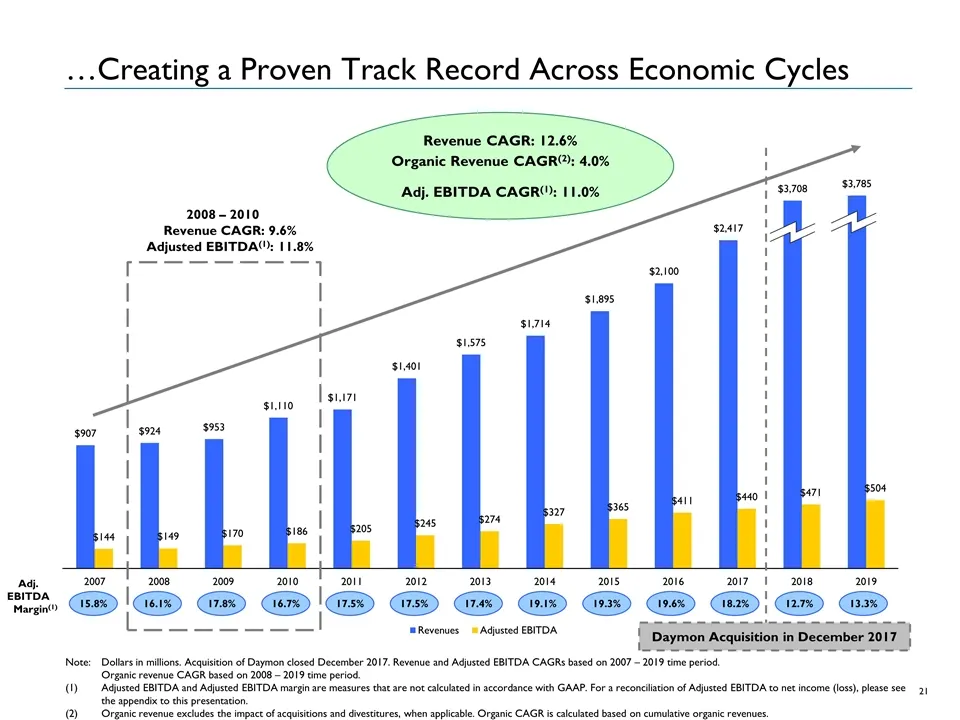
Slide 22: Creating a Proven Track Record Across Economic Cycles
…Creating a Proven Track Record Across Economic Cycles 15.8% 16.1% 17.8% 16.7% 17.5% 17.5% 17.4% 19.1% 19.3% 19.6% 18.2% 12.7% Note: Dollars in millions. Acquisition of Daymon closed December 2017. Revenue and Adjusted EBITDA CAGRs based on 2007 – 2019 time period. Organic revenue CAGR based on 2008
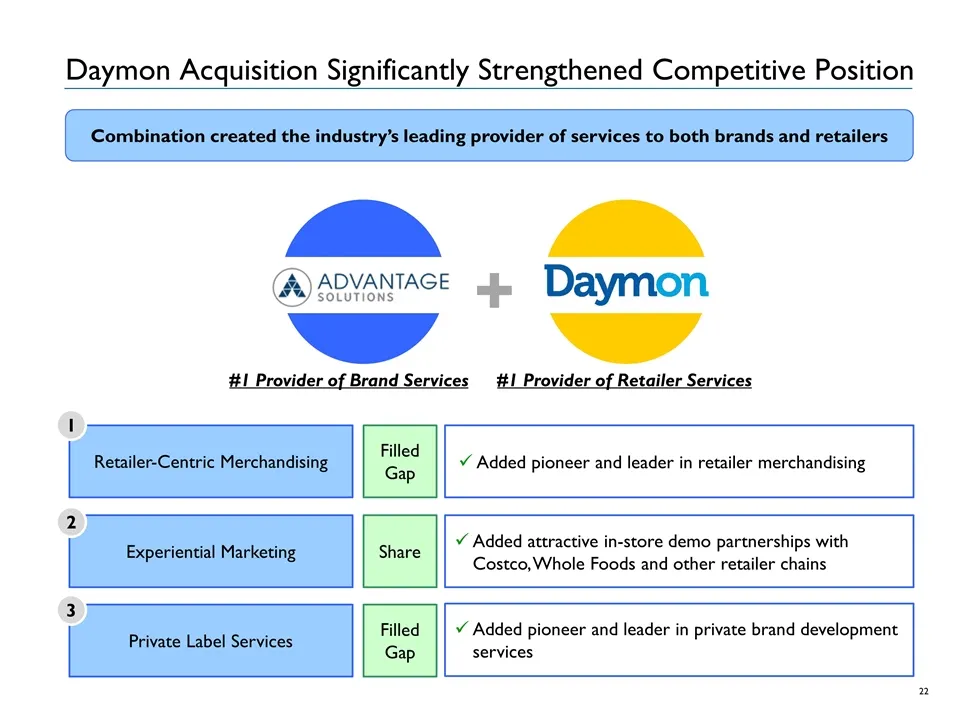
Slide 23: Daymon Acquisition Significantly Strengthened Competitive Position
Daymon Acquisition Significantly Strengthened Competitive Position #1 Provider of Brand Services Retailer-Centric Merchandising Private Label Services Experiential Marketing Filled Gap Filled Gap Share Added pioneer and leader in retailer merchandising Added attractive in-store demo partnerships wit
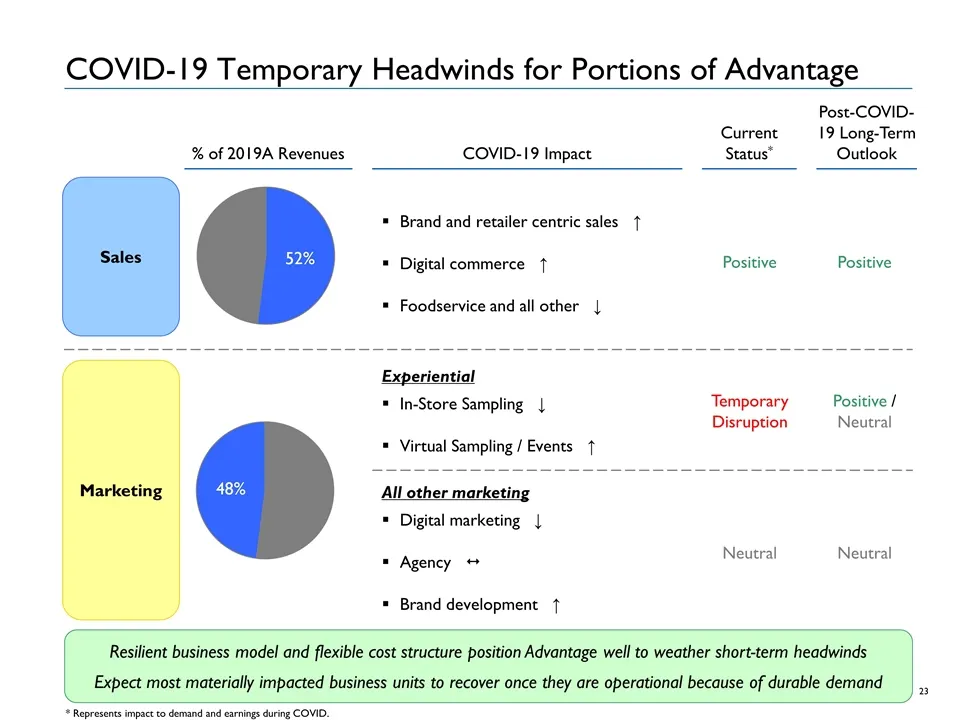
Slide 24: COVID-19 Temporary Headwinds for Portions of Advantage
COVID-19 Temporary Headwinds for Portions of Advantage Marketing Sales % of 2019A Revenues Current Status* COVID-19 Impact Post-COVID-19 Long-Term Outlook Temporary Disruption Positive / Neutral Neutral Neutral Positive Positive Resilient business model and flexible cost structure position Advantage
Slide 25: Advantage Solutions Financial Overview
Advantage Solutions Financial Overview Section 3
Slide 26: Key Drivers of Financial Performance
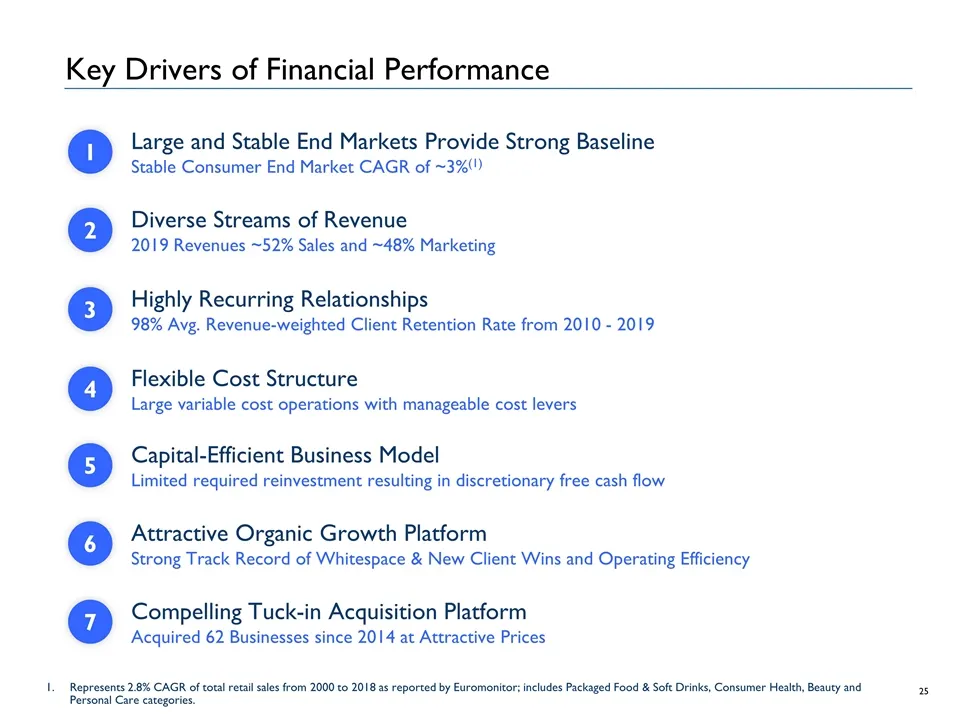
Key Drivers of Financial Performance Large and Stable End Markets Provide Strong Baseline Stable Consumer End Market CAGR of ~3%(1) Diverse Streams of Revenue 2019 Revenues ~52% Sales and ~48% Marketing Highly Recurring Relationships 98% Avg. Revenue-weighted Client Retention Rate from 2010 - 2019 C
Slide 27: Summary Financials – Revenue
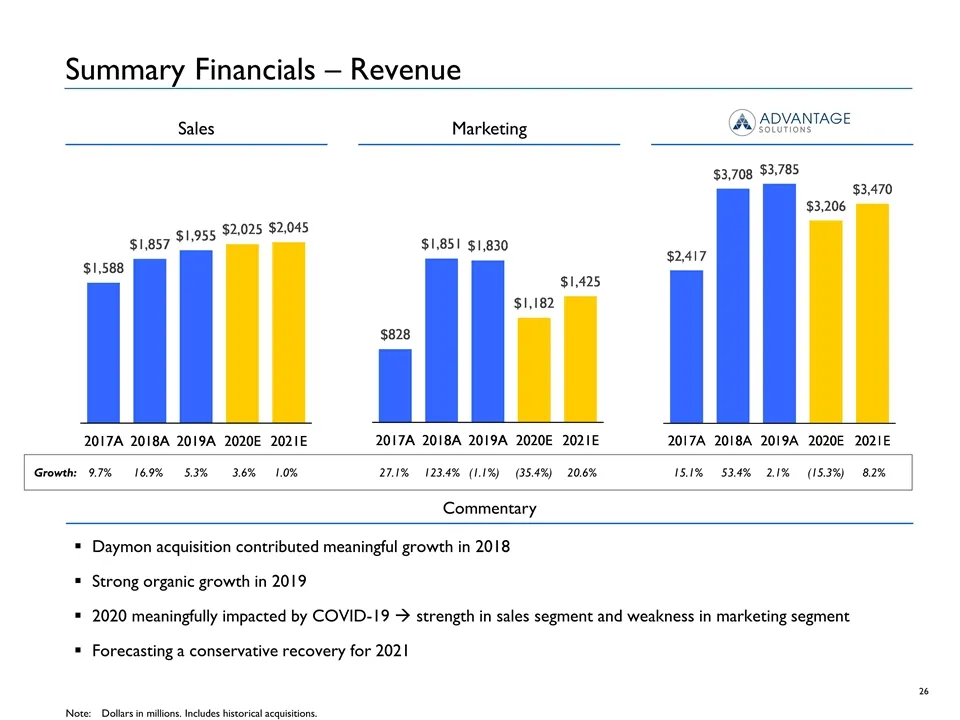
Summary Financials – Revenue Sales Note:Dollars in millions. Includes historical acquisitions. Marketing Commentary Daymon acquisition contributed meaningful growth in 2018 Strong organic growth in 2019 2020 meaningfully impacted by COVID-19 à strength in sales segment and weakness in marketing segm
Slide 28: Summary Financials – Adjusted EBITDA (and % Margin)
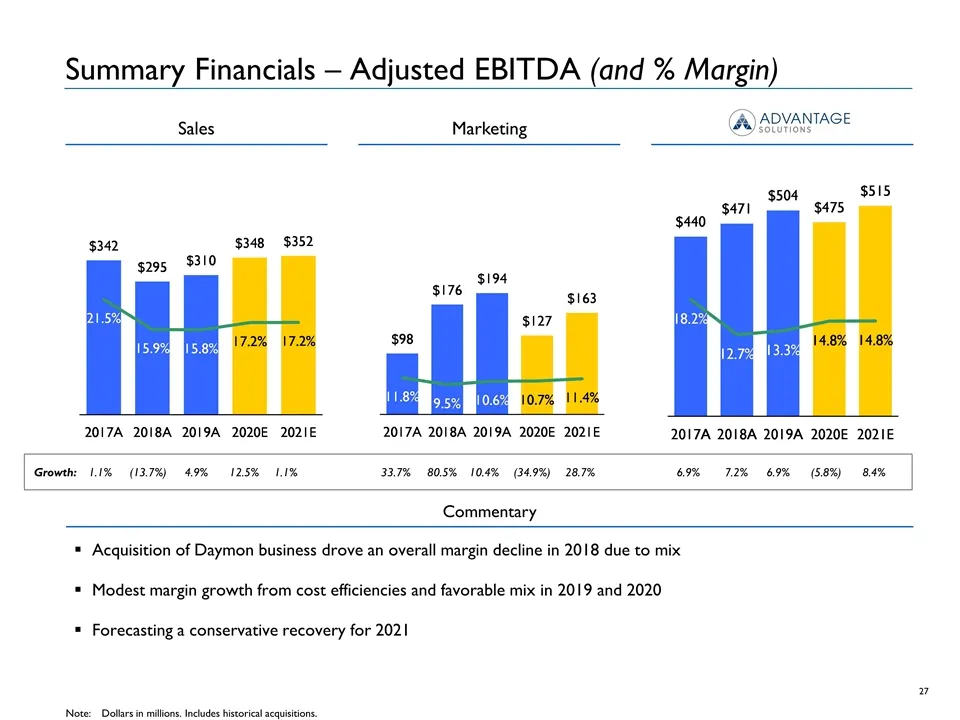
Summary Financials – Adjusted EBITDA (and % Margin) Growth:1.1% (13.7%) 4.9% 12.5% 1.1% 33.7% 80.5% 10.4%(34.9%)28.7% 6.9% 7.2% 6.9% (5.8%)8.4% Commentary Acquisition of Daymon business drove an overall margin decline in 2018 due to mix Modest margin growth from cost efficiencies and favorable mix i
Slide 29: Long-Term Outlook
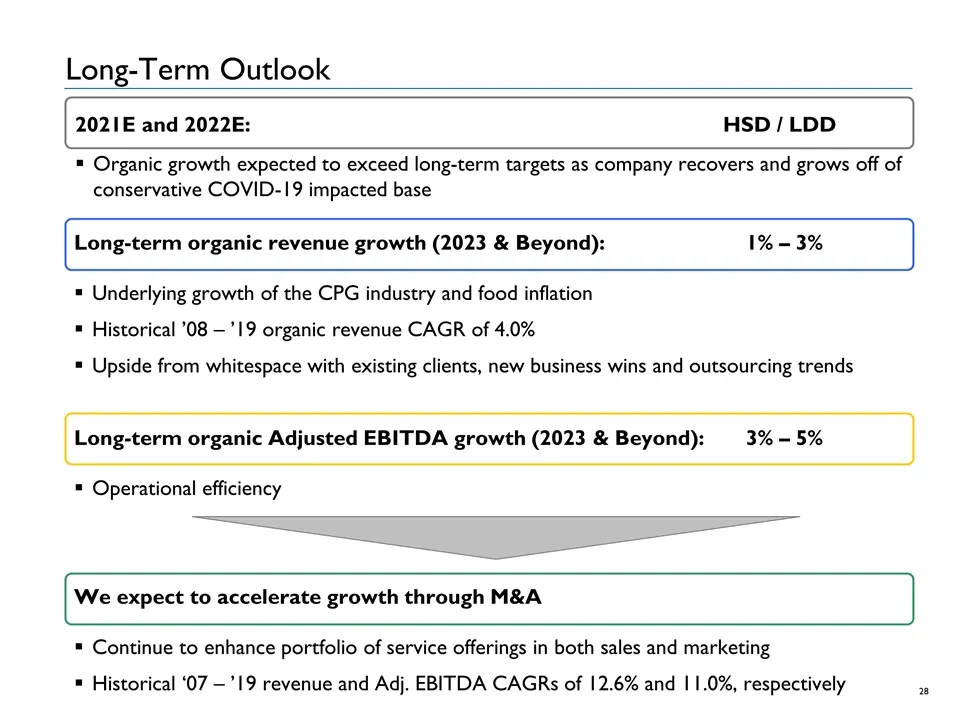
Long-Term Outlook Long-term organic revenue growth (2023 & Beyond):1% – 3% Underlying growth of the CPG industry and food inflation Historical ’08 – ’19 organic revenue CAGR of 4.0% Upside from whitespace with existing clients, new business wins and outsourcing trends Long-term organic Adjusted EBIT
Slide 30: Strategic and Financially Attractive Tuck-In Acquisition Strategy
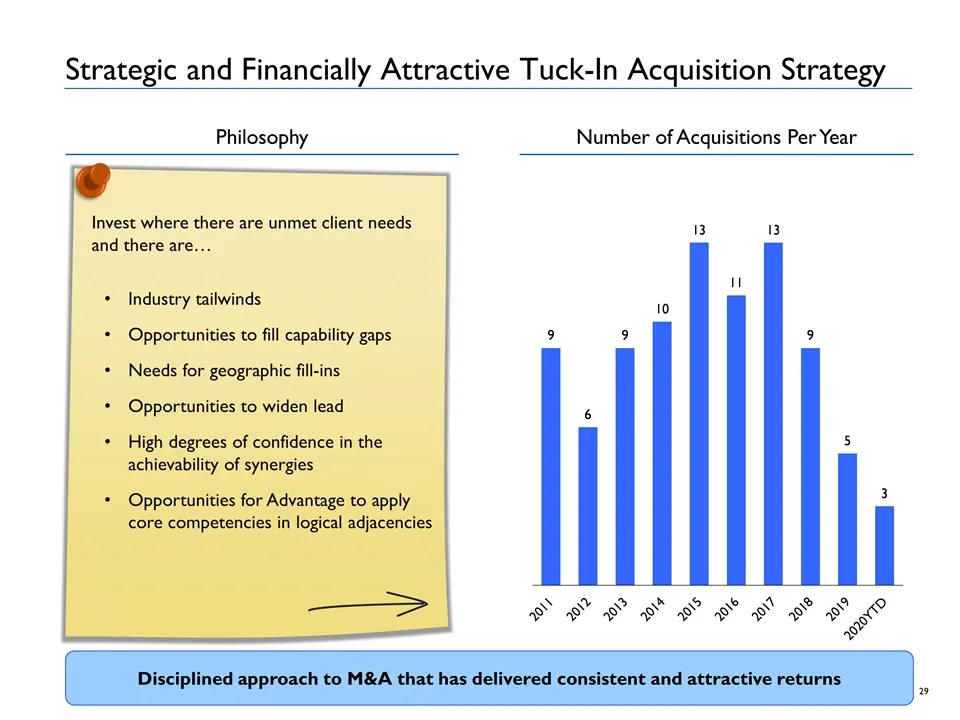
Strategic and Financially Attractive Tuck-In Acquisition Strategy Number of Acquisitions Per Year Philosophy Disciplined approach to M&A that has delivered consistent and attractive returns Invest where there are unmet client needs and there are… Industry tailwinds Opportunities to fill capability g
Slide 31: Advantage Solutions Recent Performance Update
Advantage Solutions Recent Performance Update Section 4
Slide 32: First Half of 2020 Summary
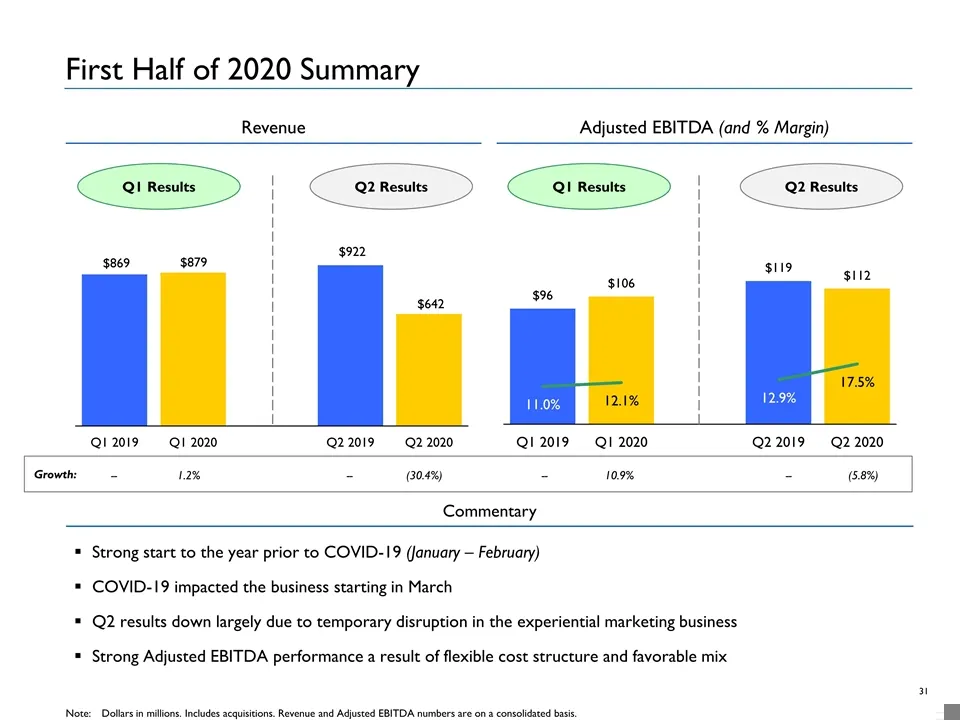
First Half of 2020 Summary Revenue Adjusted EBITDA (and % Margin) Strong start to the year prior to COVID-19 (January – February) COVID-19 impacted the business starting in March Q2 results down largely due to temporary disruption in the experiential marketing business Strong Adjusted EBITDA perform
Slide 33: Advantage Solutions Transaction Details
Advantage Solutions Transaction Details Section 5
Slide 34: Transaction Overview
Transaction Overview Note:Dollars in millions. Based on a $2.1bn term loan and $200mm of cash. Assumes no redemptions. Pro forma share count includes 115.000mm of Conyers Park II public shares (including 70.000mm shares sold in the common stock private placement), 11.250mm of Conyers Park II founder
Slide 35: Operating Benchmarking to Peers
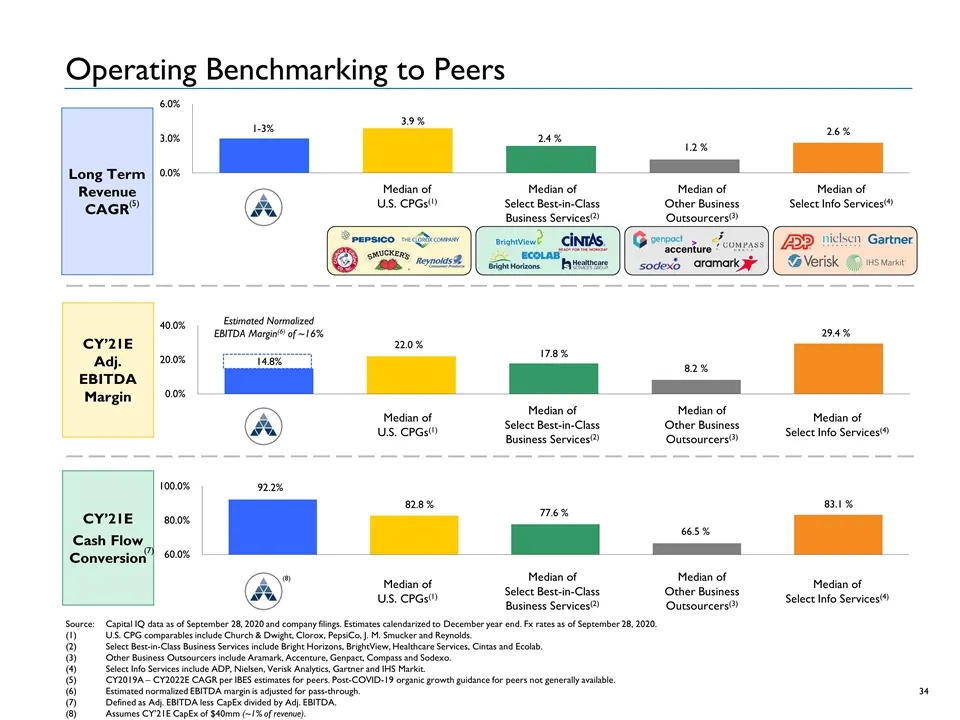
Operating Benchmarking to Peers Source:Capital IQ data as of September 28, 2020 and company filings. Estimates calendarized to December year end. Fx rates as of September 28, 2020. U.S. CPG comparables include Church & Dwight, Clorox, PepsiCo, J. M. Smucker and Reynolds. Select Best-in-Class Busines
Slide 36: Valuation Benchmarking to Peers
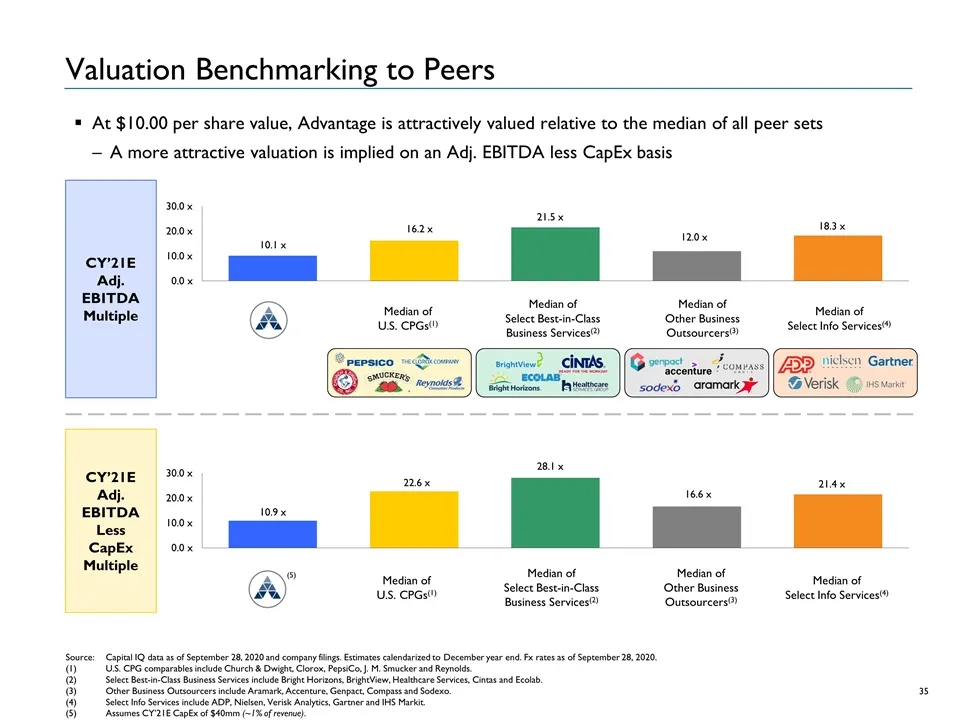
Valuation Benchmarking to Peers At $10.00 per share value, Advantage is attractively valued relative to the median of all peer sets A more attractive valuation is implied on an Adj. EBITDA less CapEx basis CY’21E Adj. EBITDA Multiple CY’21E Adj. EBITDA Less CapEx Multiple Median of U.S. CPGs(1) Medi

Slide 37: Conclusion
Conclusion Section 6
Slide 38: In Conclusion…
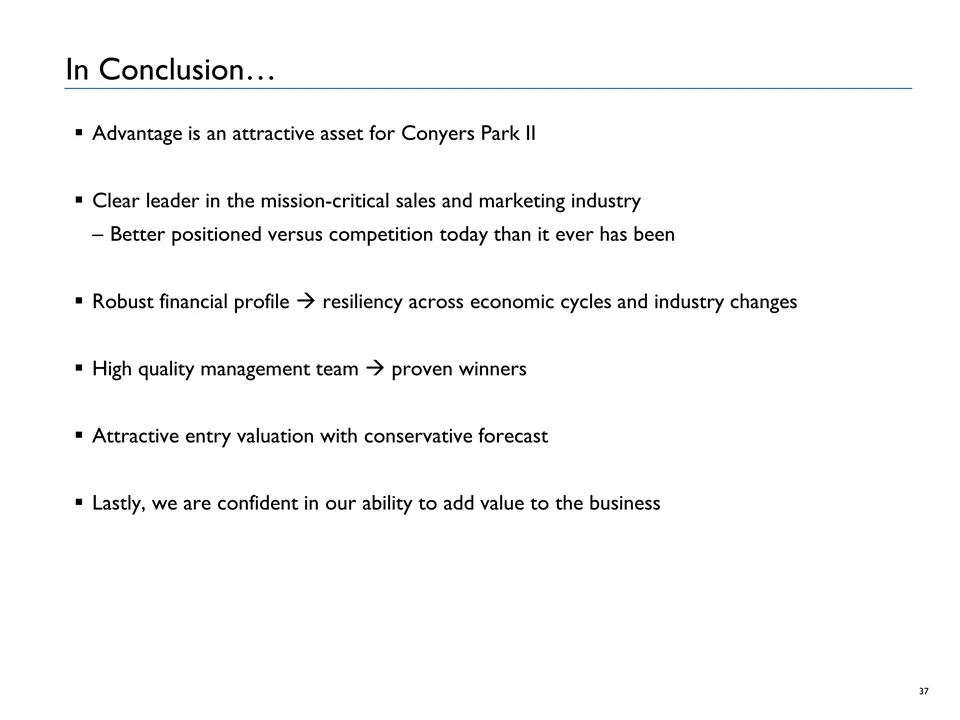
In Conclusion… Advantage is an attractive asset for Conyers Park II Clear leader in the mission-critical sales and marketing industry Better positioned versus competition today than it ever has been Robust financial profile à resiliency across economic cycles and industry changes High quality manage
Slide 39: Appendix
Appendix
Slide 40: Peer Benchmarking
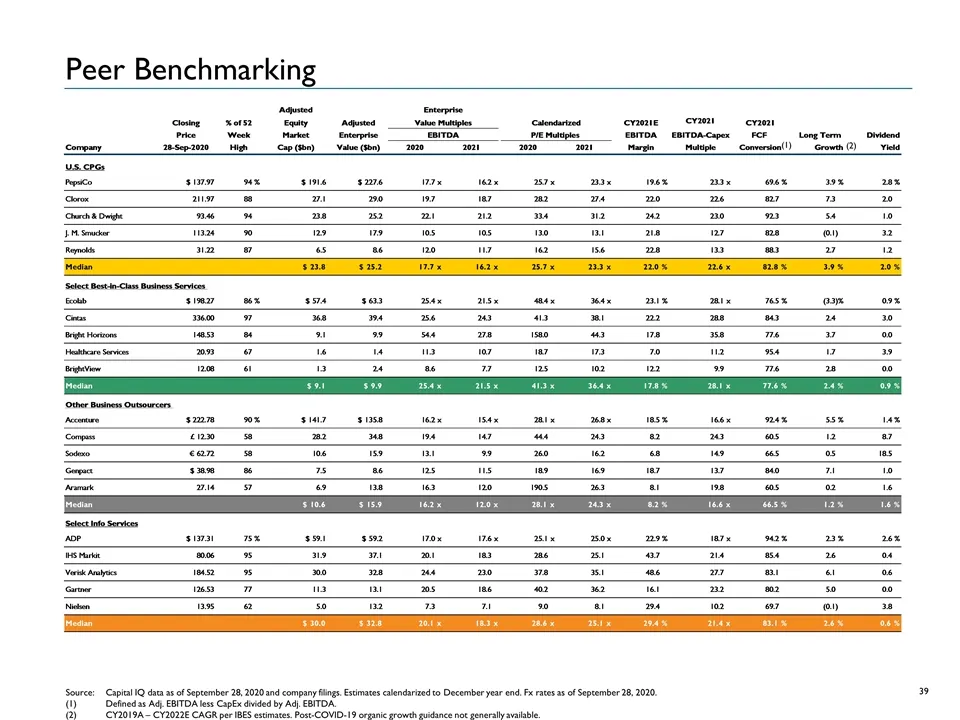
Peer Benchmarking Source:Capital IQ data as of September 28, 2020 and company filings. Estimates calendarized to December year end. Fx rates as of September 28, 2020. Defined as Adj. EBITDA less CapEx divided by Adj. EBITDA. CY2019A – CY2022E CAGR per IBES estimates. Post-COVID-19 organic growth gui
Slide 41: Q2 2020 Update
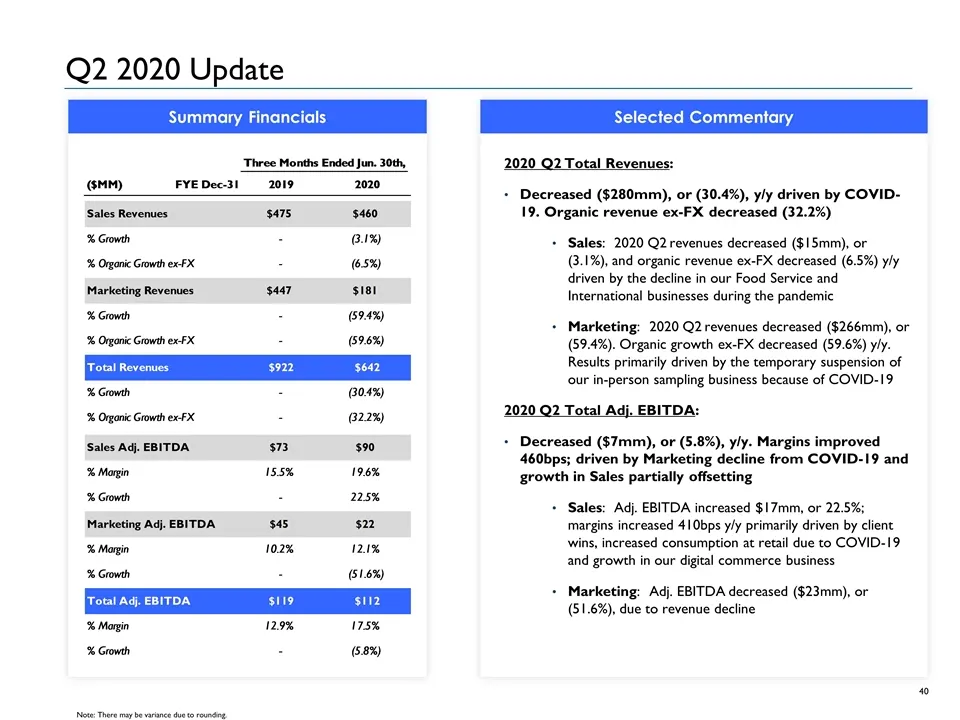
Q2 2020 Update Note: There may be variance due to rounding. Selected Commentary Summary Financials 2020 Q2 Total Revenues: Decreased ($280mm), or (30.4%), y/y driven by COVID-19. Organic revenue ex-FX decreased (32.2%) Sales: 2020 Q2 revenues decreased ($15mm), or (3.1%), and organic revenue ex-FX d
Slide 42: First Half of 2020 Update
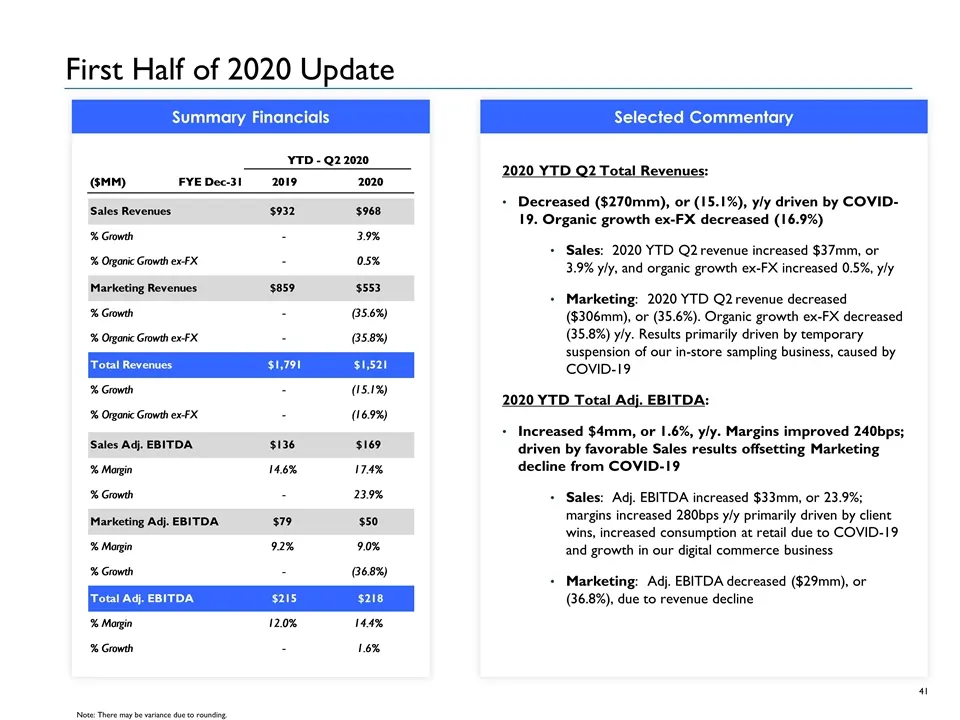
First Half of 2020 Update Selected Commentary Summary Financials 2020 YTD Q2 Total Revenues: Decreased ($270mm), or (15.1%), y/y driven by COVID-19. Organic growth ex-FX decreased (16.9%) Sales: 2020 YTD Q2 revenue increased $37mm, or 3.9% y/y, and organic growth ex-FX increased 0.5%, y/y Marketing:
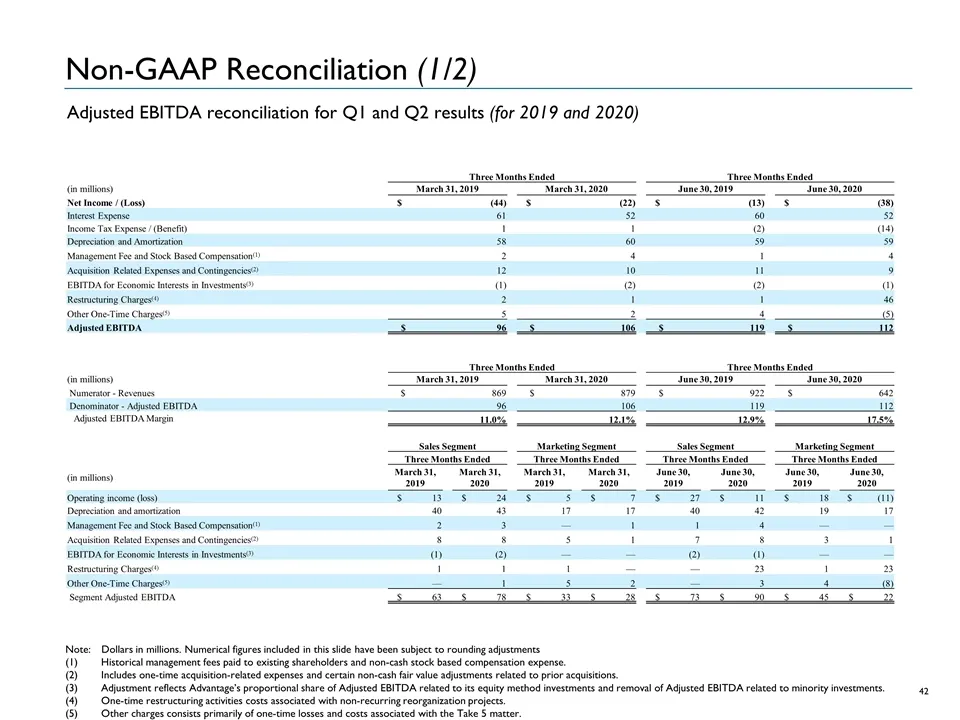
Slide 43: Non-GAAP Reconciliation (1/2)
Non-GAAP Reconciliation (1/2) Note: Dollars in millions. Numerical figures included in this slide have been subject to rounding adjustments Historical management fees paid to existing shareholders and non-cash stock based compensation expense. Includes one-time acquisition-related expenses and certa
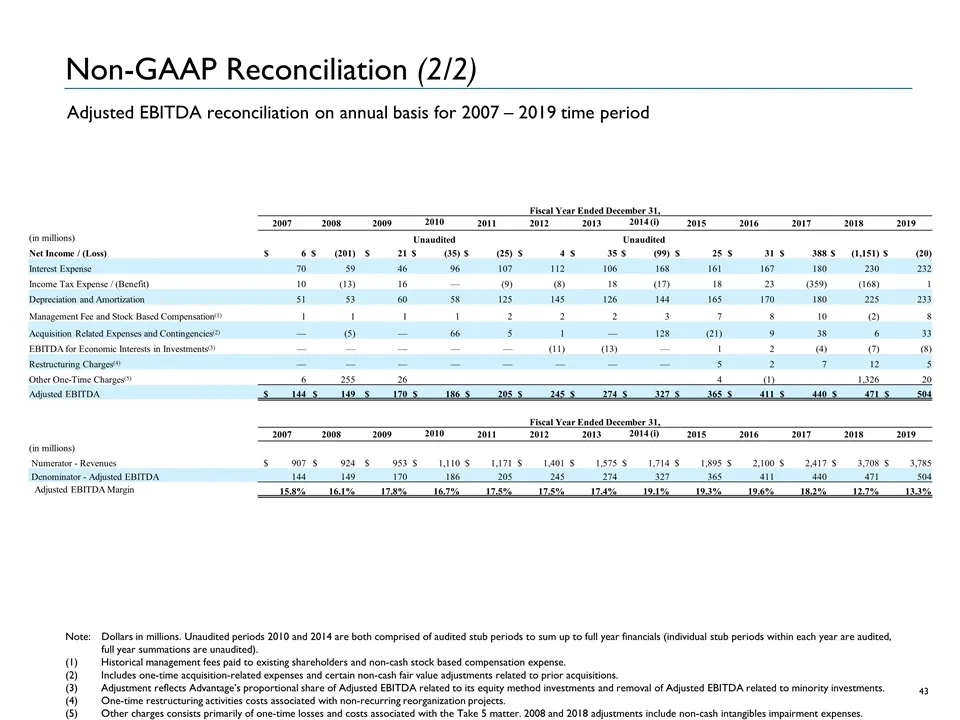
Slide 44: Non-GAAP Reconciliation (2/2)
Non-GAAP Reconciliation (2/2) Adjusted EBITDA reconciliation on annual basis for 2007 – 2019 time period Note: Dollars in millions. Unaudited periods 2010 and 2014 are both comprised of audited stub periods to sum up to full year financials (individual stub periods within each year are audited, full
Source: SEC EDGAR · DEFA14A filed Oct 1, 2020
More decks from Advantage Solutions Inc.
 Q3 2026 Earnings Presentation22 slides · Nov 4, 2026
 Investor Presentation (October 2026)46 slides · October 2026
 Investor Presentation (October 2026)45 slides · October 2026
 Investor Presentation (October 2026)47 slides · October 2026
 Investor Presentation (October 2026)45 slides · October 2026
 Q2 2026 Earnings Presentation22 slides · Aug 5, 2026