Primax Electronics Ltd. · TWSE:4915
Primax Electronics — Investor Presentation (March 2013)
21 slides from Primax Electronics's investor presentation, March 2013
Slide 1: Primax Electronics
Primax Electronics March 2013 1
Slide 2: Safe Harbor Notice
Safe Harbor Notice We have made forward-looking statements in the presentation. Our forward-looking statements contain information regarding, among other things, our financial conditions, future expansion plans and business strategies. We have based these forward-looking statements on our current
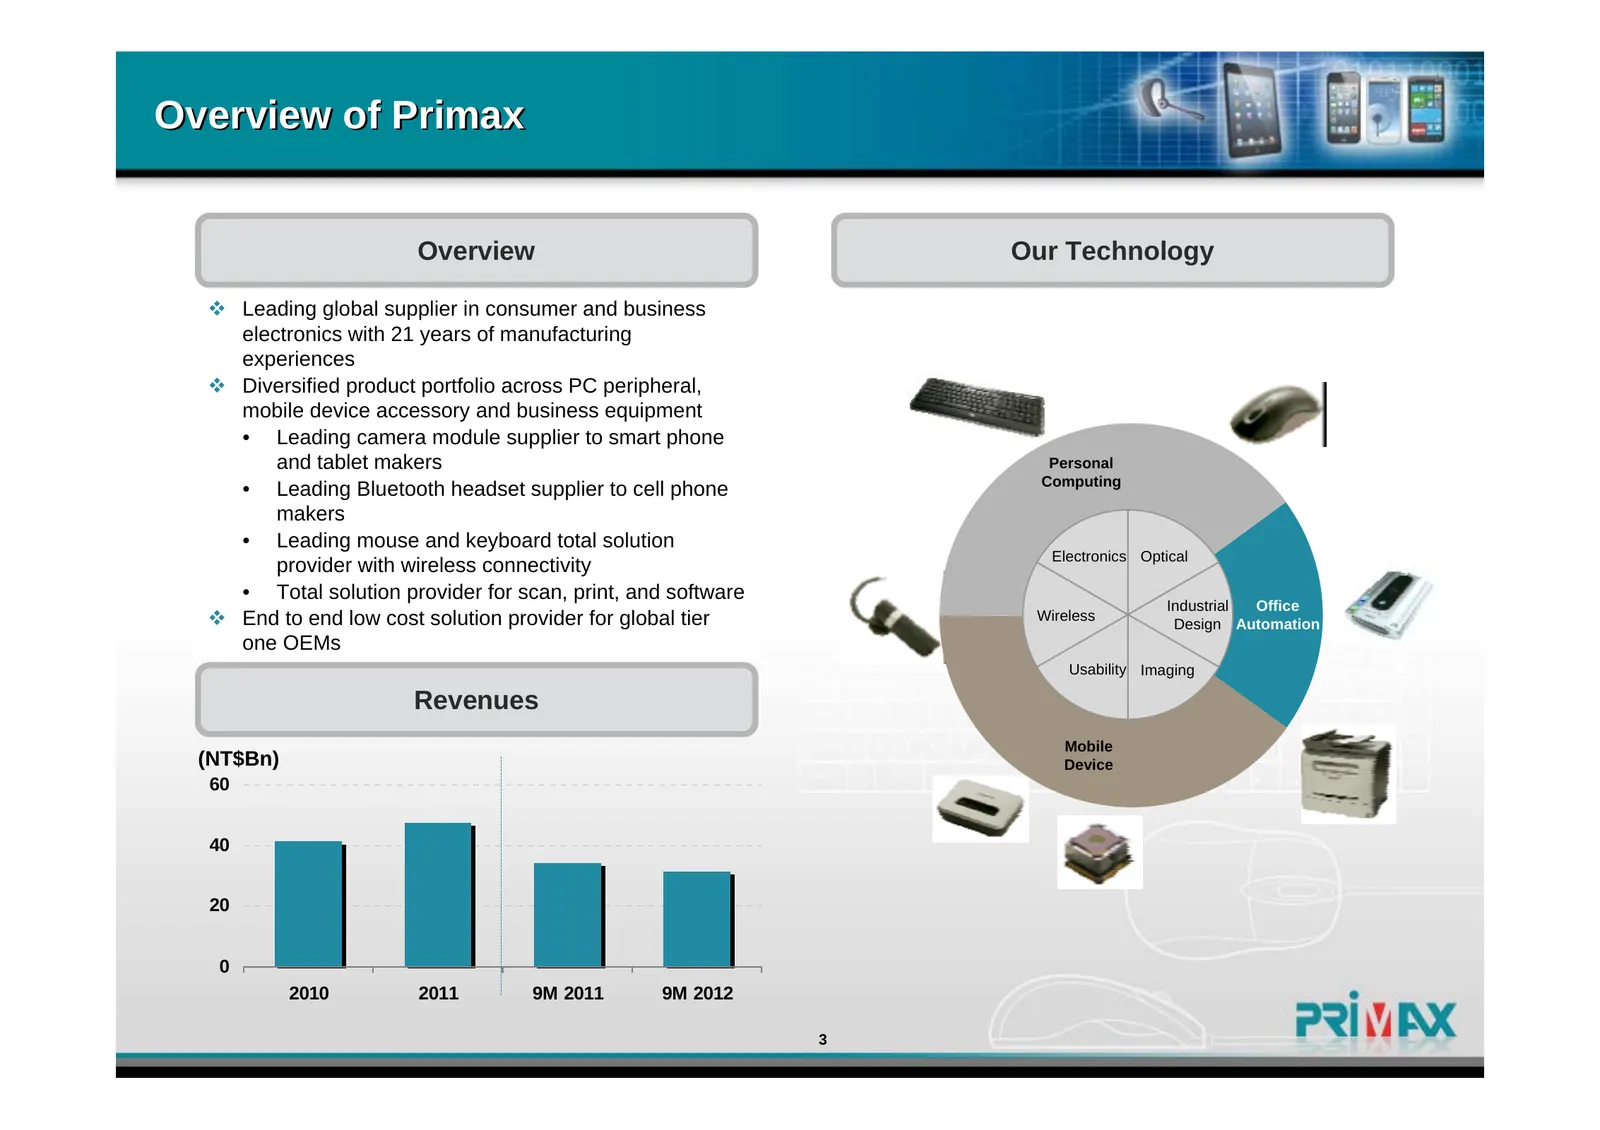
Slide 3: Overview of Primax
Overview of Primax Overview Our Technology Leading global supplier in consumer and business electronics with 21 years of manufacturing experiences Diversified product portfolio across PC peripheral, mobile device accessory and business equipment • Leading camera module supplier to smart phone an
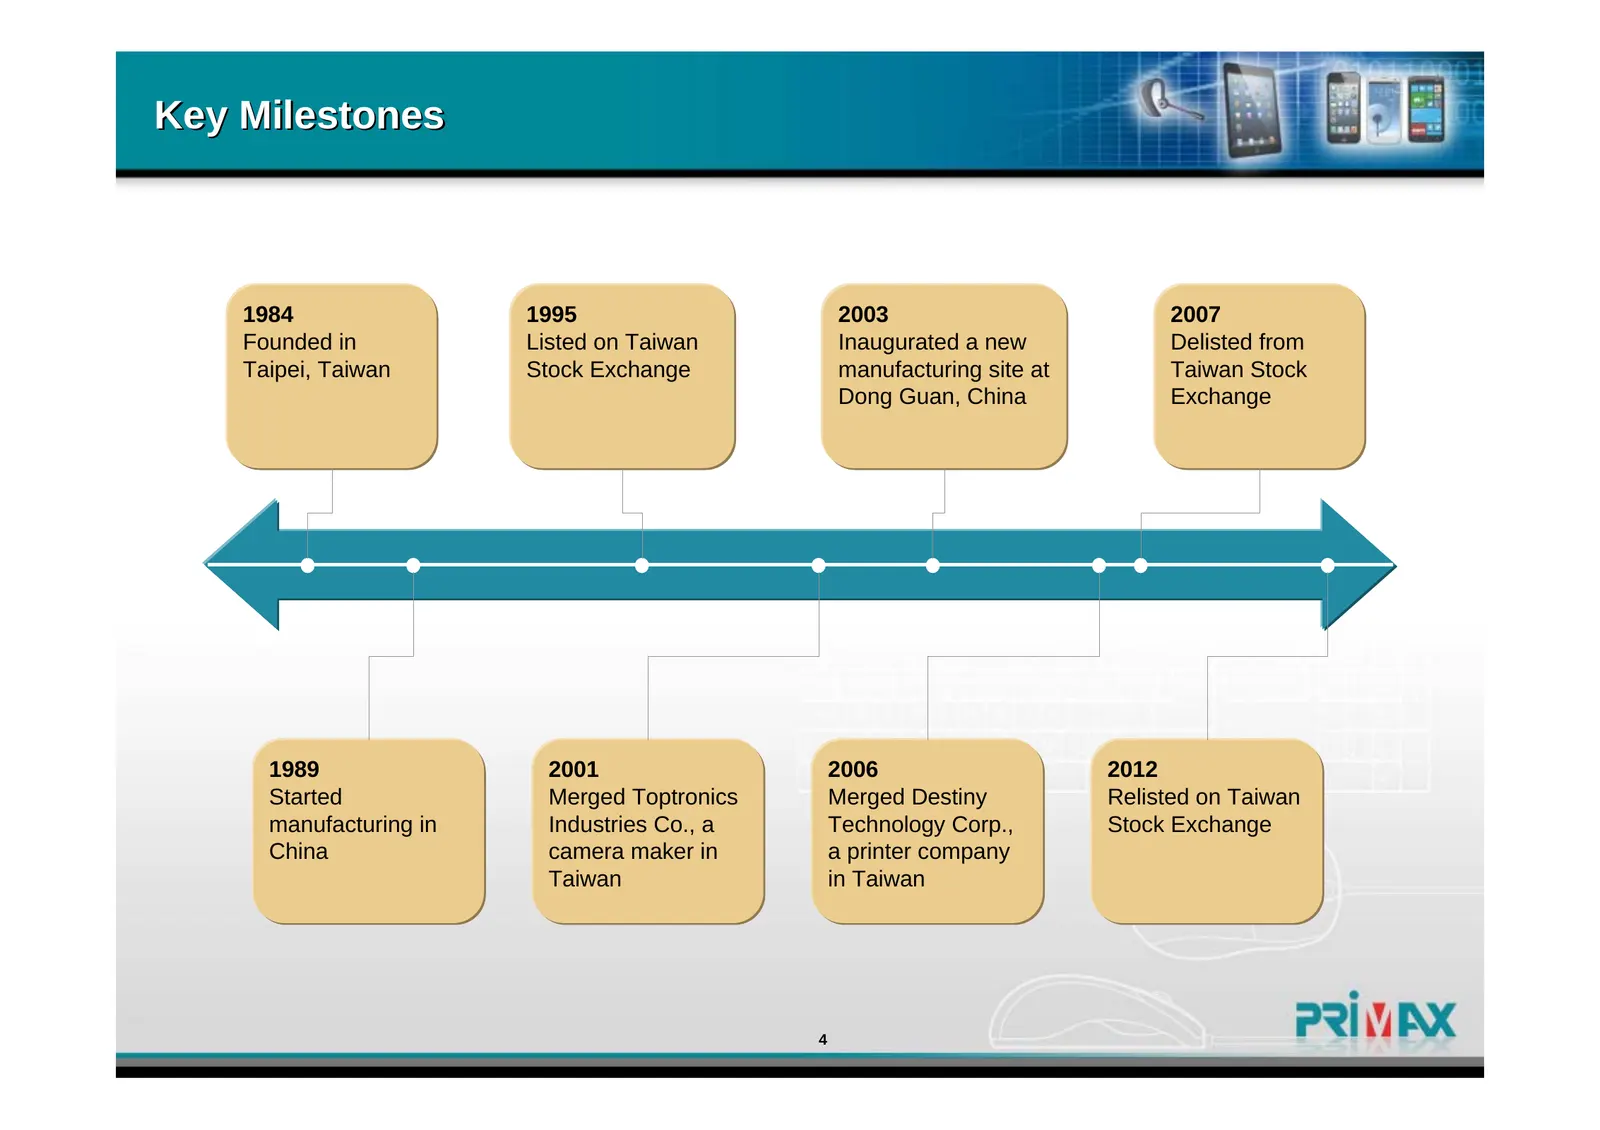
Slide 4: Key Milestones
Key Milestones 1984 1995 2003 2007 Founded in Listed on Taiwan Inaugurated a new Delisted from Taipei, Taiwan Stock Exchange manufacturing site at Taiwan Stock Dong Guan, China Exchange 1989 2001 2006 2012 Started Merged Toptronics Merged Destiny Relisted on Taiwan manufacturing in Industries Co., a
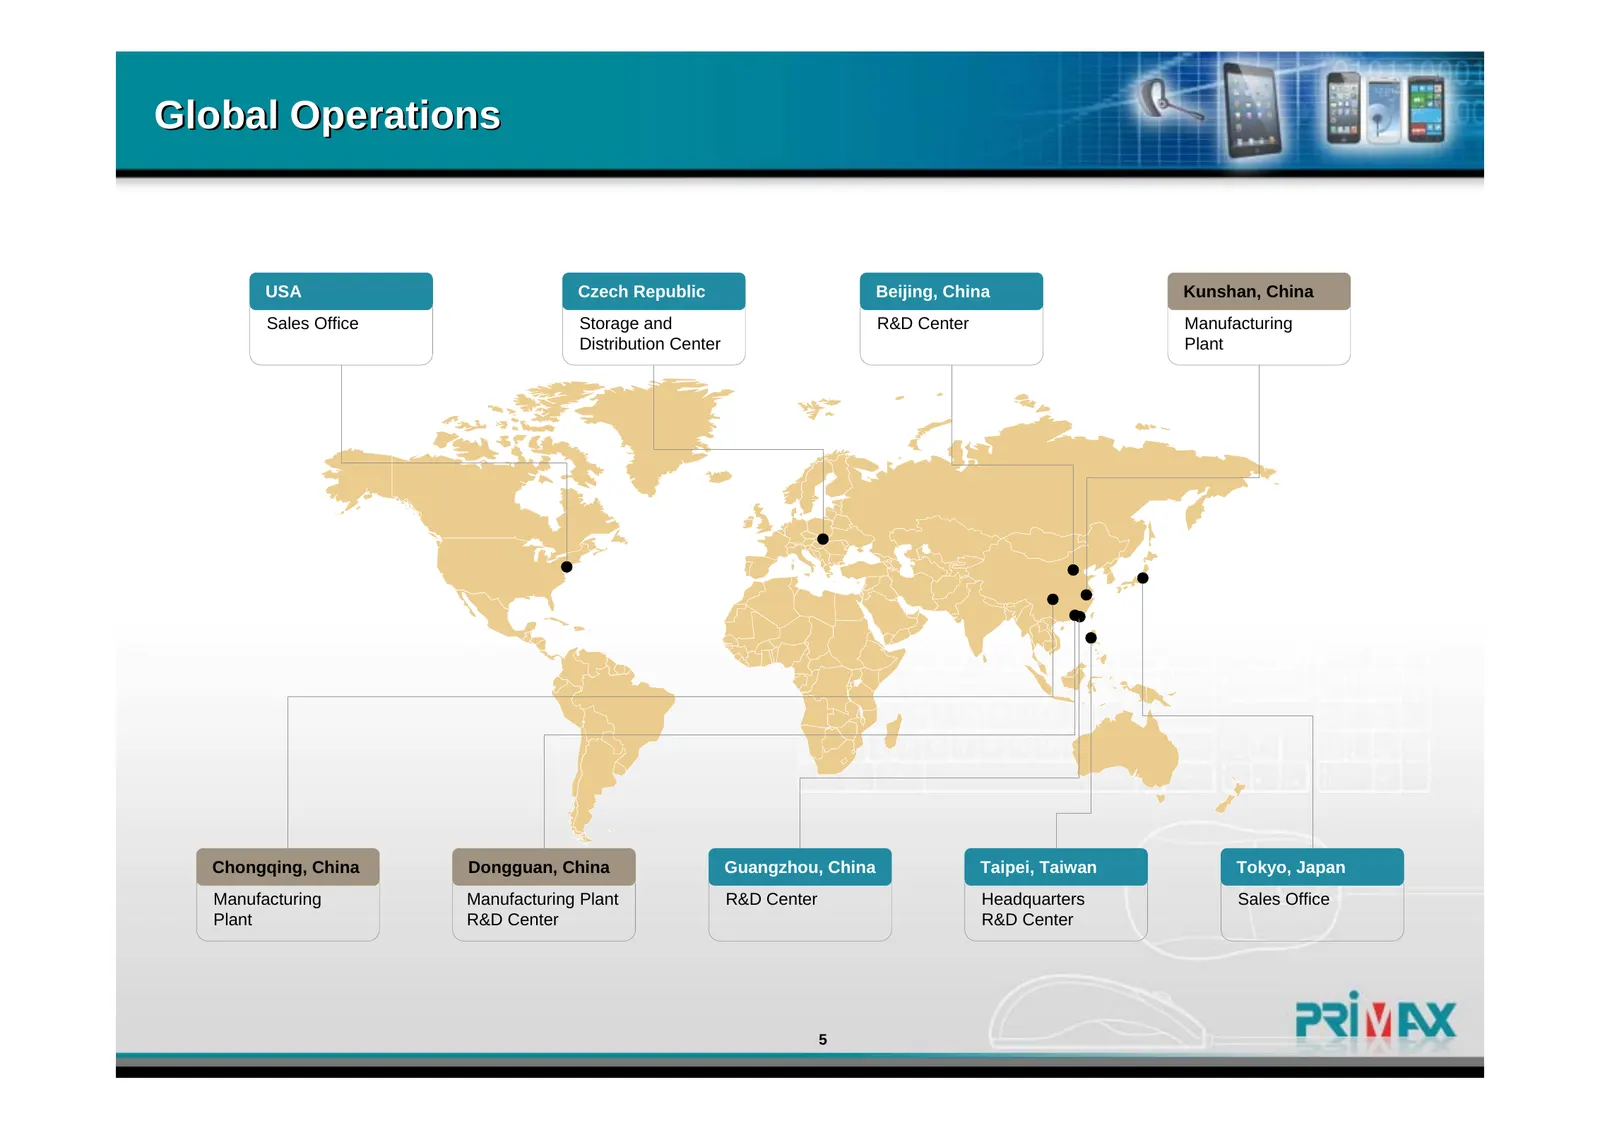
Slide 5: Global Operations
Global Operations USA Czech Republic Beijing, China Kunshan, China Sales Office Storage and R&D Center Manufacturing Distribution Center Plant Chongqing, China Dongguan, China Guangzhou, China Taipei, Taiwan Tokyo, Japan Manufacturing Manufacturing Plant R&D Center Headquarters Sales Office Plant R&
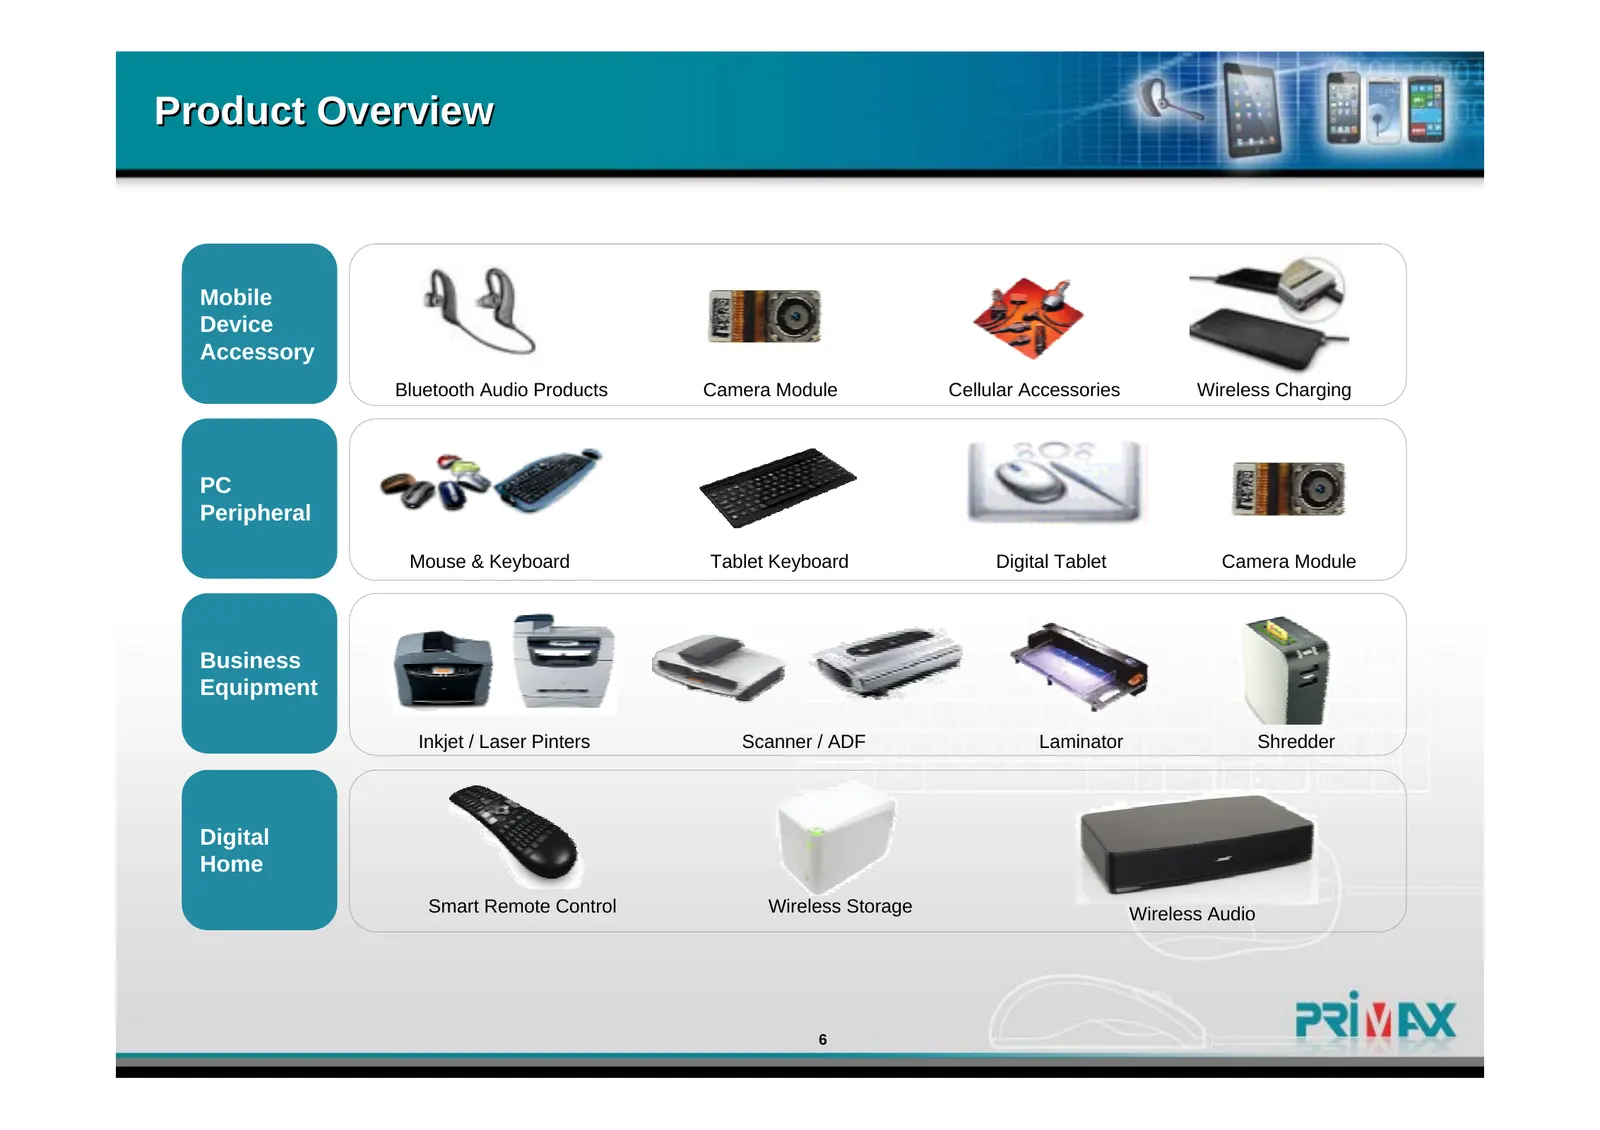
Slide 6: Product Overview
Product Overview Mobile Device Accessory Bluetooth Audio Products Camera Module Cellular Accessories Wireless Charging PC Peripheral Mouse & Keyboard Tablet Keyboard Digital Tablet Camera Module Business Equipment Inkjet / Laser Pinters Scanner / ADF Laminator Shredder Digital Home Smart Remote Cont
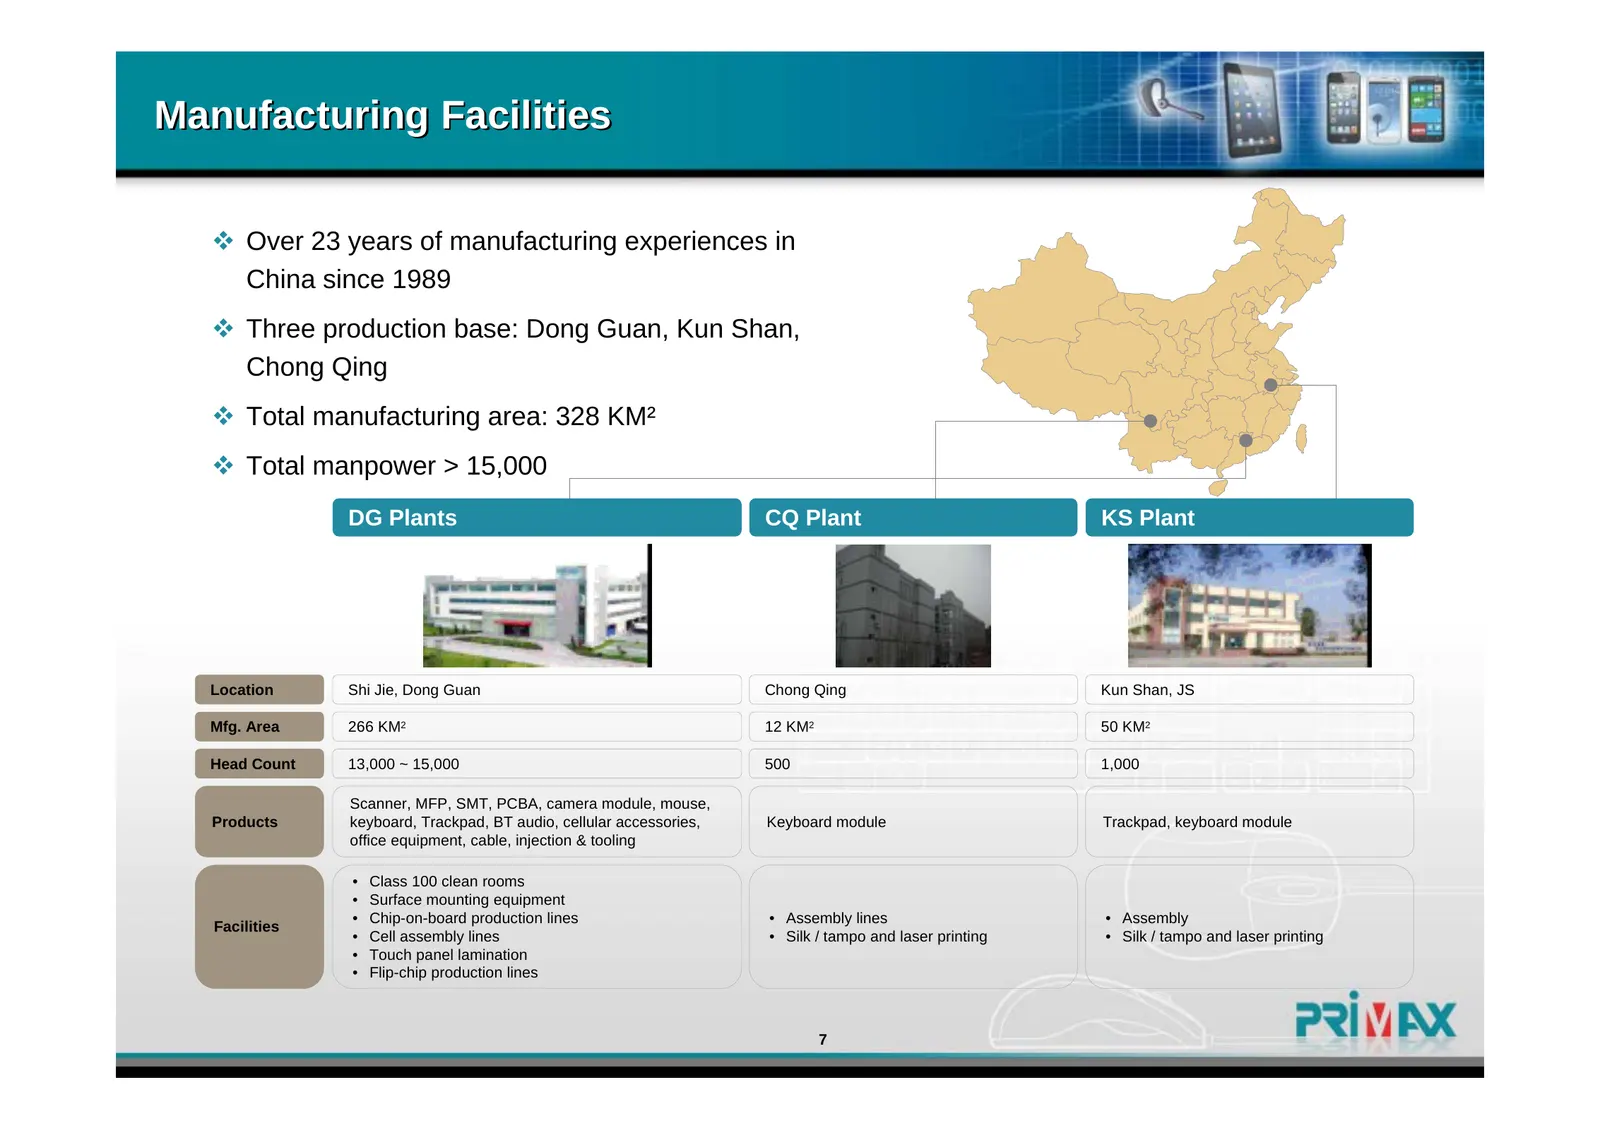
Slide 7: Manufacturing Facilities
Manufacturing Facilities Over 23 years of manufacturing experiences in China since 1989 Three production base: Dong Guan, Kun Shan, Chong Qing Total manufacturing area: 328 KM² Total manpower > 15,000 DG Plants CQ Plant KS Plant Location Shi Jie, Dong Guan Chong Qing Kun Shan, JS Mfg. Area 2
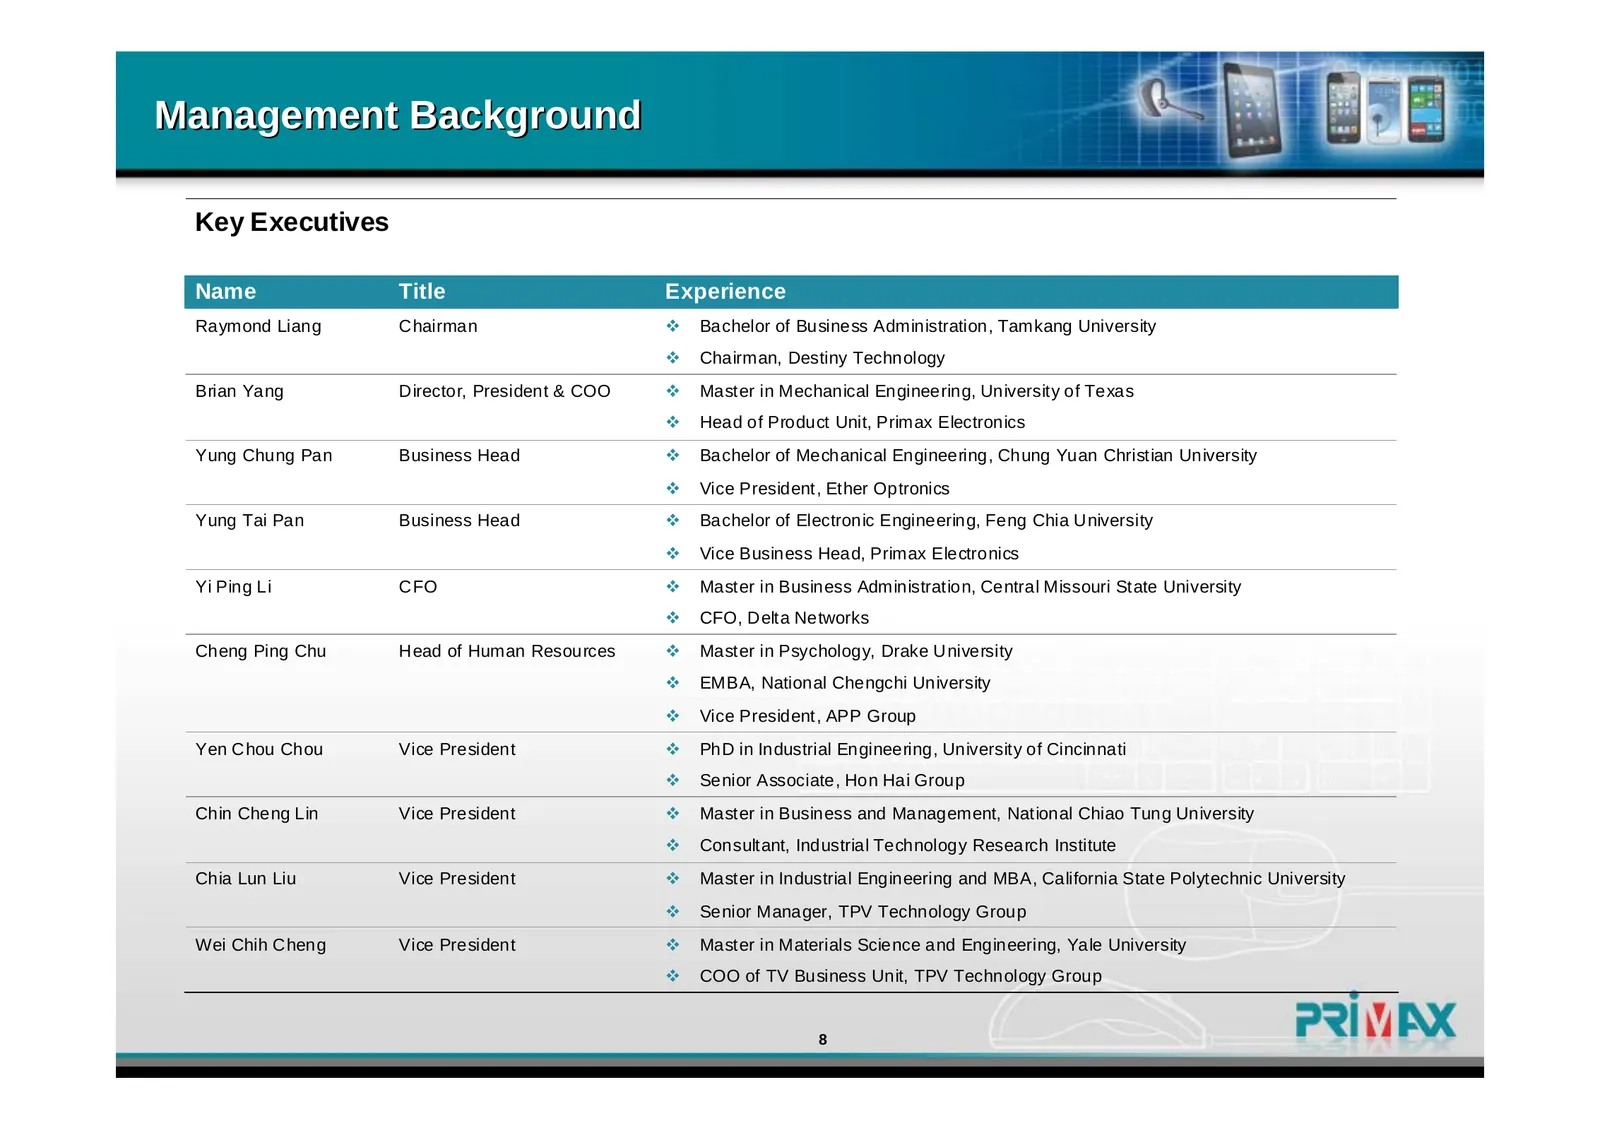
Slide 8: Management Background
Management Background Key Executives Name Title Experience Raymond Liang Chairman Bachelor of Business Administration, Tamkang University Chairman, Destiny Technology Brian Yang Director, President & COO Master in Mechanical Engineering, University of Texas Head of Product Unit, Primax Elect
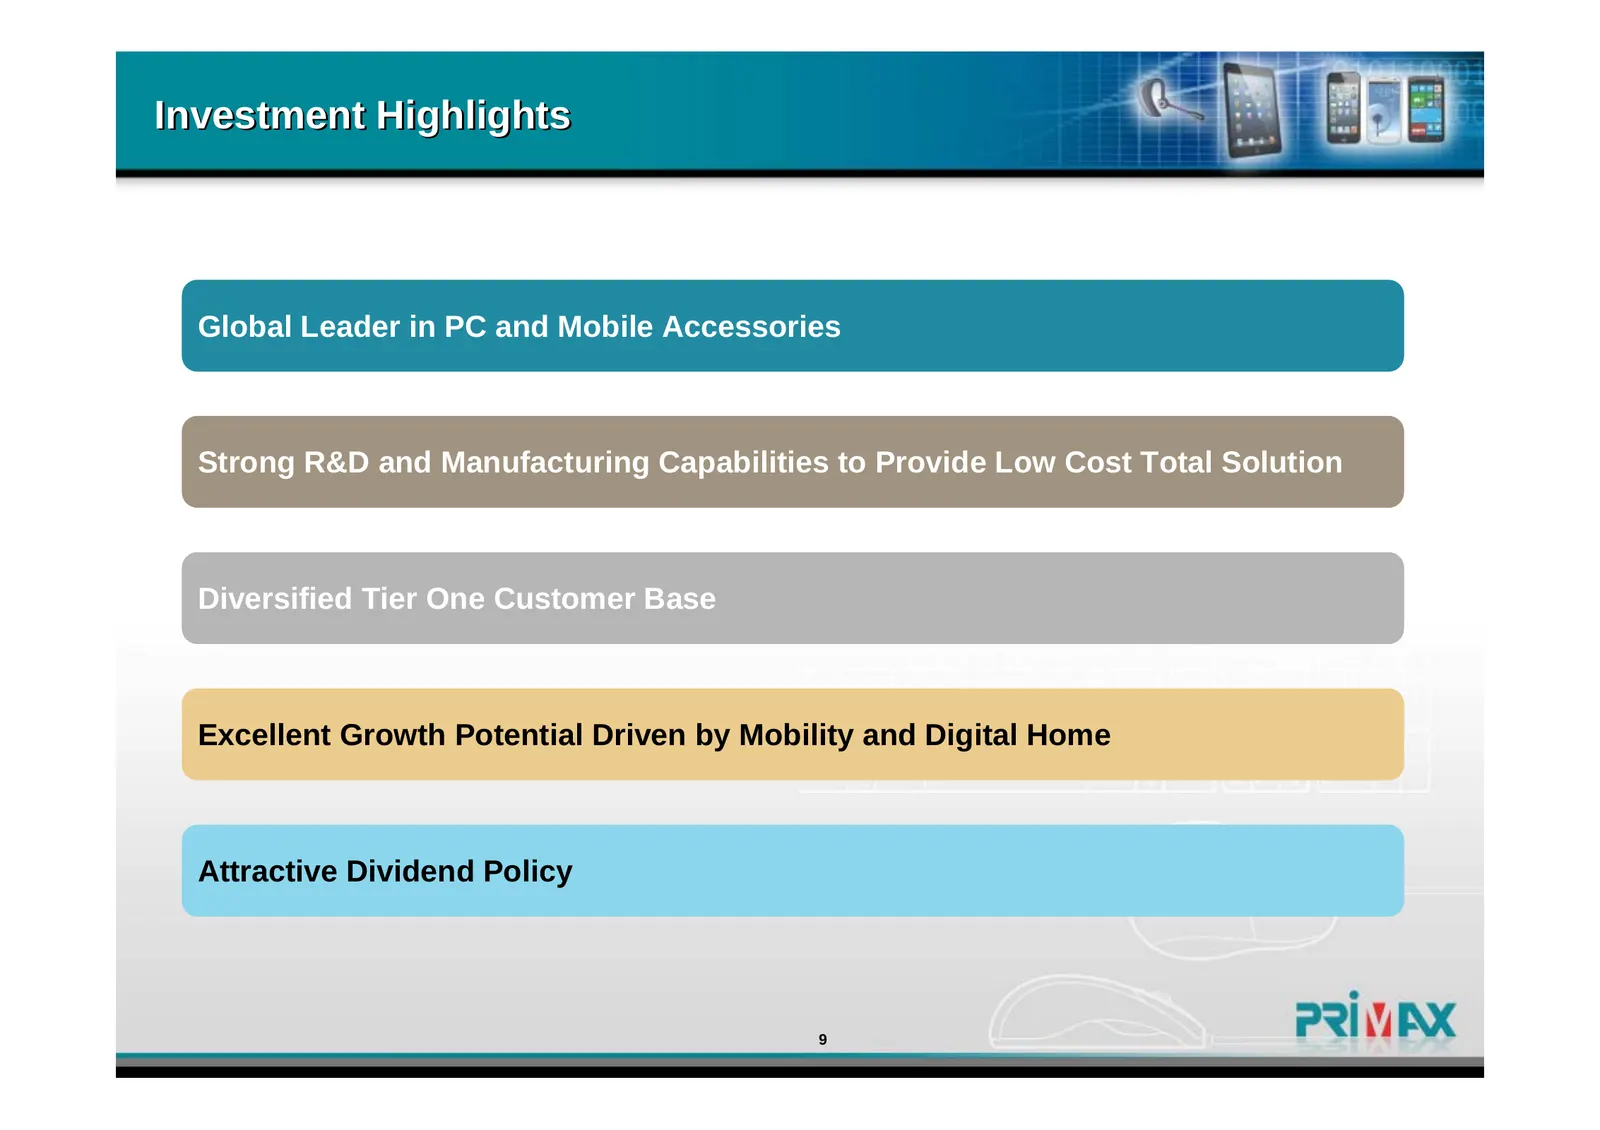
Slide 9: Investment Highlights
Investment Highlights Global Leader in PC and Mobile Accessories Strong R&D and Manufacturing Capabilities to Provide Low Cost Total Solution Diversified Tier One Customer Base Excellent Growth Potential Driven by Mobility and Digital Home Attractive Dividend Policy 9
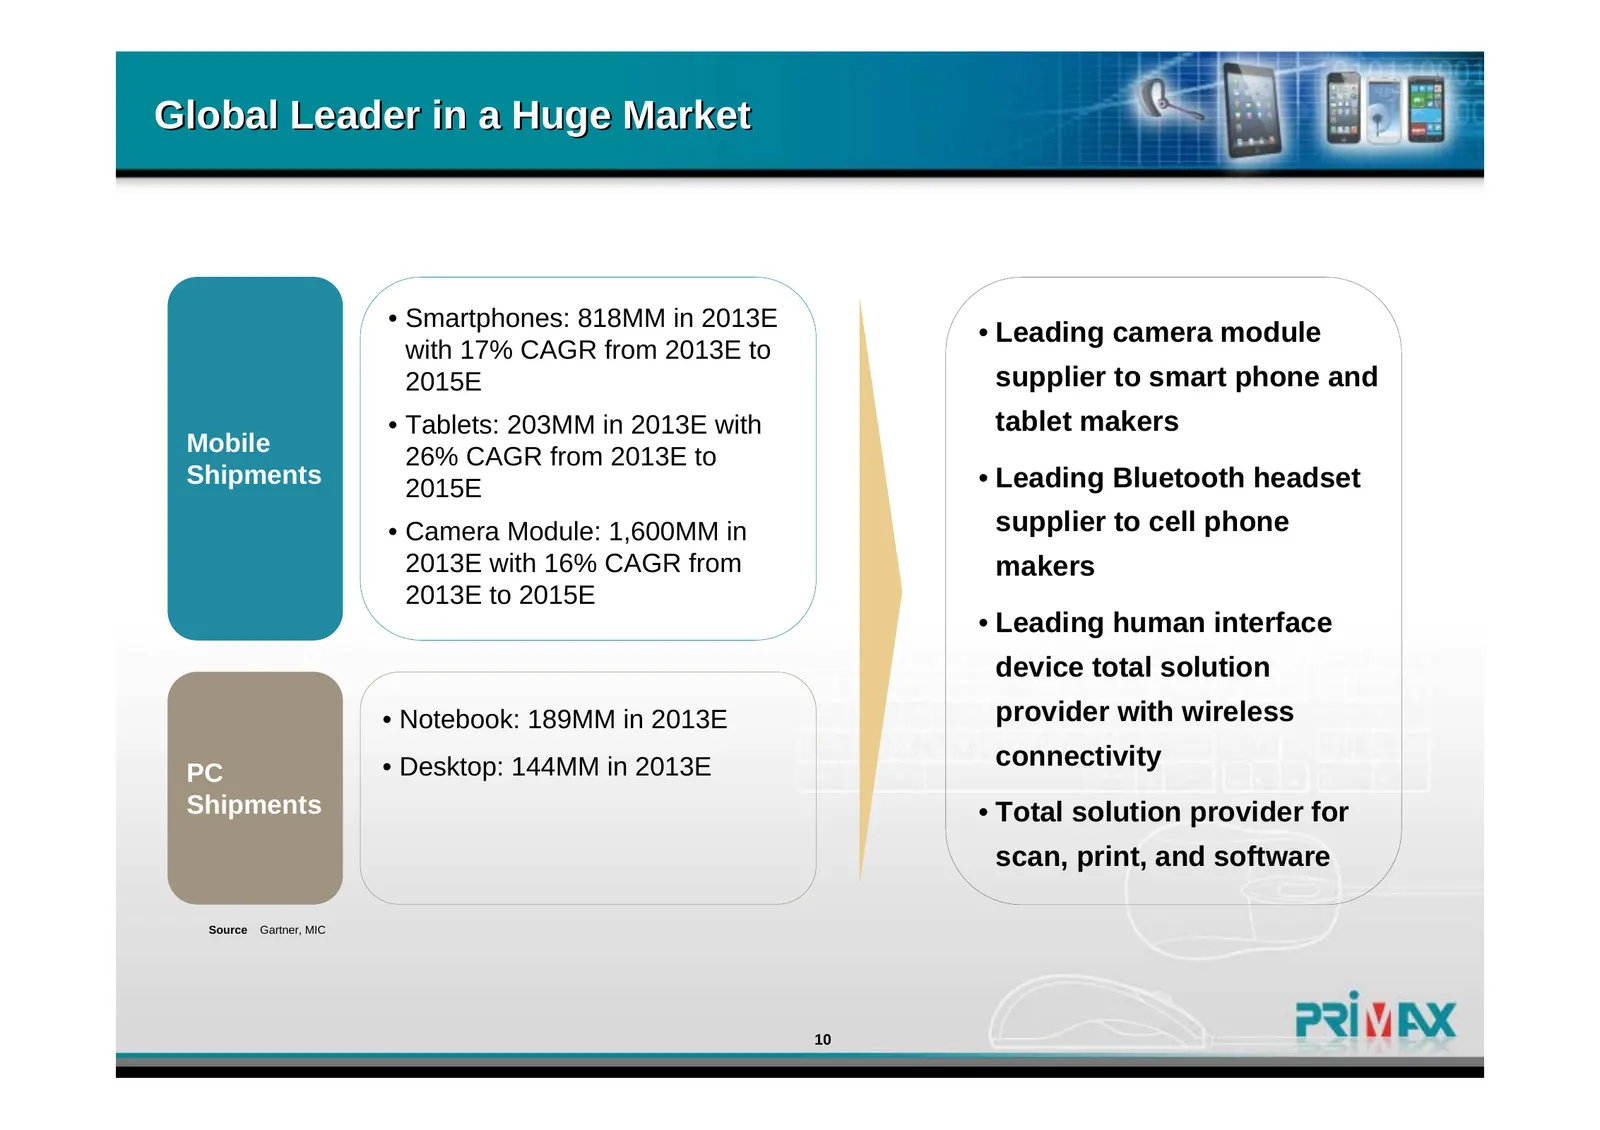
Slide 10: Global Leader in a Huge Market
Global Leader in a Huge Market • Smartphones: 818MM in 2013E • Leading camera module with 17% CAGR from 2013E to 2015E supplier to smart phone and • Tablets: 203MM in 2013E with tablet makers Mobile 26% CAGR from 2013E to Shipments 2015E • Leading Bluetooth headset • Camera Module: 1,600MM in suppli
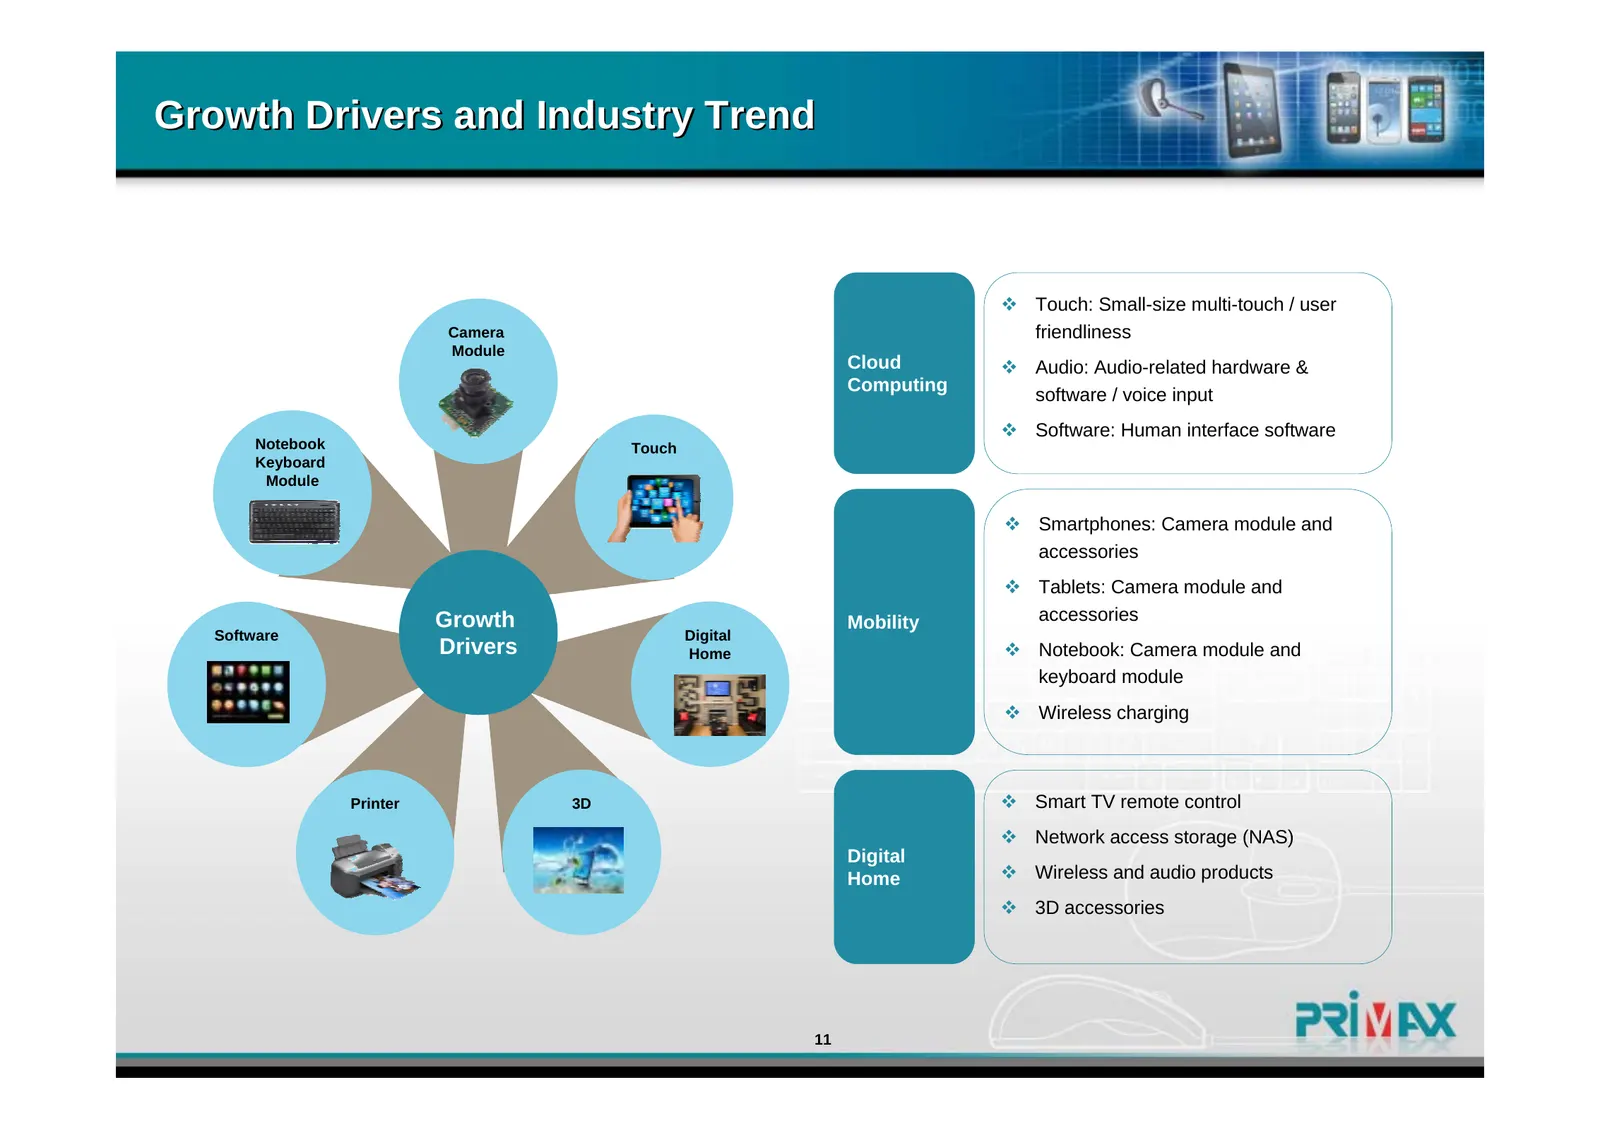
Slide 11: Growth Drivers and Industry Trend
Growth Drivers and Industry Trend Touch: Small-size multi-touch / user Camera friendliness Module Cloud Audio: Audio-related hardware & Computing software / voice input Software: Human interface software Notebook Touch Keyboard Module Smartphones: Camera module and accessories Tablets: Cam
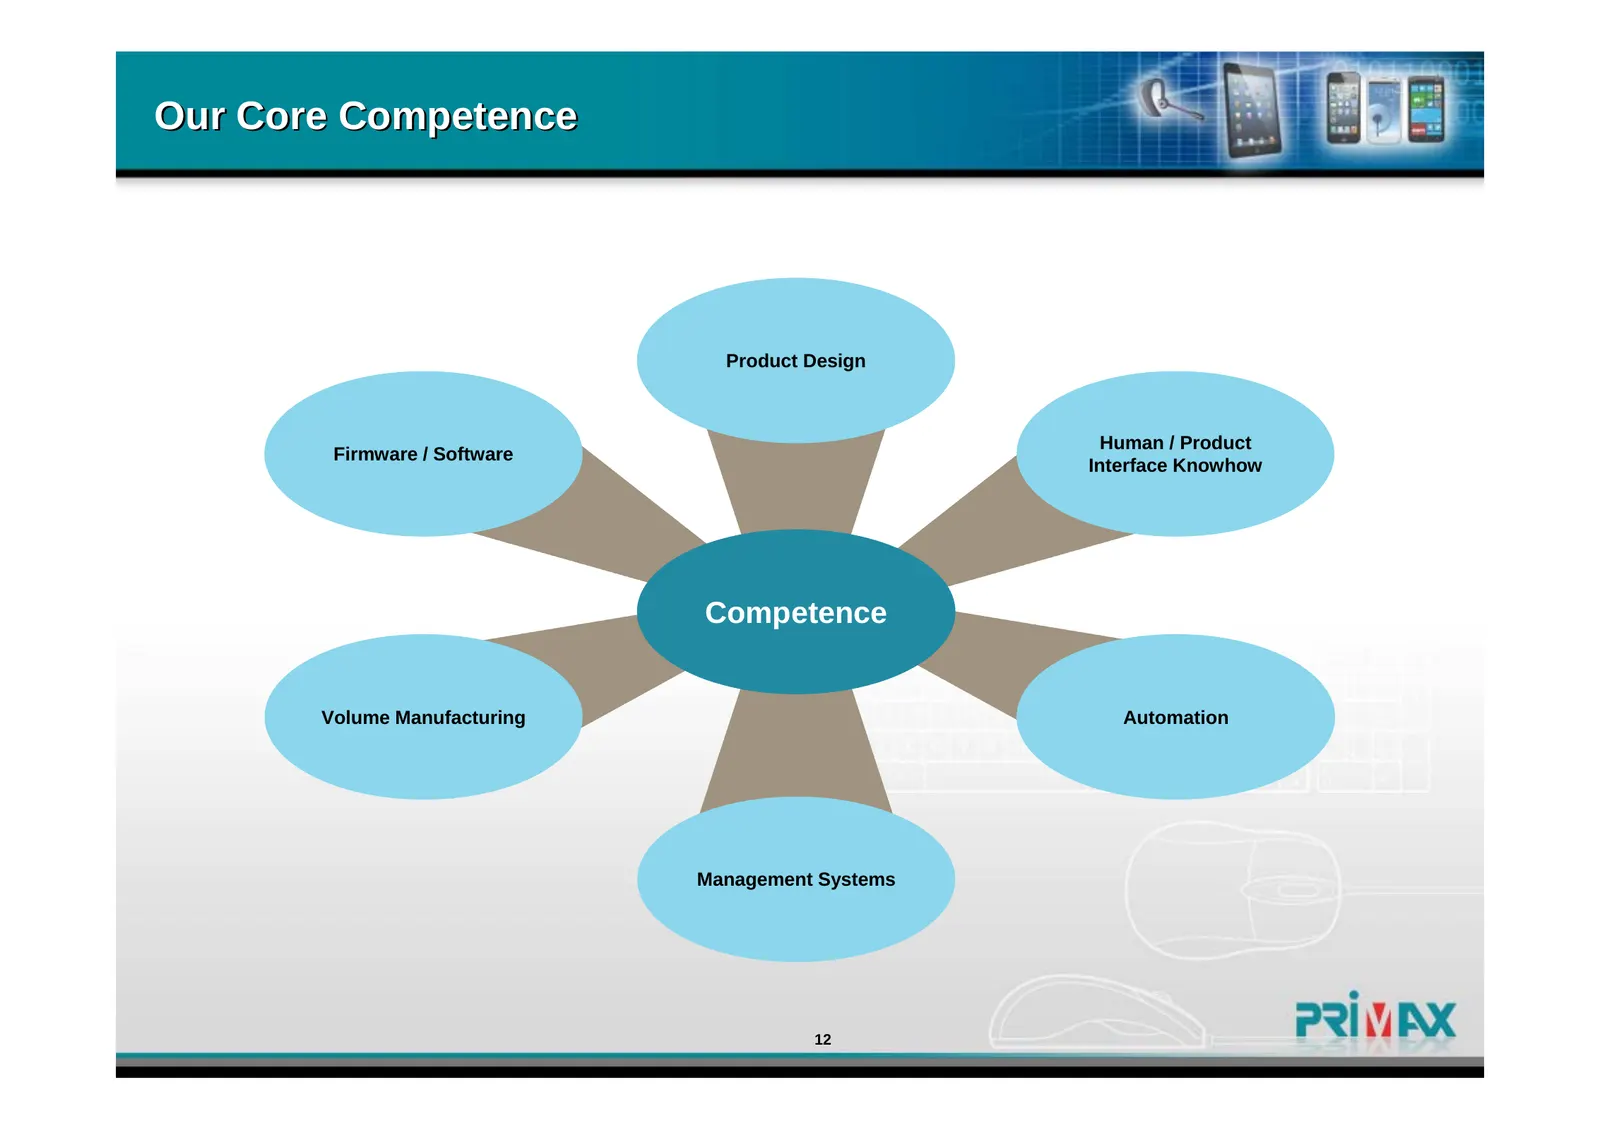
Slide 12: Our Core Competence
Our Core Competence Product Design Human / Product Firmware / Software Interface Knowhow Competence Volume Manufacturing Automation Management Systems 12
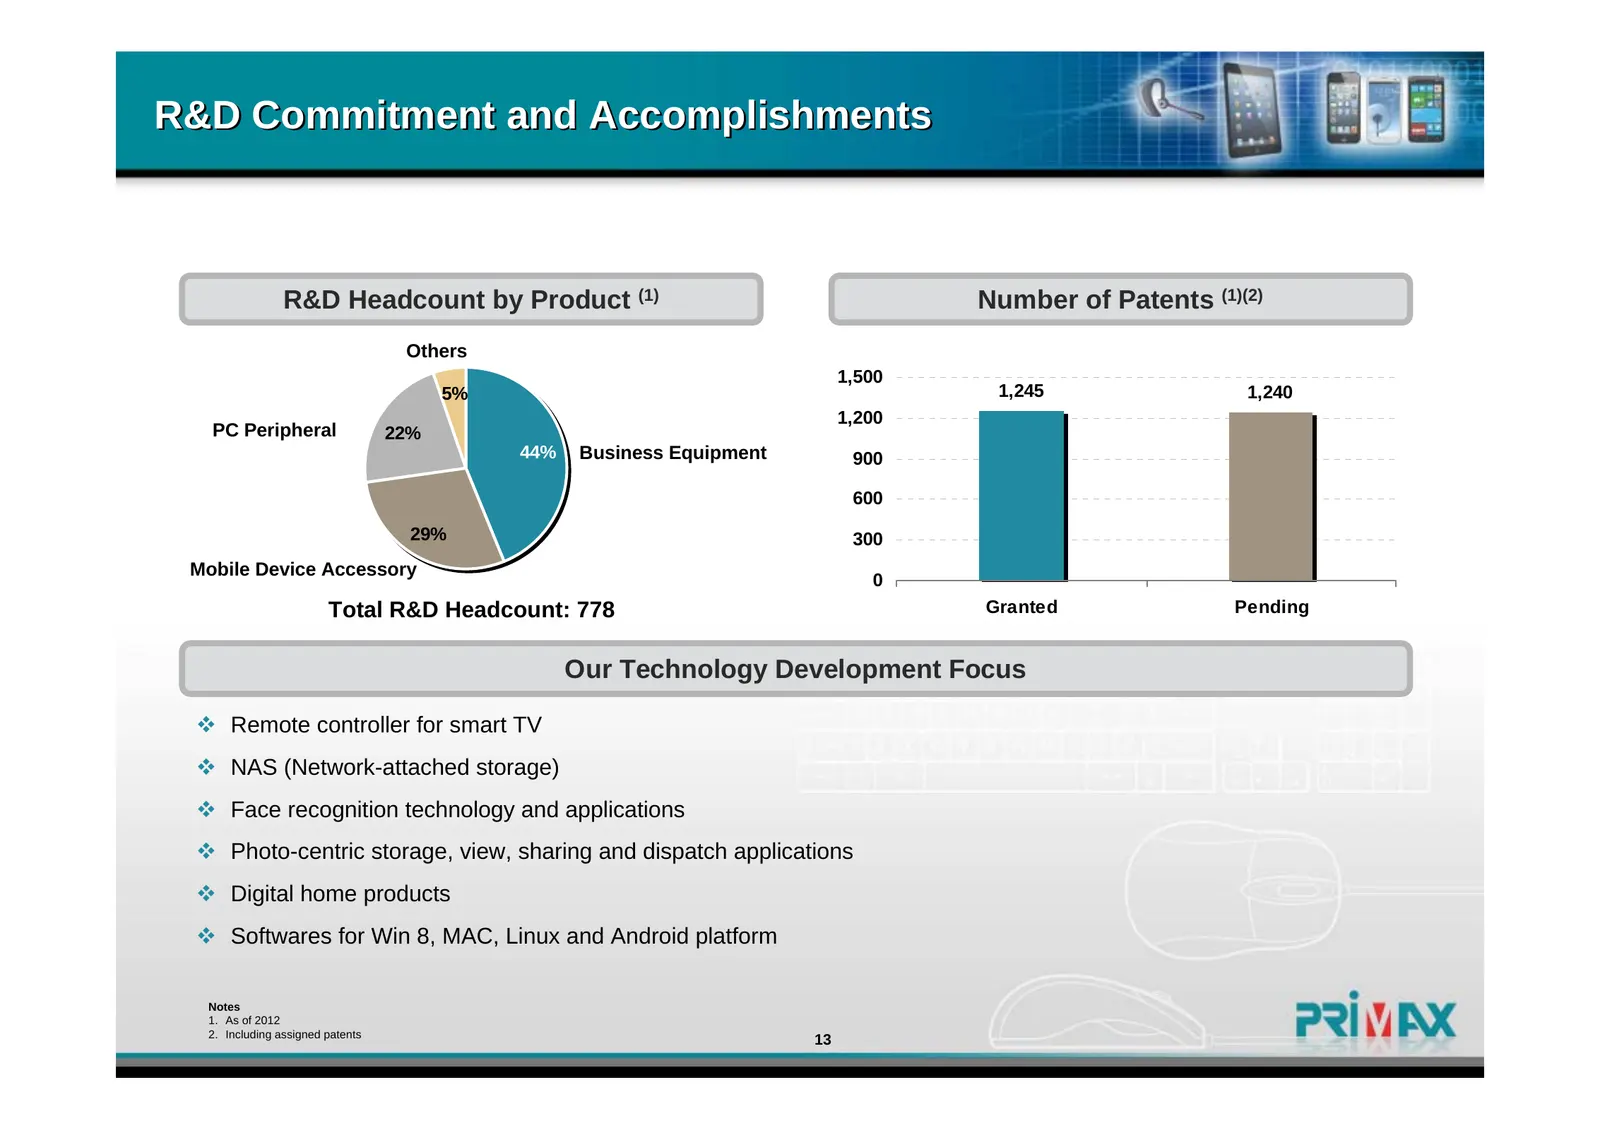
Slide 13: R&D Commitment and Accomplishments
R&D Commitment and Accomplishments R&D Headcount by Product (1) Number of Patents (1)(2) Others 1,500 5% 1,245 1,240 1,200 PC Peripheral 22% 44% Business Equipment 900 600 29% 300 Mobile Device Accessory 0 Total R&D Headcount: 778 Granted Pending Our Technology Development Focus Remote controller
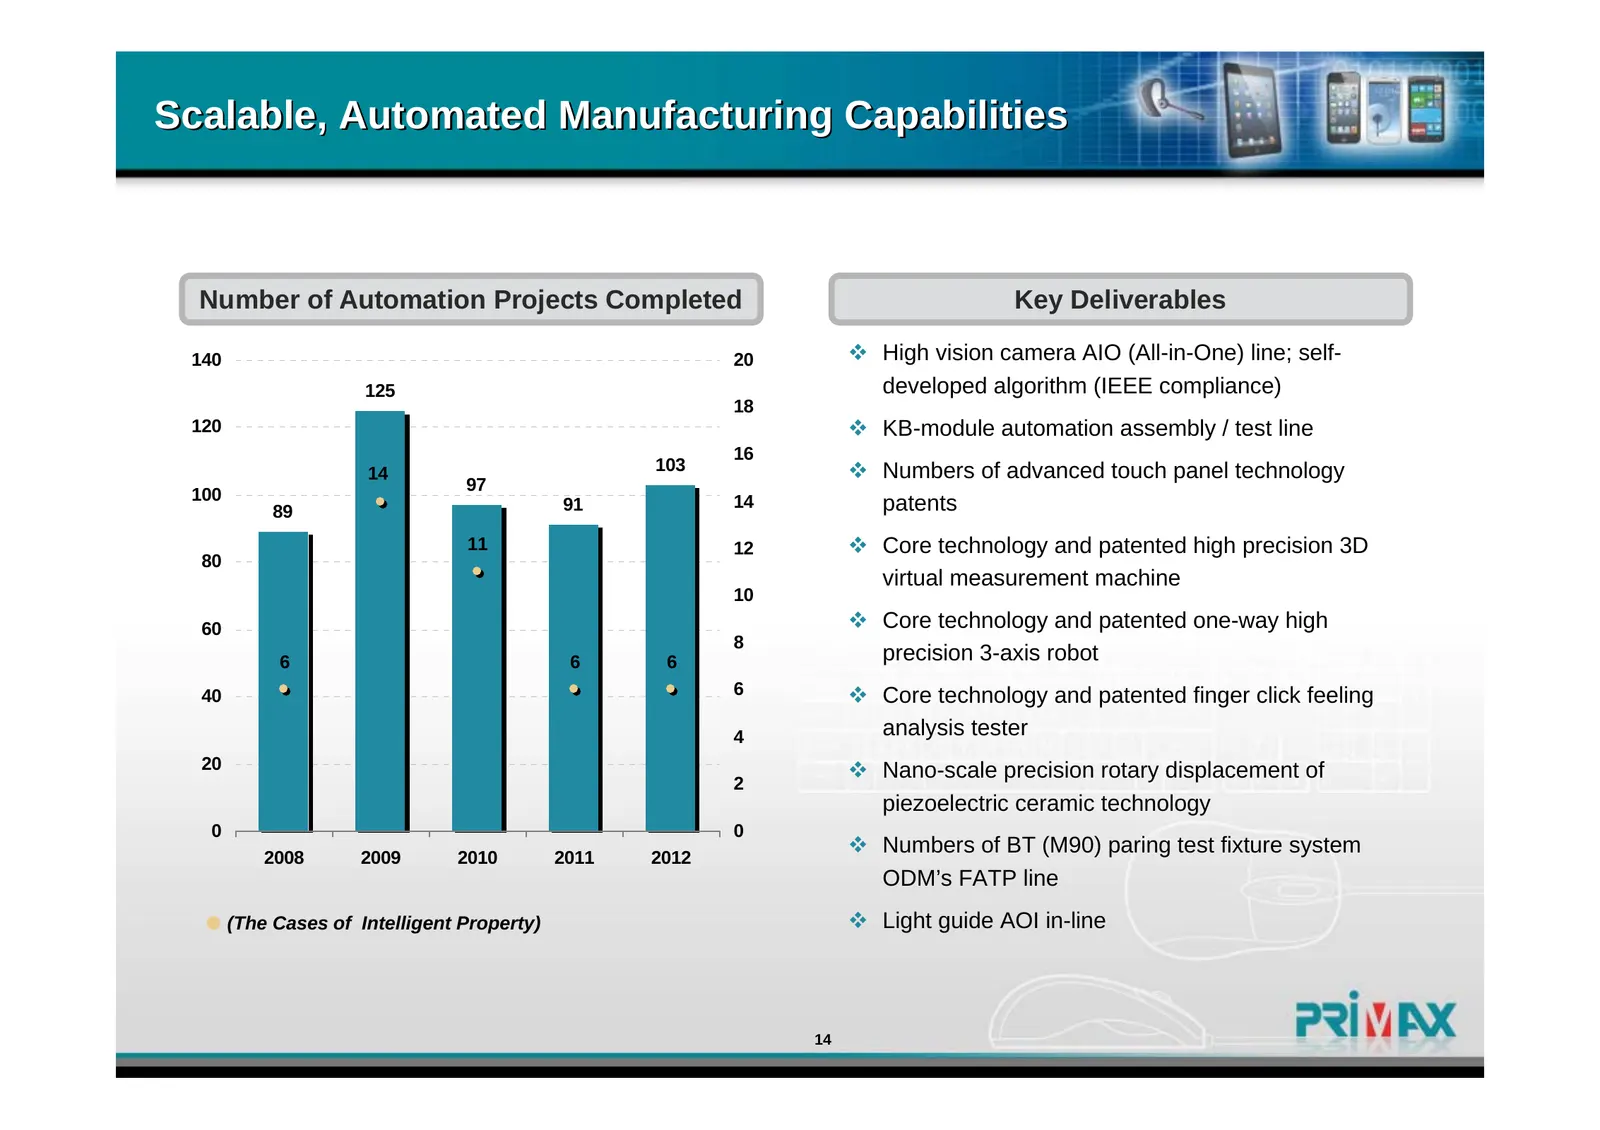
Slide 14: Scalable, Automated Manufacturing Capabilities
Scalable, Automated Manufacturing Capabilities Number of Automation Projects Completed Key Deliverables 140 20 High vision camera AIO (All-in-One) line; self- 125 developed algorithm (IEEE compliance) 18 120 KB-module automation assembly / test line 16 14 103 Numbers of advanced touch panel te
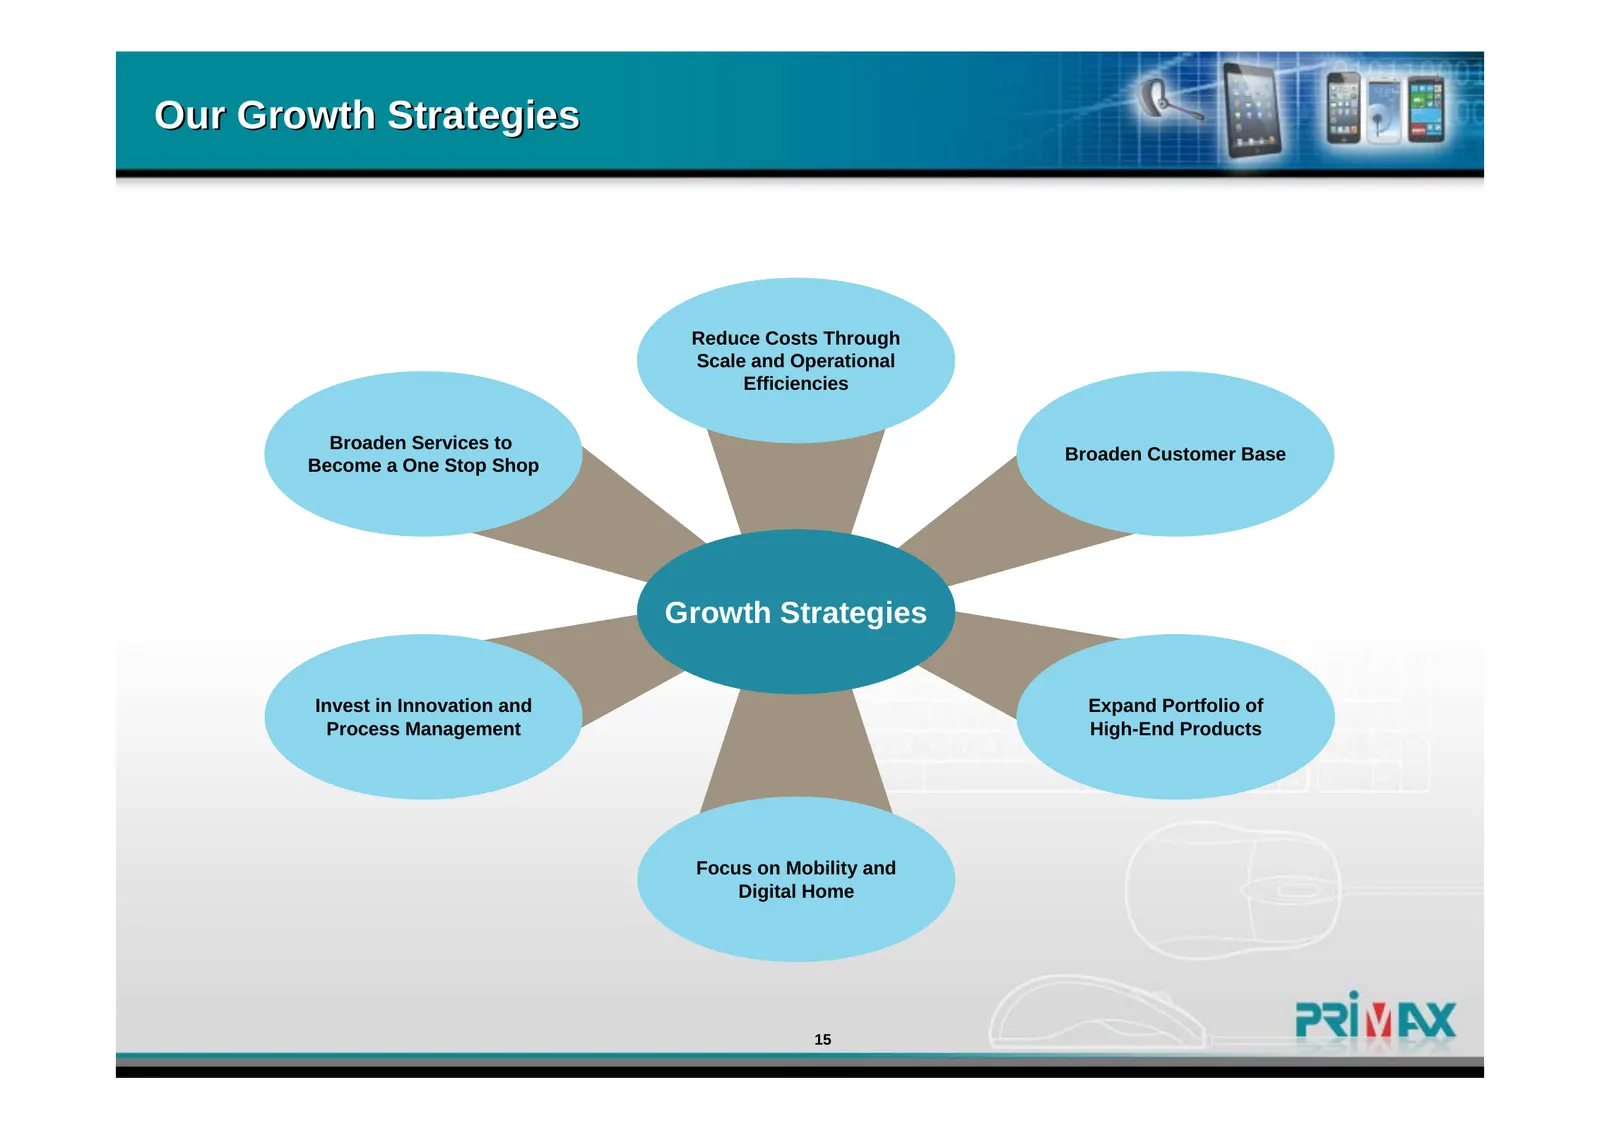
Slide 15: Our Growth Strategies
Our Growth Strategies Reduce Costs Through Scale and Operational Efficiencies Broaden Services to Broaden Customer Base Become a One Stop Shop Growth Strategies Invest in Innovation and Expand Portfolio of Process Management High-End Products Focus on Mobility and Digital Home 15

Slide 16: Financial Summary
PRI MAX Financial Summary
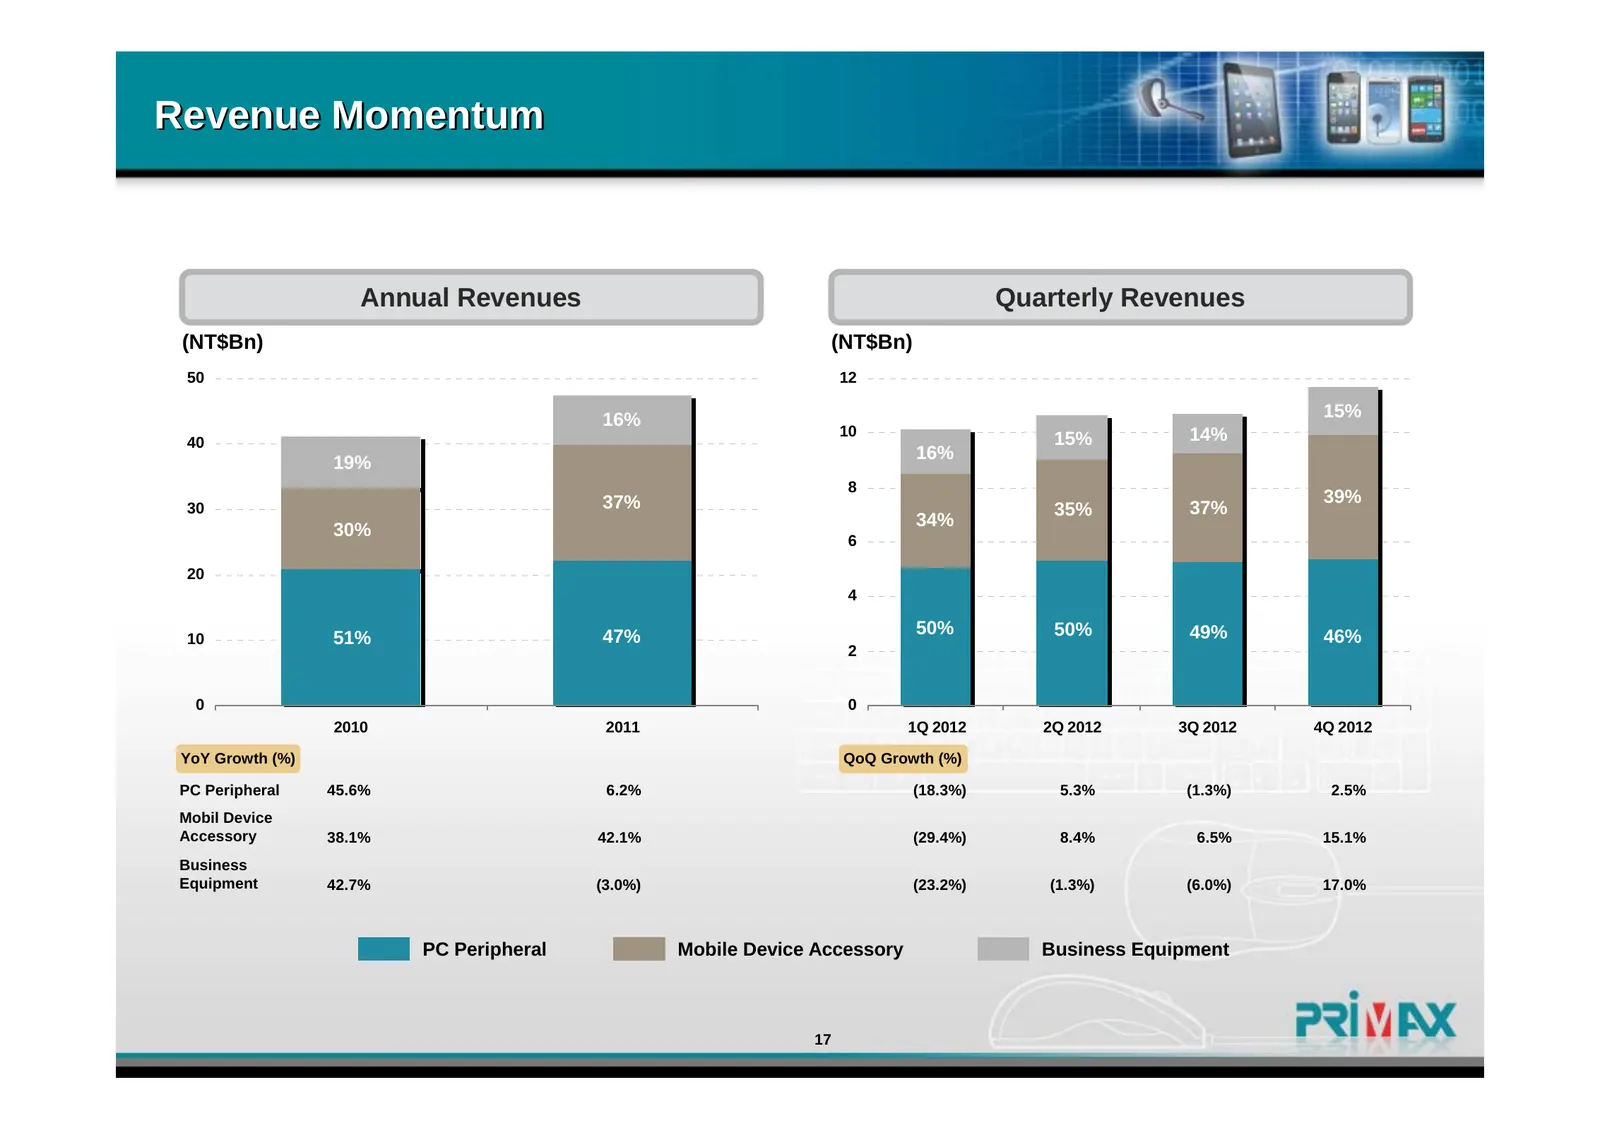
Slide 17: Revenue Momentum
Revenue Momentum Annual Revenues Quarterly Revenues (NT$Bn) (NT$Bn) 50 12 16% 15% 10 14% 40 15% 16% 19% 8 37% 39% 30 35% 37% 34% 30% 6 20 4 47% 50% 50% 49% 46% 10 51% 2 0 0 2010 2011 1Q 2012 2Q 2012 3Q 2012 4Q 2012 YoY Growth (%) QoQ Growth (%) PC Peripheral 45.6% 6.2% (18.3%) 5.3% (1.3%) 2.5% Mobil
Slide 18: Healthy Gross Margin
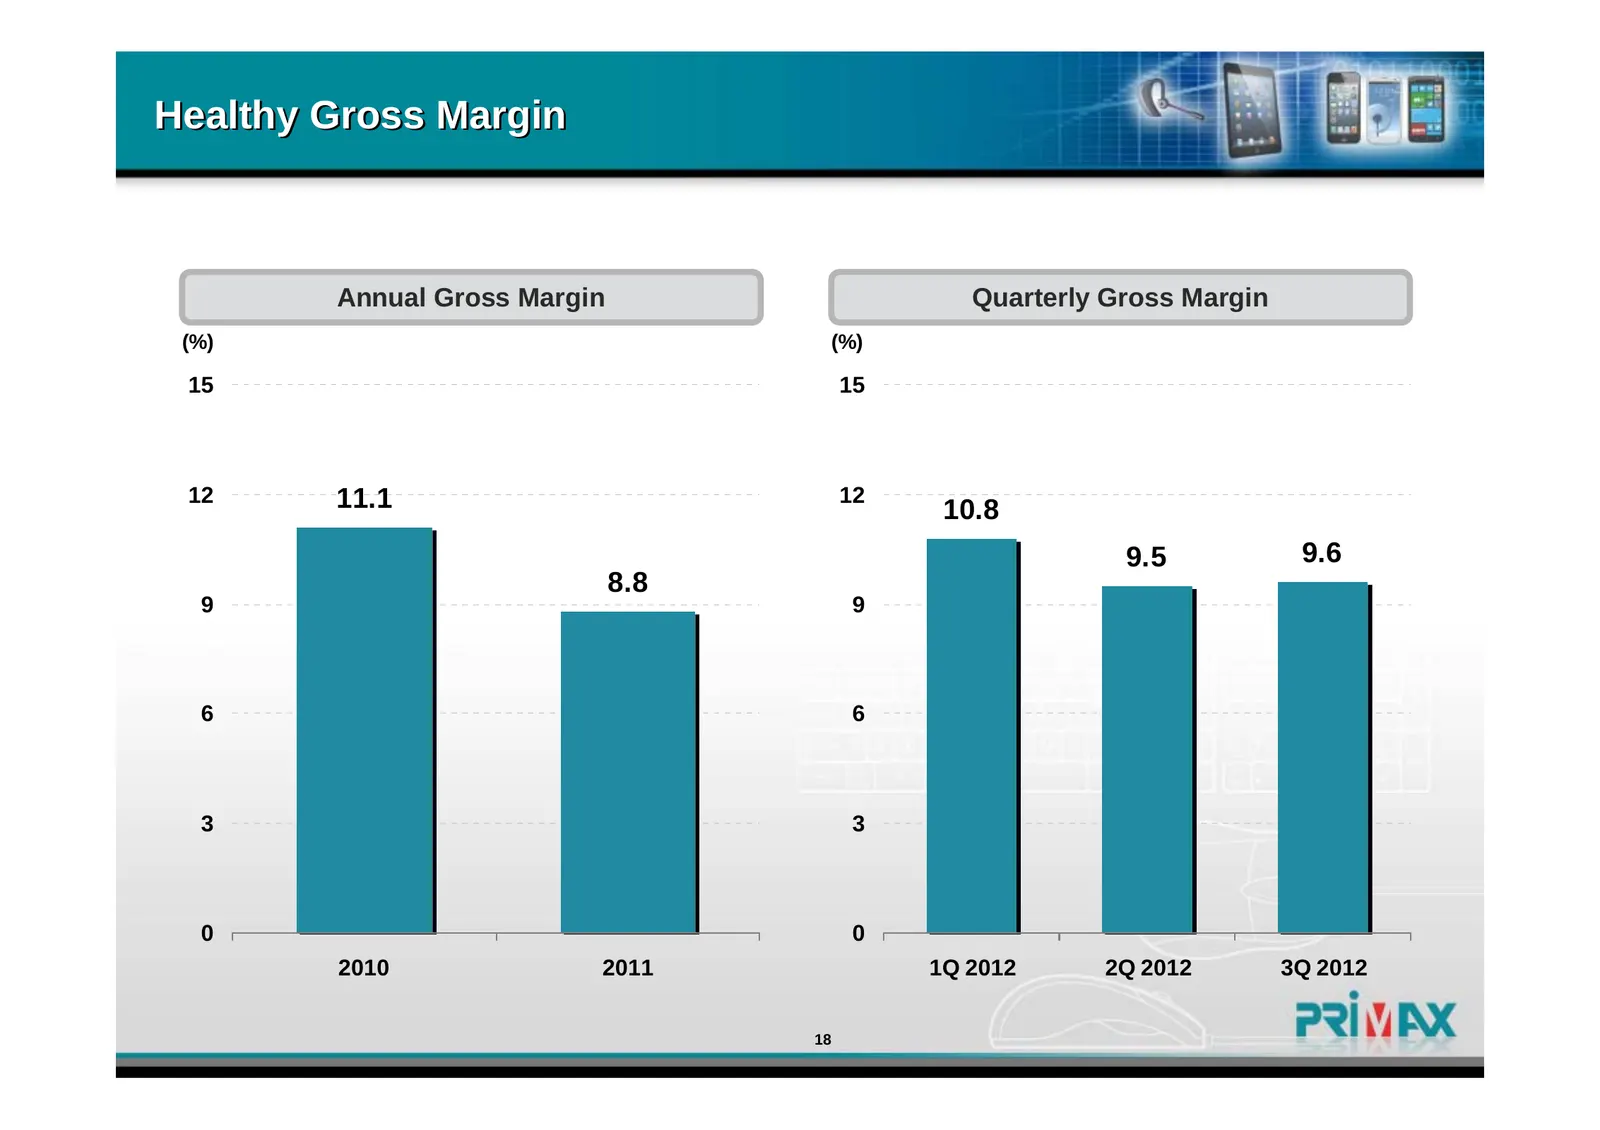
Healthy Gross Margin Annual Gross Margin Quarterly Gross Margin (%) (%) 15 15 12 11.1 12 10.8 9.5 9.6 8.8 9 9 6 6 3 3 0 0 2010 2011 1Q 2012 2Q 2012 3Q 2012 18
Slide 19: Summary Financials
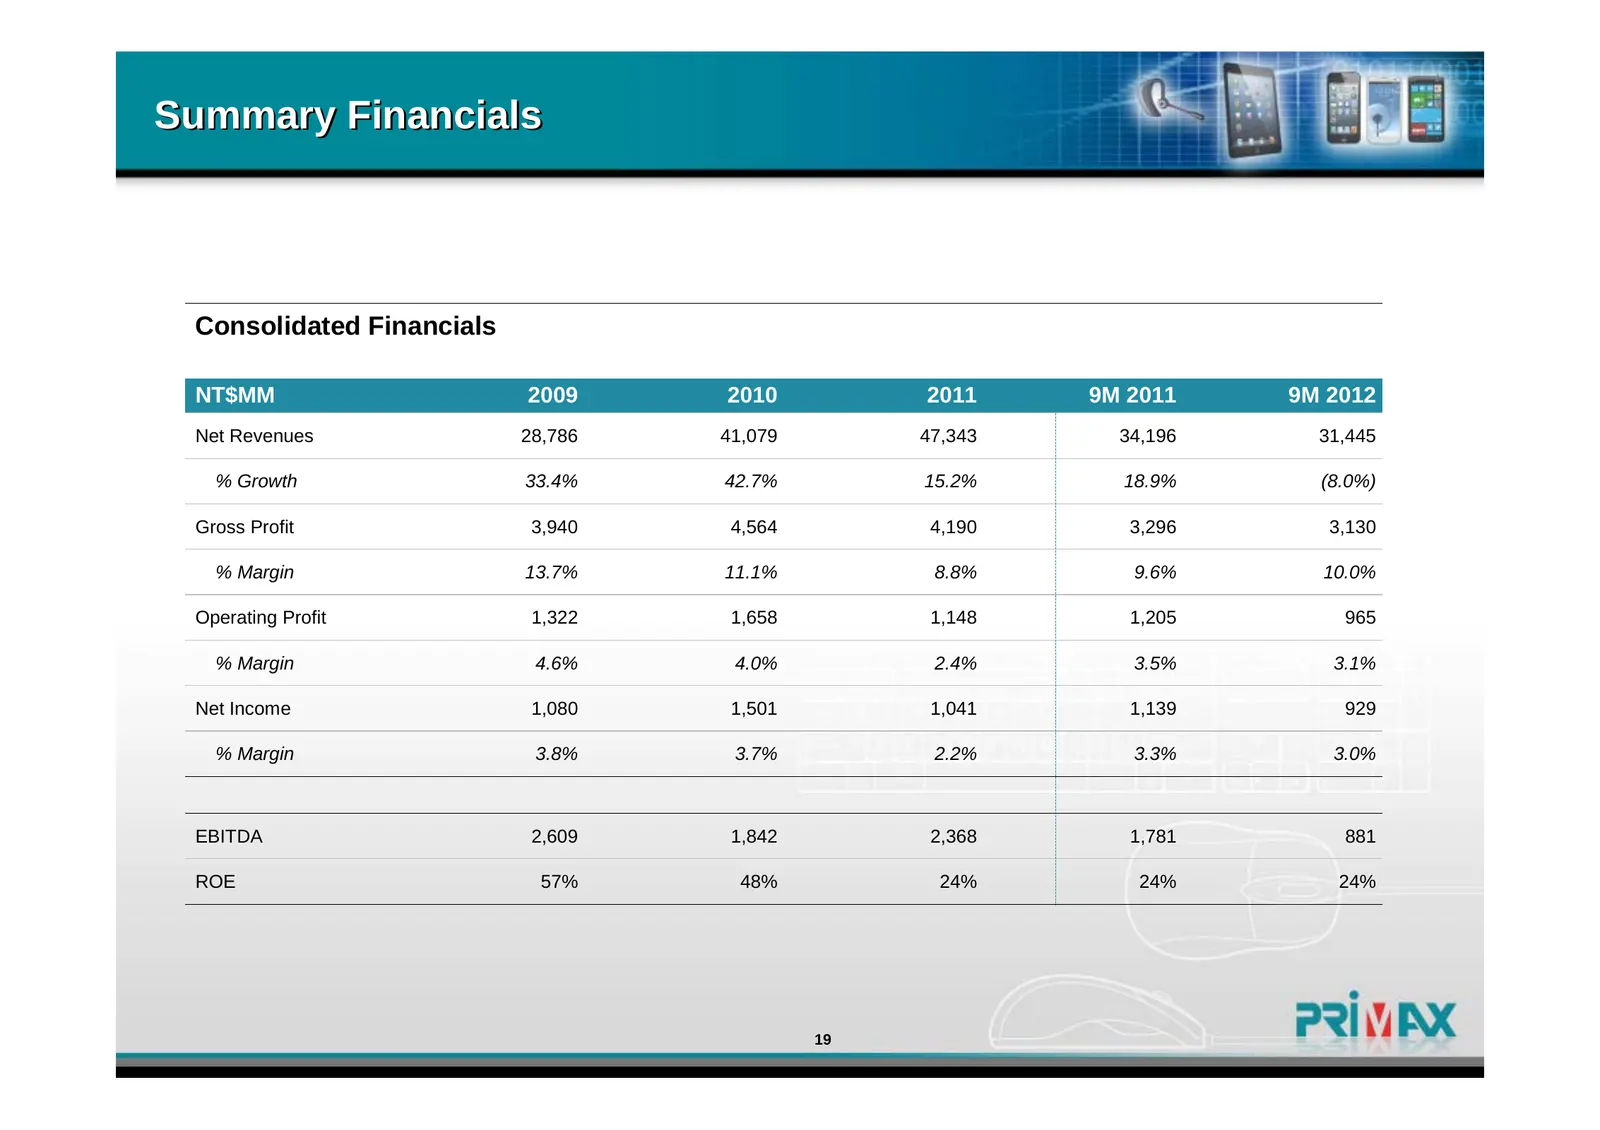
Summary Financials Consolidated Financials NT$MM 2009 2010 2011 9M 2011 9M 2012 Net Revenues 28,786 41,079 47,343 34,196 31,445 % Growth 33.4% 42.7% 15.2% 18.9% (8.0%) Gross Profit 3,940 4,564 4,190 3,296 3,130 % Margin 13.7% 11.1% 8.8% 9.6% 10.0% Operating Profit 1,322 1,658 1,148 1,205 965 % Margi
Slide 20: Our Capital Structure
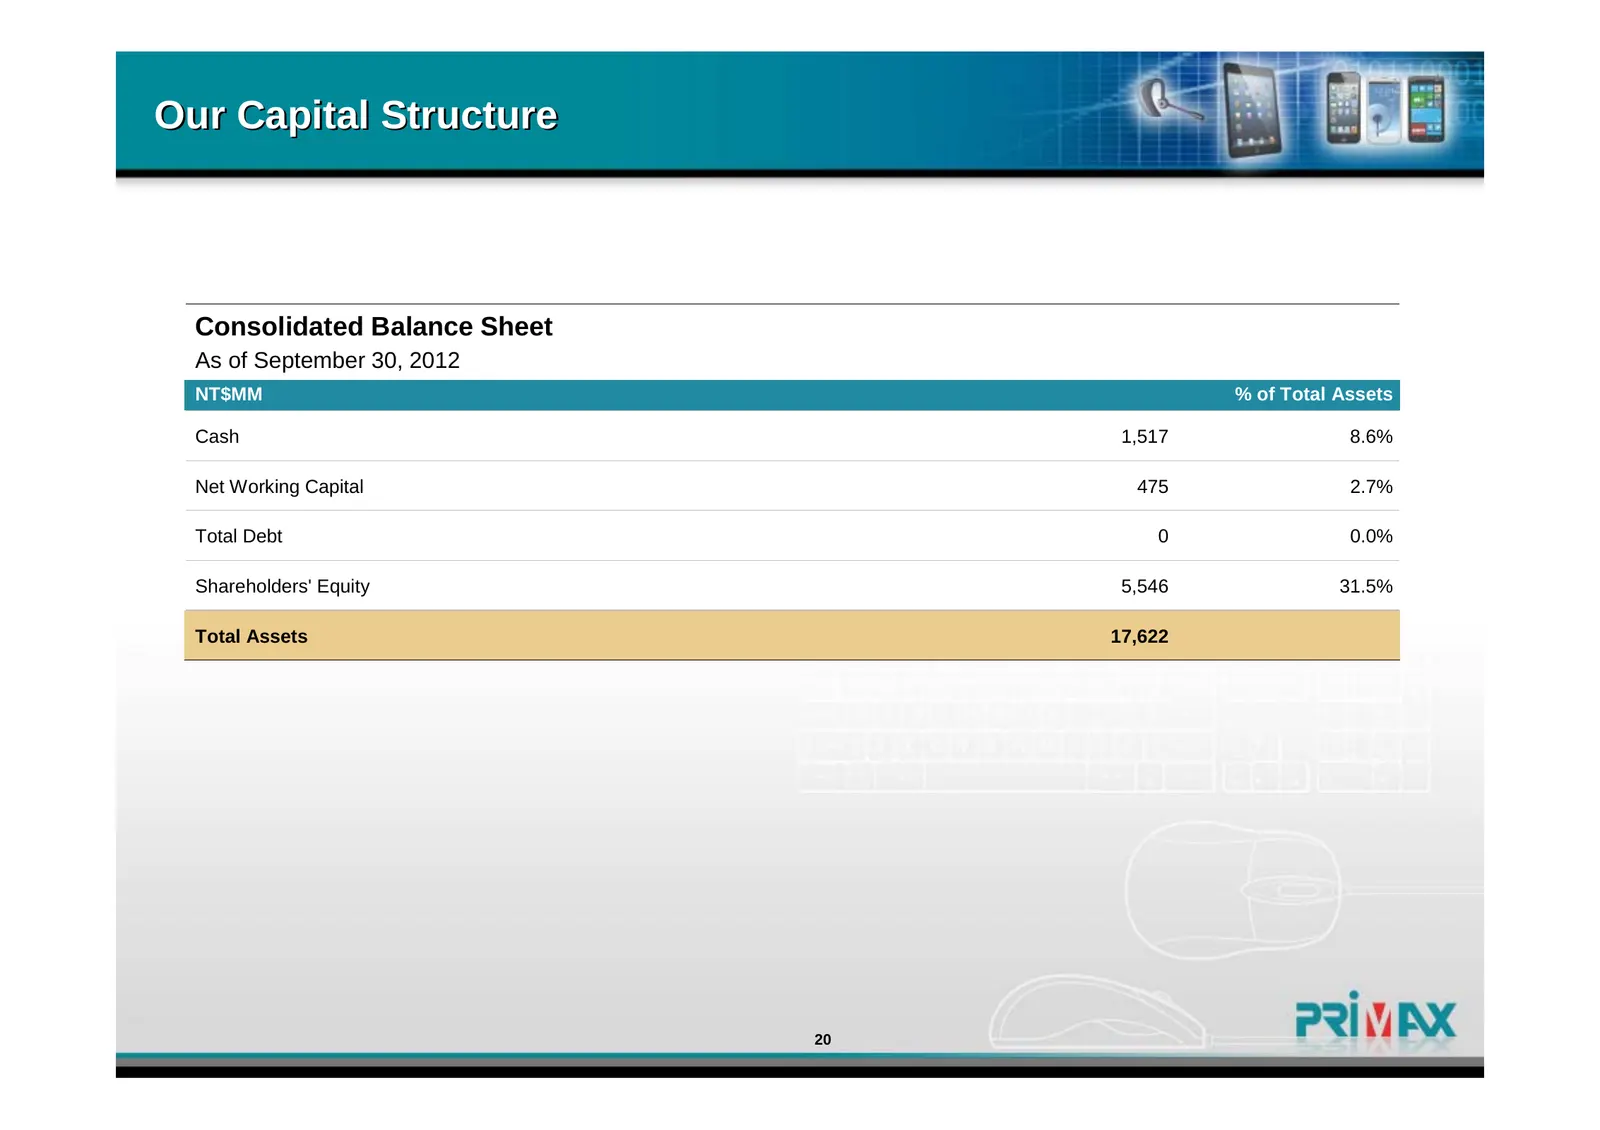
Our Capital Structure Consolidated Balance Sheet As of September 30, 2012 NT$MM % of Total Assets Cash 1,517 8.6% Net Working Capital 475 2.7% Total Debt 0 0.0% Shareholders' Equity 5,546 31.5% Total Assets 17,622 20

Slide 21: PRNAX F
PRNAX F
Source: Internet Archive copy of primax.com.tw
More decks from Primax Electronics Ltd.
 Q3 2024 Earnings Presentation15 slides · Oct 29, 2024
 Q2 2024 Earnings Presentation15 slides · Jul 29, 2024
 Q1 2024 Earnings Presentation15 slides · Apr 29, 2024
 Q4 2023 Earnings Presentation15 slides · Feb 21, 2024
 Q1 2021 Earnings Presentation16 slides · Feb 26, 2021
 Q3 2013 Earnings Presentation14 slides · Dec 10, 2013