Flutter Entertainment plc · NYSE:FLUT
Flutter Entertainment — Paddy Power — FY2013 Earnings Presentation
30 slides from Flutter Entertainment's earnings presentation, March 2014
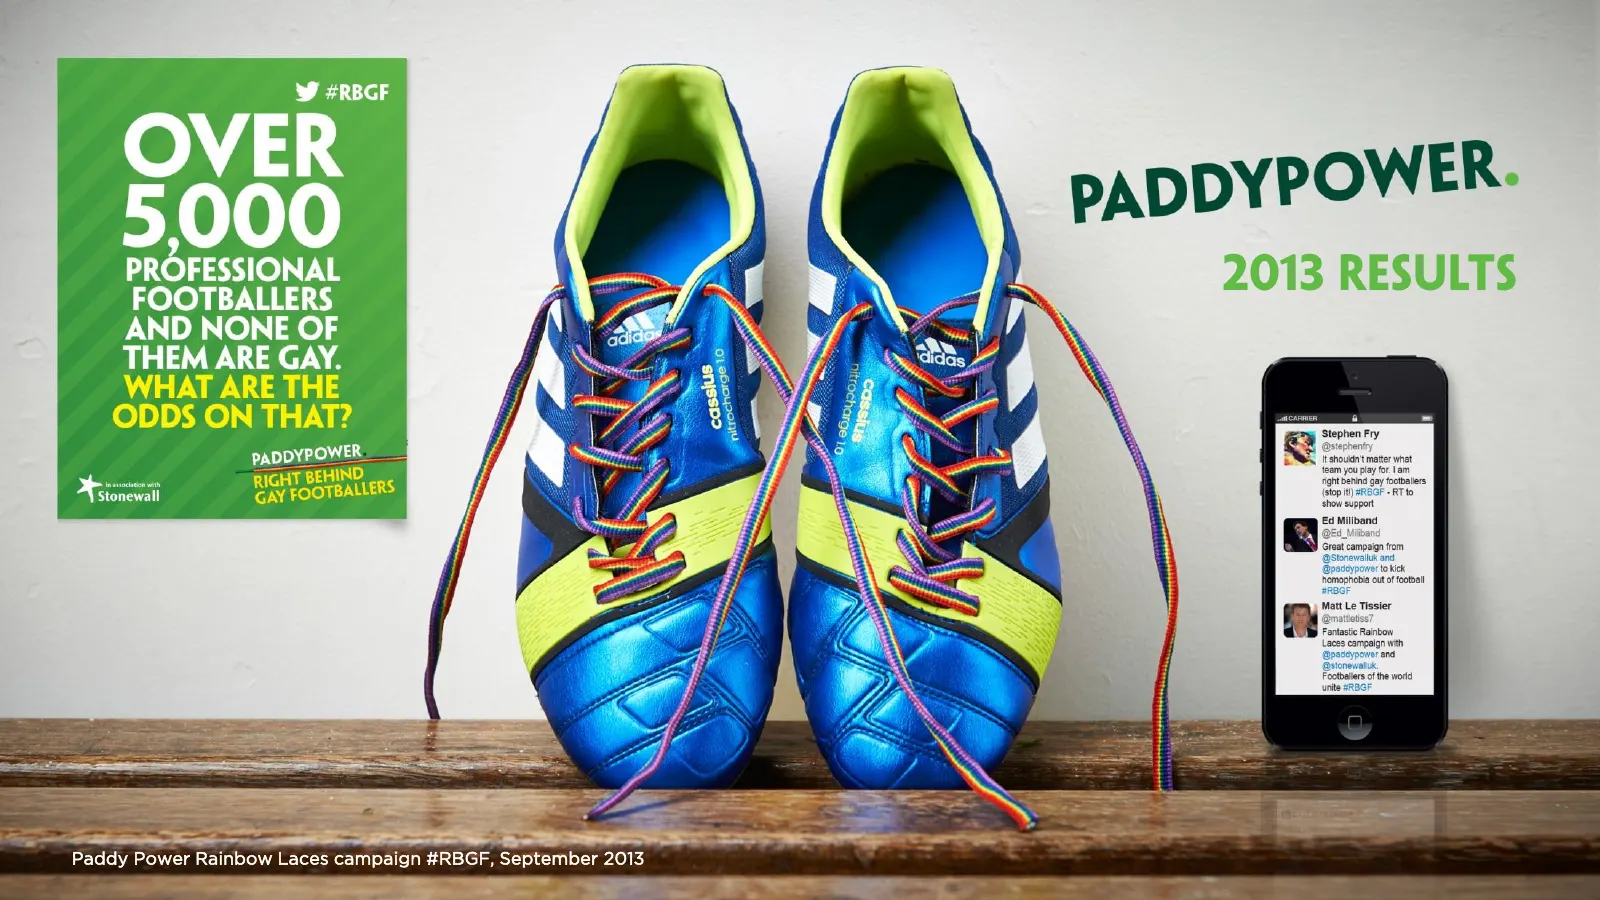
Slide 1: Paddy Power Rainbow Laces campaign
Paddy Power Rainbow Laces campaign #RBGF, September 2013
Slide 2: Highlights
HIGHLIGHTS
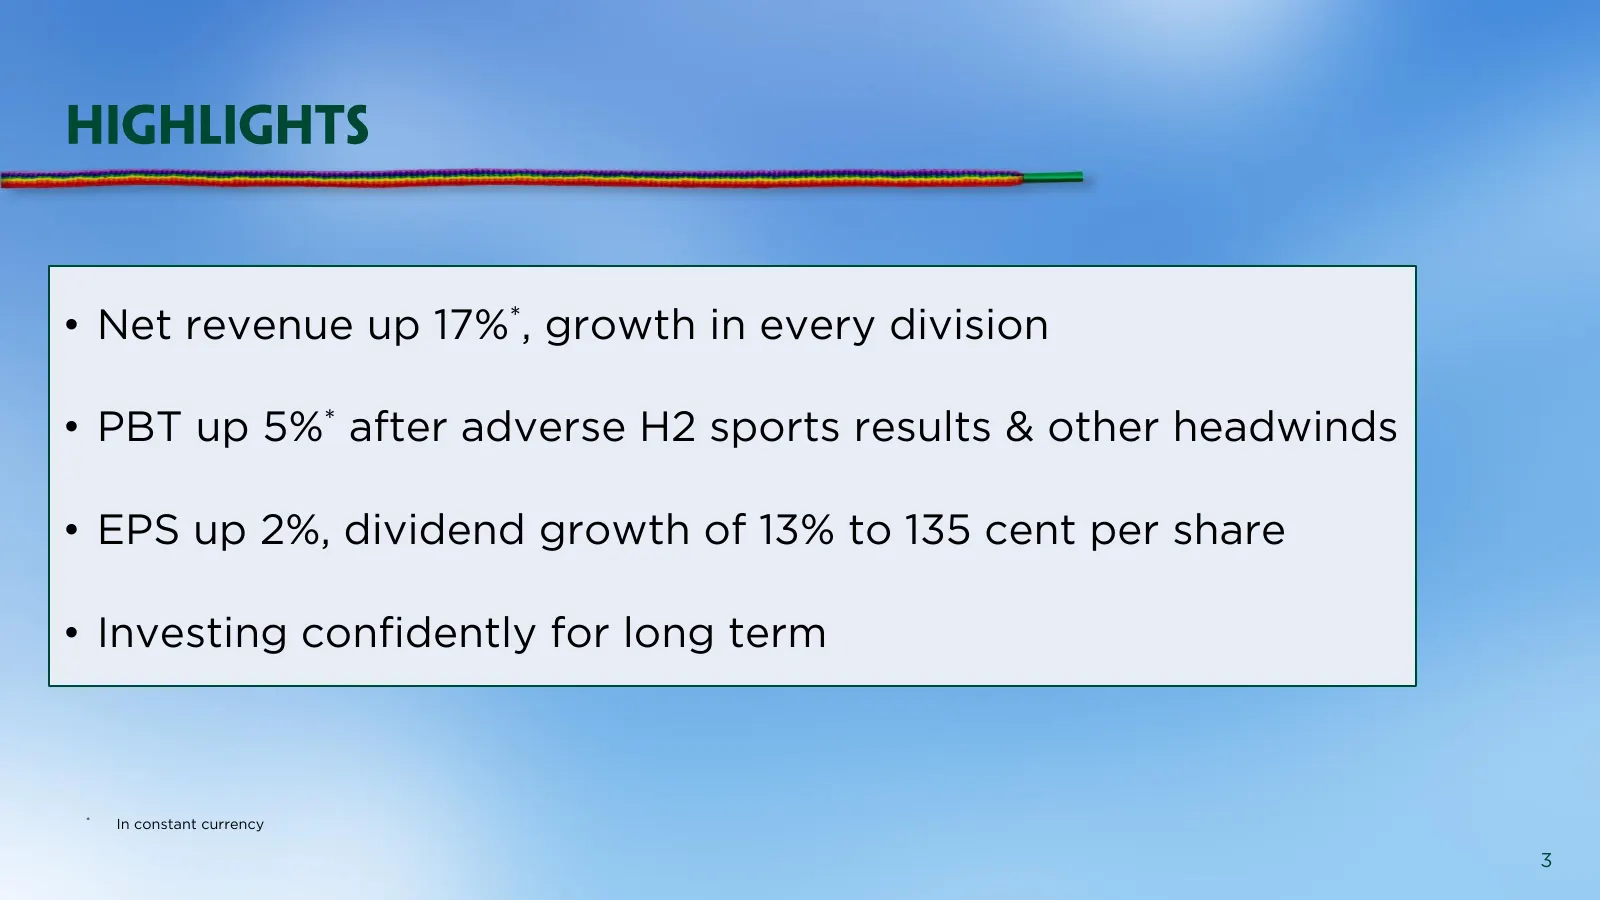
Slide 3: Highlights
• Net revenue up 17%*, growth in every division • PBT up 5%* after adverse H2 sports results & other headwinds • EPS up 2%, dividend growth of 13% to 135 cent per share • Investing confidently for long term * In constant currency 3

Slide 4: Financial & Operational Review
FINANCIAL & OPERATIONAL REVIEW
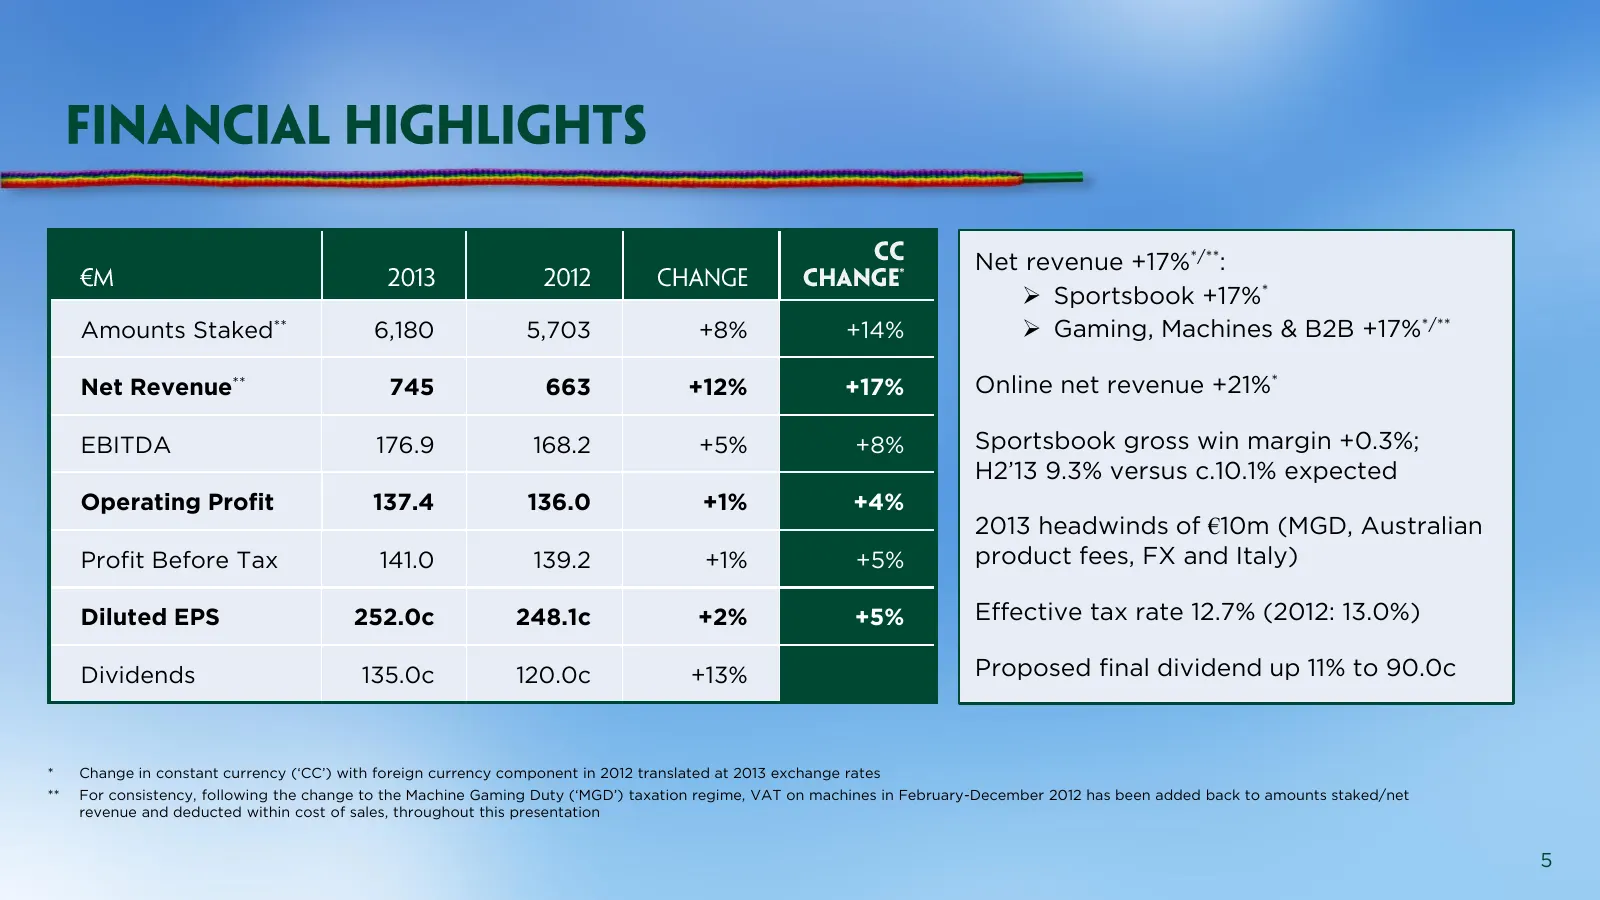
Slide 5: Group net revenue and key financials
Net revenue +17%*/**: Sportsbook +17%* Amounts Staked** 6,180 5,703 +8% +14% Gaming, Machines & B2B +17%*/** Net Revenue** 745 663 +12% +17% Online net revenue +21%* EBITDA 176.9 168.2 +5% +8% Sportsbook gross win margin +0.3%; H2’13 9.3% versus c.10.1% expected Operating Profit 137.4 136.0 +1%
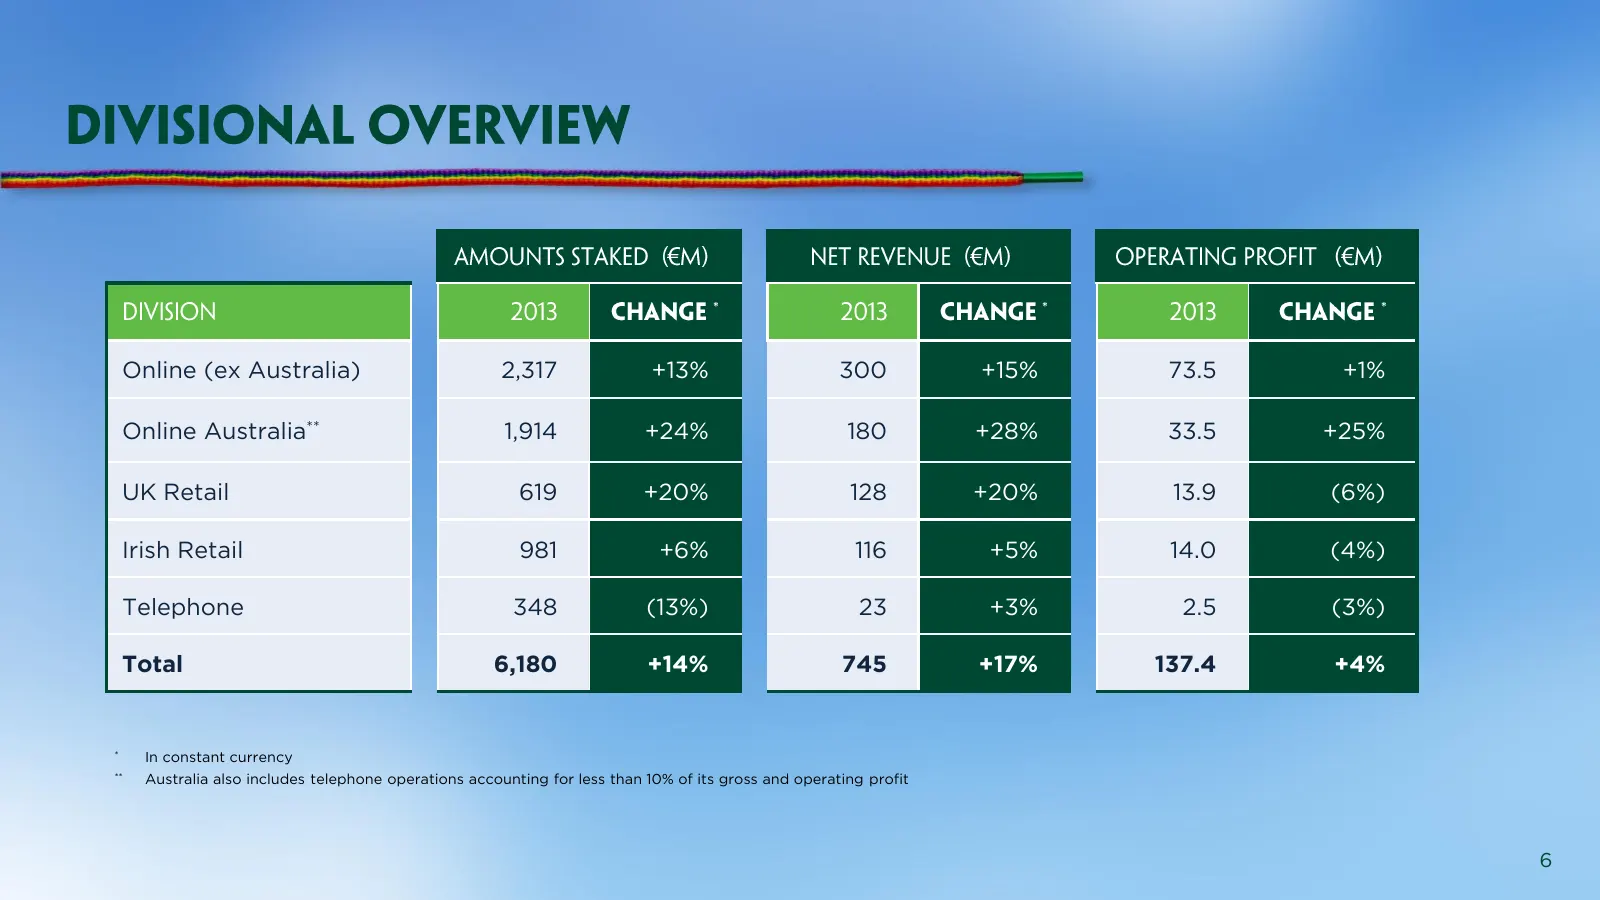
Slide 6: Results by division
Online (ex Australia) 2,317 +13% 300 +15% 73.5 +1% Online Australia** 1,914 +24% 180 +28% 33.5 +25% UK Retail 619 +20% 128 +20% 13.9 (6%) Irish Retail 981 +6% 116 +5% 14.0 (4%) Telephone 348 (13%) 23 +3% 2.5 (3%) Total 6,180 +14% 745 +17% 137.4 +4% * In constant currency ** Australia also includes t
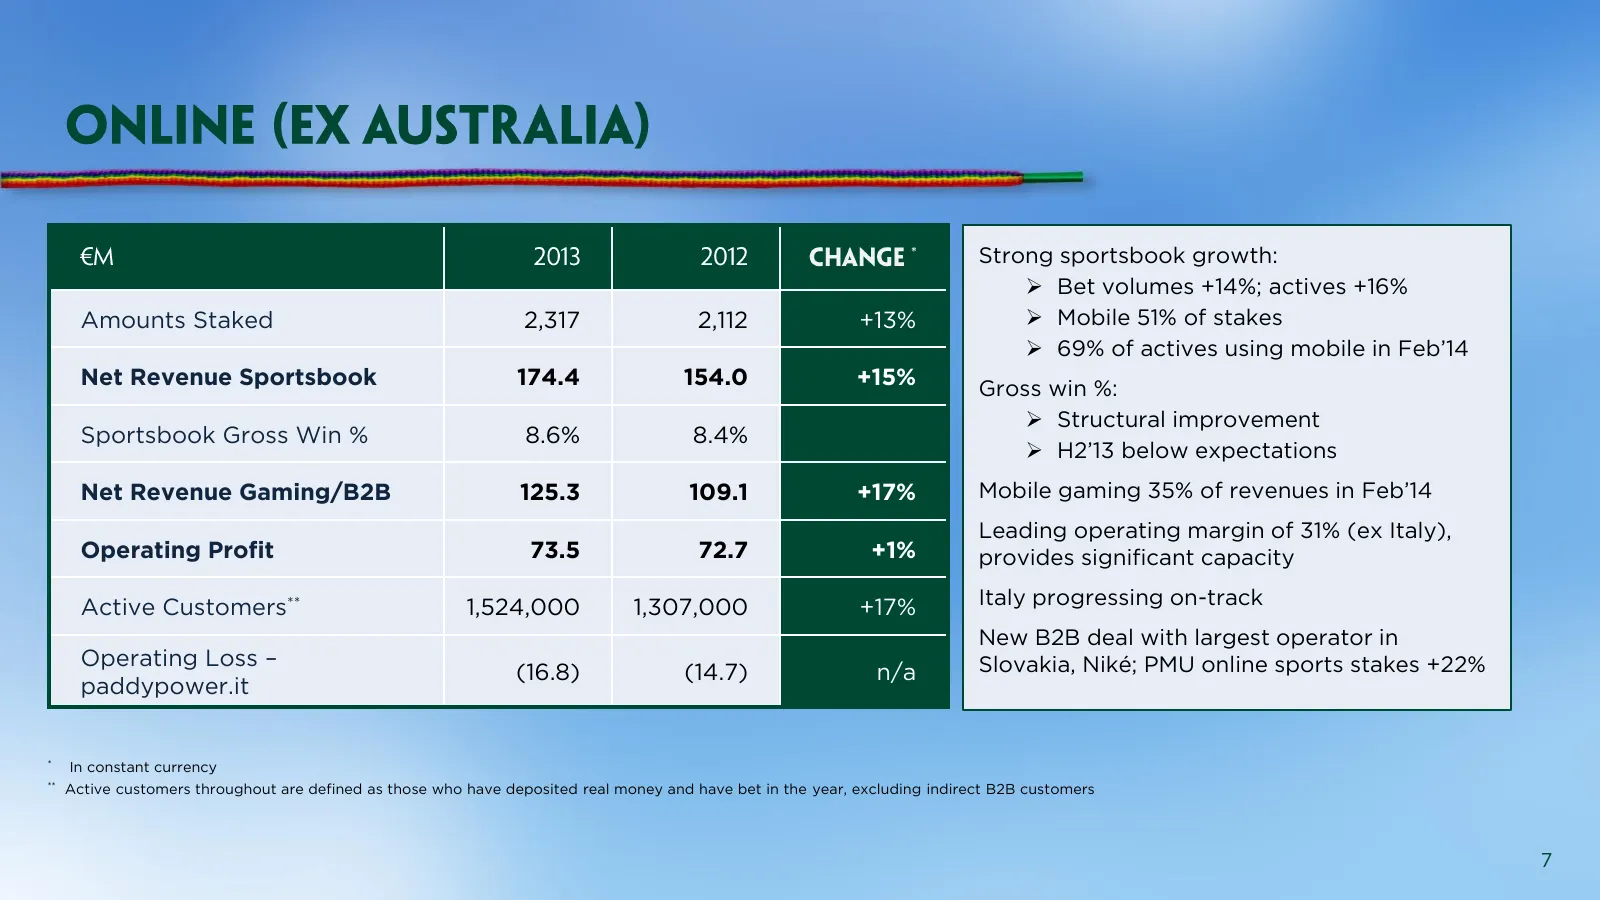
Slide 7: Online (ex Australia) results
Strong sportsbook growth: Bet volumes +14%; actives +16% Amounts Staked 2,317 2,112 +13% Mobile 51% of stakes 69% of actives using mobile in Feb’14 Net Revenue Sportsbook 174.4 154.0 +15% Gross win %: Structural improvement Sportsbook Gross Win % 8.6% 8.4% H2’13 below expectations Net Reve
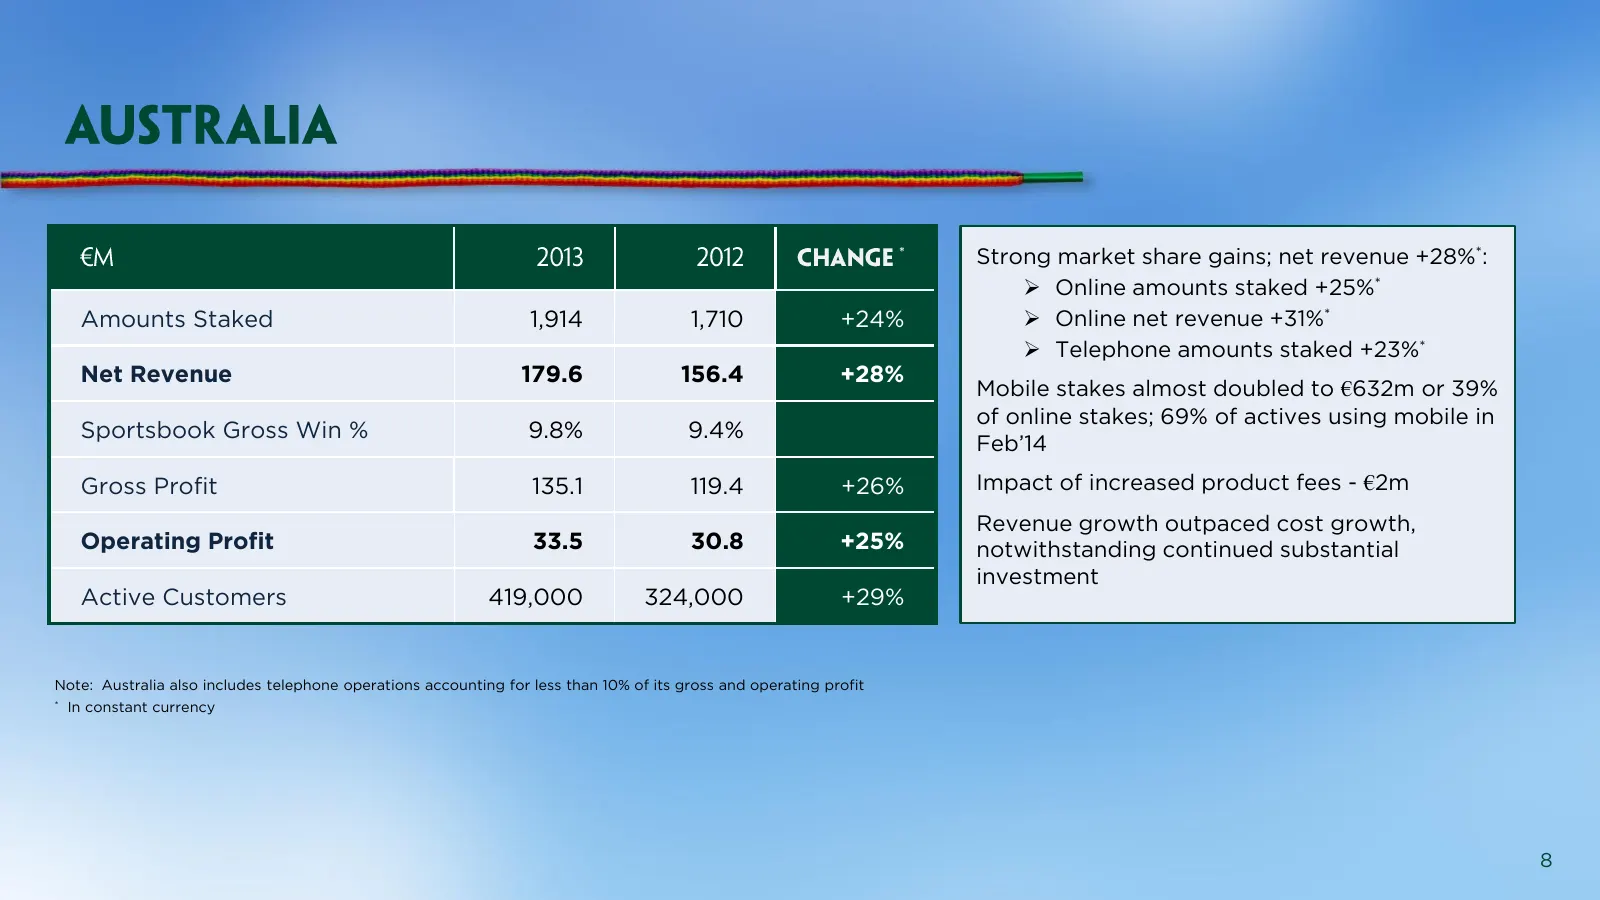
Slide 8: Online Australia results
Strong market share gains; net revenue +28%*: Online amounts staked +25%* Amounts Staked 1,914 1,710 +24% Online net revenue +31%* Telephone amounts staked +23%* Net Revenue 179.6 156.4 +28% Mobile stakes almost doubled to €632m or 39% of online stakes; 69% of actives using mobile in Sportsboo
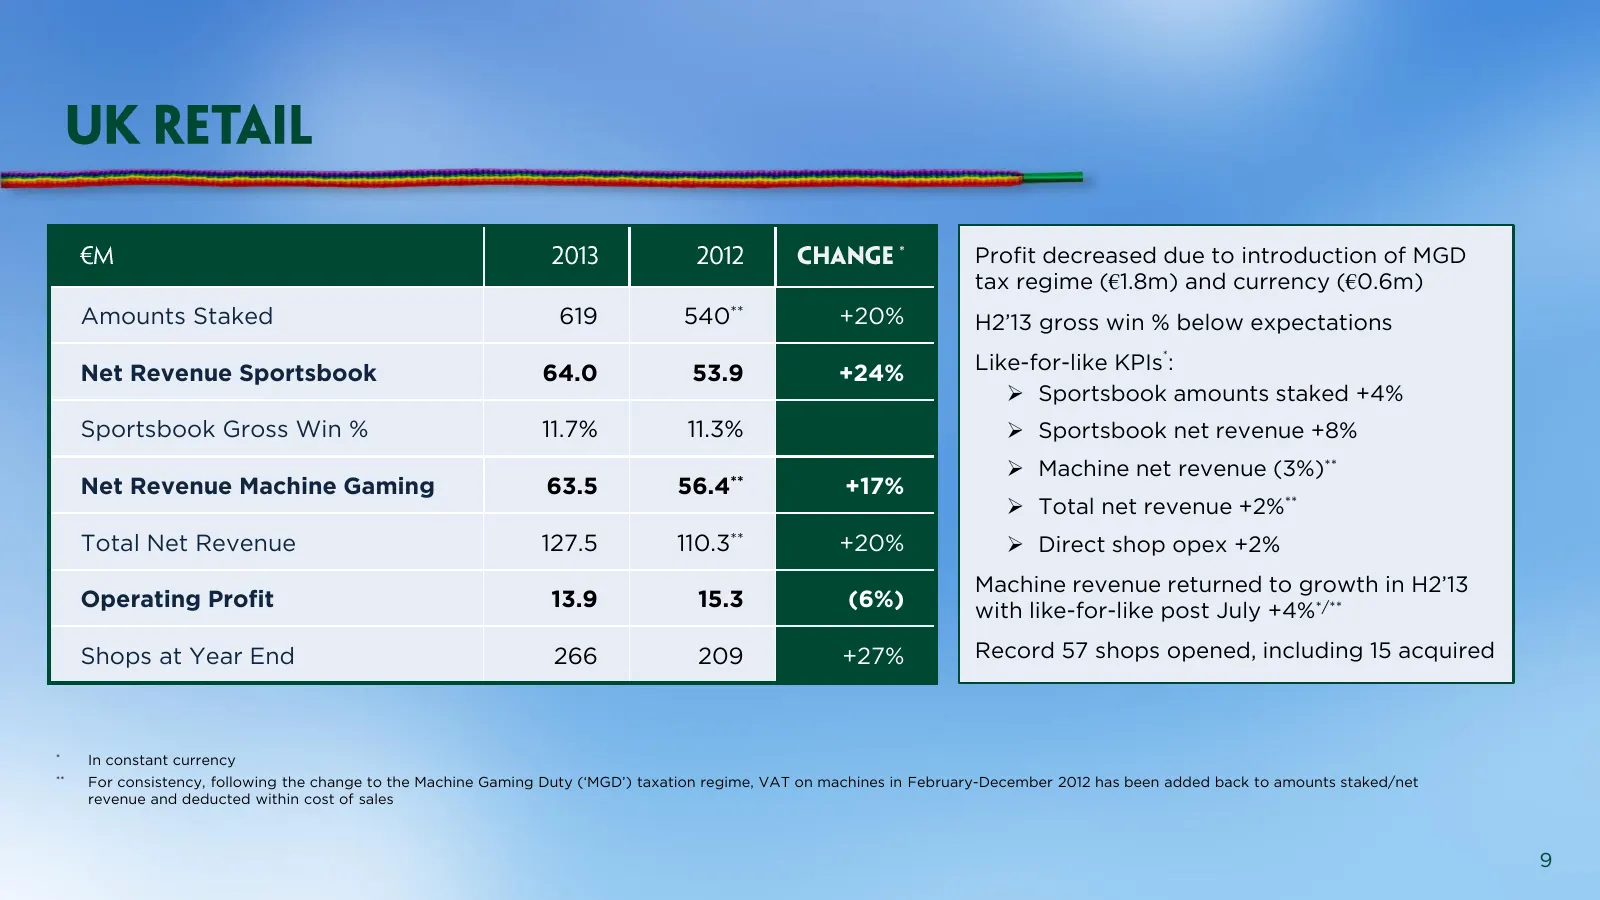
Slide 9: UK Retail results
Profit decreased due to introduction of MGD tax regime (€1.8m) and currency (€0.6m) Amounts Staked 619 540** +20% H2’13 gross win % below expectations Like-for-like KPIs*: Net Revenue Sportsbook 64.0 53.9 +24% Sportsbook amounts staked +4% Sportsbook Gross Win % 11.7% 11.3% Sportsbook net revenu
Slide 10: Irish Retail results
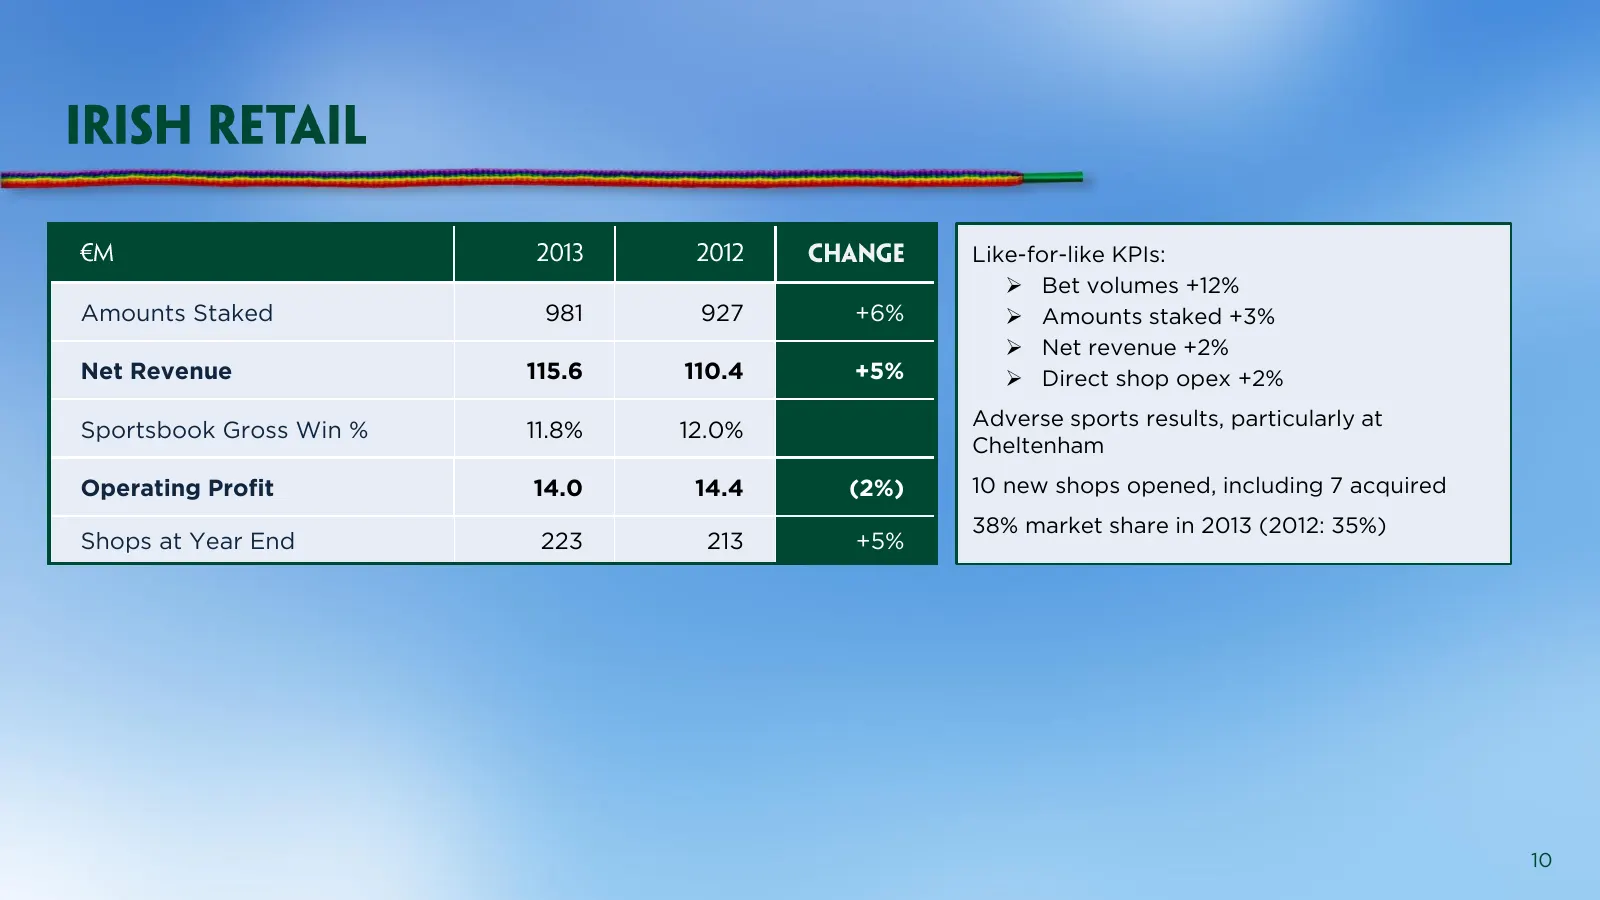
Like-for-like KPIs: Bet volumes +12% Amounts Staked 981 927 +6% Amounts staked +3% Net revenue +2% Net Revenue 115.6 110.4 +5% Direct shop opex +2% Adverse sports results, particularly at Sportsbook Gross Win % 11.8% 12.0% Cheltenham Operating Profit 14.0 14.4 (2%) 10 new shops opened, inclu
Slide 11: Telephone results
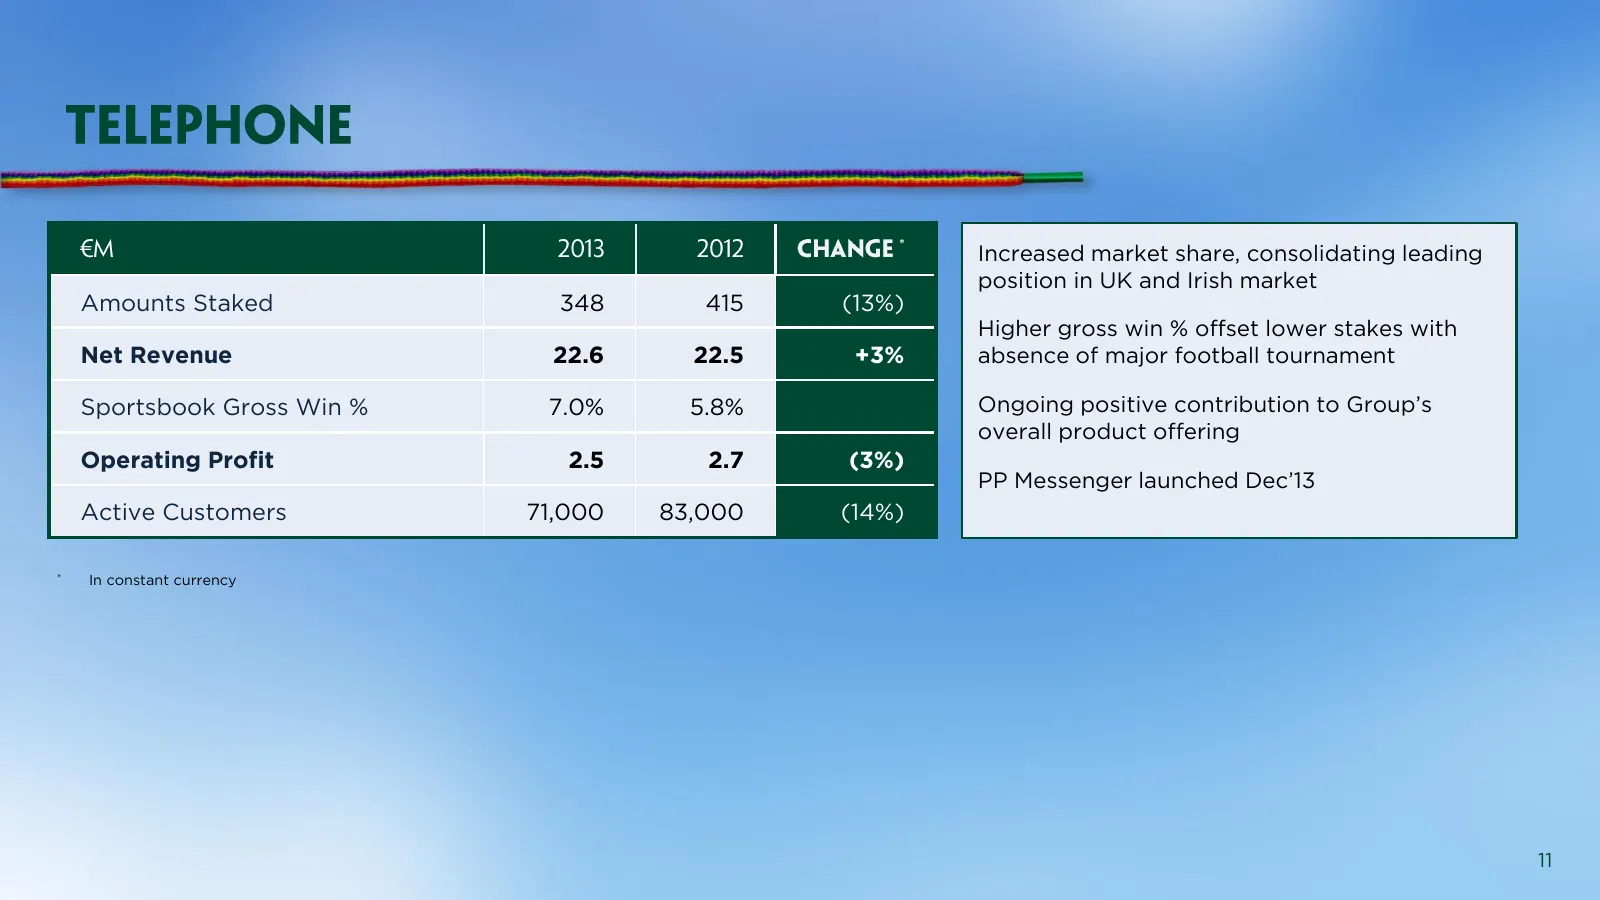
Increased market share, consolidating leading position in UK and Irish market Amounts Staked 348 415 (13%) Higher gross win % offset lower stakes with Net Revenue 22.6 22.5 +3% absence of major football tournament Sportsbook Gross Win % 7.0% 5.8% Ongoing positive contribution to Group’s overall prod
Slide 12: Marketing spend and operating cost growth
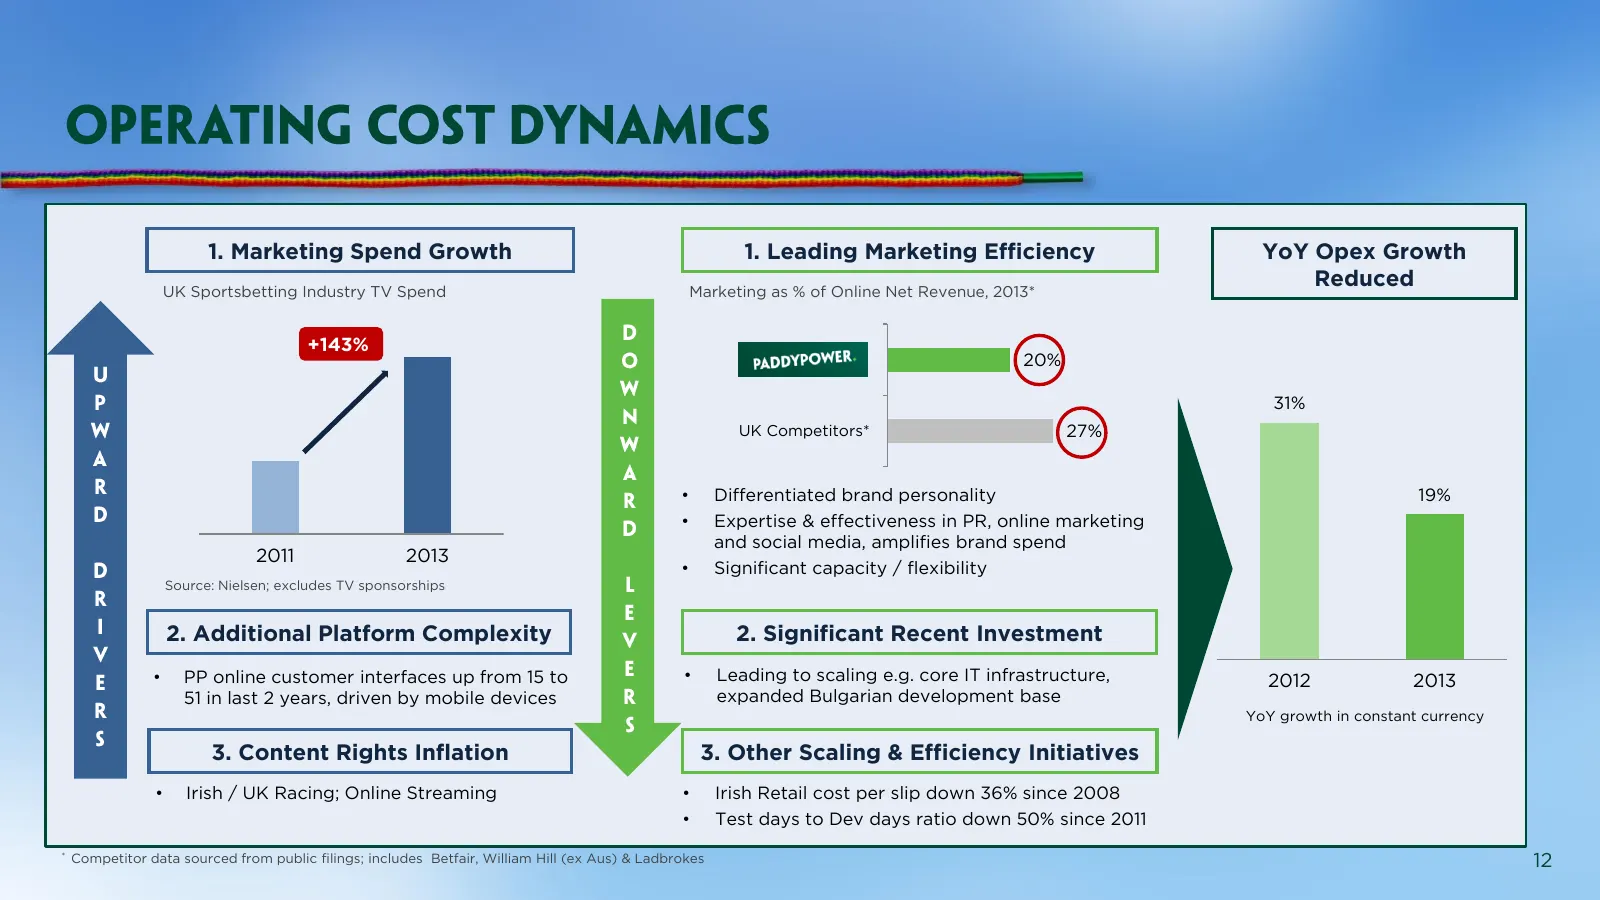
1. Marketing Spend Growth 1. Leading Marketing Efficiency YoY Opex Growth UK Sportsbetting Industry TV Spend Marketing as % of Online Net Revenue, 2013* Reduced +143% 20% 31% UK Competitors* 27% • Differentiated brand personality 19% • Expertise & effectiveness in PR, online marketing and social med
Slide 13: Cash flow
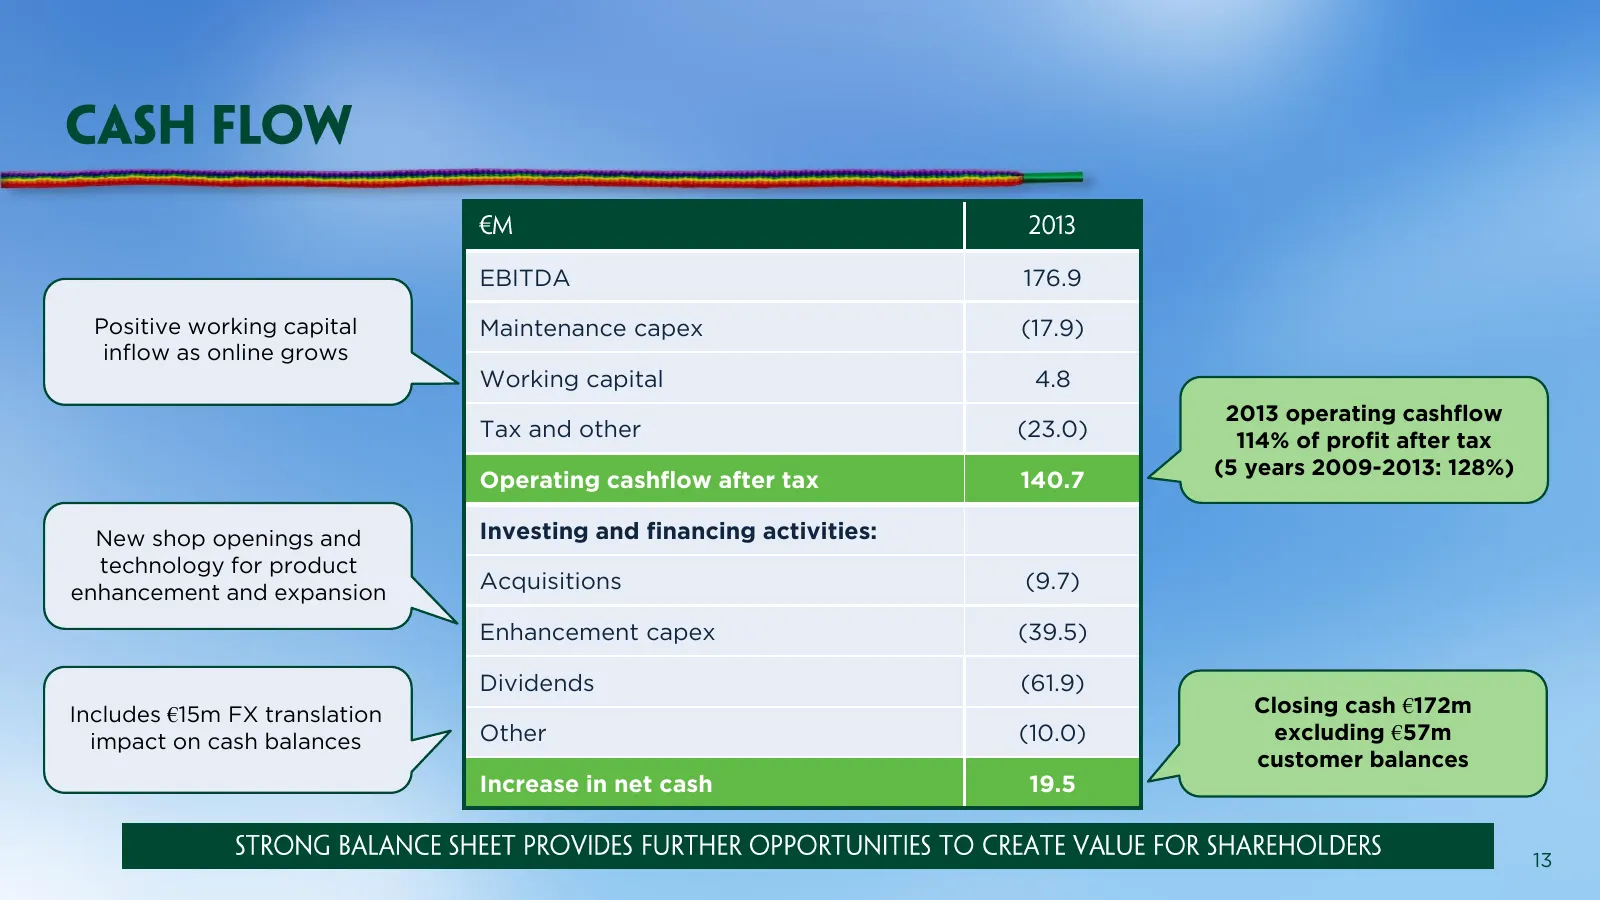
EBITDA 176.9 Positive working capital Maintenance capex (17.9) inflow as online grows Working capital 4.8 2013 operating cashflow Tax and other (23.0) 114% of profit after tax (5 years 2009-2013: 128%) Operating cashflow after tax 140.7 New shop openings and Investing and financing activities: techn
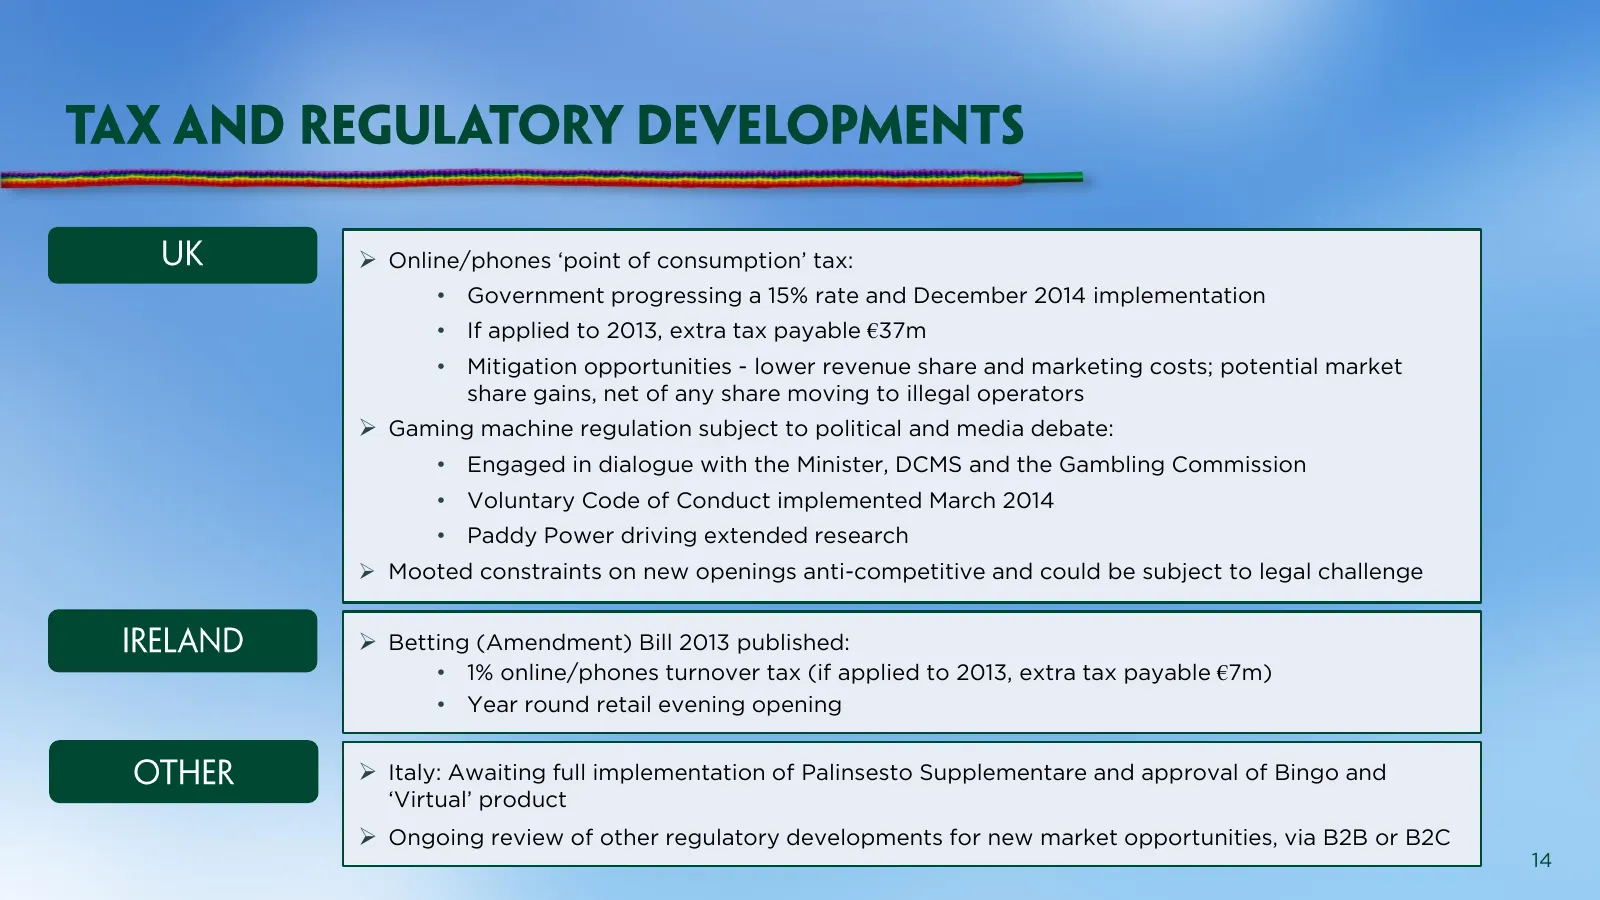
Slide 14: Regulatory and tax developments
Online/phones ‘point of consumption’ tax: • Government progressing a 15% rate and December 2014 implementation • If applied to 2013, extra tax payable €37m • Mitigation opportunities - lower revenue share and marketing costs; potential market share gains, net of any share moving to illegal operato

Slide 15: Strategy & Outlook
STRATEGY & OUTLOOK
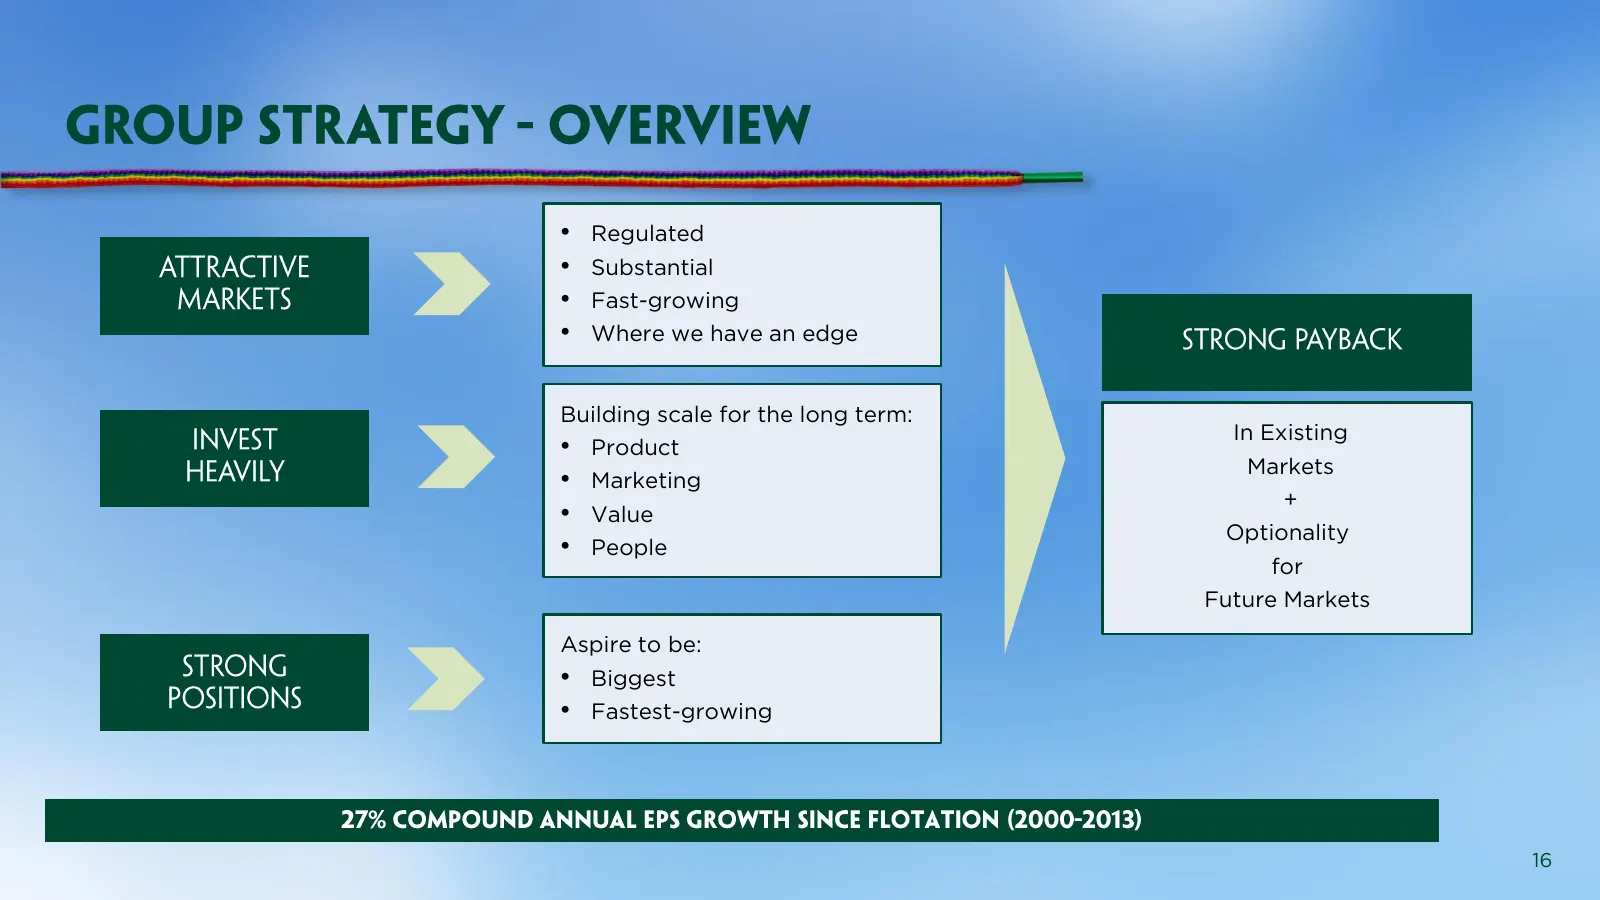
Slide 16: Building scale for the long term
• Regulated • Substantial • Fast-growing • Where we have an edge Building scale for the long term: In Existing • Product Markets • Marketing + • Value Optionality • People for Future Markets Aspire to be: • Biggest • Fastest-growing 16
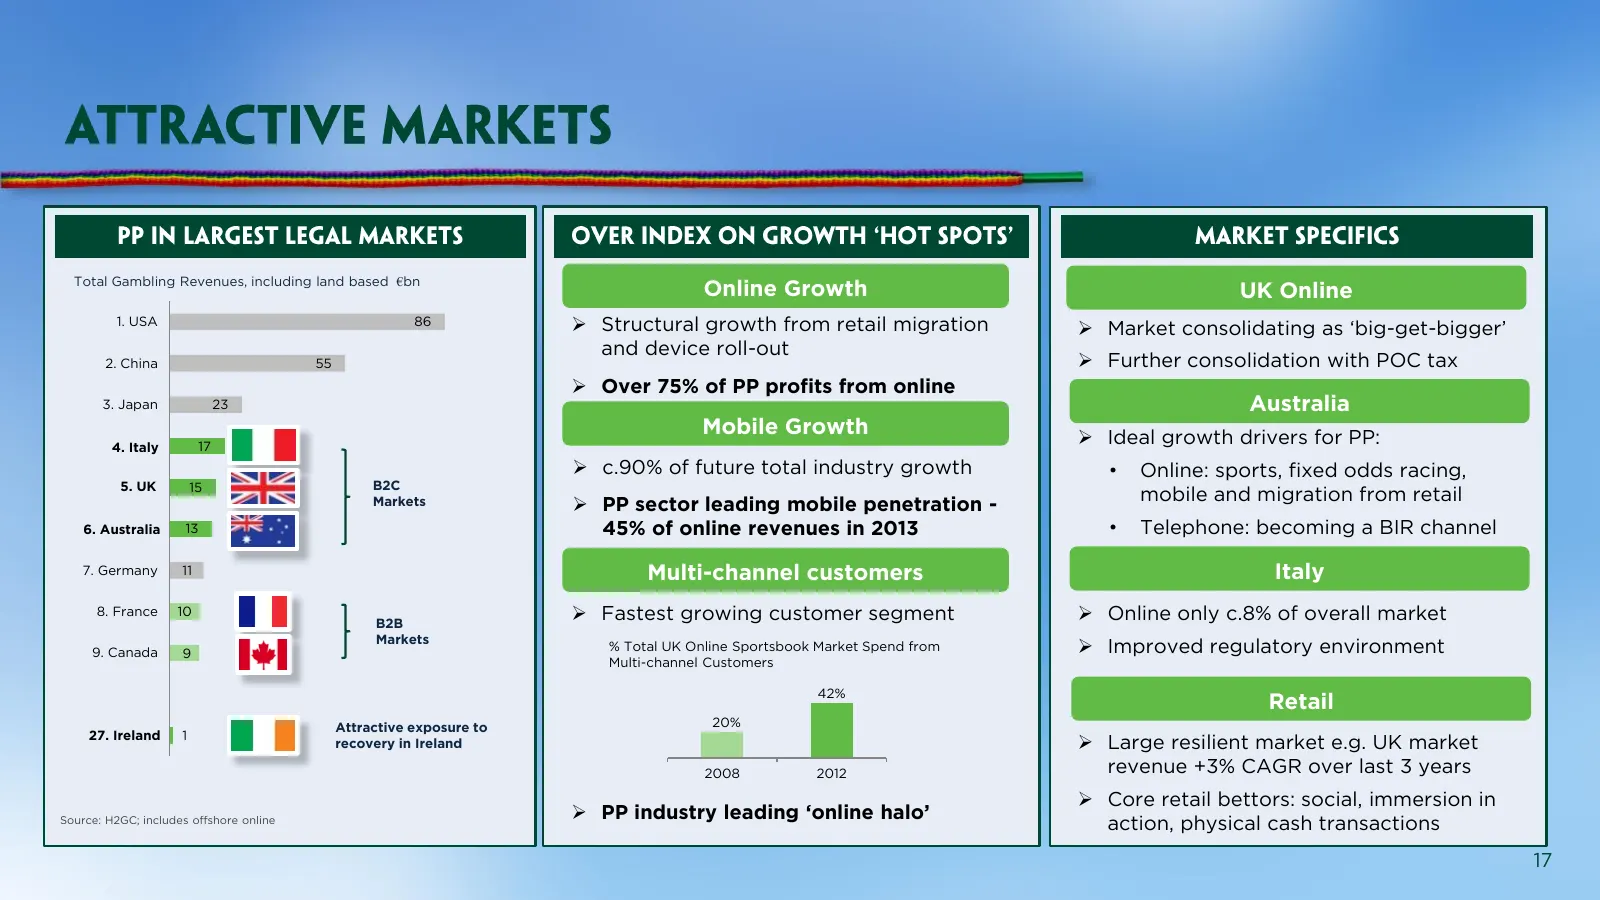
Slide 17: Market growth drivers and exposure
Total Gambling Revenues, including land based €bn Online Growth UK Online 1. USA 86 Structural growth from retail migration Market consolidating as ‘big-get-bigger’ and device roll-out 2. China 55 Further consolidation with POC tax Over 75% of PP profits from online 3. Japan 23 Australia Mob
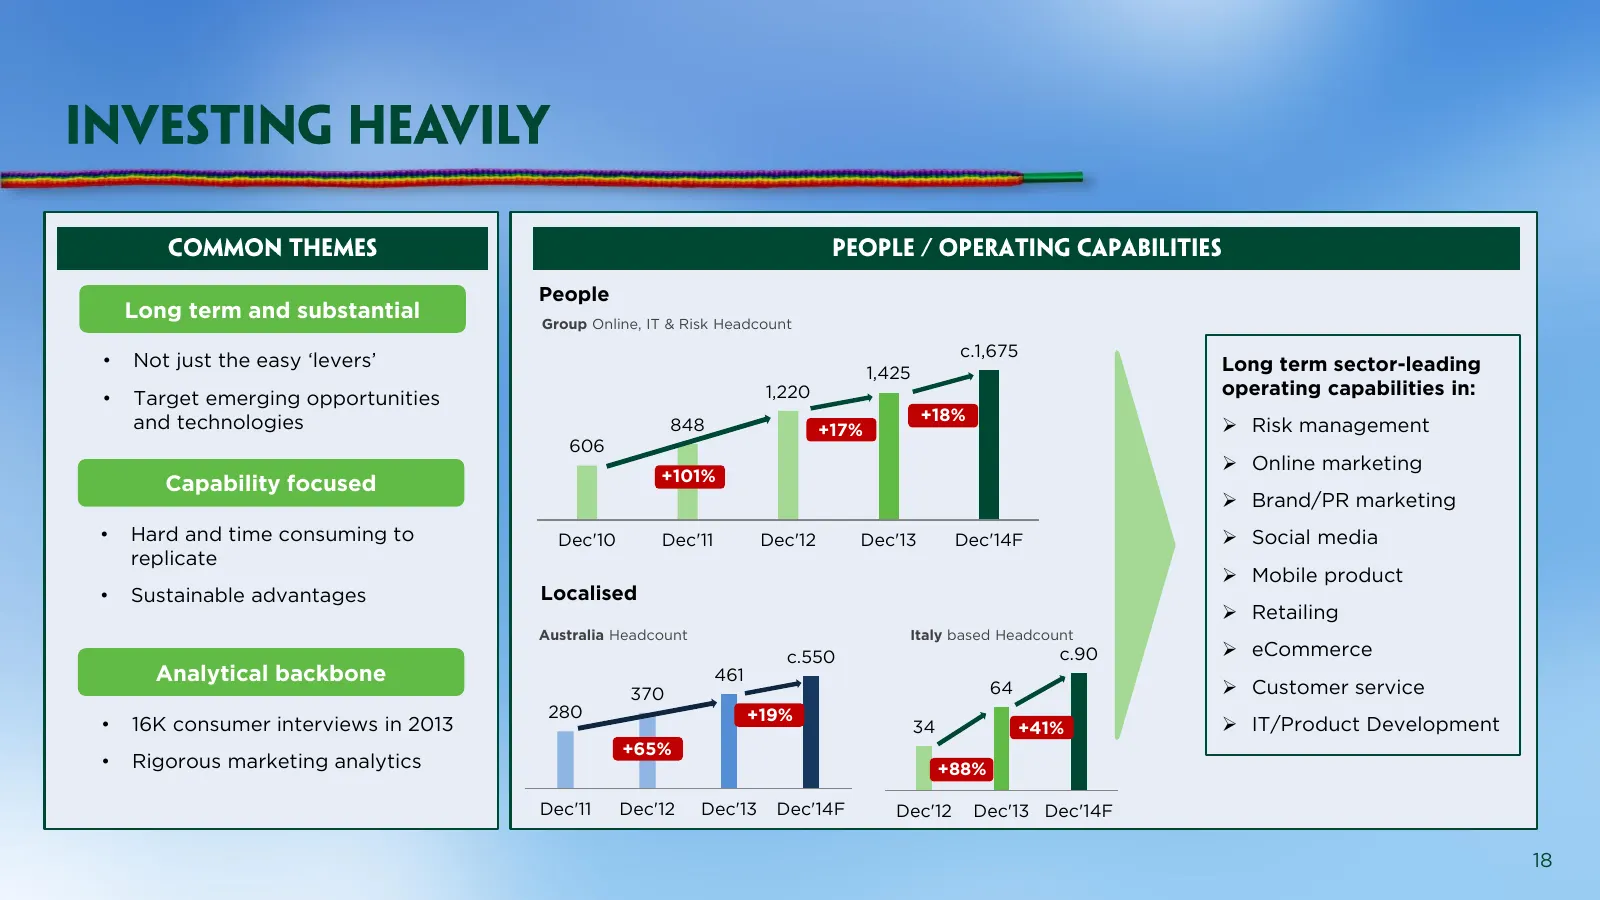
Slide 18: People and operating capabilities
People Long term and substantial Group Online, IT & Risk Headcount c.1,675 • Not just the easy ‘levers’ Long term sector-leading 1,425 • Target emerging opportunities 1,220 operating capabilities in: and technologies +18% 848 +17% Risk management 606 Online marketing +101% Capability focused B
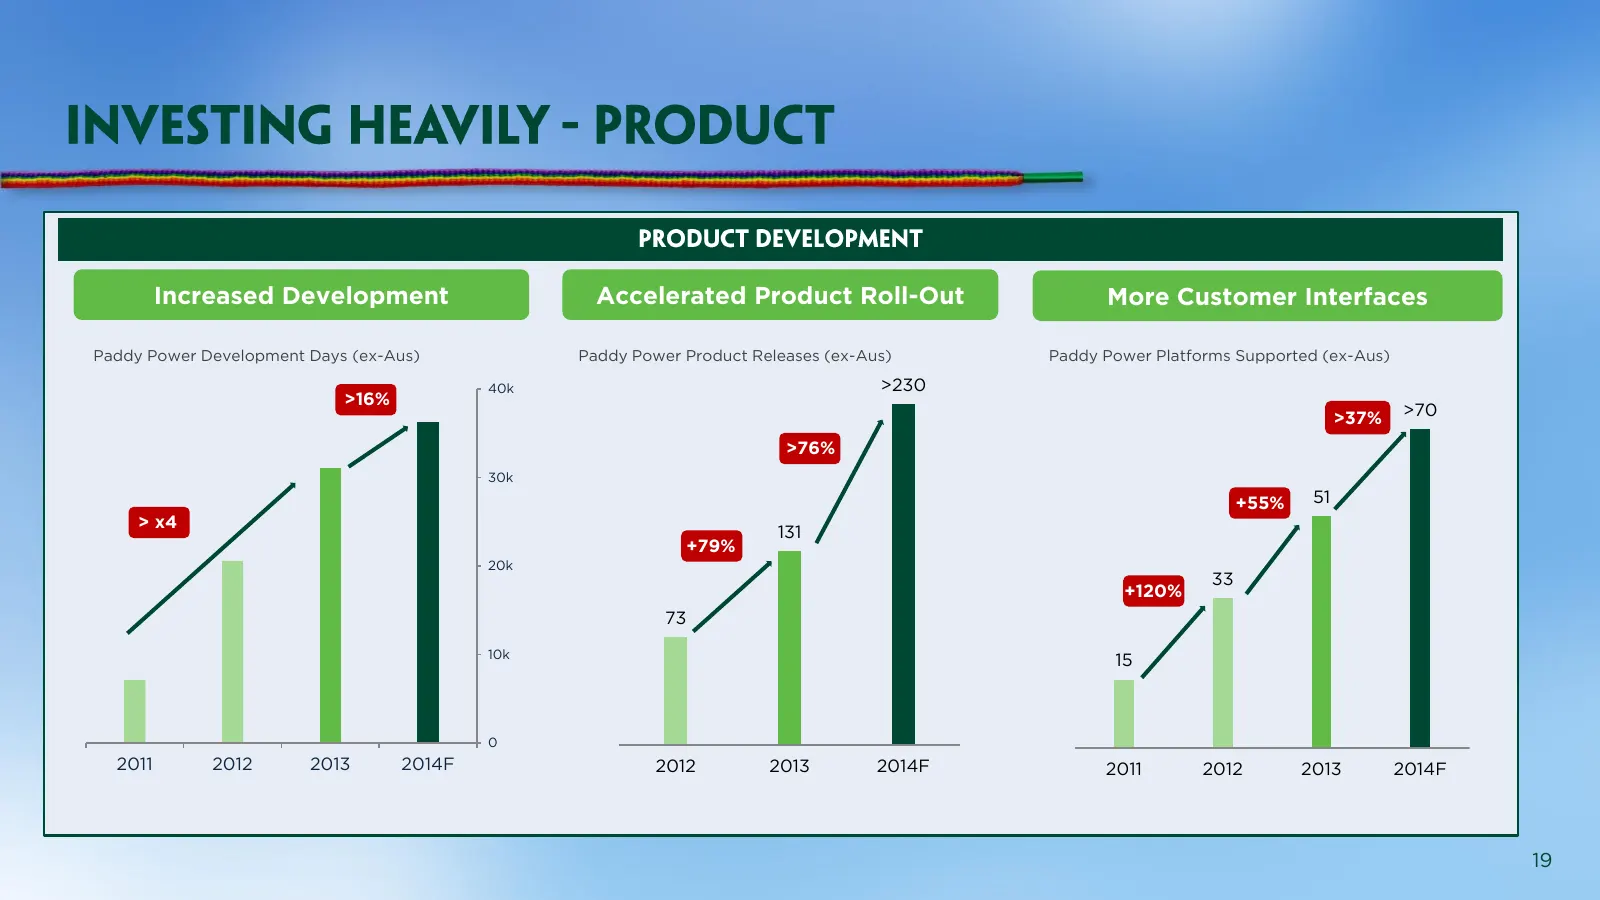
Slide 19: Increased development and product roll-out
Increased Development Accelerated Product Roll-Out More Customer Interfaces Paddy Power Development Days (ex-Aus) Paddy Power Product Releases (ex-Aus) Paddy Power Platforms Supported (ex-Aus) 40k >230 >16% >37% >70 >76% 30k +55% 51 > x4 131 +79% 20k 33 +120% 73 10k 15 0 2011 2012 2013 2014F 2012 20
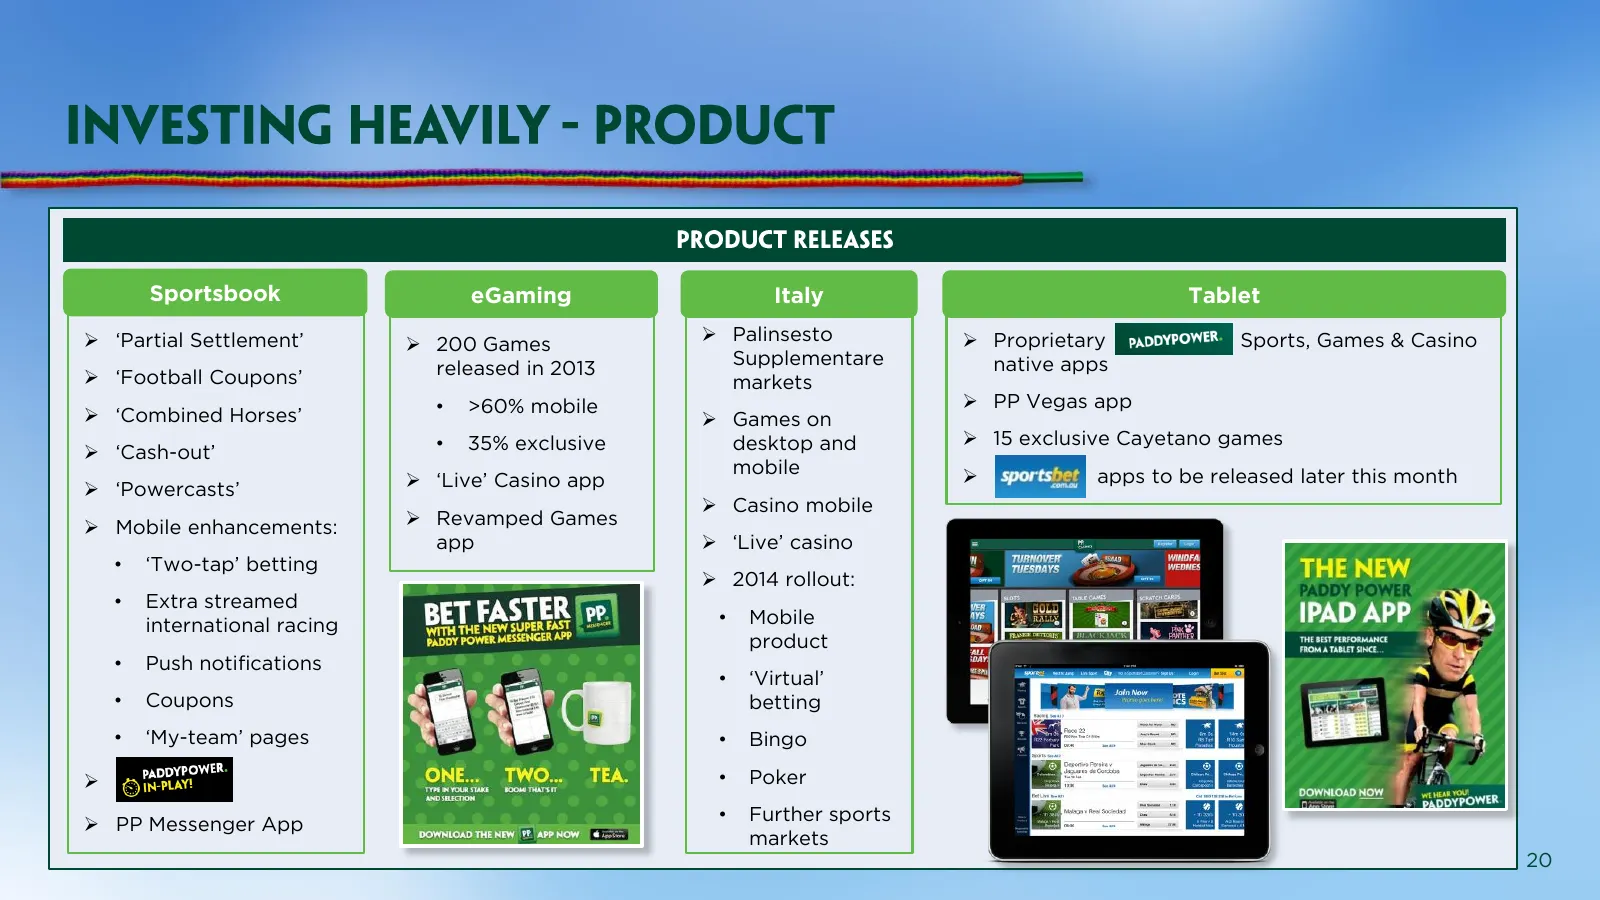
Slide 20: Online product innovation
Sportsbook eGaming Italy Tablet ‘Partial Settlement’ Palinsesto Proprietary Sports, Games & Casino 200 Games Supplementare native apps ‘Football Coupons’ released in 2013 markets • >60% mobile PP Vegas app ‘Combined Horses’ Games on • 35% exclusive desktop and 15 exclusive Cayetano
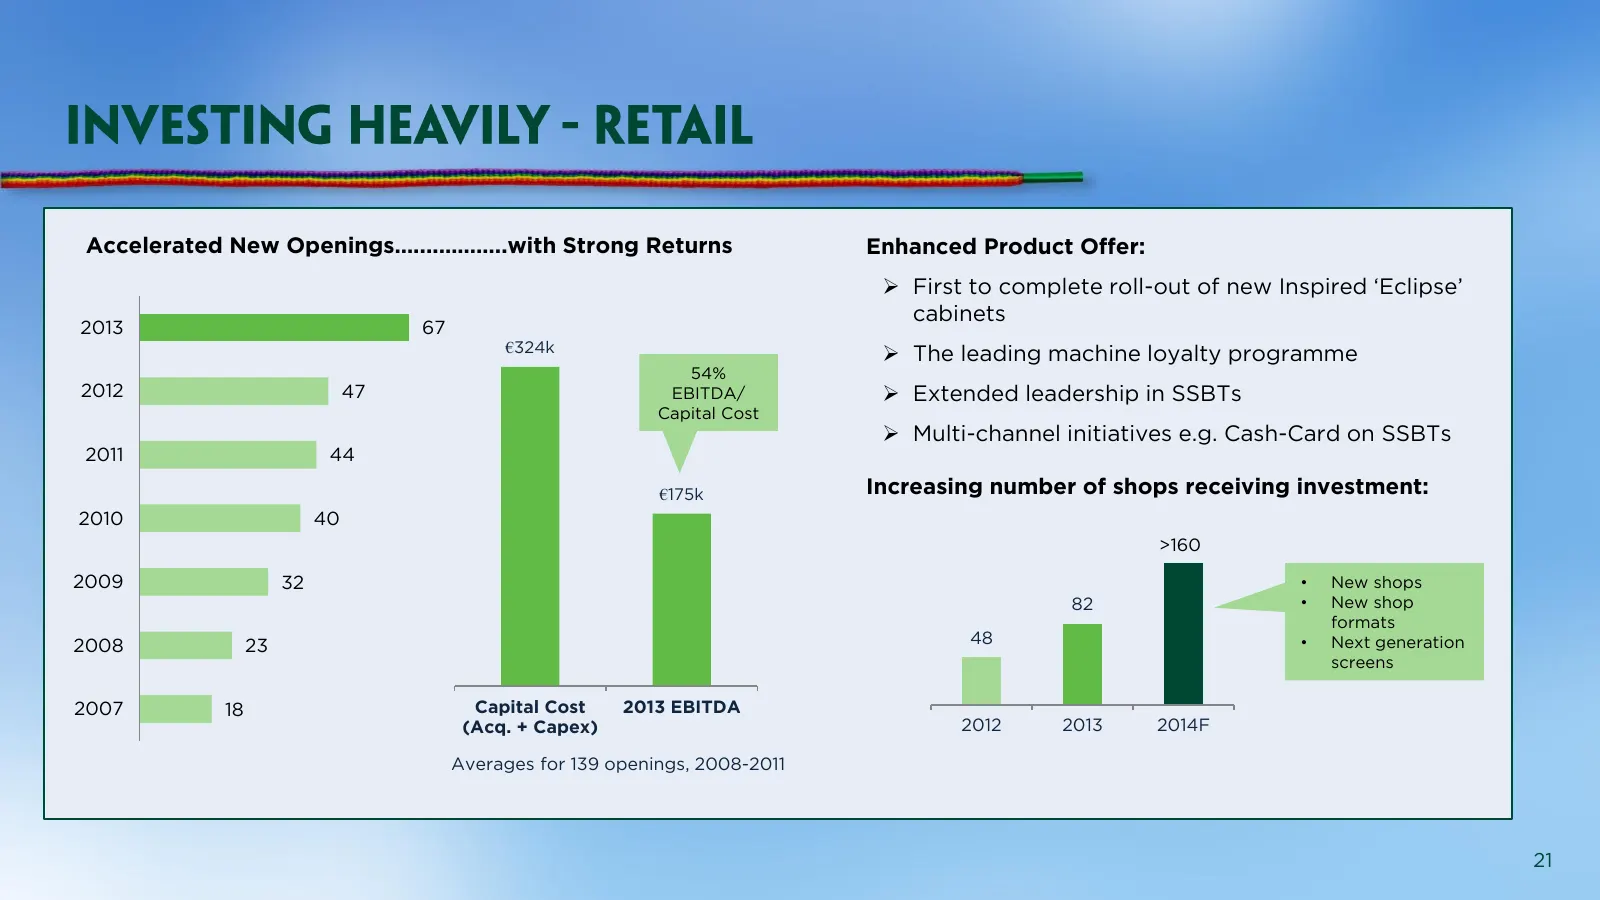
Slide 21: Retail shop openings and product offer
Accelerated New Openings…....………..with Strong Returns Enhanced Product Offer: First to complete roll-out of new Inspired ‘Eclipse’ cabinets 2013 67 €324k The leading machine loyalty programme 54% 2012 47 EBITDA/ Extended leadership in SSBTs Capital Cost Multi-channel initiatives e.g. Cash-Ca
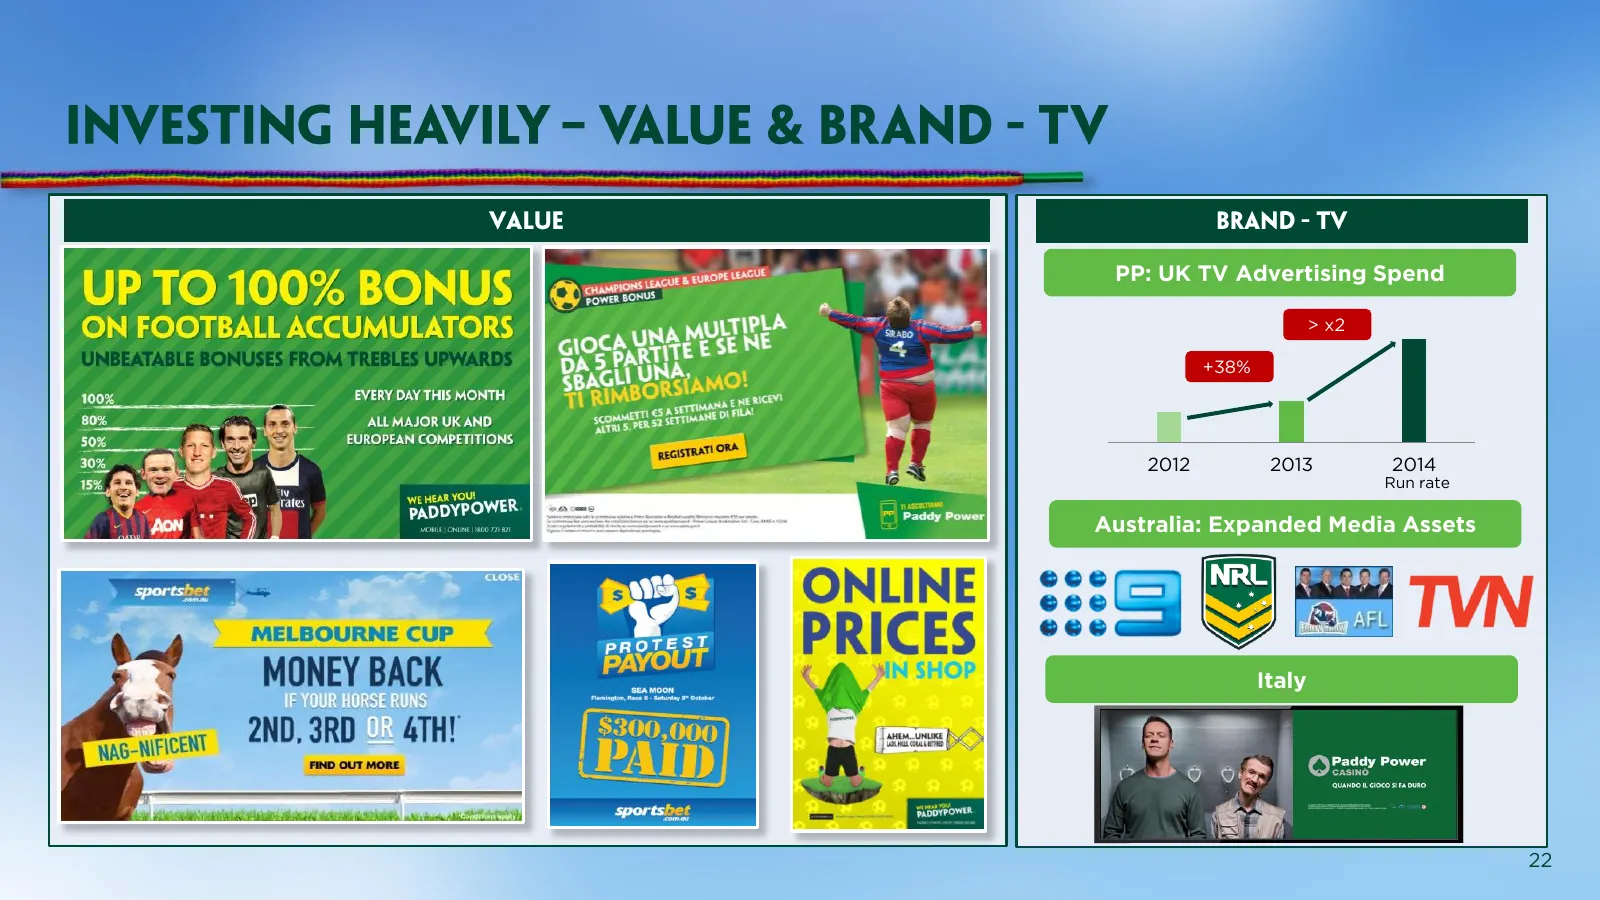
Slide 22: Advertising spend and media assets
PP: UK TV Advertising Spend > x2 +38% 2012 2013 2014 Run rate Australia: Expanded Media Assets Italy 22
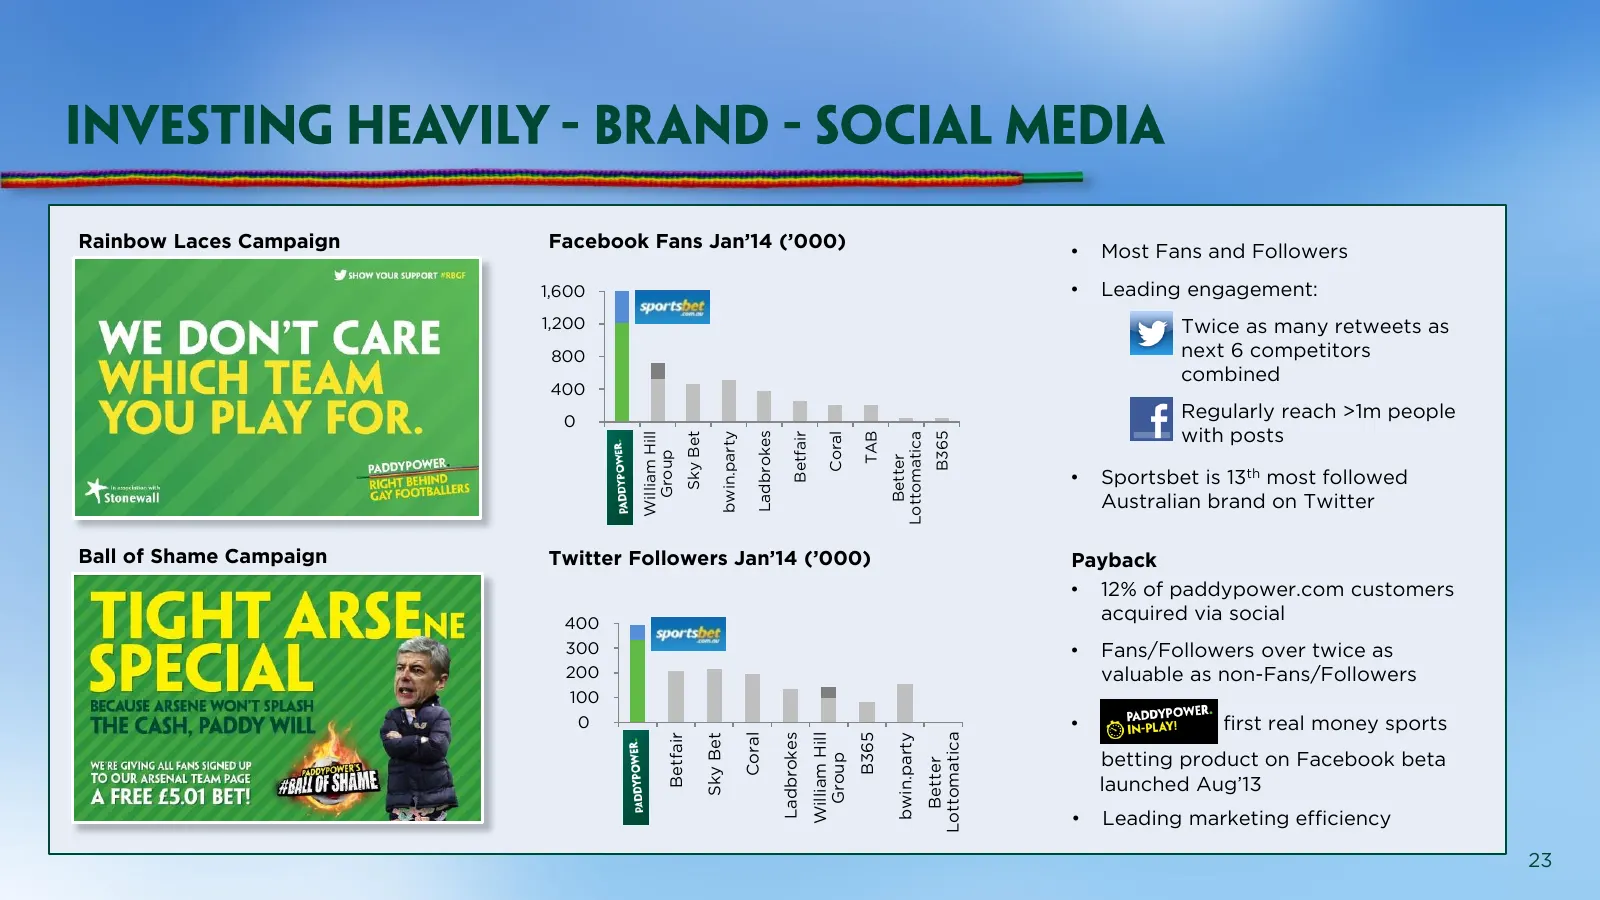
Slide 23: Social media leadership
Rainbow Laces Campaign Facebook Fans Jan’14 (’000) • Most Fans and Followers 1,600 • Leading engagement: 1,200 • Twice as many retweets as 800 next 6 competitors combined 400 0 • Regularly reach >1m people with posts William Hill Ladbrokes TAB bwin.party PP Betfair Sky Bet B365 Coral Lottomatica Gro
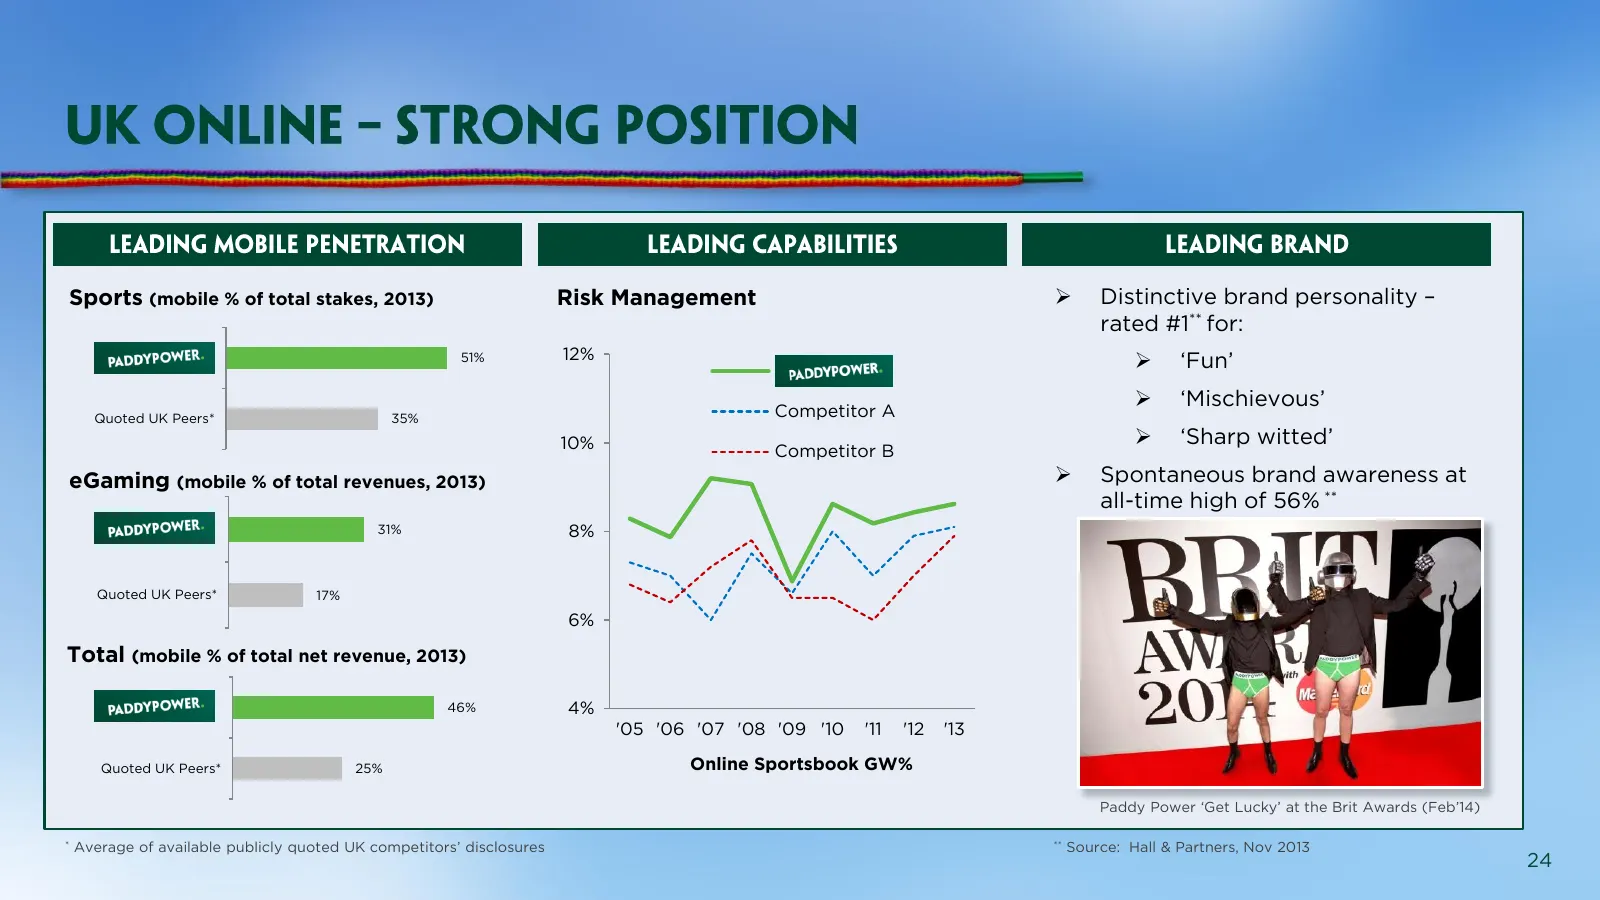
Slide 24: Mobile penetration and brand personality
Sports (mobile % of total stakes, 2013) Risk Management Distinctive brand personality – rated #1** for: 51% 12% ‘Fun’ "" ‘Mischievous’ Quoted UK Peers* 35% Competitor A 10% ‘Sharp witted’ Competitor B eGaming (mobile % of total revenues, 2013) Spontaneous brand awareness at all-time high o
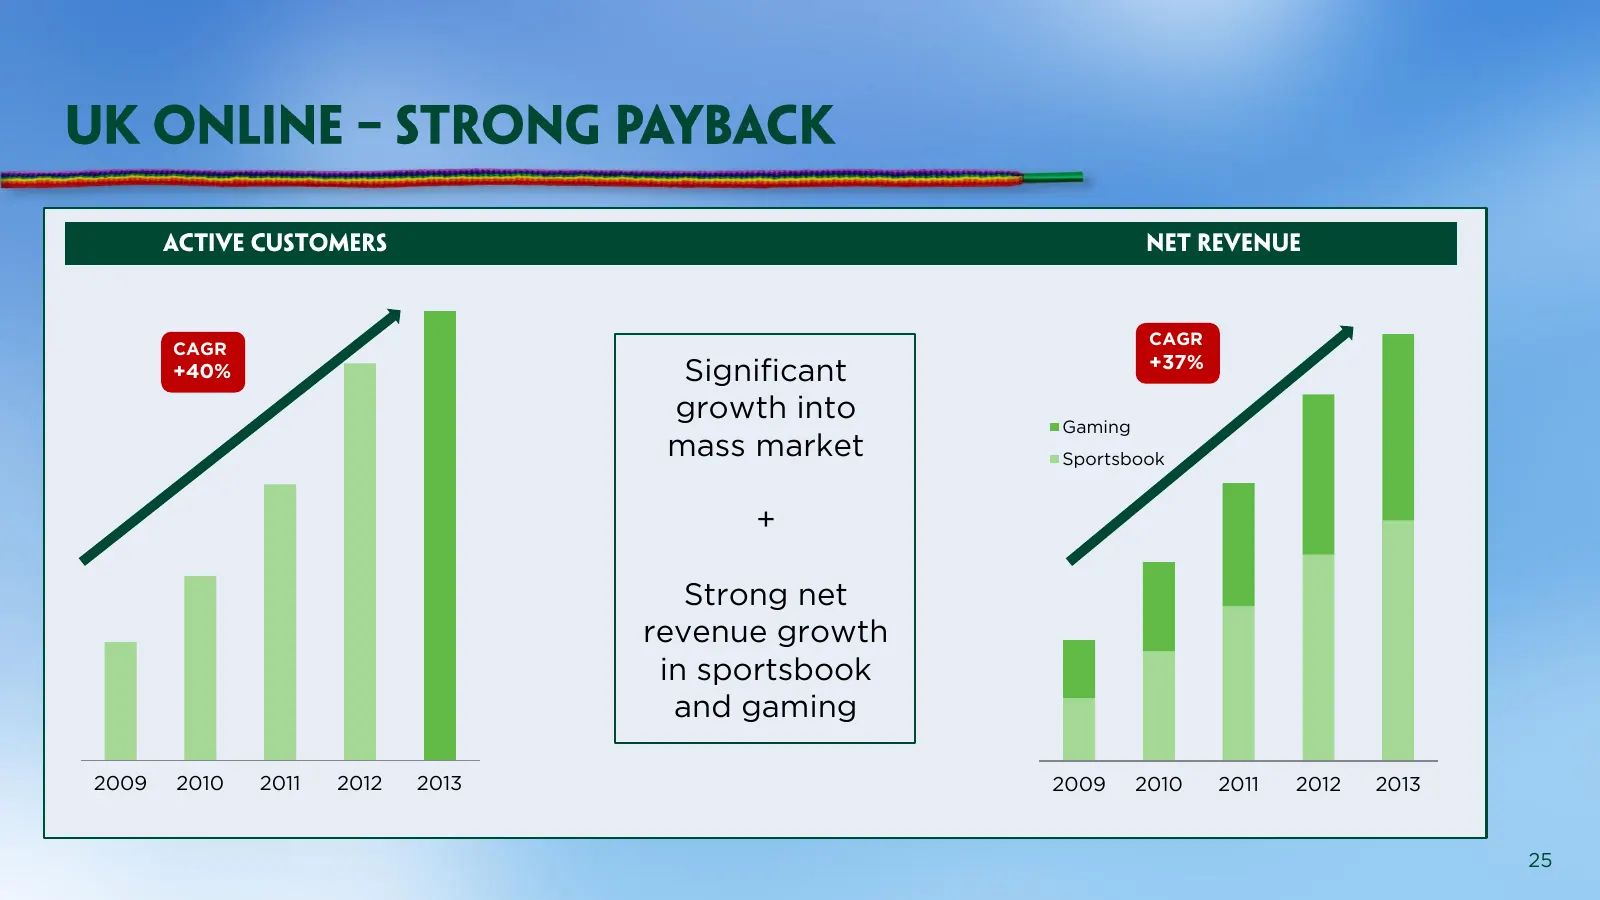
Slide 25: Significant growth into mass market
CAGR CAGR +37% +40% Significant growth into Gaming mass market Sportsbook + Strong net revenue growth in sportsbook and gaming 2009 2010 2011 2012 2013 2009 2010 2011 2012 2013 25
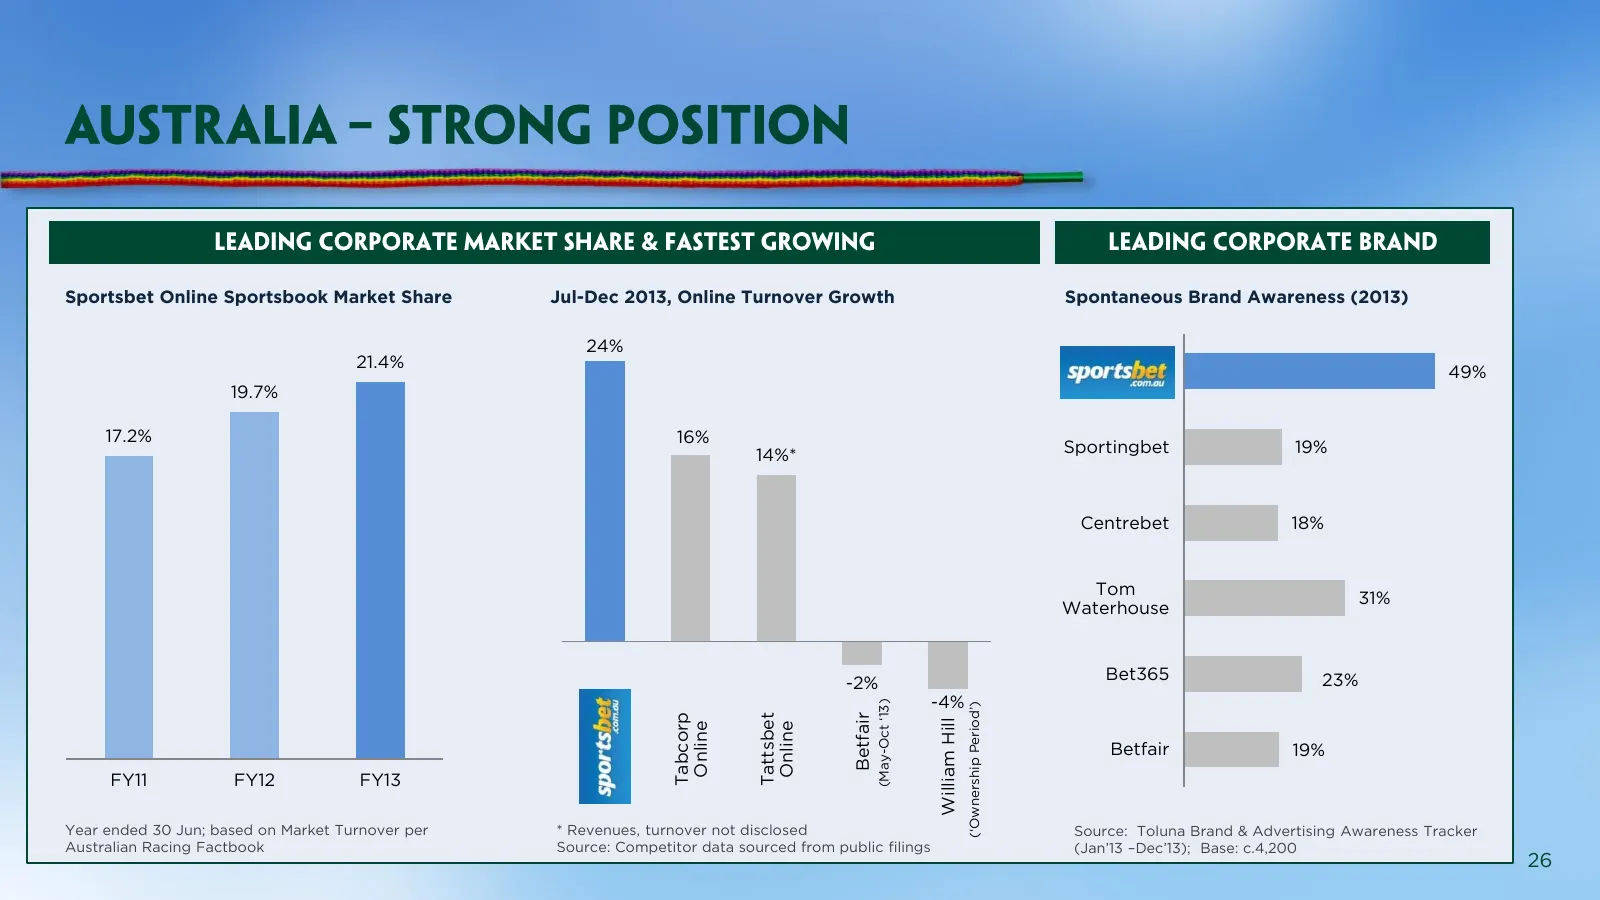
Slide 26: Sportsbet market share and brand awareness
Sportsbet Online Sportsbook Market Share Jul-Dec 2013, Online Turnover Growth Spontaneous Brand Awareness (2013) 24% 21.4% Sportsbet 49% 19.7% 17.2% 16% 14%* Sportingbet 19% Centrebet 18% Tom 31% Waterhouse Bet365 23% -2% -4% (May-Oct ‘13) (‘Ownership Period’) Tattsbet Tabcorp Betfair William Hill O
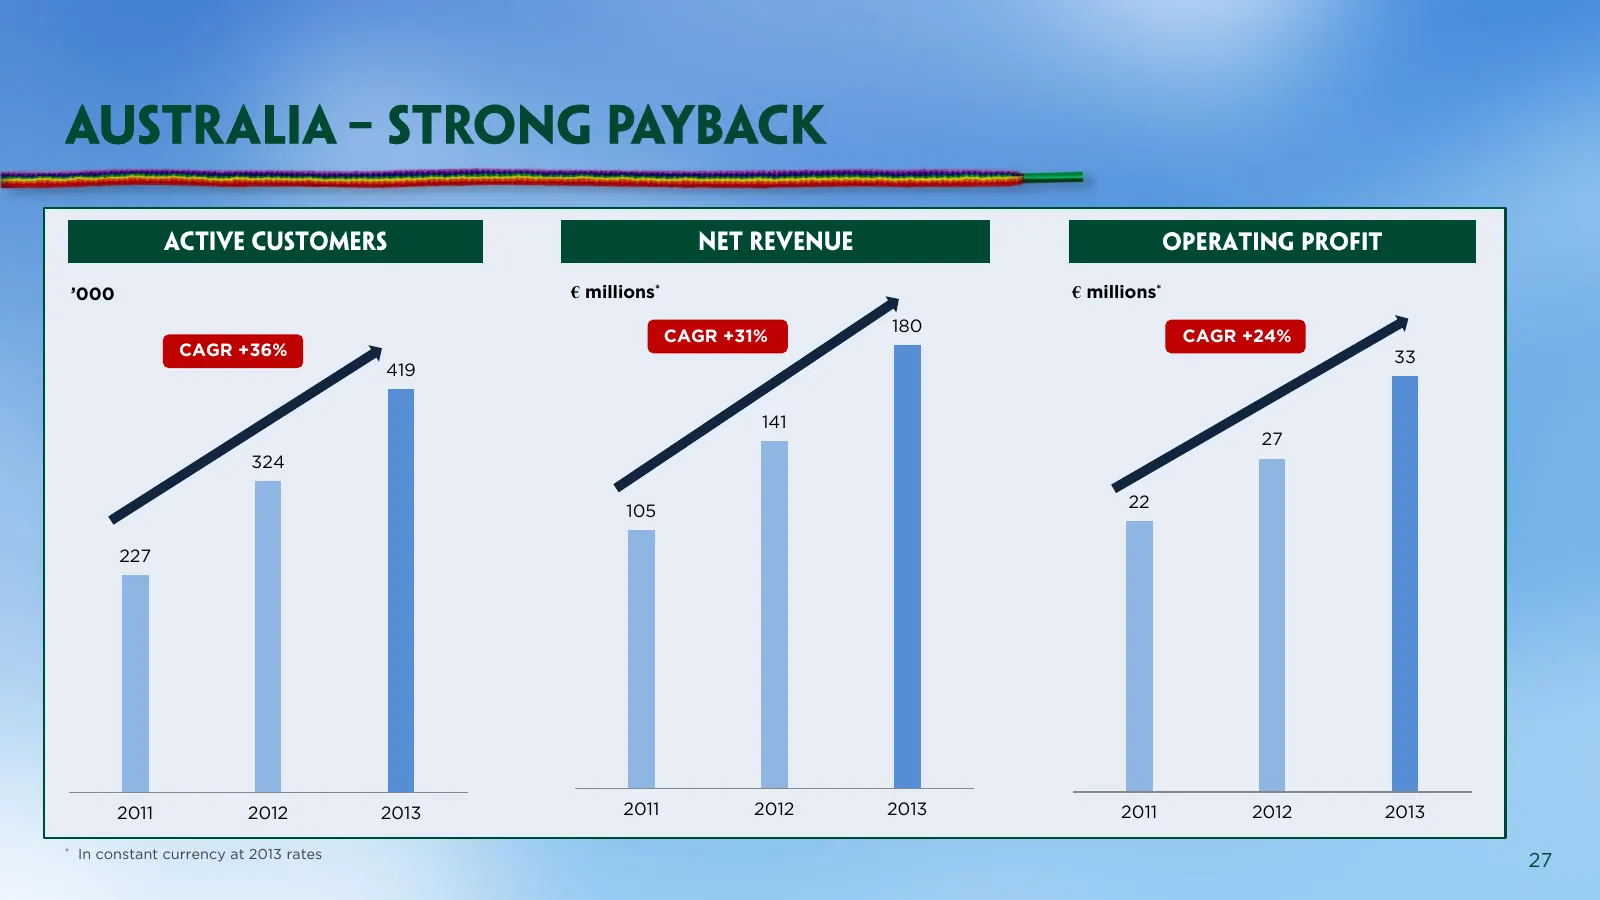
Slide 27: Australia growth metrics
’000 € millions* € millions* 180 CAGR +31% CAGR +24% CAGR +36% 33 419 141 27 324 105 22 227 2011 2012 2013 2011 2012 2013 2011 2012 2013 * In constant currency at 2013 rates 27
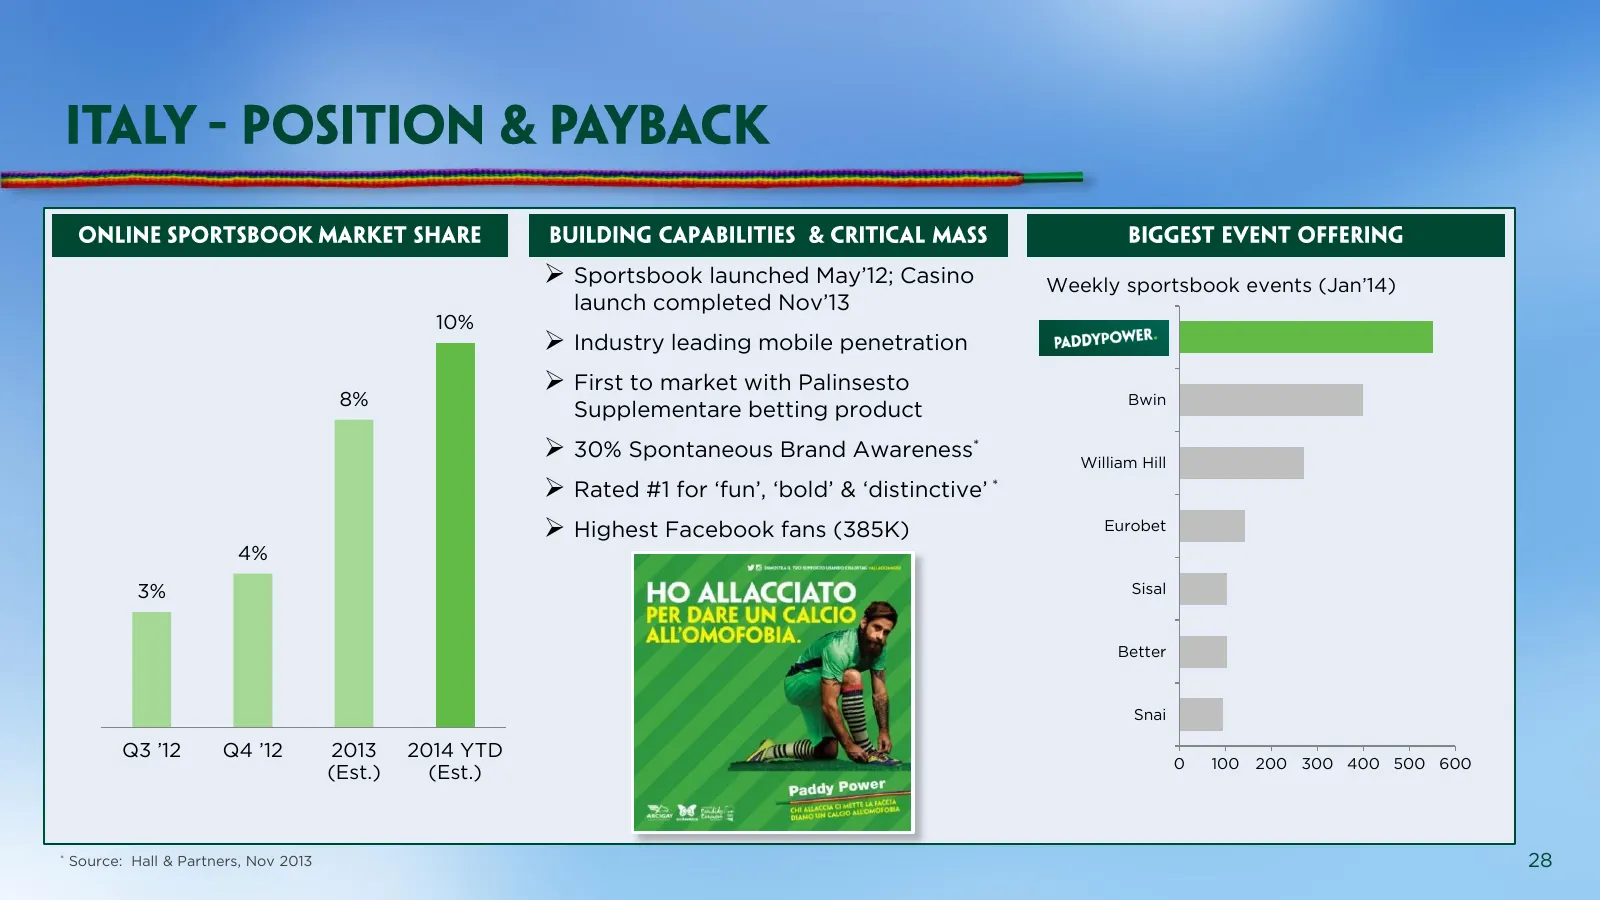
Slide 28: Italy position and brand awareness
Sportsbook launched May’12; Casino Weekly sportsbook events (Jan’14) launch completed Nov’13 10% Industry leading mobile penetration First to market with Palinsesto 8% Bwin Supplementare betting product 30% Spontaneous Brand Awareness* William Hill Rated #1 for ‘fun’, ‘bold’ & ‘distinctive
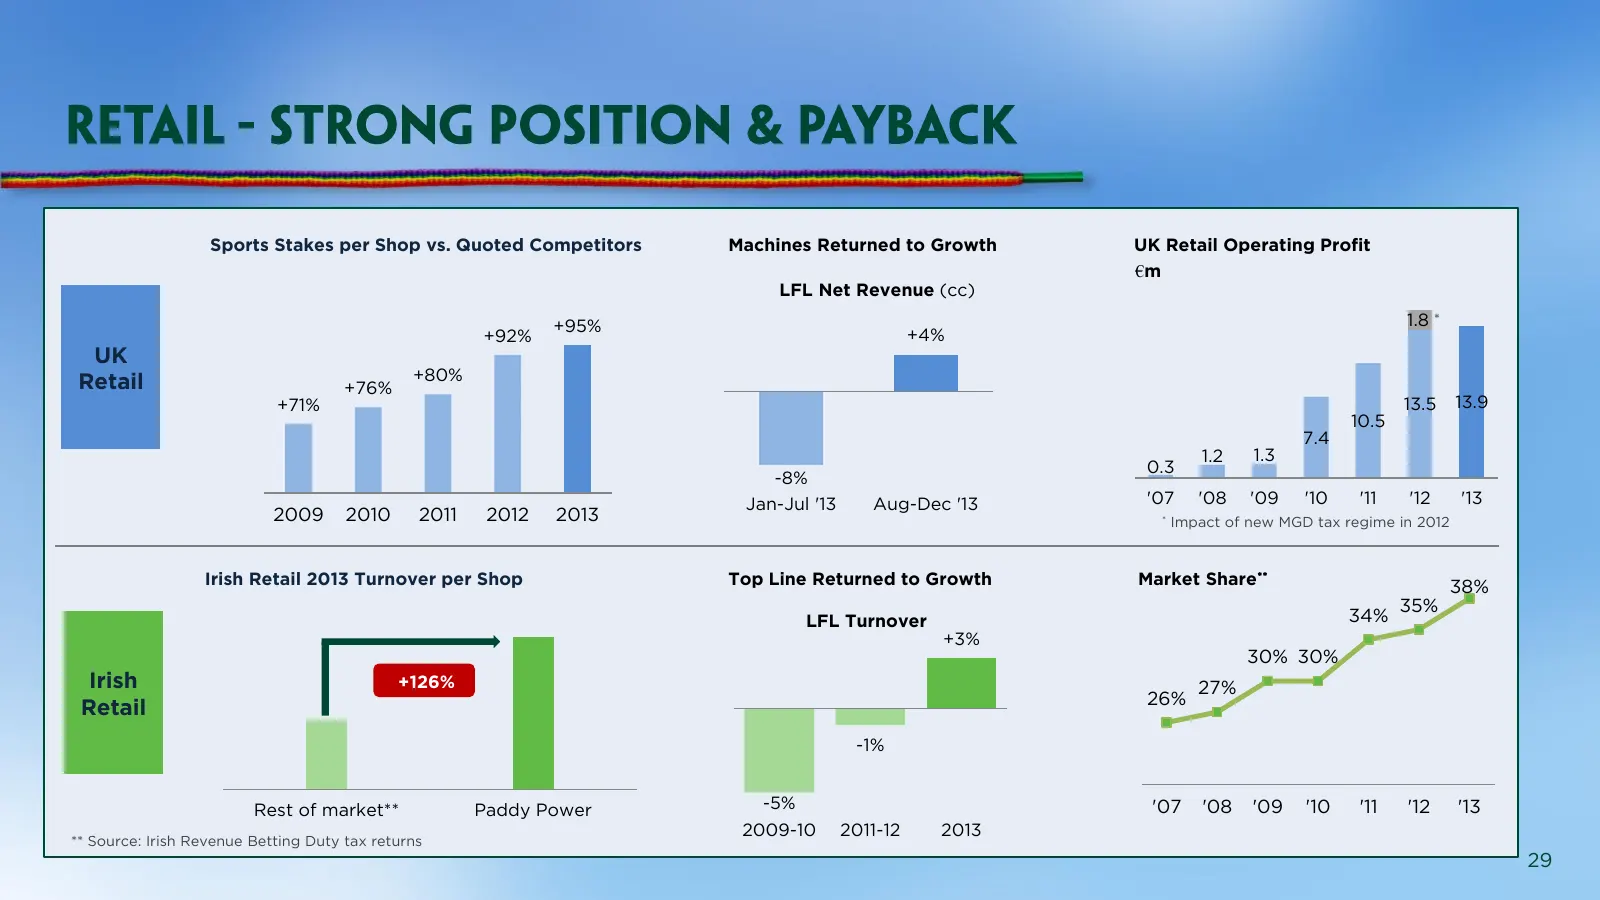
Slide 29: UK and Irish Retail performance
Sports Stakes per Shop vs. Quoted Competitors Machines Returned to Growth UK Retail Operating Profit €m LFL Net Revenue (cc) +95% 1.8 * +92% +4% UK Retail +80% +76% +71% 13.5 13.9 10.5 7.4 1.2 1.3 0.3 -8% Jan-Jul '13 Aug-Dec '13 '07 '08 '09 '10 '11 '12 '13 2009 2010 2011 2012 2013 * Impact of new MG
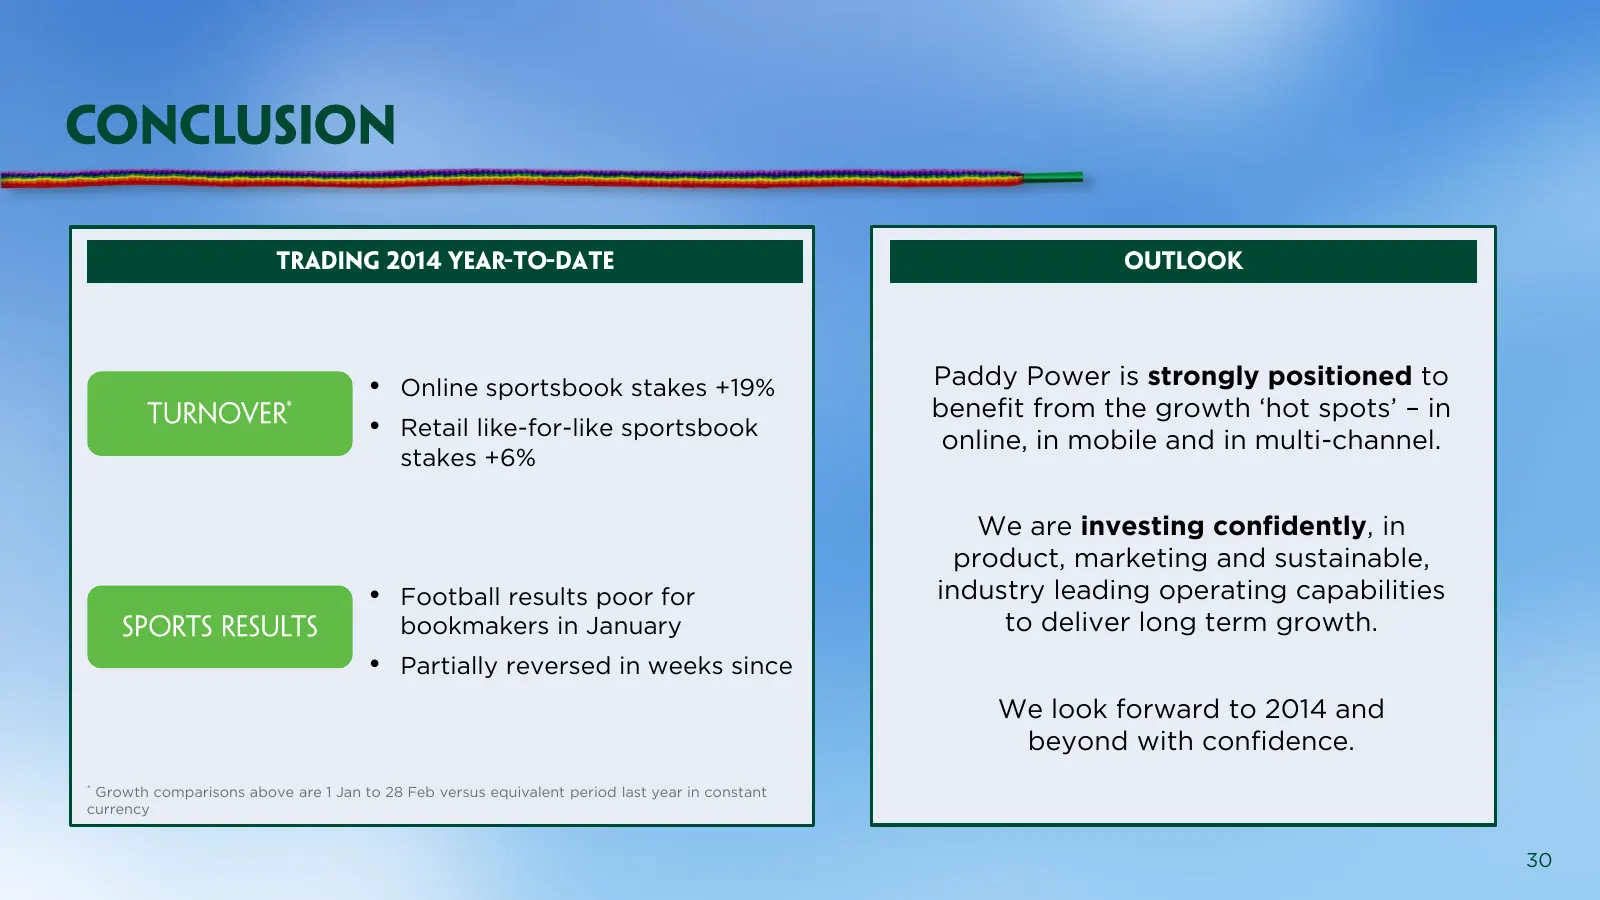
Slide 30: Current trading and outlook
• Online sportsbook stakes +19% Paddy Power is strongly positioned to benefit from the growth ‘hot spots’ – in • Retail like-for-like sportsbook online, in mobile and in multi-channel. stakes +6% We are investing confidently, in product, marketing and sustainable, • Football results poor for industr
Source: Internet Archive copy of flutter.com
More decks from Flutter Entertainment plc
 Q3 2026 Earnings Presentation15 slides · Nov 4, 2026
 Q2 2026 Earnings Presentation14 slides · Aug 5, 2026
 Investor Day (September 2024)152 slides · Sep 25, 2024
 Q2 2024 Earnings Presentation20 slides · Aug 13, 2024
 Q1 2024 Earnings Presentation20 slides · May 14, 2024
 FY2023 Earnings Presentation36 slides · Mar 26, 2024