Bertrandt AG · XETR:BDT
Bertrandt — Analyst Conference FY 2014/2015
33 slides from Bertrandt's conference presentation, December 2015
Slide 1: Analyst conference FY 2014/2015
Analyst conference FY 2014/2015 Bertrandt AG Frankfurt on Main, December 2015, Dietmar Bichler and Markus Ruf Bertrandt AG Analyst conference FY 2014/2015 0
Slide 2: Content
Content 1. Framework – FY 2014/2015 2. Key figures – FY 2014/2015 3. Outlook – FY 2015/2016 Bertrandt AG Analyst conference FY 2014/2015 1
Slide 3: Content
Content 1. Framework – FY 2014/2015 2. Key figures – FY 2014/2015 3. Outlook – FY 2015/2016 Bertrandt AG Analyst conference FY 2014/2015 2
Slide 4: Framework FY 2014/2015 – Automotive industry
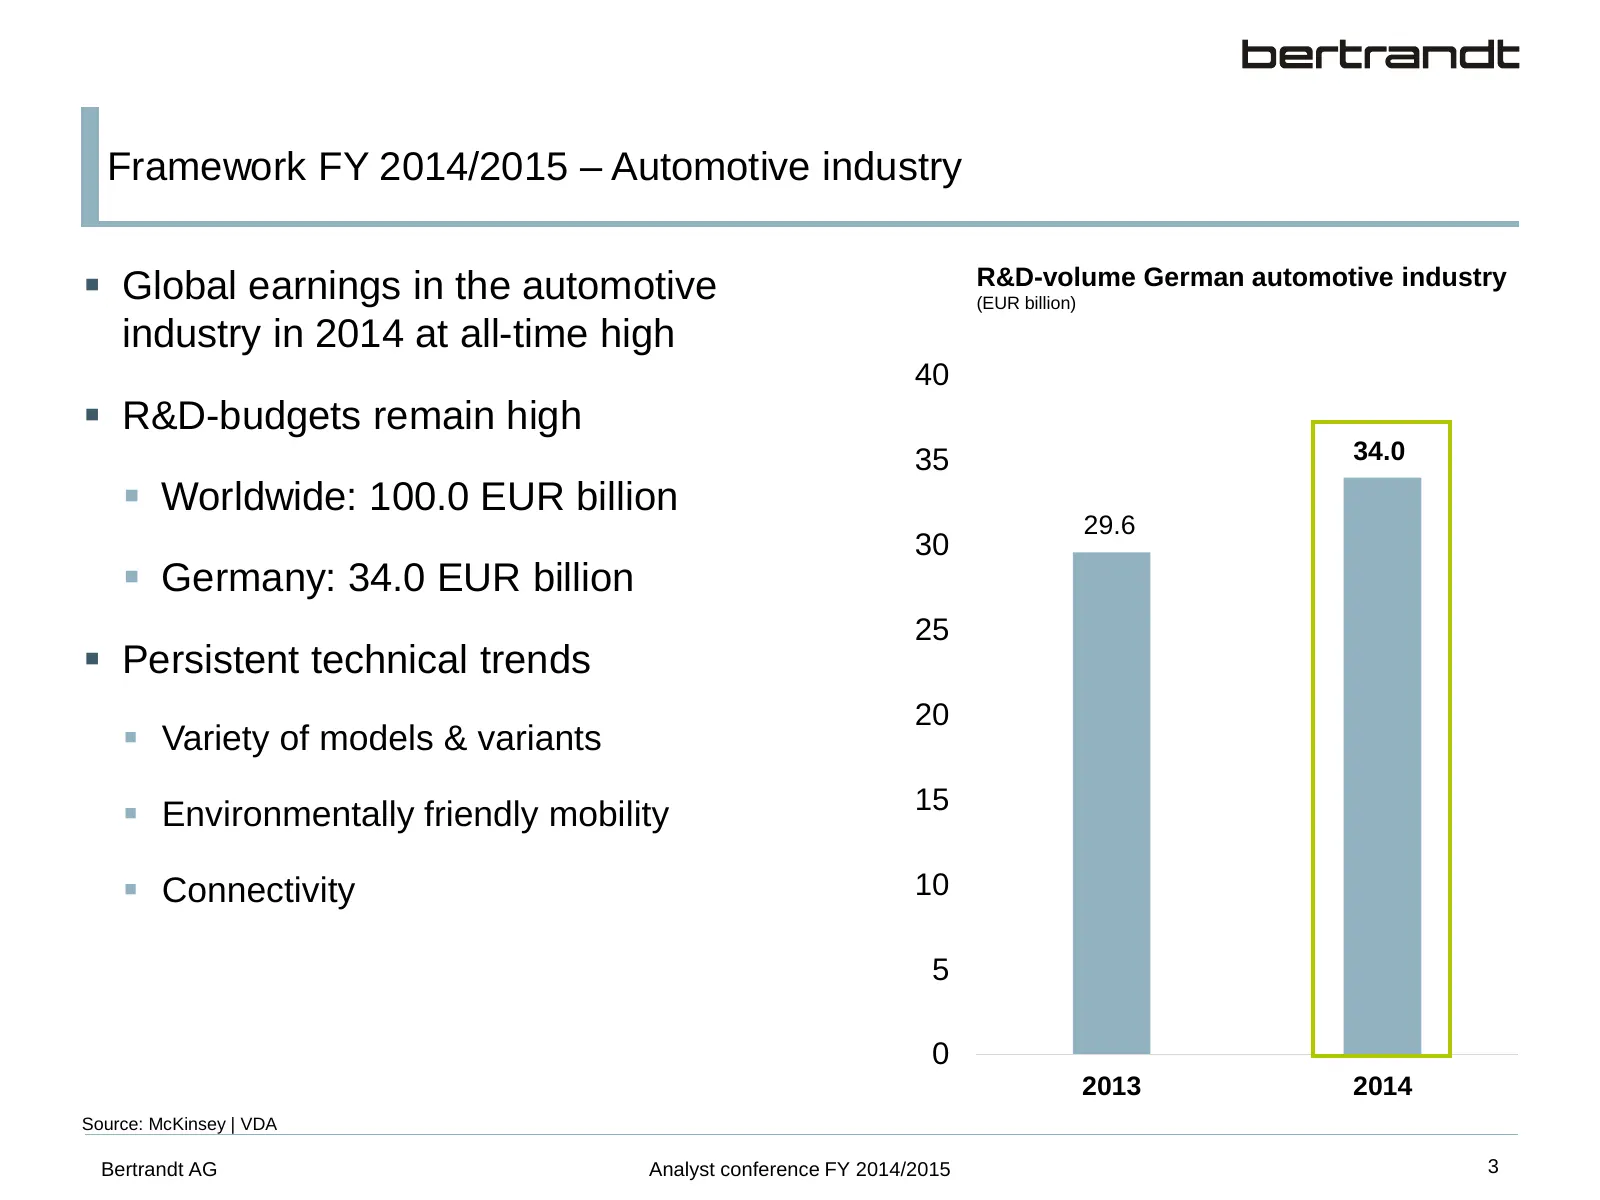
Framework FY 2014/2015 – Automotive industry Global earnings in the automotive R&D-volume German automotive industry (EUR billion) industry in 2014 at all-time high 40 R&D-budgets remain high 35 34.0 Worldwide: 100.0 EUR billion 29.6 30 Germany: 34.0 EUR billion 25 Persistent technical tre
Slide 5: Outsourcing in the automotive industry on a high level
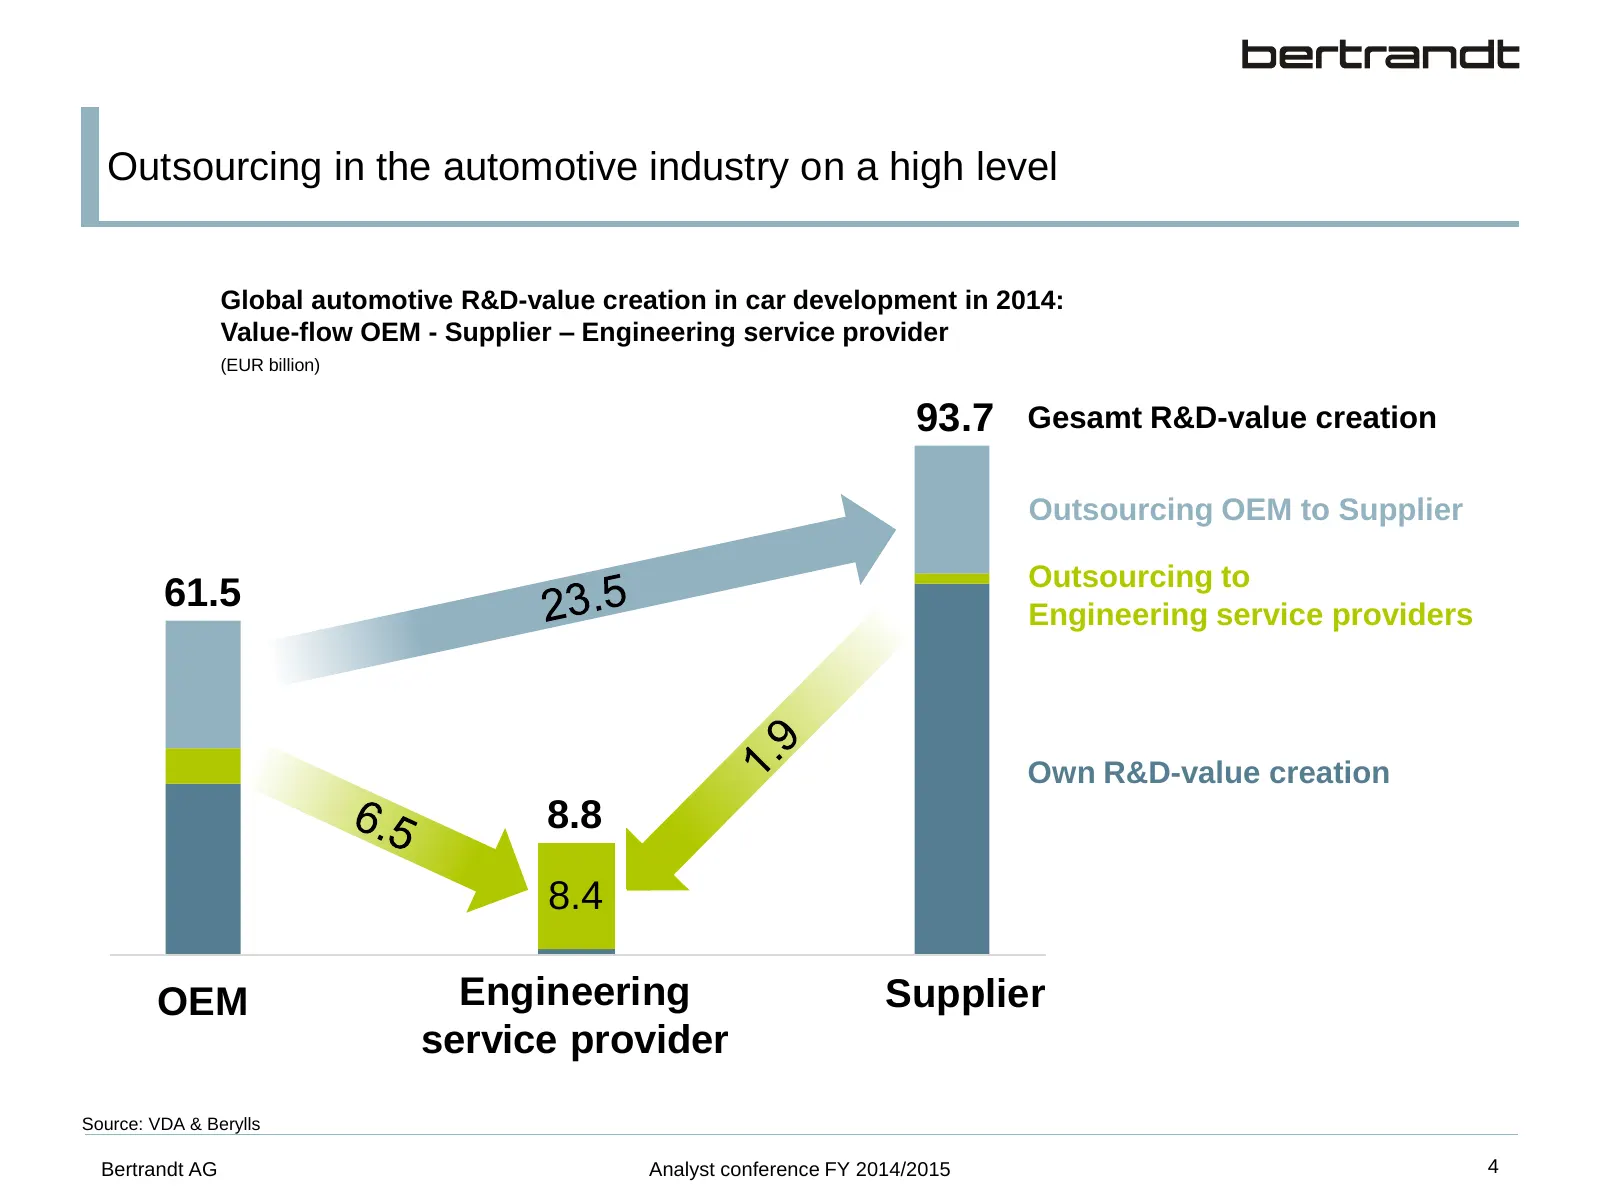
Outsourcing in the automotive industry on a high level Global automotive R&D-value creation in car development in 2014: Value-flow OEM - Supplier – Engineering service provider (EUR billion) 93.7 Gesamt R&D-value creation Outsourcing OEM to Supplier Outsourcing to 61.5 Engineering service providers
Slide 6: Framework FY 2014/2015 – Civil aviation and technological key sectors
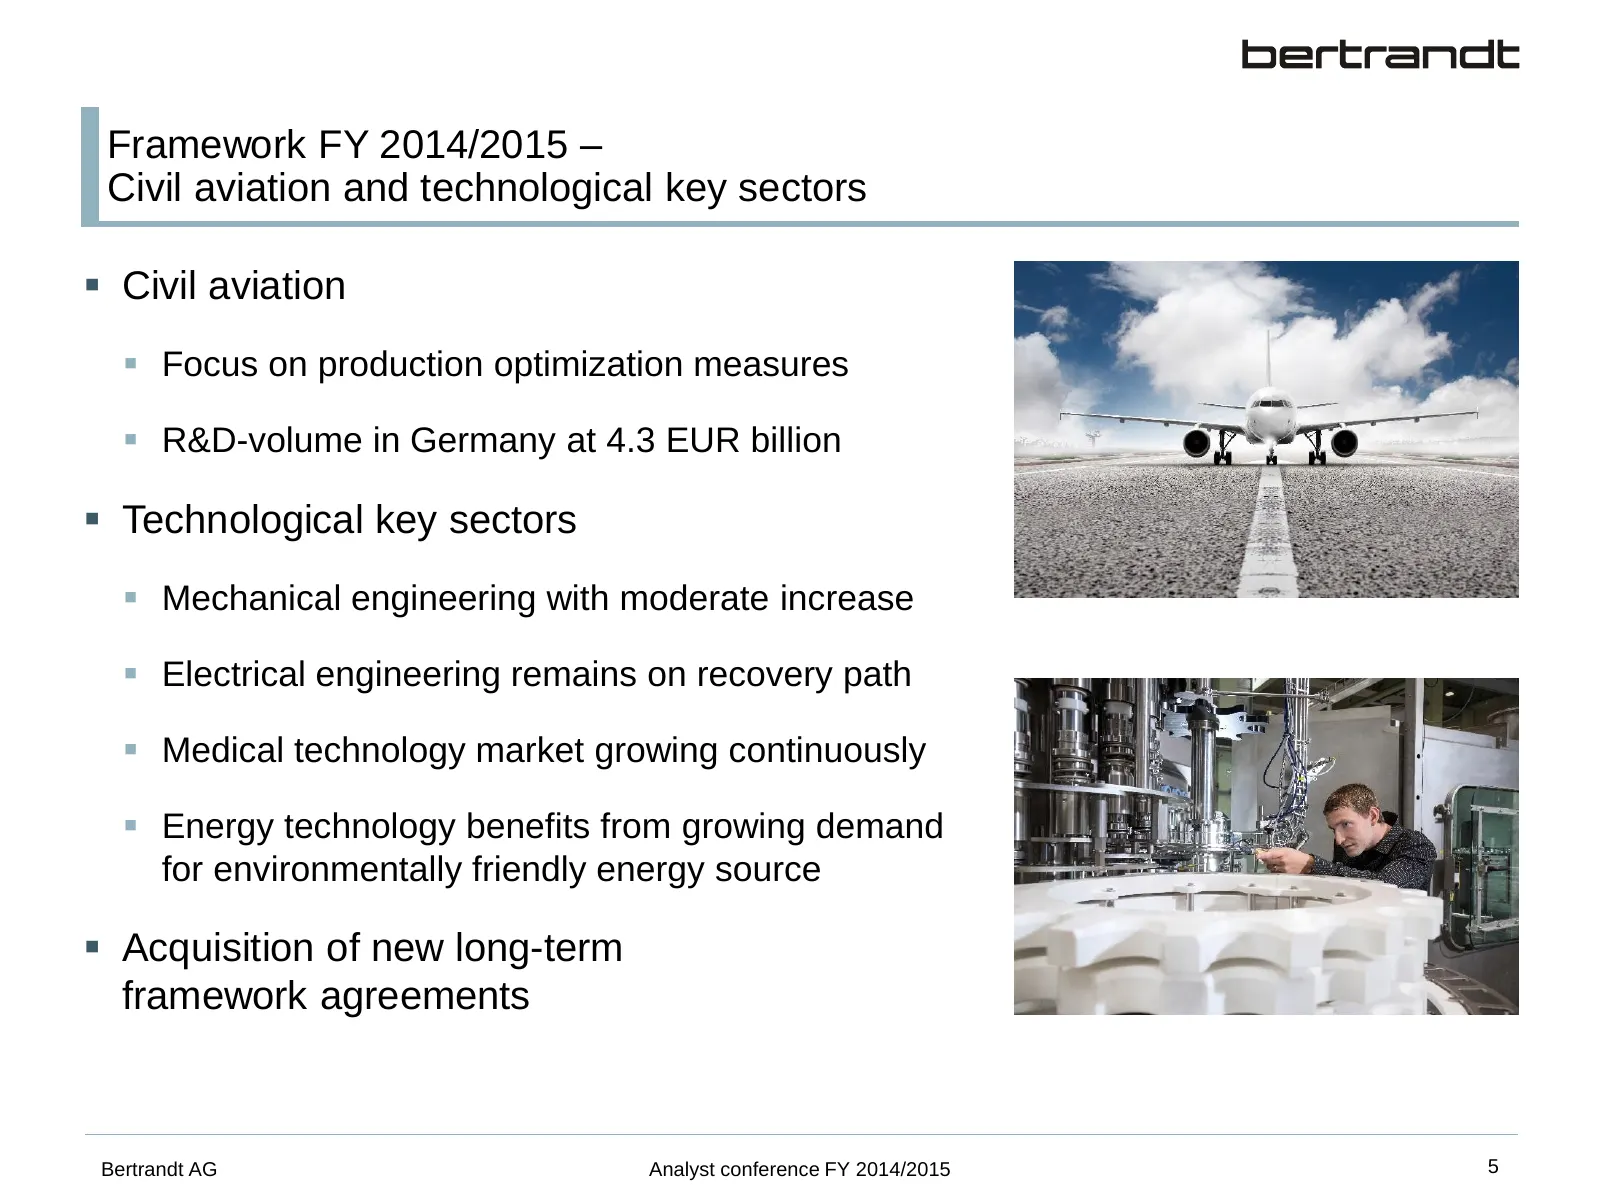
Framework FY 2014/2015 – Civil aviation and technological key sectors Civil aviation Focus on production optimization measures R&D-volume in Germany at 4.3 EUR billion Technological key sectors Mechanical engineering with moderate increase Electrical engineering remains on recovery path
Slide 7: Content
Content 1. Framework – FY 2014/2015 2. Key figures – FY 2014/2015 3. Outlook – FY 2015/2016 Bertrandt AG Analyst conference FY 2014/2015 6
Slide 8: Successful FY 2014/2015
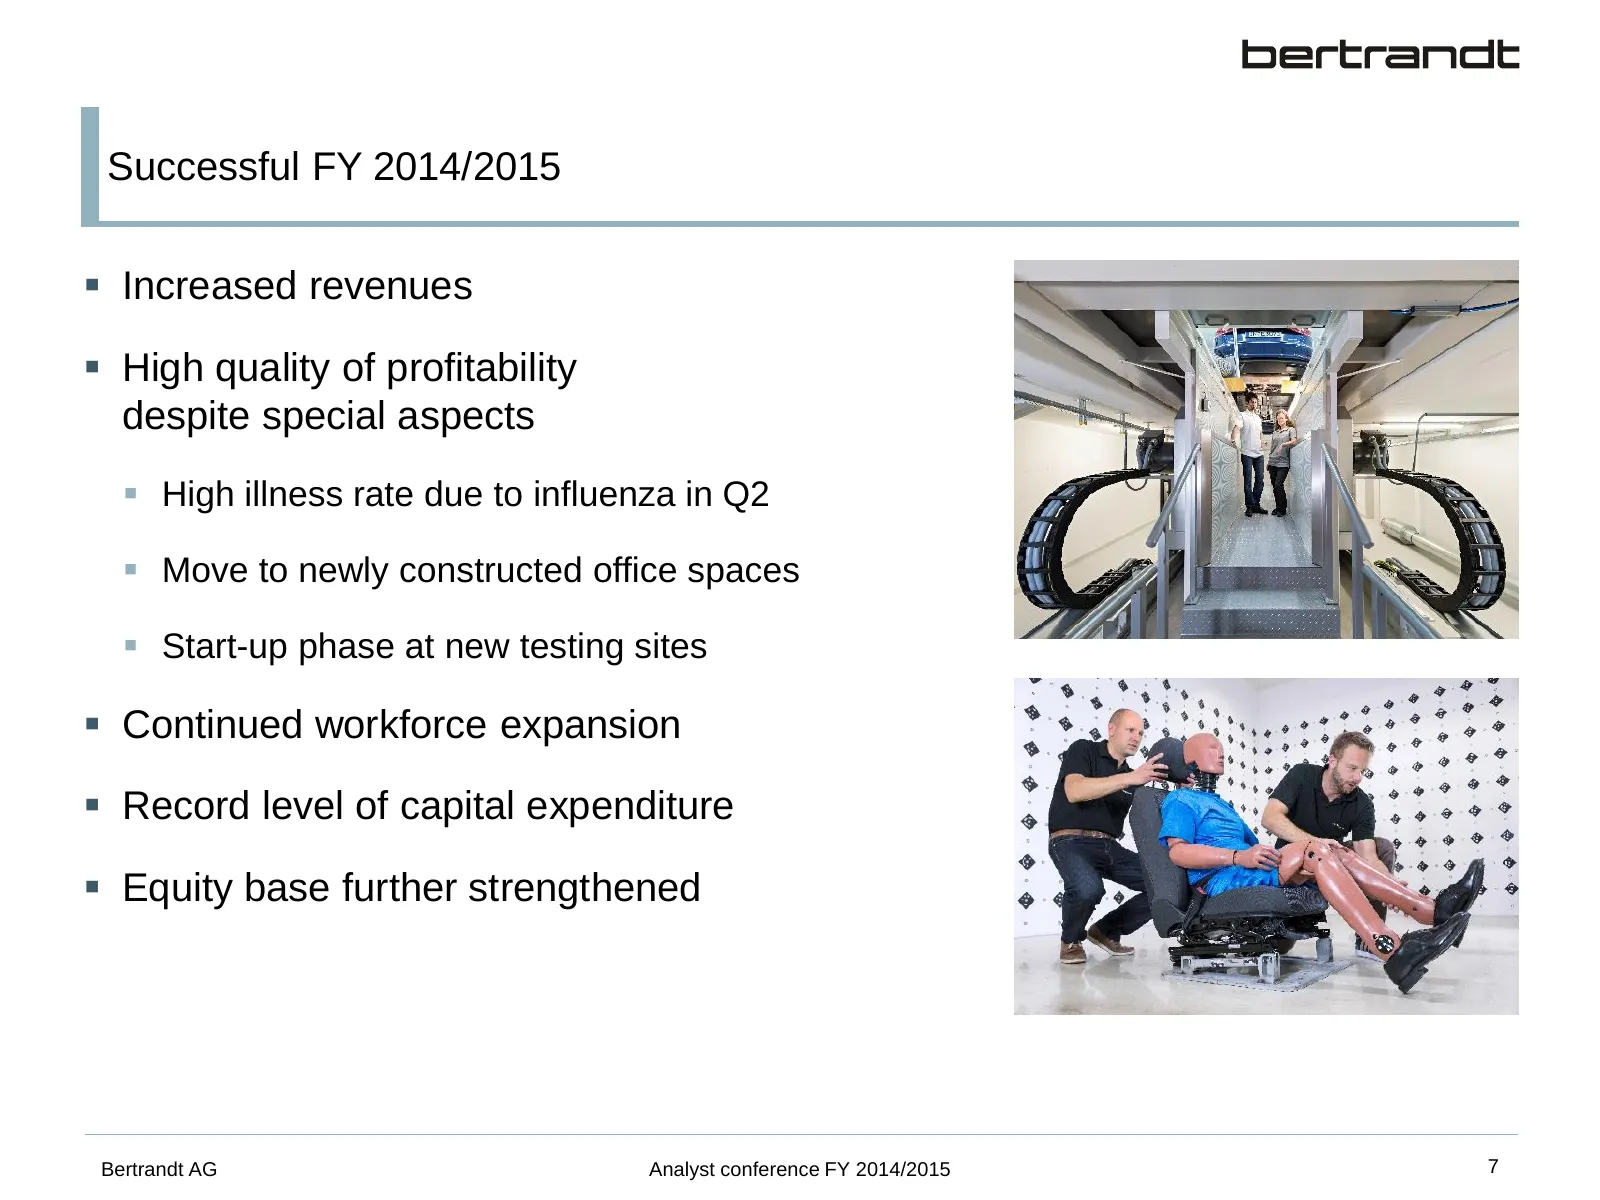
Successful FY 2014/2015 Increased revenues High quality of profitability despite special aspects High illness rate due to influenza in Q2 Move to newly constructed office spaces Start-up phase at new testing sites Continued workforce expansion Record level of capital expenditure Equi
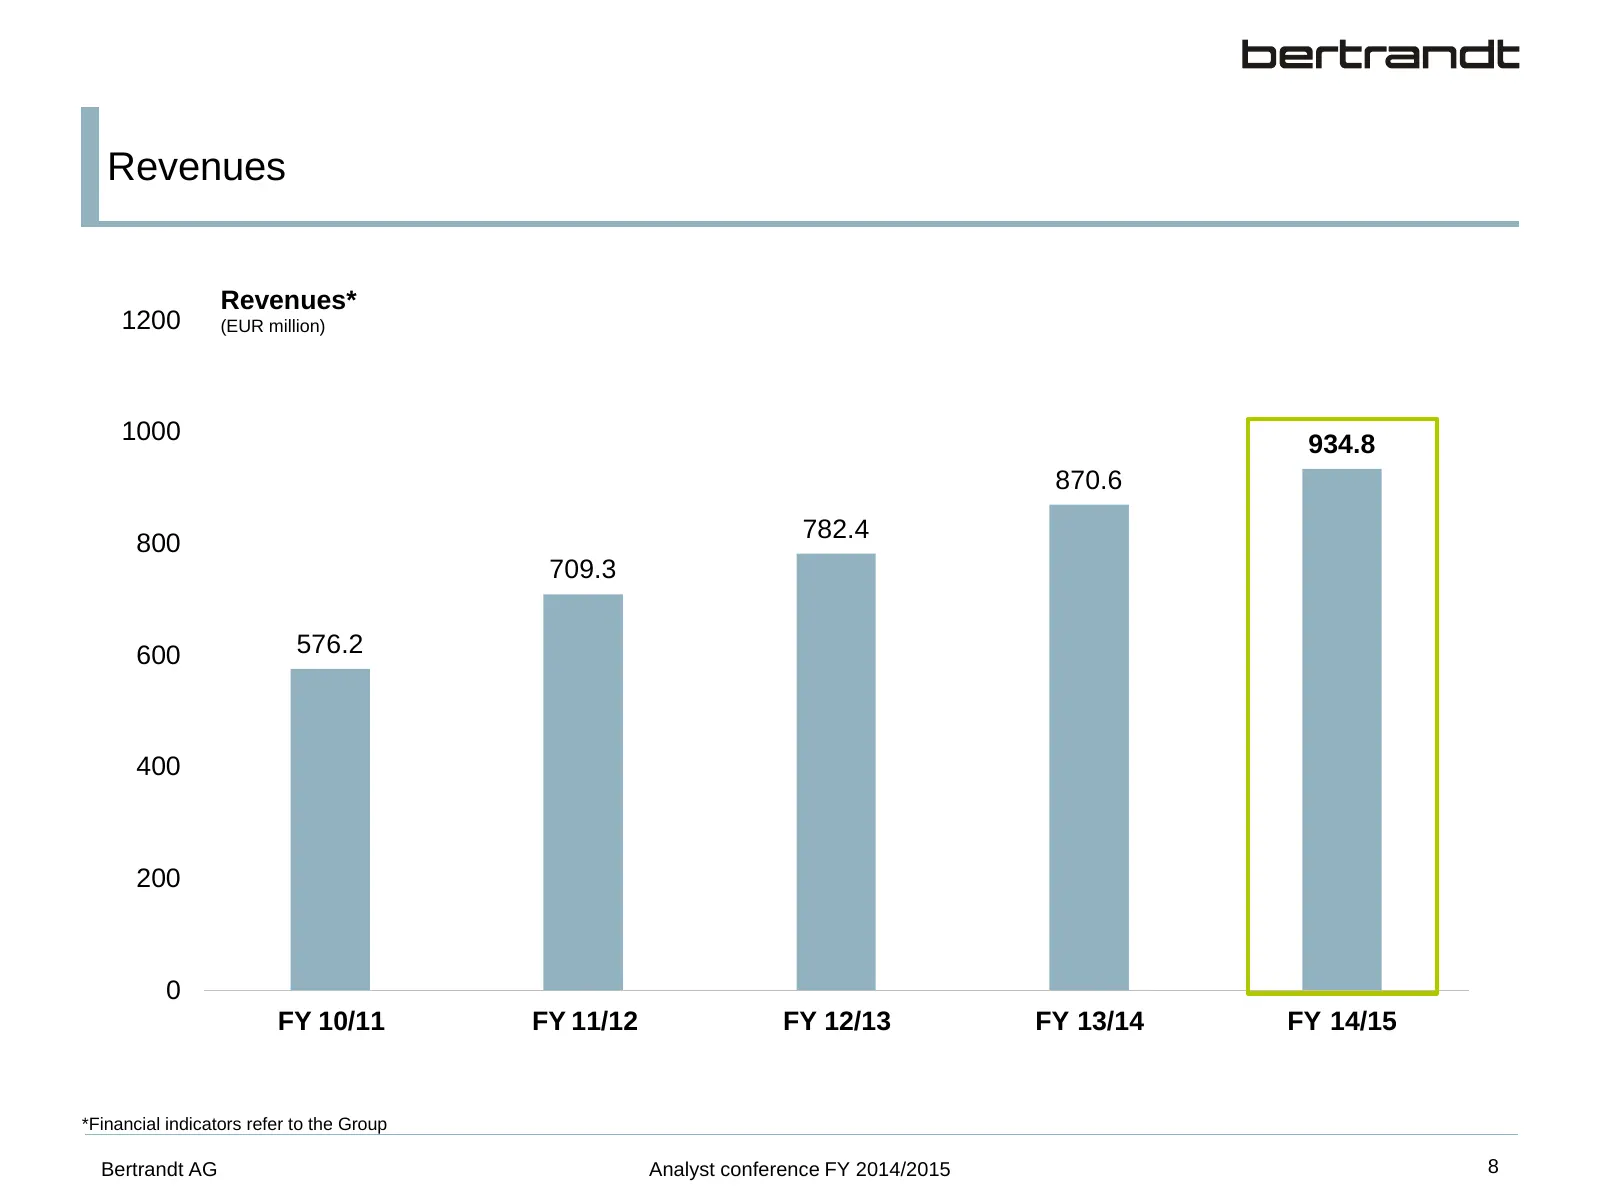
Slide 9: Revenues
Revenues Revenues* 1200 (EUR million) 1000 934.8 870.6 782.4 800 709.3 600 576.2 400 200 0 GJ FY 10/11 GJ FY 11/12 GJ FY 12/13 GJ FY 13/14 GJ FY 14/15 *Financial indicators refer to the Group Bertrandt AG Analyst conference FY 2014/2015 8
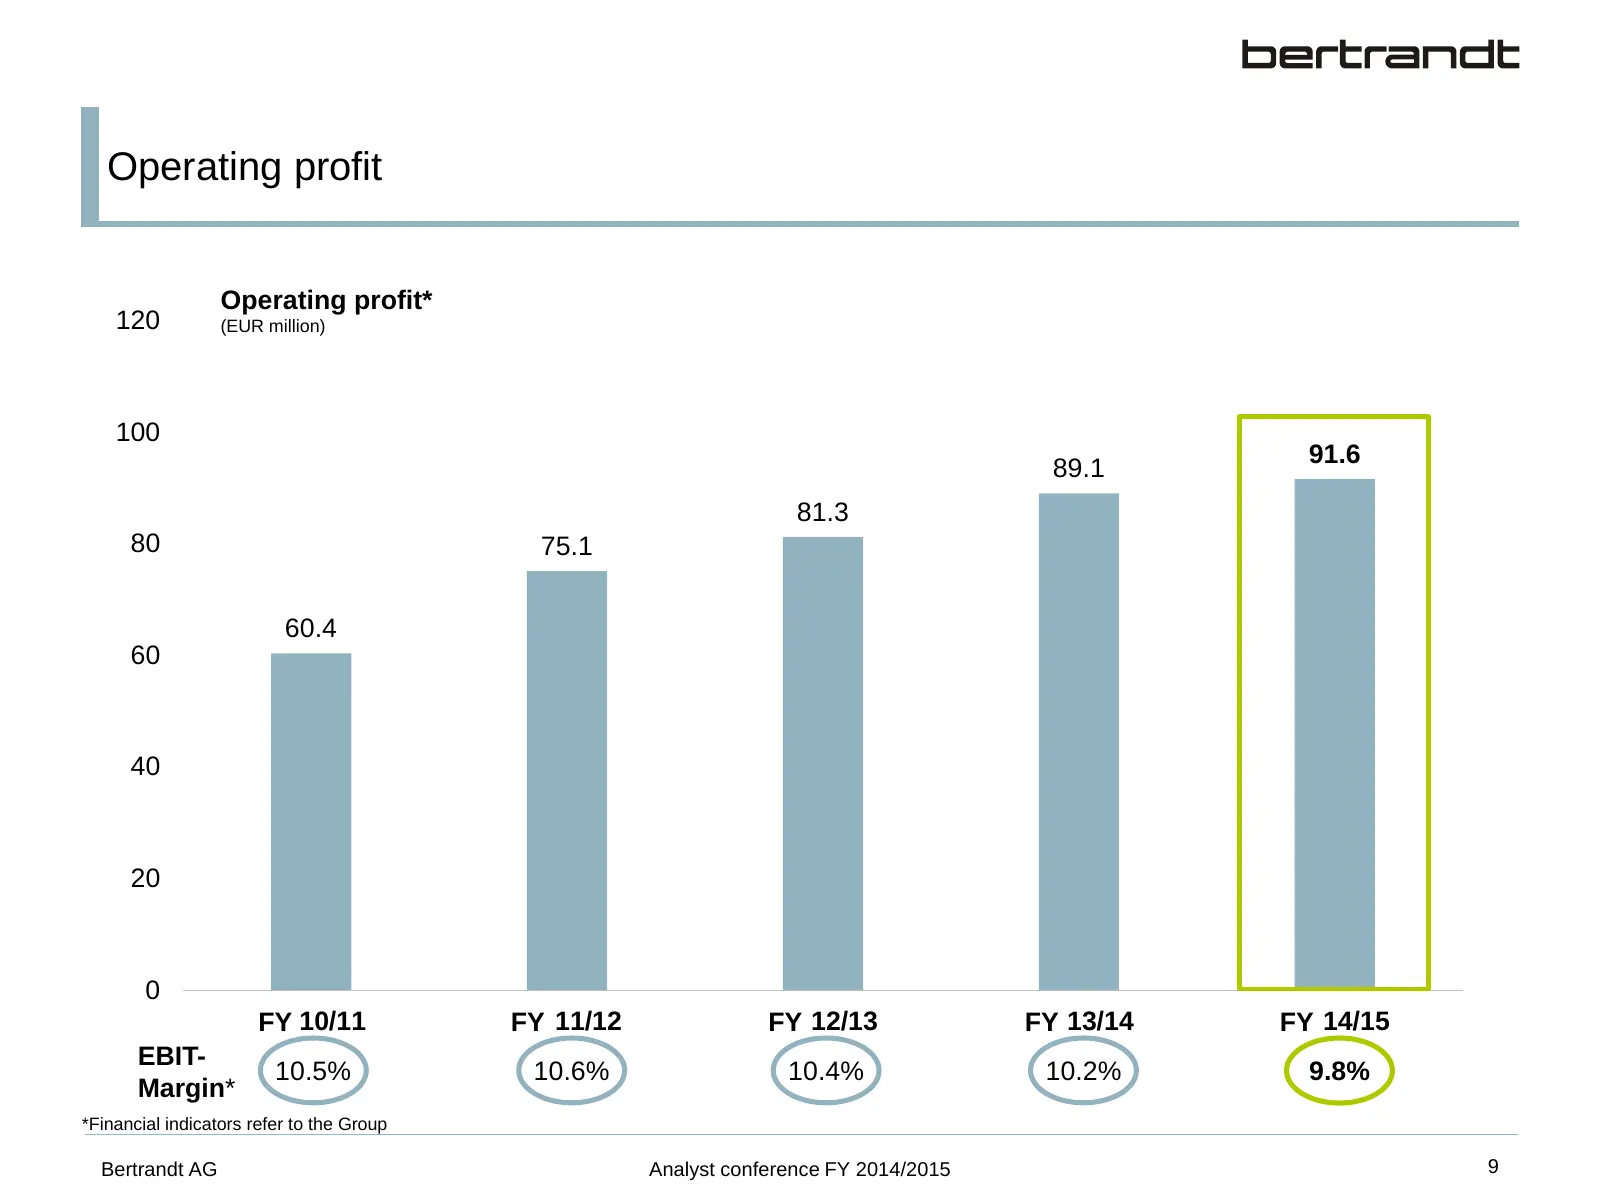
Slide 10: Operating profit
Operating profit Operating profit* 120 (EUR million) 100 91.6 89.1 81.3 80 75.1 60.4 60 40 20 0 GJ FY 10/11 GJ 11/12 FY GJ 12/13 FY GJ FY 13/14 GJ 14/15 FY EBIT- 10.5% 10.6% 10.4% 10.2% 9.8% Margin* *Financial indicators refer to the Group Bertrandt AG Analyst conference FY 2014/2015 9
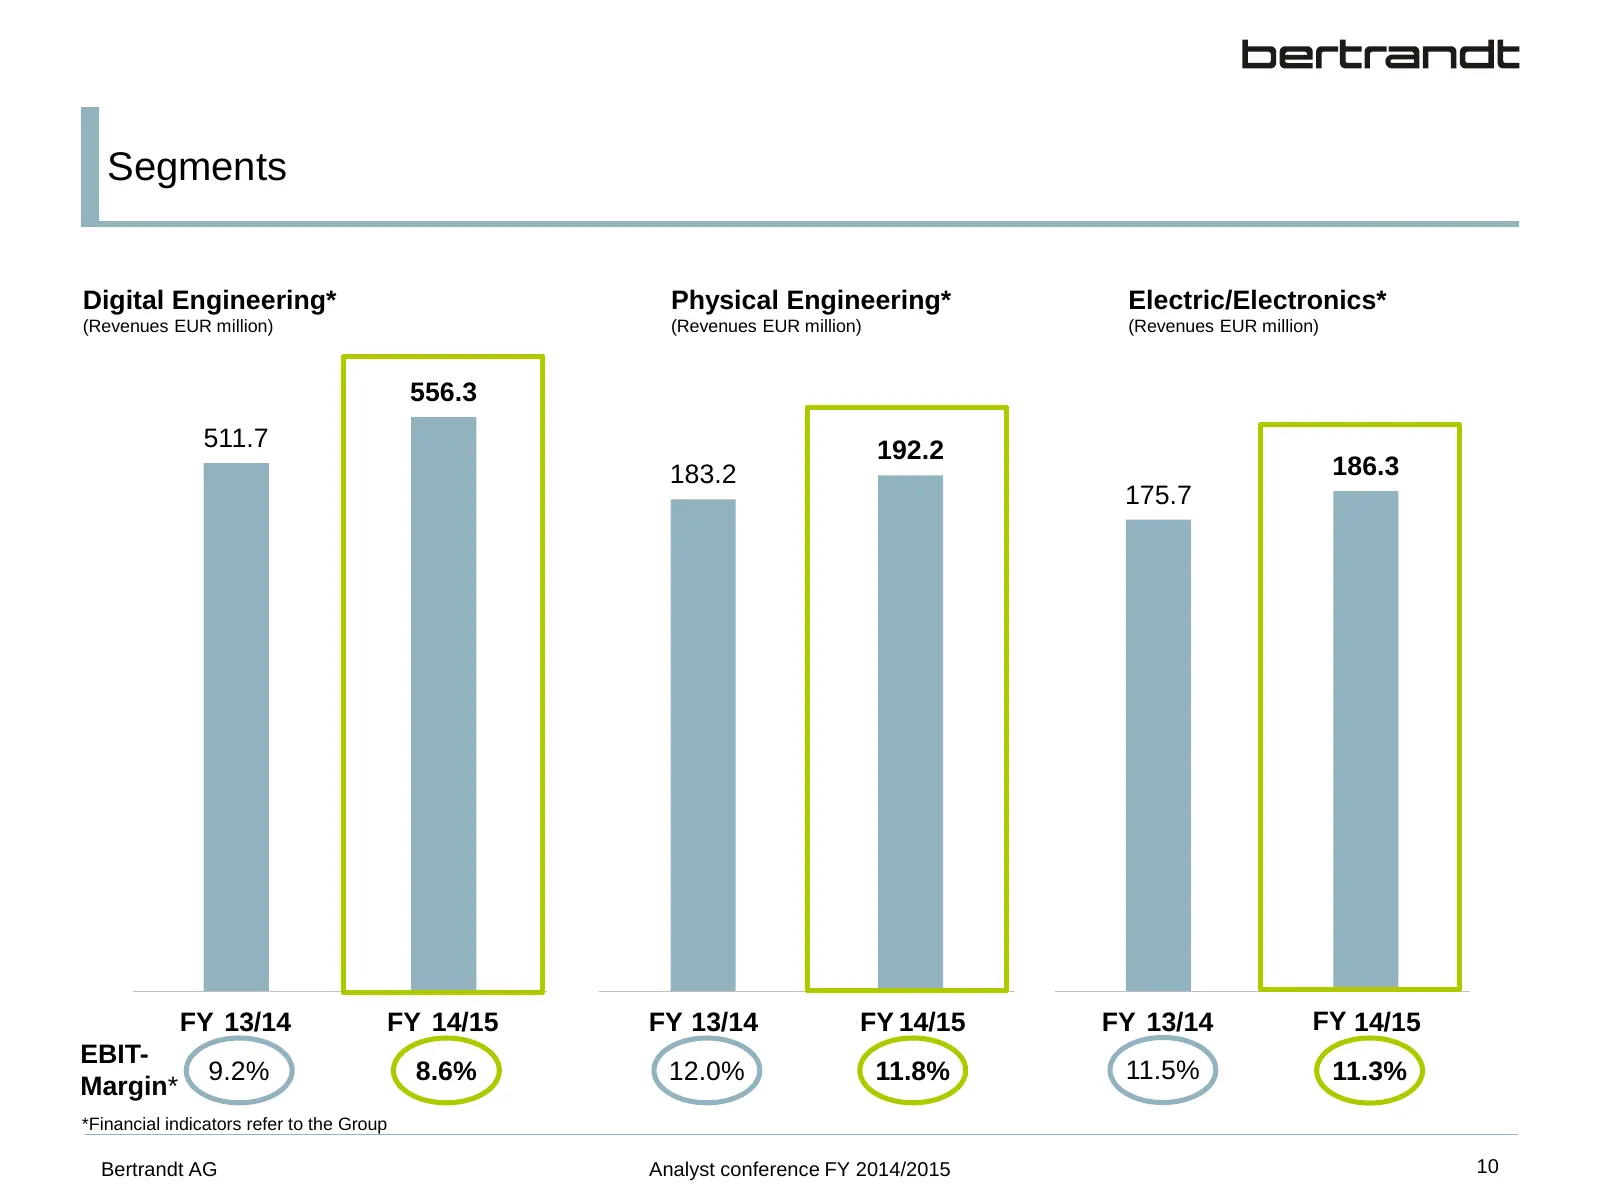
Slide 11: Segments
Segments Digital Engineering* Physical Engineering* Electric/Electronics* (Revenues EUR million) (Revenues EUR million) (Revenues EUR million) 556.3 511.7 192.2 183.2 186.3 175.7 FY GJ 13/14 FY GJ 14/15 FY 13/14 GJ FY 14/15 GJ FY GJ 13/14 FY 14/15 GJ EBIT- 9.2% 8.6% 12.0% 11.8% 11.5% 11.3% Margin* *
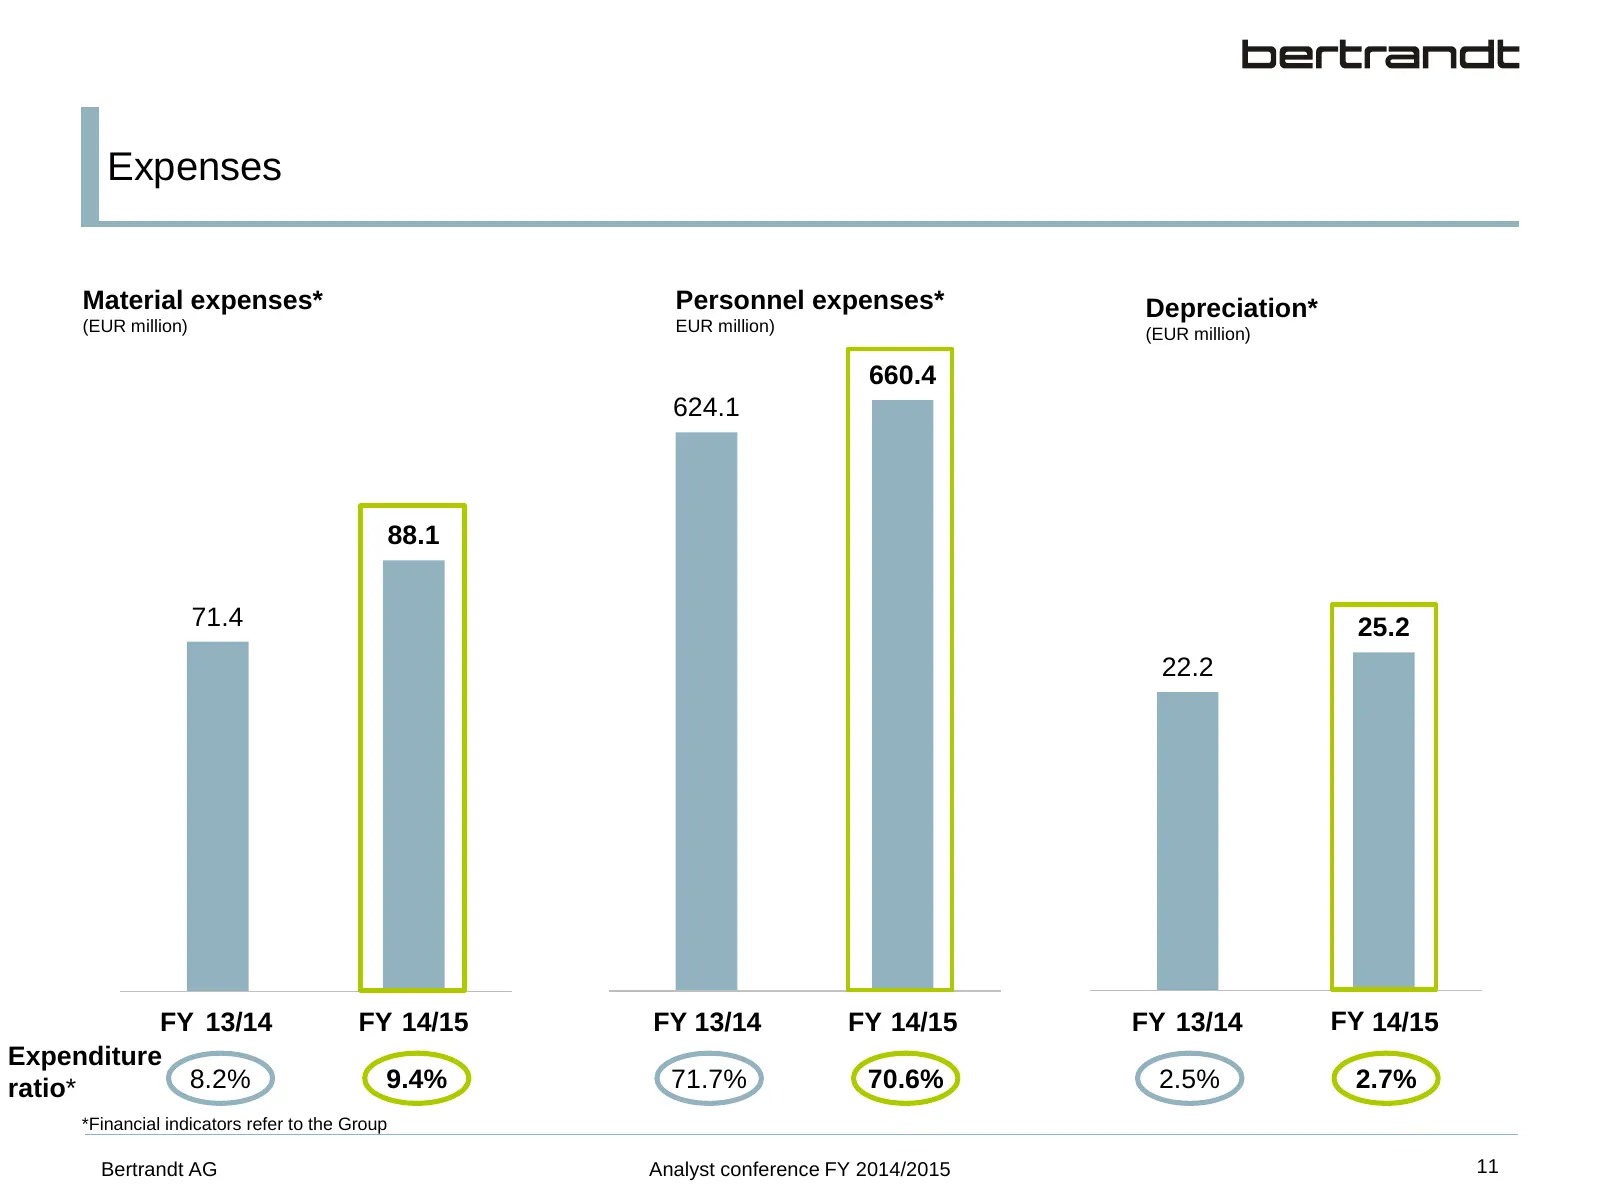
Slide 12: Expenses
Expenses Material expenses* Personnel expenses* Depreciation* (EUR million) EUR million) (EUR million) 660.4 624.1 88.1 71.4 25.2 22.2 FY GJ 13/14 FY GJ 14/15 FY 13/14 GJ FY 14/15 GJ GJ 13/14 FY FY 14/15 GJ Expenditure ratio* 8.2% 9.4% 71.7% 70.6% 2.5% 2.7% *Financial indicators refer to the Group B
Slide 13: Earnings after income tax
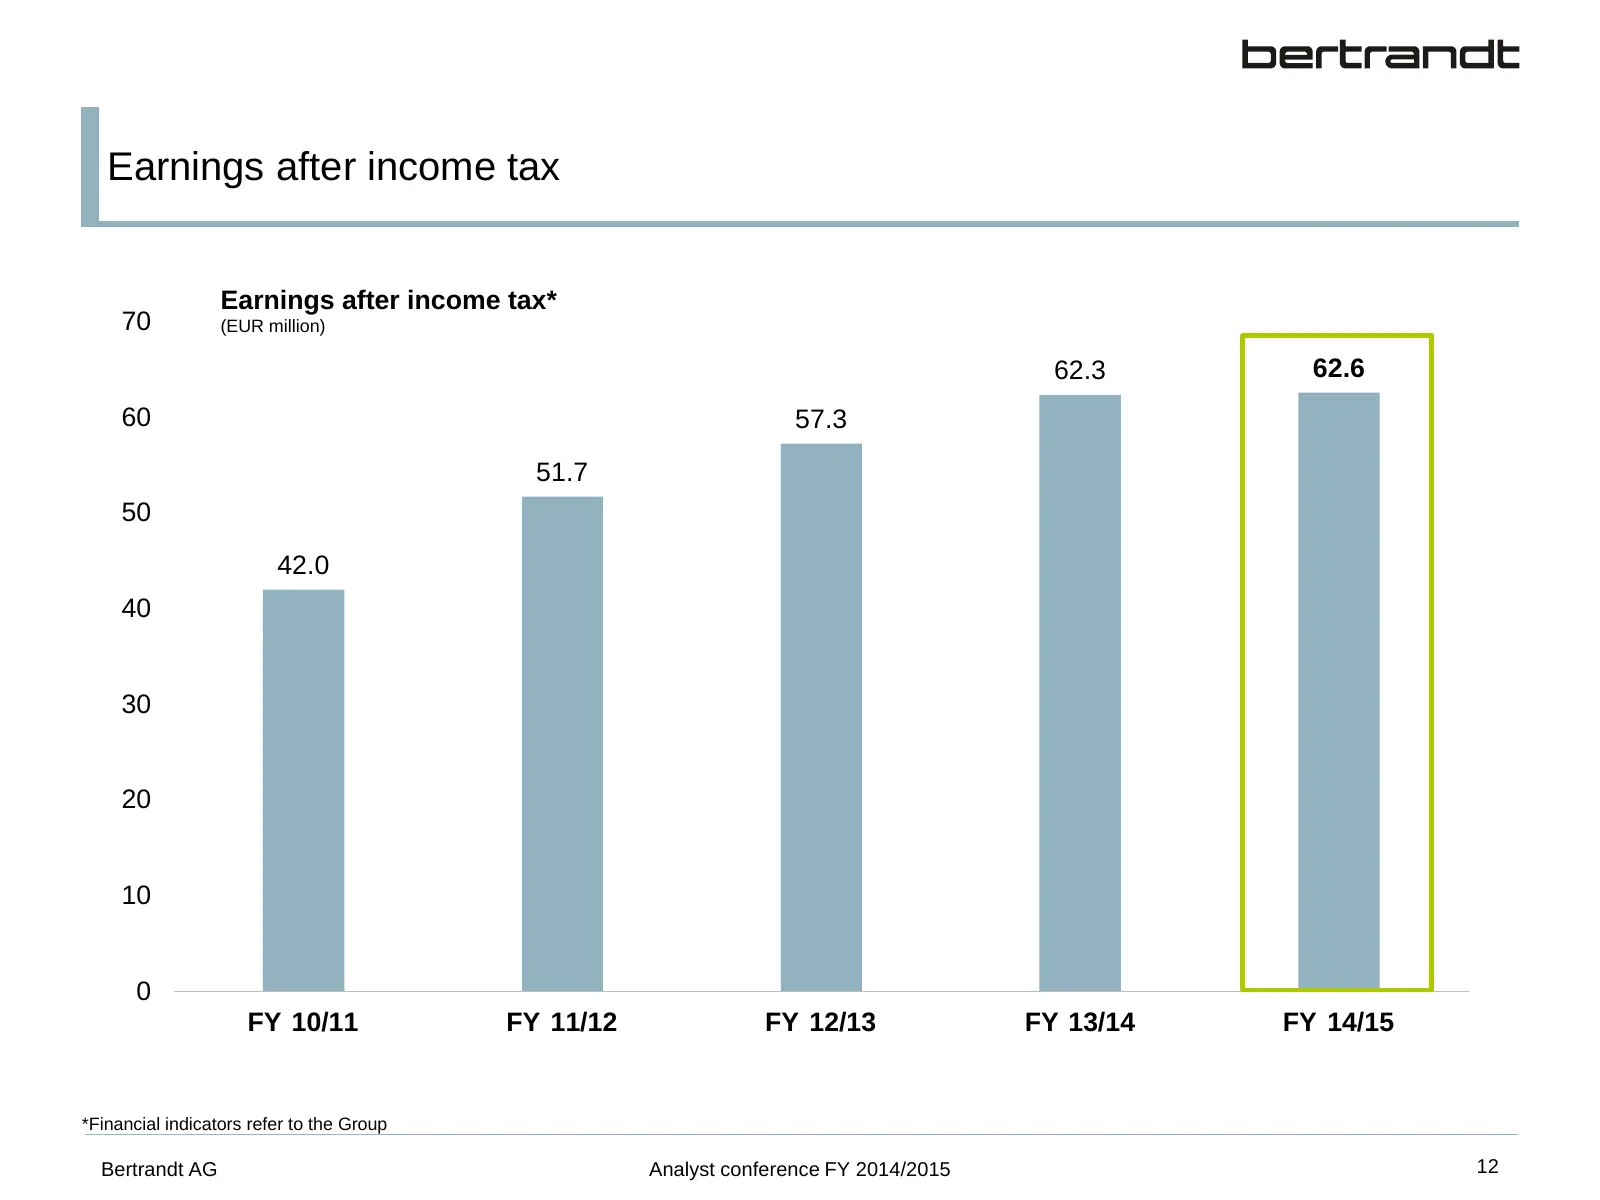
Earnings after income tax Earnings after income tax* 70 (EUR million) 62.3 62.6 60 57.3 51.7 50 42.0 40 30 20 10 0 FY GJ 10/11 FY GJ 11/12 FY GJ 12/13 FY GJ 13/14 FY GJ 14/15 *Financial indicators refer to the Group Bertrandt AG Analyst conference FY 2014/2015 12
Slide 14: Equity
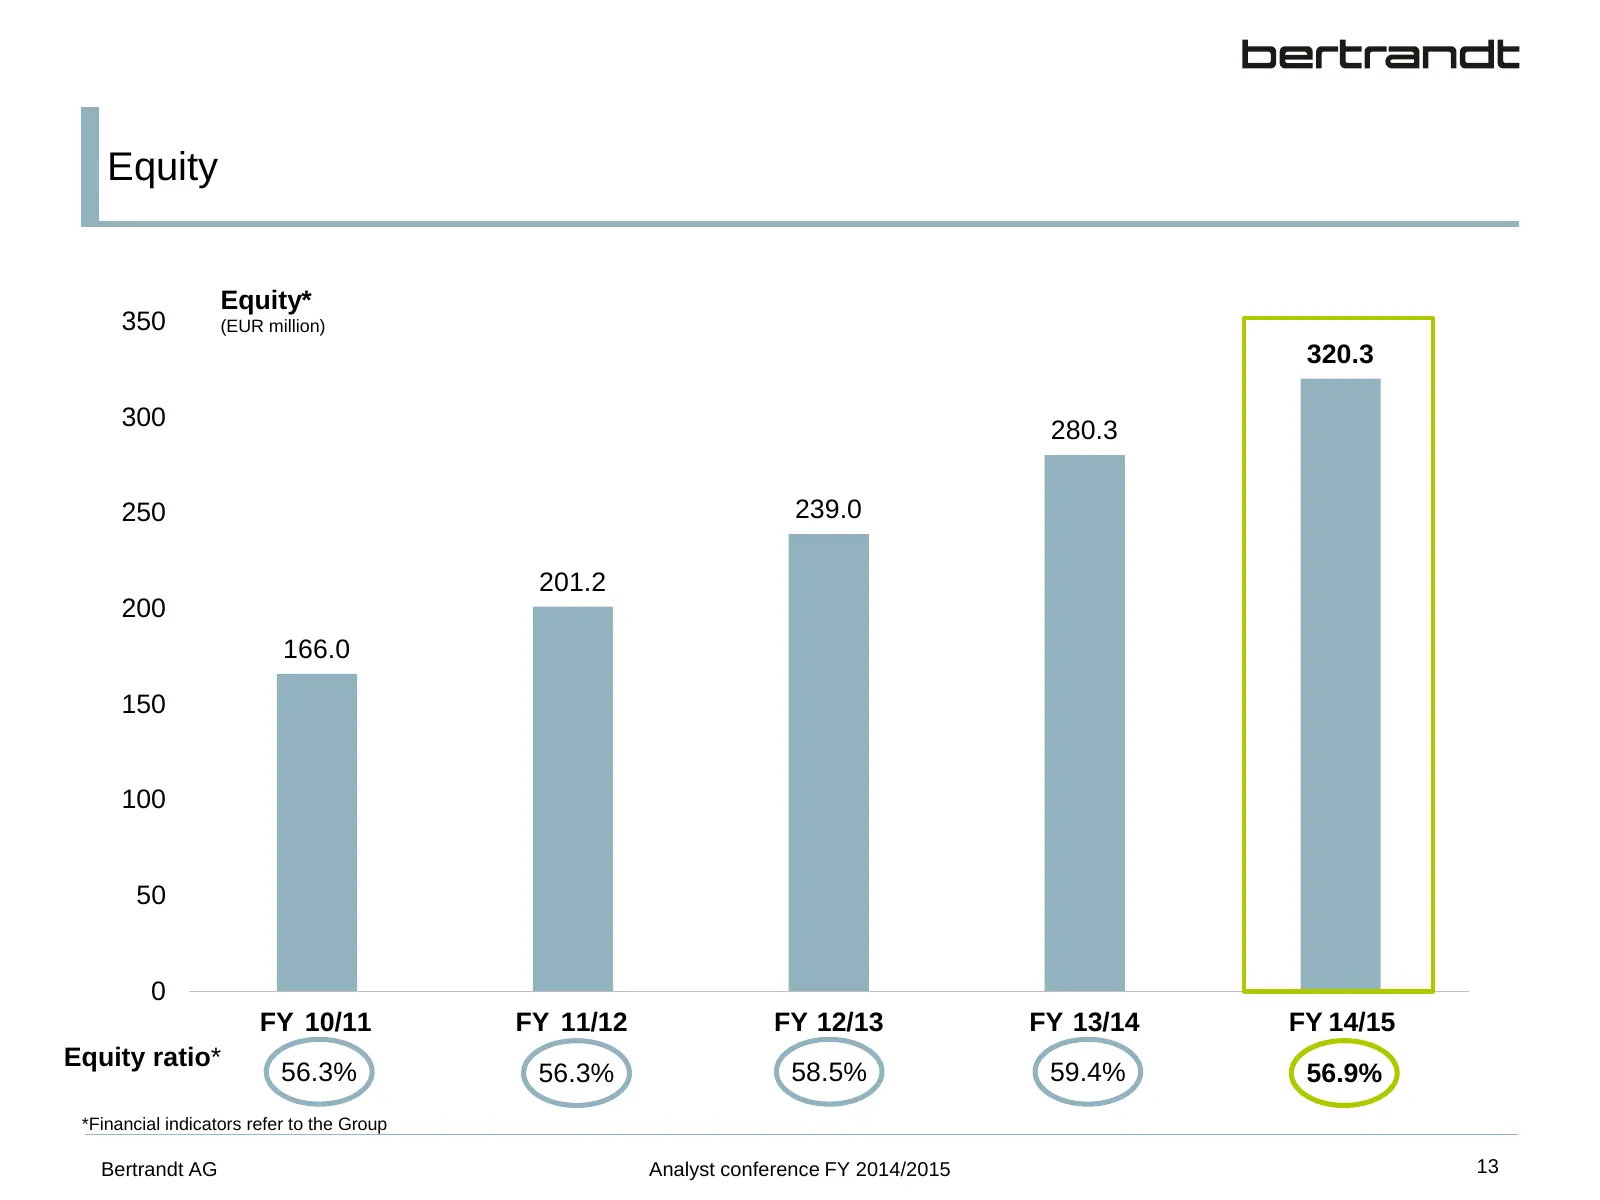
Equity Equity* 350 (EUR million) 320.3 300 280.3 250 239.0 201.2 200 166.0 150 100 50 0 FY GJ 10/11 FY GJ 11/12 FY 12/13 GJ FY GJ 13/14 FY 14/15 GJ Equity ratio* 56.3% 56.3% 58.5% 59.4% 56.9% *Financial indicators refer to the Group Bertrandt AG Analyst conference FY 2014/2015 13
Slide 15: Net finance income
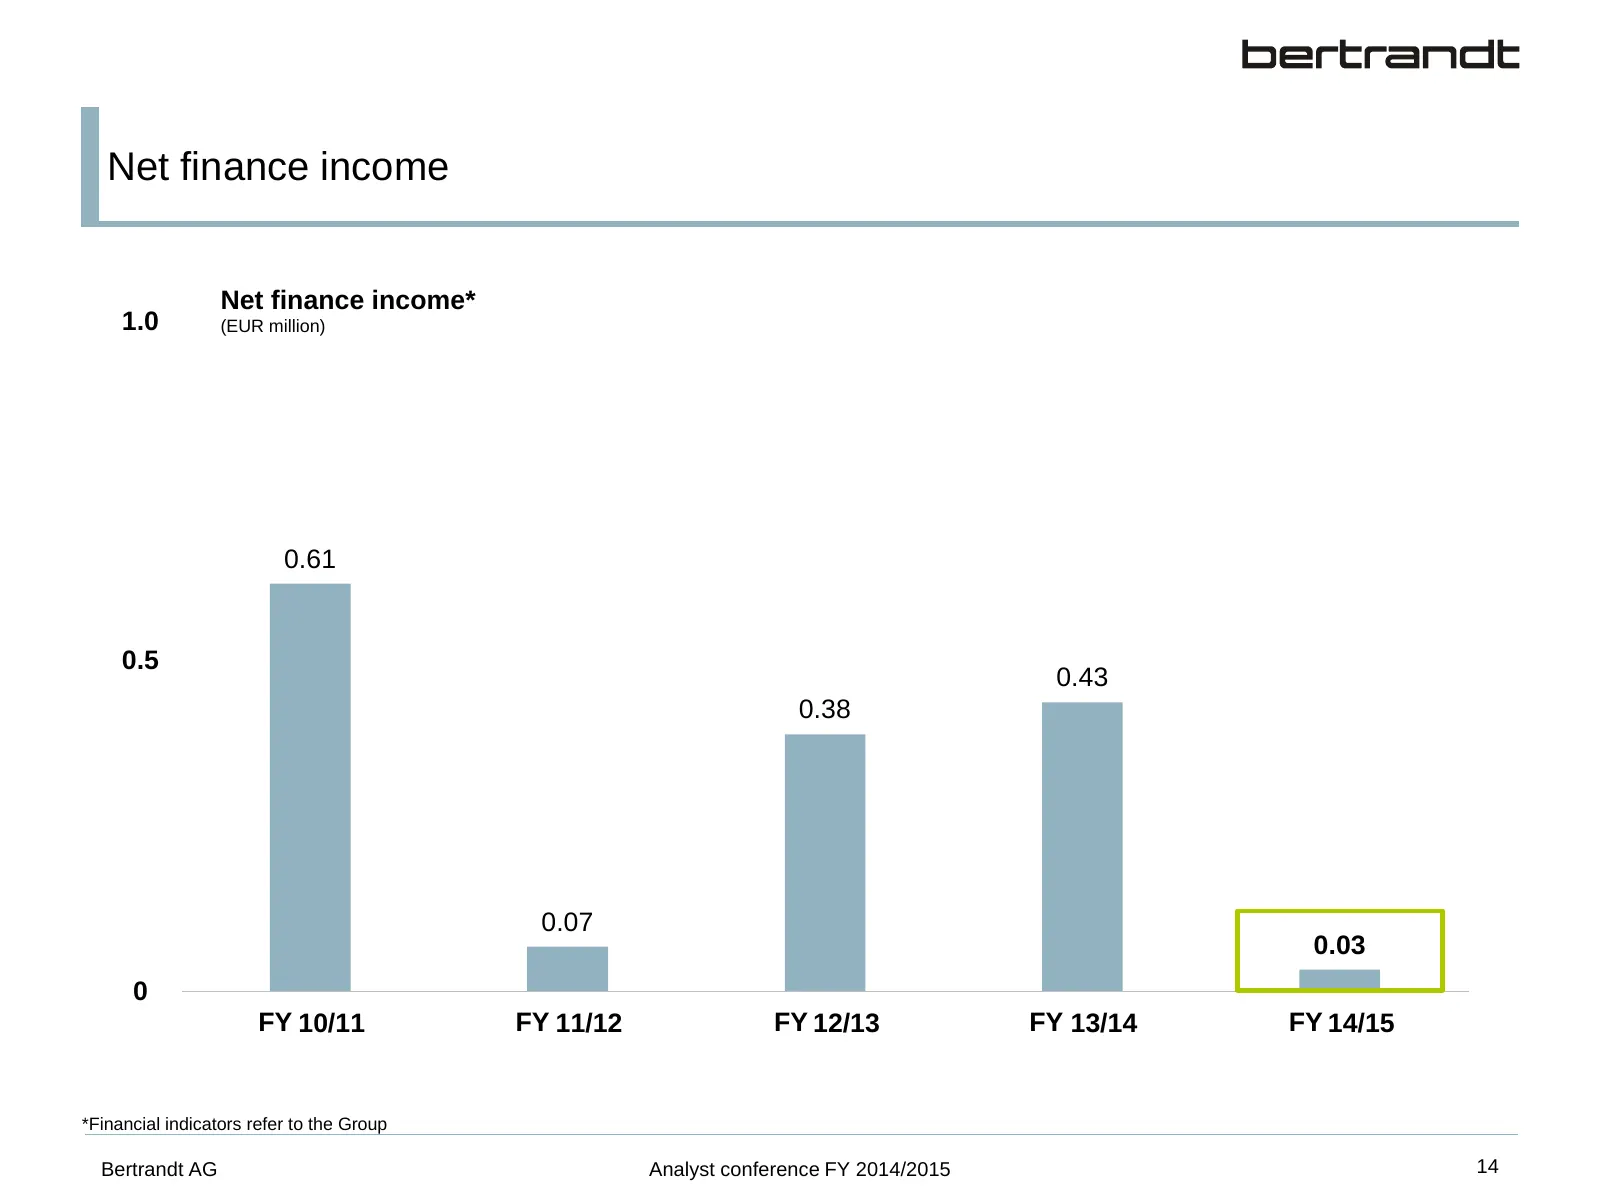
Net finance income Net finance income* 1,0 1.0 (EUR million) 0.61 0,5 0.5 0.43 0.38 0.07 0.03 0,0 0 FY 10/11 GJ FY 11/12 GJ FY 12/13 GJ FY 13/14 GJ FY 14/15 GJ *Financial indicators refer to the Group Bertrandt AG Analyst conference FY 2014/2015 14
Slide 16: Cash flow from operating activities
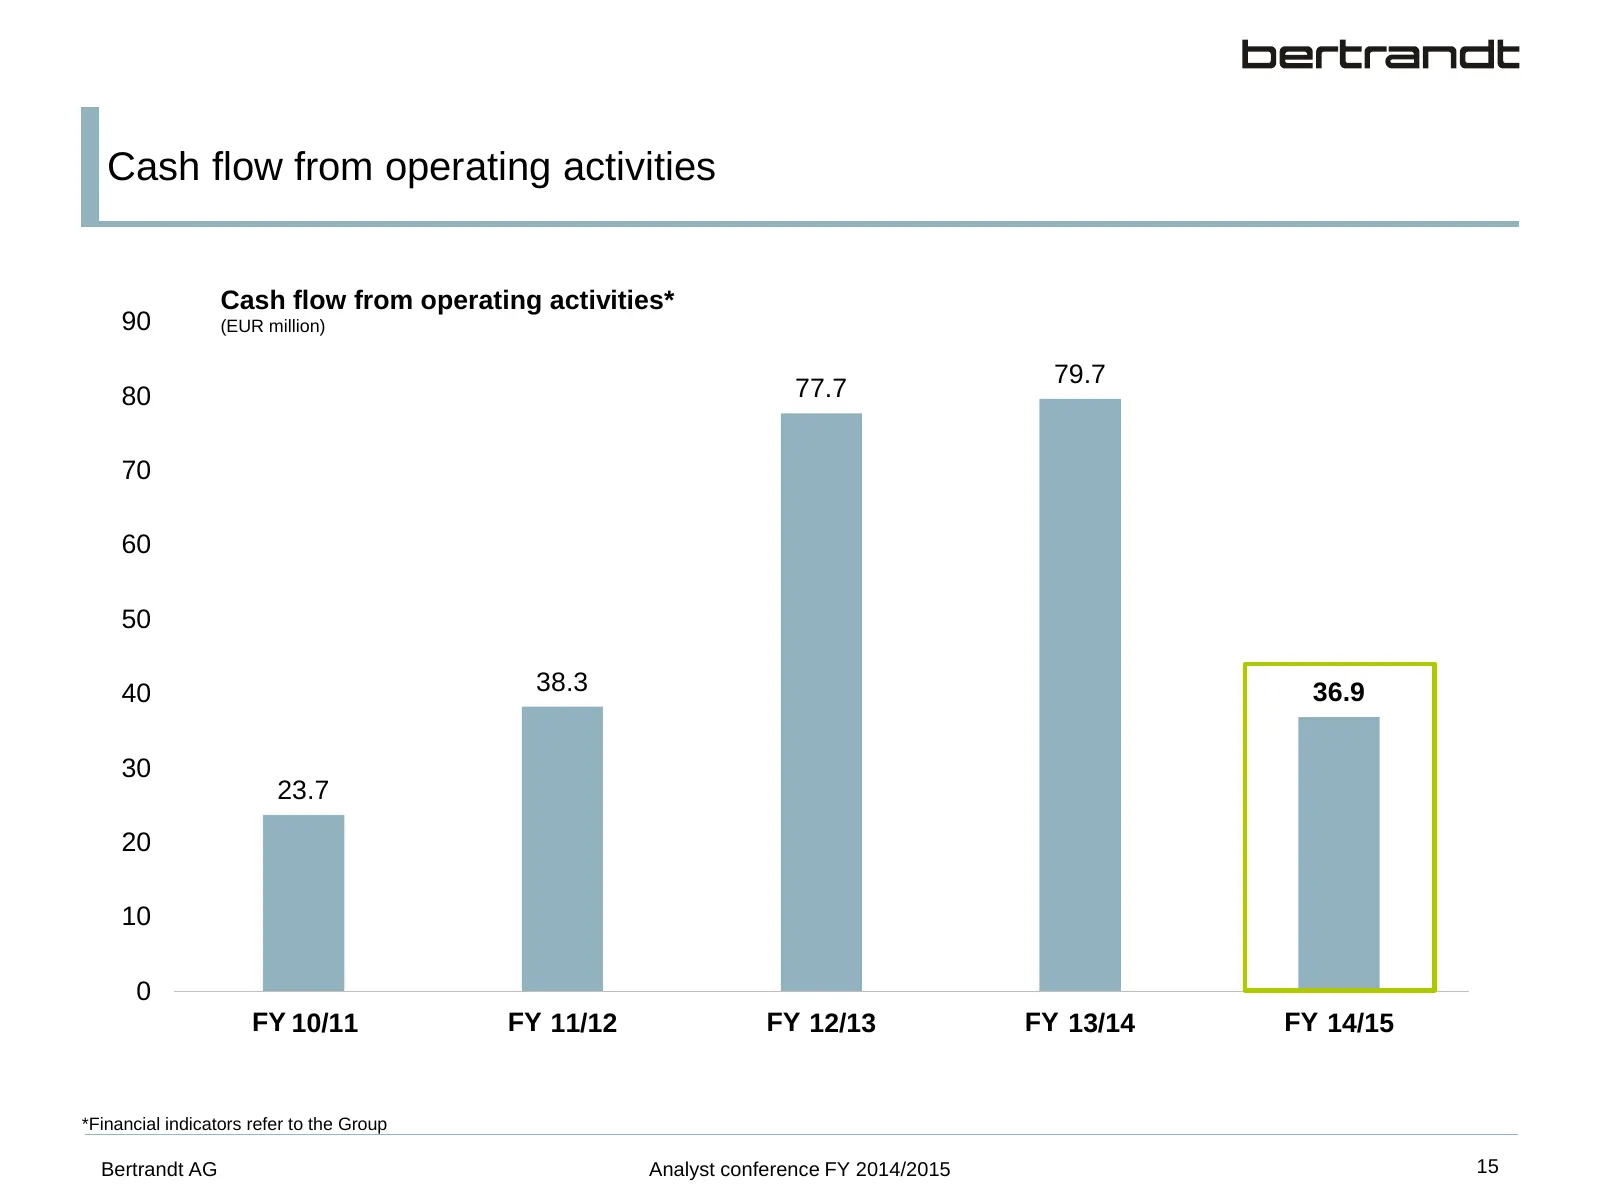
Cash flow from operating activities Cash flow from operating activities* 90 (EUR million) 79.7 80 77.7 70 60 50 40 38.3 36.9 30 23.7 20 10 0 FY 10/11 GJ FY 11/12 GJ FY 12/13 GJ FY GJ 13/14 FY 14/15 GJ *Financial indicators refer to the Group Bertrandt AG Analyst conference FY 2014/2015 15
Slide 17: Capital spending
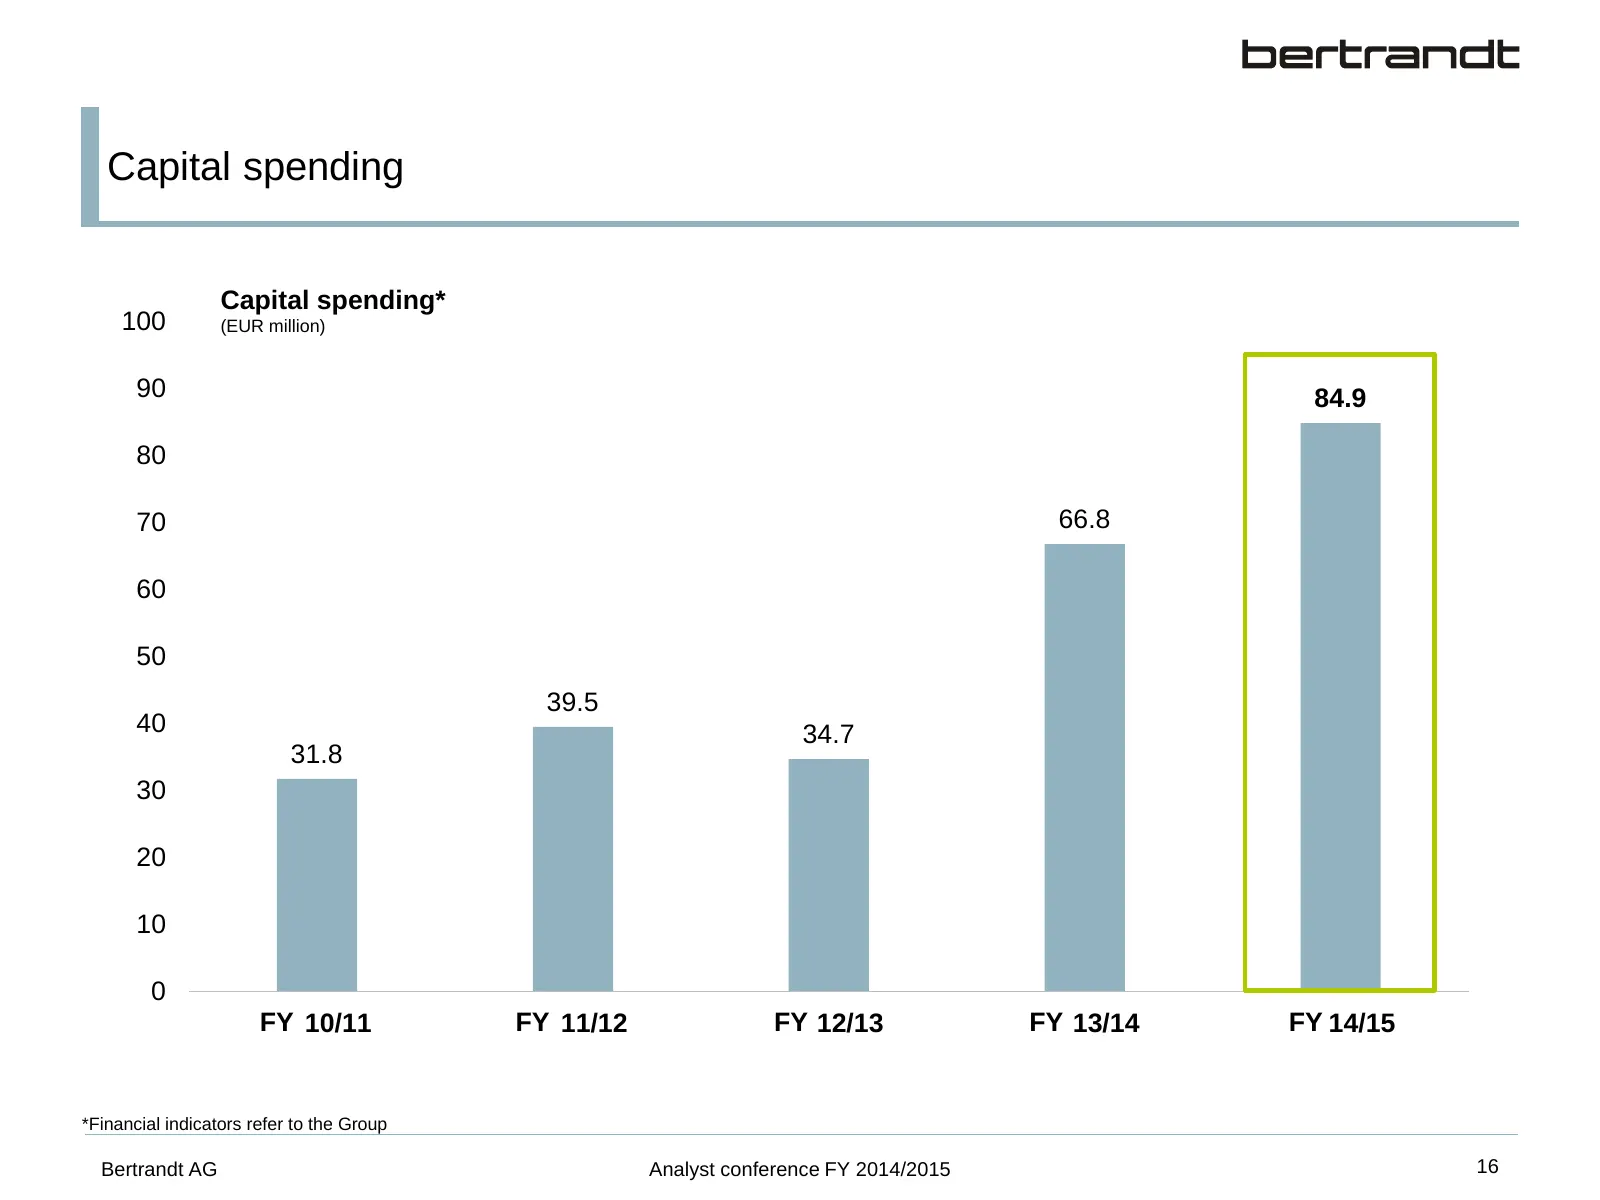
Capital spending Capital spending* 100 (EUR million) 90 84.9 80 70 66.8 60 50 39.5 40 34.7 31.8 30 20 10 0 FY GJ 10/11 FY GJ 11/12 FY 12/13 GJ FY GJ 13/14 FY 14/15 GJ *Financial indicators refer to the Group Bertrandt AG Analyst conference FY 2014/2015 16
Slide 18: Free cash flow
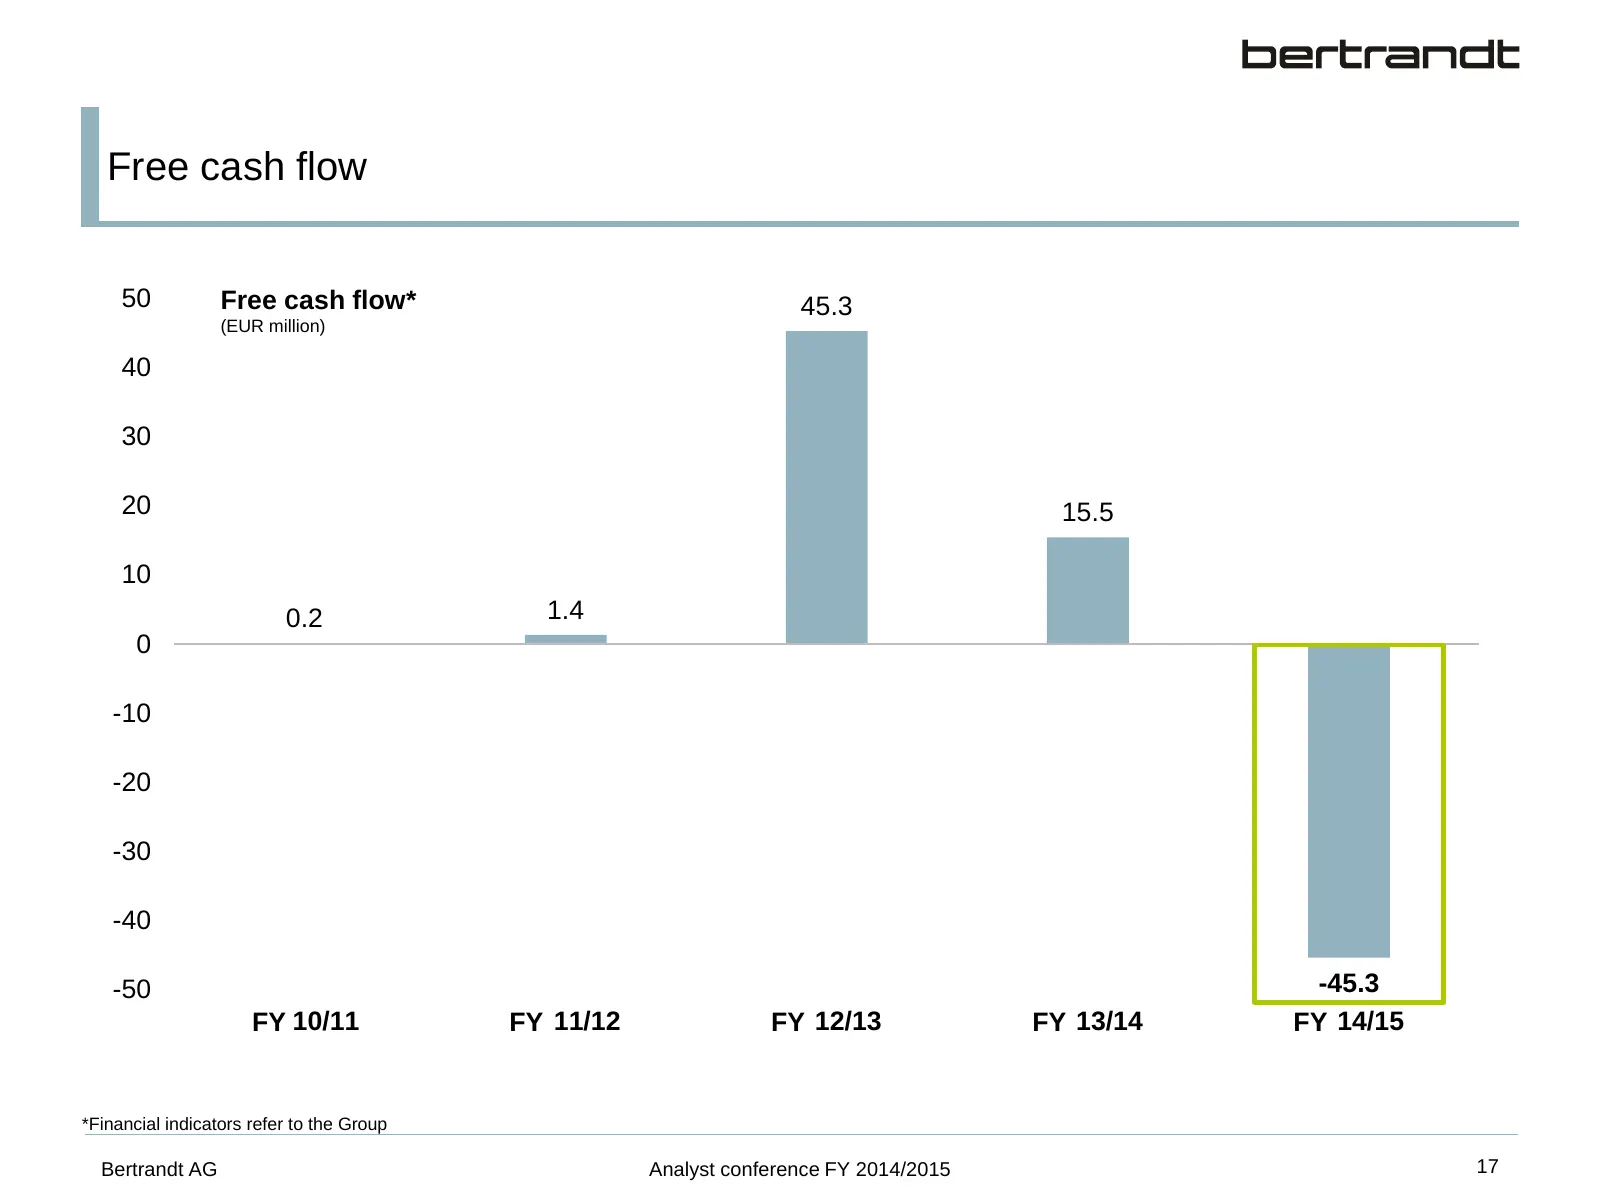
Free cash flow 50 Free cash flow* 45.3 (EUR million) 40 30 20 15.5 10 0.2 1.4 0 -10 -20 -30 -40 -50 -45.3 GJ FY 10/11 GJ 11/12 FY GJ 12/13 FY GJ 13/14 FY GJ 14/15 FY *Financial indicators refer to the Group Bertrandt AG Analyst conference FY 2014/2015 17
Slide 19: Employees
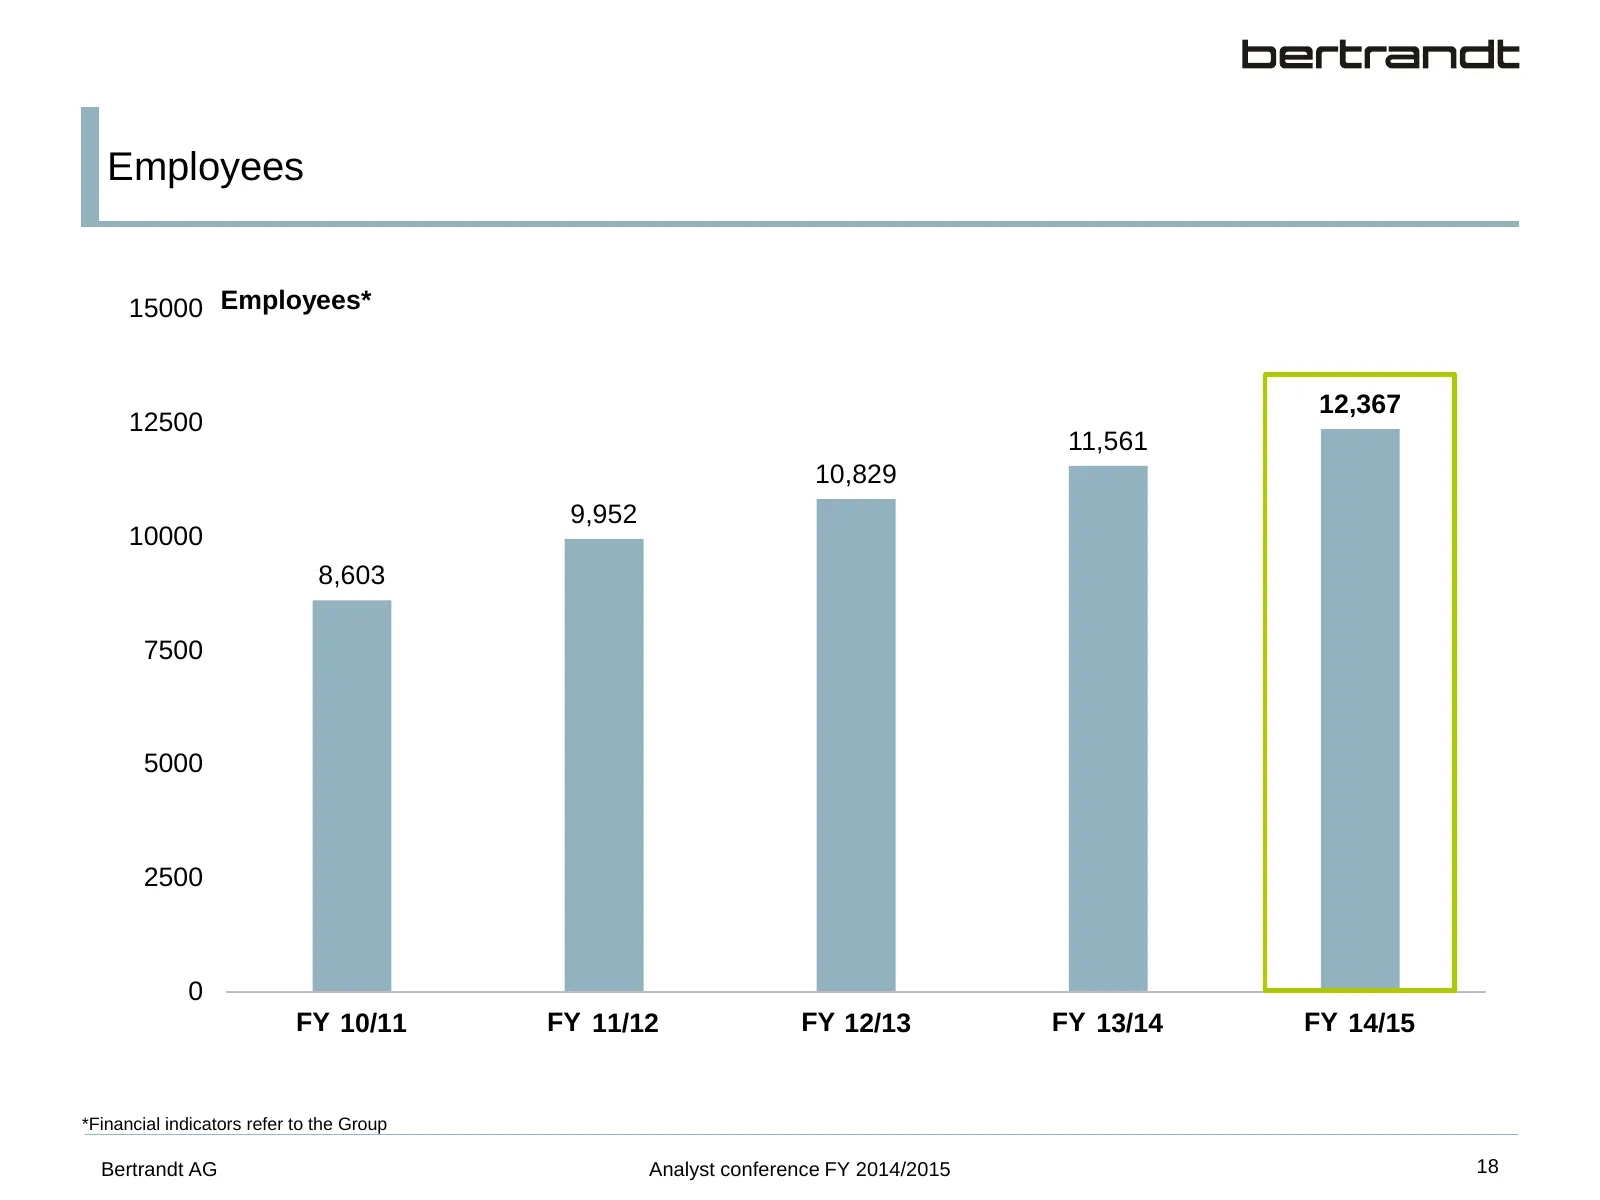
Employees 15000 Employees* 12,367 12500 11,561 10,829 9,952 10000 8,603 7500 5000 2500 0 FY GJ 10/11 FY GJ 11/12 FY GJ 12/13 FY GJ 13/14 FY GJ 14/15 *Financial indicators refer to the Group Bertrandt AG Analyst conference FY 2014/2015 18
Slide 20: Dividend
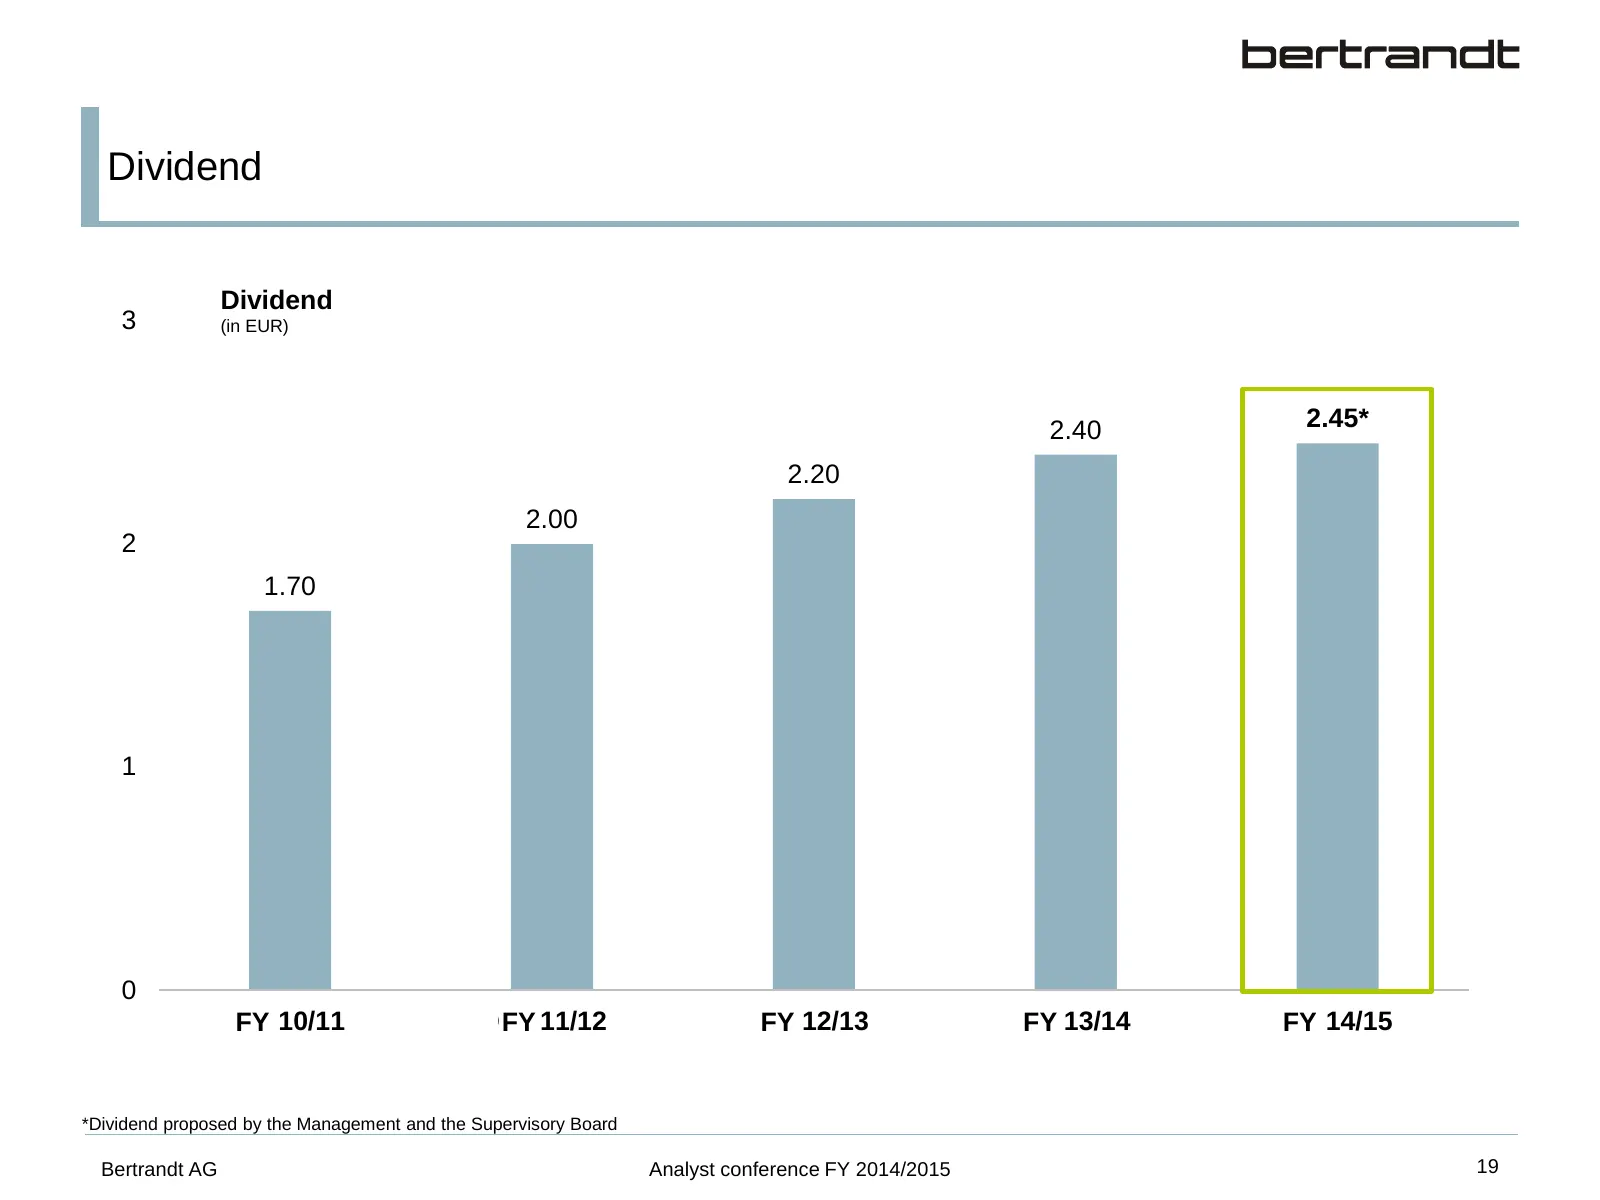
Dividend Dividend 3 (in EUR) 2.40 2.45* 2.20 2.00 2 1.70 1 0 GJ FY 10/11 GJ FY 11/12 GJ FY 12/13 GJ FY 13/14 GJ FY 14/15 *Dividend proposed by the Management and the Supervisory Board Bertrandt AG Analyst conference FY 2014/2015 19
Slide 21: Content
Content 1. Framework – FY 2014/2015 2. Key figures – FY 2014/2015 3. Outlook – FY 2015/2016 Bertrandt AG Analyst conference FY 2014/2015 20
Slide 22: Outlook FY 2015/2016
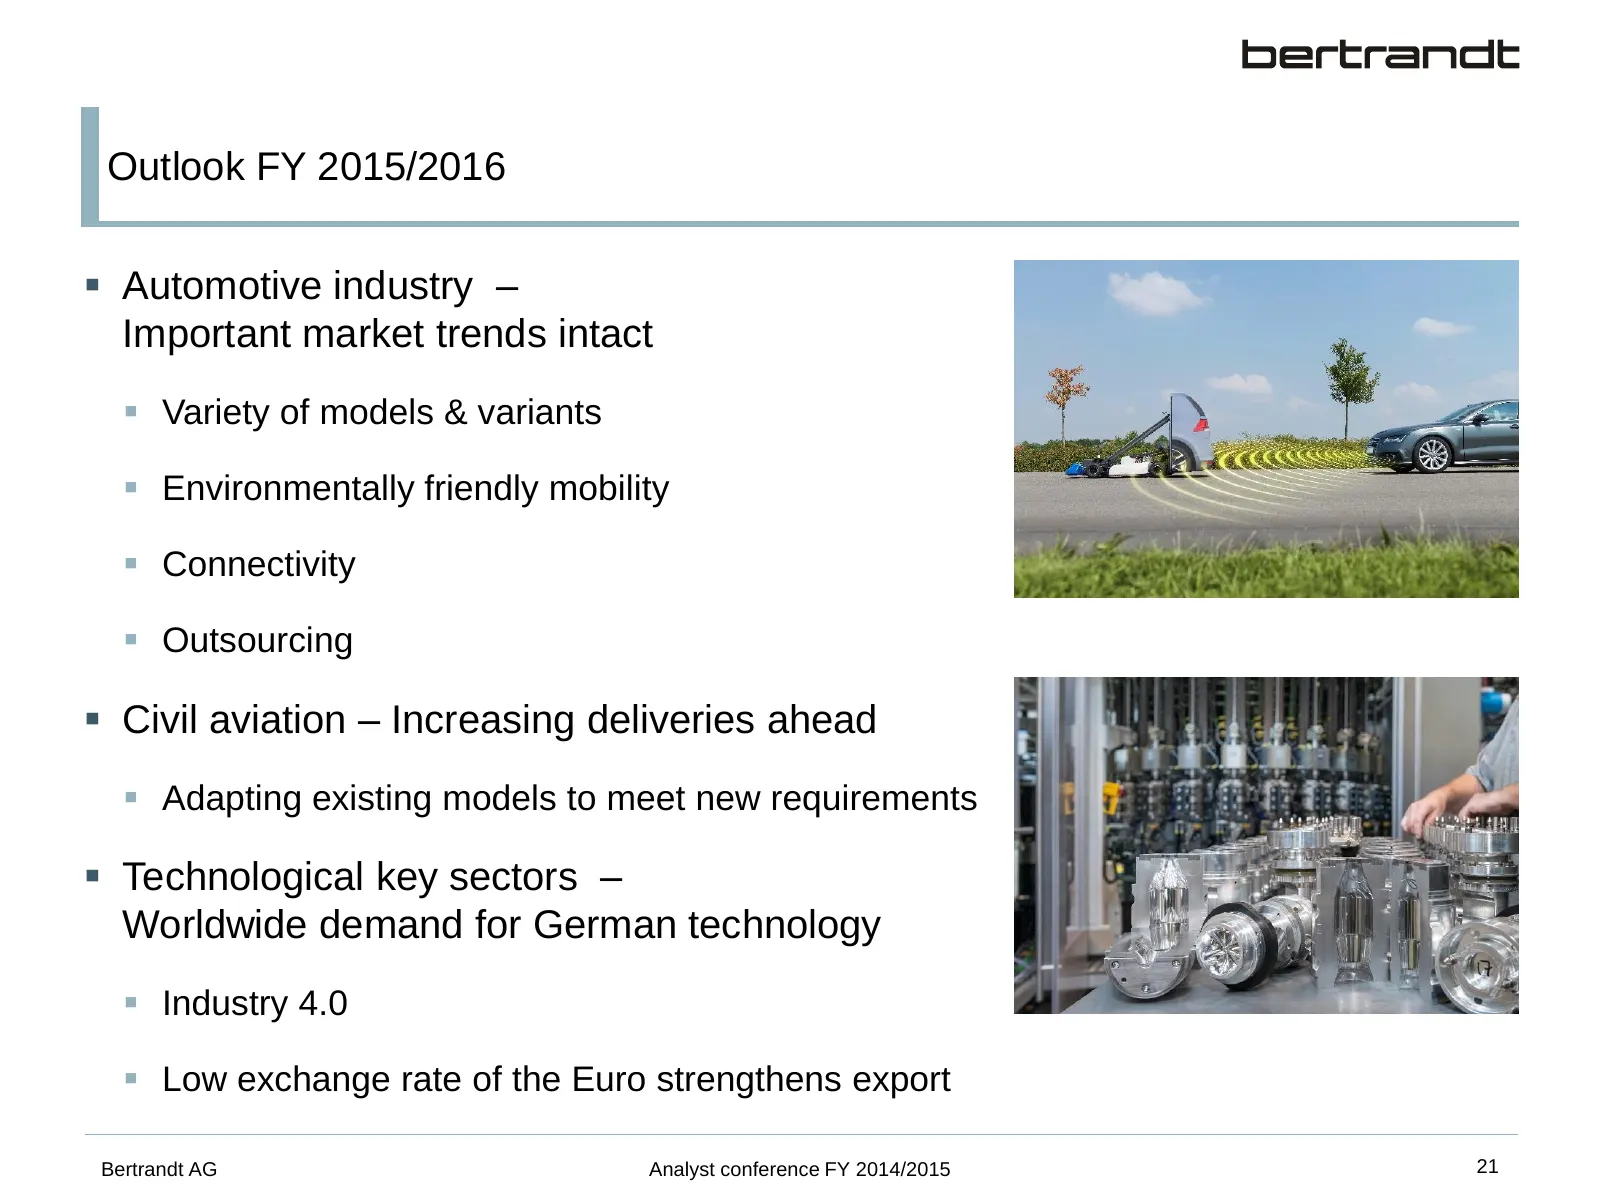
Outlook FY 2015/2016 Automotive industry – Important market trends intact Variety of models & variants Environmentally friendly mobility Connectivity Outsourcing Civil aviation – Increasing deliveries ahead Adapting existing models to meet new requirements Technological key sectors –
Slide 23: Model diversity increases
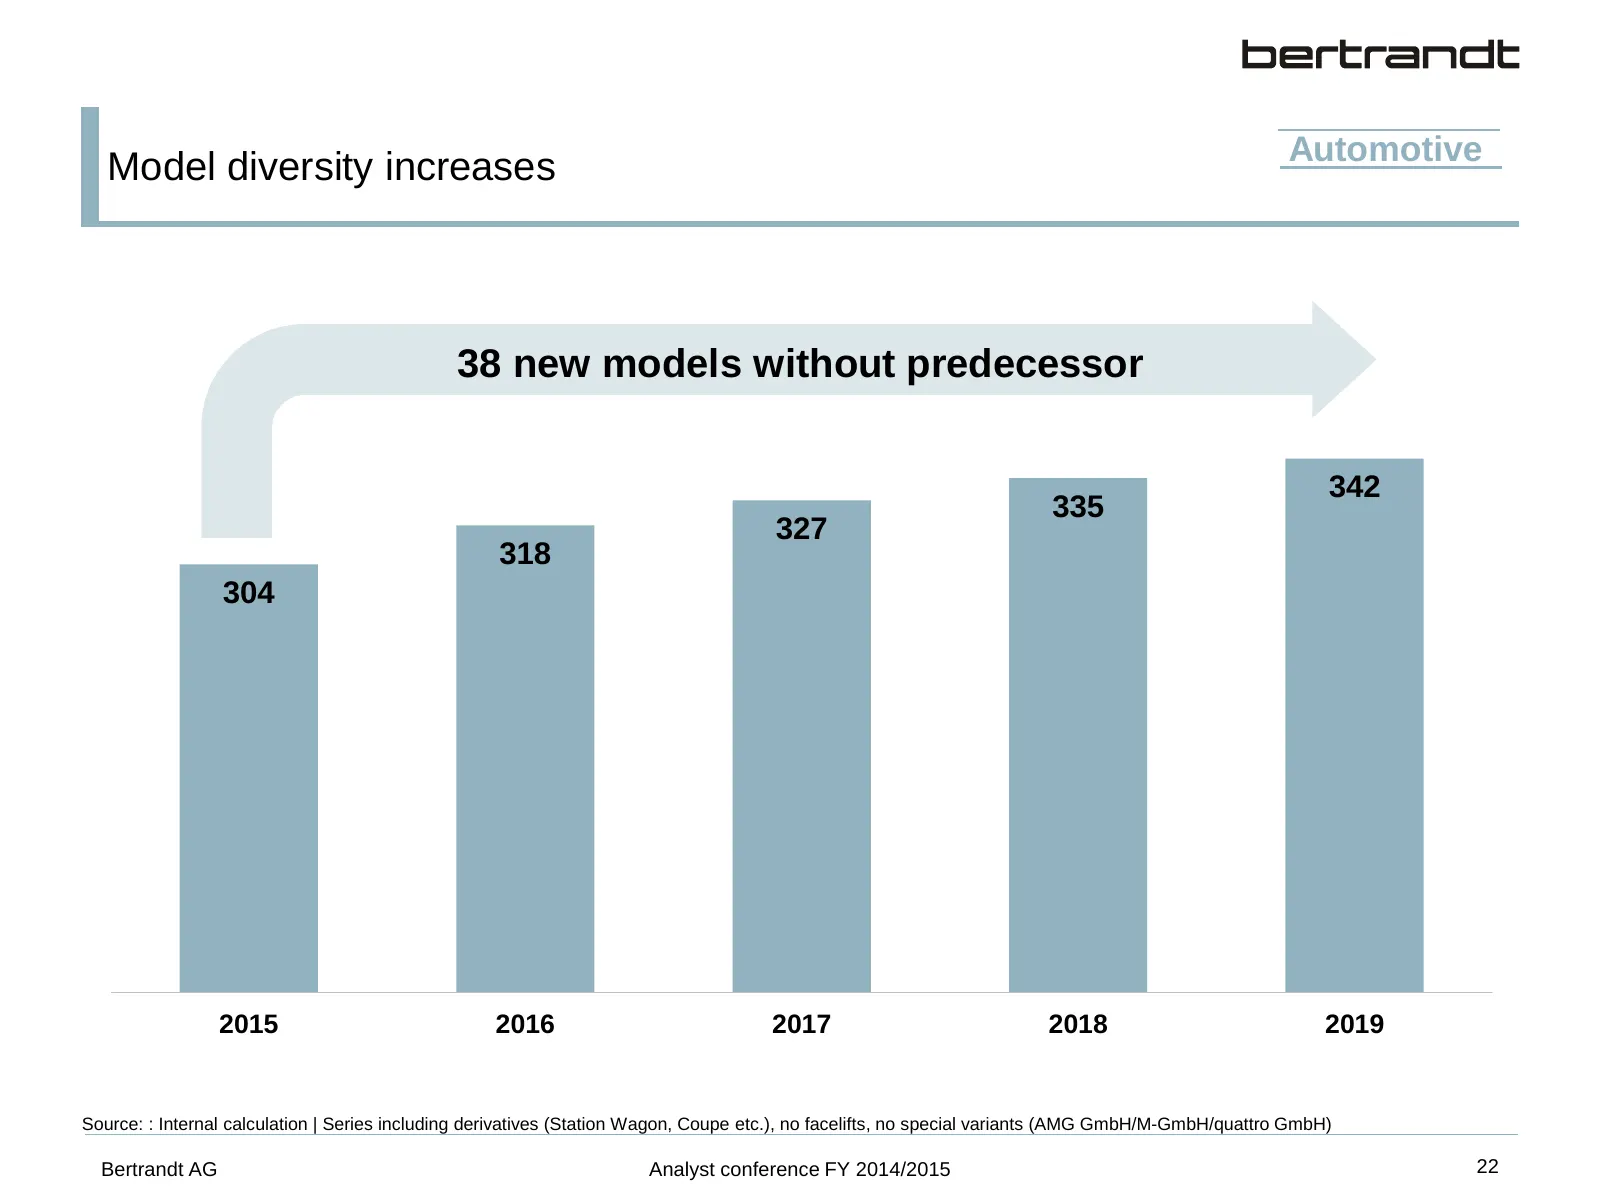
Automotive Model diversity increases 38 new models without predecessor 342 335 327 318 304 2015 2016 2017 2018 2019 Source: : Internal calculation | Series including derivatives (Station Wagon, Coupe etc.), no facelifts, no special variants (AMG GmbH/M-GmbH/quattro GmbH) Bertrandt AG Analyst confere
Slide 24: Environmentally friendly mobility driven by regulations
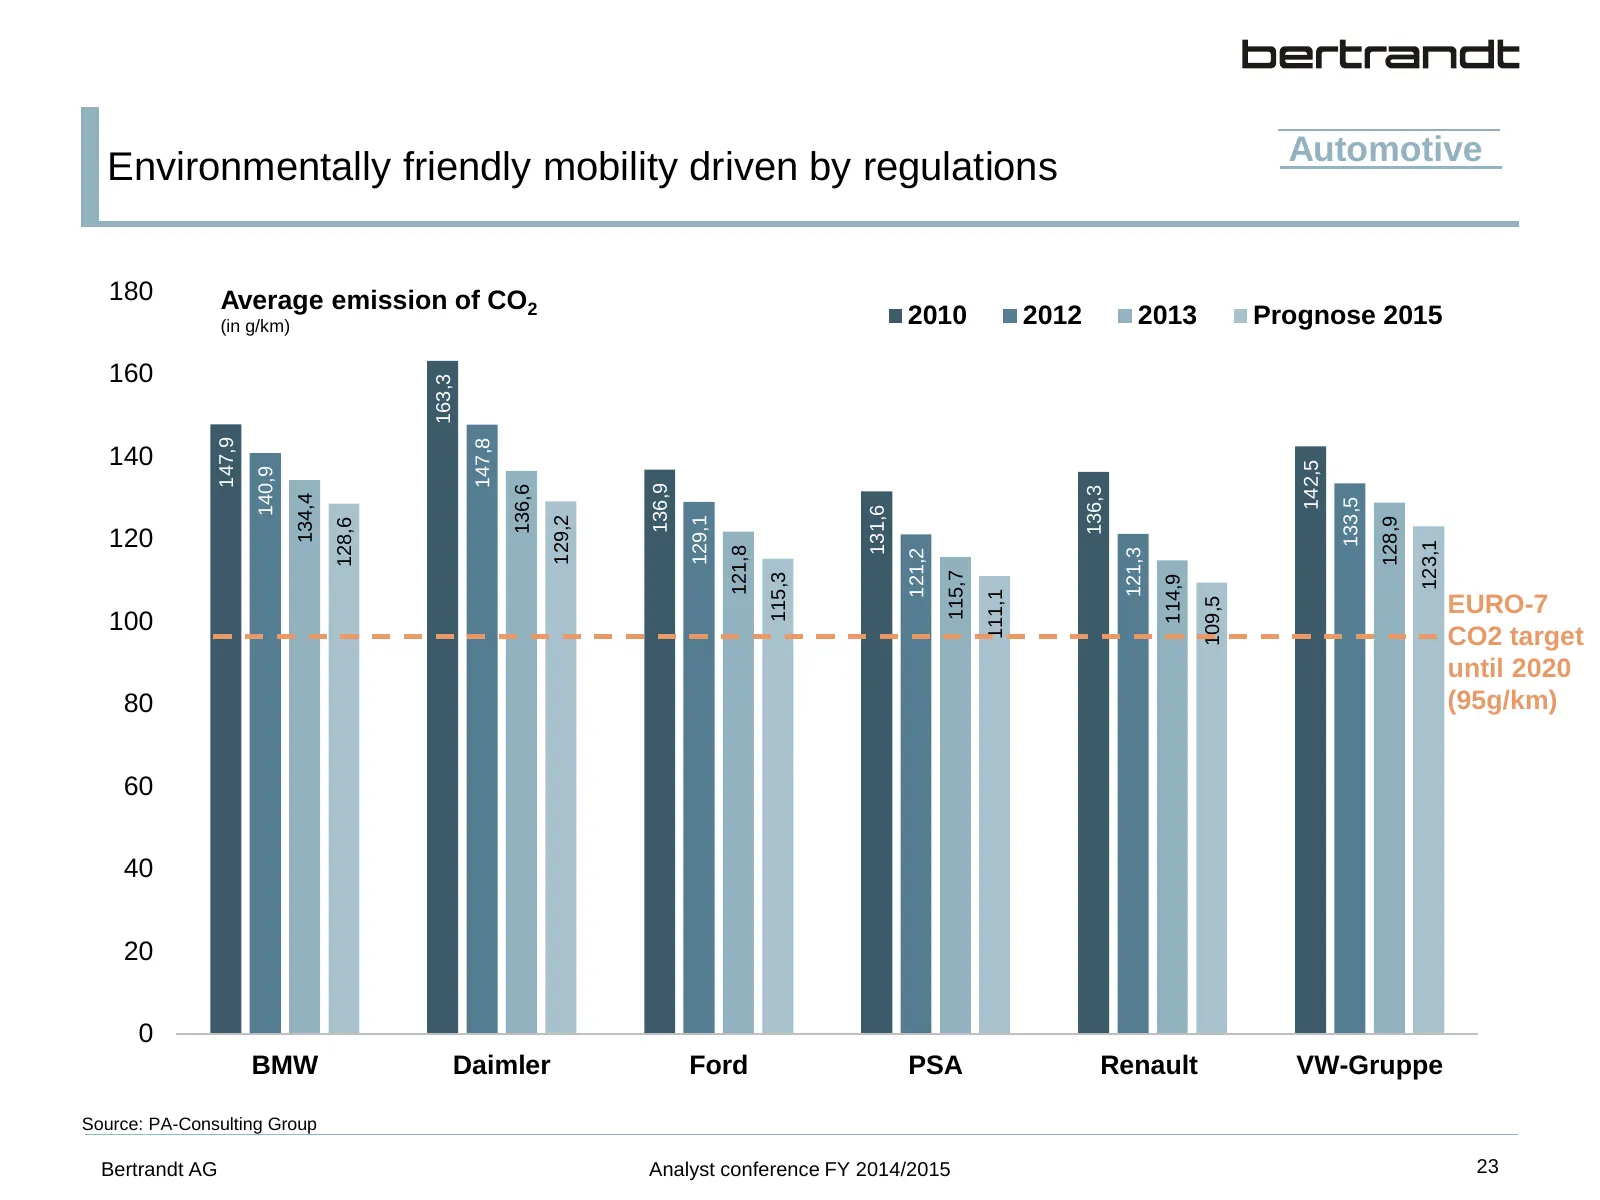
Automotive Environmentally friendly mobility driven by regulations 180 Average emission of CO2 (in g/km) 2010 2012 2013 Prognose 2015 160 163,3 147,9 147,8 140 142,5 140,9 136,9 136,6 136,3 134,4 133,5 131,6 129,2 129,1 128,9 128,6 120 123,1 121,8 121,3 121,2 115,7 115,3 114,9 111,1 EURO-7 109,5 100
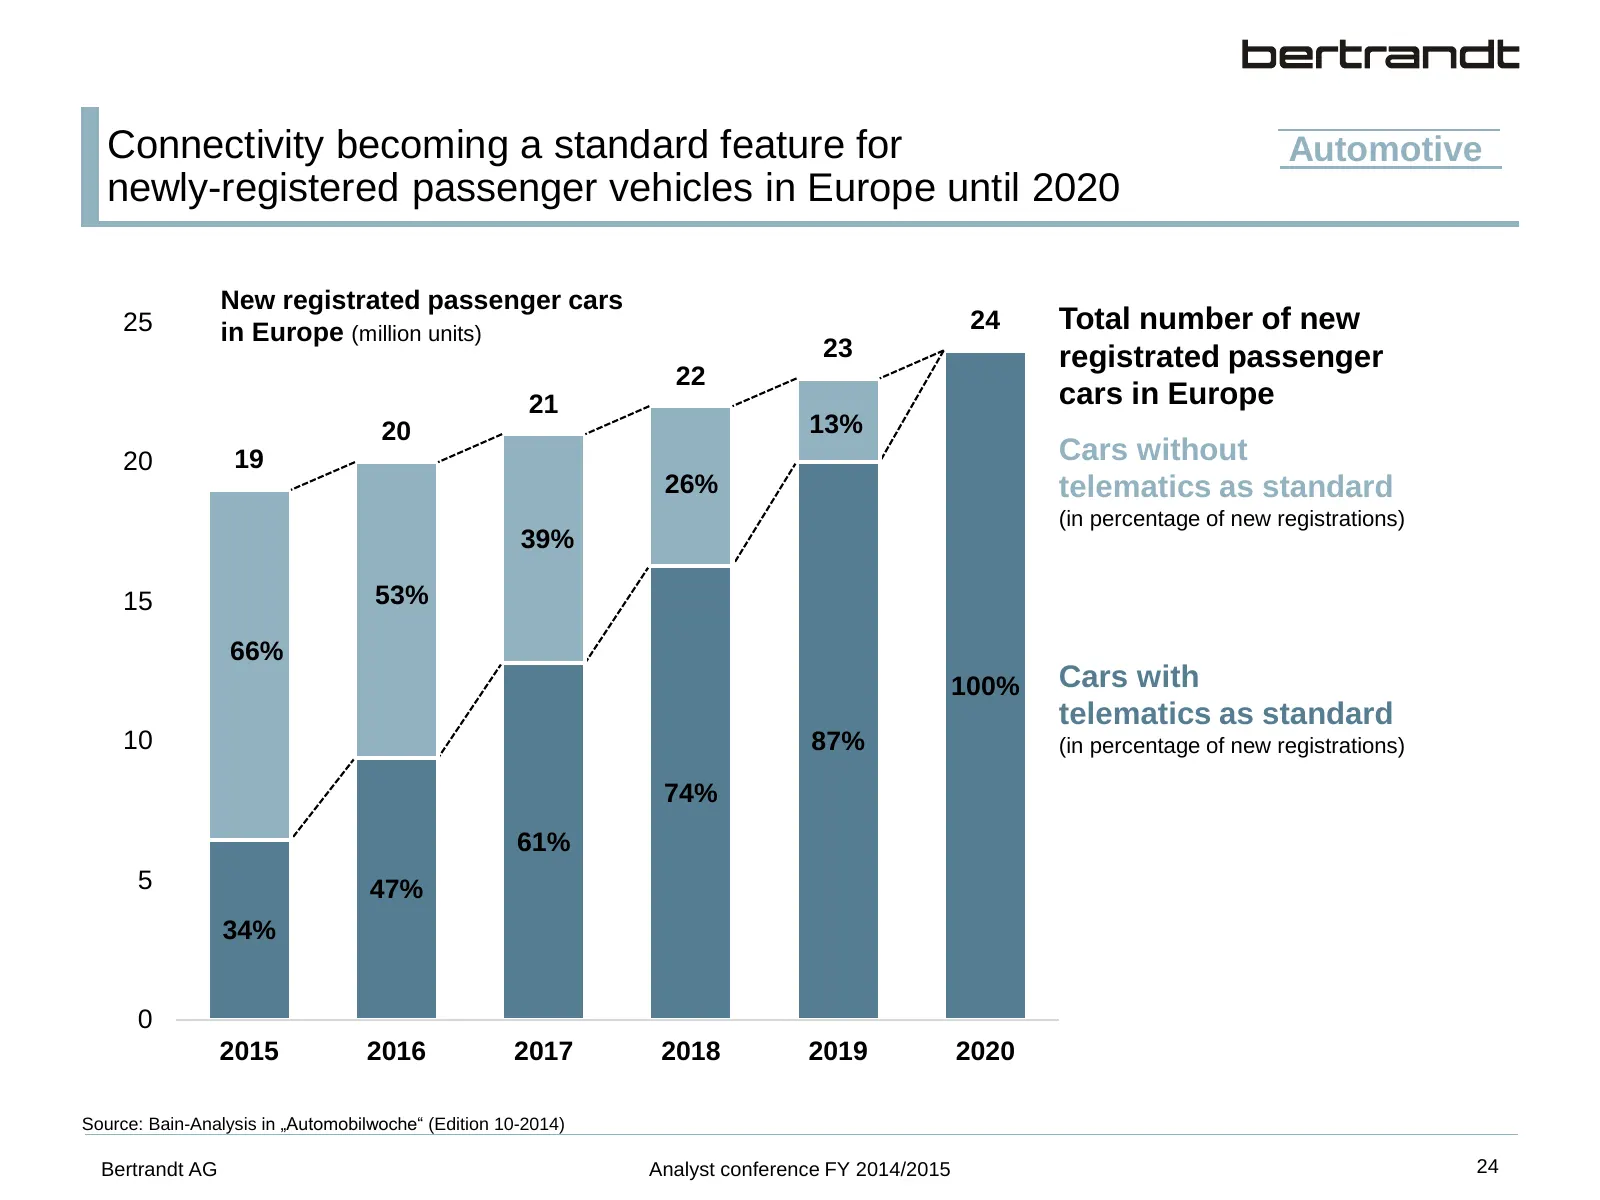
Slide 25: Connectivity becoming a standard feature for newly-registered passenger vehicles
Connectivity becoming a standard feature for Automotive newly-registered passenger vehicles in Europe until 2020 New registrated passenger cars 25 in Europe (million units) 24 Total number of new 23 registrated passenger 22 21 cars in Europe 20 13% 20 19 Cars without 26% telematics as standard (in p
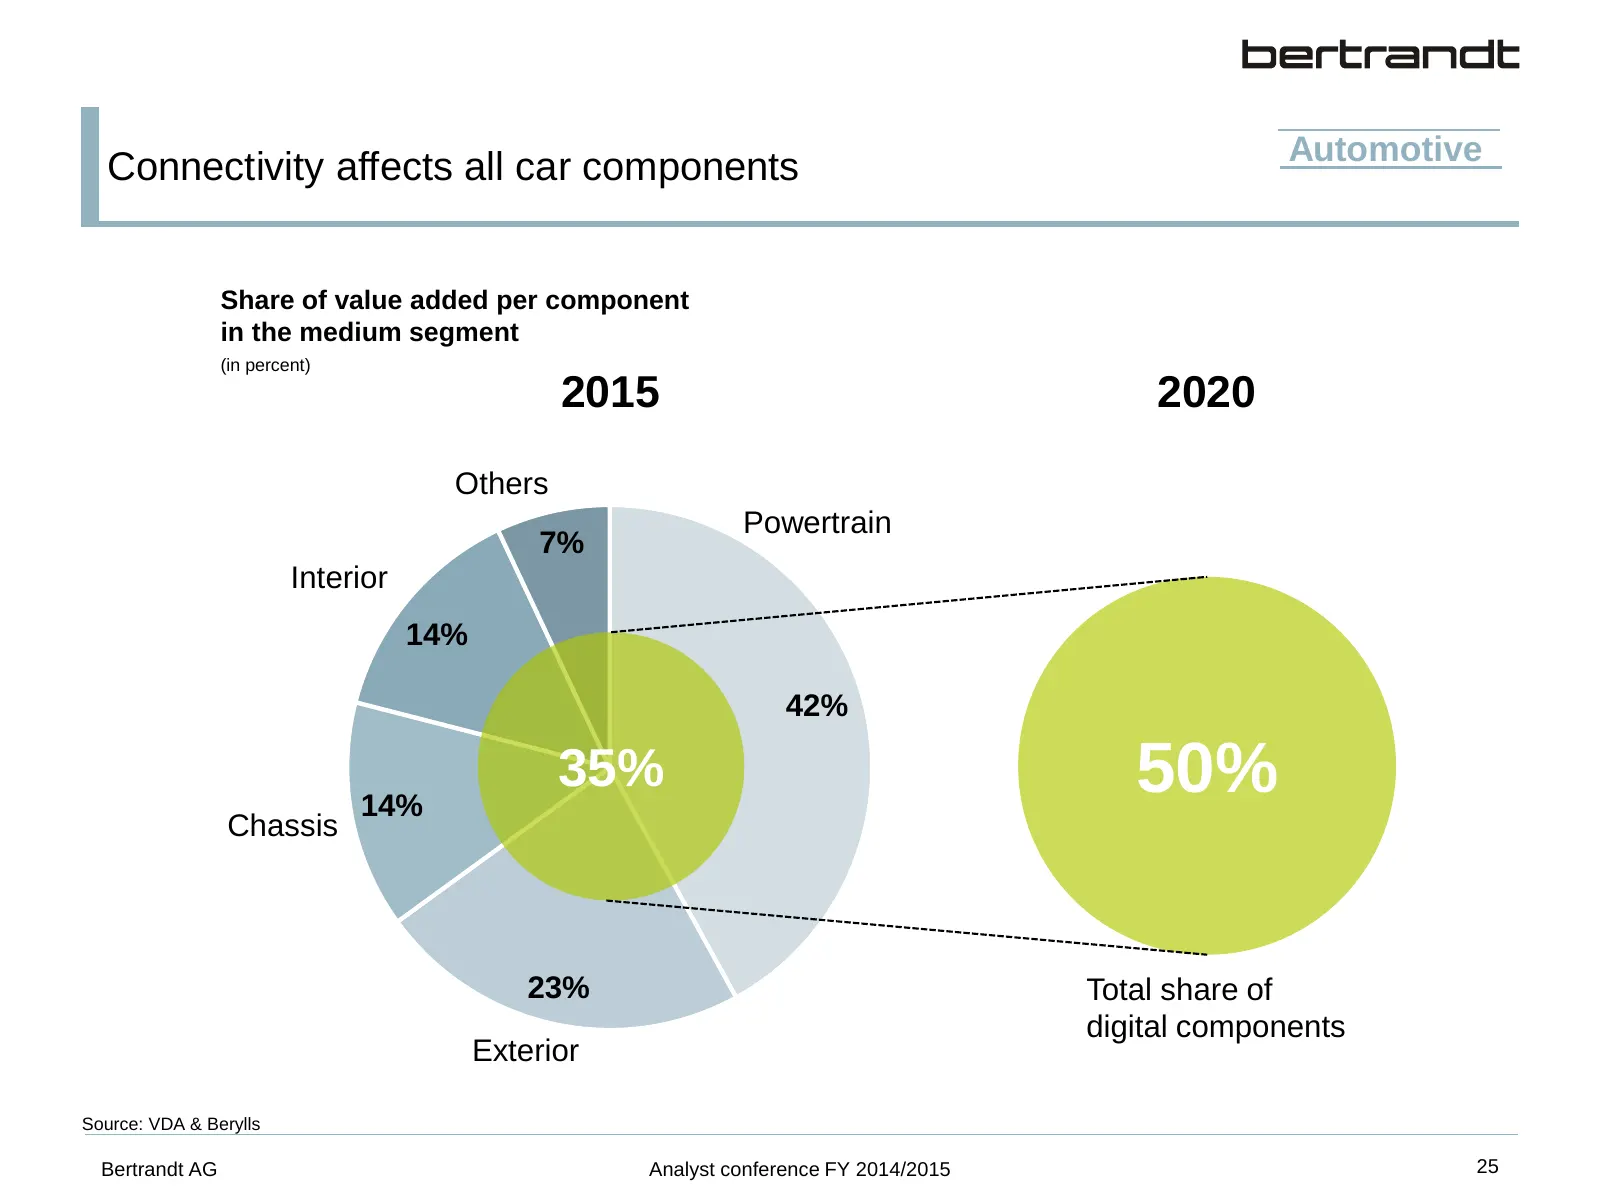
Slide 26: Connectivity affects all car components
Automotive Connectivity affects all car components Share of value added per component in the medium segment (in percent) 2015 2020 Others Powertrain 7% Interior 14% 42% 14% 35% 50% Chassis 23% Total share of digital components Exterior Source: VDA & Berylls Bertrandt AG Analyst conference FY 2014/20
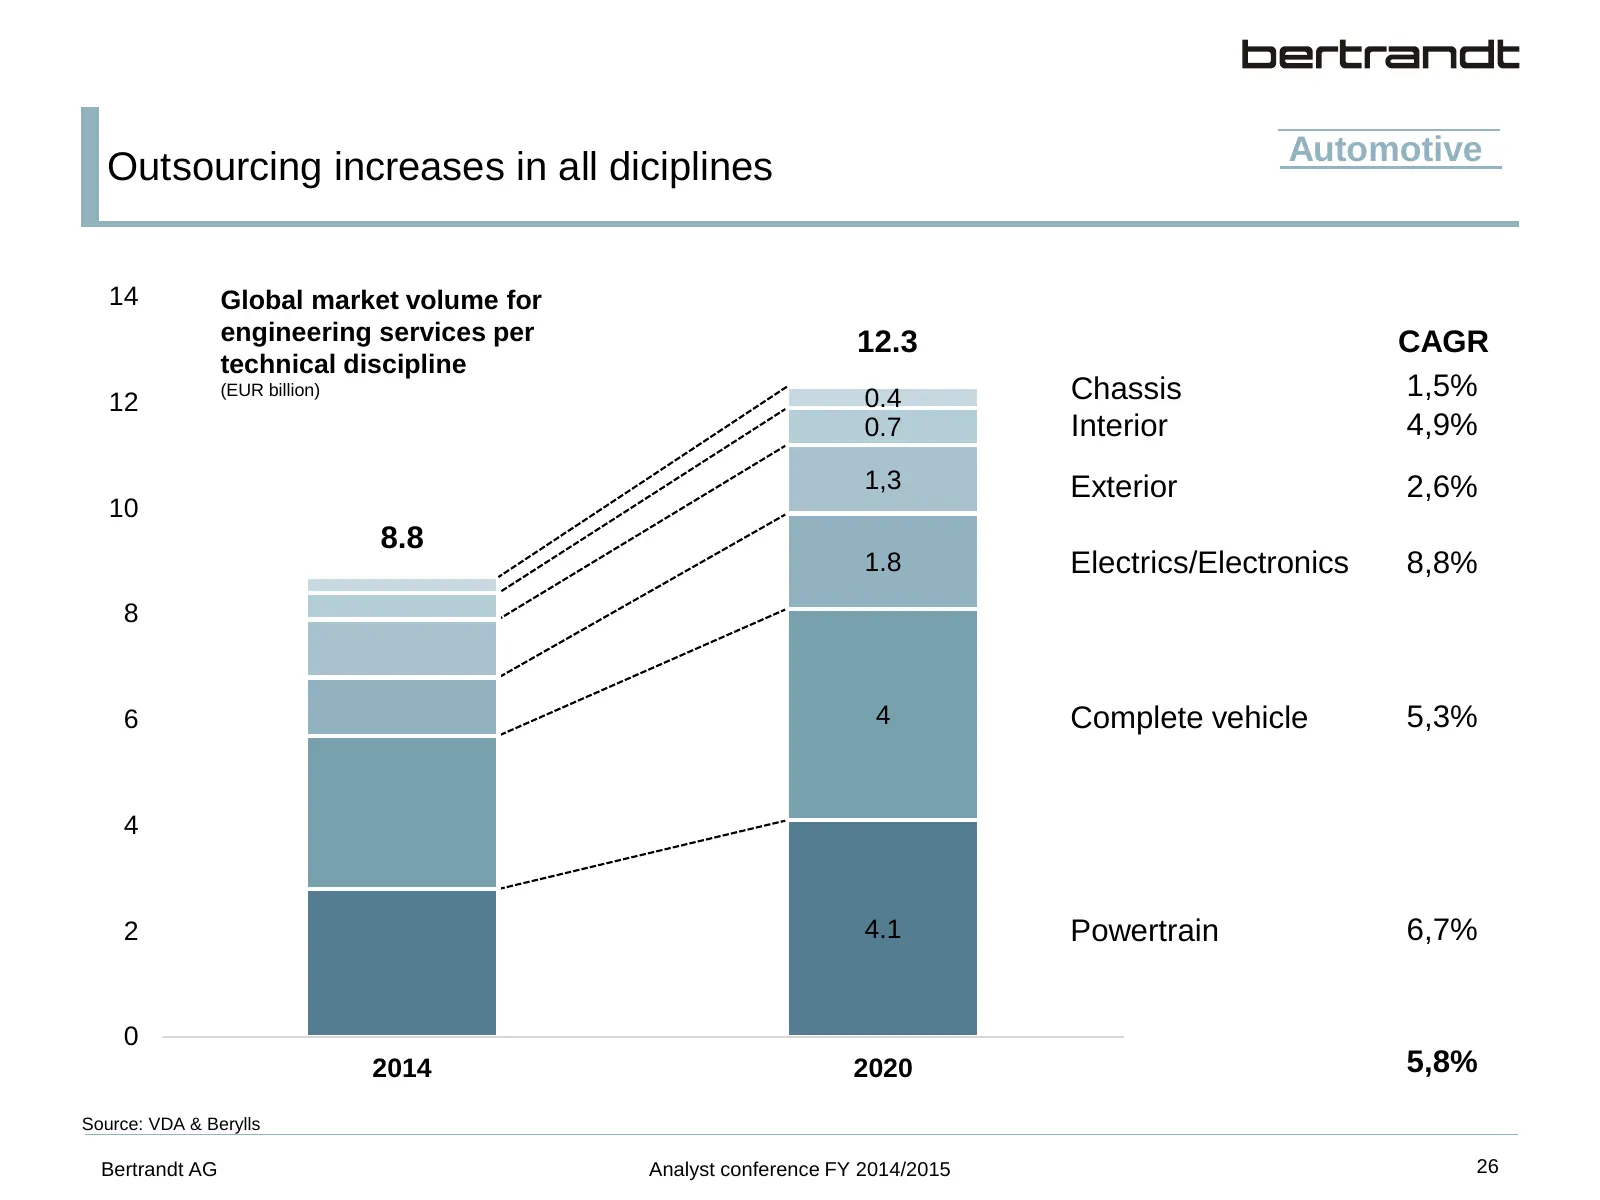
Slide 27: Outsourcing increases in all disciplines
Automotive Outsourcing increases in all diciplines 14 Global market volume for engineering services per 12.3 CAGR technical discipline 12 (EUR billion) 0.4 Chassis 1,5% 0.7 Interior 4,9% 1,3 Exterior 2,6% 10 8.8 1.8 Electrics/Electronics 8,8% 8 6 4 Complete vehicle 5,3% 4 2 4.1 Powertrain 6,7% 0 201
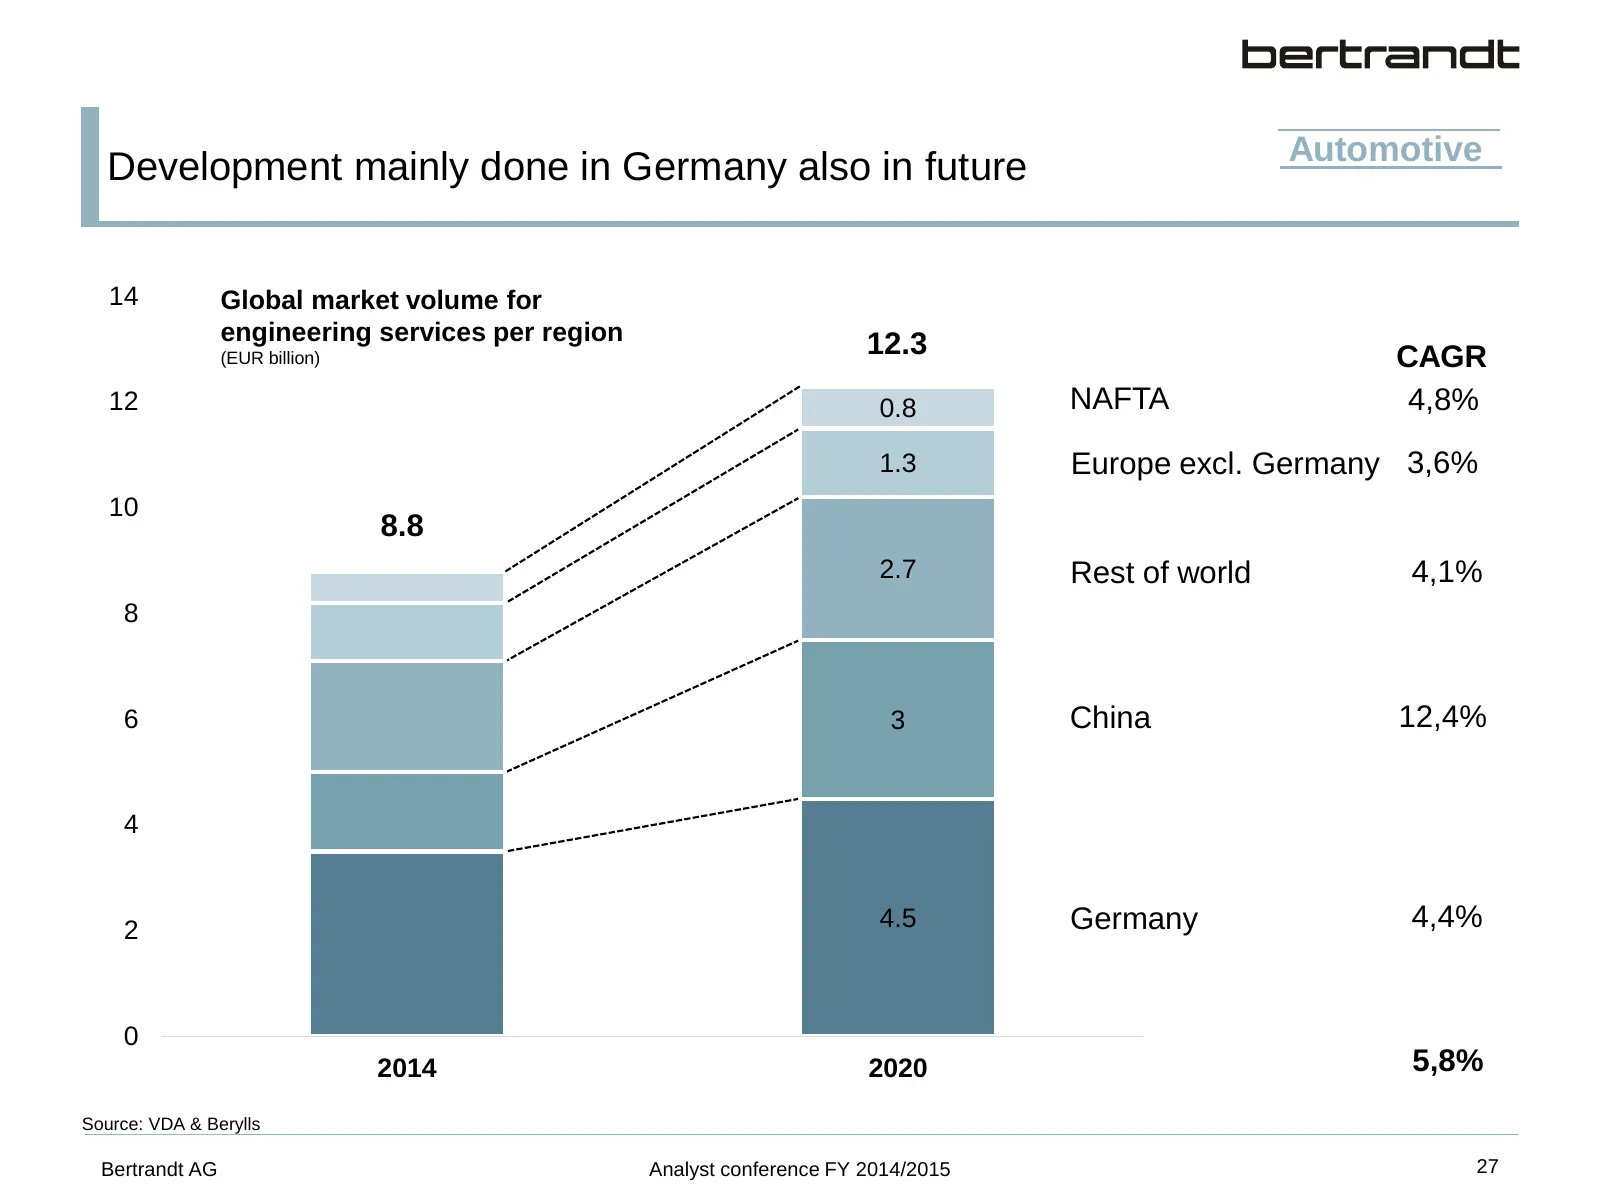
Slide 28: Development mainly done in Germany also in future
Automotive Development mainly done in Germany also in future 14 Global market volume for engineering services per region 12.3 (EUR billion) CAGR 12 0.8 NAFTA 4,8% 1.3 Europe excl. Germany 3,6% 10 8.8 2.7 Rest of world 4,1% 8 6 3 China 12,4% 4 2 4.5 Germany 4,4% 0 2014 2020 5,8% Source: VDA & Berylls
Slide 29: Civil aviation increasing production
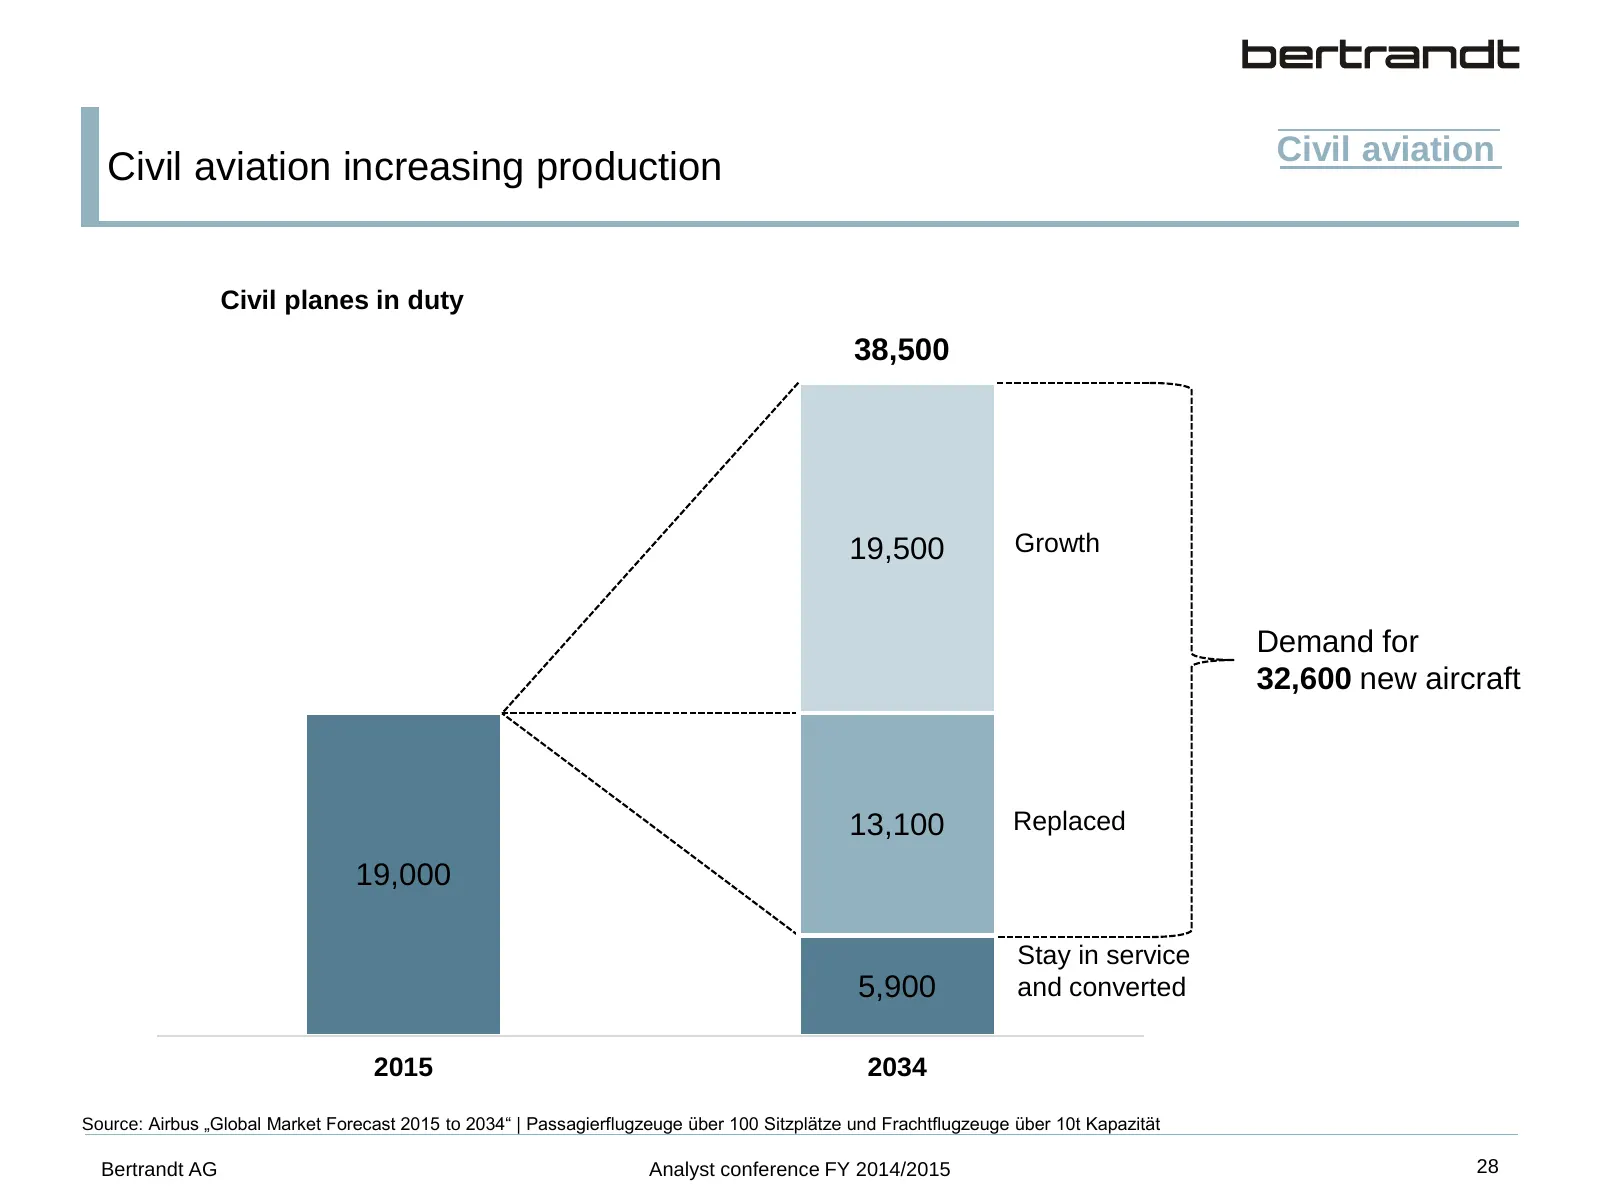
Civil aviation Civil aviation increasing production Civil planes in duty 38,500 19,500 Growth Demand for 32,600 new aircraft 13,100 Replaced 19,000 Stay in service 5,900 and converted 2015 2034 Source: Airbus „Global Market Forecast 2015 to 2034“ | Passagierflugzeuge über 100 Sitzplätze und Frachtfl
Slide 30: Technological key sectors with positive outlook
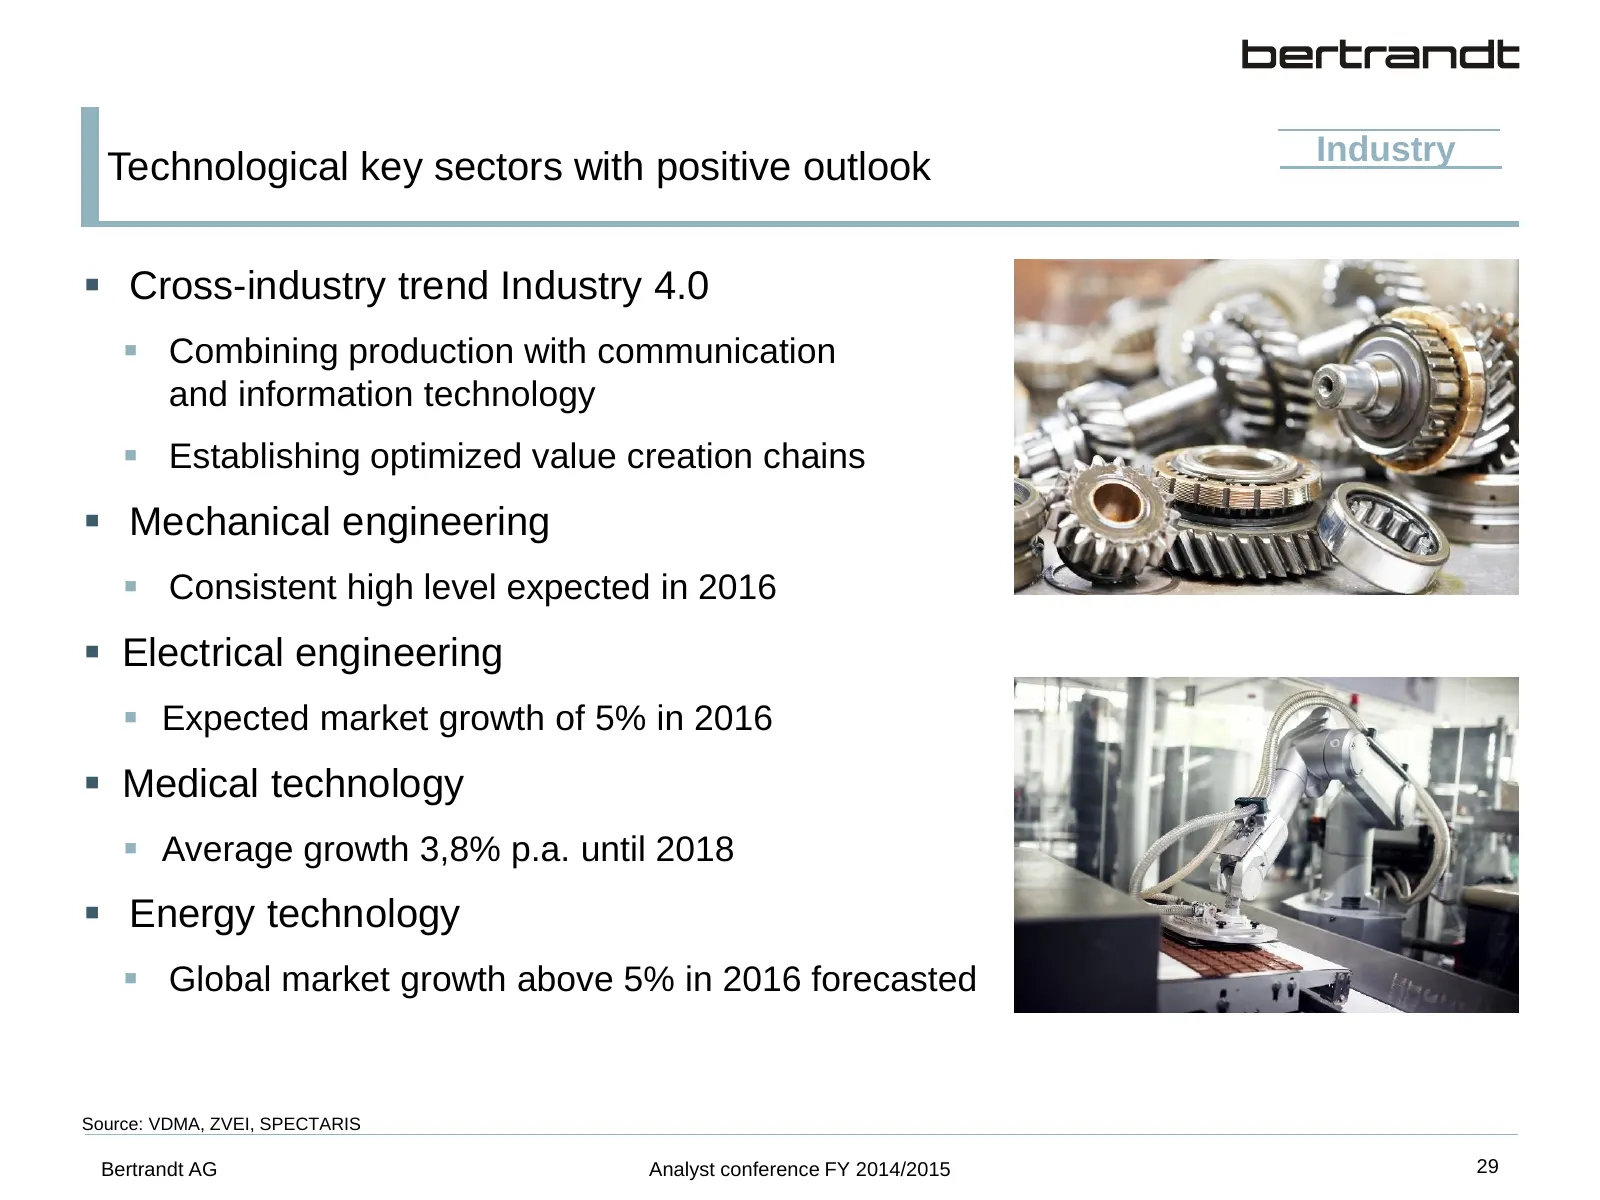
Industry Technological key sectors with positive outlook Cross-industry trend Industry 4.0 Combining production with communication and information technology Establishing optimized value creation chains Mechanical engineering Consistent high level expected in 2016 Electrical engineering
Slide 31: Summary – Outlook FY 2015/2016
Summary – Outlook FY 2015/2016 Attractive prospects in 2016 Continuing expansion of infrastructure, capex at a sustained high level Assuming that underlying economic conditions do not deteriorate, that OEMs invest on a sustained basis in R&D for new technologies and models, that engineering wo

Slide 32: Thank you. We look forward to your questions!
Thank you. We look forward to your questions! Bertrandt AG Analyst conference FY 2014/2015 31
Slide 33: Legal notice
Legal notice This presentation contains inter alia certain foresighted statements about future developments, which are based on current estimates of management. Such statements are subjected to certain risks and uncertainties. If one of these factors of uncertainty or other imponderables should oc
Source: Internet Archive copy of bertrandt.com
More decks from Bertrandt AG
 9M 2025/2026 Earnings Presentation20 slides · Aug 3, 2026
 Investor Day (May 2026)82 slides · May 13, 2026
 H1 2025/2026 Earnings Presentation19 slides · May 13, 2026
 Q1 2025/2026 Earnings Presentation15 slides · Feb 12, 2026
 Investor Presentation (January 2026)61 slides · Jan 12, 2026
 FY2024/2025 Earnings Presentation41 slides · Dec 18, 2025