Danvers Bancorp — Sandler O'Neill & Partners East Coast Financial Services Conference 2010
15 slides from Danvers Bancorp's conference presentation, Nov 12, 2010
Slide 1: Sandler O'Neill & Partners East Coast Financial Services Conference — November 2010
Sandler O’Neill & Partners East Coast Financial Services Conference — November 2010 Kevin T. Bottomley Chairman, Chief Executive Officer & President
Slide 2: Forward-Looking Statements
Forward-Looking Statements Certain statements herein constitute “forward-looking statements” within the meaning of the Private Securities Litigation Reform Act of 1995. These statements are based on the beliefs and expectations of management, as well as the assumptions made using information current
Slide 3: Danversbank History
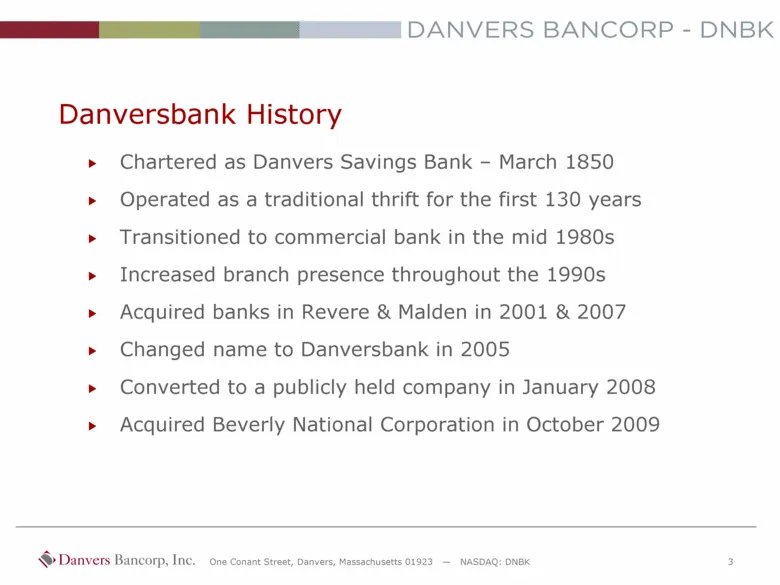
Danversbank History Chartered as Danvers Savings Bank – March 1850 Operated as a traditional thrift for the first 130 years Transitioned to commercial bank in the mid 1980s Increased branch presence throughout the 1990s Acquired banks in Revere & Malden in 2001 & 2007 Changed name to Danversbank in
Slide 4: Total Franchise Highlights
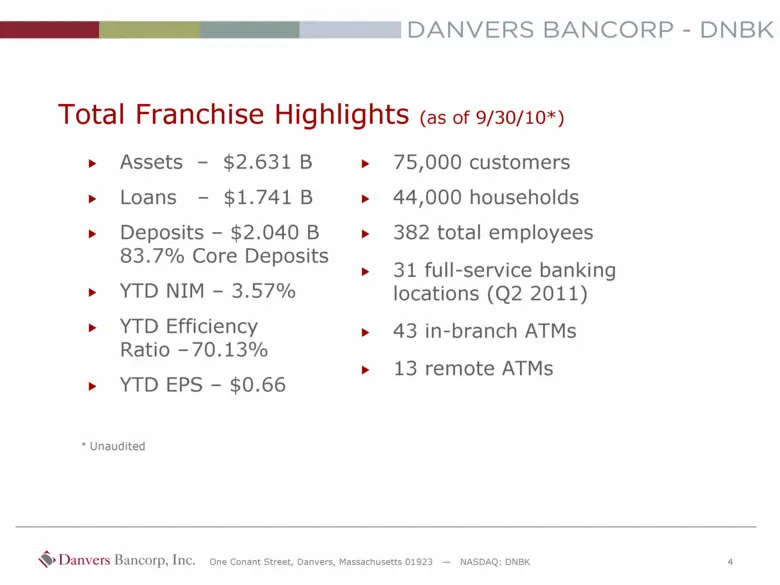
Total Franchise Highlights (as of 9/30/10*) 75,000 customers 44,000 households 382 total employees 31 full-service banking locations (Q2 2011) 43 in-branch ATMs 13 remote ATMs Assets – $2.631 B Loans – $1.741 B Deposits – $2.040 B 83.7% Core Deposits YTD NIM – 3.57% YTD Efficiency Ratio – 70.13% YTD
Slide 5: Upcoming Branch Locations
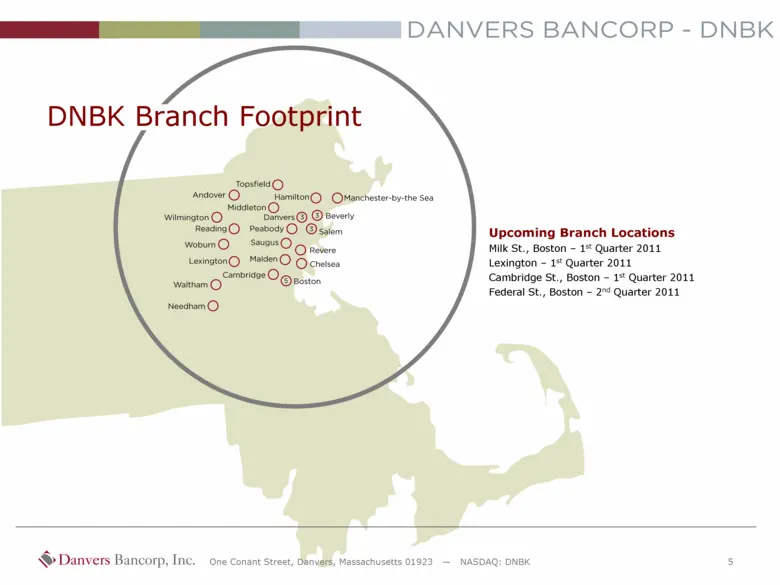
Upcoming Branch Locations Milk St., Boston – 1st Quarter 2011 Lexington – 1st Quarter 2011 Cambridge St., Boston – 1st Quarter 2011 Federal St., Boston – 2nd Quarter 2011 DNBK Branch Footprint One Conant Street, Danvers, Massachusetts 01923 — NASDAQ: DNBK 5
Slide 6: Financial Performance: Asset Growth
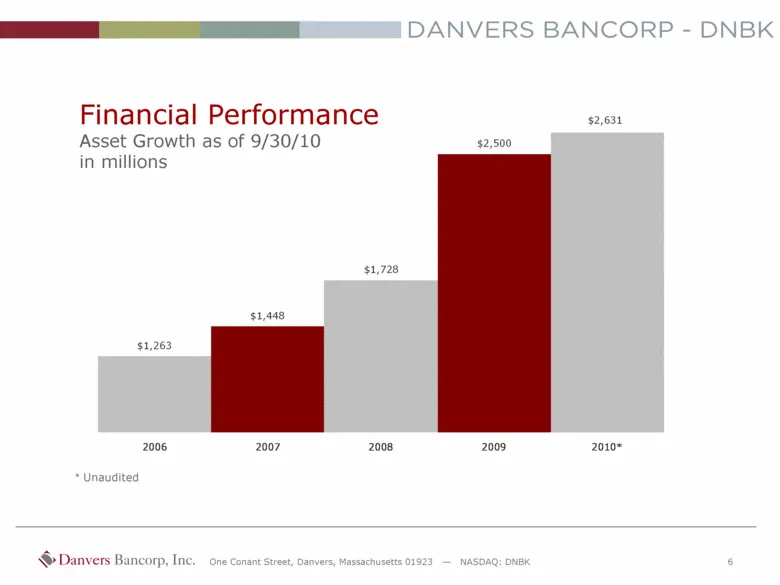
Financial Performance Asset Growth as of 9/30/10 in millions Unaudited $1,263 $1,448 $1,728 $2,500 $2,631 2006 2007 2008 2009 2010*
Slide 7: Financial Performance: Loan Growth
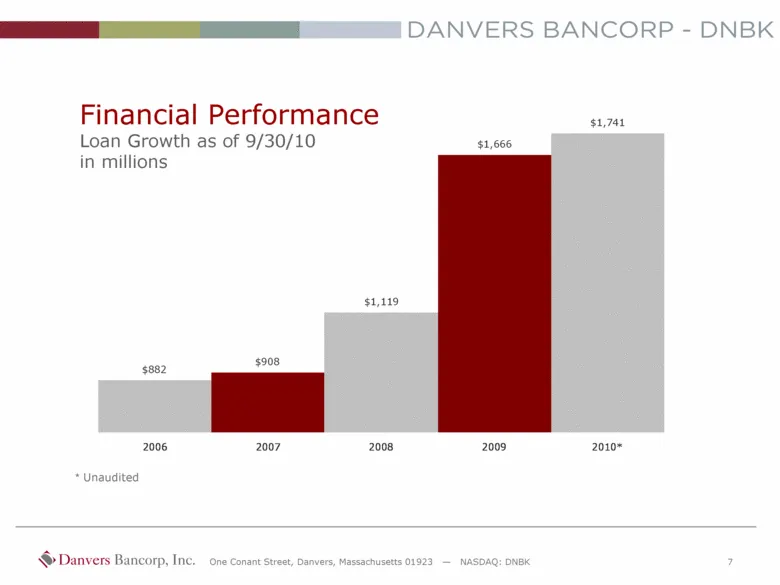
Financial Performance Loan Growth as of 9/30/10 in millions Unaudited $882 $908 $1,119 $1,666 $1,741 2006 2007 2008 2009 2010*
Slide 8: Loan Portfolio Composition
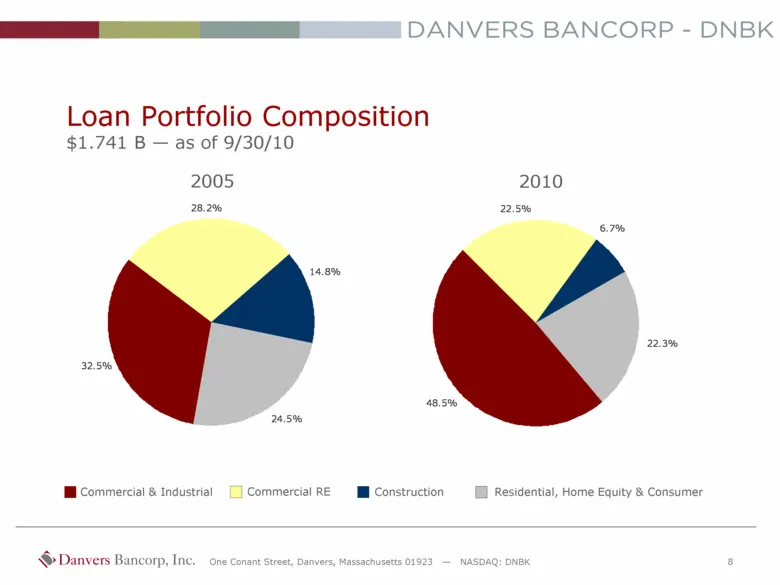
Commercial & Industrial Commercial RE Construction Residential, Home Equity & Consumer 2005 2010 Loan Portfolio Composition $1.741 B — as of 9/30/10 32.5% 28.2% 24.5% 14.8% 48.5% 22.5% 22.3% 6.7%
Slide 9: Asset Quality
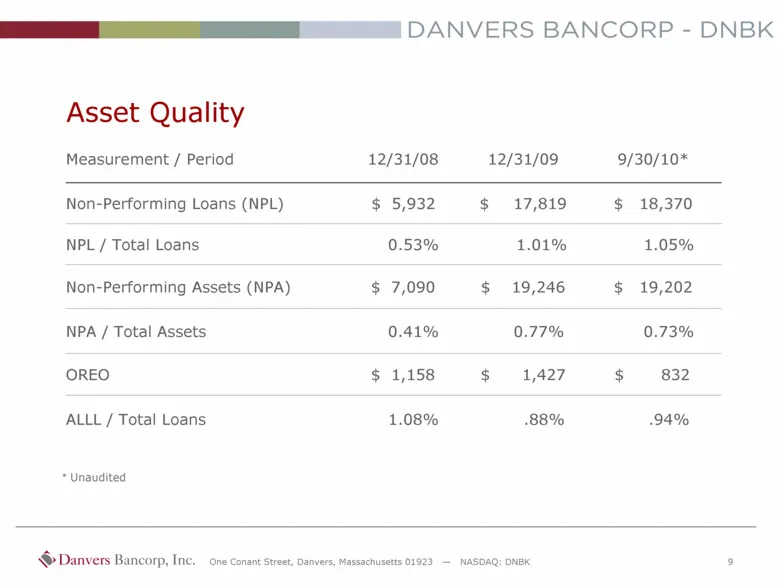
Asset Quality 1.08% $ 1,158 0.41% $ 7,090 0.53% $ 5,932 12/31/08 .94% .88% ALLL / Total Loans $ 832 $ 1,427 OREO 0.73% 0.77% NPA / Total Assets $ 19,202 $ 19,246 Non-Performing Assets (NPA) 1.05% 1.01% NPL / Total Loans $ 18,370 $ 17,819 Non-Performing Loans (NPL) 9/30/10* 12/31/09 Measurement / Per
Slide 10: Financial Performance: Deposit Growth
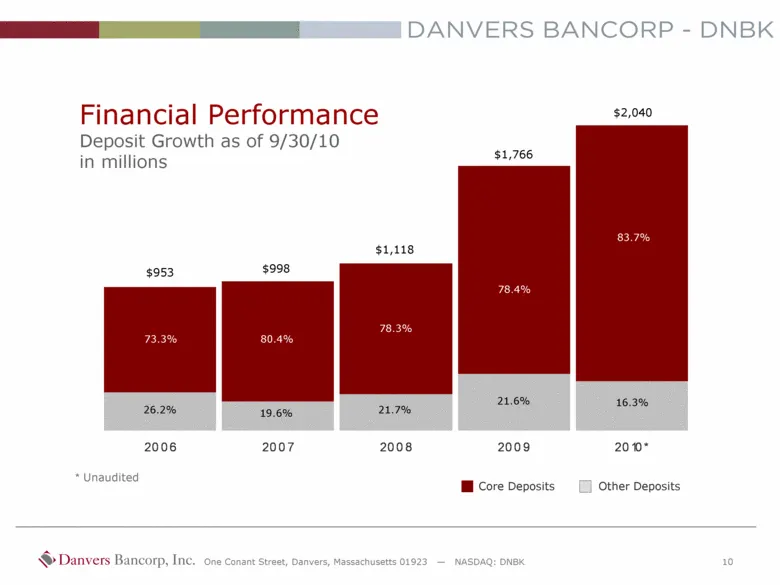
Unaudited Financial Performance Deposit Growth as of 9/30/10 in millions 73.3% 26.2% 80.4% 19.6% 78.3% 21.7% 78.4% 21.6% 83.7% 16.3% $953 $998 $1,118 $1,766 $2,040 Core Deposits Other Deposits 2006 2007 2008 2009 2010*
Slide 11: Financial Performance: Investments
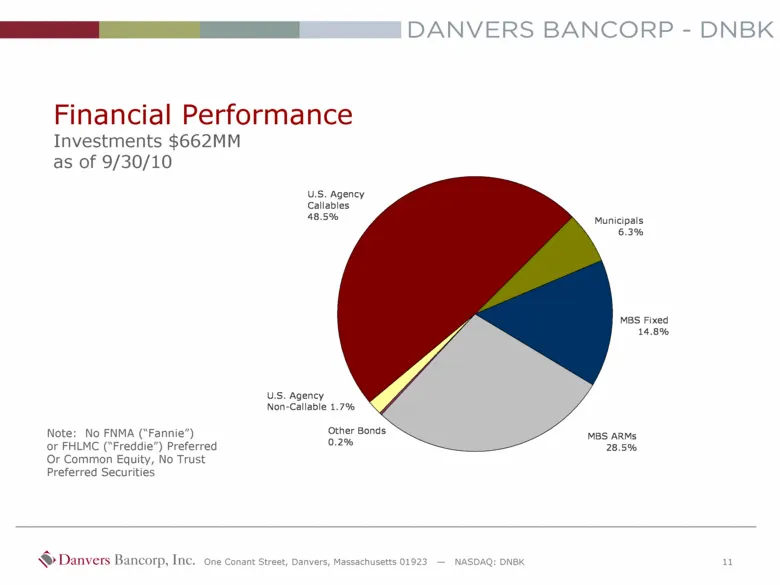
Note: No FNMA (“Fannie”) or FHLMC (“Freddie”) Preferred Or Common Equity, No Trust Preferred Securities Financial Performance Investments $662MM as of 9/30/10 MBS ARMs 28.5% MBS Fixed 14.8% Municipals 6.3% U.S. Agency Non-Callable 1.7% Other Bonds 0.2% U.S. Agency Callables 48.5%
Slide 12: Financial Performance: Earnings per Share
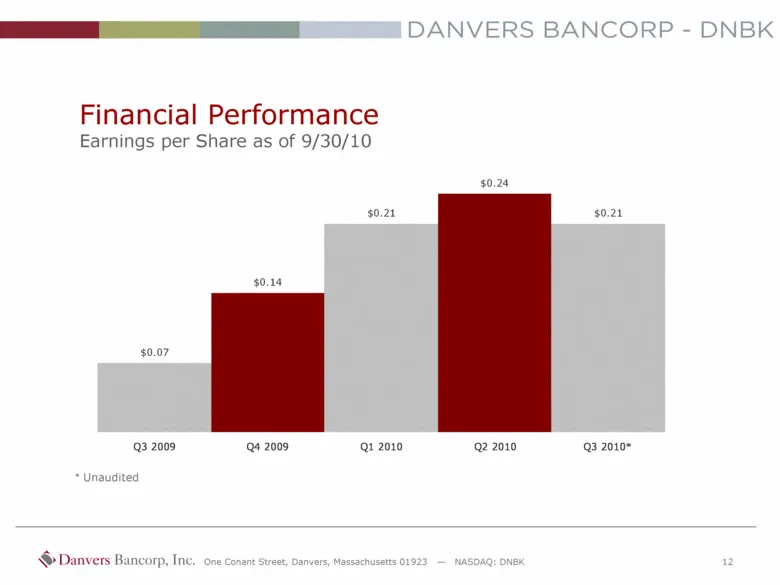
Financial Performance Earnings per Share as of 9/30/10 Unaudited $0.07 $0.14 $0.21 $0.24 $0.21 Q3 2009 Q4 2009 Q1 2010 Q2 2010 Q3 2010*
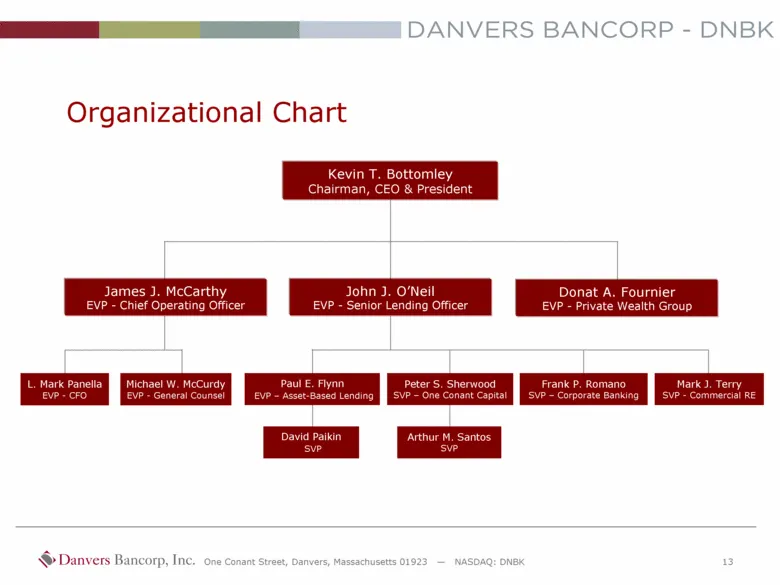
Slide 13: Organizational Chart
Organizational Chart Kevin T. Bottomley Chairman, CEO & President James J. McCarthy EVP - Chief Operating Officer John J. O’Neil EVP - Senior Lending Officer Michael W. McCurdy EVP - General Counsel L. Mark Panella EVP - CFO Donat A. Fournier EVP - Private Wealth Group Peter S. Sherwood SVP – One Co
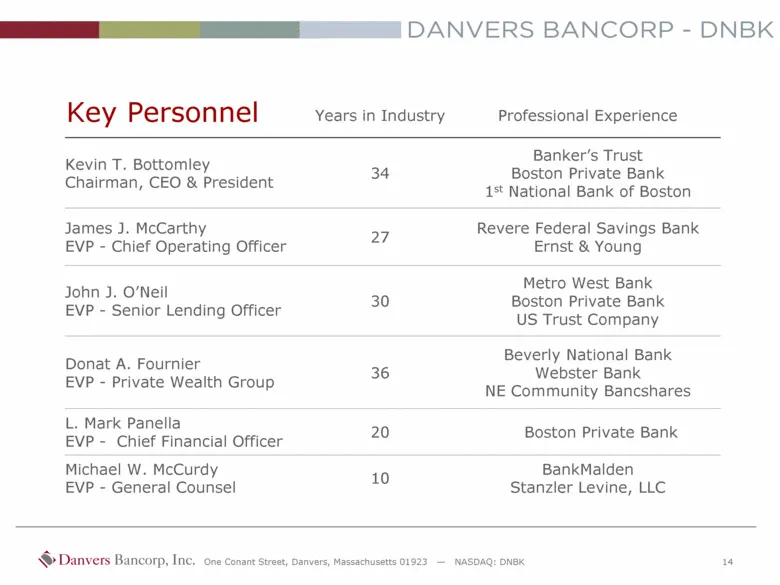
Slide 14: Key Personnel
Key Personnel Banker’s Trust Boston Private Bank 1st National Bank of Boston 34 Kevin T. Bottomley Chairman, CEO & President 10 20 36 30 27 Years in Industry BankMalden Stanzler Levine, LLC Michael W. McCurdy EVP - General Counsel Boston Private Bank L. Mark Panella EVP - Chief Financial Officer Bev
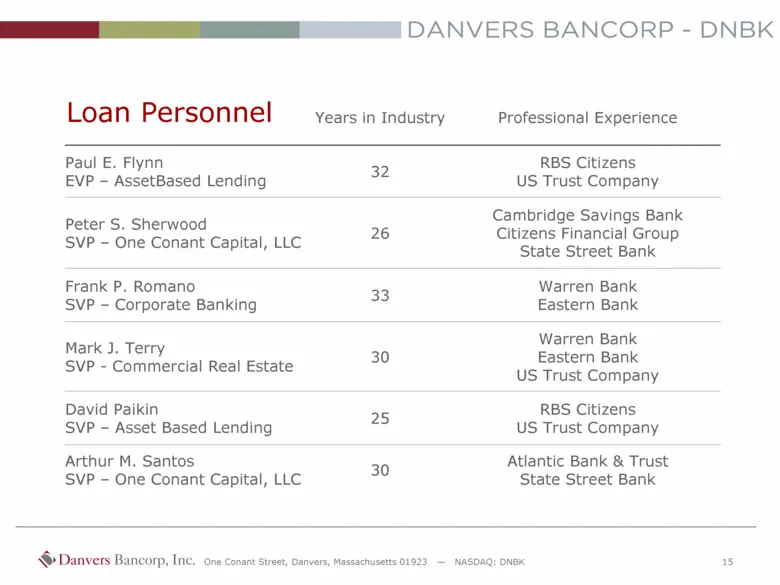
Slide 15: Loan Personnel
Loan Personnel Atlantic Bank & Trust State Street Bank 30 Arthur M. Santos SVP – One Conant Capital, LLC 25 30 33 26 32 Years in Industry RBS Citizens US Trust Company David Paikin SVP – Asset Based Lending Warren Bank Eastern Bank US Trust Company Mark J. Terry SVP - Commercial Real Estate Warren B
Source: SEC EDGAR · 8-K filed Nov 12, 2010
More decks from Danvers Bancorp Inc
 Q1 2011 Earnings Presentation29 slides · Jun 7, 2011
 Merger or Acquisition (May 2011)26 slides · May 17, 2011
 Q1 2011 Earnings Presentation20 slides · Apr 21, 2011
 KBW Boston Bank Conference 201128 slides · Mar 1, 2011
 Q4 2010 Earnings Presentation41 slides · Jan 21, 2011
 Investor Presentation (February 2010)16 slides · Feb 18, 2010