Evonik Industries AG · XETR:EVK
Evonik Industries — Investor Presentation (February 2017)
95 slides from Evonik Industries's investor presentation, February 2017
Slide 1: Evonik Company Presentation February 2017
Evonik Power to create. Company Presentation February 2017 1
Slide 2: Table of contents
Table of contents 1. Strategic update and current trading 2. Evonik at a glance 3. Acquisition of Huber Silica 4. Financials Q3 2016 5. Appendix 2
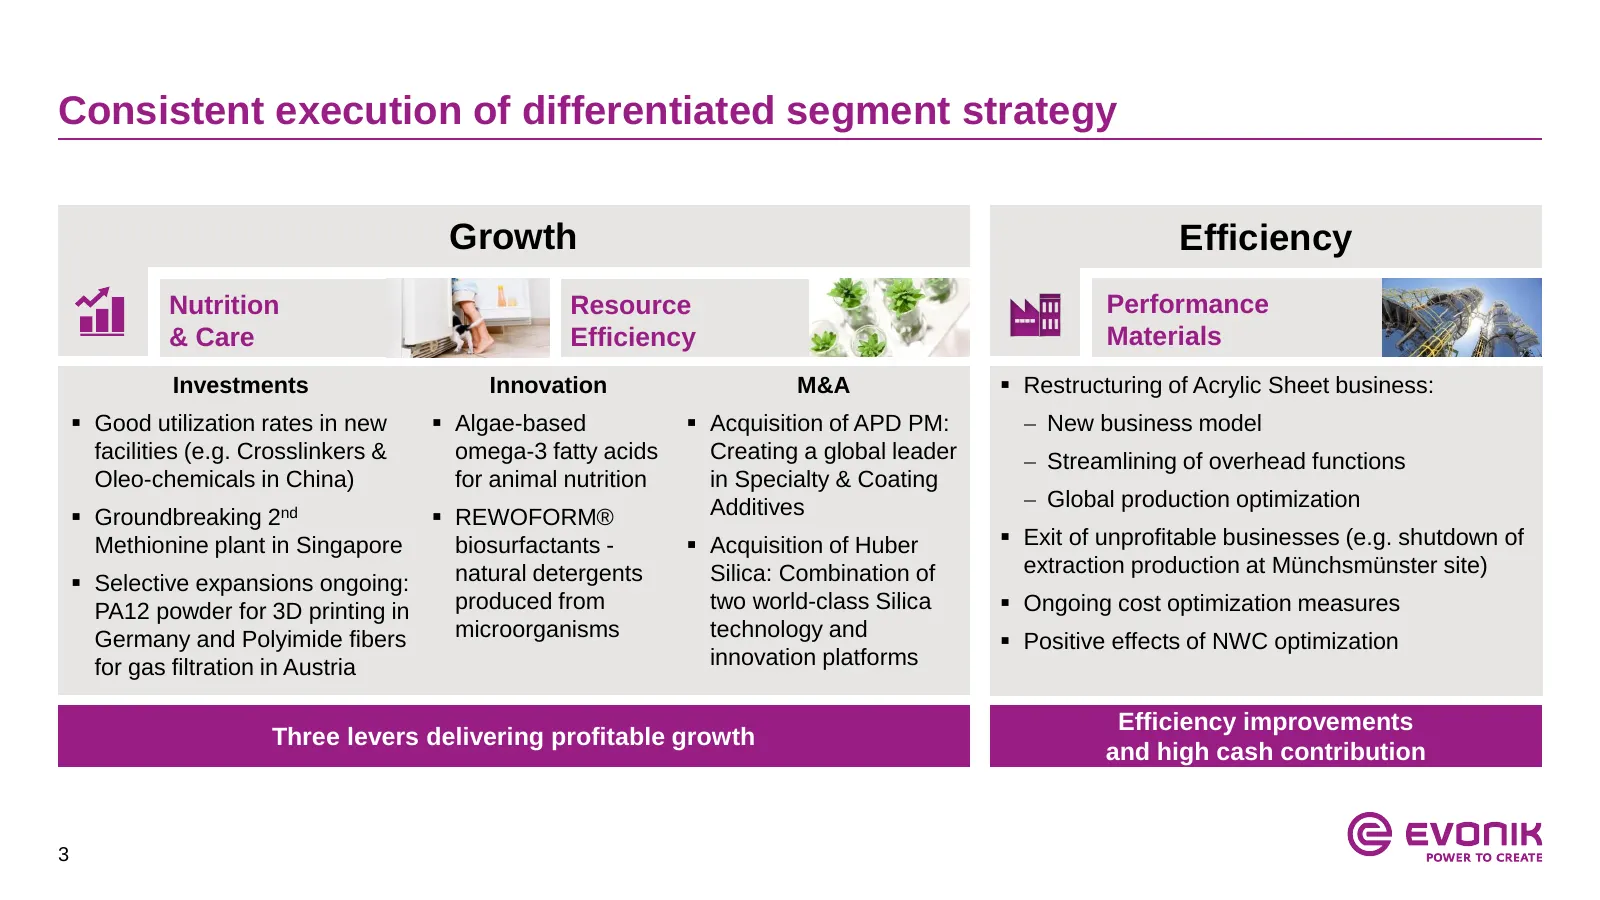
Slide 3: Consistent execution of differentiated segment strategy
Consistent execution of differentiated segment strategy Growth Efficiency Nutrition Resource Performance & Care Efficiency Materials Investments Innovation M&A Restructuring of Acrylic Sheet business: Good utilization rates in new Algae-based Acquisition of APD PM: New business model facil
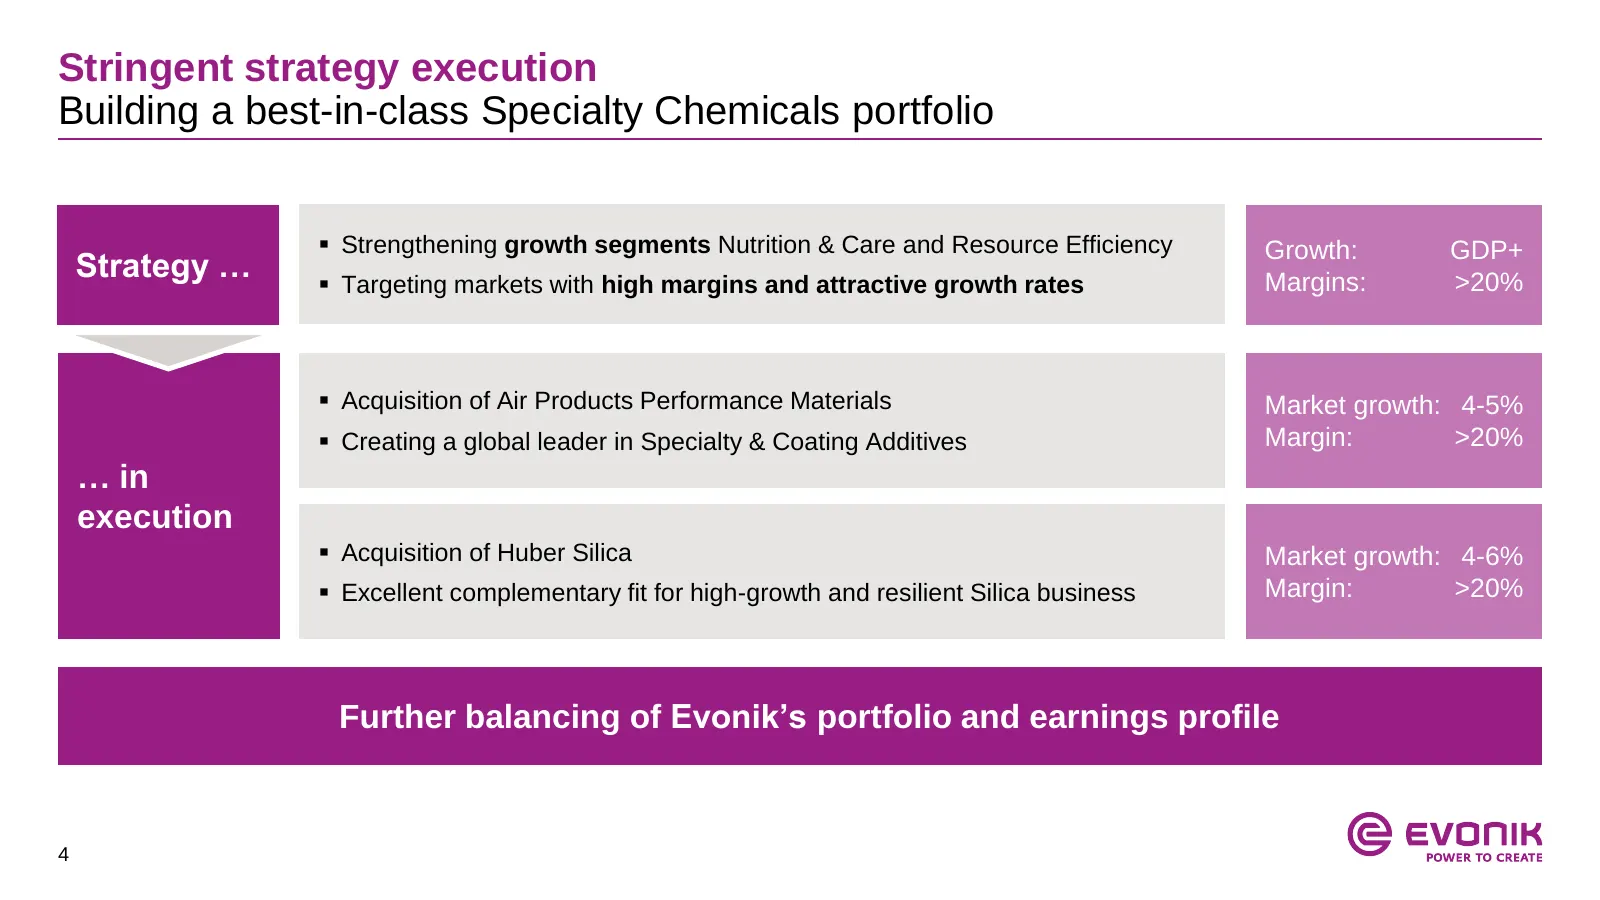
Slide 4: Stringent strategy execution
Stringent strategy execution Building a best-in-class Specialty Chemicals portfolio Strengthening growth segments Nutrition & Care and Resource Efficiency Growth: GDP+ Strategy … Targeting markets with high margins and attractive growth rates Margins: >20% Acquisition of Air Products Performan
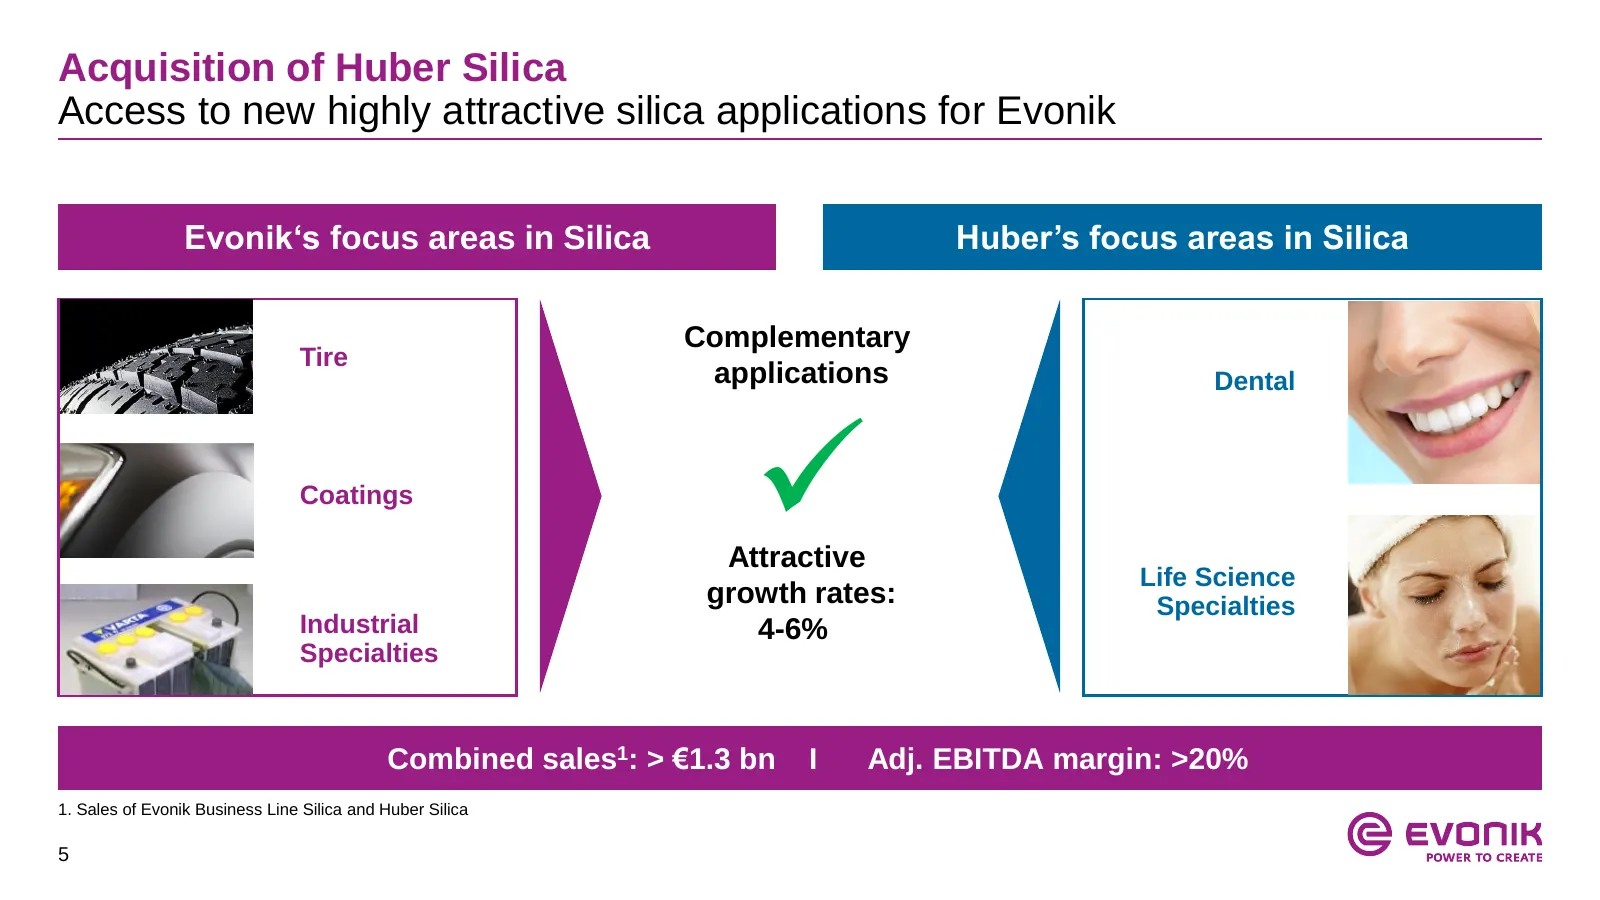
Slide 5: Acquisition of Huber Silica
Acquisition of Huber Silica Access to new highly attractive silica applications for Evonik Evonik‘s focus areas in Silica Huber’s focus areas in Silica Complementary Tire applications Dental Coatings Attractive growth rates: Life Science Specialties Industrial 4-6% Specialties Combined sales1: > €
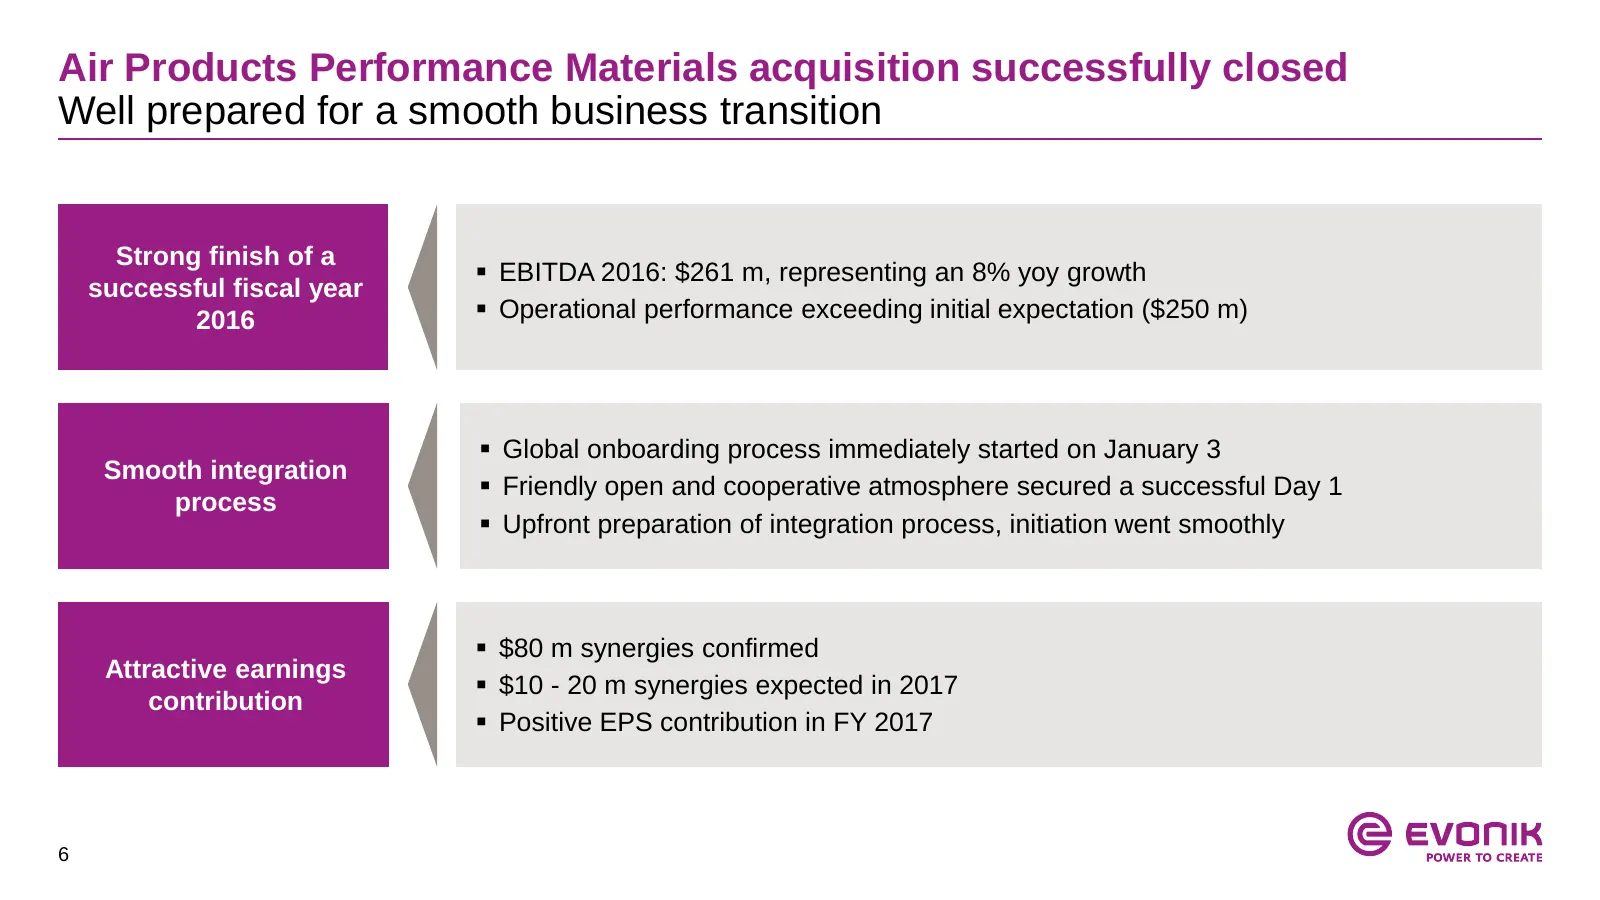
Slide 6: Air Products Performance Materials acquisition successfully closed
Air Products Performance Materials acquisition successfully closed Well prepared for a smooth business transition Strong finish of a EBITDA 2016: $261 m, representing an 8% yoy growth successful fiscal year 2016 Operational performance exceeding initial expectation ($250 m) Global onboarding p
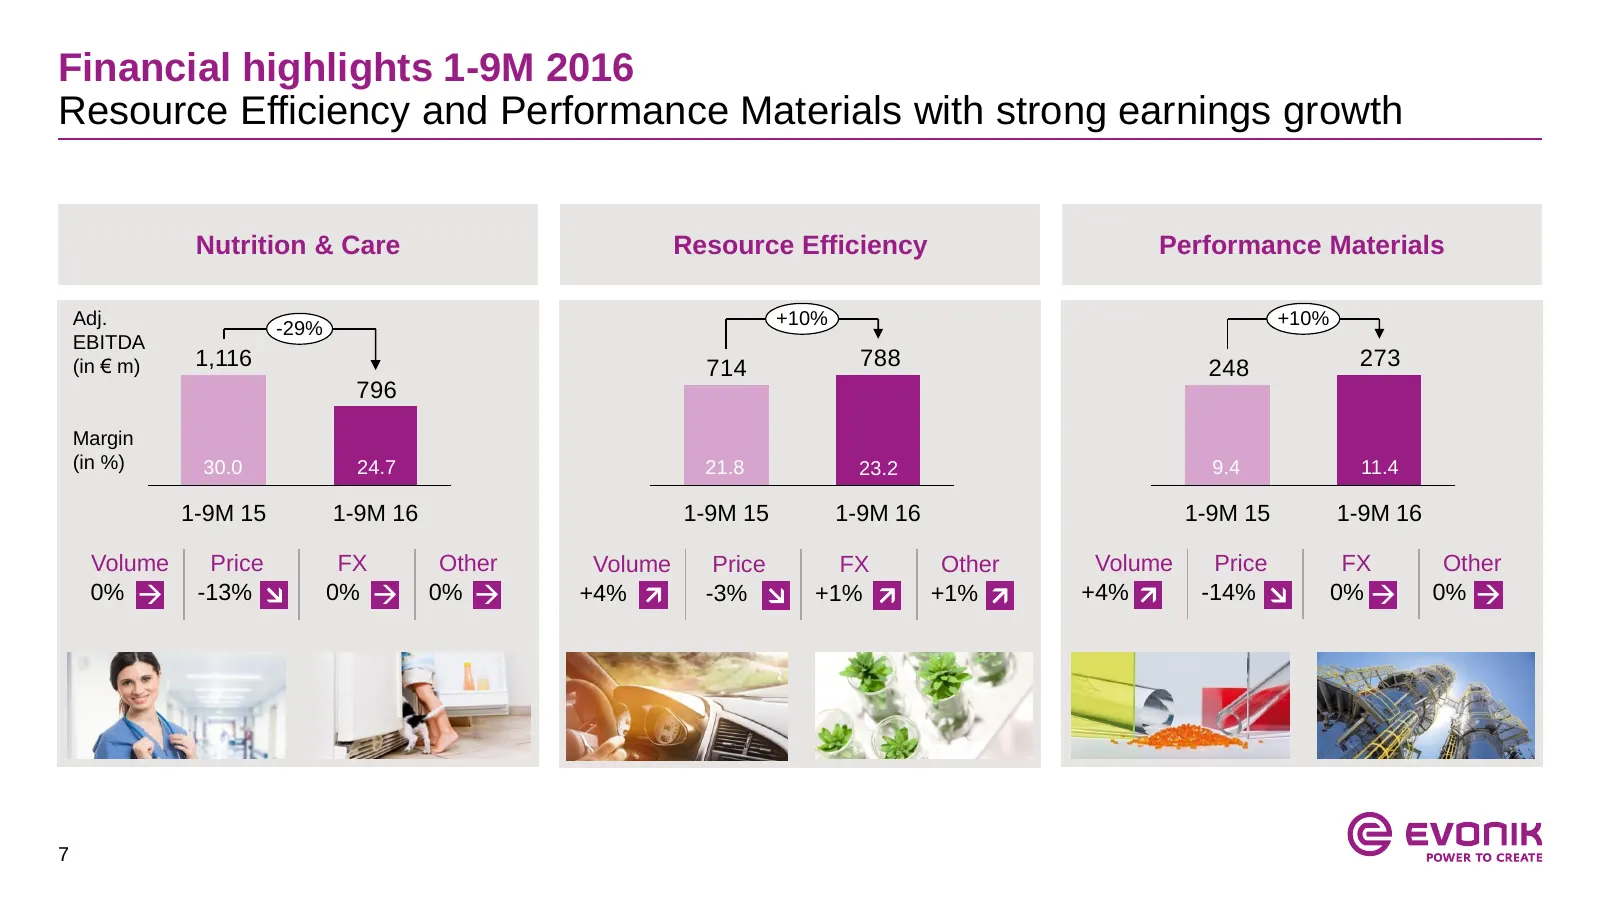
Slide 7: Financial highlights 1-9M 2016
Financial highlights 1-9M 2016 Resource Efficiency and Performance Materials with strong earnings growth Nutrition & Care Resource Efficiency Performance Materials Adj. +10% +10% -29% EBITDA (in € m) 1,116 714 788 248 273 796 Margin (in %) 30.0 24.7 21.8 23.2 9.4 11.4 1-9M 15 1-9M 16 1-9M 15 1-9M 16
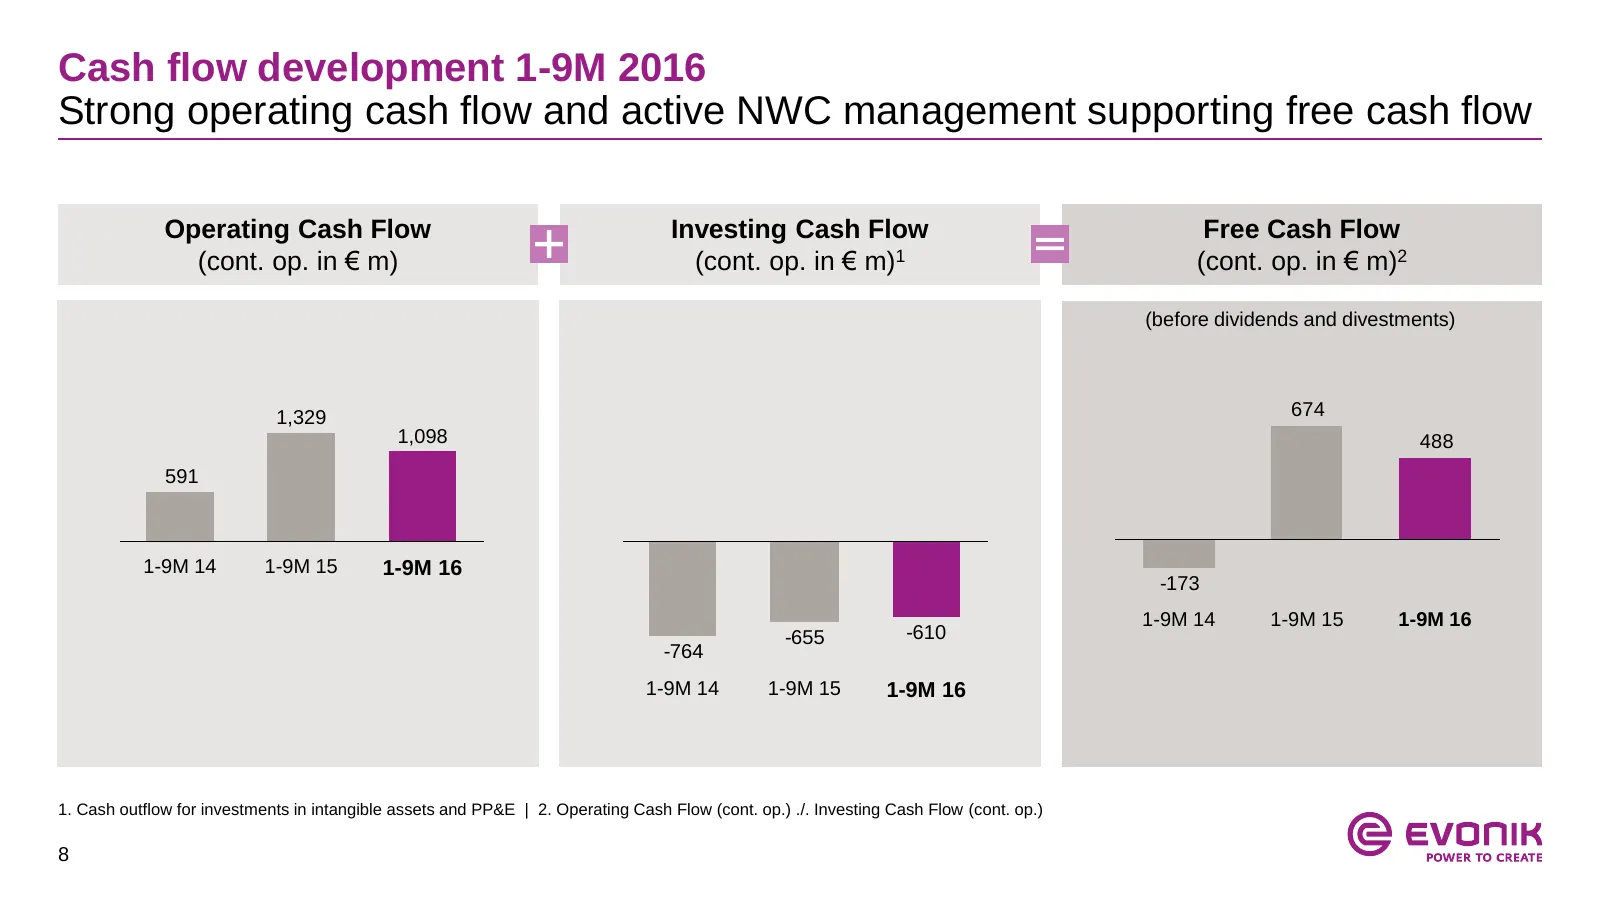
Slide 8: Cash flow development 1-9M 2016
Cash flow development 1-9M 2016 Strong operating cash flow and active NWC management supporting free cash flow Operating Cash Flow Investing Cash Flow Free Cash Flow (cont. op. in € m) (cont. op. in € m)1 (cont. op. in € m)2 (before dividends and divestments) 1,329 674 1,098 488 591 1-9M 14 1-9M 15
Slide 9: Outlook for 2016 reiterated
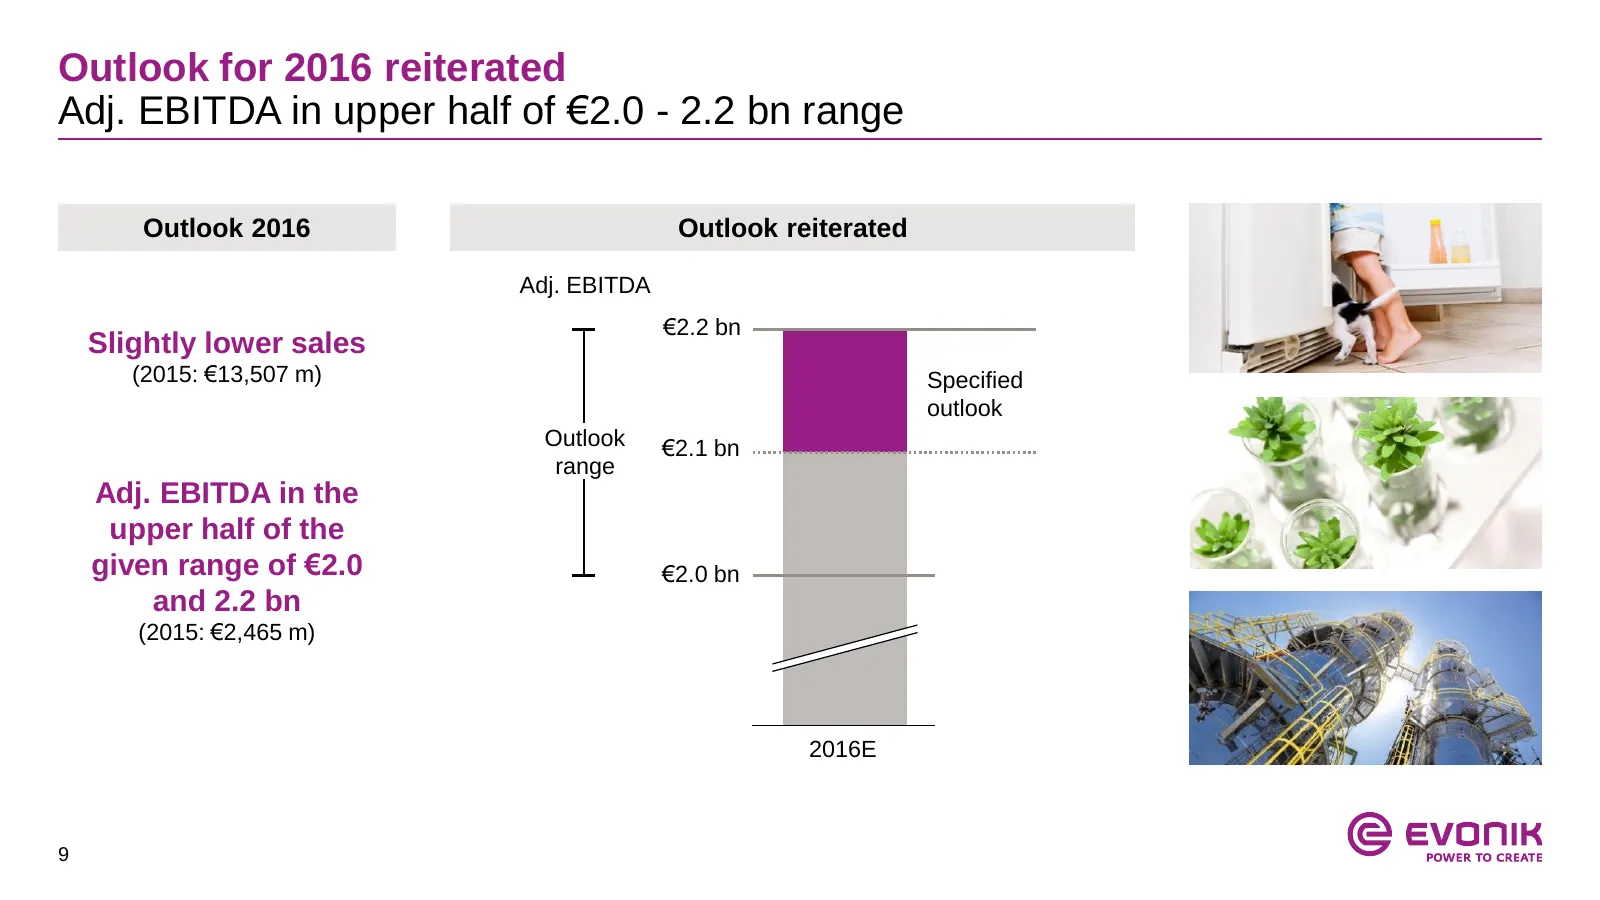
Outlook for 2016 reiterated Adj. EBITDA in upper half of €2.0 - 2.2 bn range Outlook 2016 Outlook reiterated Adj. EBITDA €2.2 bn Slightly lower sales (2015: €13,507 m) Specified outlook Outlook €2.1 bn range Adj. EBITDA in the upper half of the given range of €2.0 €2.0 bn and 2.2 bn (2015: €2,465 m)
Slide 10: Strong business fundamentals
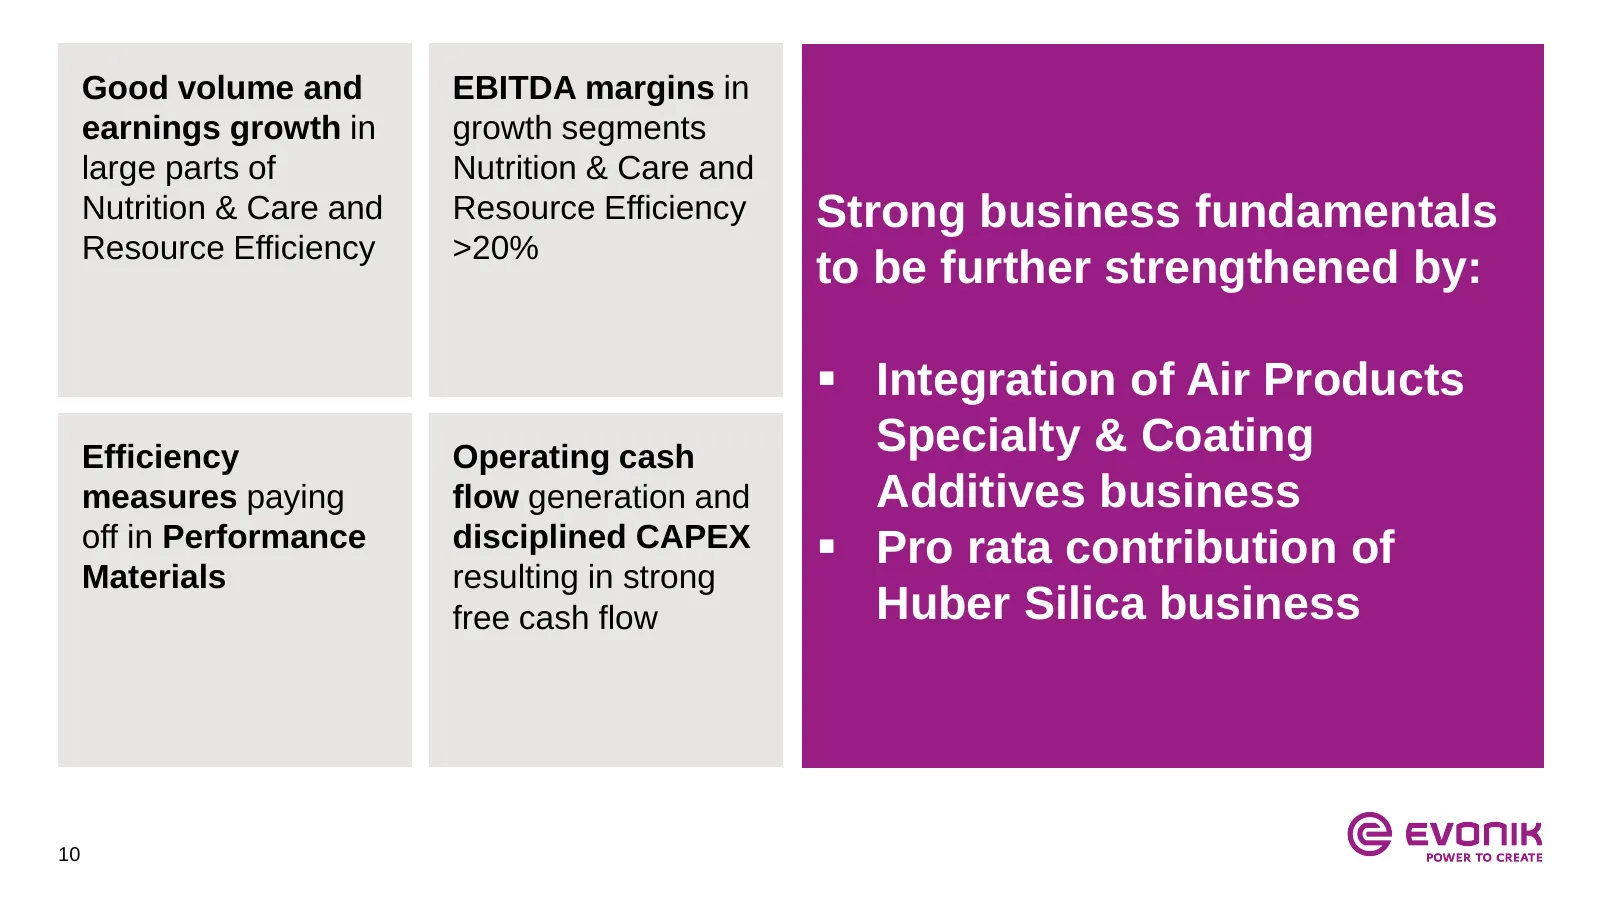
Good volume and EBITDA margins in earnings growth in growth segments large parts of Nutrition & Care and Nutrition & Care and Resource Efficiency Strong business fundamentals Resource Efficiency >20% to be further strengthened by: Integration of Air Products Efficiency Operating cash Specialty & C
Slide 11: Table of contents
Table of contents 1. Strategic update and current trading 2. Evonik at a glance 3. Acquisition of Huber Silica 4. Financials Q3 2016 5. Appendix 11
Slide 12: Leading in Specialty Chemicals
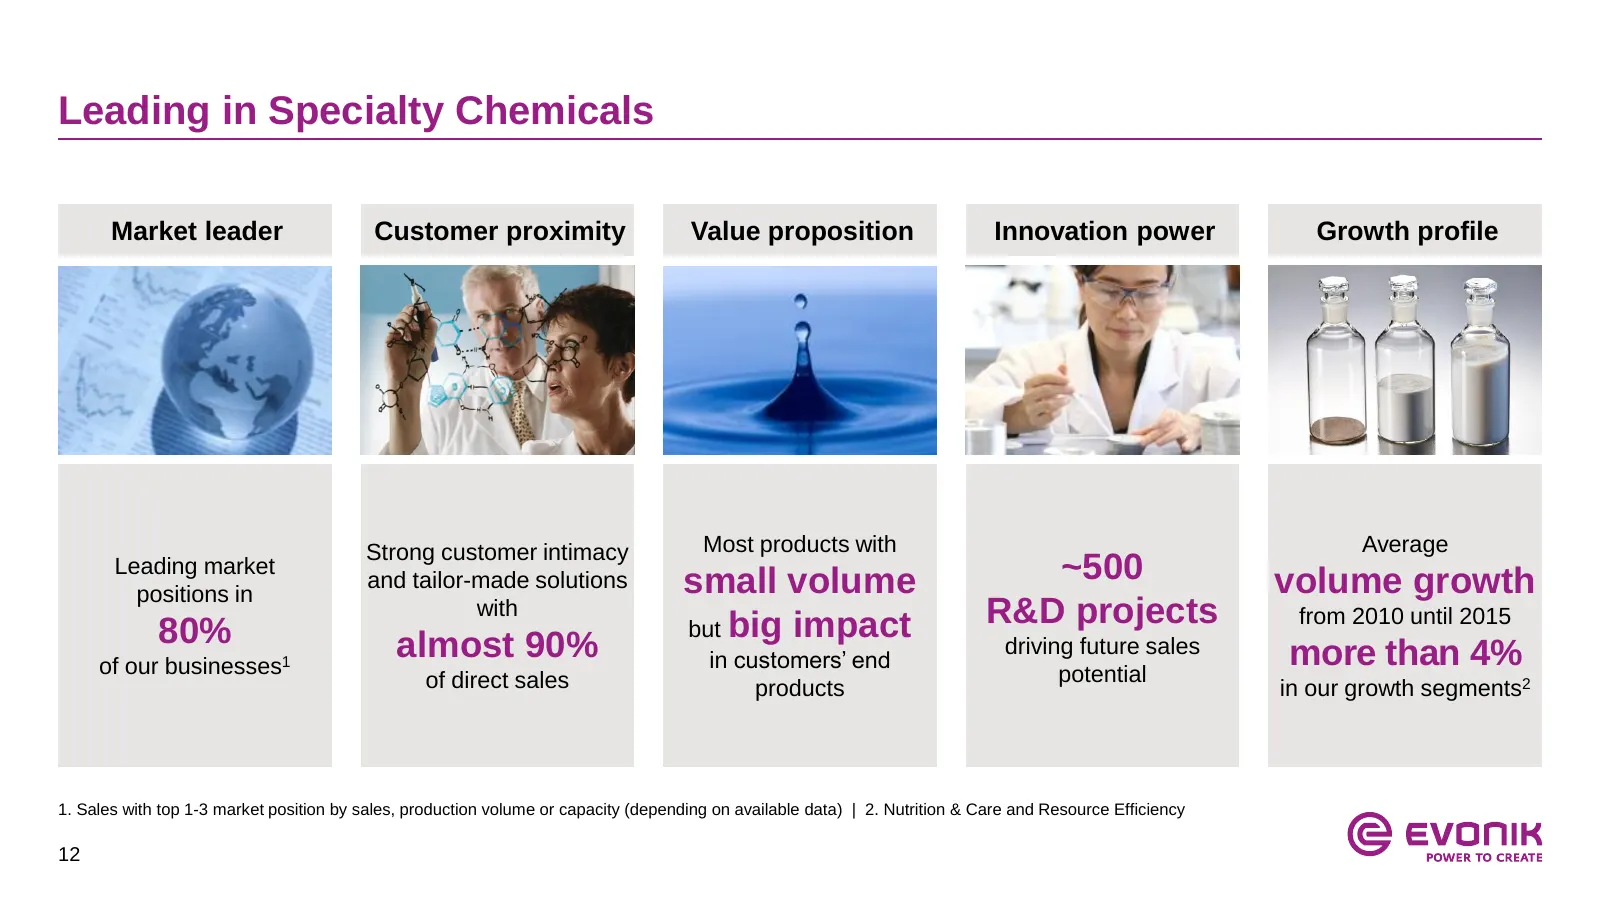
Leading in Specialty Chemicals Market leader Customer proximity Value proposition Innovation power Growth profile Strong customer intimacy Most products with Average Leading market and tailor-made solutions small volume ~500 volume growth positions in with but big impact R&D projects from 2010 until
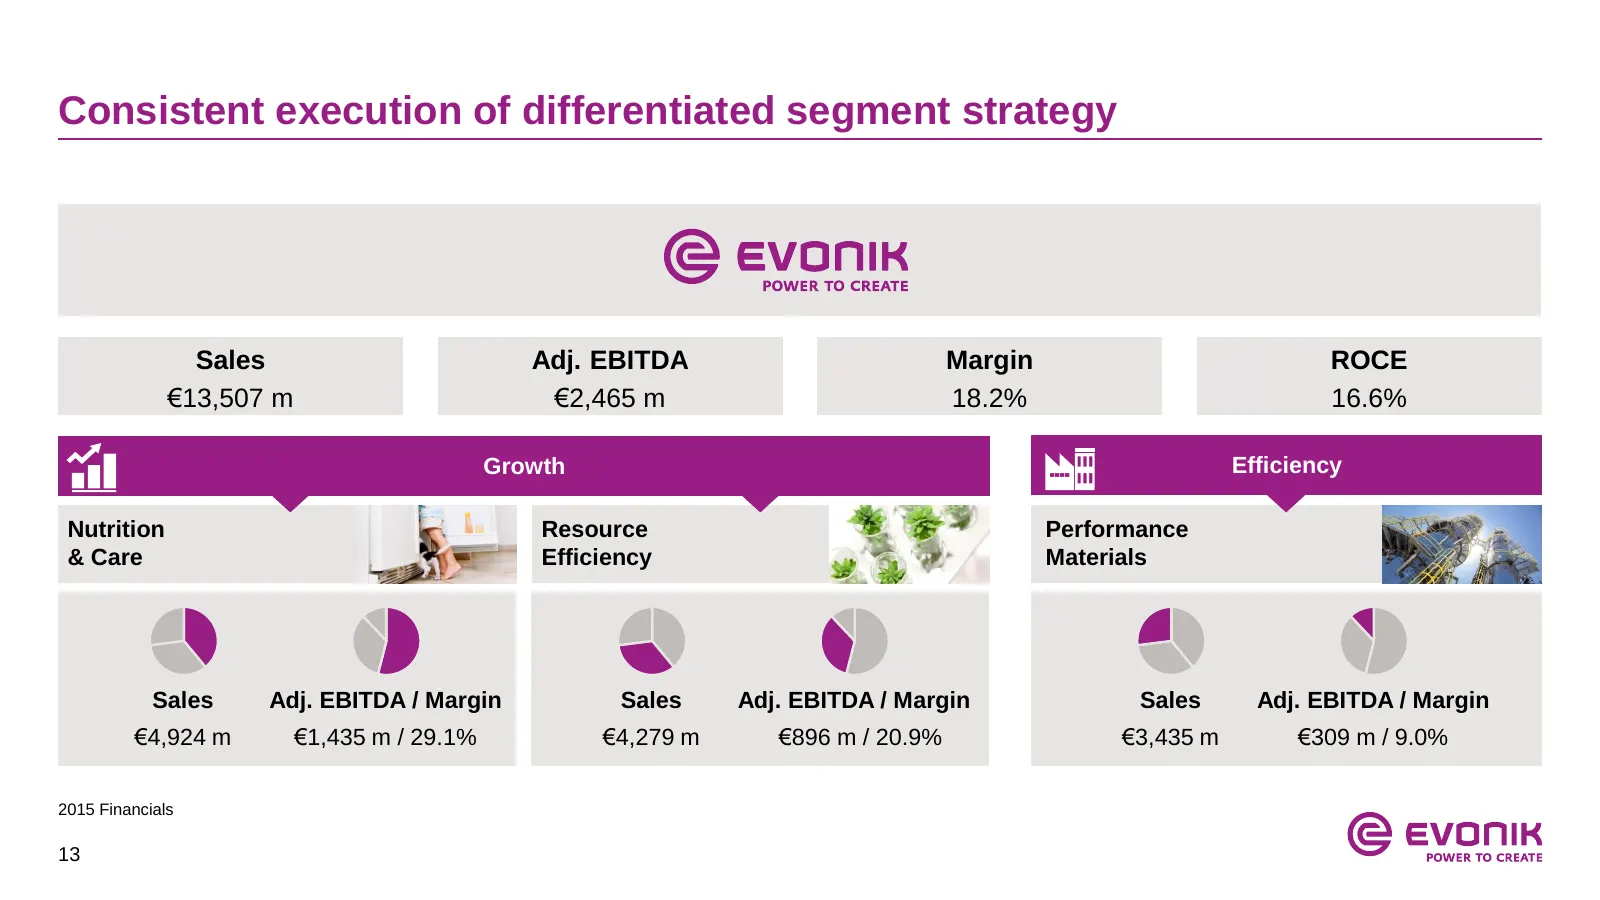
Slide 13: Consistent execution of differentiated segment strategy
Consistent execution of differentiated segment strategy Sales Adj. EBITDA Margin ROCE €13,507 m €2,465 m 18.2% 16.6% Growth Efficiency Nutrition Resource Performance & Care Efficiency Materials Sales Adj. EBITDA / Margin Sales Adj. EBITDA / Margin Sales Adj. EBITDA / Margin €4,924 m €1,435 m / 29.1%
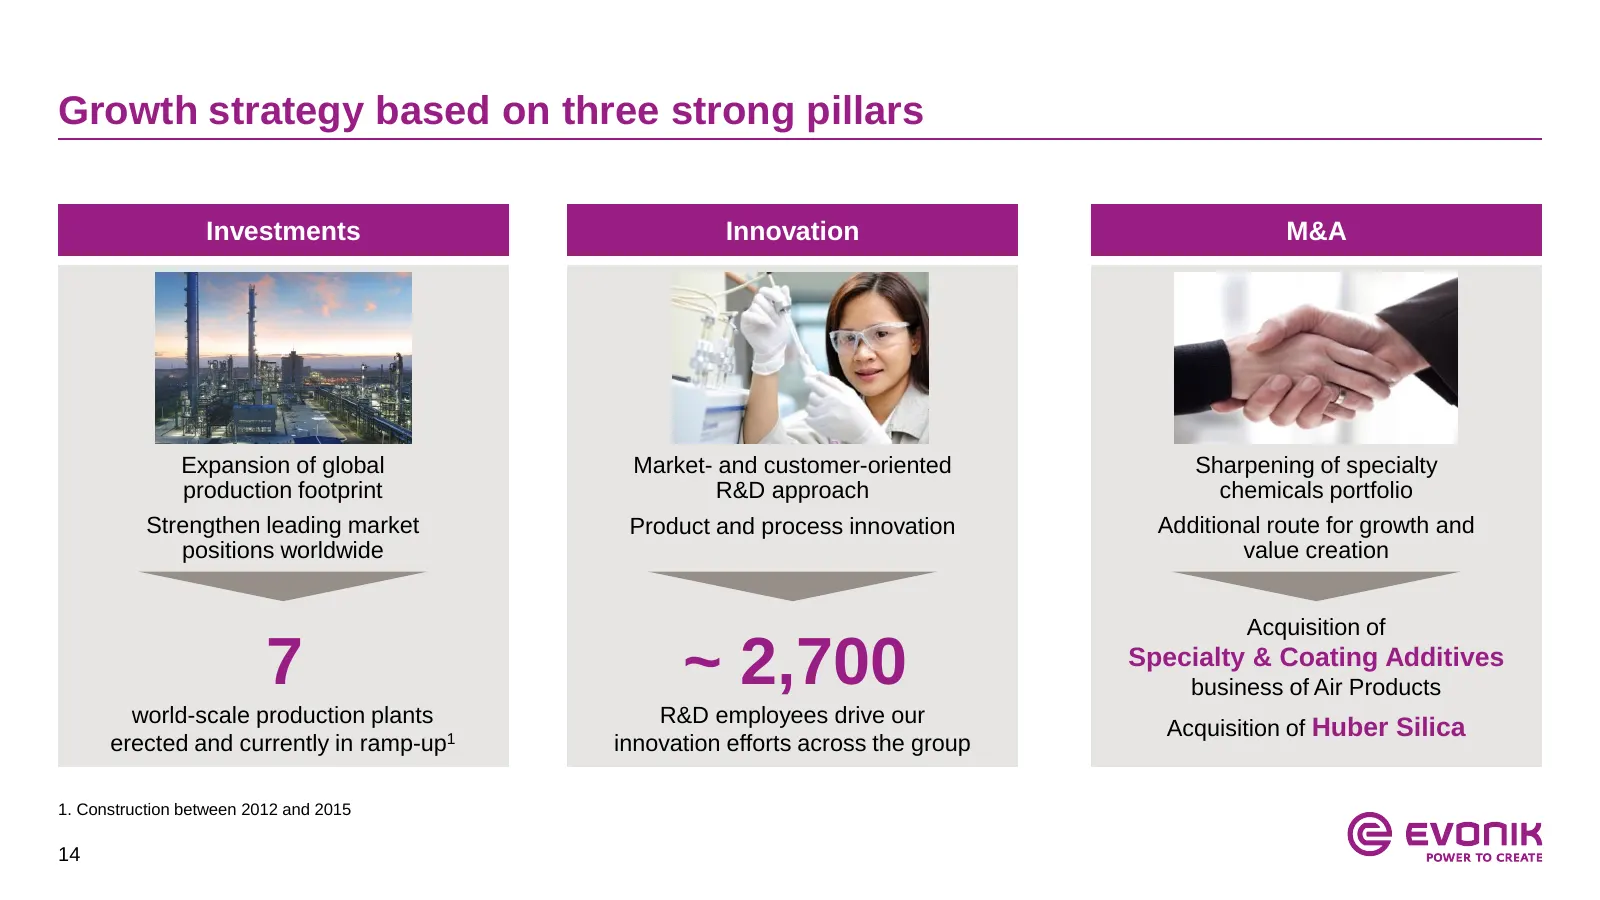
Slide 14: Growth strategy based on three strong pillars
Growth strategy based on three strong pillars Investments Innovation M&A Expansion of global Market- and customer-oriented Sharpening of specialty production footprint R&D approach chemicals portfolio Strengthen leading market Product and process innovation Additional route for growth and positions
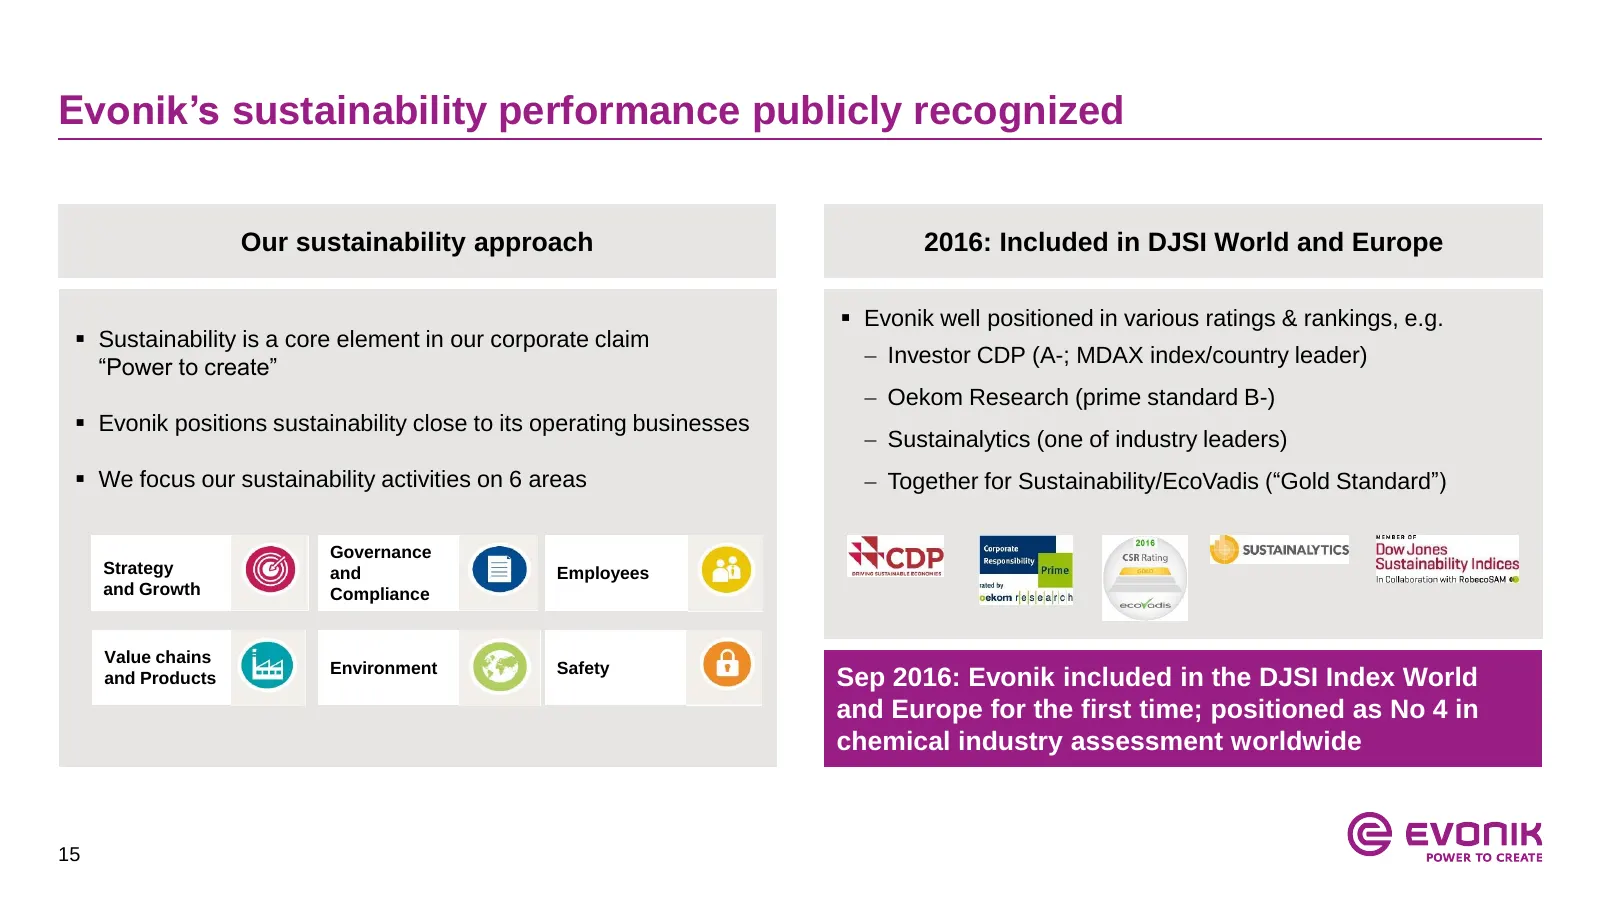
Slide 15: Evonik's sustainability performance publicly recognized
Evonik’s sustainability performance publicly recognized Our sustainability approach 2016: Included in DJSI World and Europe Evonik well positioned in various ratings & rankings, e.g. Sustainability is a core element in our corporate claim Investor CDP (A-; MDAX index/country leader) “Power to
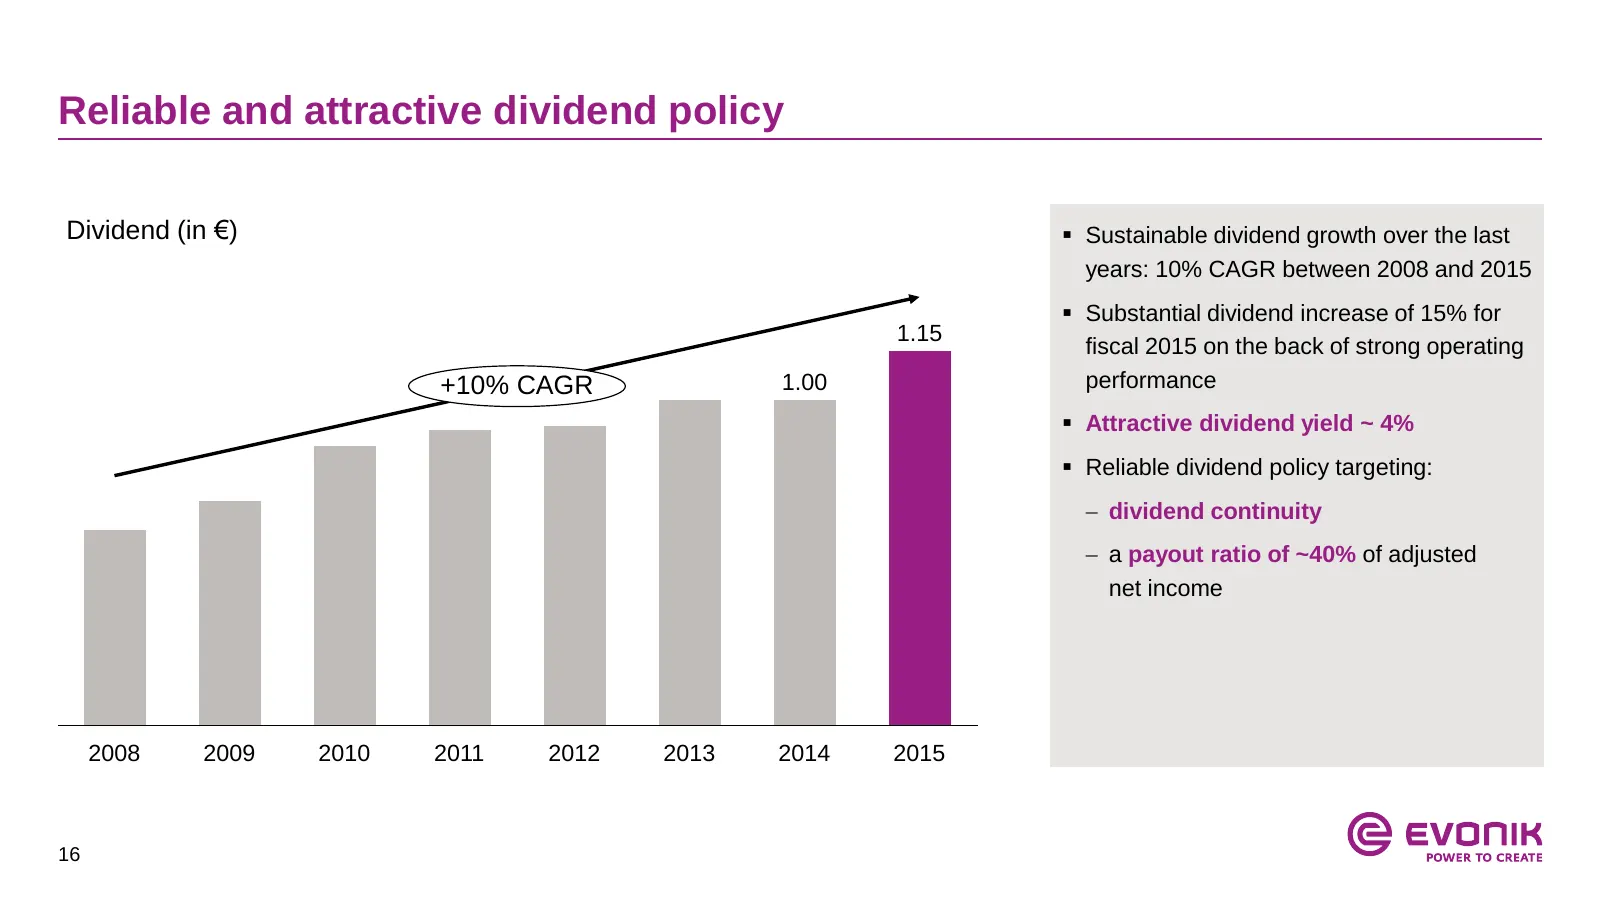
Slide 16: Reliable and attractive dividend policy
Reliable and attractive dividend policy Dividend (in €) Sustainable dividend growth over the last years: 10% CAGR between 2008 and 2015 Substantial dividend increase of 15% for 1.15 fiscal 2015 on the back of strong operating +10% CAGR 1.00 performance Attractive dividend yield ~ 4% Reliable
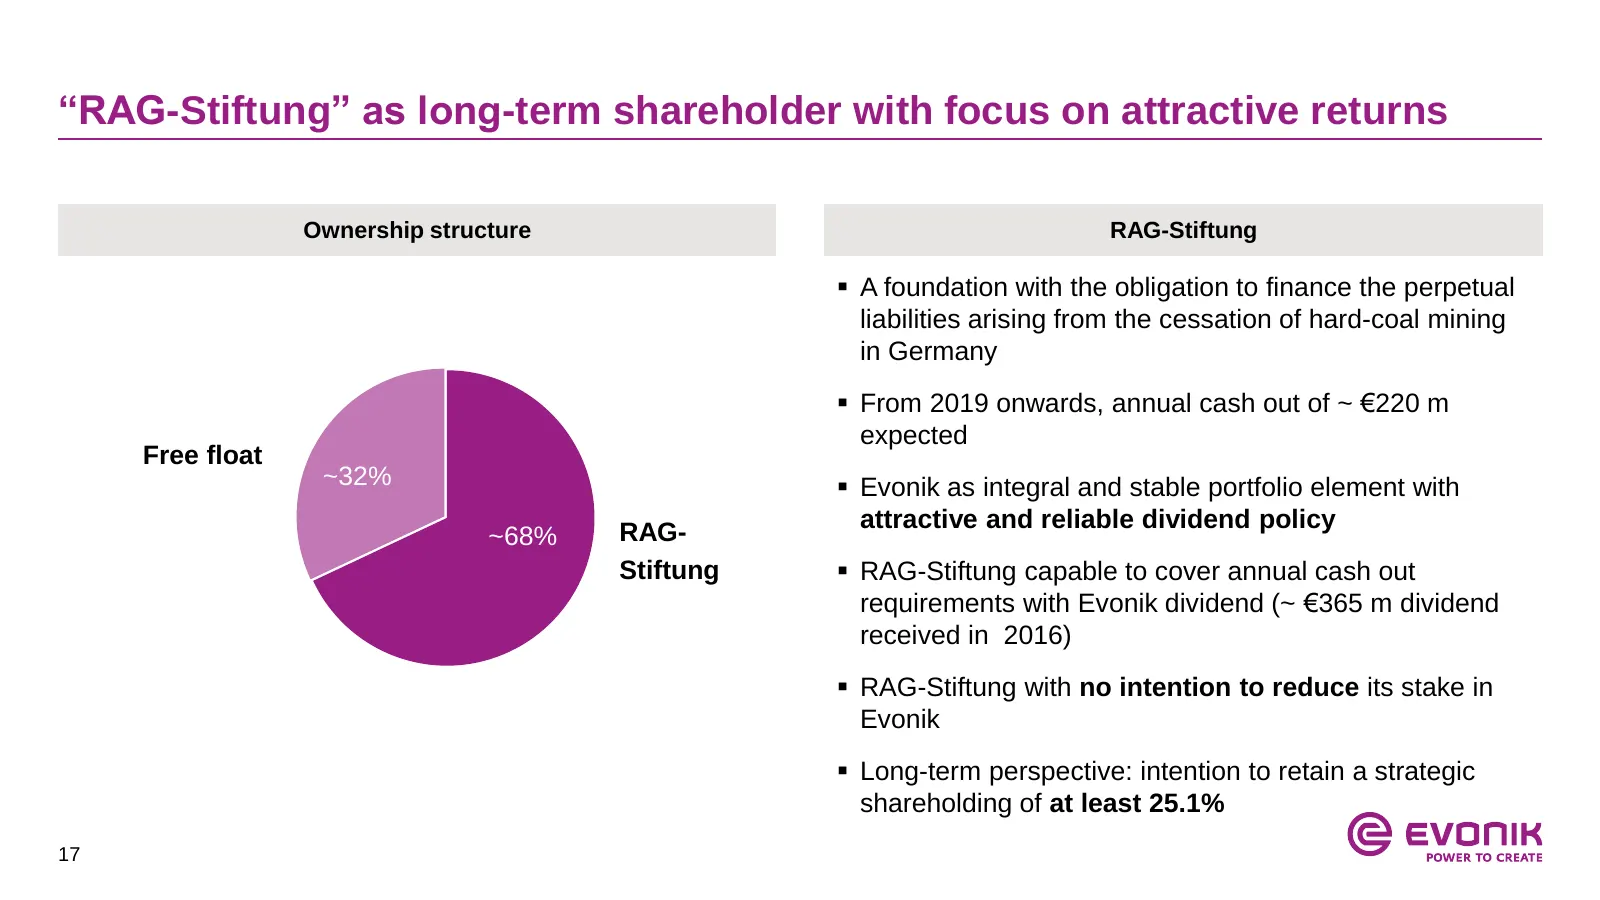
Slide 17: RAG-Stiftung as long-term shareholder
“RAG-Stiftung” as long-term shareholder with focus on attractive returns Ownership structure RAG-Stiftung A foundation with the obligation to finance the perpetual liabilities arising from the cessation of hard-coal mining in Germany From 2019 onwards, annual cash out of ~ €220 m expected Free f
Slide 18: Table of contents
Table of contents 1. Strategic update and current trading 2. Evonik at a glance 3. Acquisition of Huber Silica 4. Financials Q3 2016 5. Appendix 18
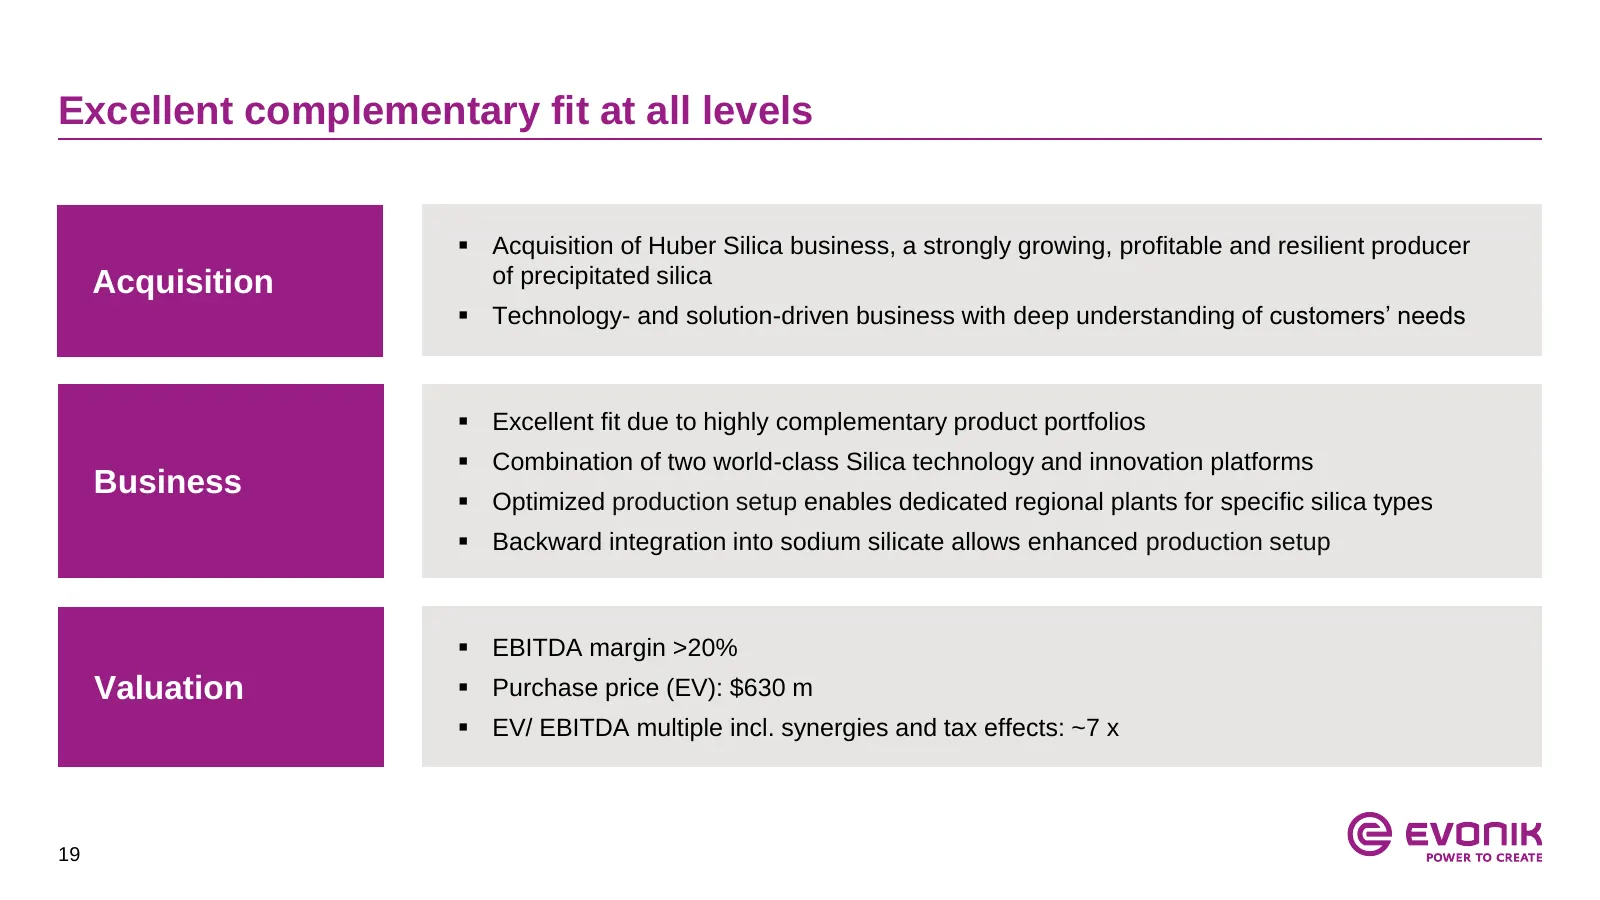
Slide 19: Excellent complementary fit at all levels
Excellent complementary fit at all levels Acquisition of Huber Silica business, a strongly growing, profitable and resilient producer Acquisition of precipitated silica Technology- and solution-driven business with deep understanding of customers’ needs Excellent fit due to highly complementar
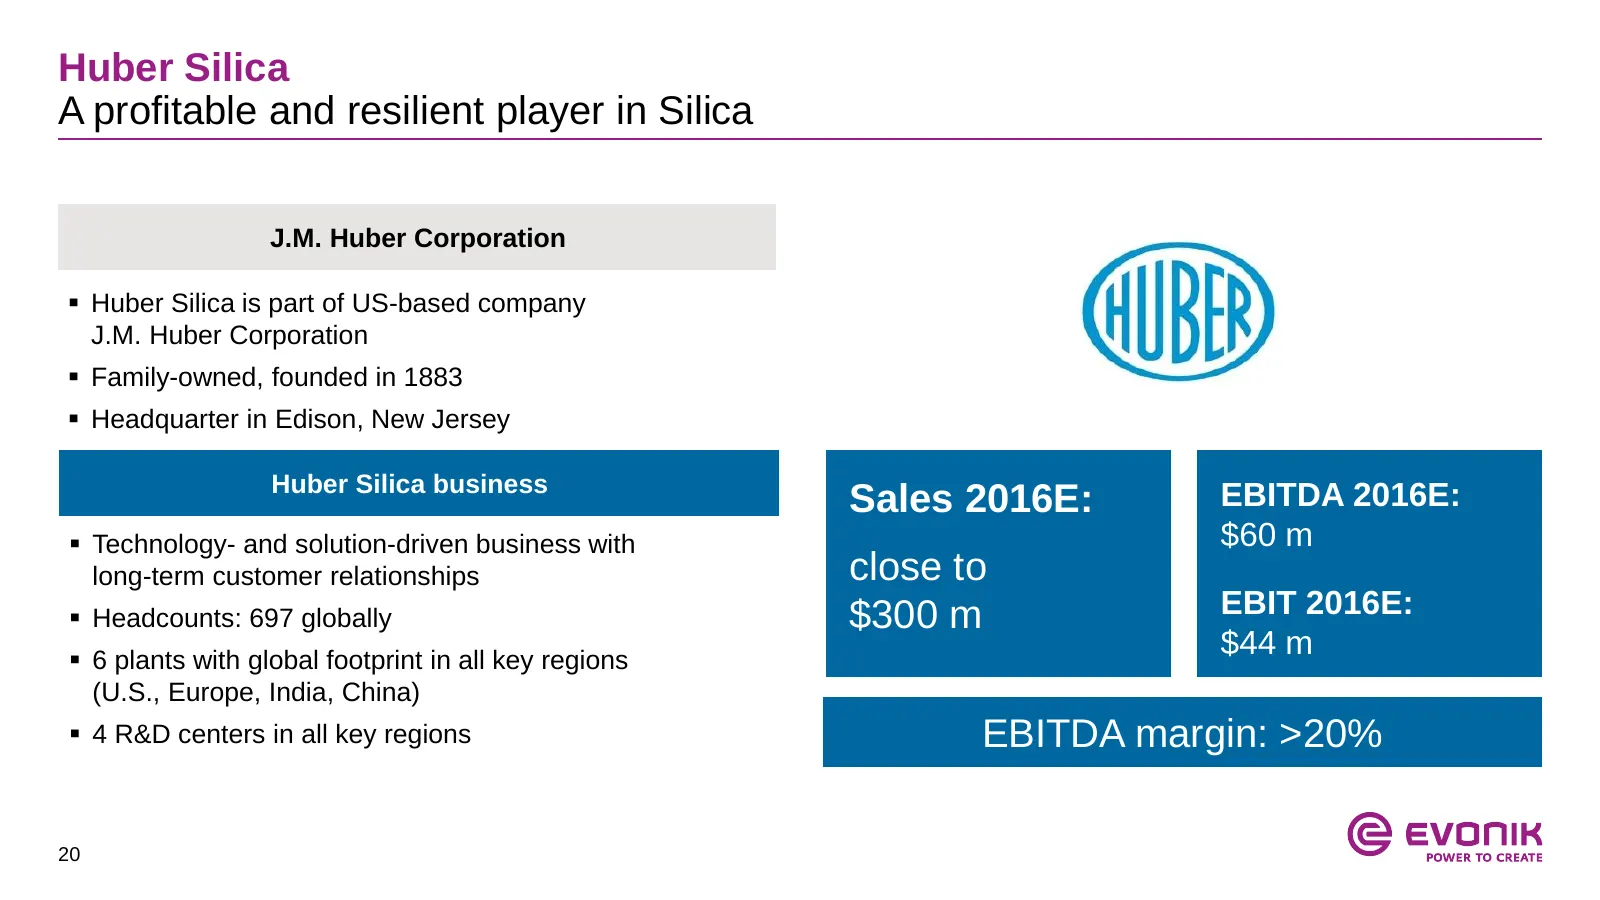
Slide 20: Huber Silica
Huber Silica A profitable and resilient player in Silica J.M. Huber Corporation Huber Silica is part of US-based company J.M. Huber Corporation Family-owned, founded in 1883 Headquarter in Edison, New Jersey Huber Silica business EBITDA 2016E: Sales 2016E: Technology- and solution-driven bus
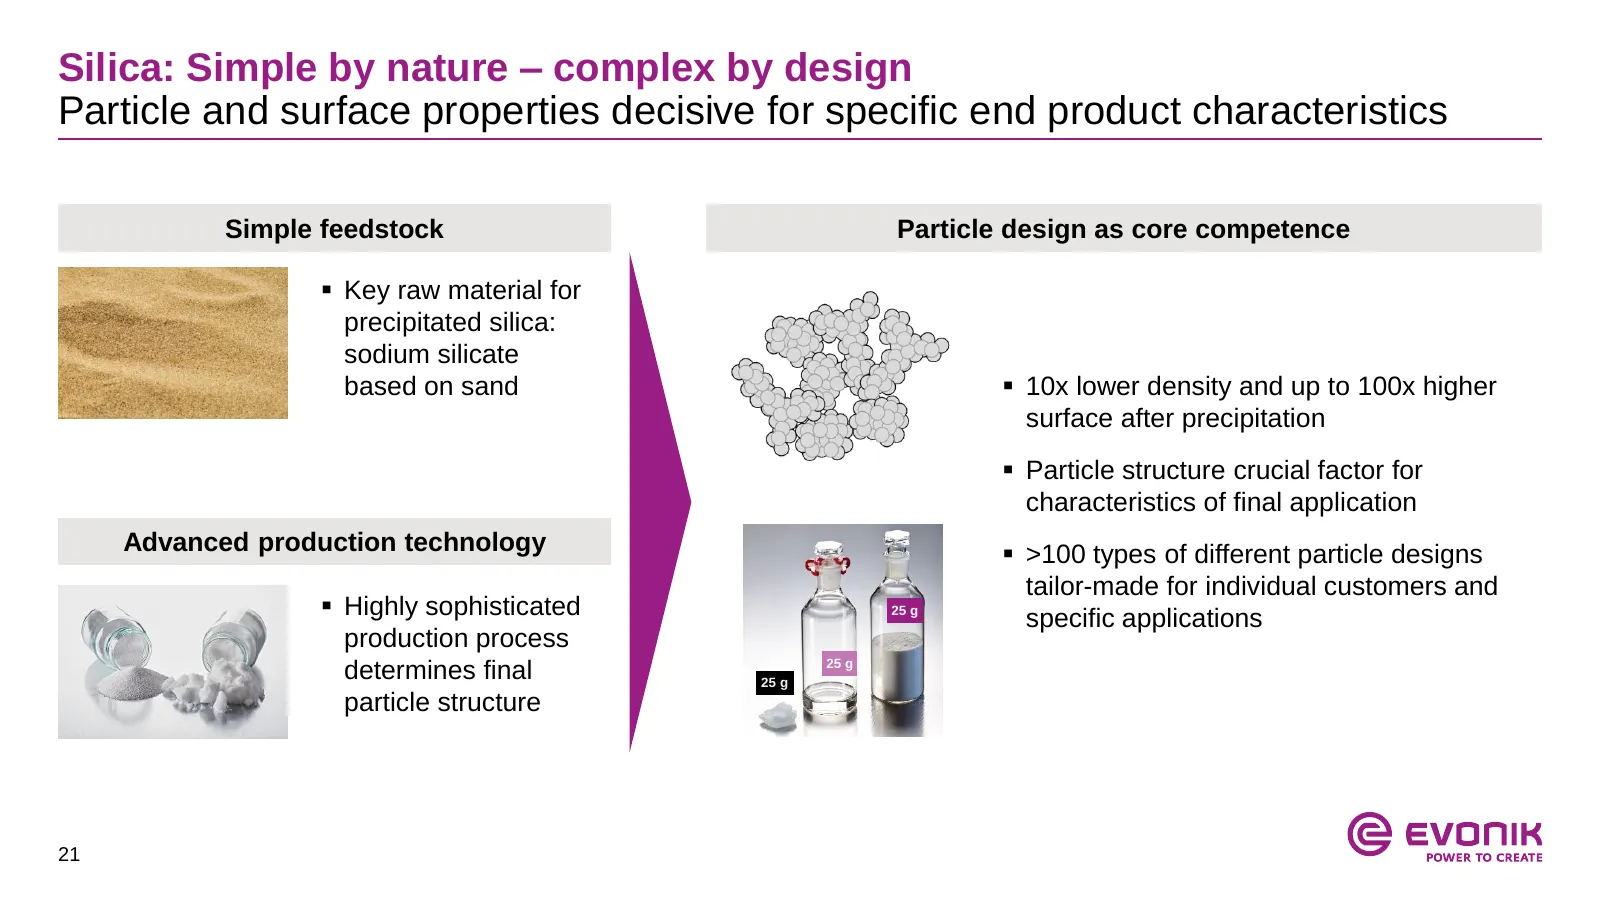
Slide 21: Silica: Simple by nature – complex by design
Silica: Simple by nature – complex by design Particle and surface properties decisive for specific end product characteristics Simple feedstock Particle design as core competence Key raw material for precipitated silica: sodium silicate based on sand 10x lower density and up to 100x higher surfa
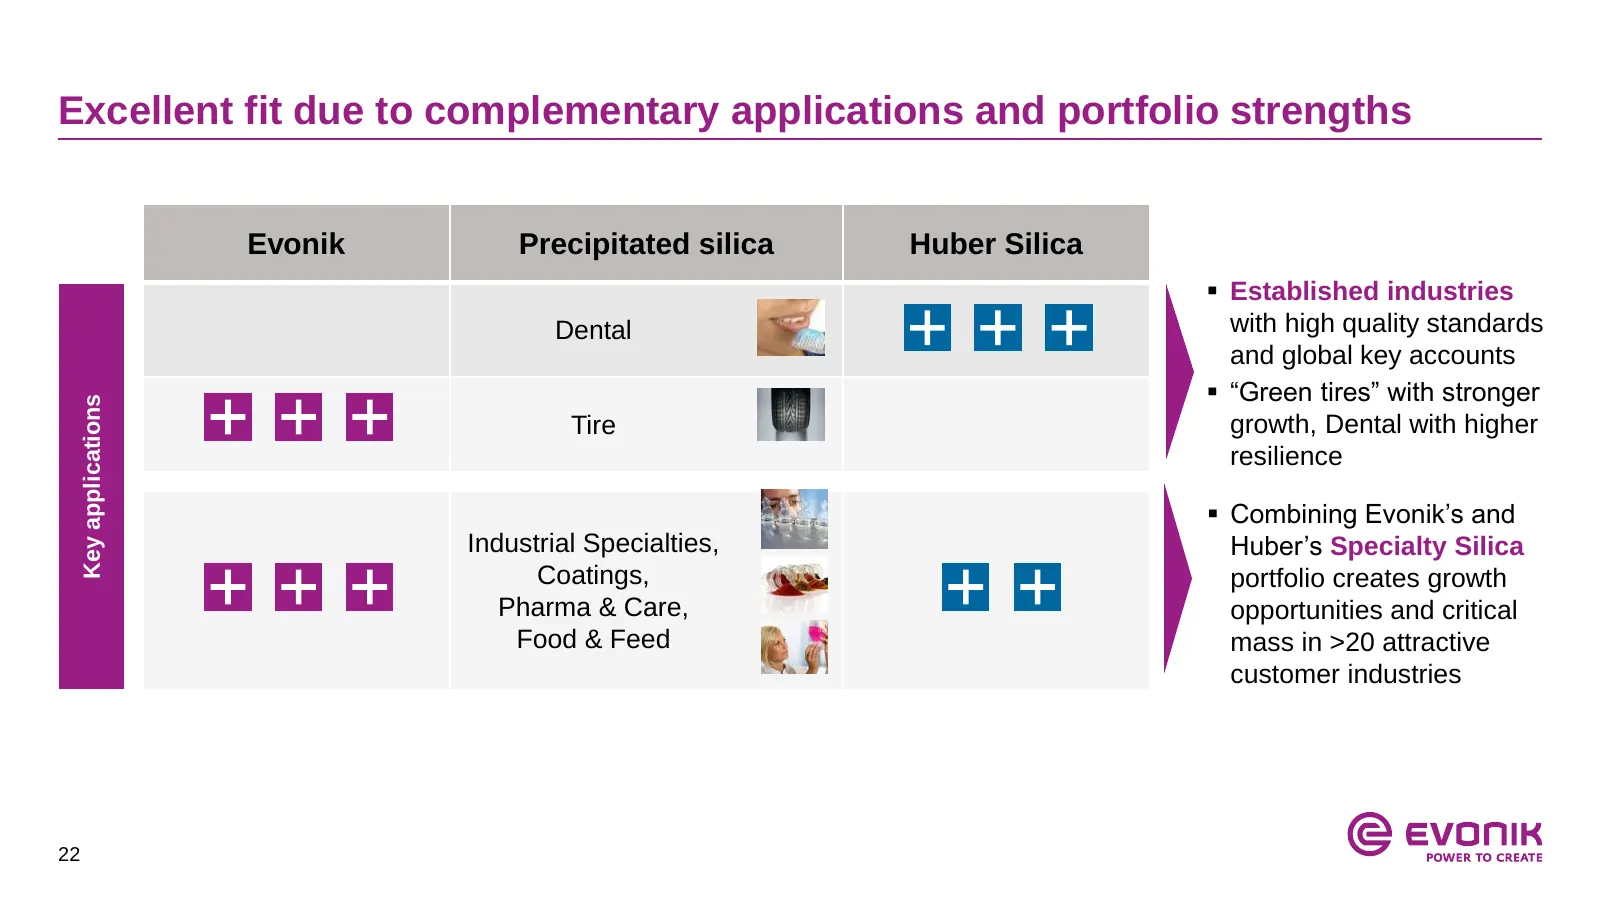
Slide 22: Key applications
Excellent fit due to complementary applications and portfolio strengths Evonik Precipitated silica Huber Silica Established industries Dental with high quality standards and global key accounts “Green tires” with stronger Key applications Tire growth, Dental with higher resilience Combining Ev
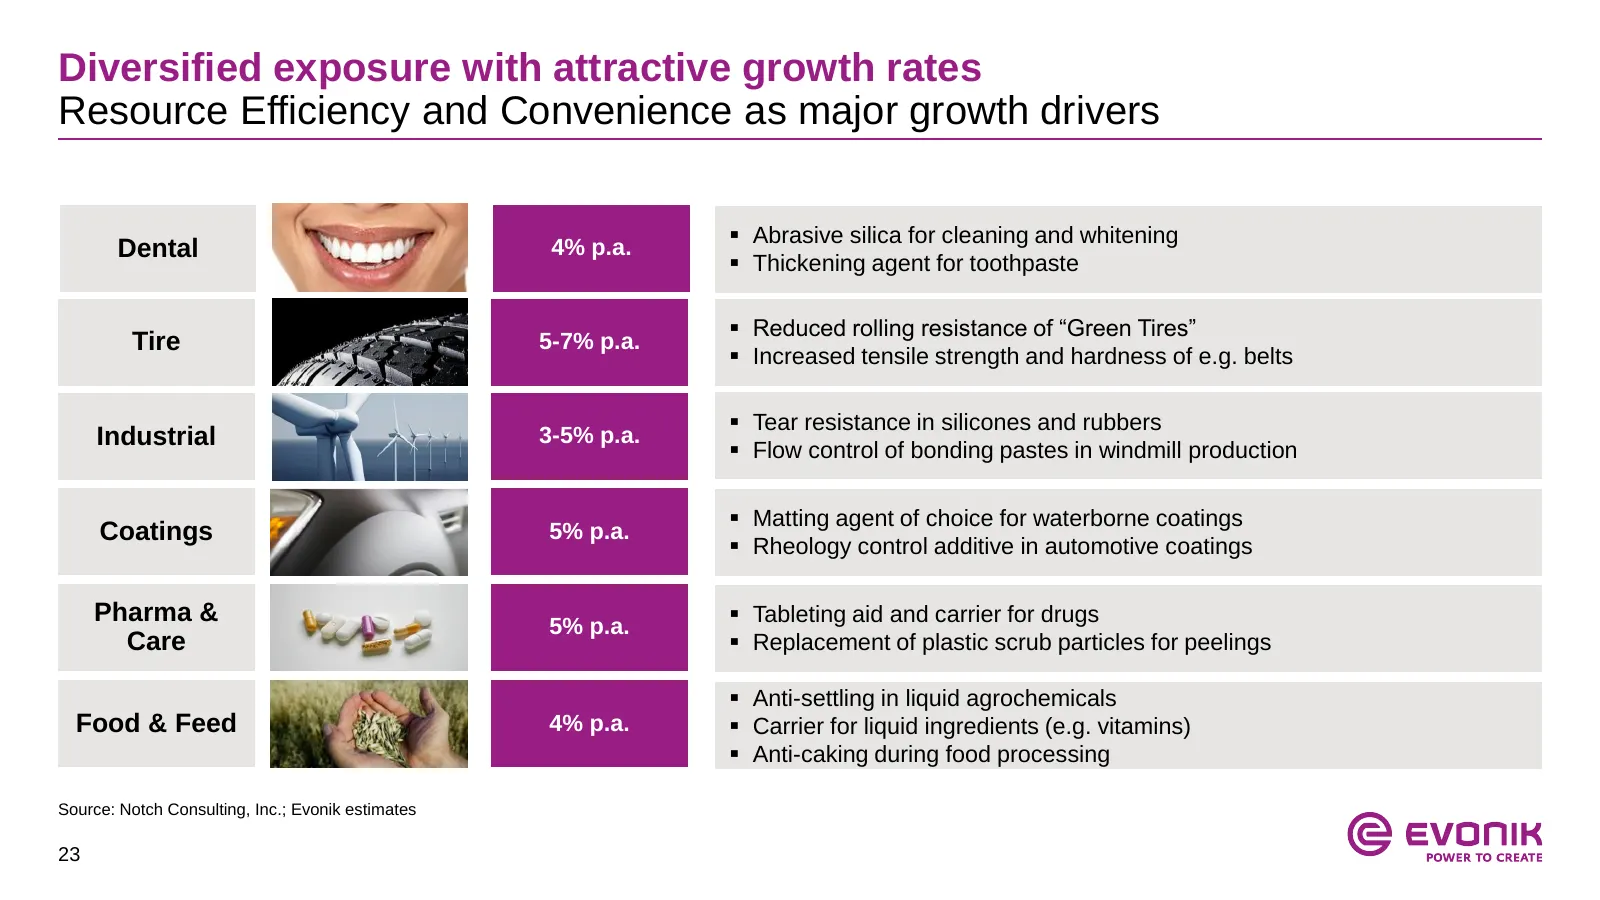
Slide 23: Diversified exposure with attractive growth rates
Diversified exposure with attractive growth rates Resource Efficiency and Convenience as major growth drivers Abrasive silica for cleaning and whitening Dental 4% p.a. Thickening agent for toothpaste Reduced rolling resistance of “Green Tires” Tire 5-7% p.a. Increased tensile strength and ha
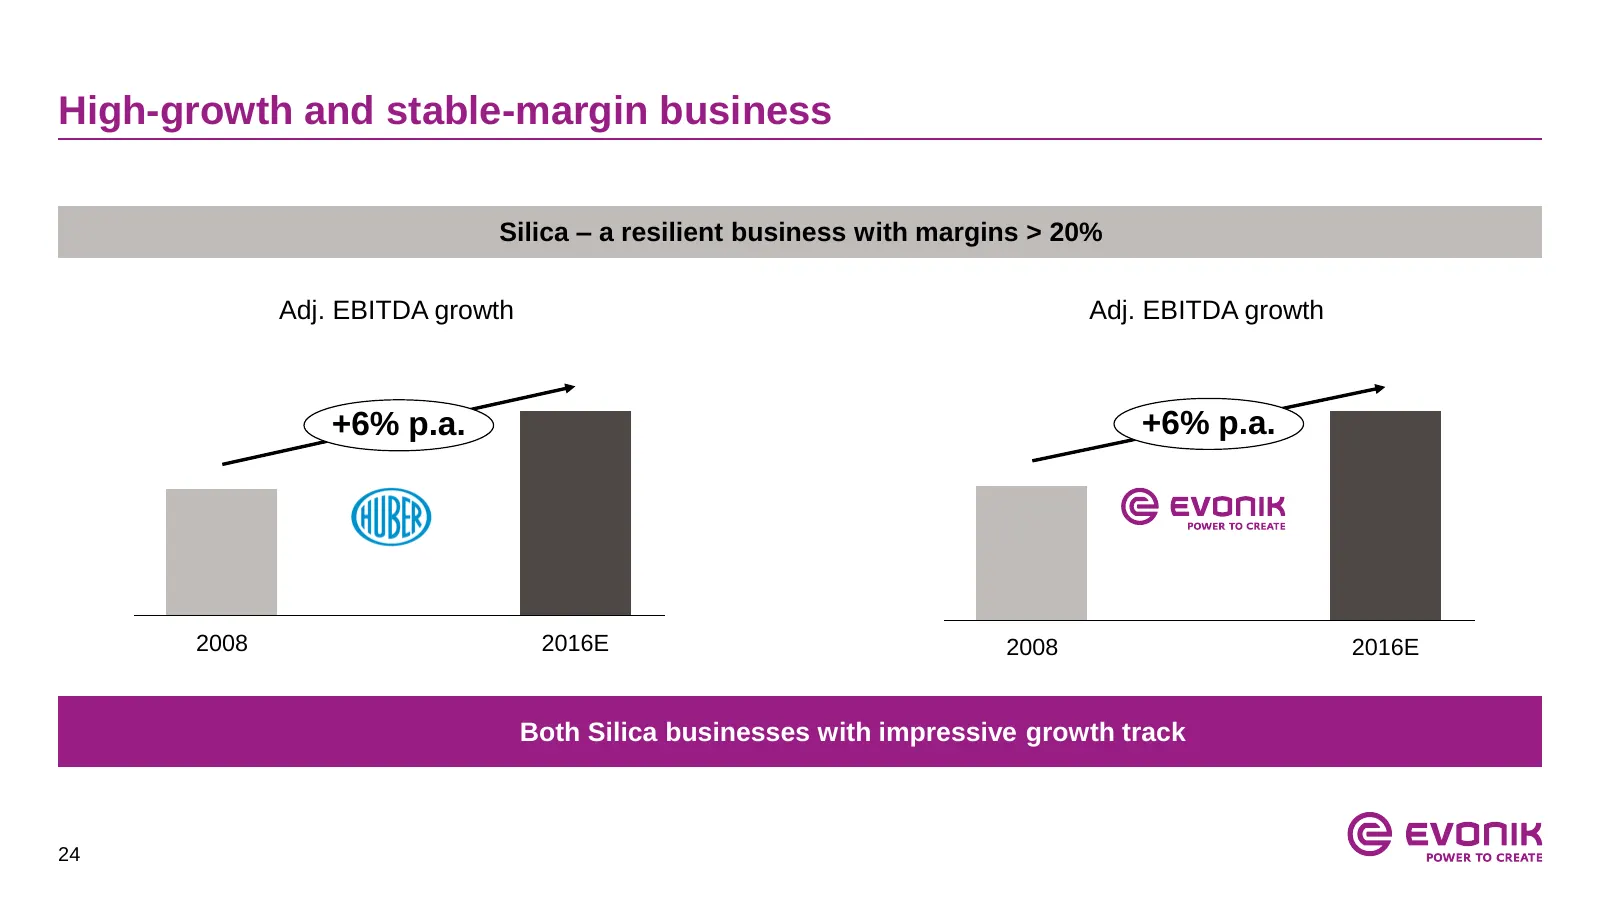
Slide 24: High-growth and stable-margin business
High-growth and stable-margin business Silica – a resilient business with margins > 20% Adj. EBITDA growth Adj. EBITDA growth +6% p.a. +6% p.a. 2008 2016E 2008 2016E Both Silica businesses with impressive growth track 24
Slide 25: Key regions
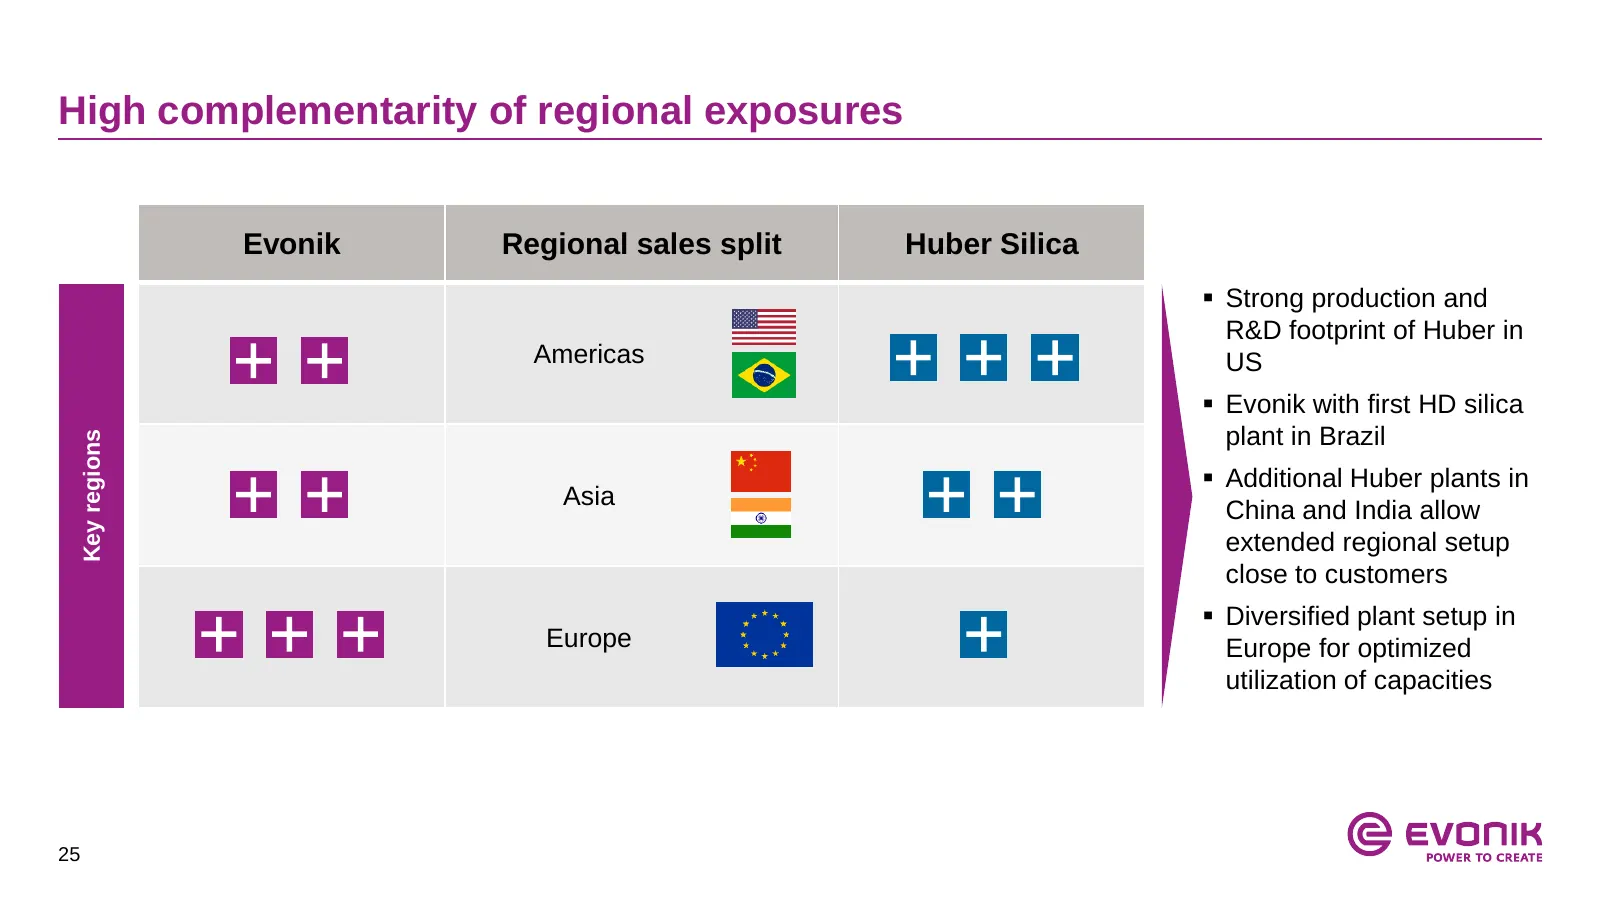
High complementarity of regional exposures Evonik Regional sales split Huber Silica Strong production and R&D footprint of Huber in Americas US Evonik with first HD silica plant in Brazil Key regions Additional Huber plants in Asia China and India allow extended regional setup close to custome
Slide 26: Optimizing the regional production setup
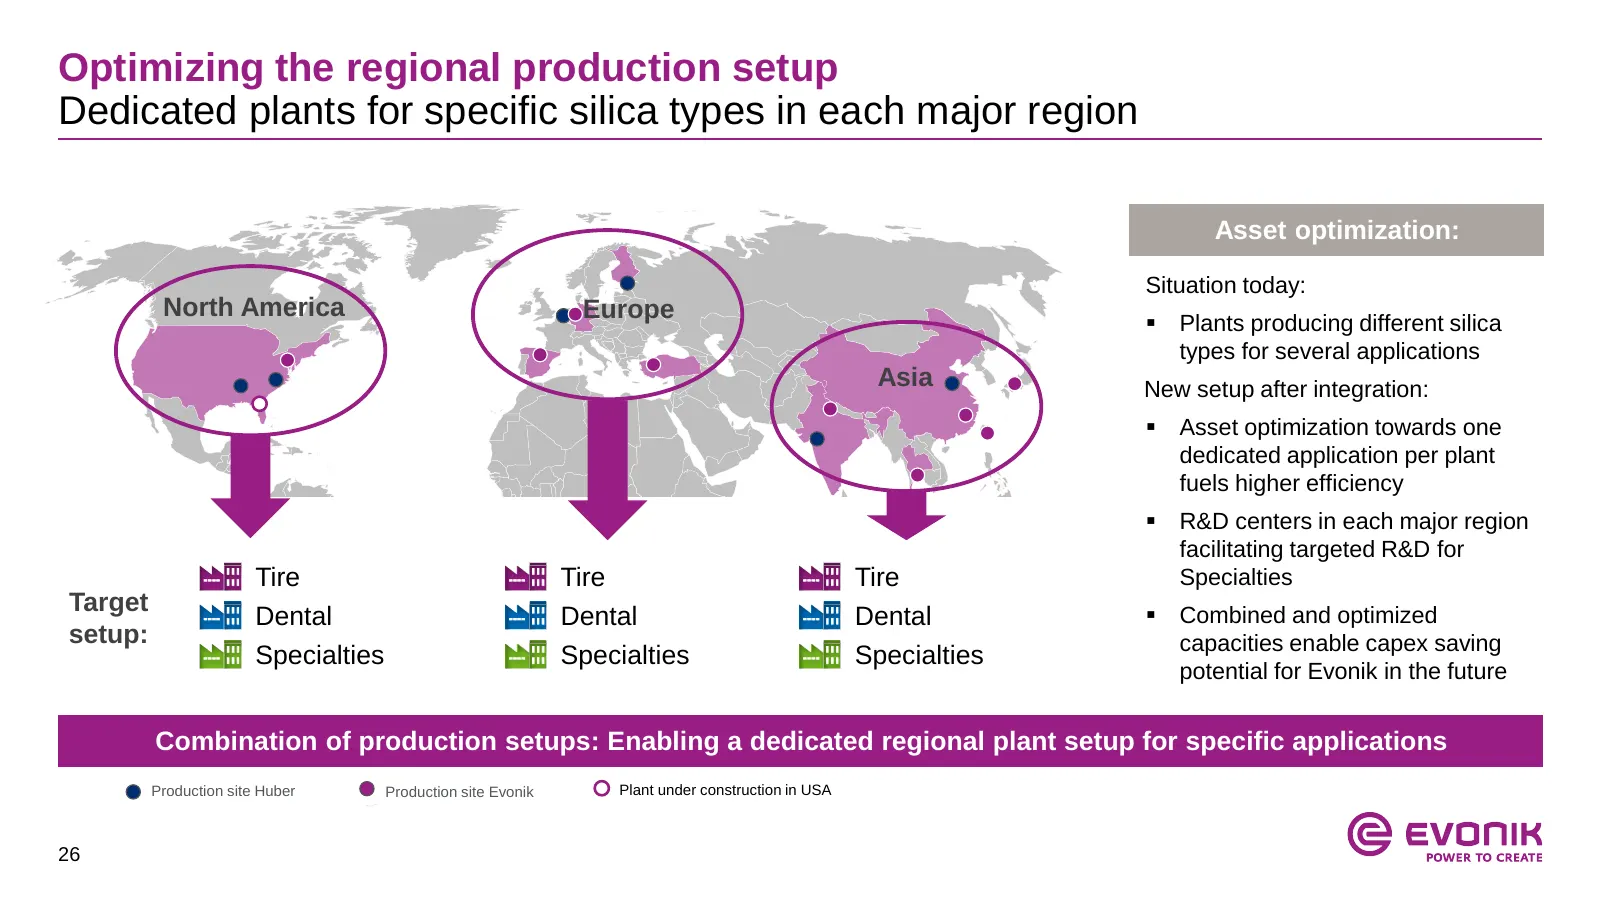
Optimizing the regional production setup Dedicated plants for specific silica types in each major region Asset optimization: Situation today: North America Europe Plants producing different silica types for several applications Asia New setup after integration: Asset optimization towards one ded
Slide 27: Partial backward integration into sodium silicate
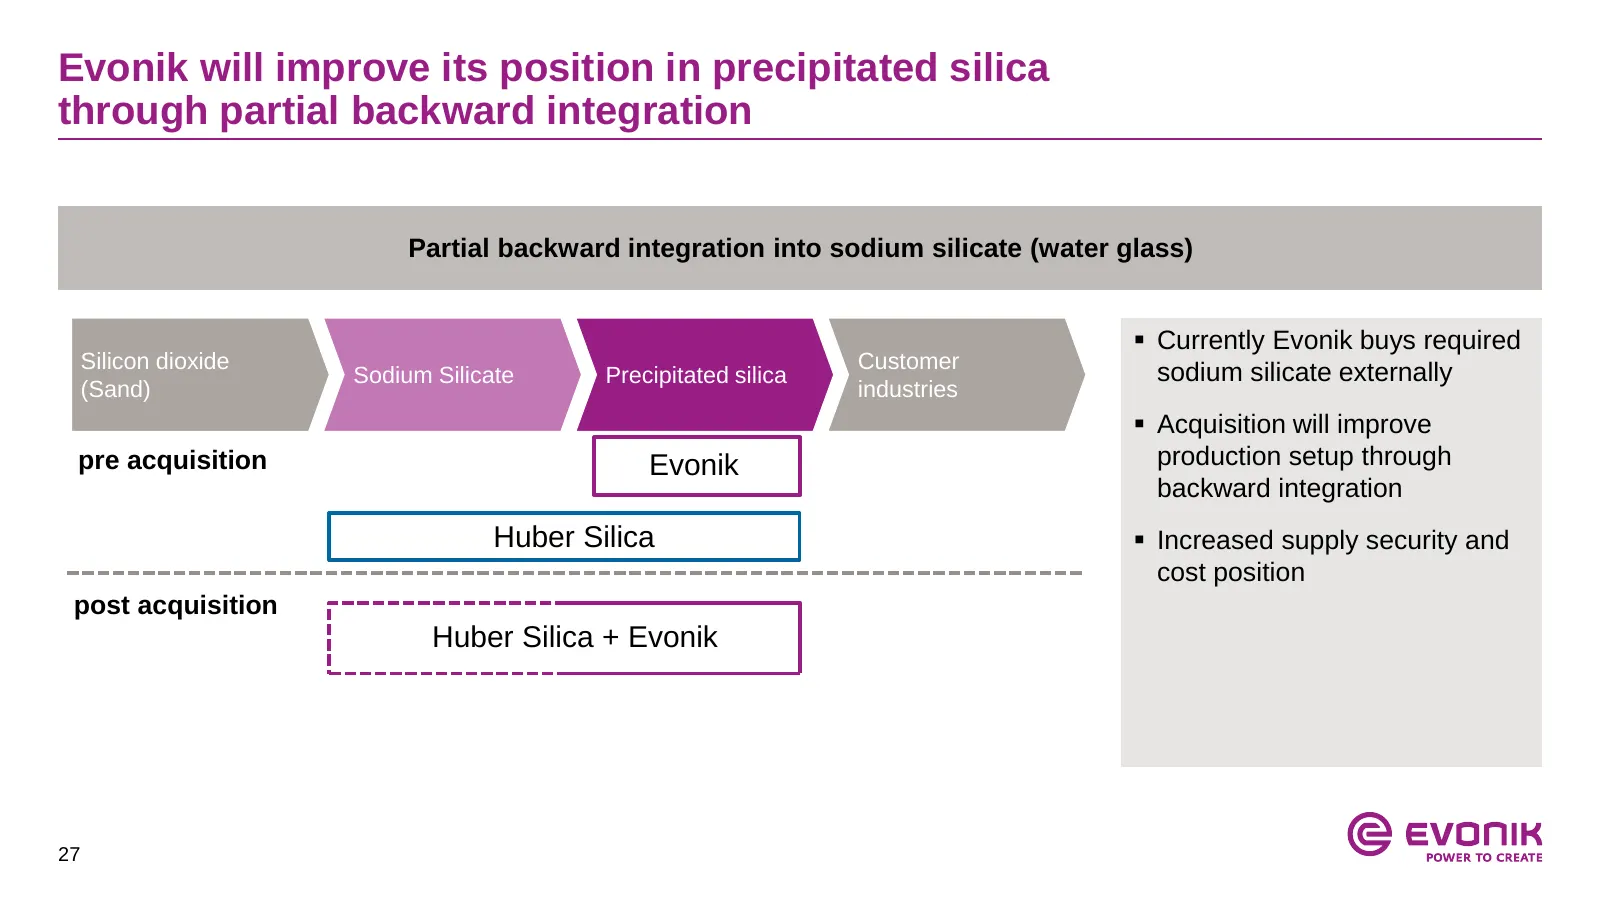
Evonik will improve its position in precipitated silica through partial backward integration Partial backward integration into sodium silicate (water glass) Currently Evonik buys required Silicon dioxide Customer Sodium Silicate Precipitated silica sodium silicate externally (Sand) industries Ac
Slide 28: Huber Silica technology & innovation capacities
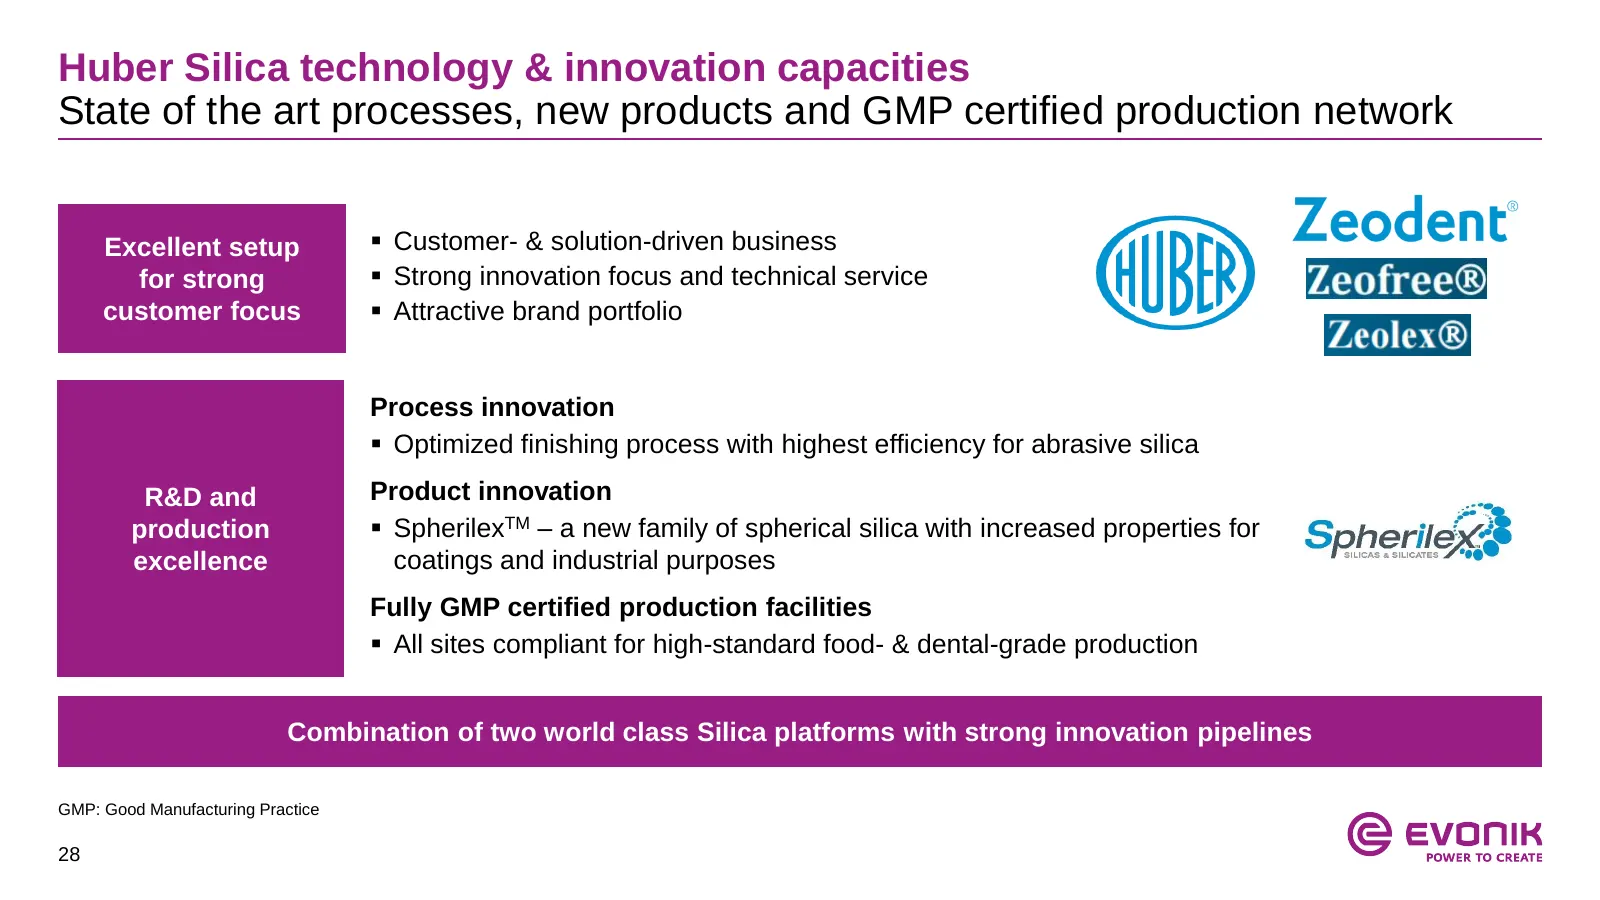
Huber Silica technology & innovation capacities State of the art processes, new products and GMP certified production network Excellent setup Customer- & solution-driven business for strong Strong innovation focus and technical service customer focus Attractive brand portfolio Process innovati
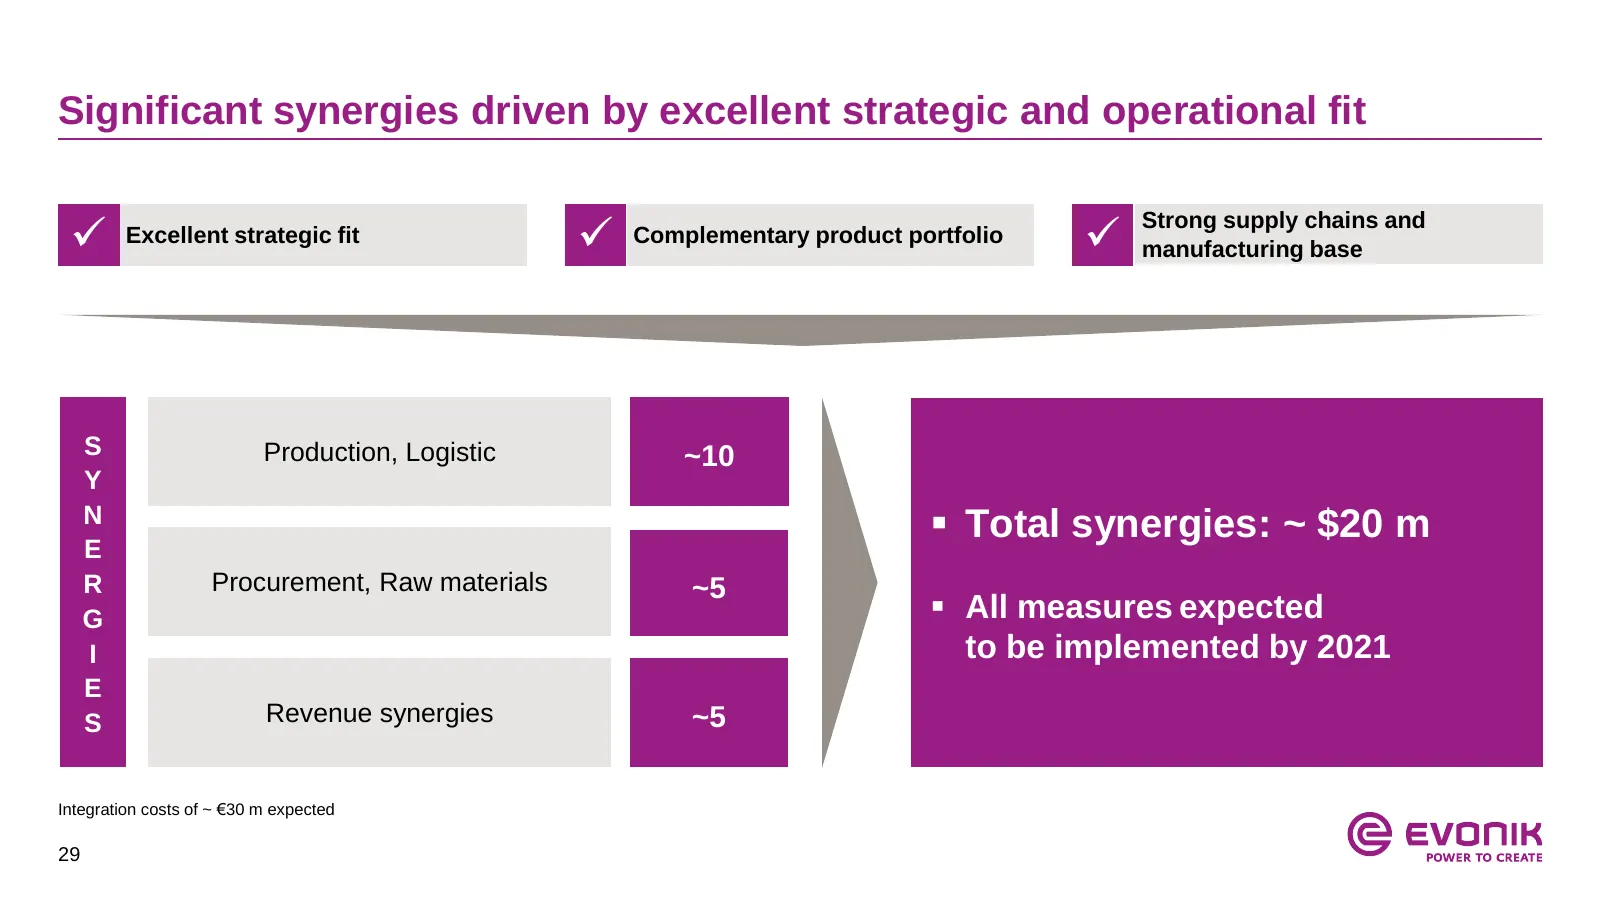
Slide 29: Significant synergies
Significant synergies driven by excellent strategic and operational fit Excellent strategic fit Complementary product portfolio manufacturing base Strong supply chains and S Production, Logistic ~10 Y N Total synergies: ~ $20 m E R Procurement, Raw materials ~5 G All measures expected I to
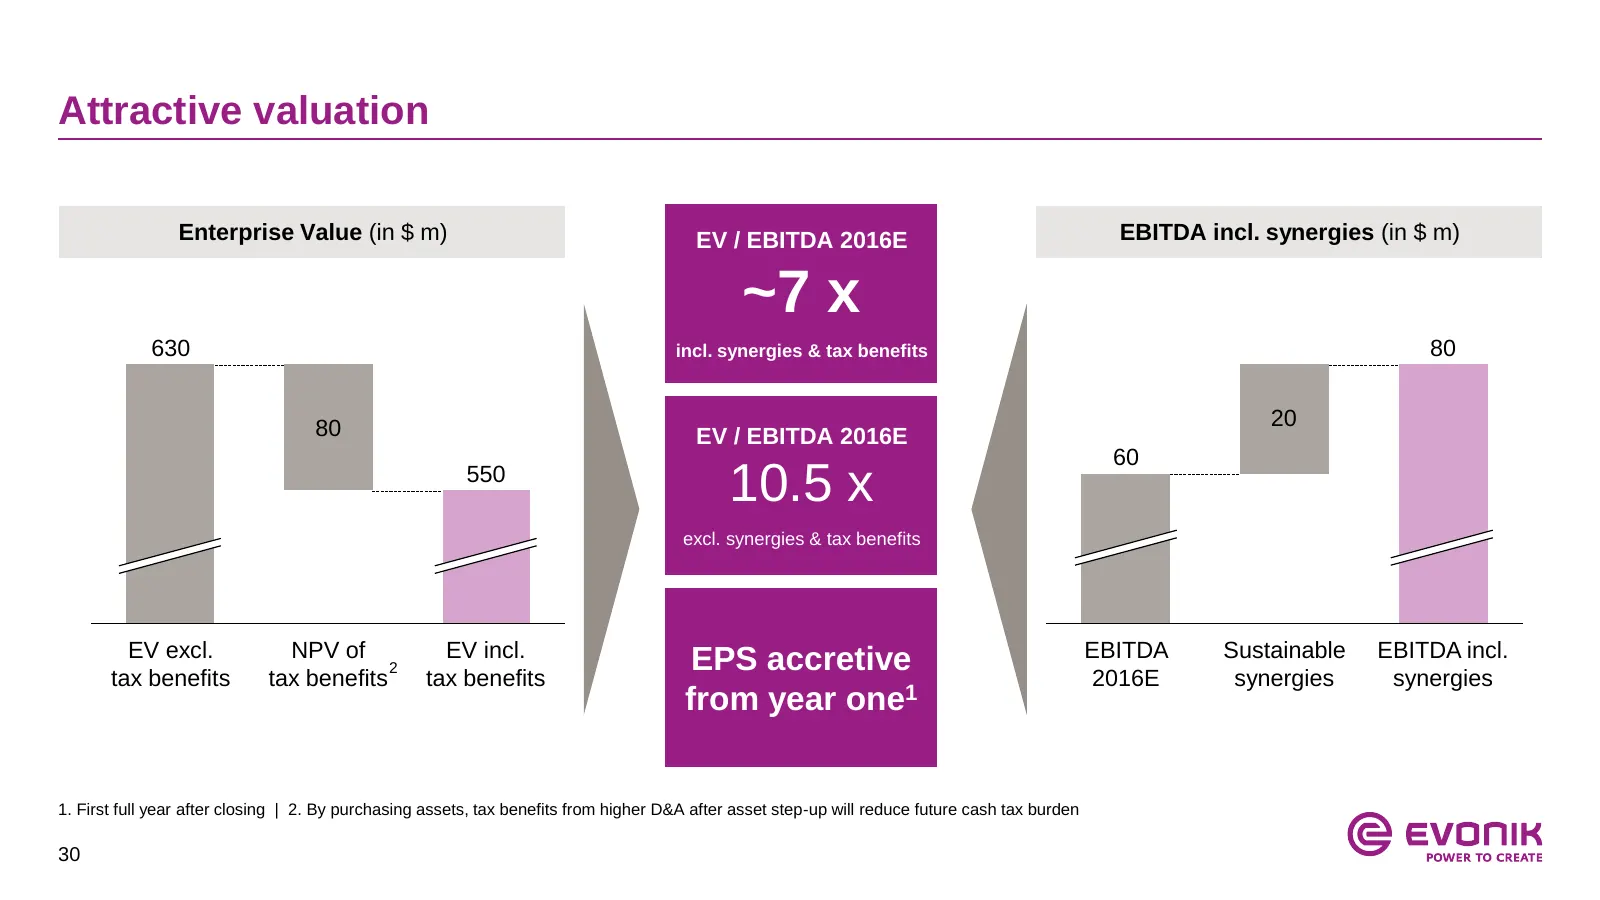
Slide 30: Attractive valuation
Attractive valuation Enterprise Value (in $ m) EV / EBITDA 2016E EBITDA incl. synergies (in $ m) ~7 x 630 incl. synergies & tax benefits 80 80 20 EV / EBITDA 2016E 60 550 10.5 x excl. synergies & tax benefits EV excl. NPV of EV incl. EBITDA Sustainable EBITDA incl. tax benefits tax benefits 2 tax be
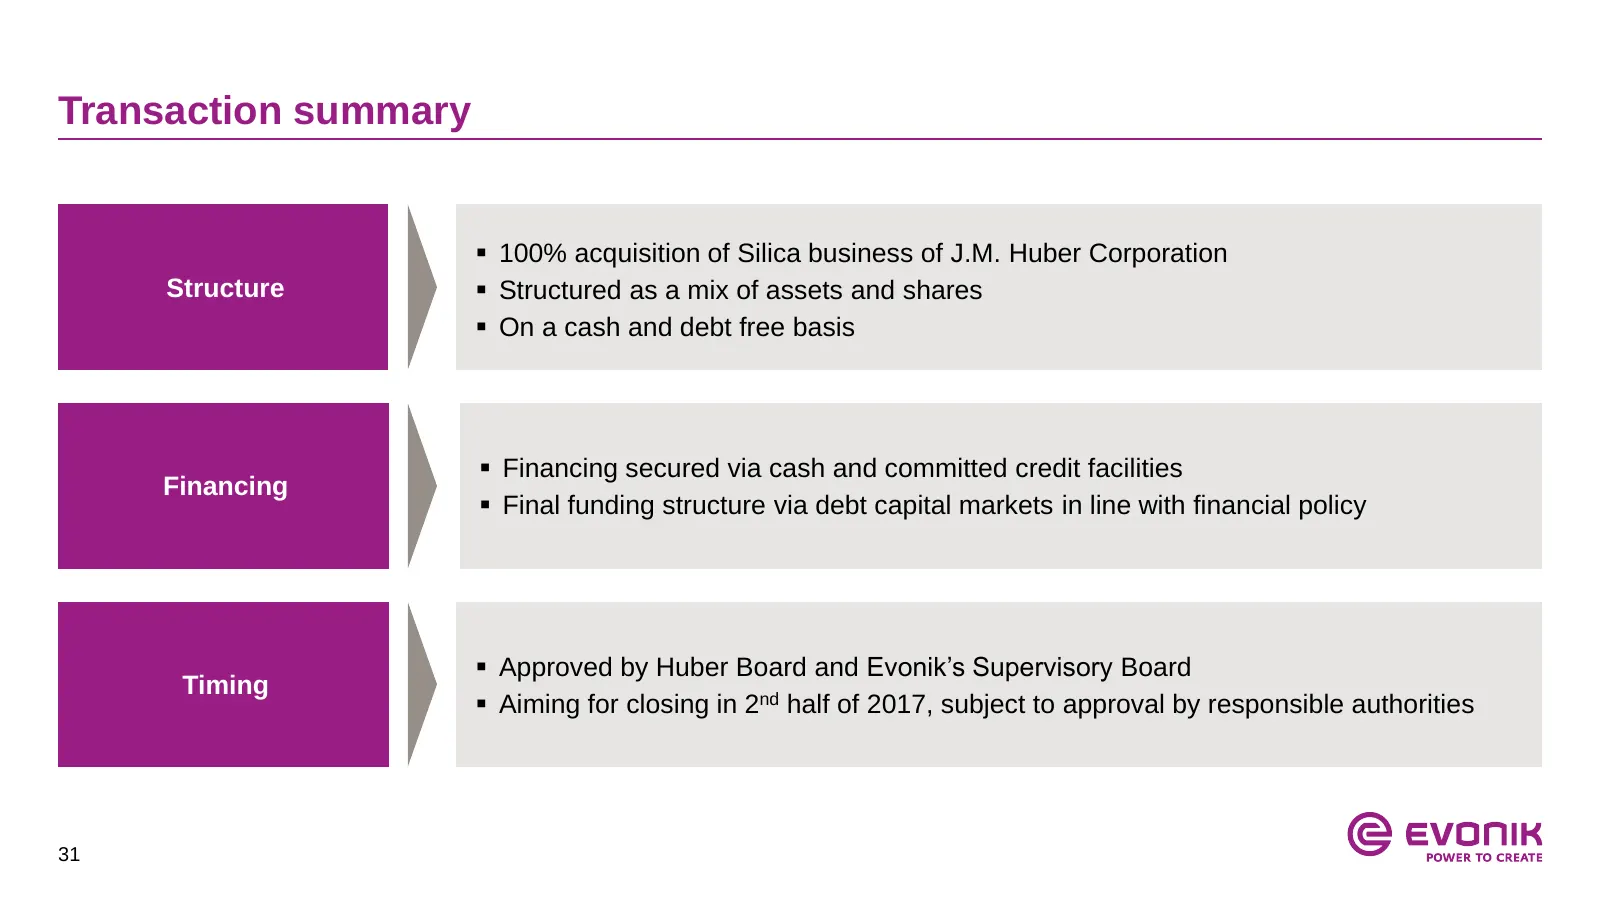
Slide 31: Transaction summary
Transaction summary 100% acquisition of Silica business of J.M. Huber Corporation Structure Structured as a mix of assets and shares On a cash and debt free basis Financing secured via cash and committed credit facilities Financing Final funding structure via debt capital markets in line w
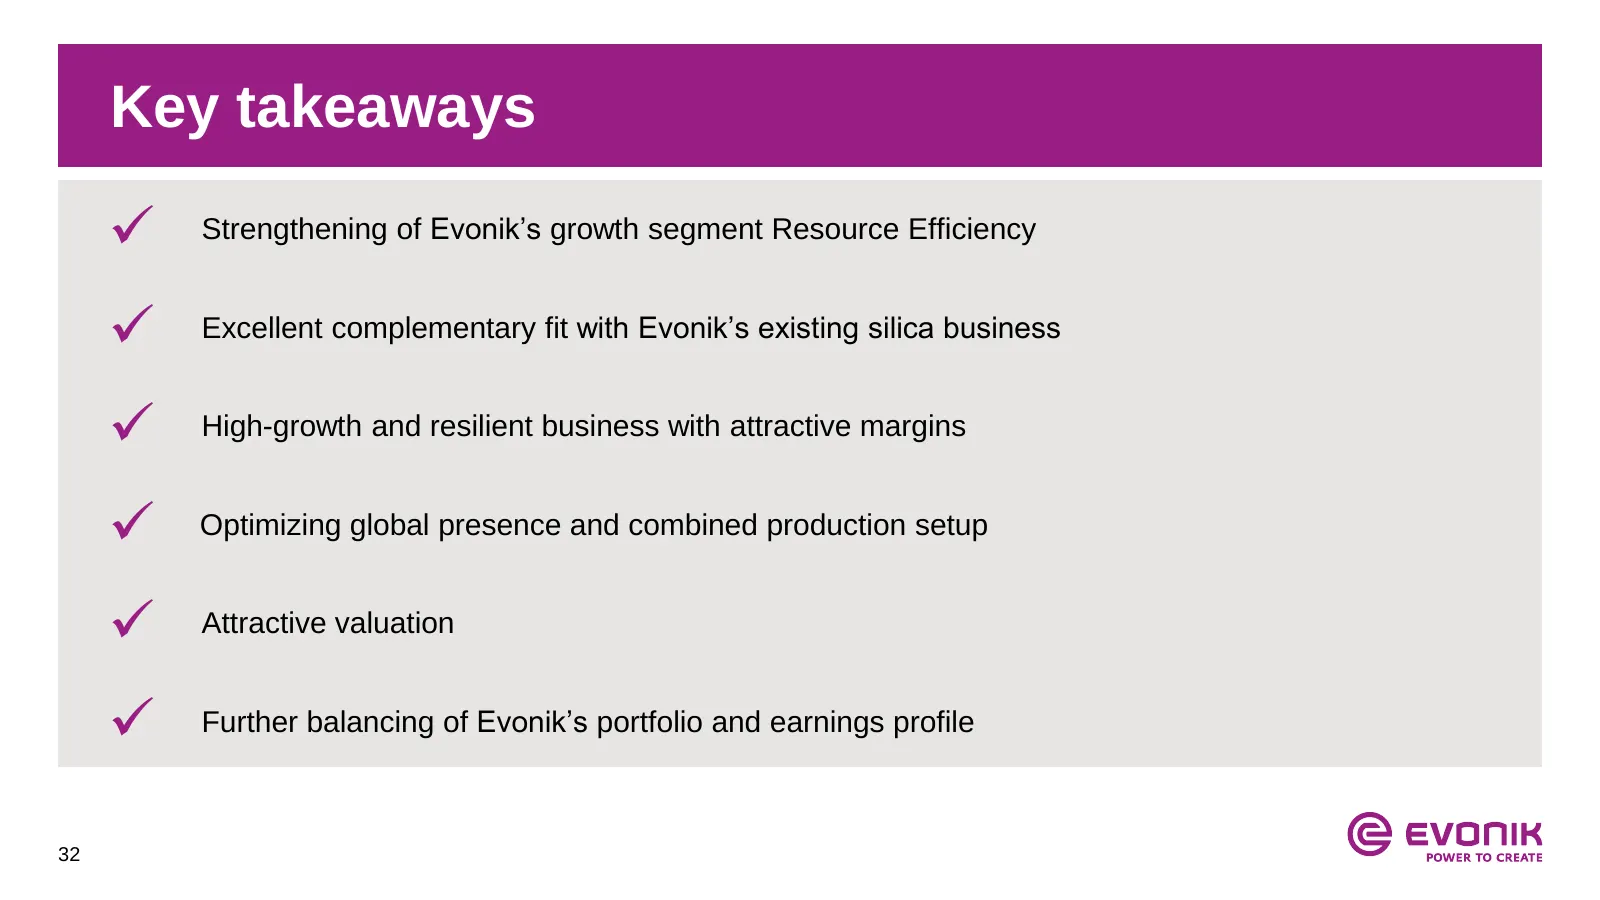
Slide 32: Key takeaways
Key takeaways Strengthening of Evonik’s growth segment Resource Efficiency Excellent complementary fit with Evonik’s existing silica business High-growth and resilient business with attractive margins Optimizing global presence and combined production setup Attractive valuation Further b
Slide 33: Table of contents
Table of contents 1. Strategic update and current trading 2. Evonik at a glance 3. Acquisition of Huber Silica 4. Financials Q3 2016 5. Appendix 33
Slide 34: Highlights Q3 2016
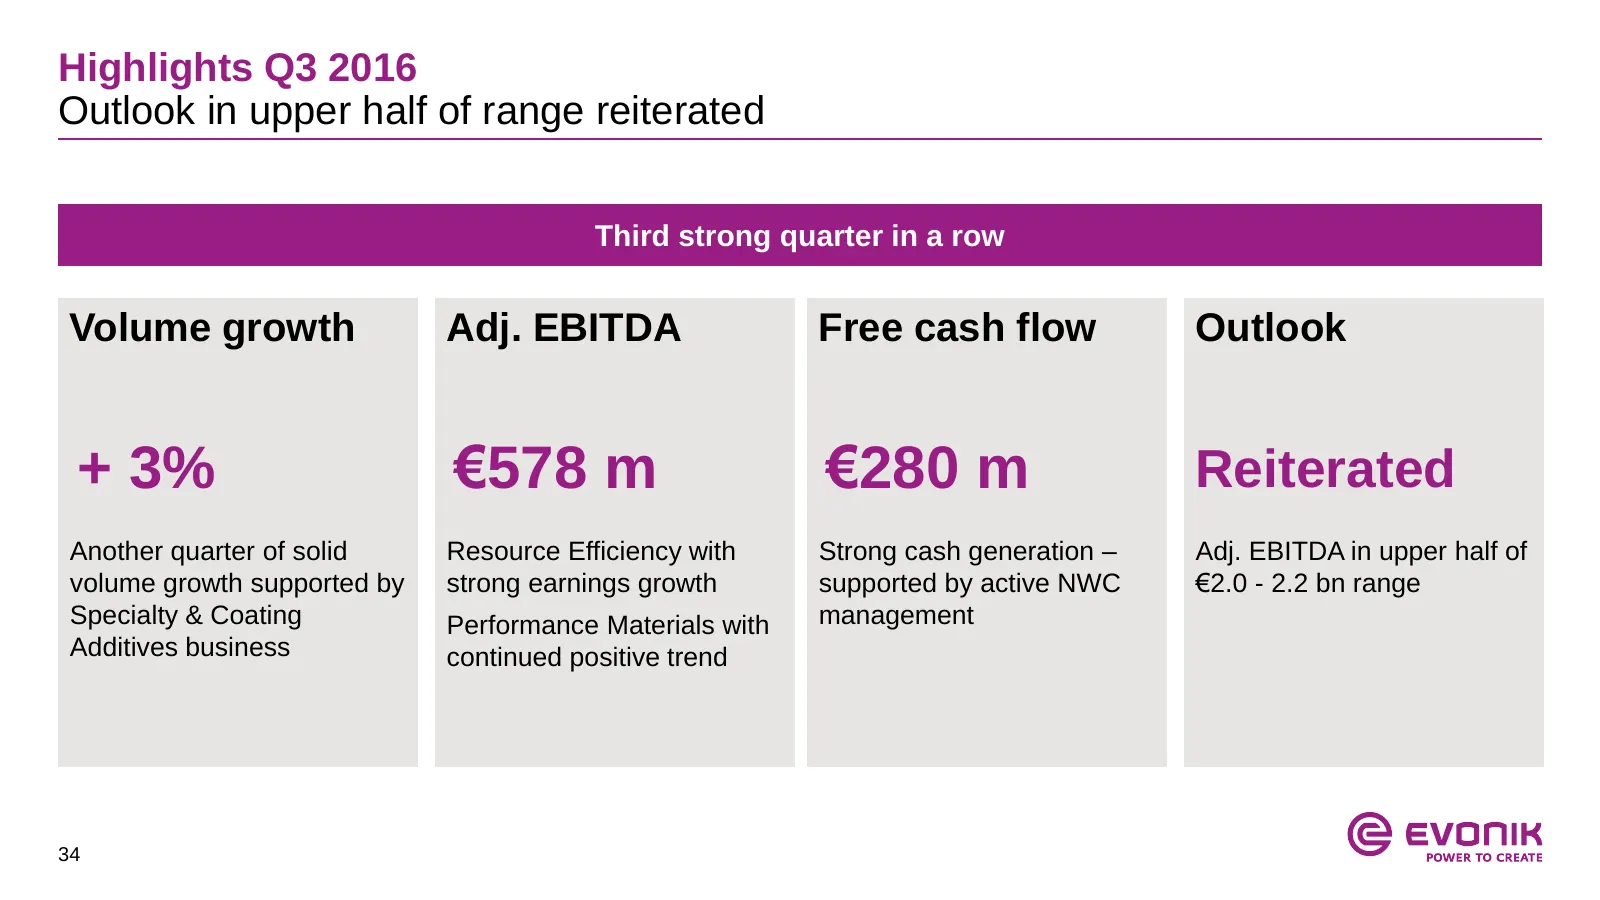
Highlights Q3 2016 Outlook in upper half of range reiterated Third strong quarter in a row Volume growth Adj. EBITDA Free cash flow Outlook + 3% €578 m €280 m Reiterated ) Another quarter of solid Resource Efficiency with Strong cash generation – Adj. EBITDA in upper half of volume growth supported
Slide 35: Preparations for APD Performance Materials closing
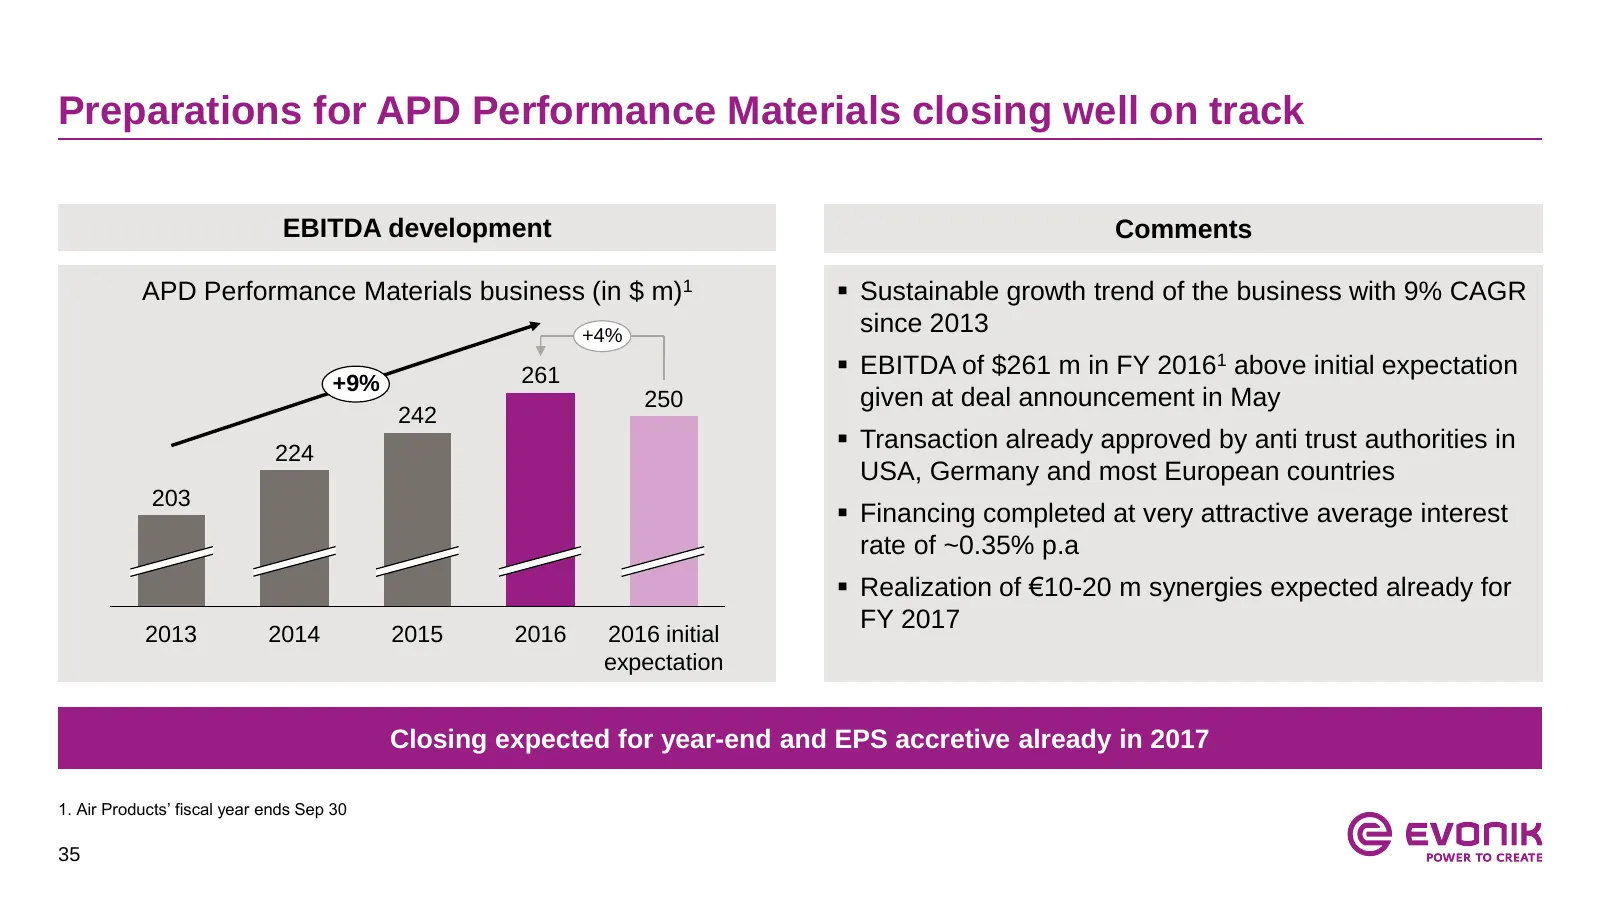
Preparations for APD Performance Materials closing well on track EBITDA development Comments APD Performance Materials business (in $ m)1 Sustainable growth trend of the business with 9% CAGR +4% since 2013 261 EBITDA of $261 m in FY 20161 above initial expectation +9% 250 given at deal announce
Slide 36: Financial highlights Q3 2016
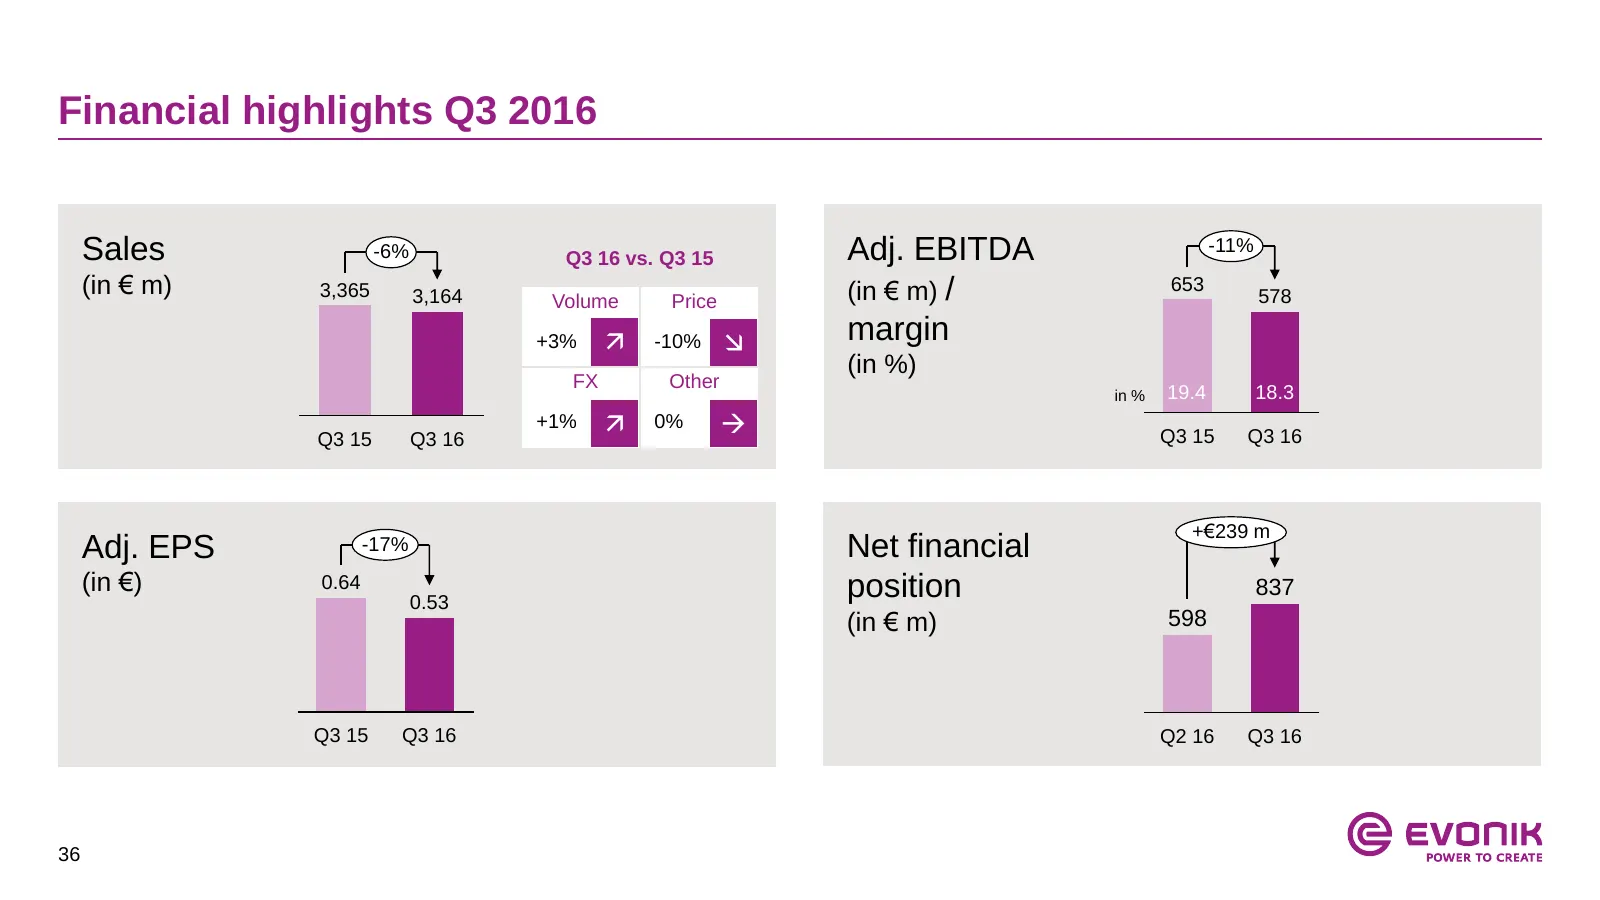
Financial highlights Q3 2016 Sales -6% Q3 16 vs. Q3 15 Adj. EBITDA -11% (in € m) 3,365 3,164 (in € m) / 653 578 Volume Price +3% -10% margin (in %) FX Other in % 19.4 18.3 Q3 15 Q3 16 +1% 0% Q3 15 Q3 16 +€239 m Adj. EPS -17% Net financial (in €) 0.64 position 837 0.53 (in € m) 598 Q3 15 Q3
Slide 37: Cash flow development
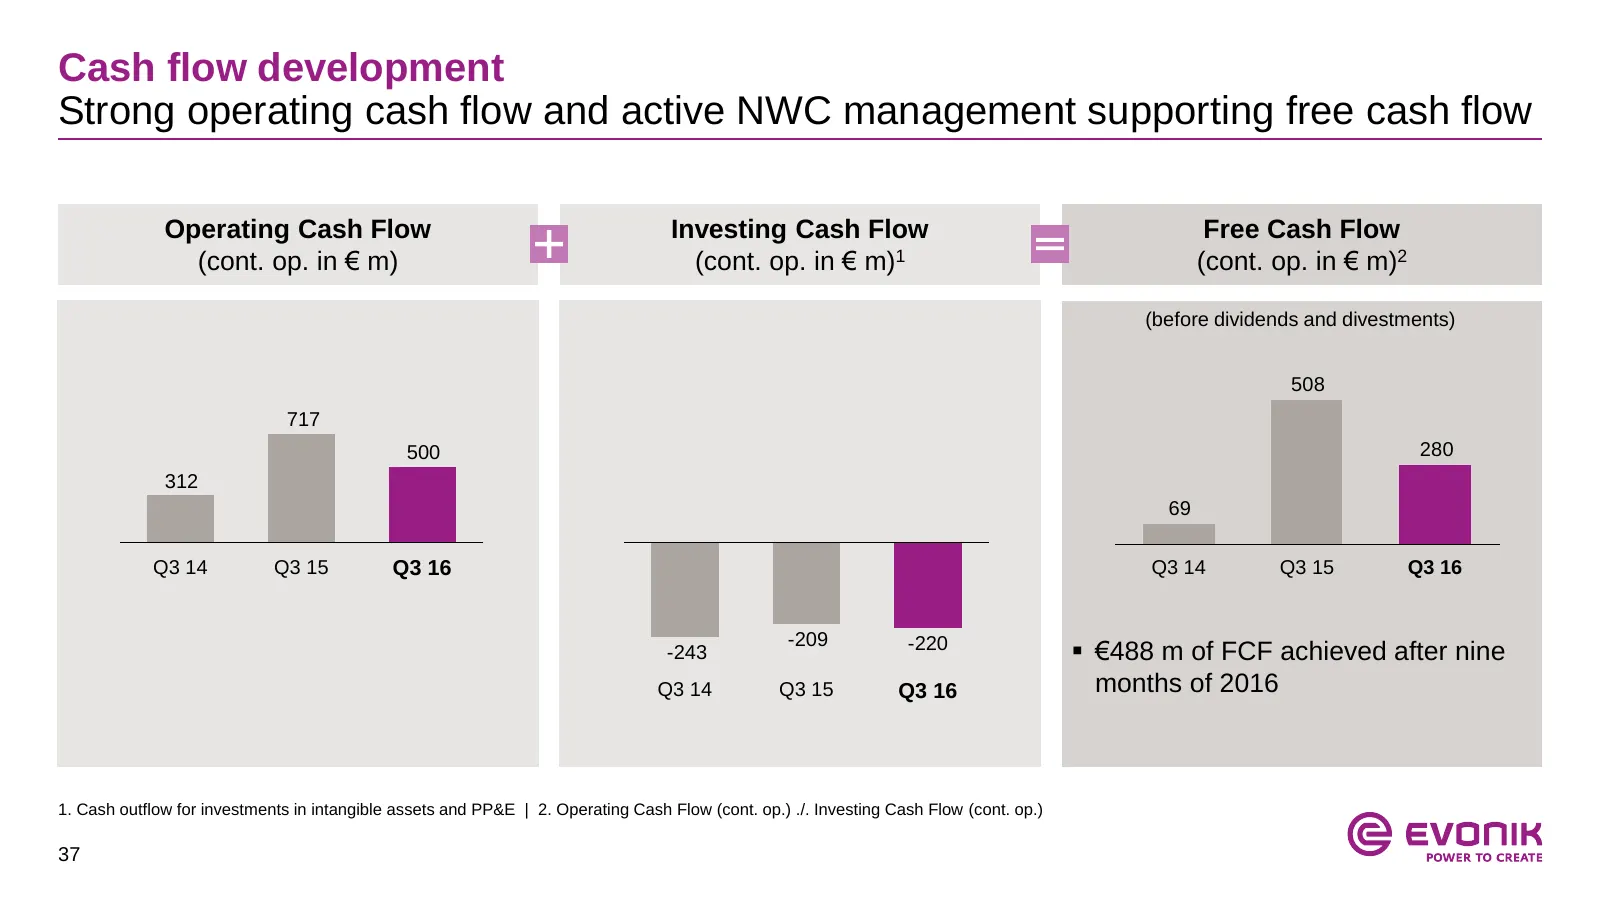
Cash flow development Strong operating cash flow and active NWC management supporting free cash flow Operating Cash Flow Investing Cash Flow Free Cash Flow (cont. op. in € m) (cont. op. in € m)1 (cont. op. in € m)2 (before dividends and divestments) 508 717 500 280 312 69 Q3 14 Q3 15 Q3 16 Q3 14 Q3
Slide 38: Nutrition & Care
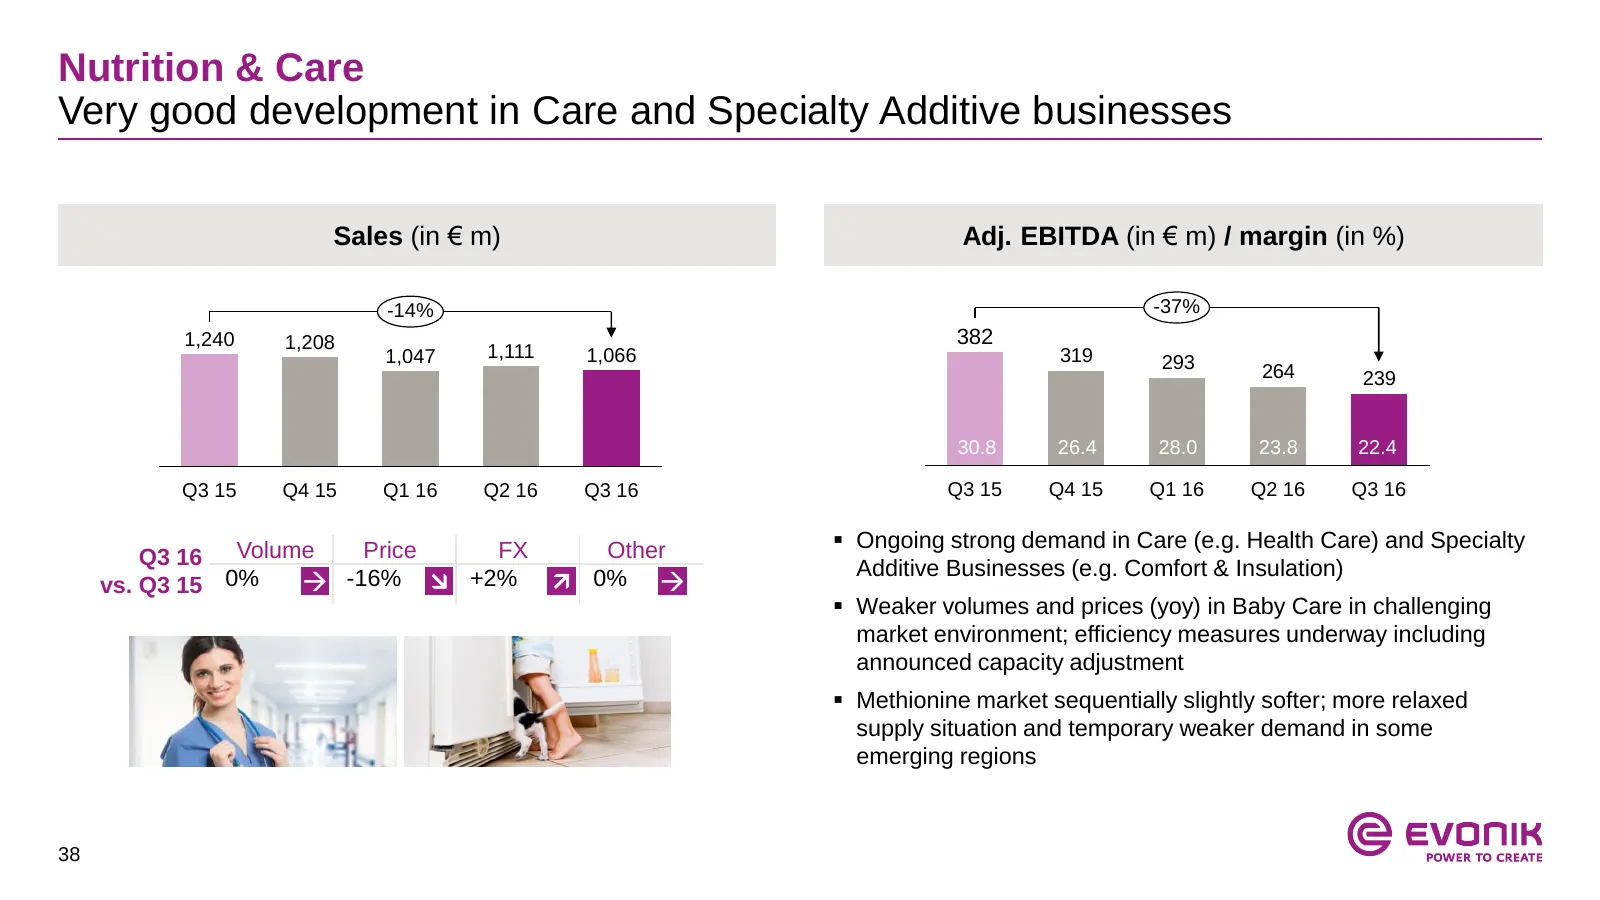
Nutrition & Care Very good development in Care and Specialty Additive businesses Sales (in € m) Adj. EBITDA (in € m) / margin (in %) -14% -37% 1,240 1,208 382 1,047 1,111 1,066 319 293 264 239 30.8 26.4 28.0 23.8 22.4 Q3 15 Q4 15 Q1 16 Q2 16 Q3 16 Q3 15 Q4 15 Q1 16 Q2 16 Q3 16 Ongoing strong deman
Slide 39: Resource Efficiency
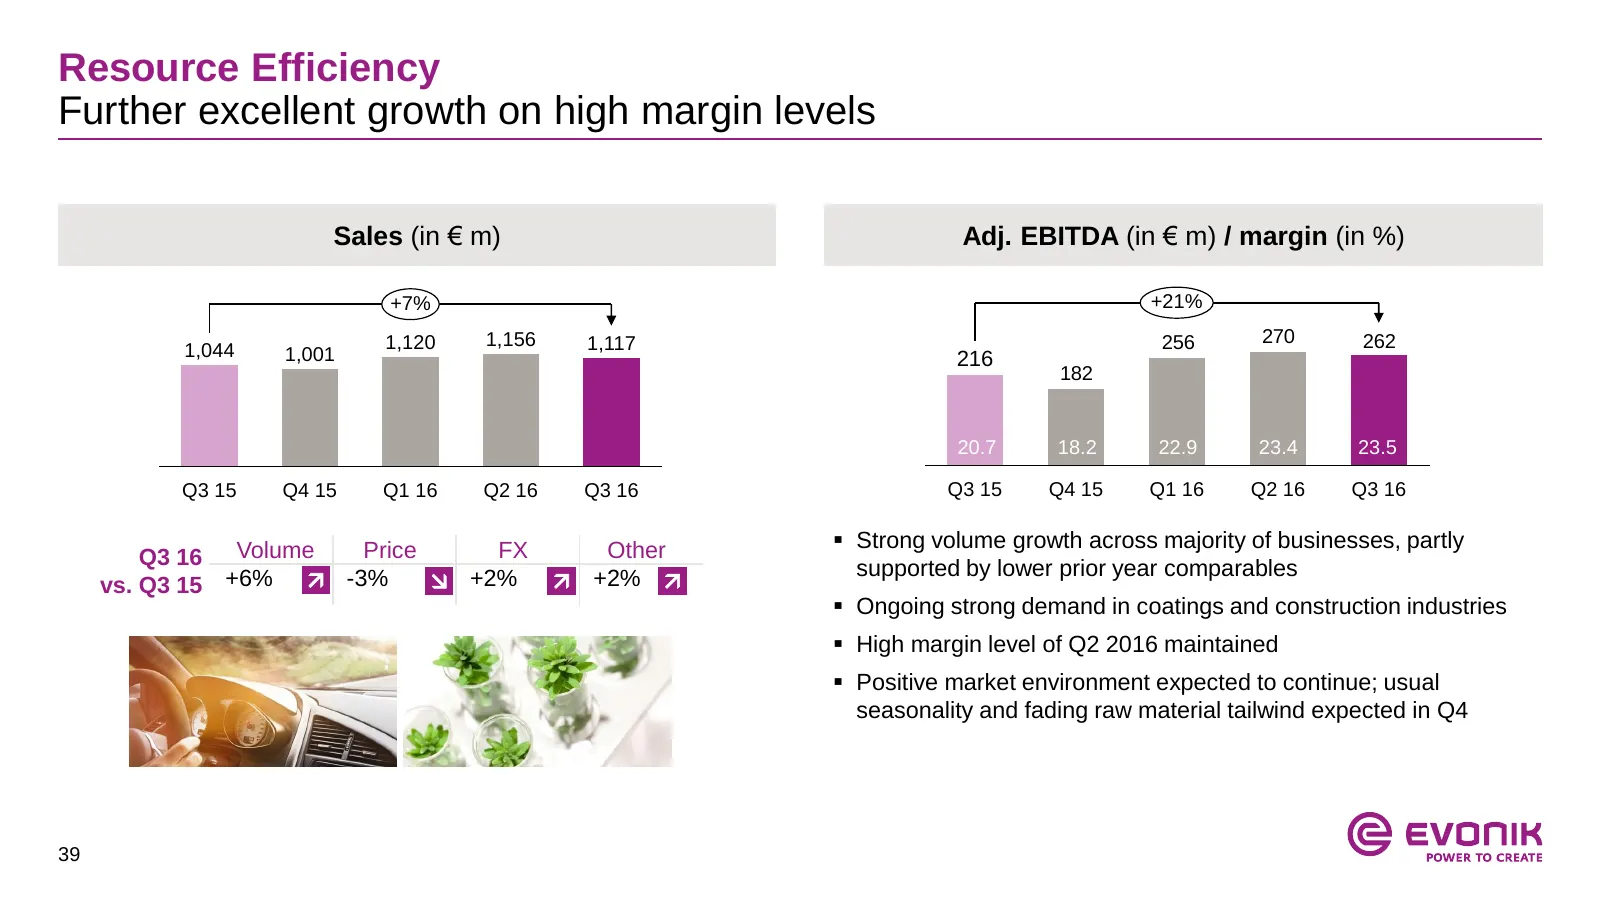
Resource Efficiency Further excellent growth on high margin levels Sales (in € m) Adj. EBITDA (in € m) / margin (in %) +7% +21% 1,120 1,156 1,117 256 270 262 1,044 1,001 216 182 20.7 18.2 22.9 23.4 23.5 Q3 15 Q4 15 Q1 16 Q2 16 Q3 16 Q3 15 Q4 15 Q1 16 Q2 16 Q3 16 Strong volume growth across majorit
Slide 40: Performance Materials
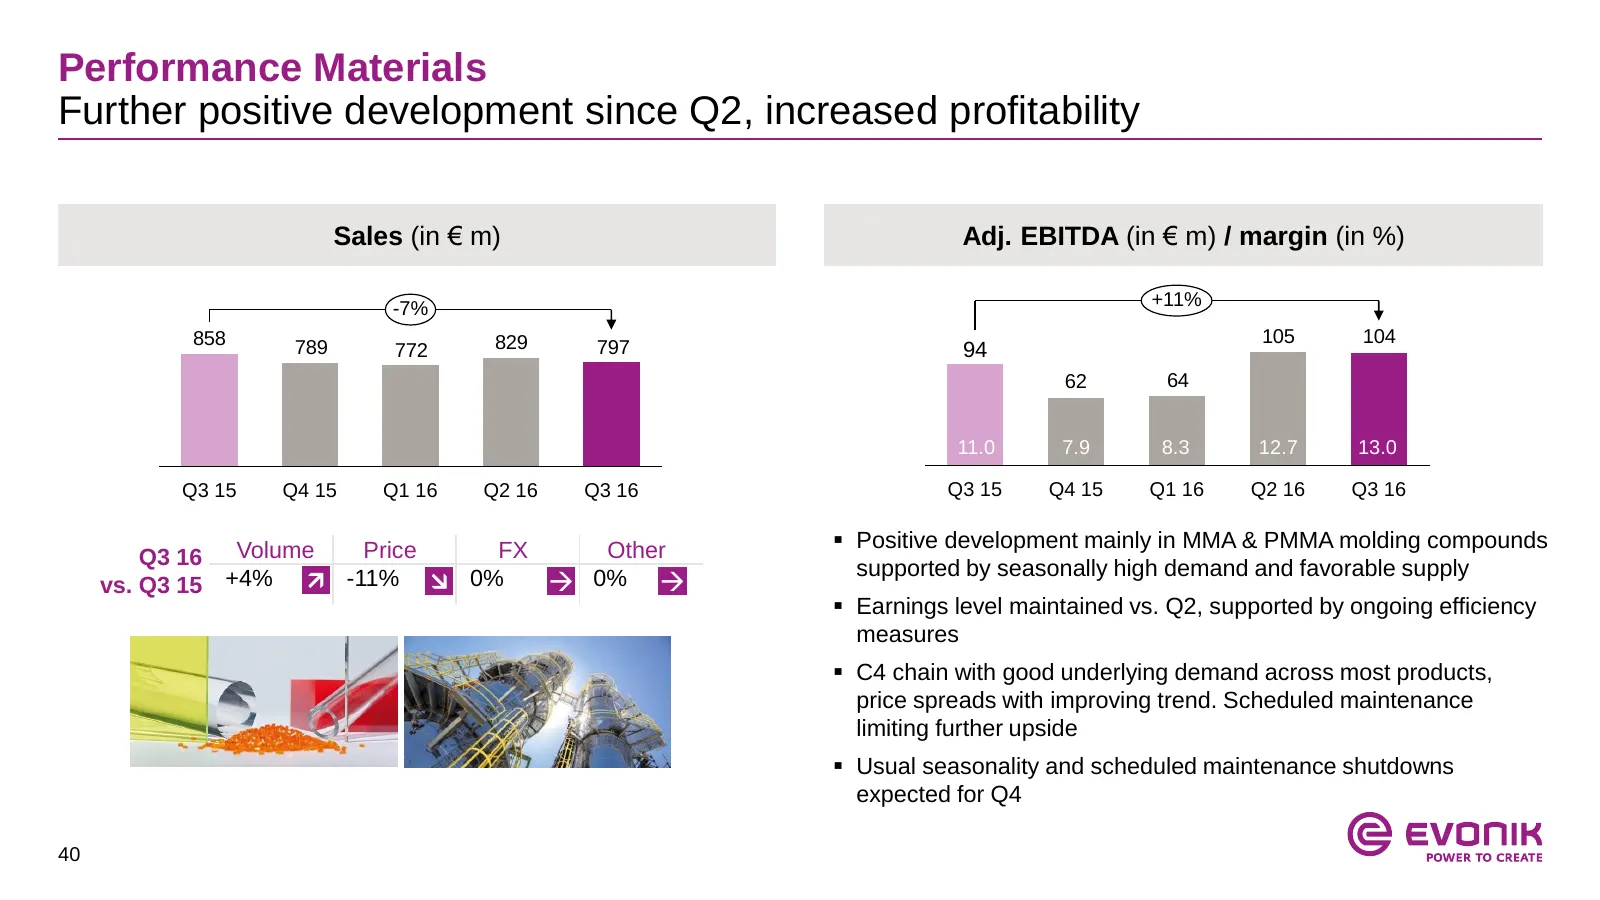
Performance Materials Further positive development since Q2, increased profitability Sales (in € m) Adj. EBITDA (in € m) / margin (in %) -7% +11% 858 829 105 104 789 772 797 94 62 64 11.0 7.9 8.3 12.7 13.0 Q3 15 Q4 15 Q1 16 Q2 16 Q3 16 Q3 15 Q4 15 Q1 16 Q2 16 Q3 16 Positive development mainly in M
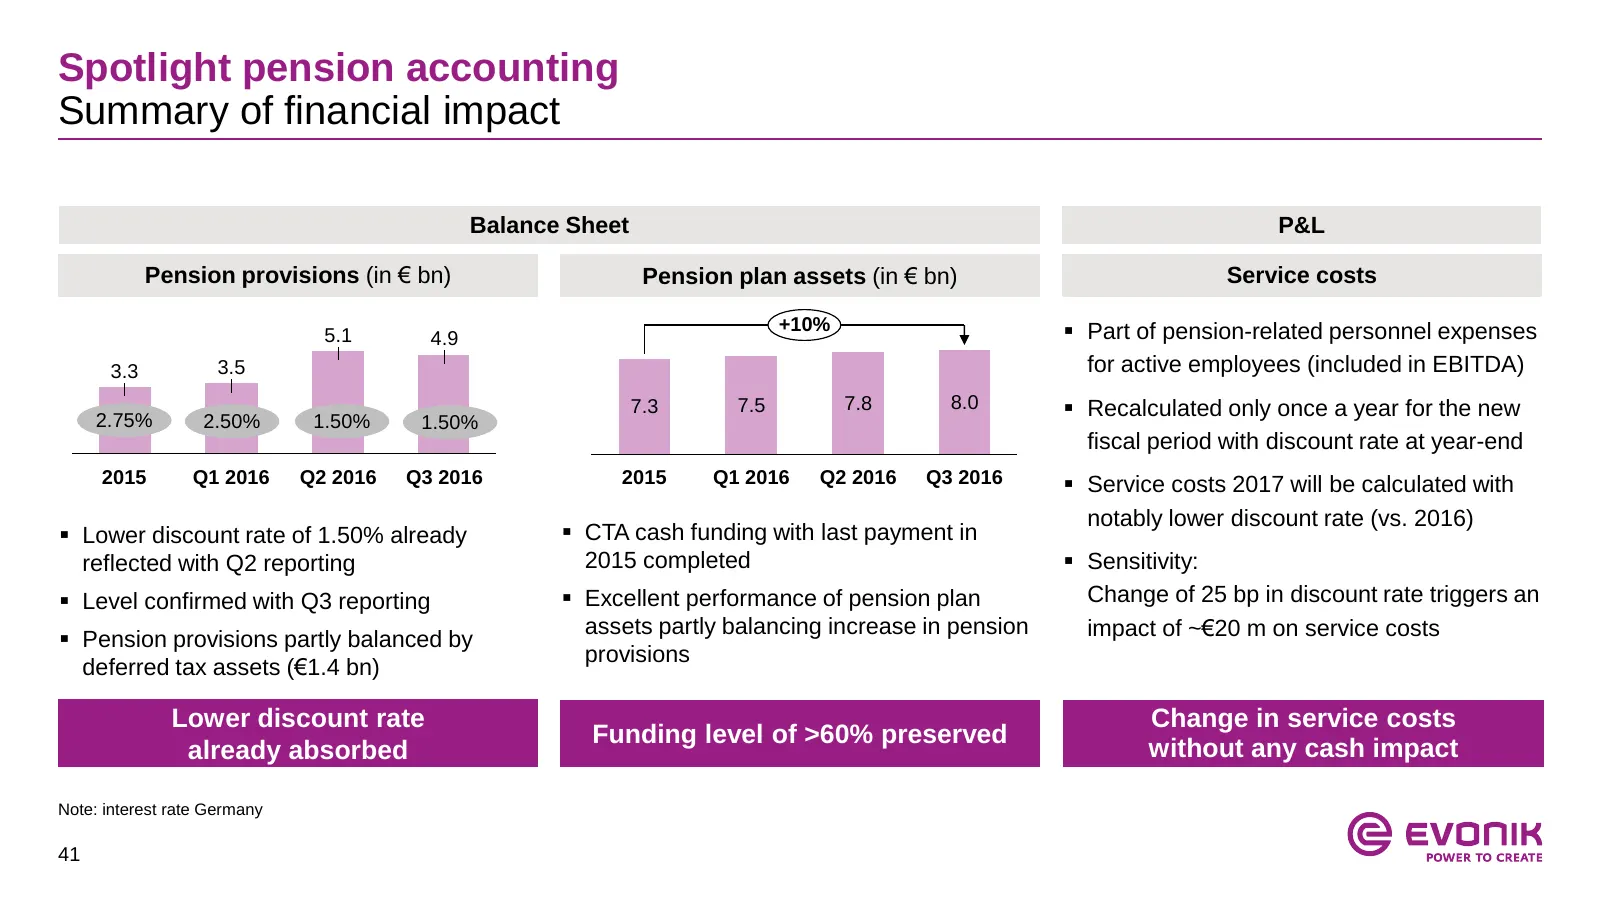
Slide 41: Spotlight pension accounting
Spotlight pension accounting Summary of financial impact Balance Sheet P&L Pension provisions (in € bn) Pension plan assets (in € bn) Service costs +10% Part of pension-related personnel expenses 5.1 4.9 3.3 3.5 for active employees (included in EBITDA) 7.3 7.5 7.8 8.0 Recalculated only once a y
Slide 42: © evonik
© evonik
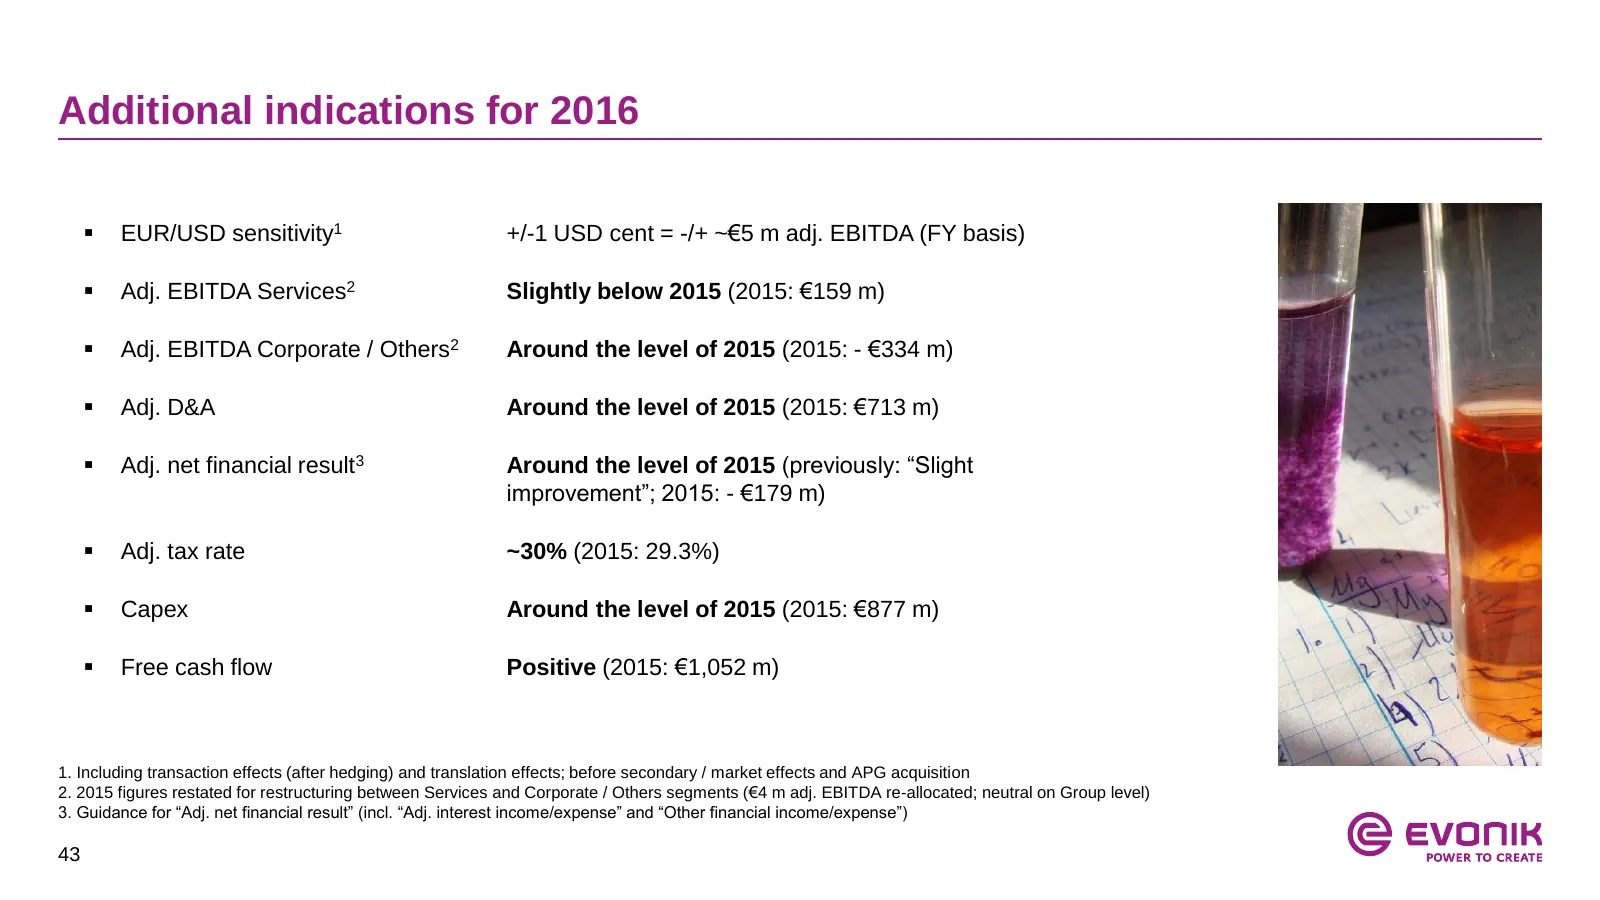
Slide 43: Additional indications for 2016
Additional indications for 2016 EUR/USD sensitivity1 +/-1 USD cent = -/+ ~€5 m adj. EBITDA (FY basis) Adj. EBITDA Services2 Slightly below 2015 (2015: €159 m) Adj. EBITDA Corporate / Others2 Around the level of 2015 (2015: - €334 m) Adj. D&A Around the level of 2015 (2015: €713 m) Adj. net
Slide 44: Table of contents
Table of contents 1. Appendix to Acquisition of APD Performance Materials 2. Segment overview 3. Financials 4. Investor Relations contact 44
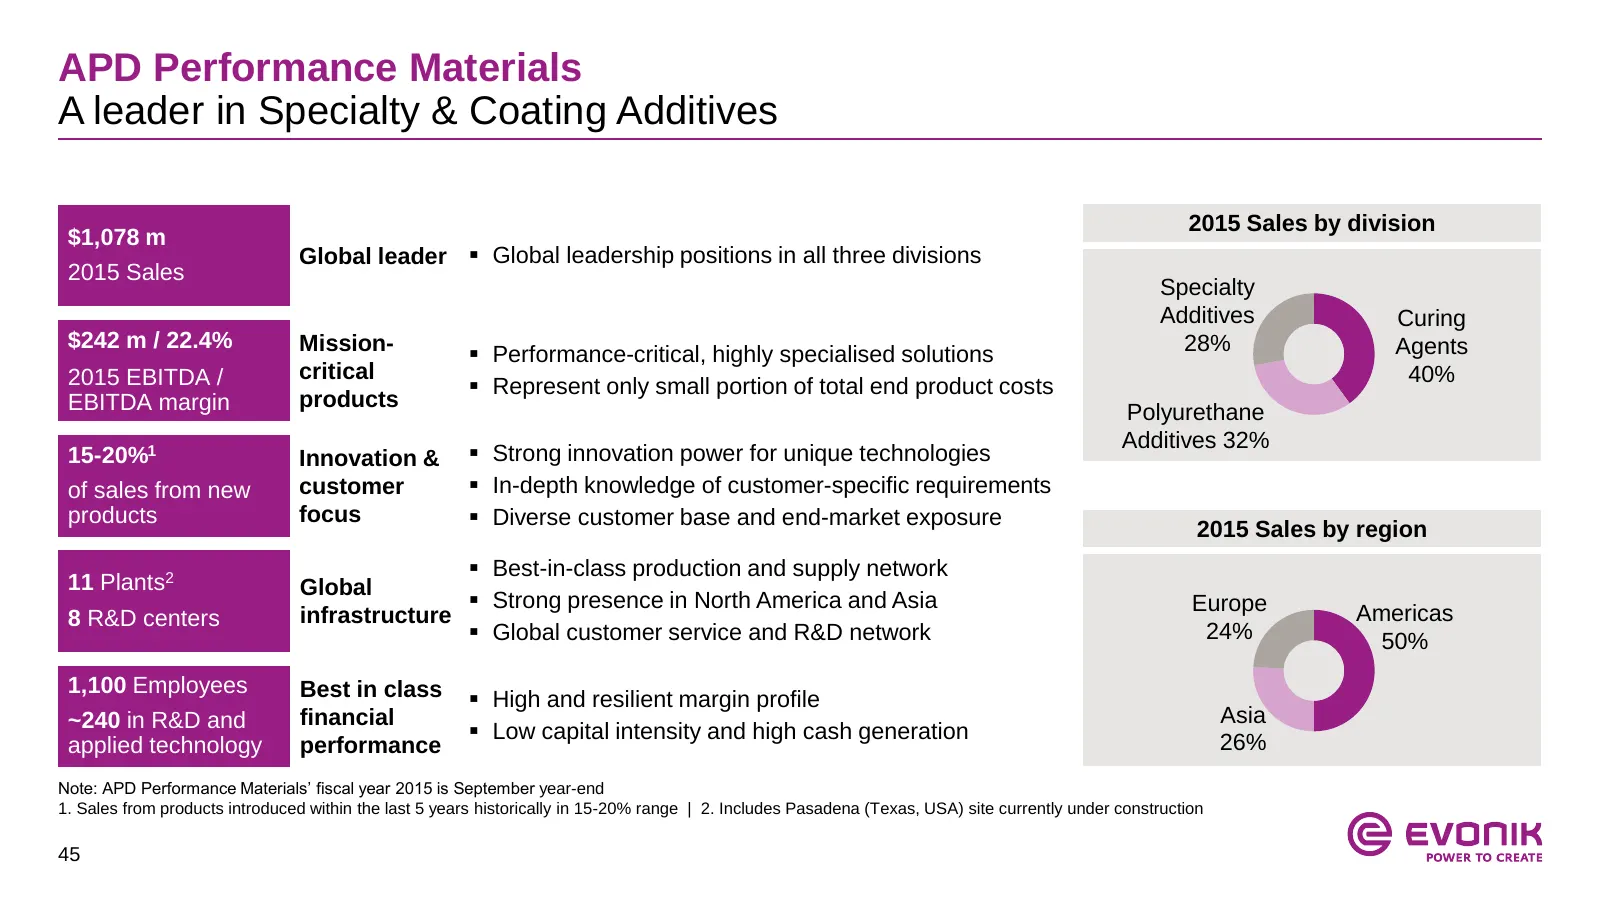
Slide 45: APD Performance Materials: A leader in Specialty & Coating Additives
APD Performance Materials A leader in Specialty & Coating Additives 2015 Sales by division $1,078 m Global leader Global leadership positions in all three divisions 2015 Sales Specialty Additives Curing $242 m / 22.4% Mission- 28% Agents Performance-critical, highly specialised solutions 2015 EB
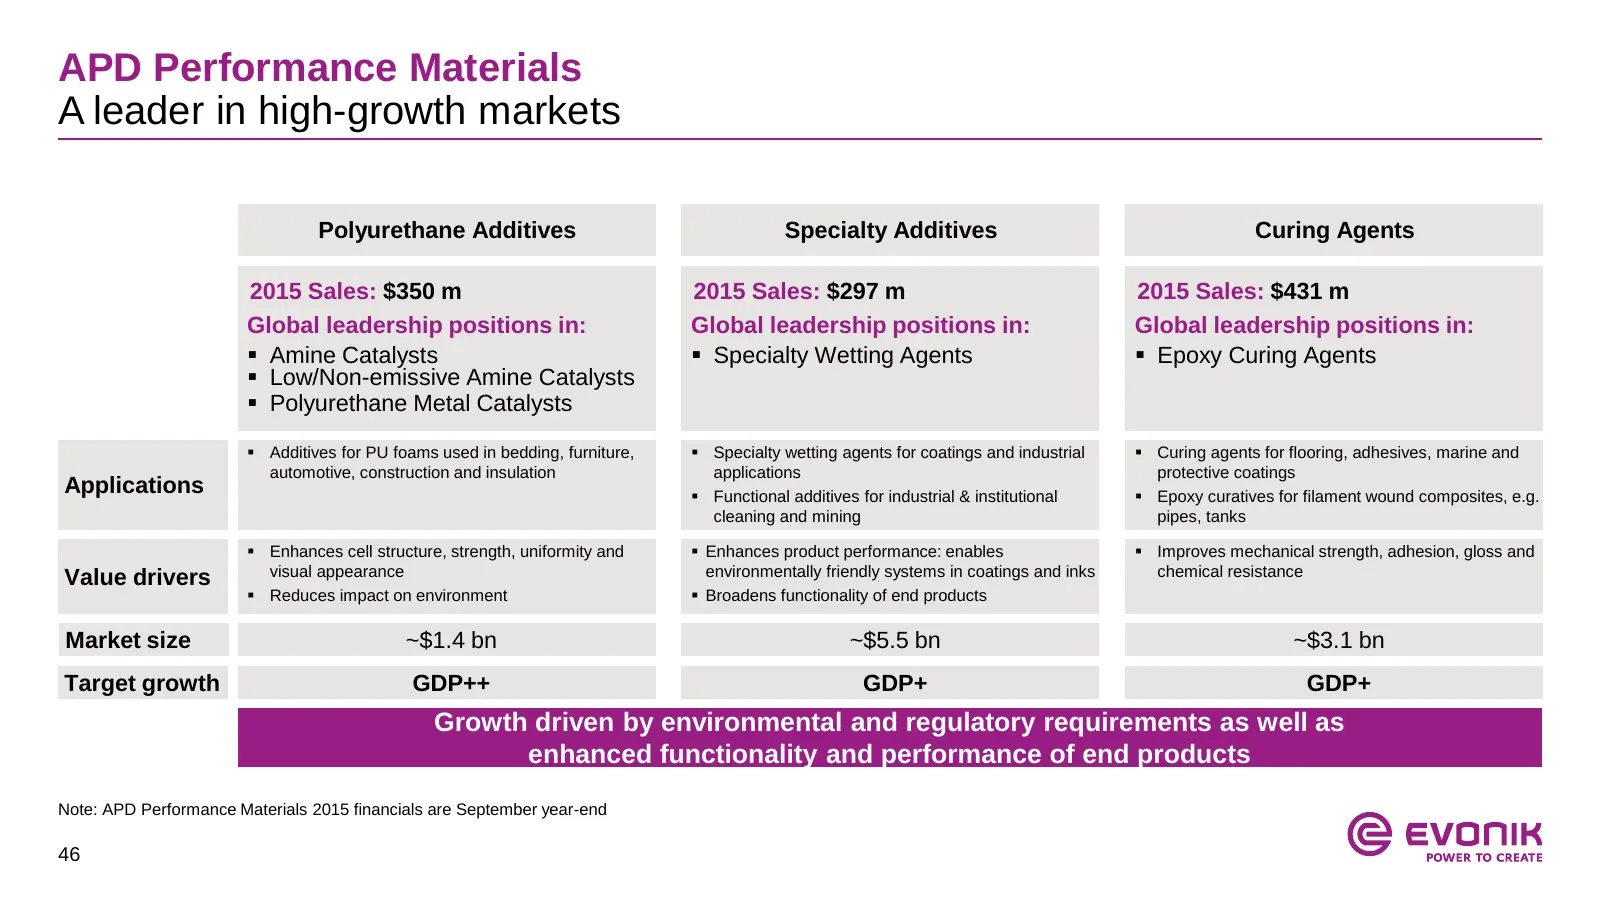
Slide 46: APD Performance Materials: A leader in high-growth markets
APD Performance Materials A leader in high-growth markets Polyurethane Additives Specialty Additives Curing Agents 2015 Sales: $350 m 2015 Sales: $297 m 2015 Sales: $431 m Global leadership positions in: Global leadership positions in: Global leadership positions in: Amine Catalysts Specialty We
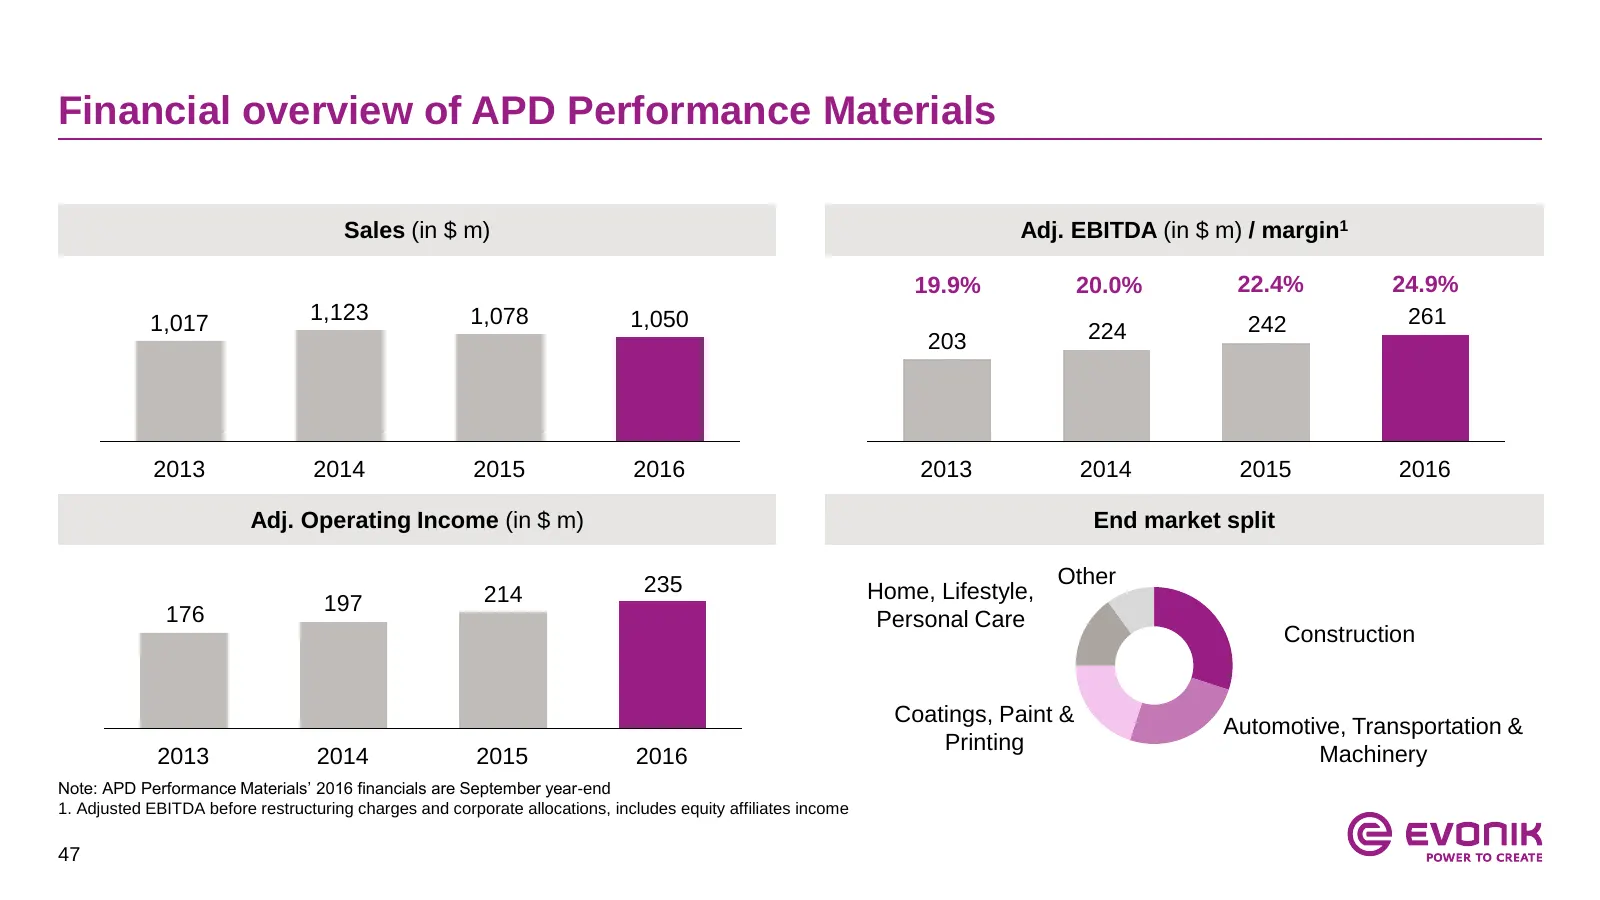
Slide 47: Financial overview of APD Performance Materials
Financial overview of APD Performance Materials Sales (in $ m) Adj. EBITDA (in $ m) / margin1 19.9% 20.0% 22.4% 24.9% 1,017 1,123 1,078 1,050 261 224 242 203 2013 2014 2015 2016 2013 2014 2015 2016 Adj. Operating Income (in $ m) End market split 235 Other 214 Home, Lifestyle, 176 197 Personal Care C
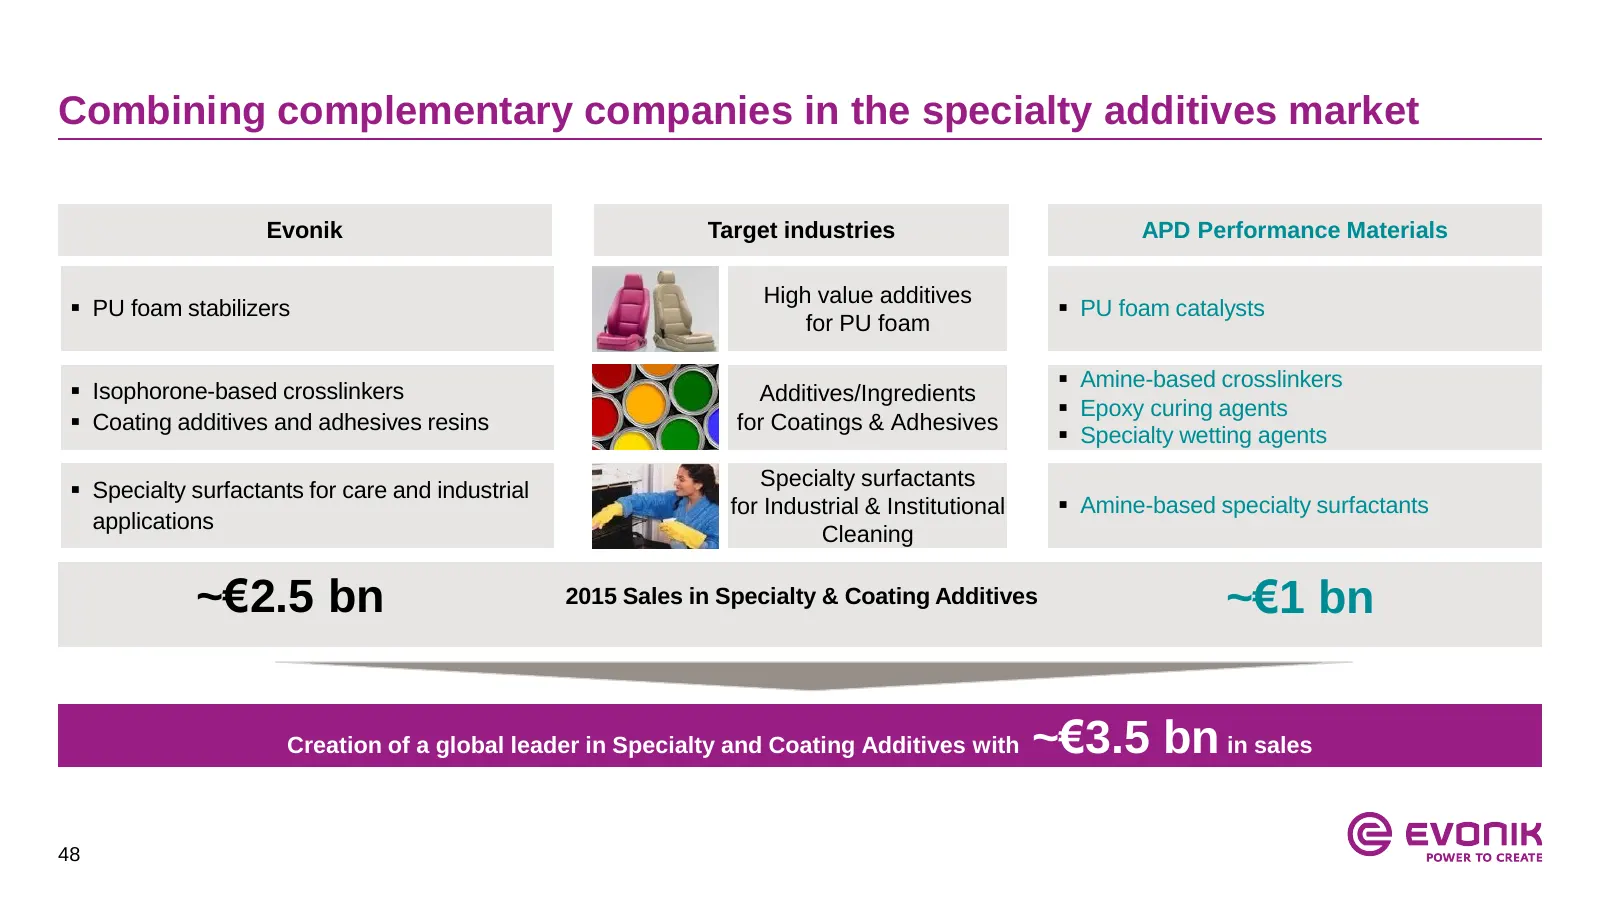
Slide 48: Combining complementary companies in the specialty additives market
Combining complementary companies in the specialty additives market Evonik Target industries APD Performance Materials High value additives PU foam stabilizers PU foam catalysts for PU foam Amine-based crosslinkers Isophorone-based crosslinkers Additives/Ingredients Epoxy curing agents C
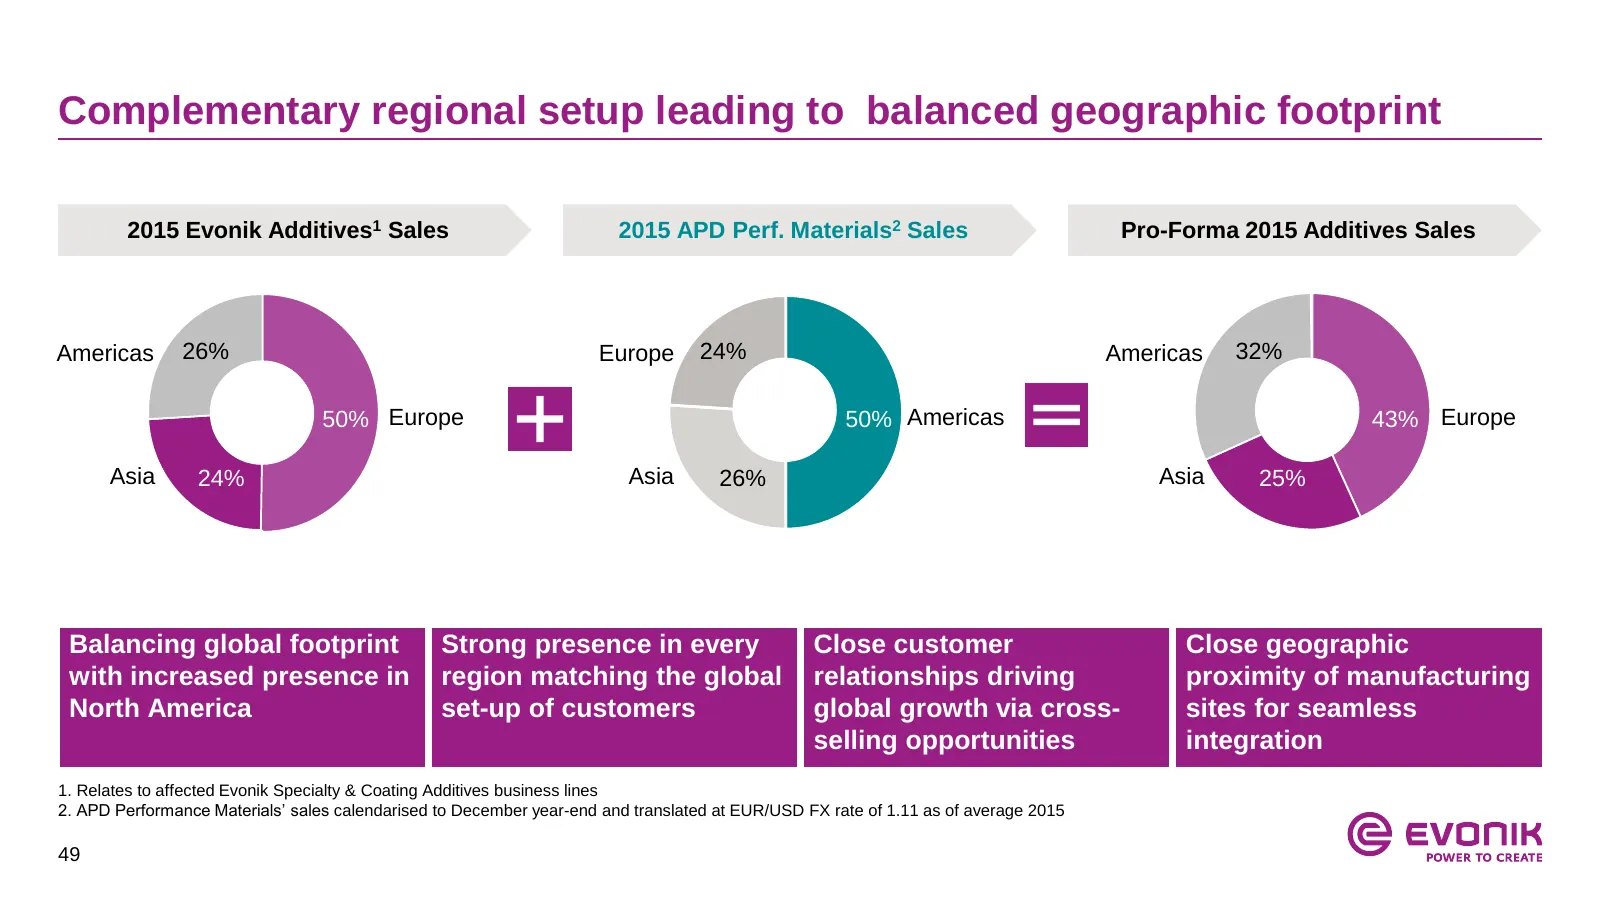
Slide 49: Complementary regional setup
Complementary regional setup leading to balanced geographic footprint 2015 Evonik Additives1 Sales 2015 APD Perf. Materials2 Sales Pro-Forma 2015 Additives Sales Americas 26% Europe 24% Americas 32% 50% Europe 50% Americas 43% Europe Asia 24% Asia 26% Asia 25% Balancing global footprint Strong prese
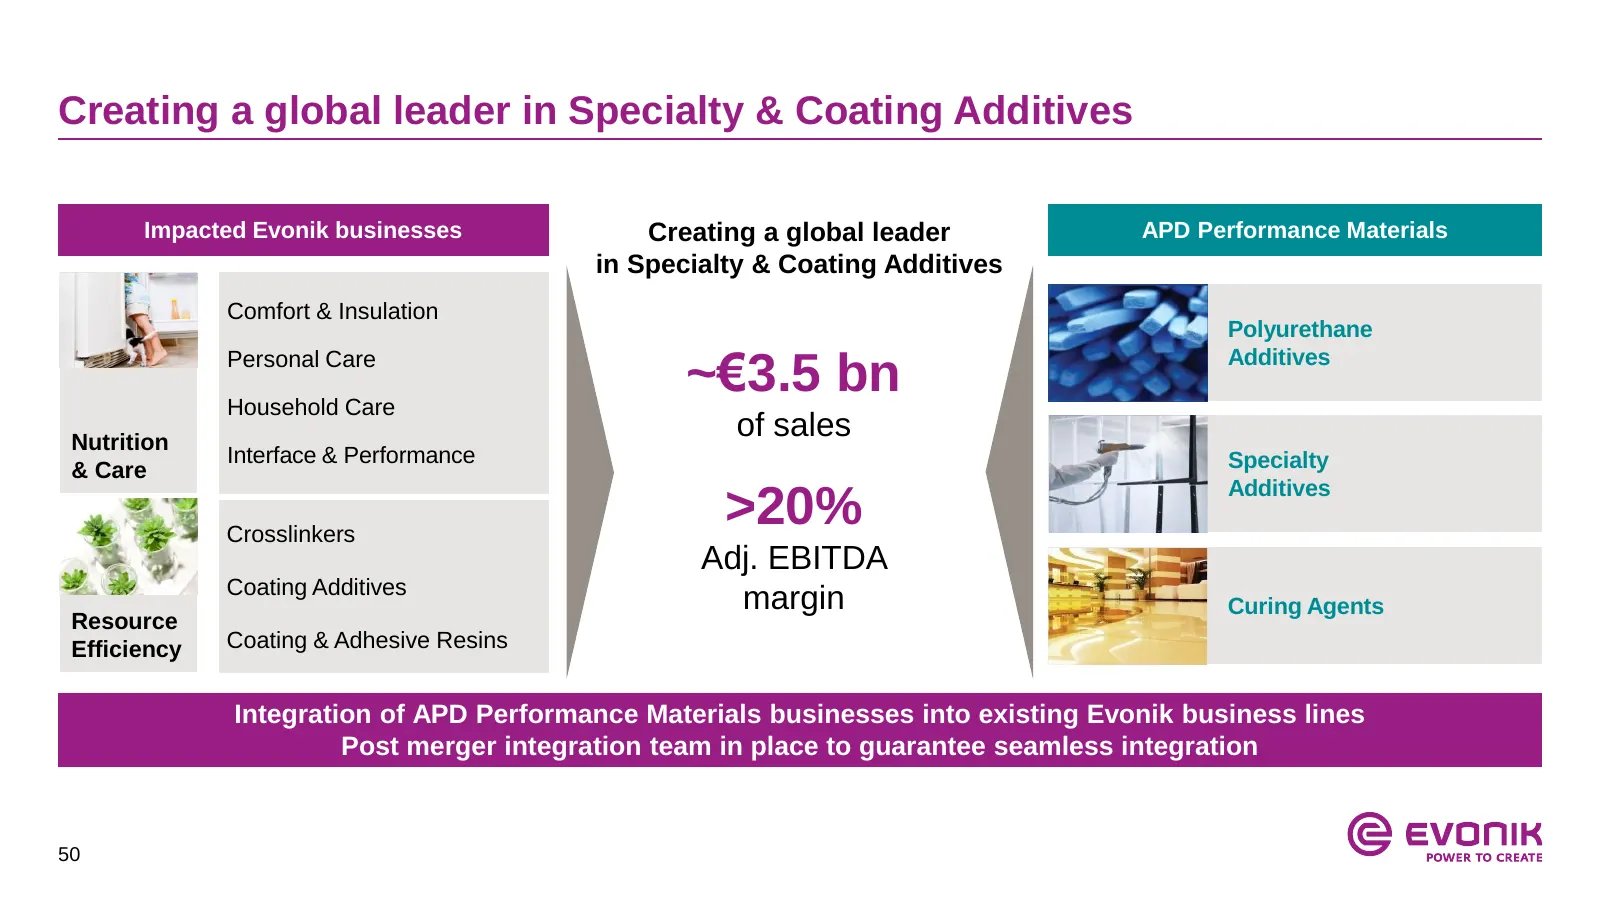
Slide 50: Creating a global leader in Specialty & Coating Additives
Creating a global leader in Specialty & Coating Additives Impacted Evonik businesses Creating a global leader APD Performance Materials in Specialty & Coating Additives Comfort & Insulation Polyurethane Personal Care Additives Household Care ~€3.5 bn Nutrition of sales Interface & Performance Specia
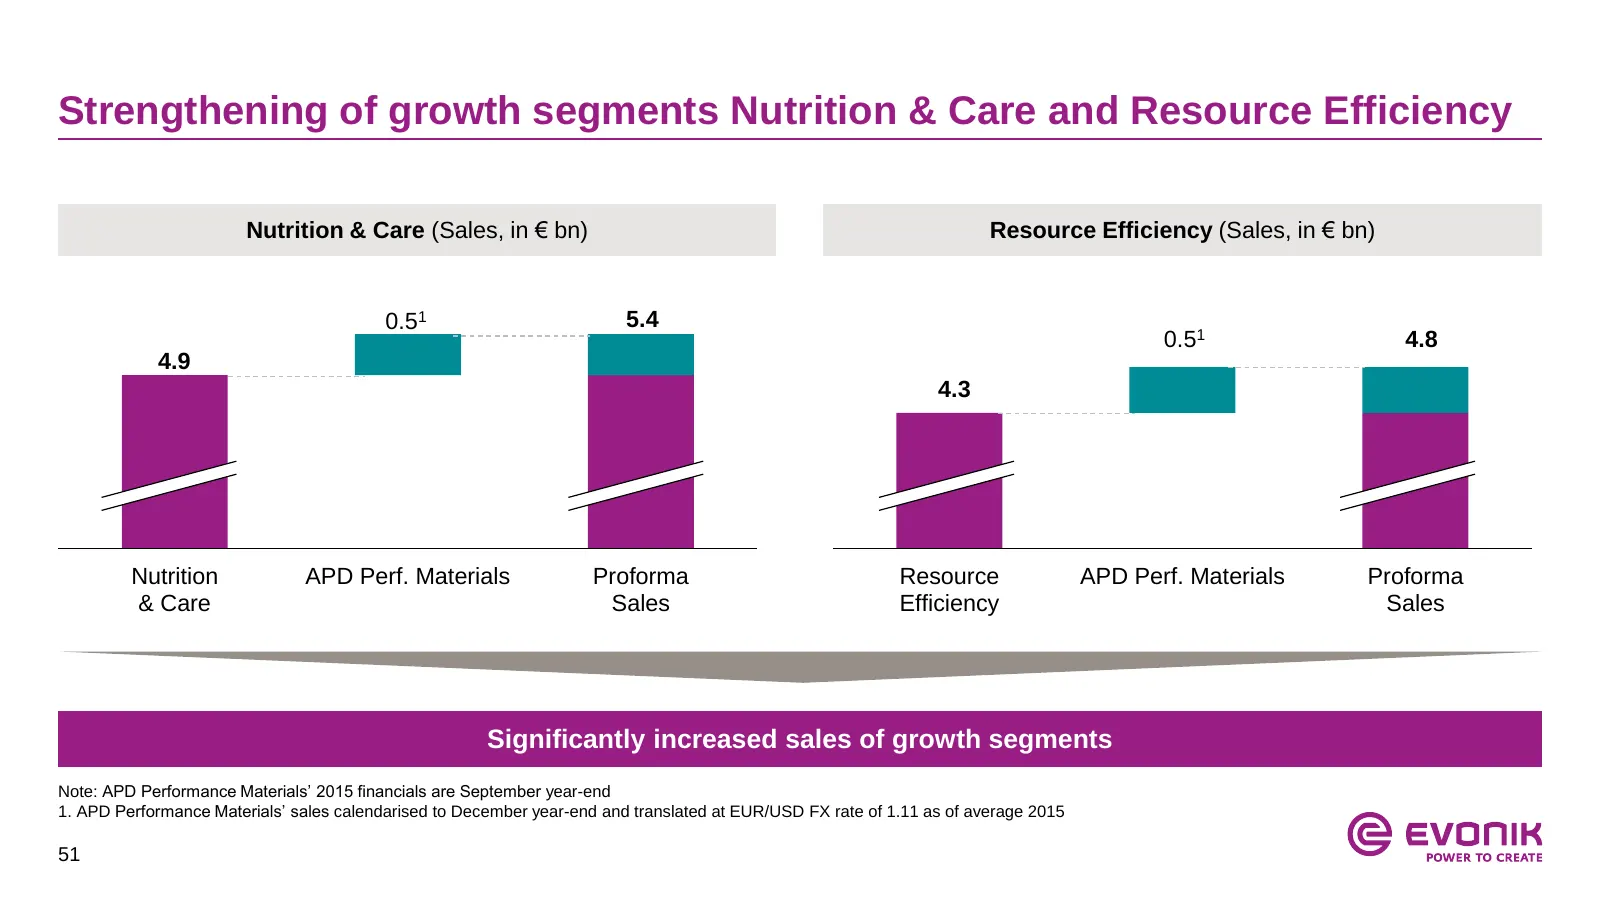
Slide 51: Strengthening of growth segments
Strengthening of growth segments Nutrition & Care and Resource Efficiency Nutrition & Care (Sales, in € bn) Resource Efficiency (Sales, in € bn) 0.51 5.4 0.51 4.8 4.9 4.3 Nutrition APD Perf. Materials Proforma Resource APD Perf. Materials Proforma & Care Sales Efficiency Sales Significantly increase
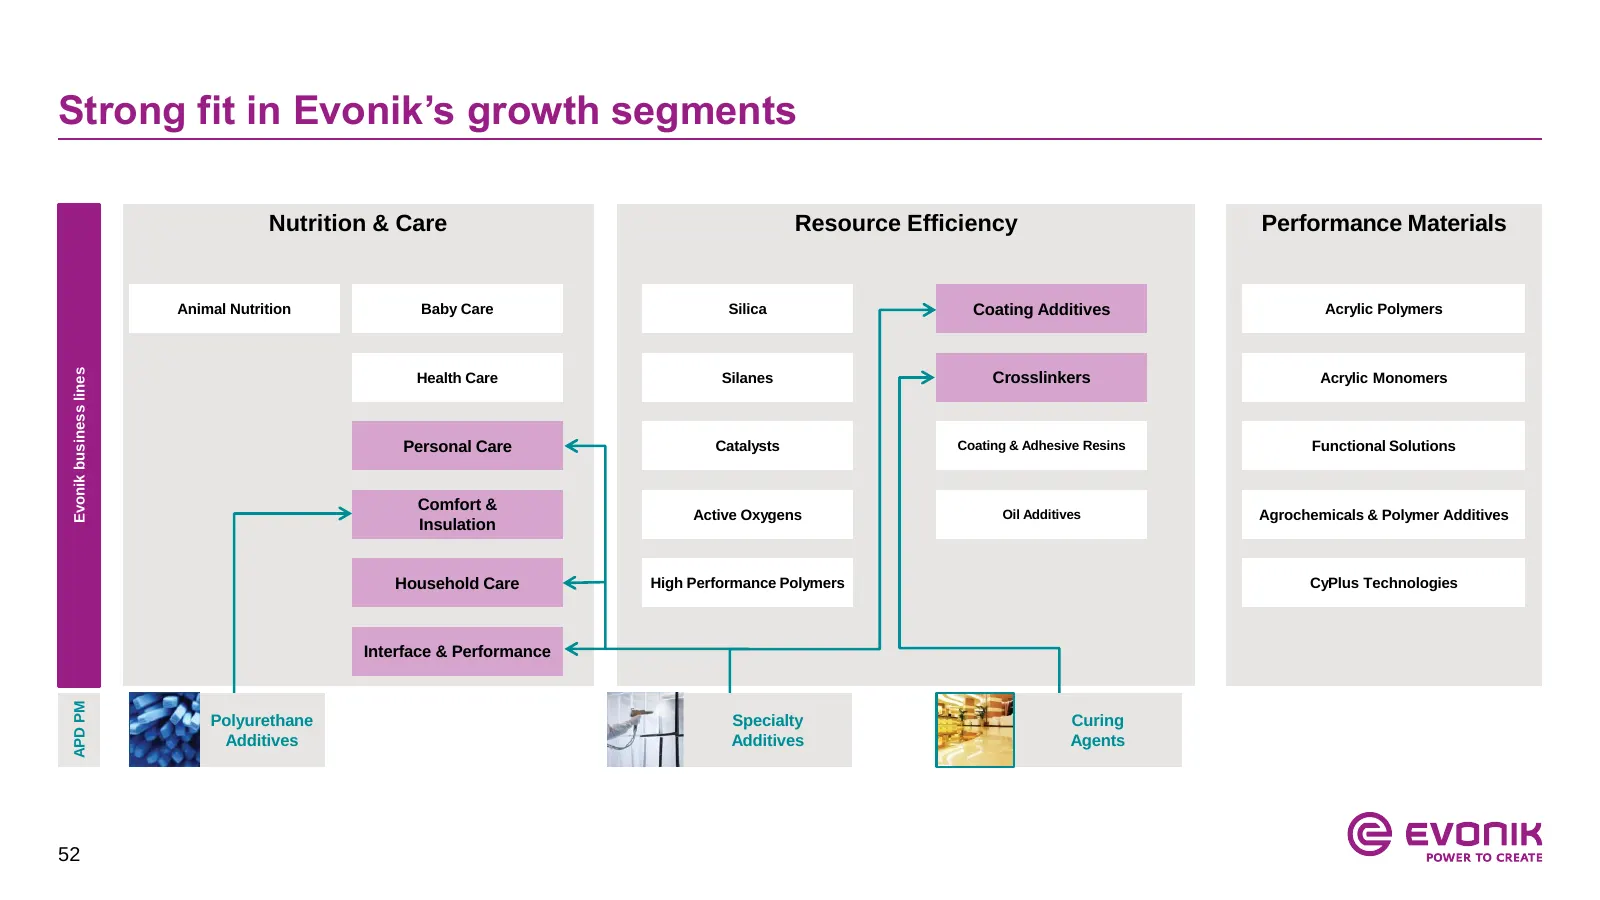
Slide 52: Strong fit in Evonik's growth segments
Strong fit in Evonik’s growth segments Nutrition & Care Resource Efficiency Performance Materials Animal Nutrition Baby Care Silica Coating Additives Acrylic Polymers Evonik business lines Health Care Silanes Crosslinkers Acrylic Monomers Personal Care Catalysts Coating & Adhesive Resins Functional
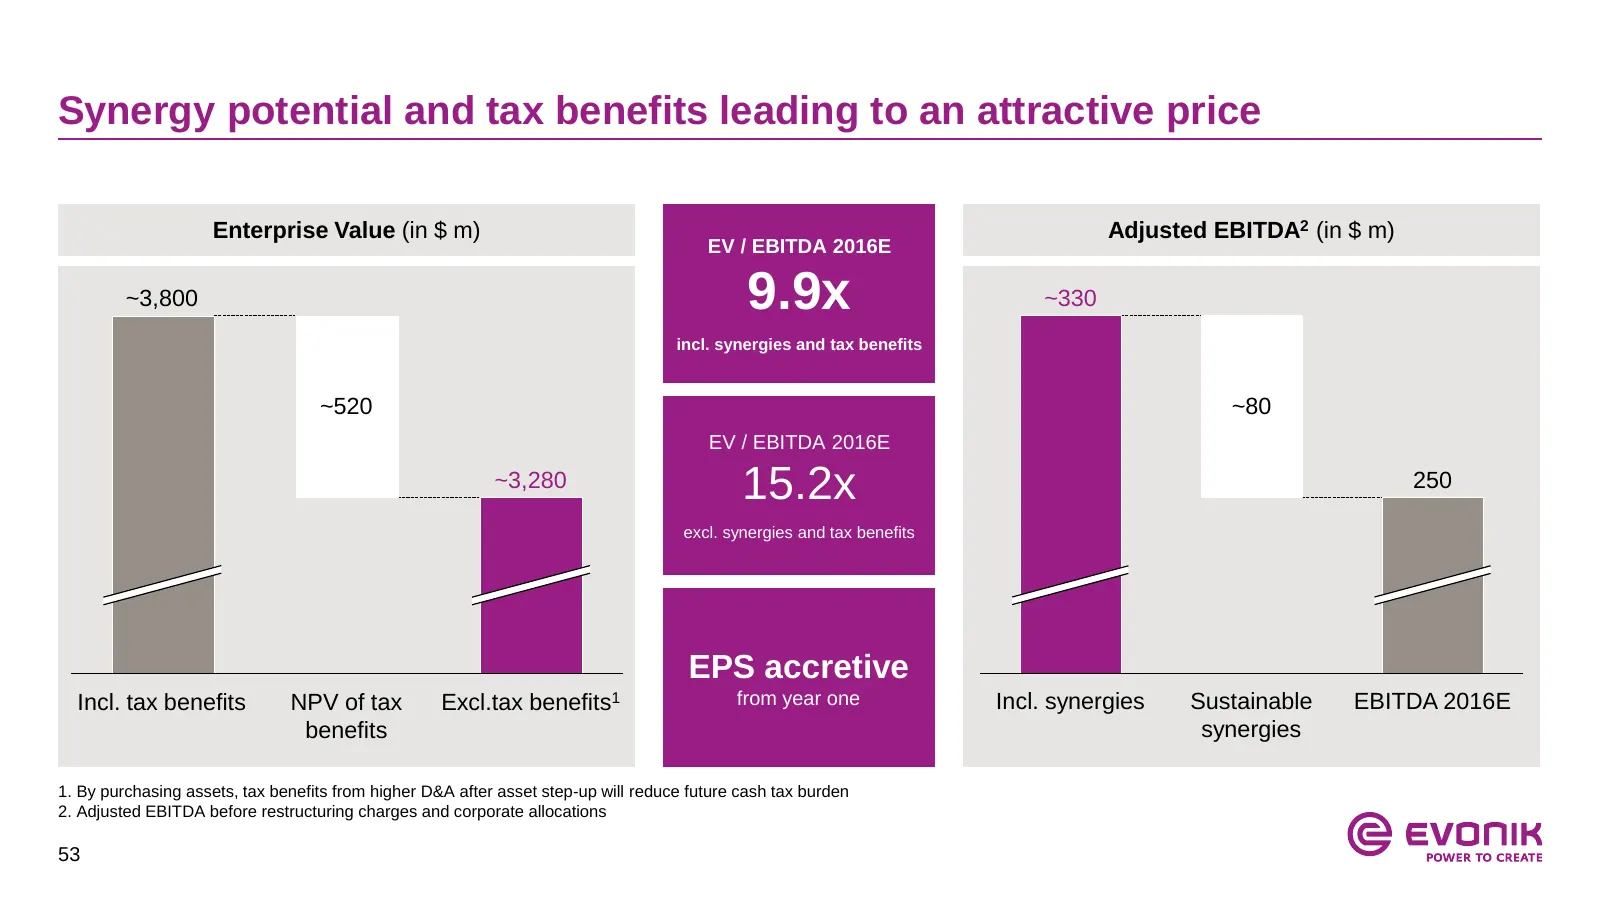
Slide 53: Synergy potential and tax benefits leading to an attractive price
Synergy potential and tax benefits leading to an attractive price Enterprise Value (in $ m) Adjusted EBITDA2 (in $ m) EV / EBITDA 2016E ~3,800 9.9x ~330 incl. synergies and tax benefits ~520 ~80 EV / EBITDA 2016E ~3,280 15.2x 250 excl. synergies and tax benefits EPS accretive Incl. tax benefits NPV
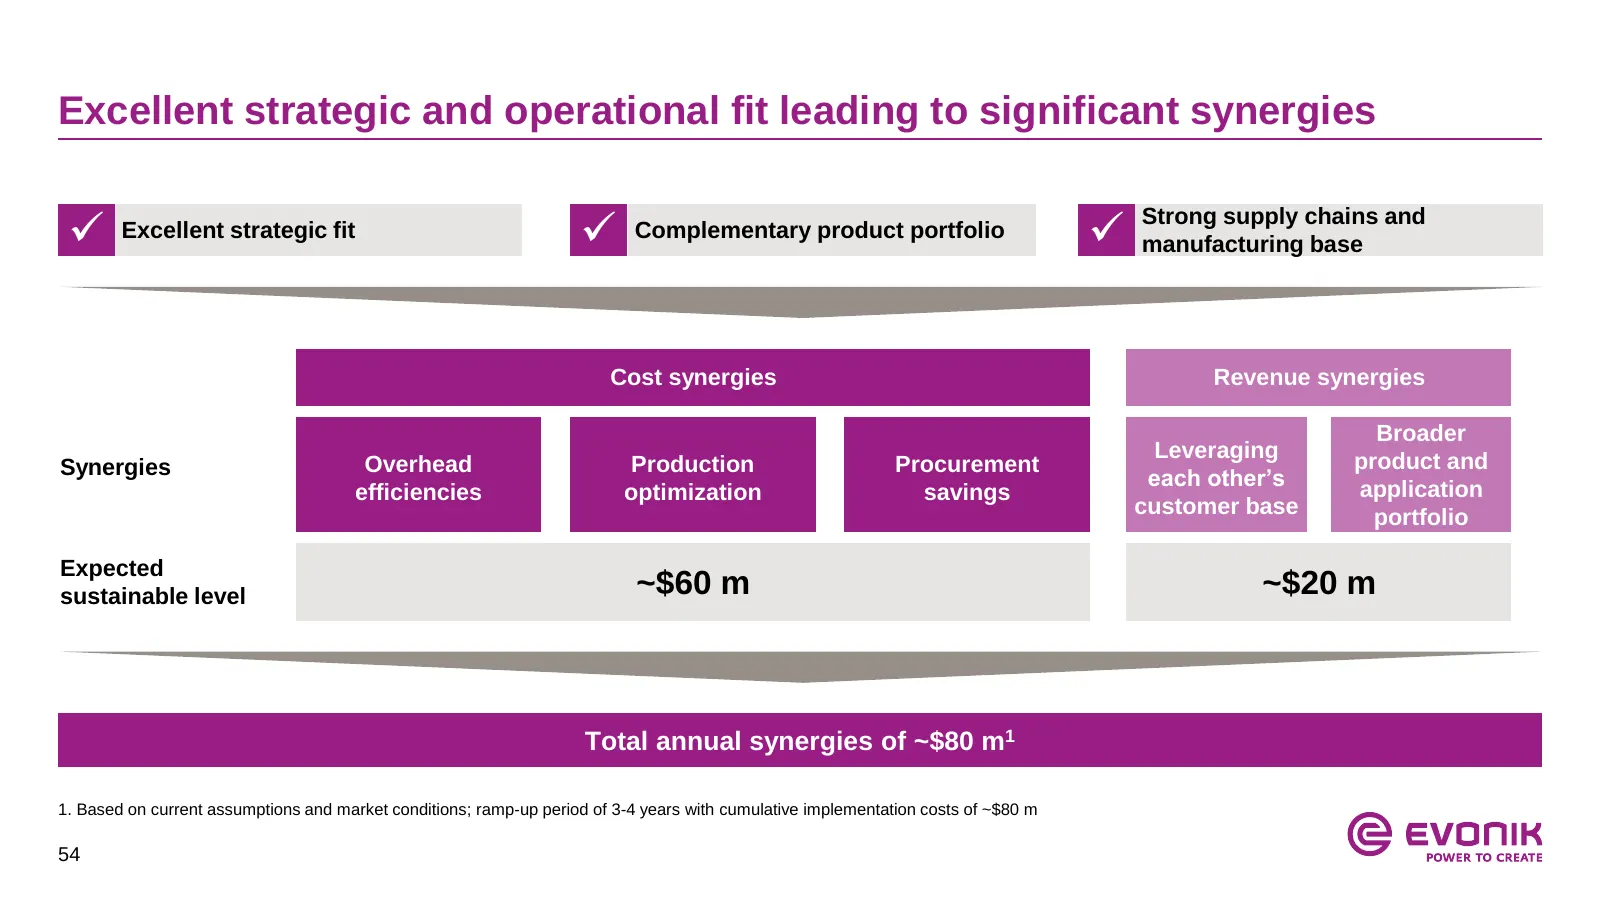
Slide 54: Excellent strategic and operational fit leading to significant synergies
Excellent strategic and operational fit leading to significant synergies Excellent strategic fit Complementary product portfolio Strong supply chains and manufacturing base Cost synergies Revenue synergies Broader Leveraging product and Synergies Overhead Production Procurement each other’s ap
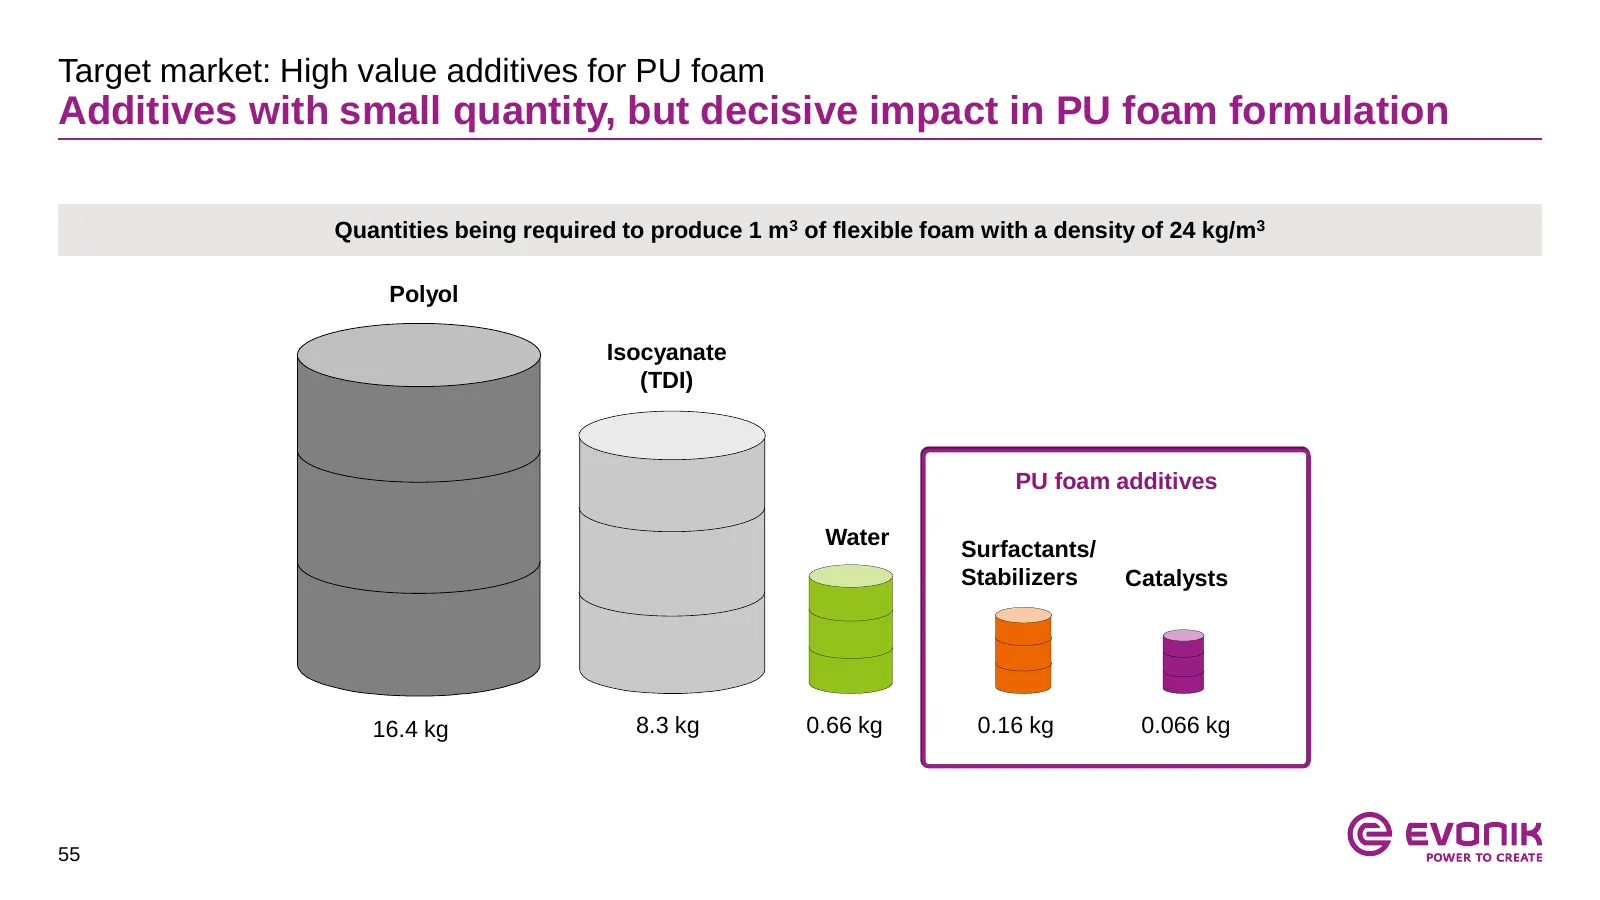
Slide 55: Additives with small quantity, but decisive impact in PU foam
Target market: High value additives for PU foam Additives with small quantity, but decisive impact in PU foam formulation Quantities being required to produce 1 m3 of flexible foam with a density of 24 kg/m3 Polyol Isocyanate (TDI) PU foam additives Water Surfactants/ Stabilizers Catalysts 16.4 kg 8
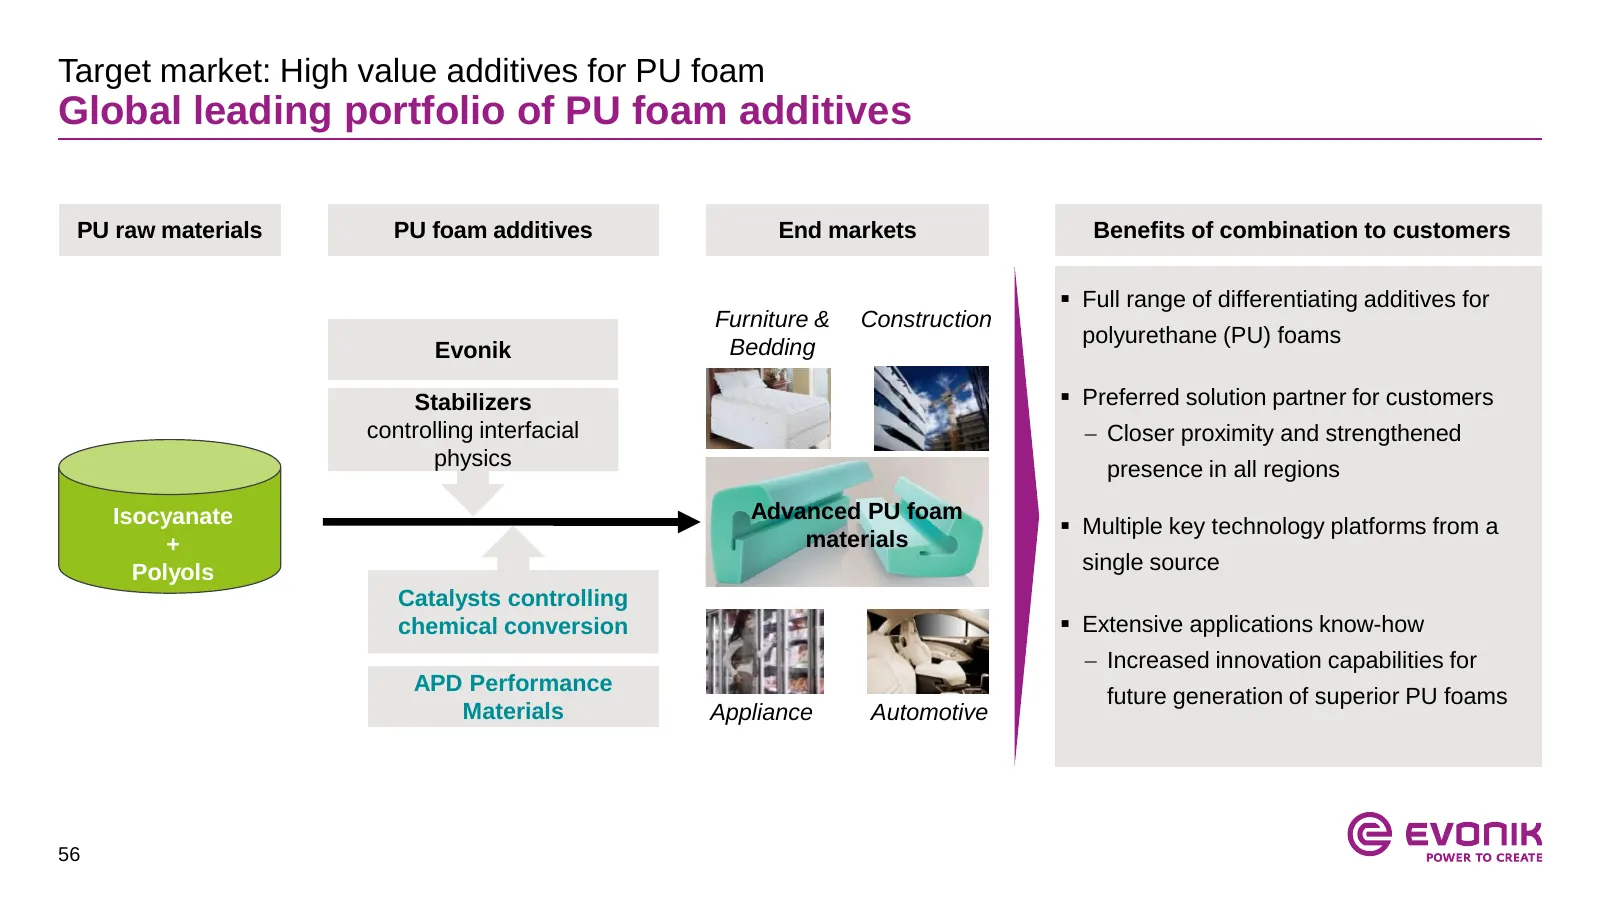
Slide 56: Global leading portfolio of PU foam additives
Target market: High value additives for PU foam Global leading portfolio of PU foam additives PU raw materials PU foam additives End markets Benefits of combination to customers Full range of differentiating additives for Furniture & Construction polyurethane (PU) foams Evonik Bedding Stabilizers
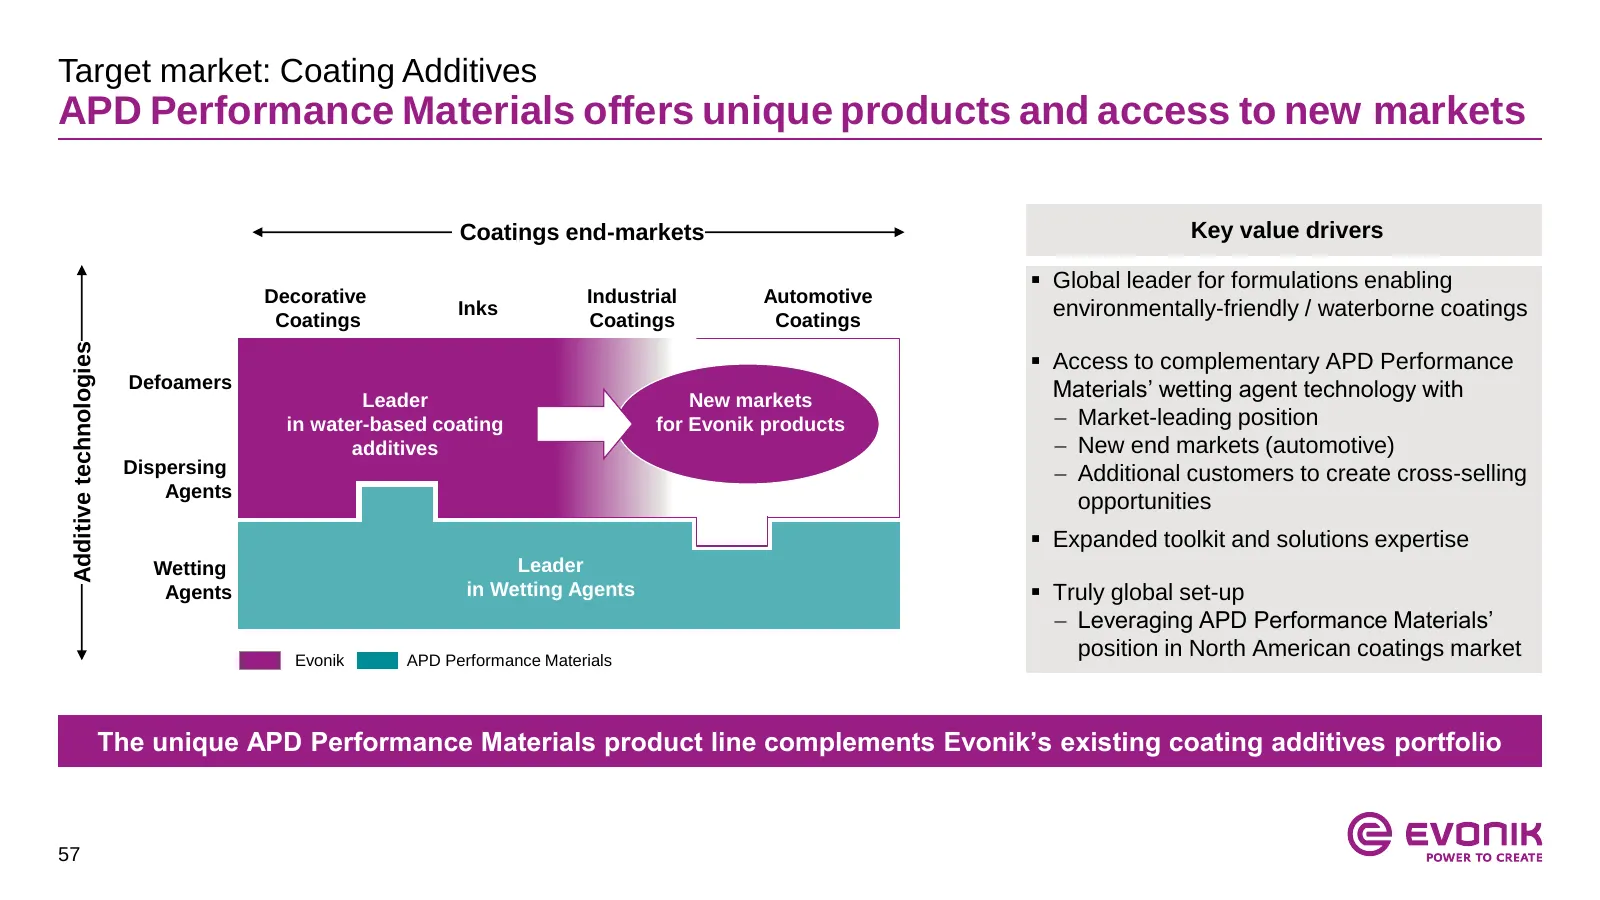
Slide 57: Additive technologies: Coating Additives
Target market: Coating Additives APD Performance Materials offers unique products and access to new markets Coatings end-markets Key value drivers Global leader for formulations enabling Decorative Industrial Automotive Coatings Inks Coatings Coatings environmentally-friendly / waterborne coatings
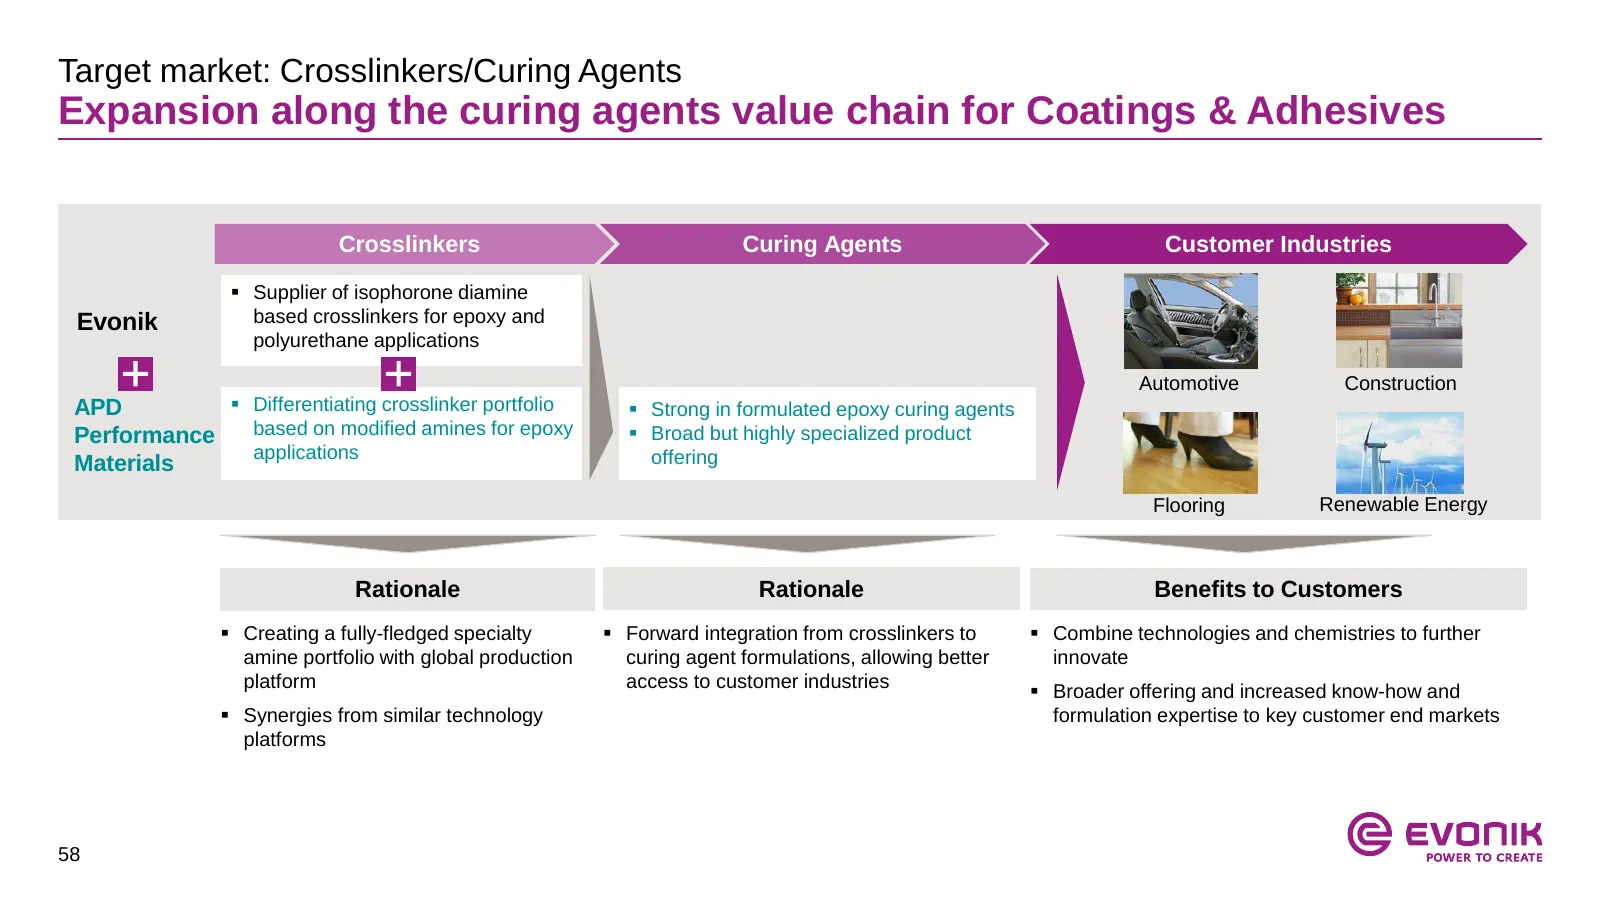
Slide 58: Expansion along the curing agents value chain
Target market: Crosslinkers/Curing Agents Expansion along the curing agents value chain for Coatings & Adhesives Crosslinkers Curing Agents Customer Industries Supplier of isophorone diamine Evonik based crosslinkers for epoxy and polyurethane applications Automotive Construction APD Differentia
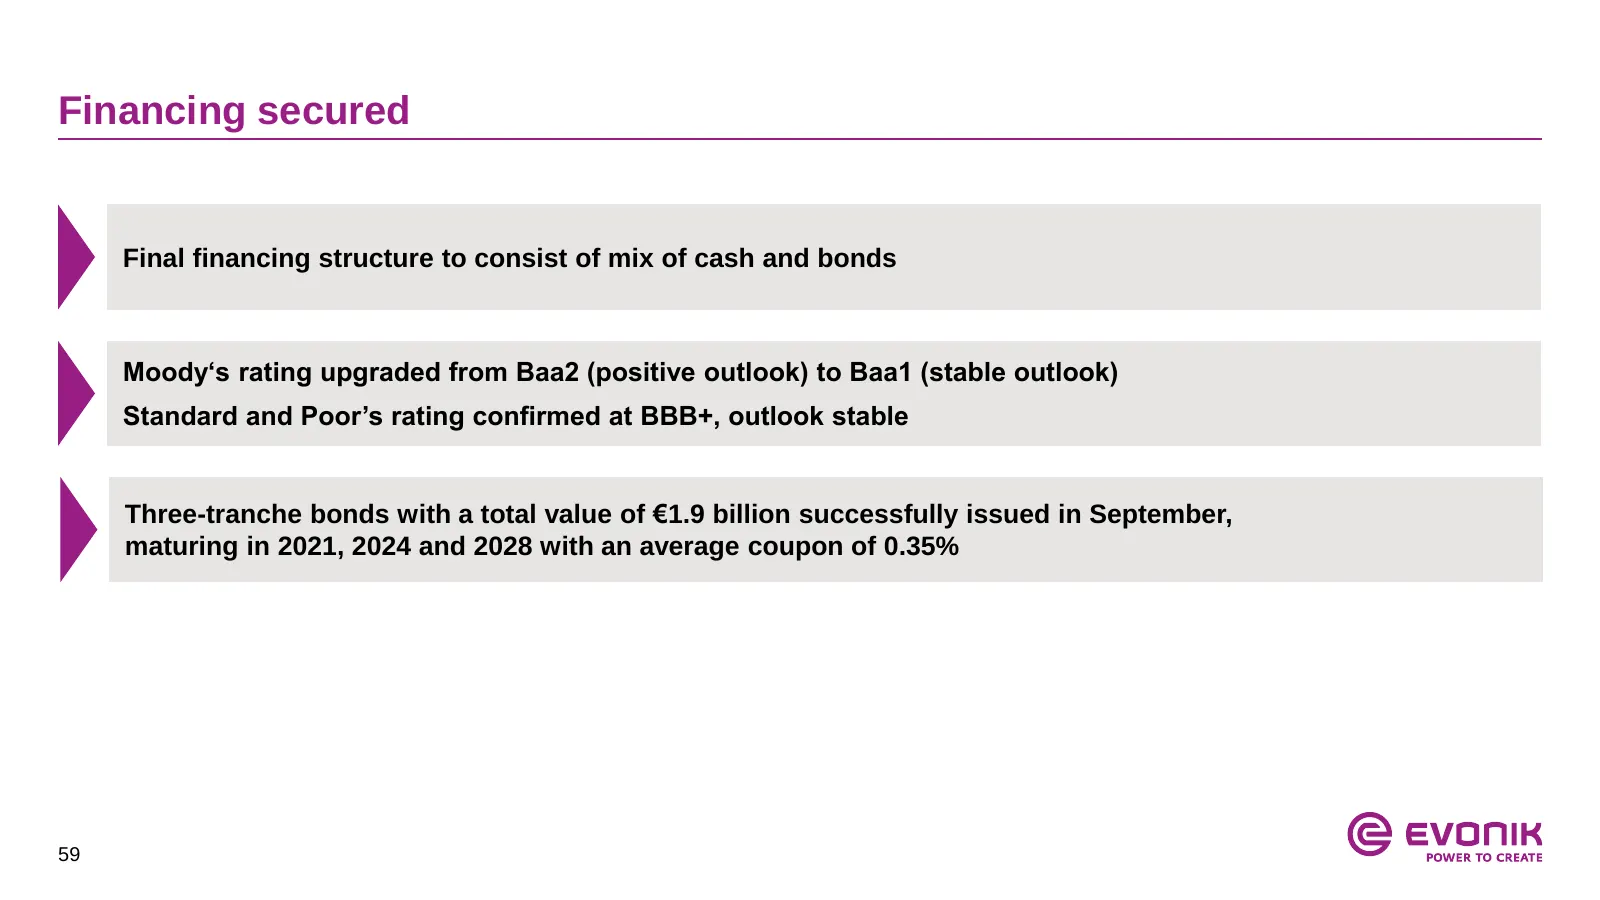
Slide 59: Financing secured
Financing secured Final financing structure to consist of mix of cash and bonds Moody‘s rating upgraded from Baa2 (positive outlook) to Baa1 (stable outlook) Standard and Poor’s rating confirmed at BBB+, outlook stable Three-tranche bonds with a total value of €1.9 billion successfully issued in Sep
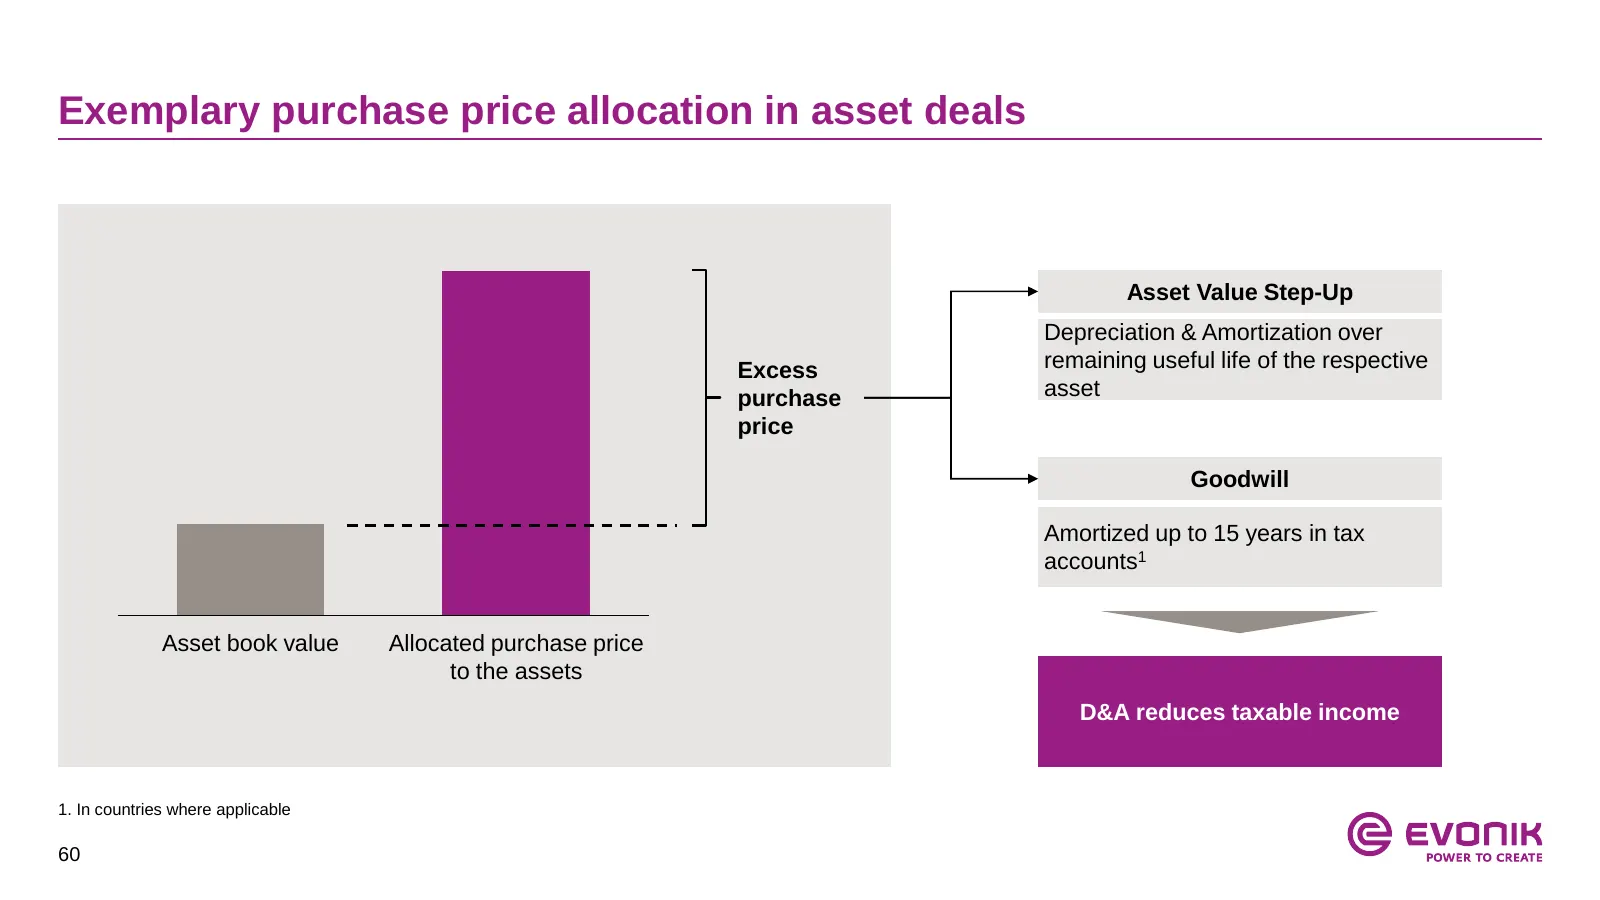
Slide 60: Exemplary purchase price allocation in asset deals
Exemplary purchase price allocation in asset deals Asset Value Step-Up Depreciation & Amortization over Excess remaining useful life of the respective purchase asset price Goodwill Amortized up to 15 years in tax accounts1 Asset book value Allocated purchase price to the assets D&A reduces taxable i
Slide 61: Table of contents
Table of contents 1. Appendix to Acquisition of APD Performance Materials 2. Segment overview 3. Financials 4. Investor Relations contact 61
Slide 62: Evonik Group Business Lines grouped in segments
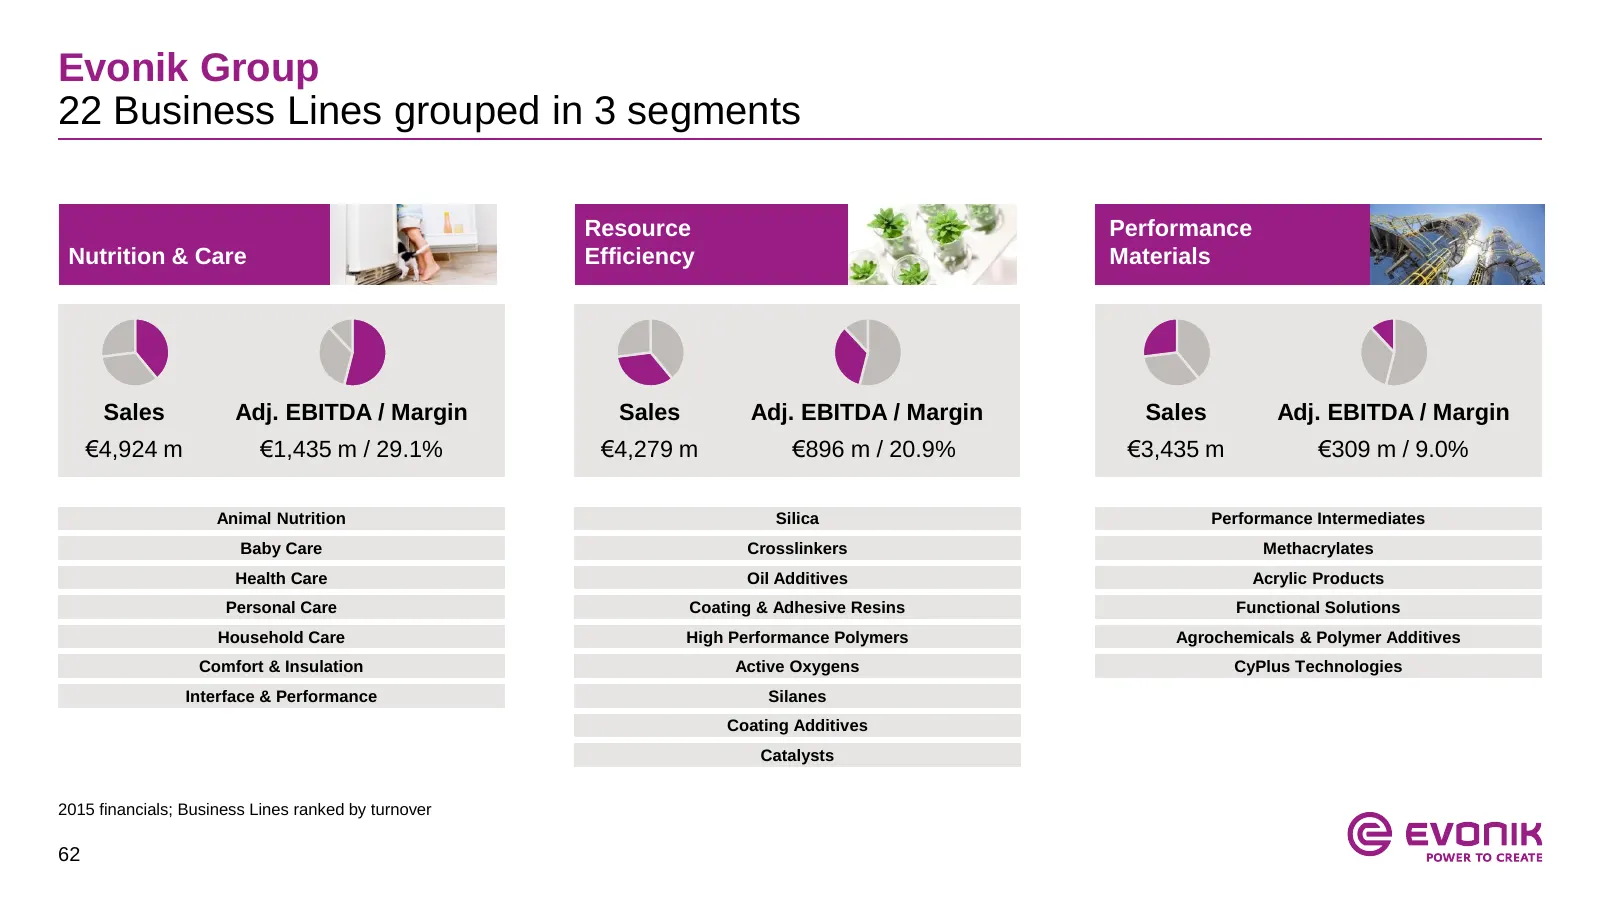
Evonik Group 22 Business Lines grouped in 3 segments Resource Performance Nutrition & Care Efficiency Materials Sales Adj. EBITDA / Margin Sales Adj. EBITDA / Margin Sales Adj. EBITDA / Margin €4,924 m €1,435 m / 29.1% €4,279 m €896 m / 20.9% €3,435 m €309 m / 9.0% Animal Nutrition Silica Performanc
Slide 63: Nutrition & Care
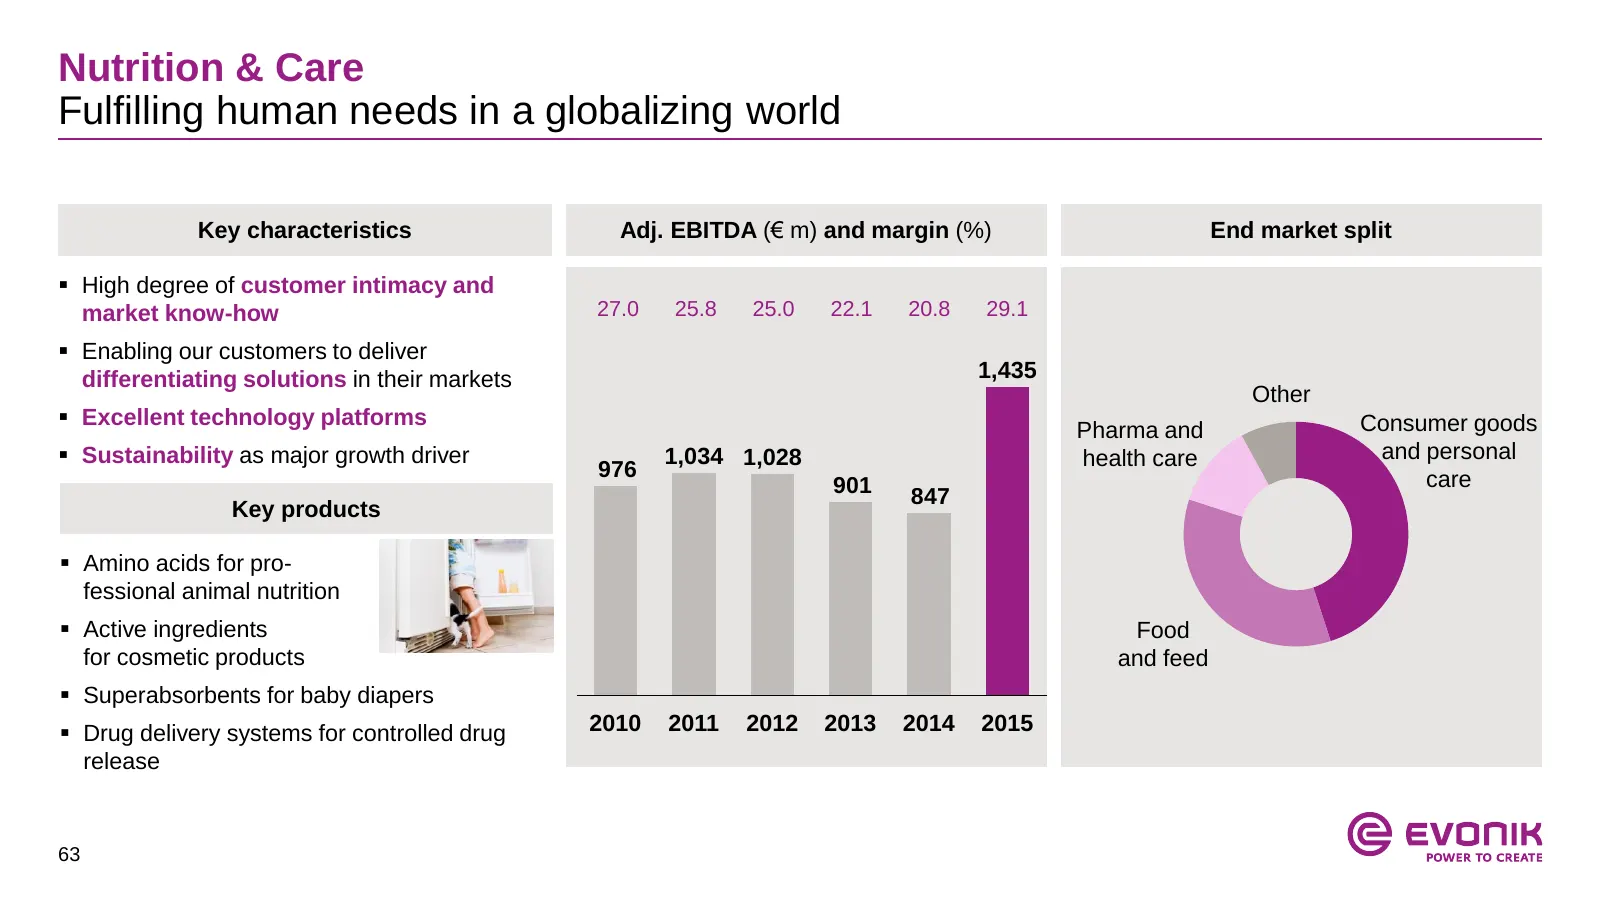
Nutrition & Care Fulfilling human needs in a globalizing world Key characteristics Adj. EBITDA (€ m) and margin (%) End market split High degree of customer intimacy and market know-how 27.0 25.8 25.0 22.1 20.8 29.1 Enabling our customers to deliver differentiating solutions in their markets 1,4
Slide 64: Nutrition & Care Business Line overview (1/2)
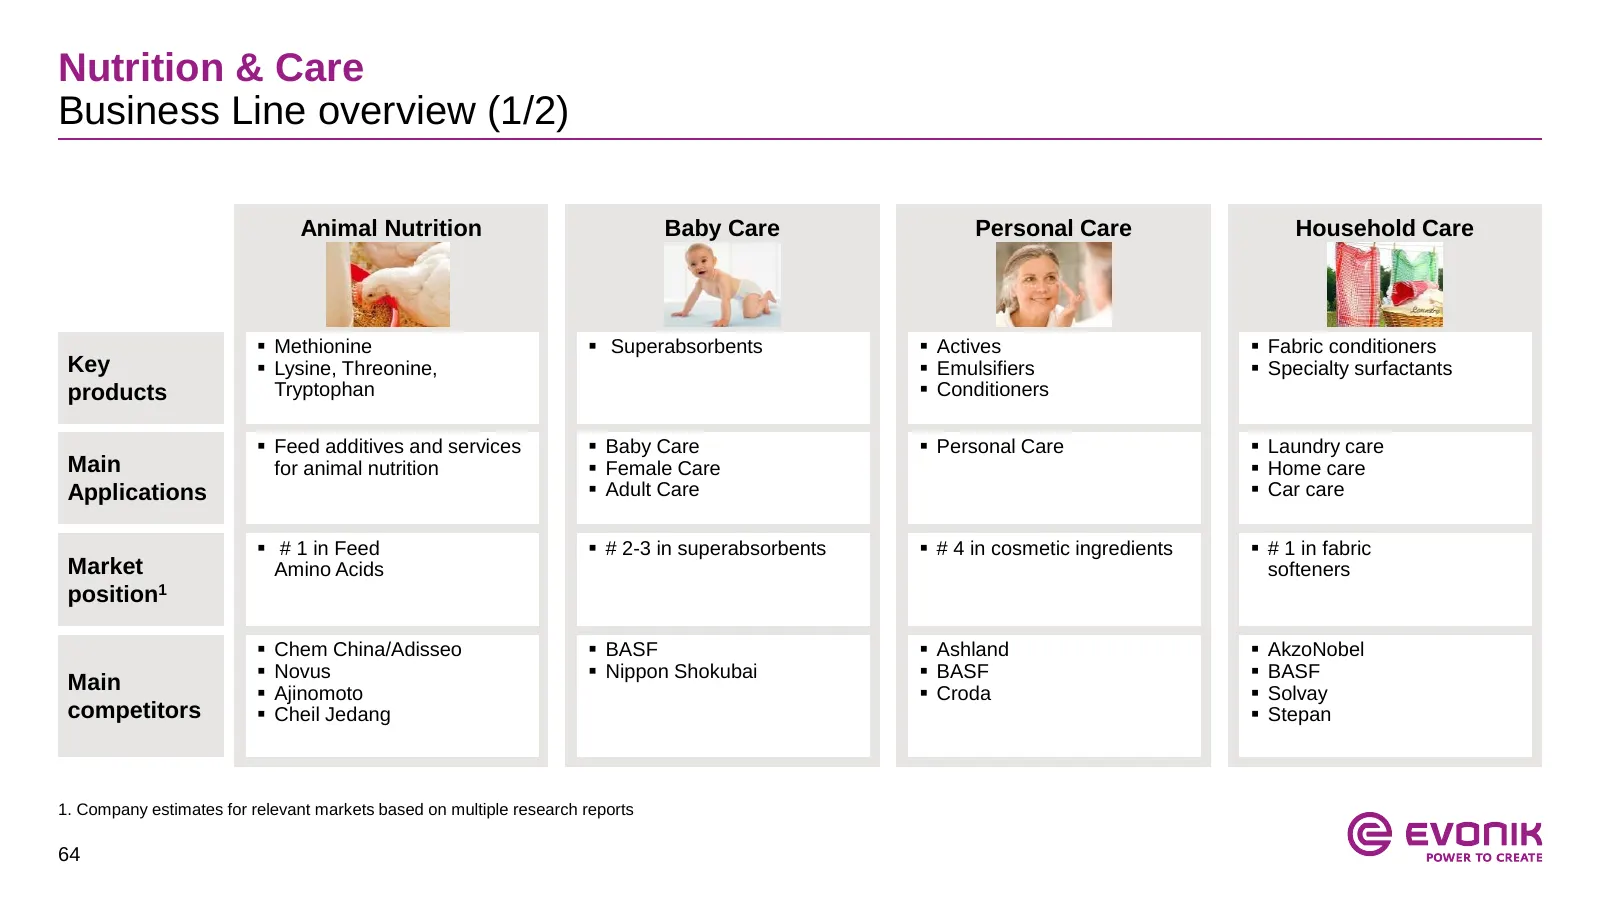
Nutrition & Care Business Line overview (1/2) Animal Nutrition Baby Care Personal Care Household Care Methionine Superabsorbents Actives Fabric conditioners Key Lysine, Threonine, Emulsifiers Specialty surfactants products Tryptophan Conditioners Feed additives and services Baby
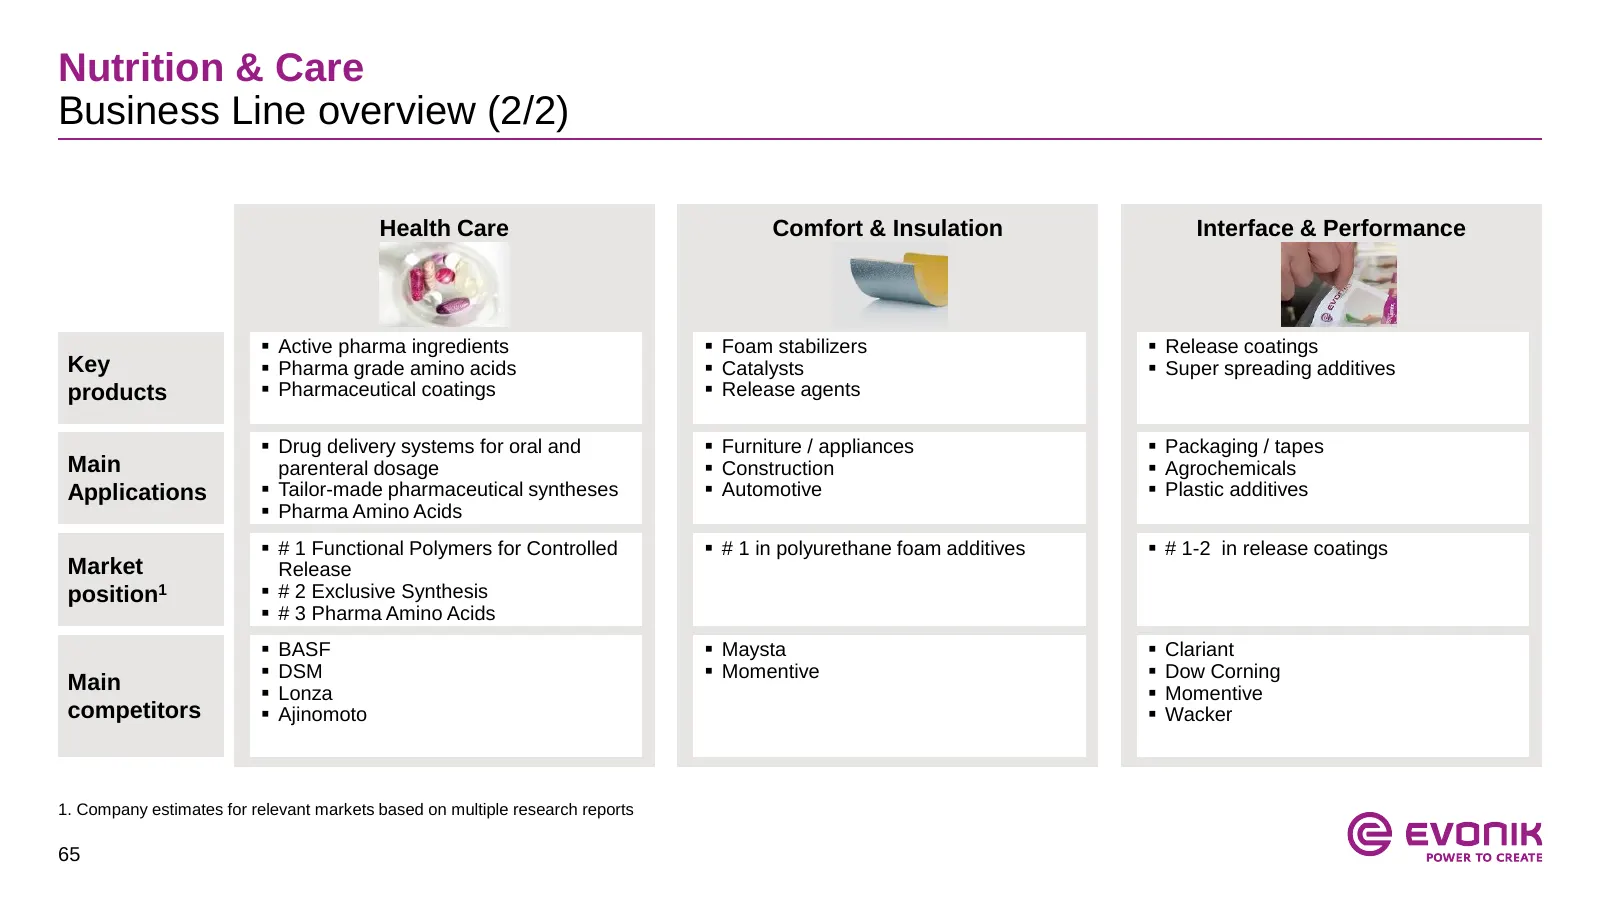
Slide 65: Nutrition & Care Business Line overview (2/2)
Nutrition & Care Business Line overview (2/2) Health Care Comfort & Insulation Interface & Performance Active pharma ingredients Foam stabilizers Release coatings Key Pharma grade amino acids Catalysts Super spreading additives products Pharmaceutical coatings Release agents Drug d
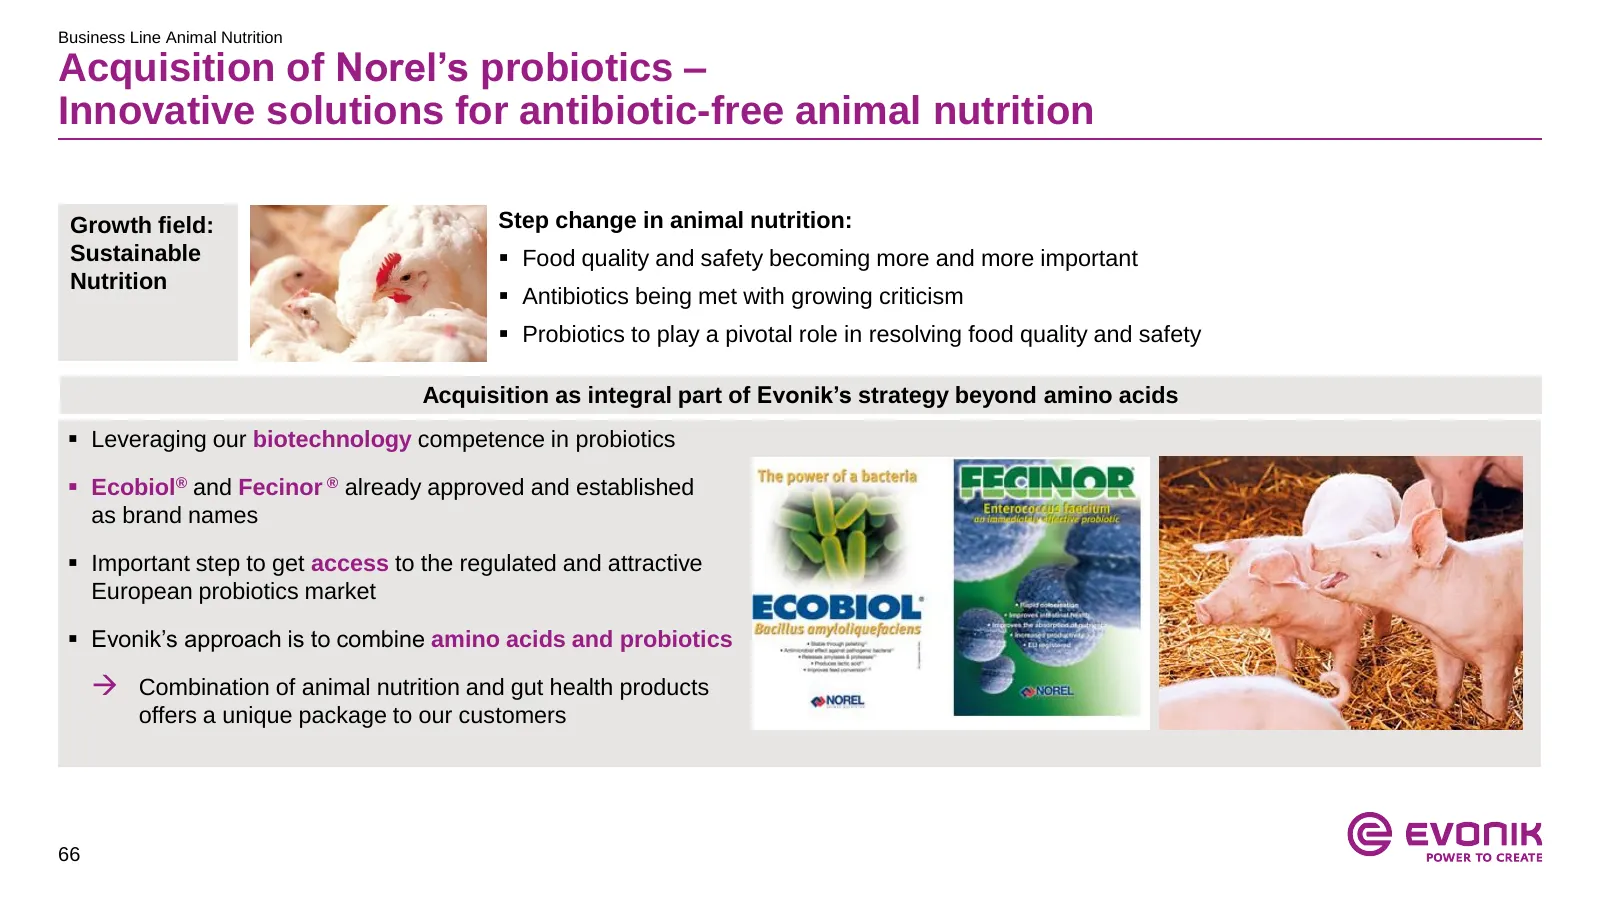
Slide 66: Acquisition of Norel's probiotics
Business Line Animal Nutrition Acquisition of Norel’s probiotics – Innovative solutions for antibiotic-free animal nutrition Growth field: Step change in animal nutrition: Sustainable Food quality and safety becoming more and more important Nutrition Antibiotics being met with growing criticism
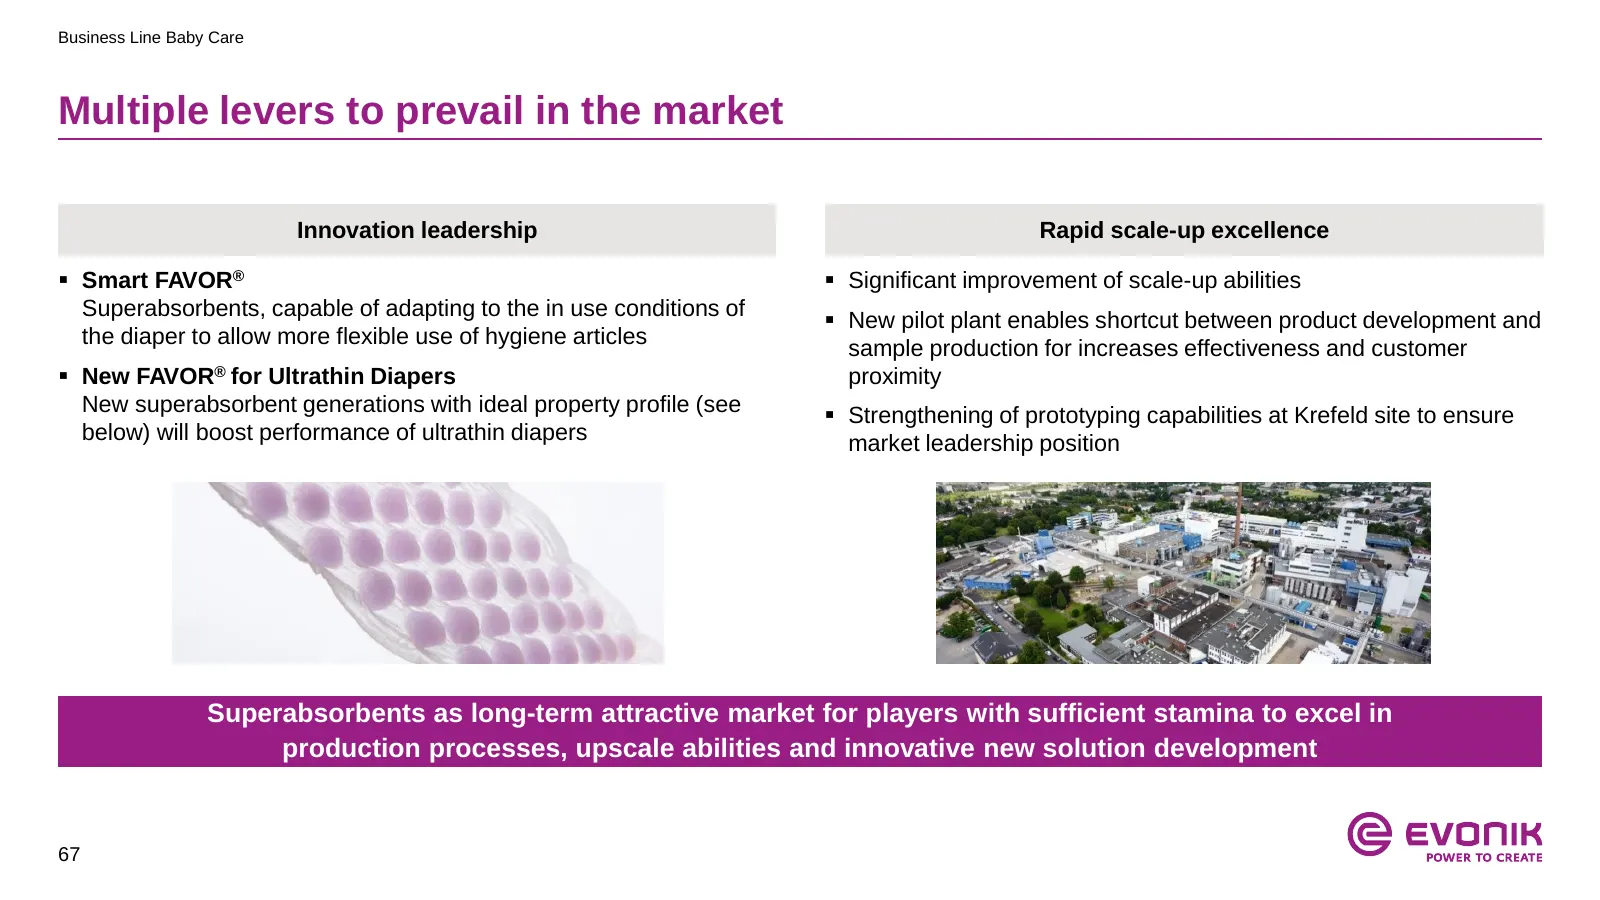
Slide 67: Baby Care: Multiple levers to prevail in the market
Business Line Baby Care Multiple levers to prevail in the market Innovation leadership Rapid scale-up excellence Smart FAVOR® Significant improvement of scale-up abilities Superabsorbents, capable of adapting to the in use conditions of New pilot plant enables shortcut between product developm
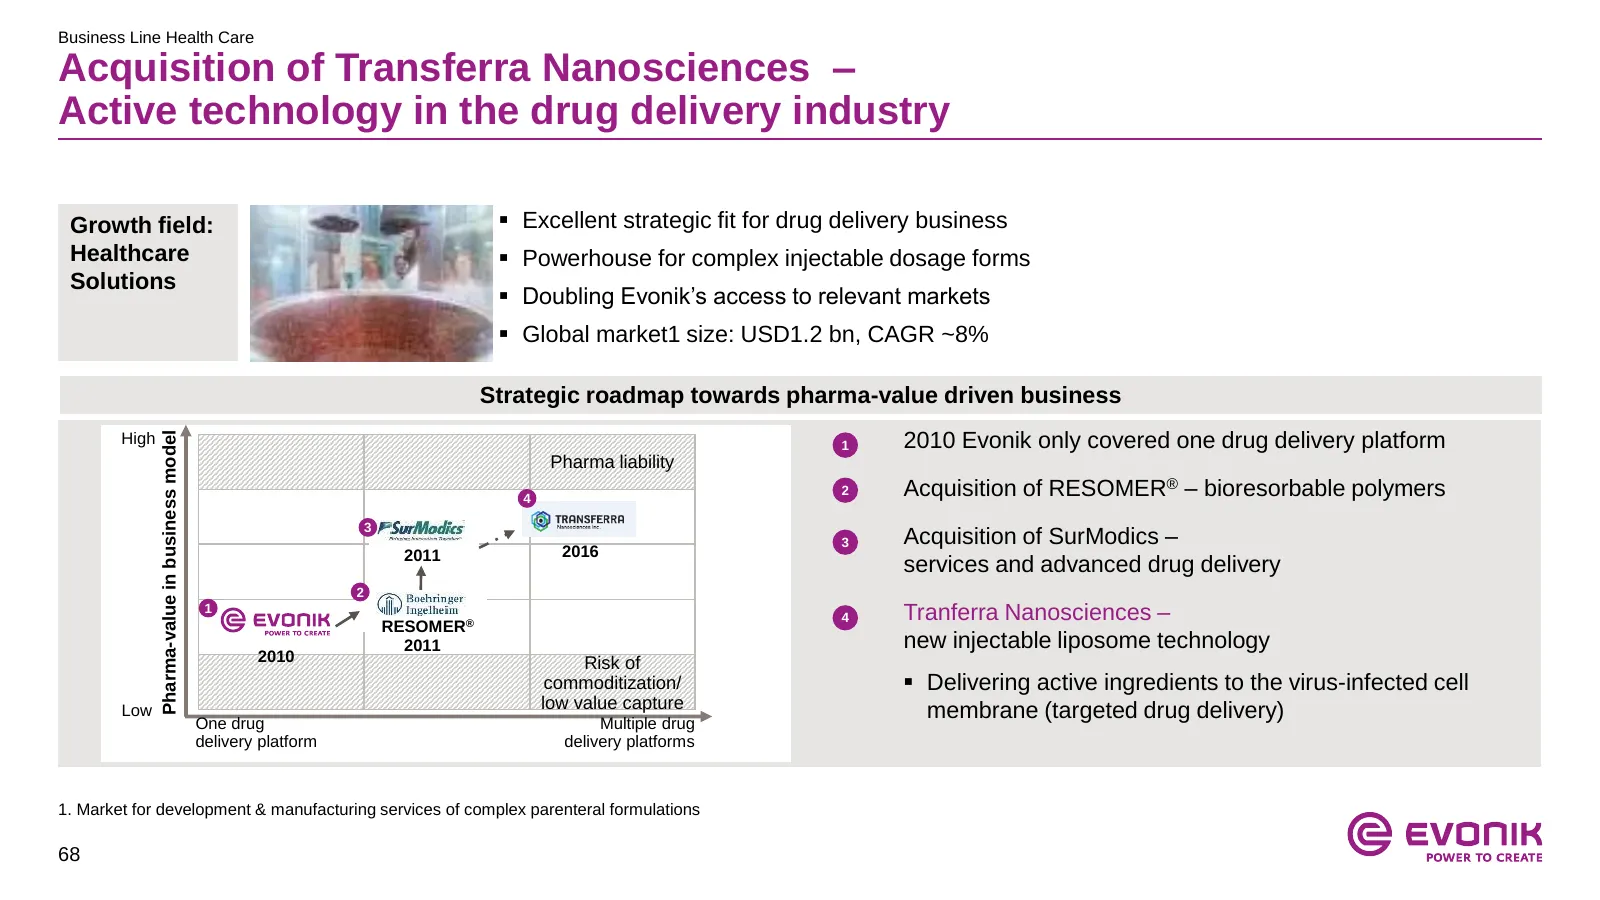
Slide 68: Acquisition of Transferra Nanosciences
Business Line Health Care Acquisition of Transferra Nanosciences – Active technology in the drug delivery industry Growth field: Excellent strategic fit for drug delivery business Healthcare Powerhouse for complex injectable dosage forms Solutions Doubling Evonik’s access to relevant markets
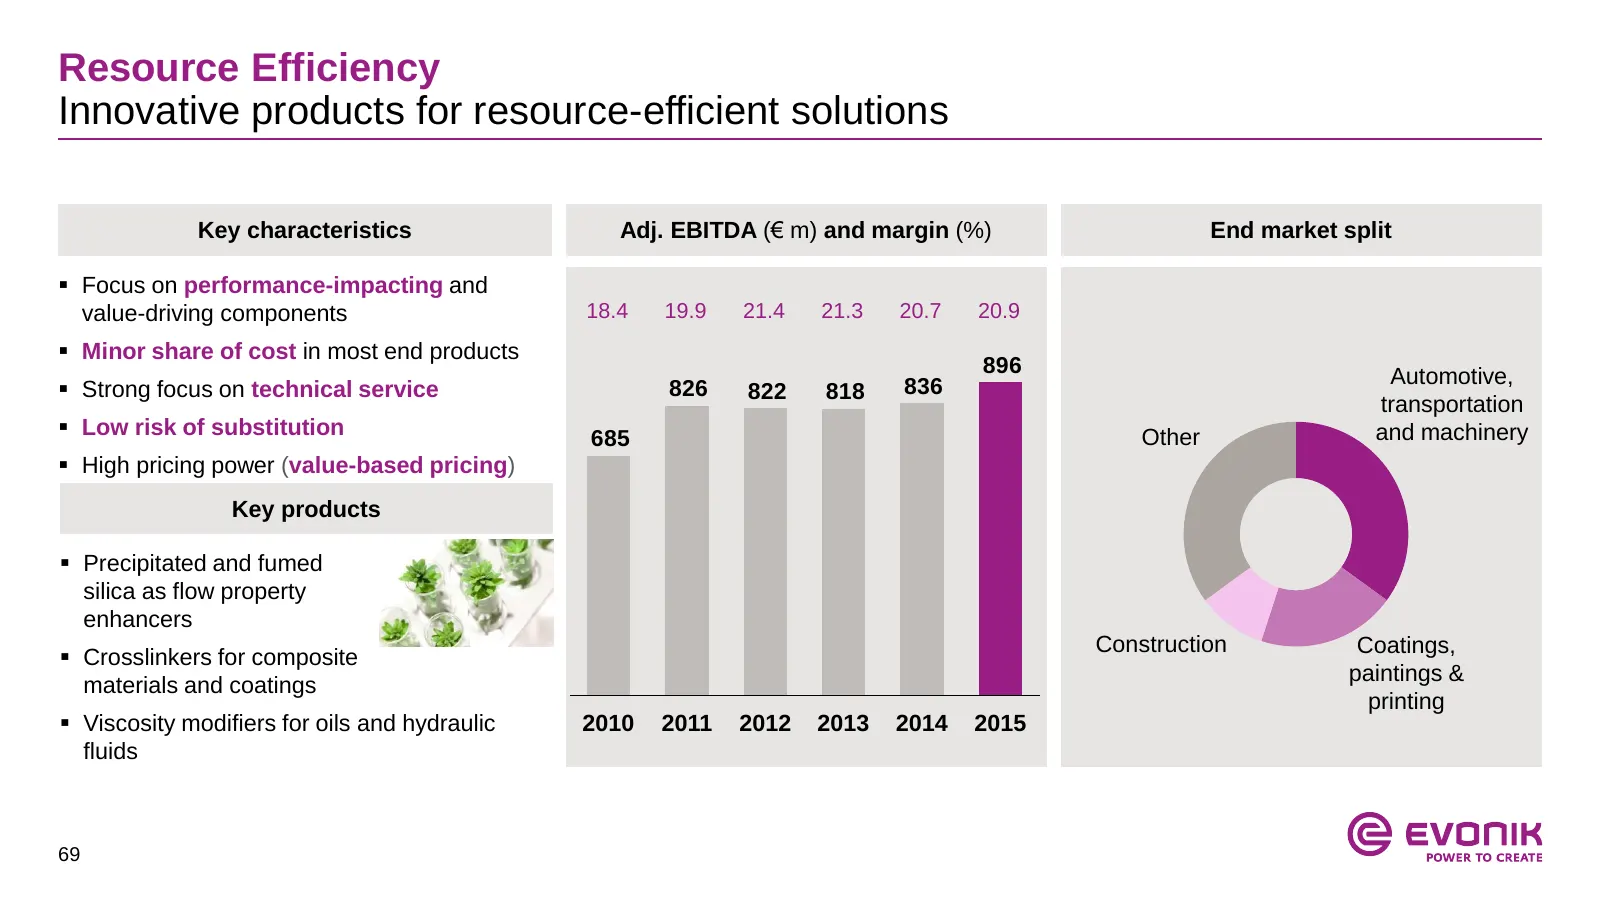
Slide 69: Resource Efficiency
Resource Efficiency Innovative products for resource-efficient solutions Key characteristics Adj. EBITDA (€ m) and margin (%) End market split Focus on performance-impacting and value-driving components 18.4 19.9 21.4 21.3 20.7 20.9 Minor share of cost in most end products 896 Automotive, Stro
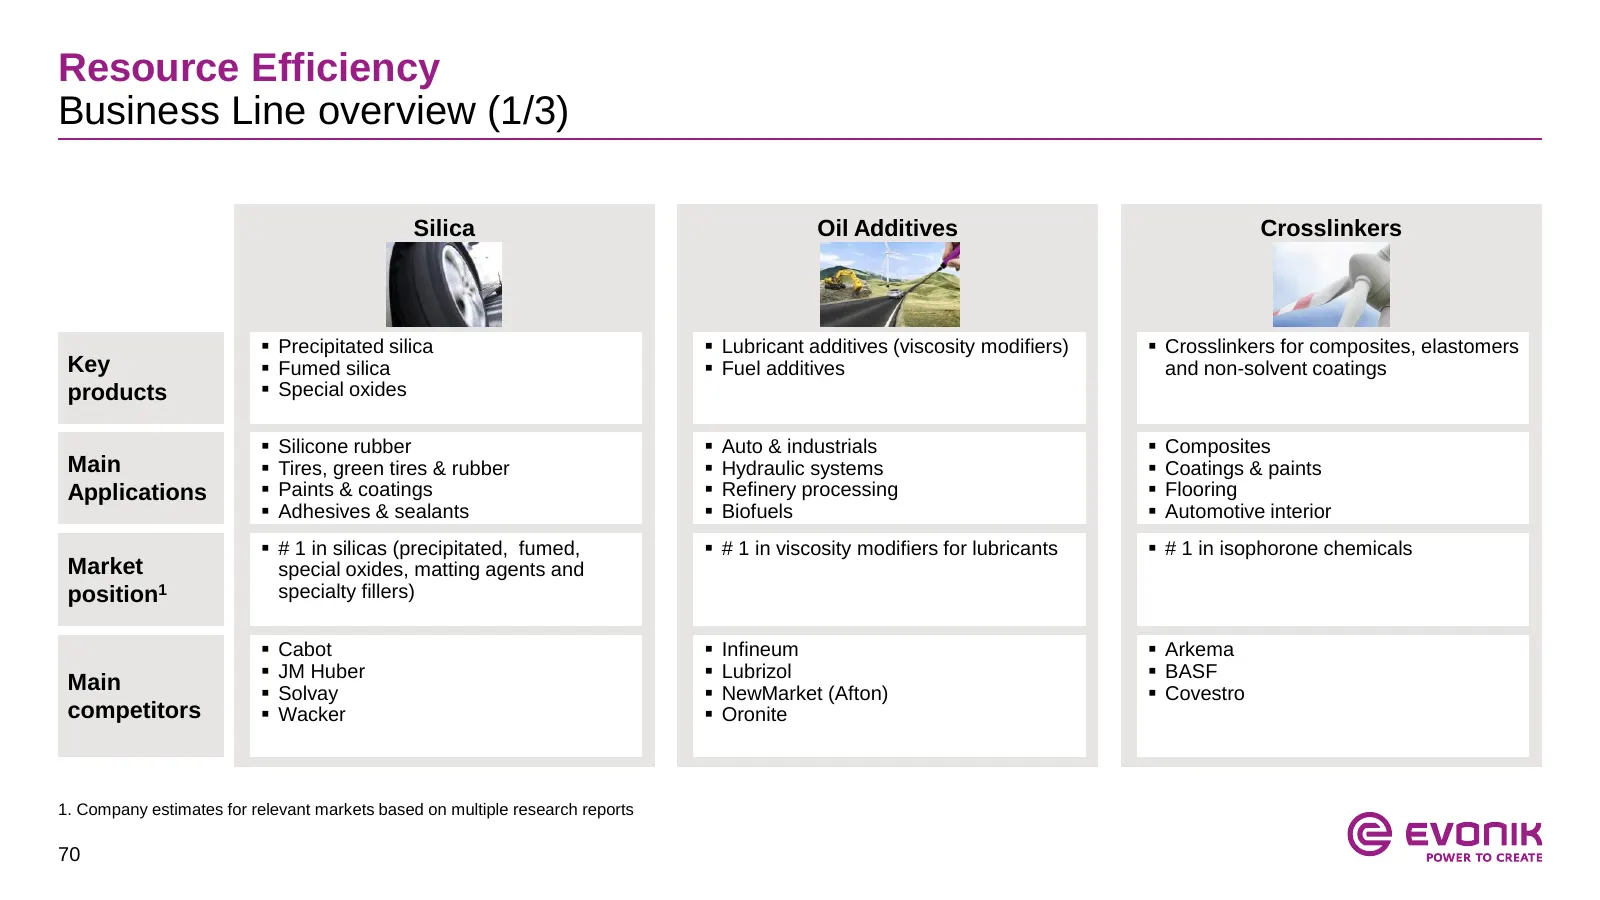
Slide 70: Resource Efficiency Business Line overview (1/3)
Resource Efficiency Business Line overview (1/3) Silica Oil Additives Crosslinkers Precipitated silica Lubricant additives (viscosity modifiers) Crosslinkers for composites, elastomers Key Fumed silica Fuel additives and non-solvent coatings products Special oxides Silicone rubber Au
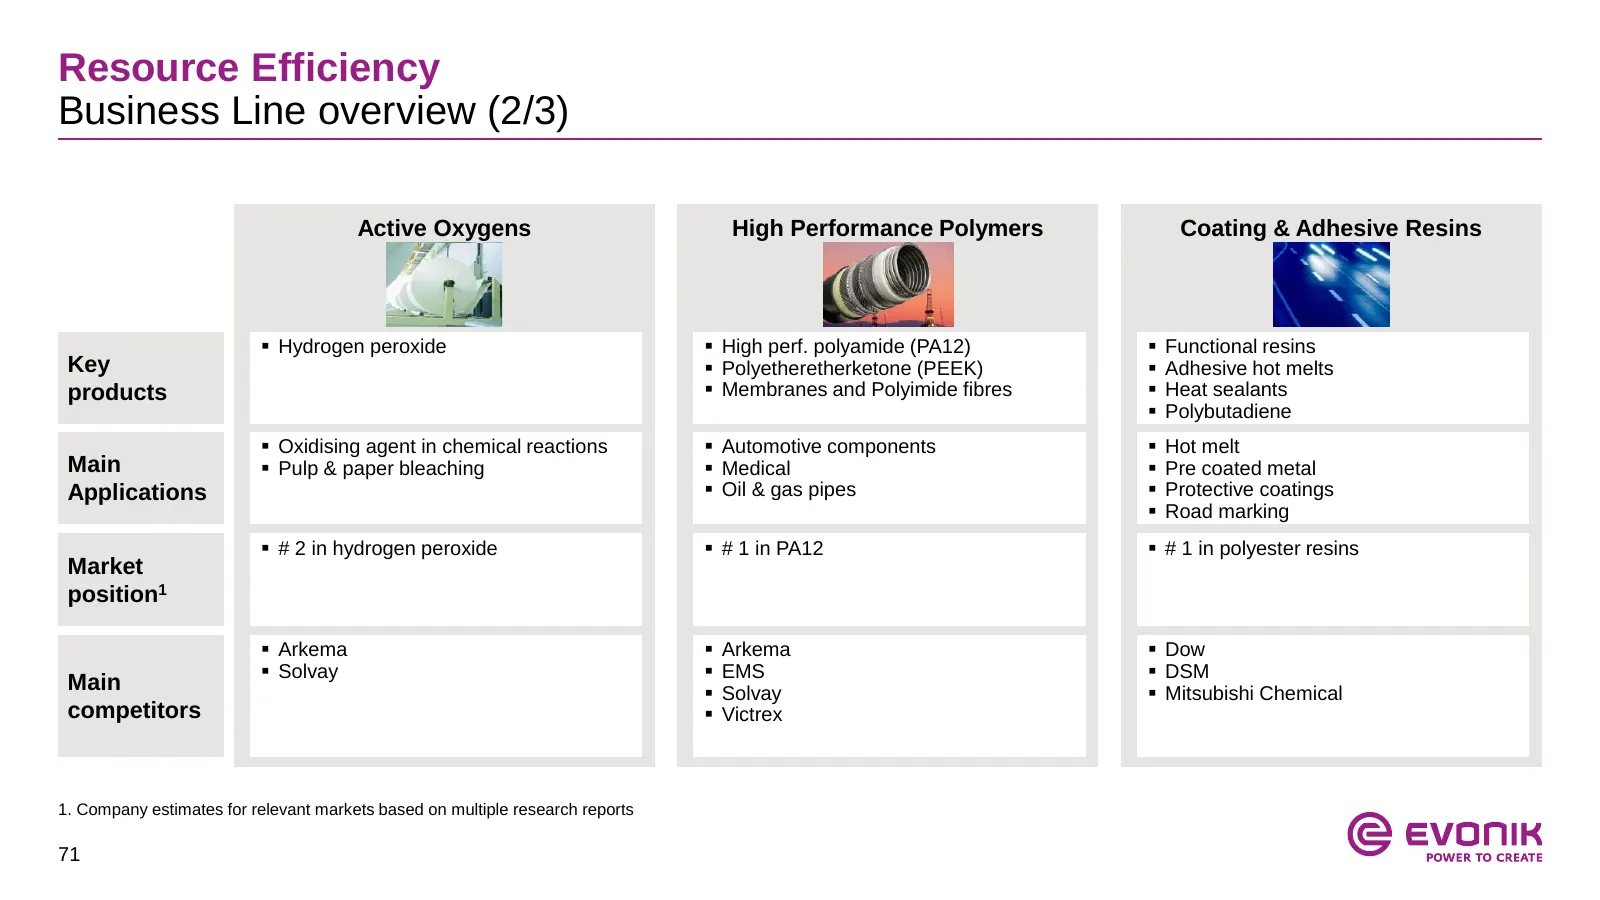
Slide 71: Resource Efficiency Business Line overview (2/3)
Resource Efficiency Business Line overview (2/3) Active Oxygens High Performance Polymers Coating & Adhesive Resins Hydrogen peroxide High perf. polyamide (PA12) Functional resins Key Polyetheretherketone (PEEK) Adhesive hot melts products Membranes and Polyimide fibres Heat sealants
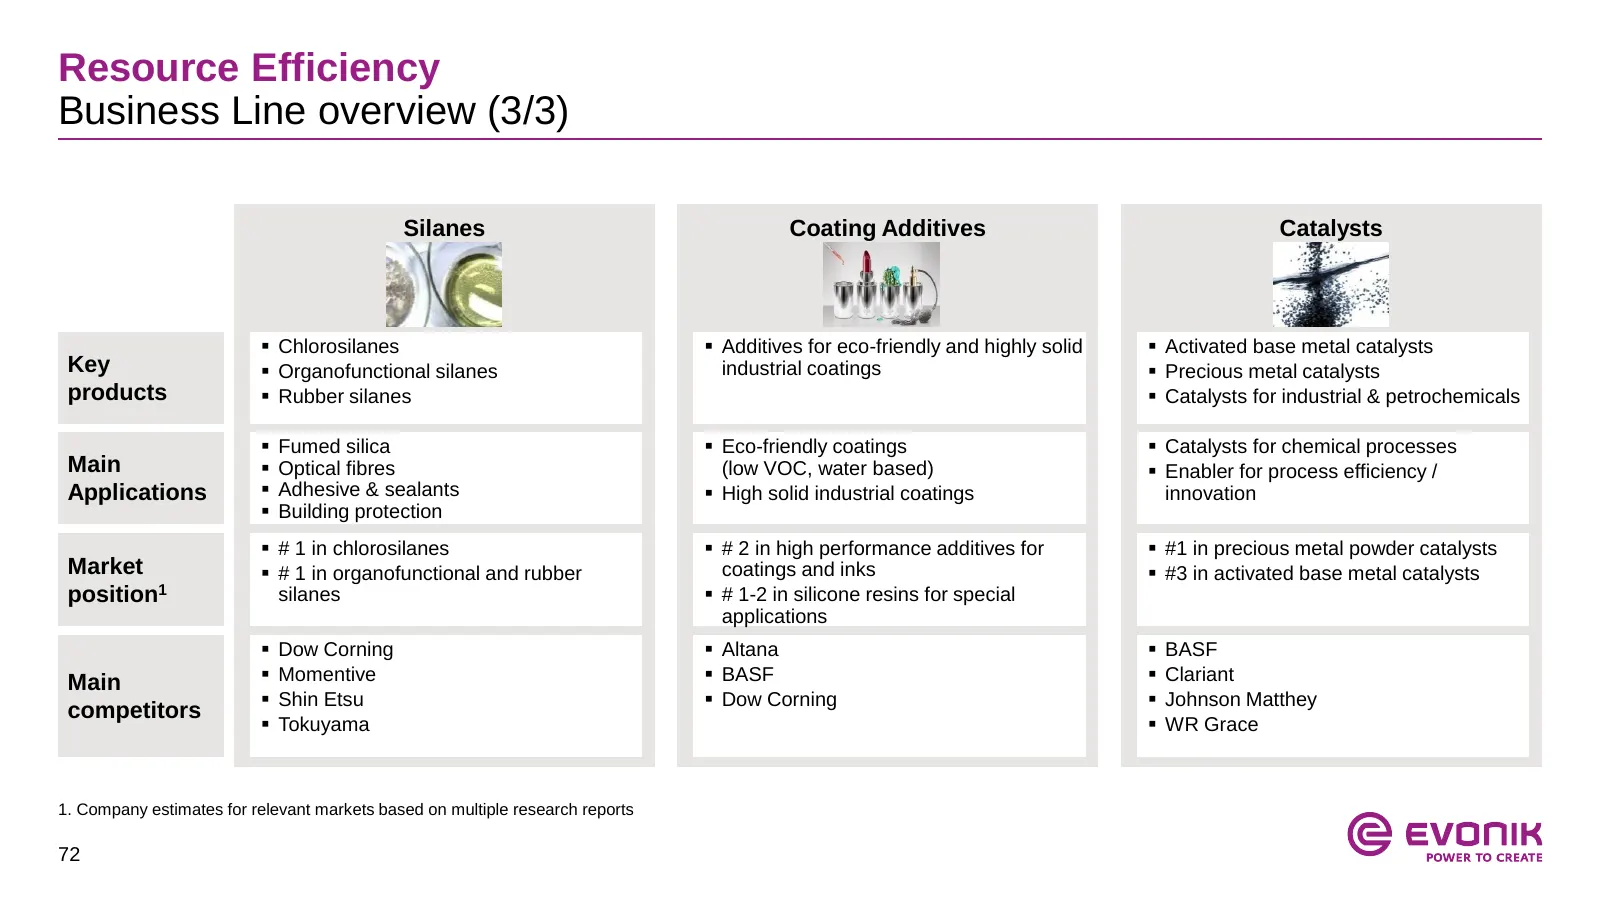
Slide 72: Resource Efficiency Business Line overview (3/3)
Resource Efficiency Business Line overview (3/3) Silanes Coating Additives Catalysts Chlorosilanes Additives for eco-friendly and highly solid Activated base metal catalysts Key Organofunctional silanes industrial coatings Precious metal catalysts products Rubber silanes Catalysts for
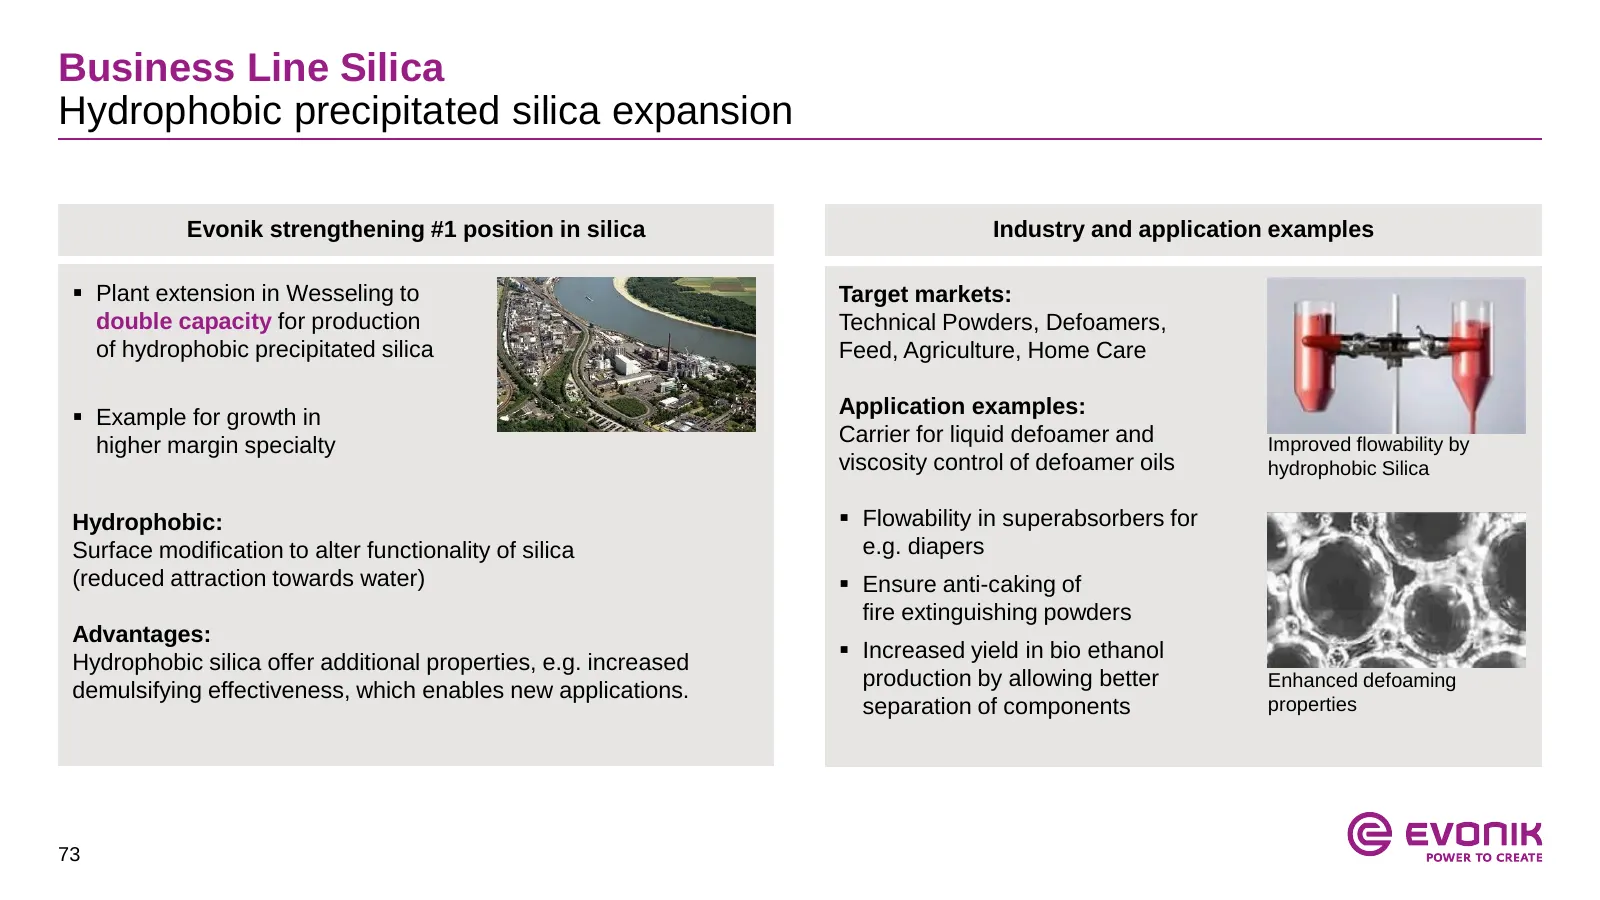
Slide 73: Hydrophobic precipitated silica expansion
Business Line Silica Hydrophobic precipitated silica expansion Evonik strengthening #1 position in silica Industry and application examples Plant extension in Wesseling to Target markets: double capacity for production Technical Powders, Defoamers, of hydrophobic precipitated silica Feed, Agricult
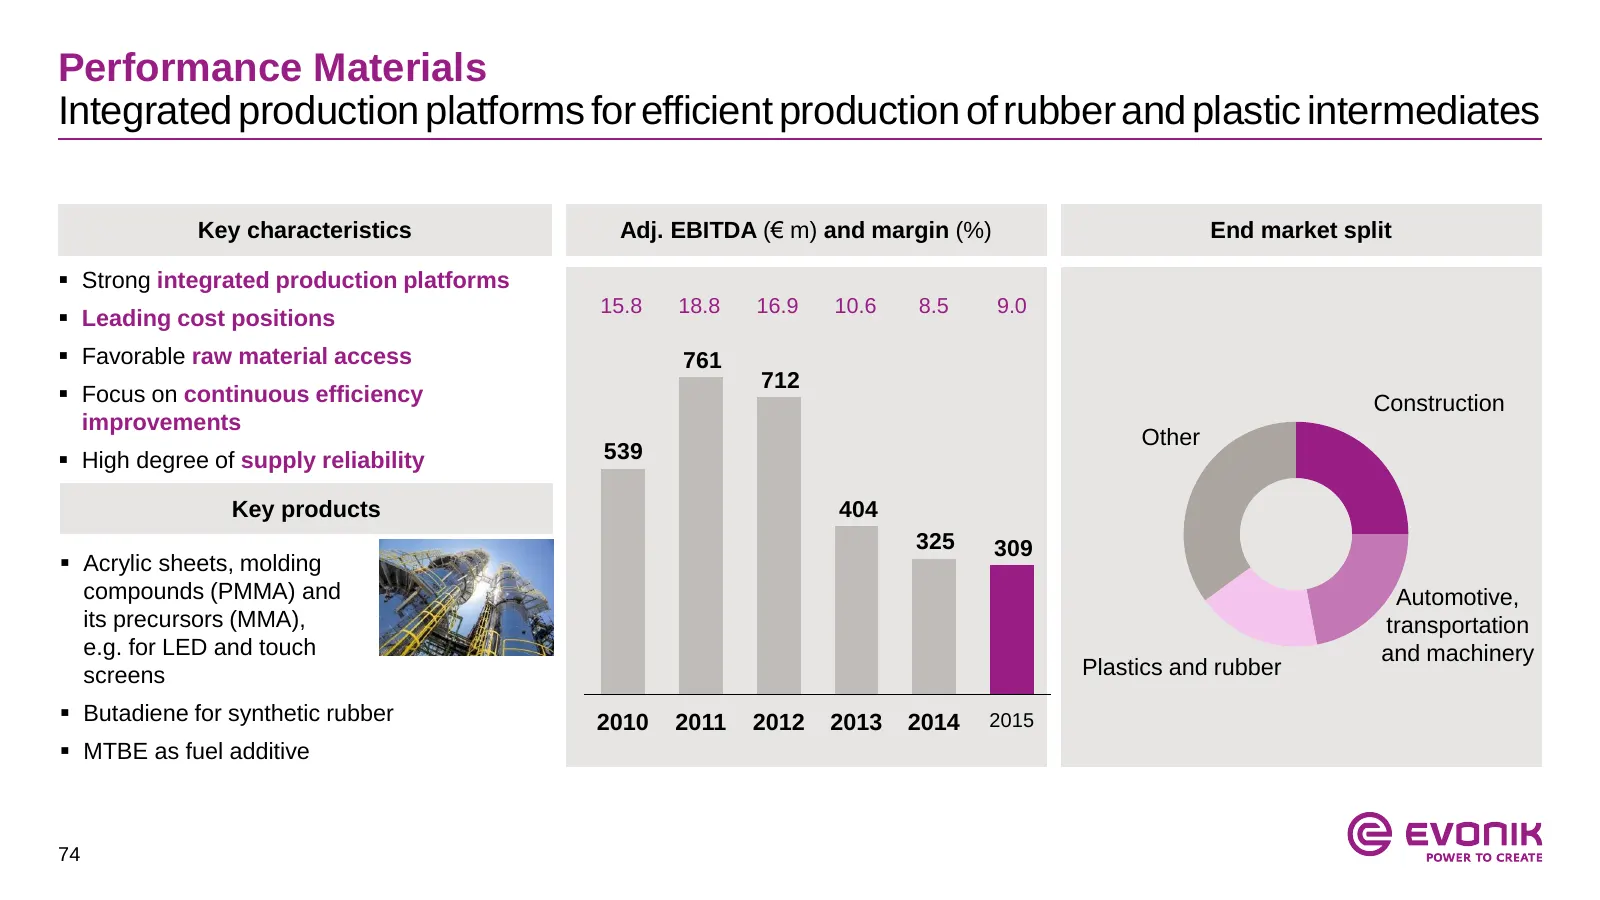
Slide 74: Performance Materials
Performance Materials Integrated production platforms for efficient production of rubber and plastic intermediates Key characteristics Adj. EBITDA (€ m) and margin (%) End market split Strong integrated production platforms 15.8 18.8 16.9 10.6 8.5 9.0 Leading cost positions Favorable raw mater
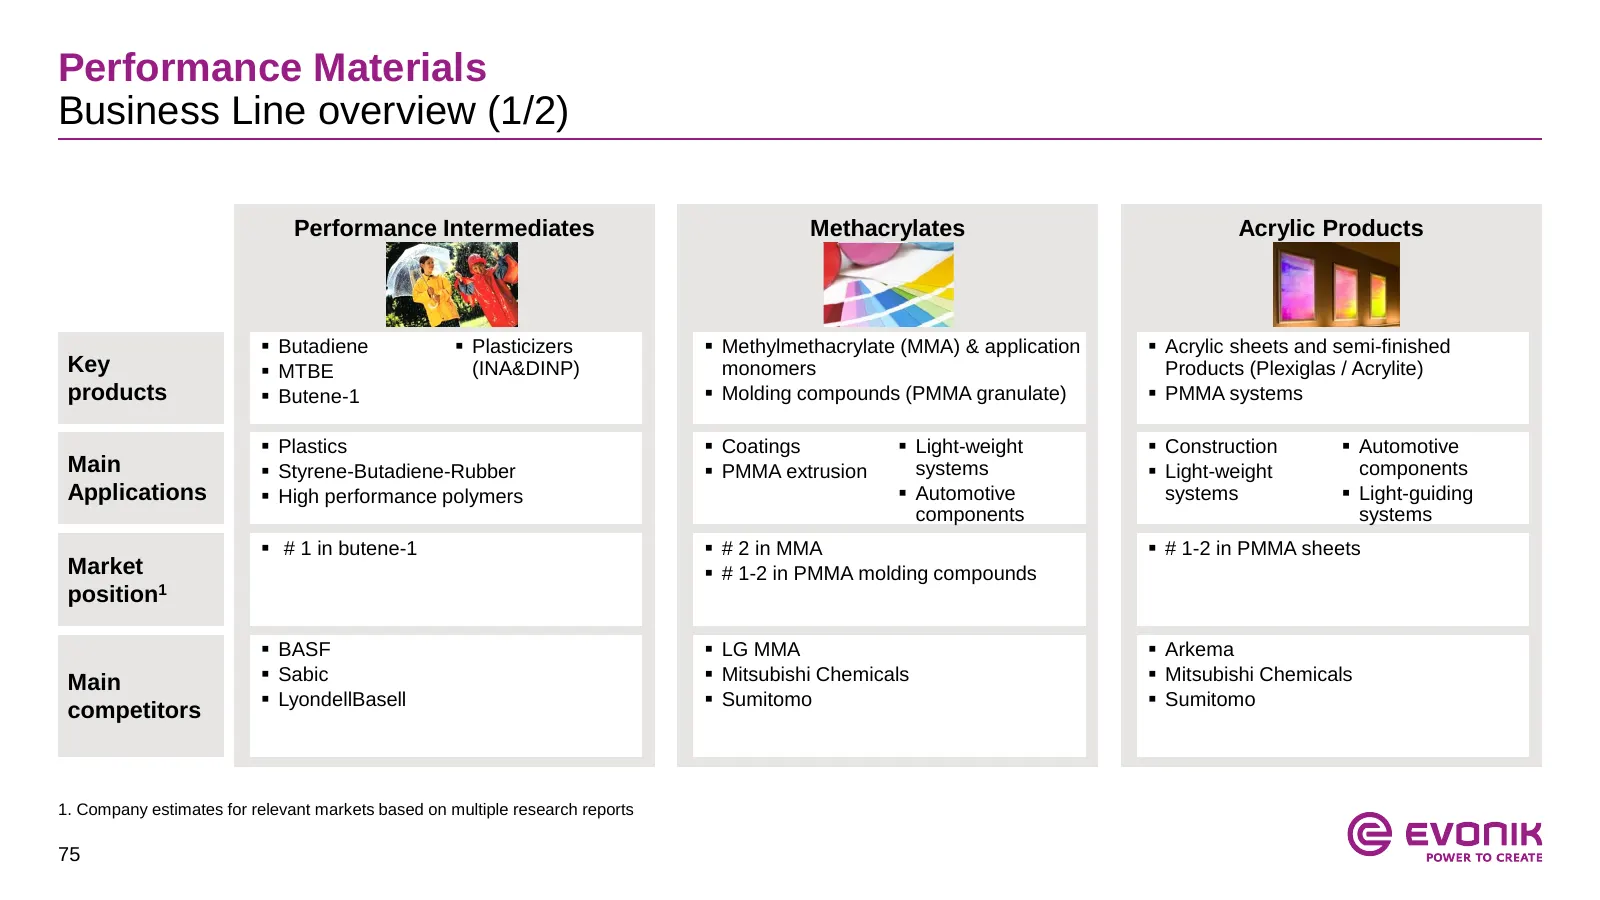
Slide 75: Performance Materials Business Line overview (1/2)
Performance Materials Business Line overview (1/2) Performance Intermediates Methacrylates Acrylic Products Butadiene Plasticizers Methylmethacrylate (MMA) & application Acrylic sheets and semi-finished Key MTBE (INA&DINP) monomers Products (Plexiglas / Acrylite) products Butene-1 Mold
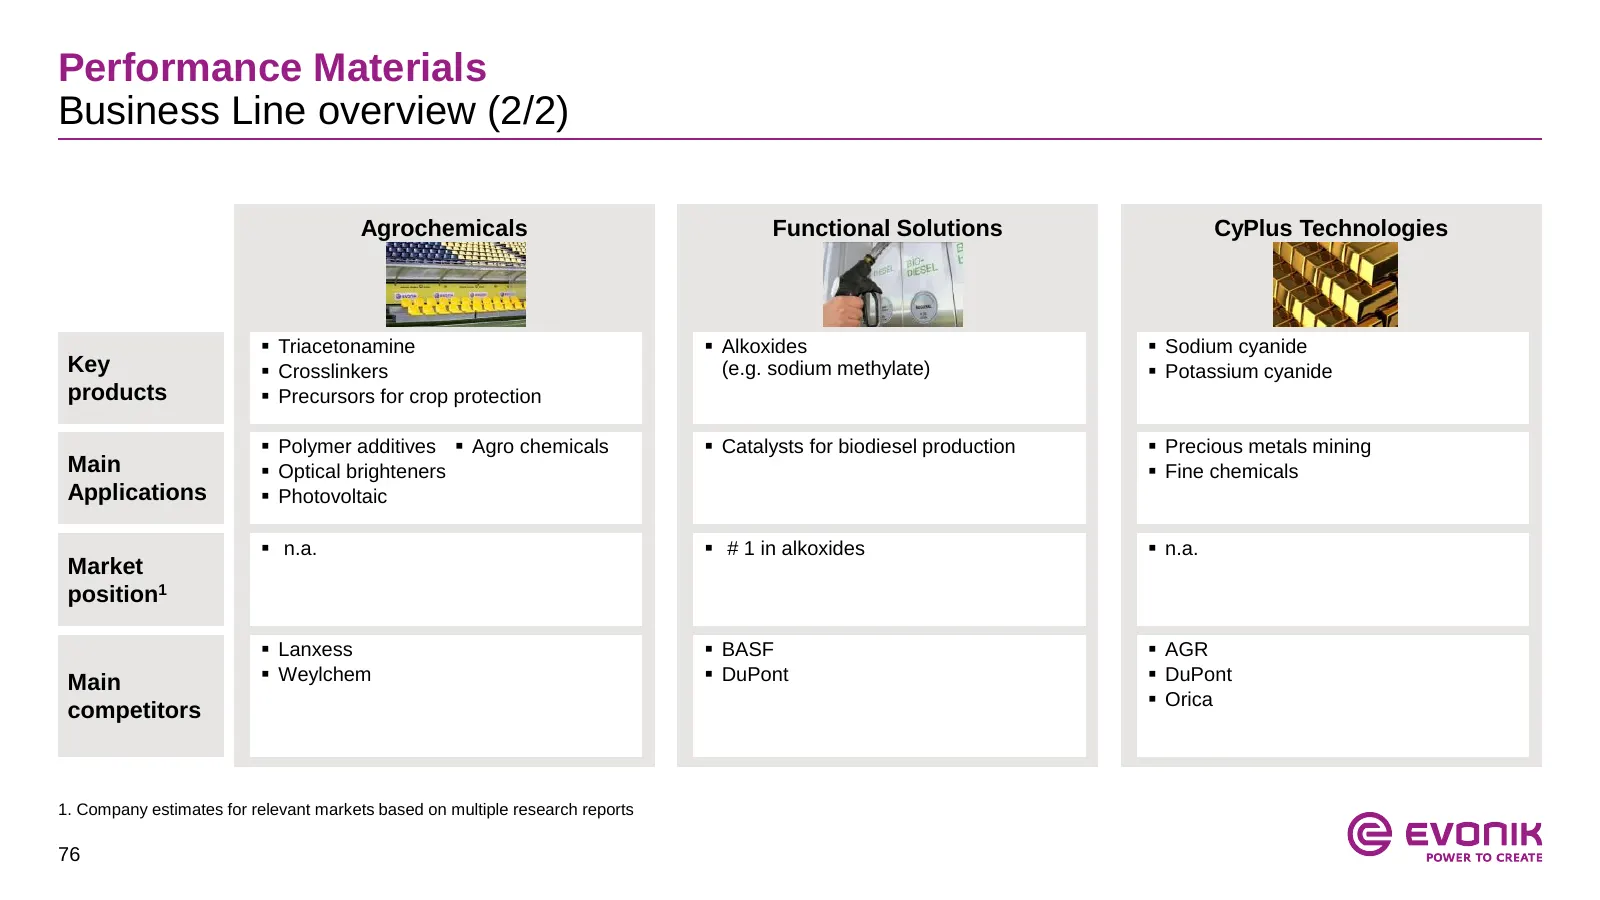
Slide 76: Performance Materials Business Line overview (2/2)
Performance Materials Business Line overview (2/2) Agrochemicals Functional Solutions CyPlus Technologies Triacetonamine Alkoxides Sodium cyanide Key Crosslinkers (e.g. sodium methylate) Potassium cyanide products Precursors for crop protection Polymer additives Agro chemicals Cata
Slide 77: Table of contents
Table of contents 1. Appendix to Acquisition of APD Performance Materials 2. Segment overview 3. Financials 4. Investor Relations contact 77
Slide 78: Capex brought down to sustainable level
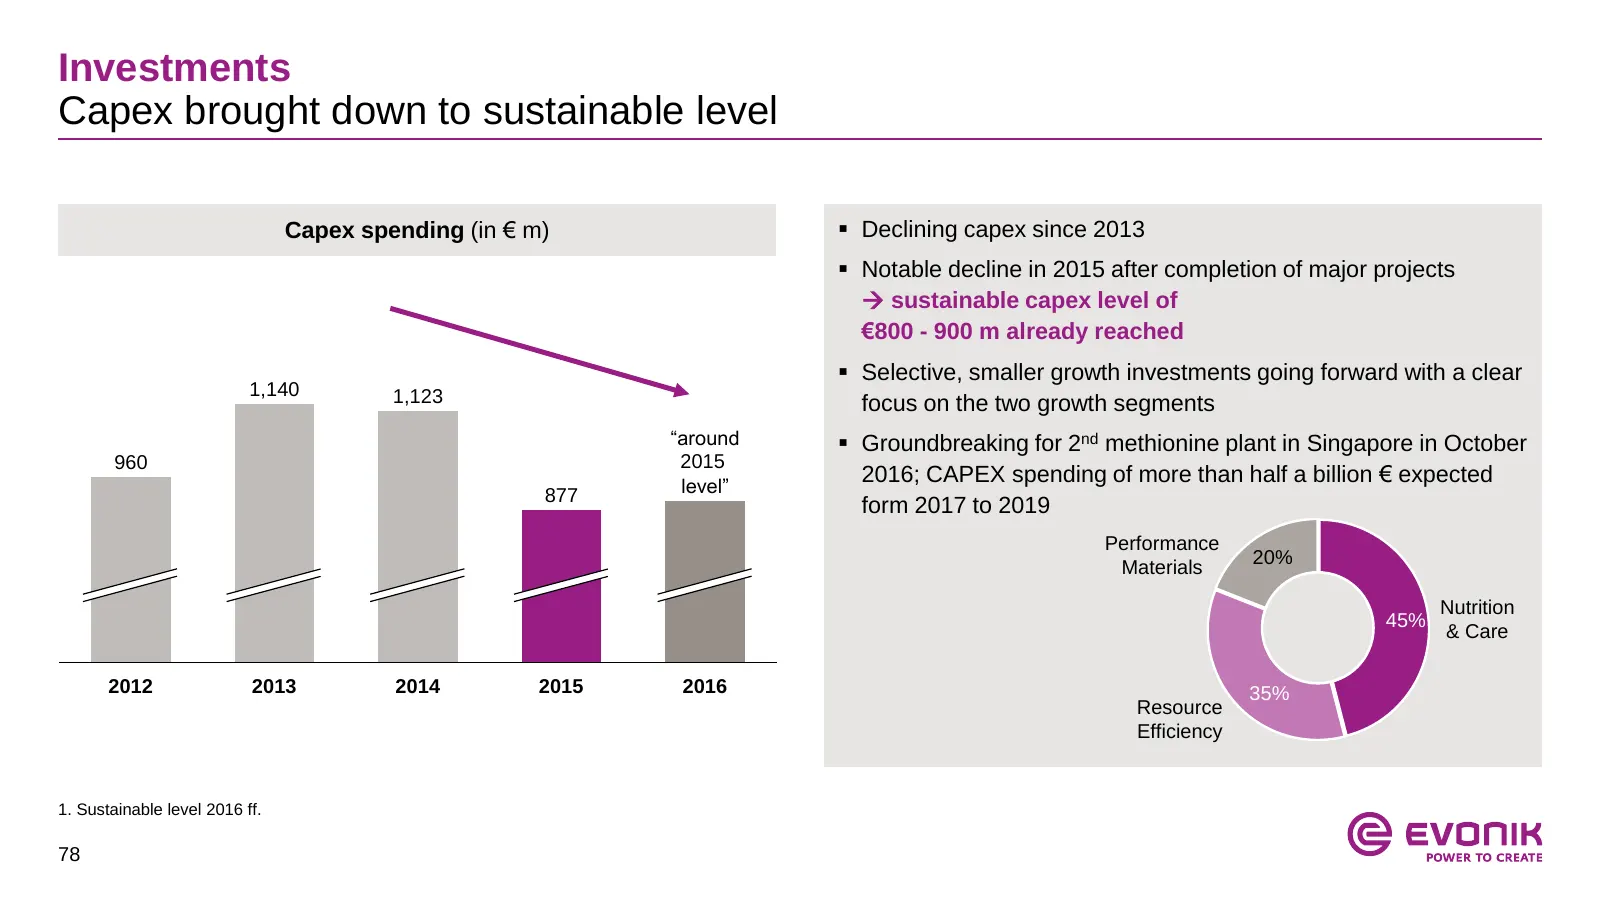
Investments Capex brought down to sustainable level Capex spending (in € m) Declining capex since 2013 Notable decline in 2015 after completion of major projects sustainable capex level of €800 - 900 m already reached Selective, smaller growth investments going forward with a clear 1,140 1,1
Slide 79: Selective, smaller projects announced for 2017/18
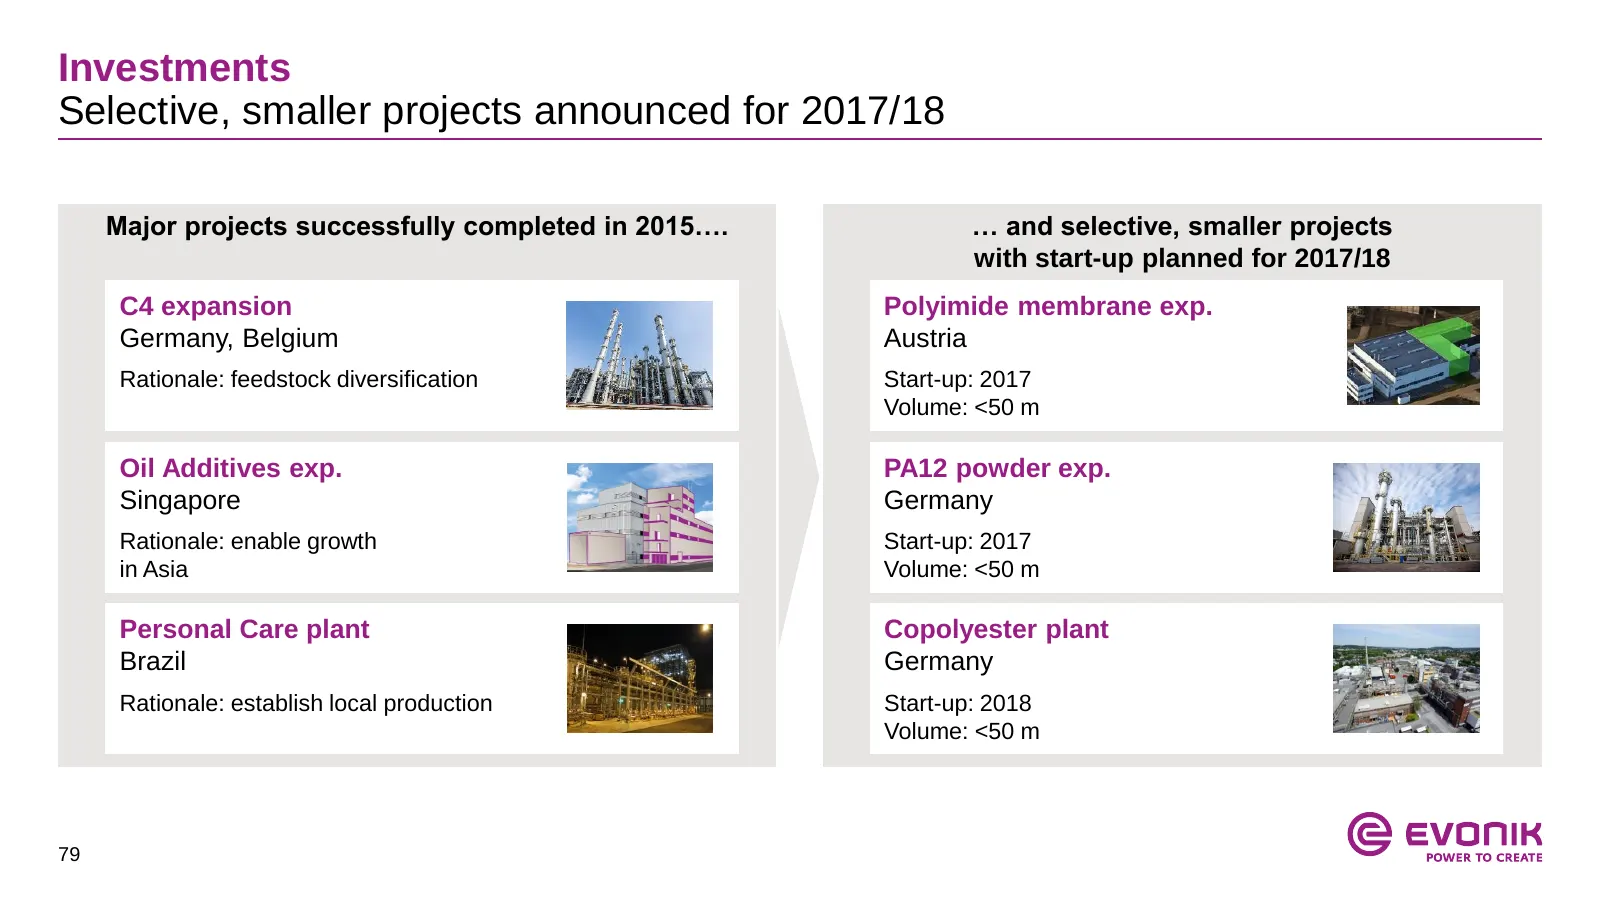
Investments Selective, smaller projects announced for 2017/18 Major projects successfully completed in 2015…. … and selective, smaller projects with start-up planned for 2017/18 C4 expansion Polyimide membrane exp. Germany, Belgium Austria Rationale: feedstock diversification Start-up: 2017 Volume:
Slide 80: Cost improvement integral part of Evonik's DNA
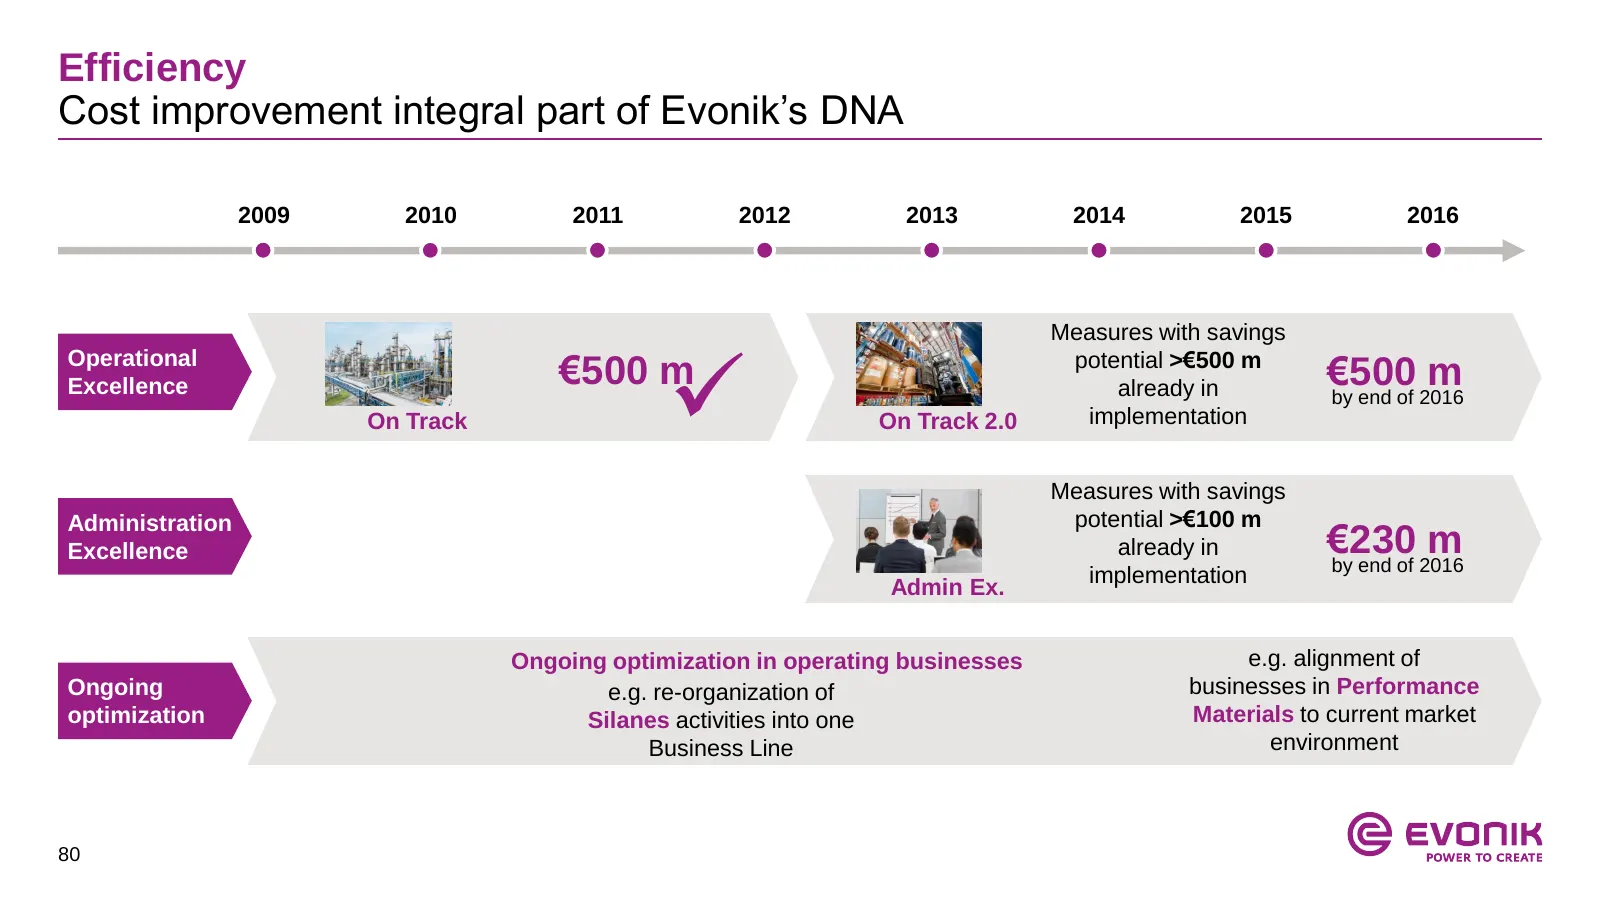
Efficiency Cost improvement integral part of Evonik’s DNA 2009 2010 2011 2012 2013 2014 2015 2016 Measures with savings €500 m €500 Operational potential >€500 m Excellence already in m by end of 2016 On Track On Track 2.0 implementation Measures with savings Administration potential >€100 m Excel
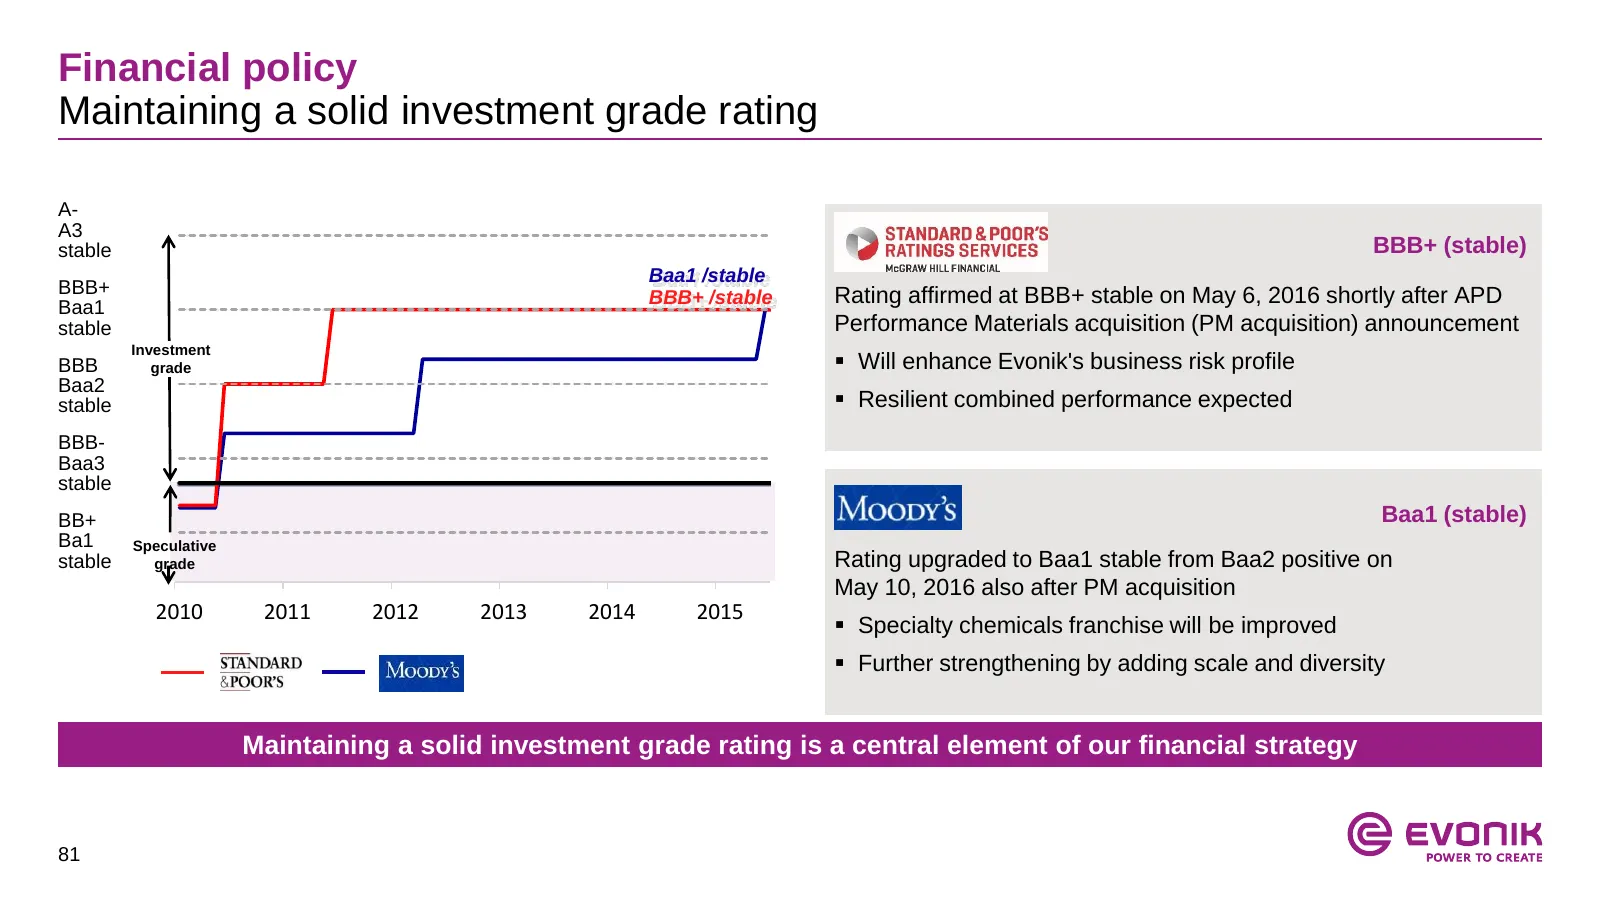
Slide 81: Financial policy
Financial policy Maintaining a solid investment grade rating A- A3 stable BBB+ (stable) Baa1 /stable BBB+ Rating affirmed at BBB+ stable on May 6, 2016 shortly after APD Baa1 BBB+ /stable stable Performance Materials acquisition (PM acquisition) announcement Investment BBB grade Will enhance Evoni
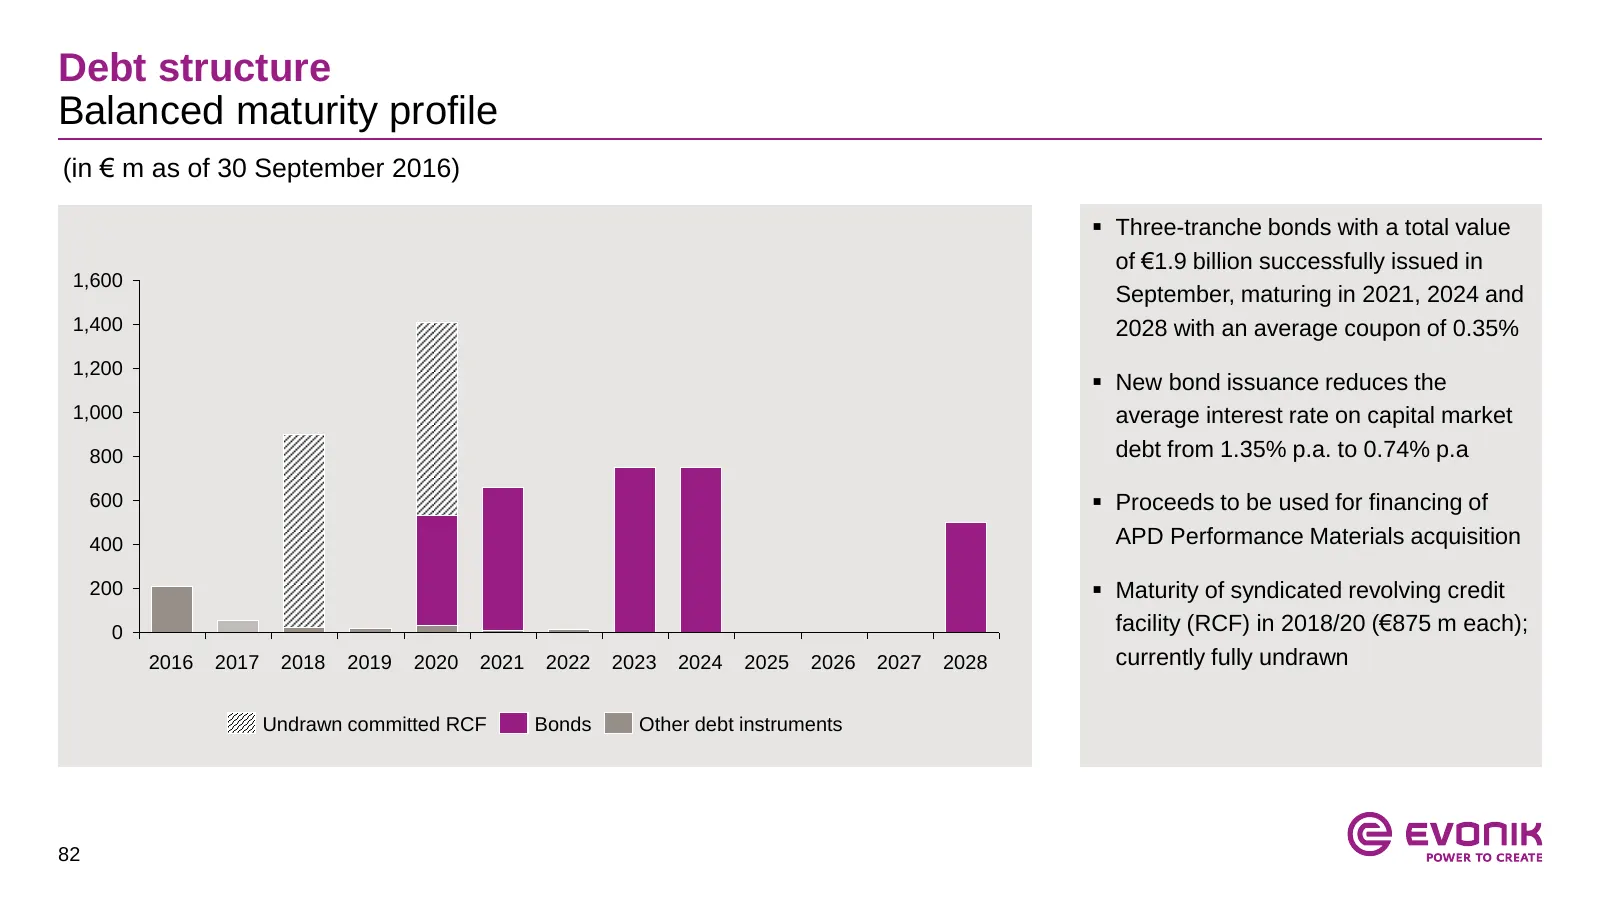
Slide 82: Debt structure
Debt structure Balanced maturity profile (in € m as of 30 September 2016) Three-tranche bonds with a total value of €1.9 billion successfully issued in 1,600 September, maturing in 2021, 2024 and 1,400 2028 with an average coupon of 0.35% 1,200 New bond issuance reduces the 1,000 average interes
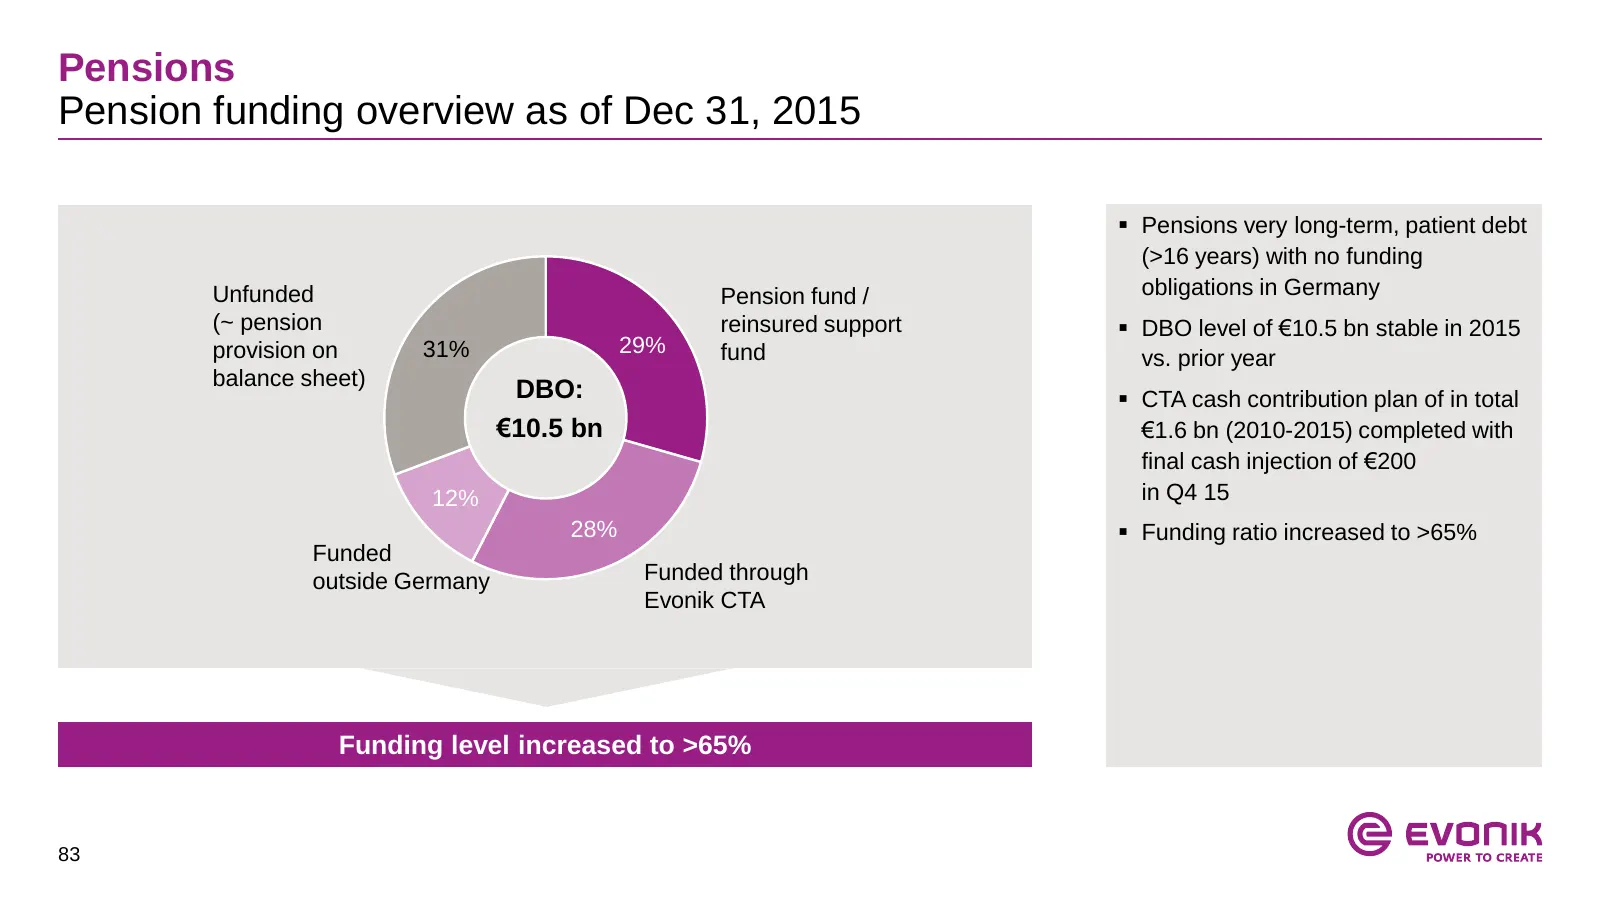
Slide 83: Pension funding overview
Pensions Pension funding overview as of Dec 31, 2015 Pensions very long-term, patient debt (>16 years) with no funding Unfunded Pension fund / obligations in Germany (~ pension reinsured support DBO level of €10.5 bn stable in 2015 provision on 31% 29% fund vs. prior year balance sheet) DBO: C
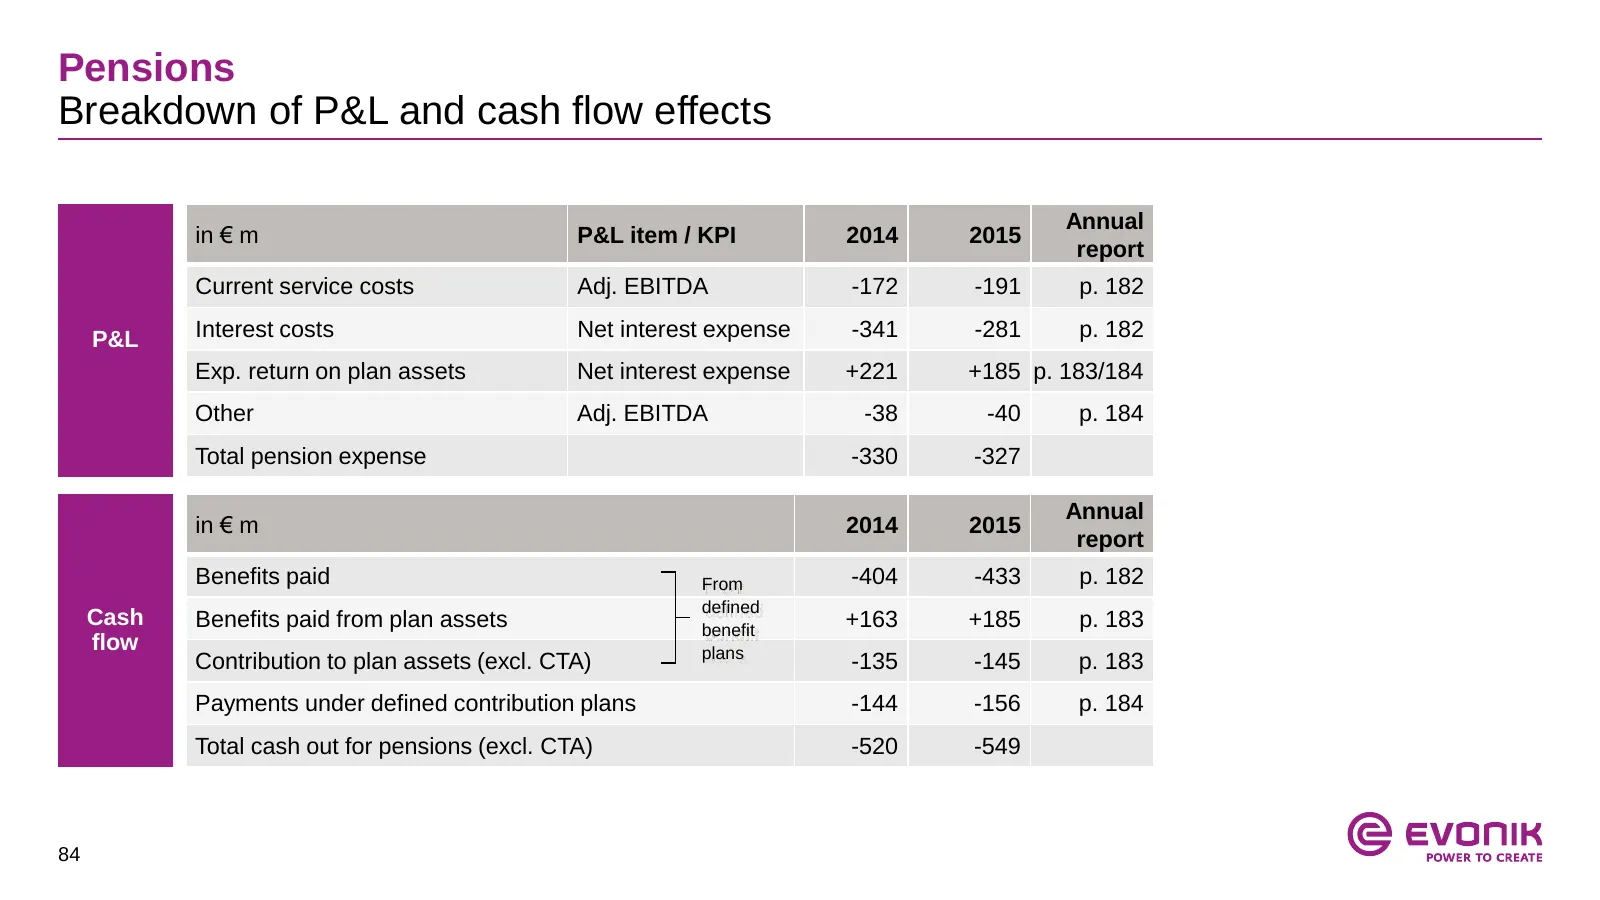
Slide 84: Pensions: Breakdown of P&L and cash flow effects
Pensions Breakdown of P&L and cash flow effects Annual in € m P&L item / KPI 2014 2015 report Current service costs Adj. EBITDA -172 -191 p. 182 P&L Interest costs Net interest expense -341 -281 p. 182 Exp. return on plan assets Net interest expense +221 +185 p. 183/184 Other Adj. EBITDA -38 -40 p.
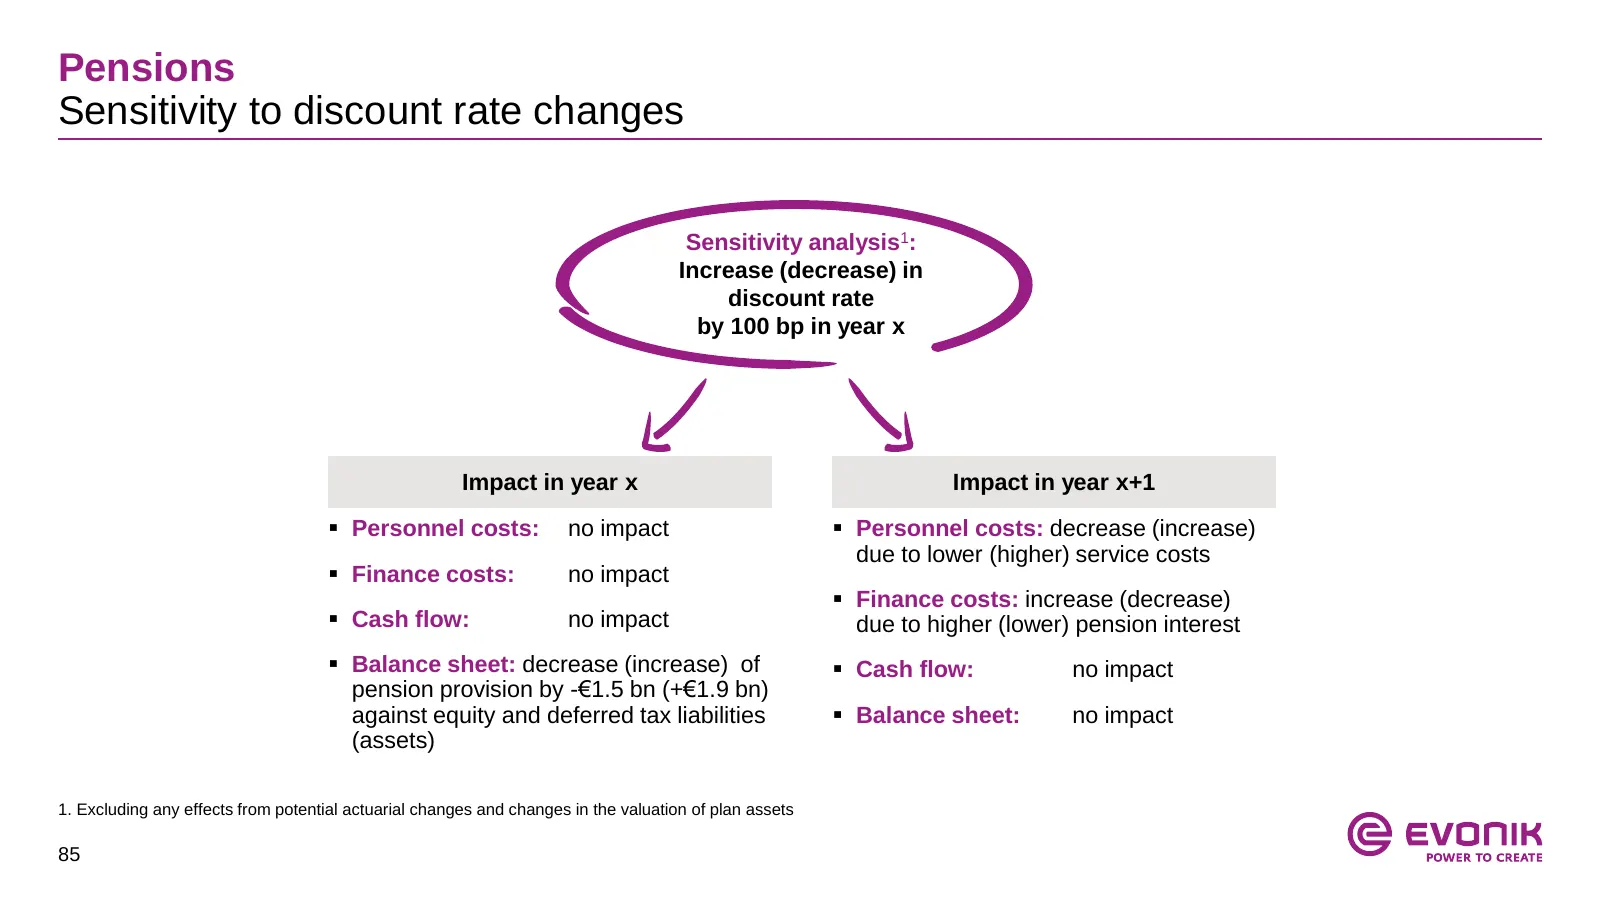
Slide 85: Pensions: Sensitivity to discount rate changes
Pensions Sensitivity to discount rate changes Sensitivity analysis1: Increase (decrease) in discount rate by 100 bp in year x Impact in year x Impact in year x+1 Personnel costs: no impact Personnel costs: decrease (increase) due to lower (higher) service costs Finance costs: no impact Finan
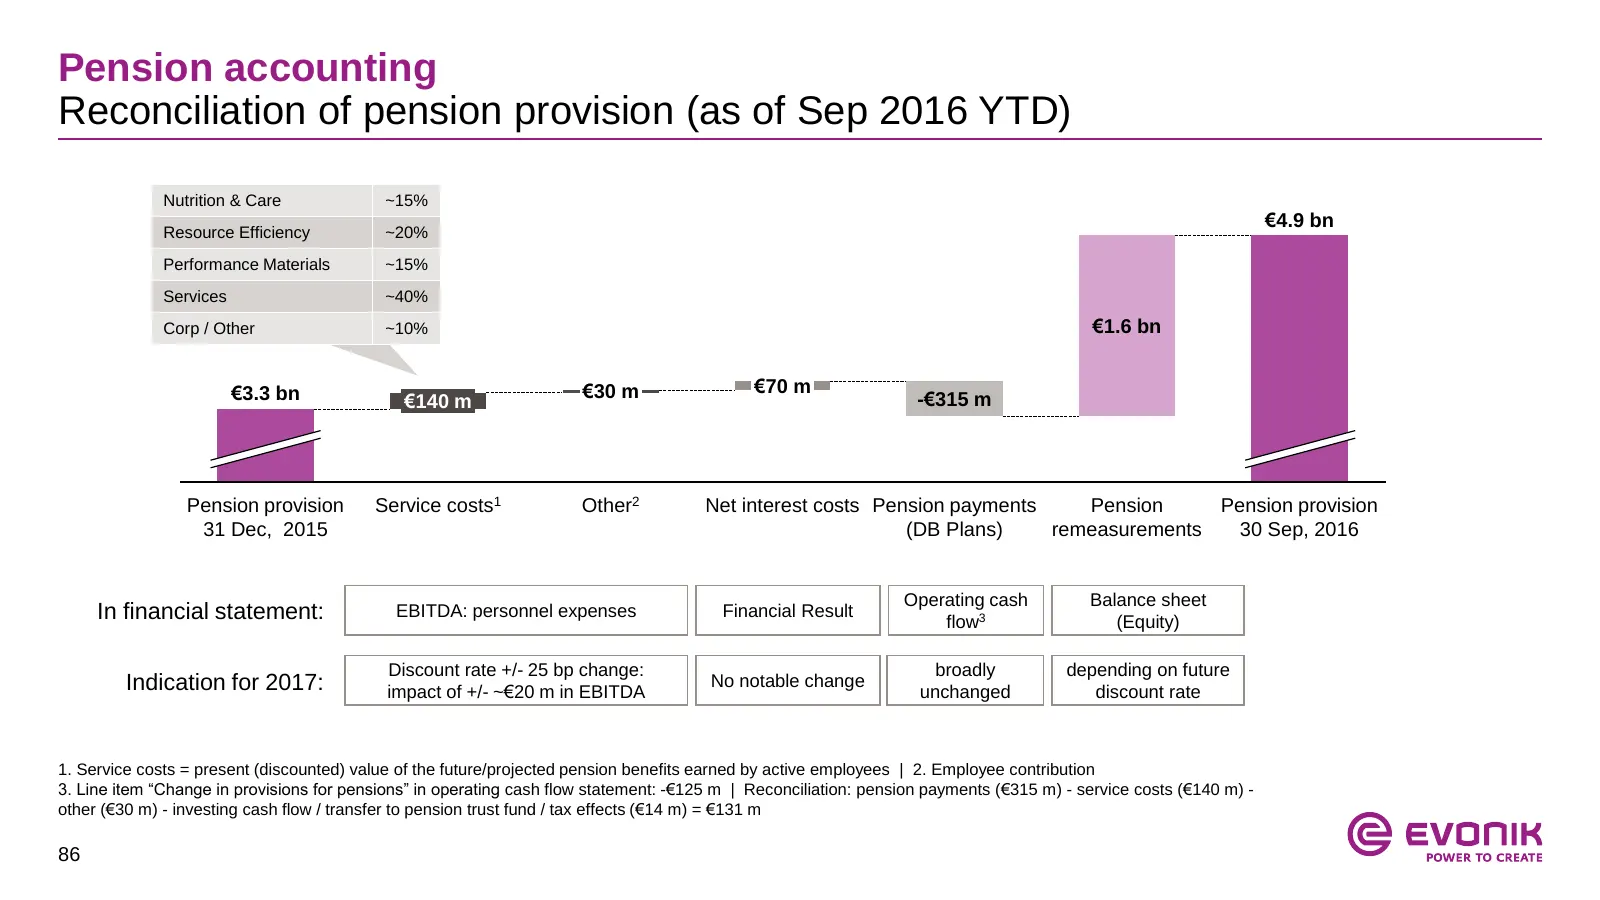
Slide 86: Reconciliation of pension provision
Pension accounting Reconciliation of pension provision (as of Sep 2016 YTD) Nutrition & Care ~15% €4.9 bn Resource Efficiency ~20% Performance Materials ~15% Services ~40% Corp / Other ~10% €1.6 bn €3.3 bn €30 m €70 m €140 m -€315 m Pension provision Service costs1 Other2 Net interest costs Pension
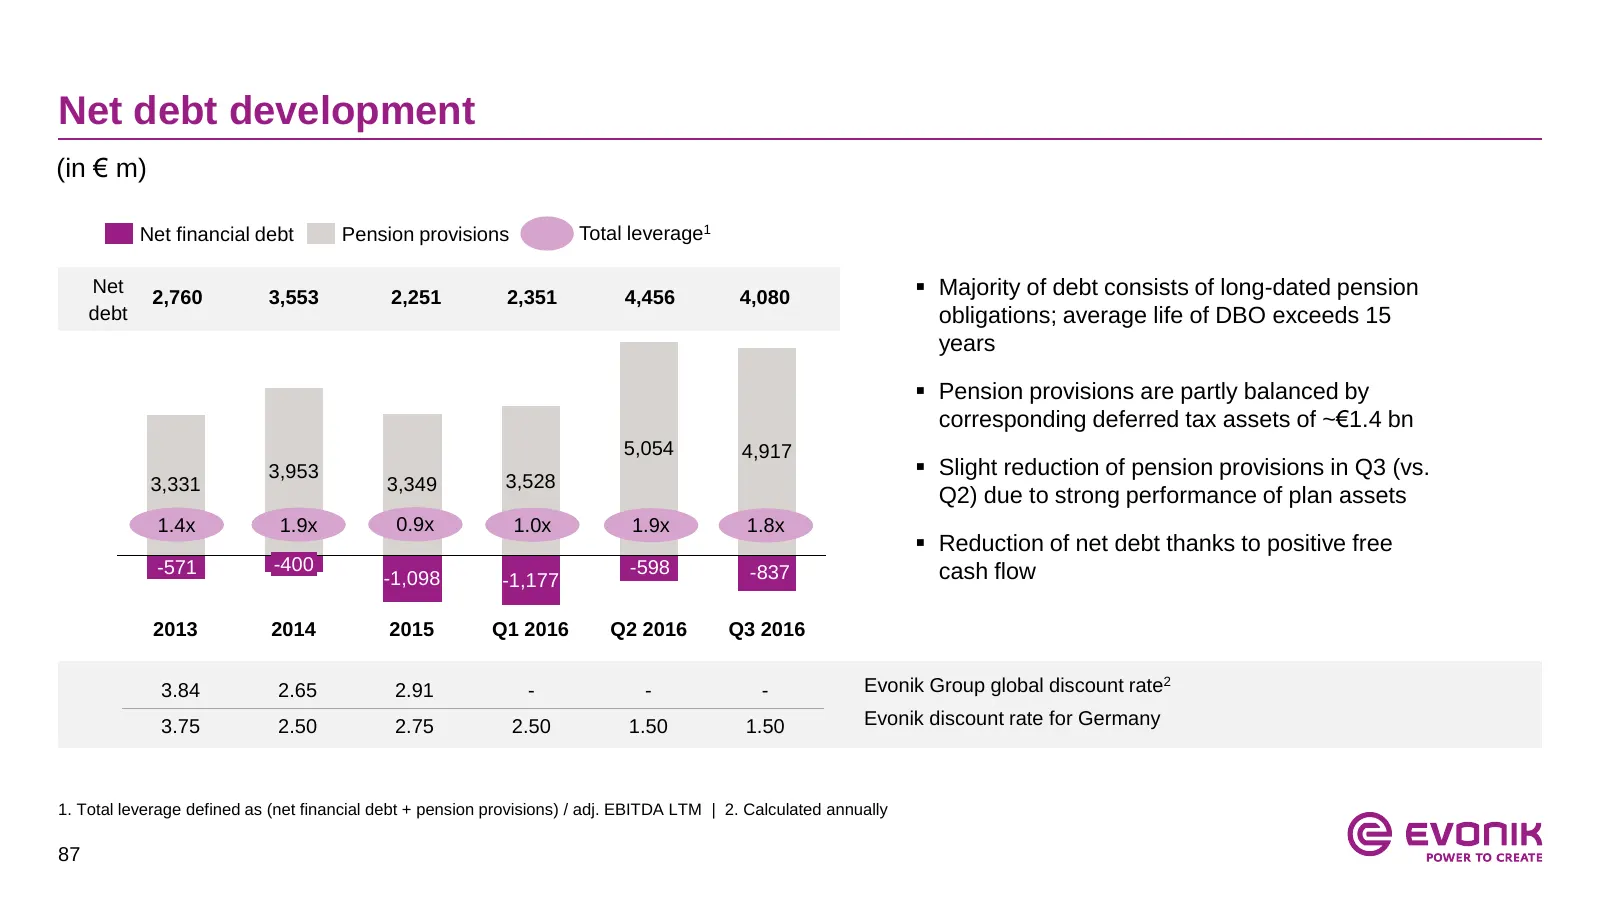
Slide 87: Net debt development
Net debt development (in € m) Net financial debt Pension provisions Total leverage1 Net 2,760 3,553 2,251 2,351 4,456 4,080 Majority of debt consists of long-dated pension debt obligations; average life of DBO exceeds 15 years Pension provisions are partly balanced by corresponding deferred tax
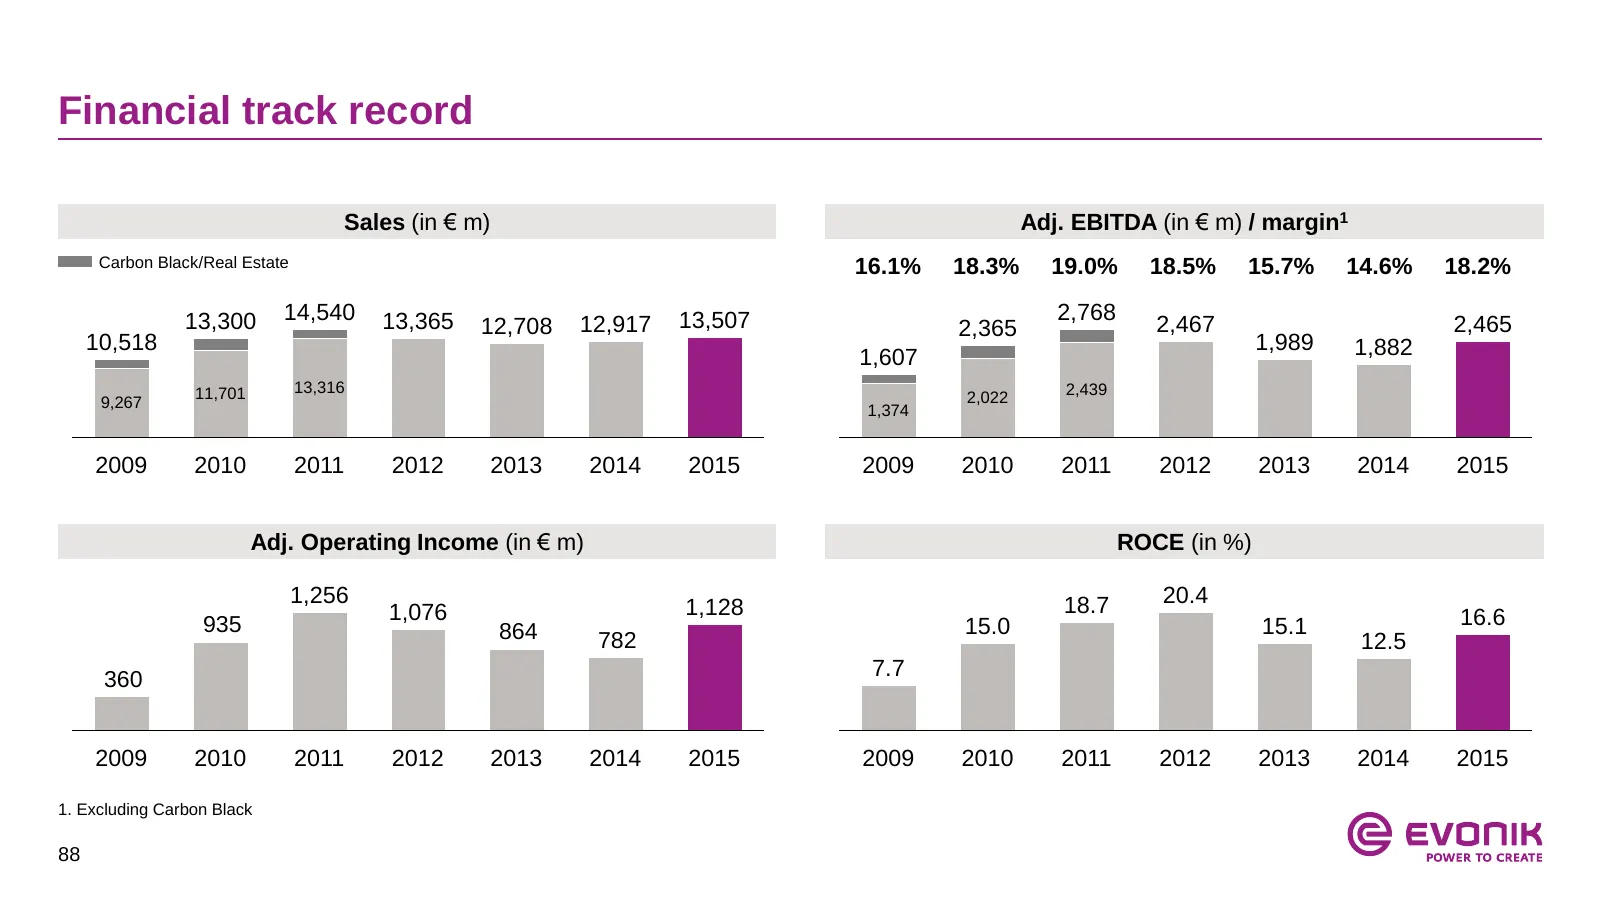
Slide 88: Financial track record
Financial track record Sales (in € m) Adj. EBITDA (in € m) / margin1 Carbon Black/Real Estate 16.1% 18.3% 19.0% 18.5% 15.7% 14.6% 18.2% 13,300 14,540 13,365 13,507 2,768 12,708 12,917 2,365 2,467 2,465 10,518 1,989 1,882 1,607 11,701 13,316 2,439 9,267 2,022 1,374 2009 2010 2011 2012 2013 2014 2015
Slide 89: Raw material split
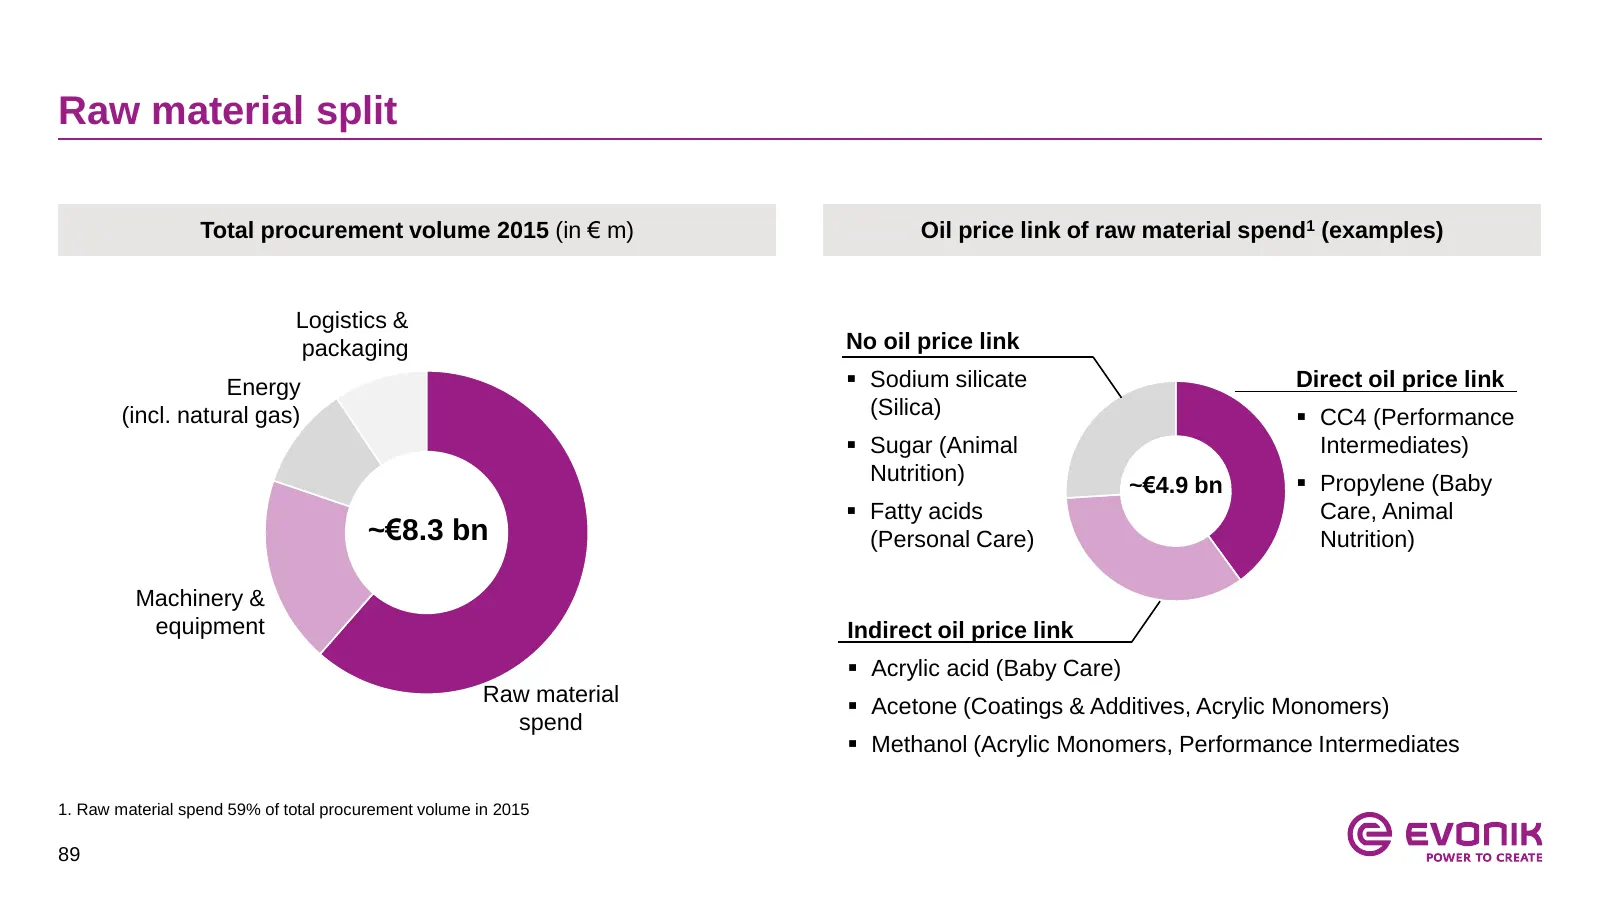
Raw material split Total procurement volume 2015 (in € m) Oil price link of raw material spend1 (examples) Logistics & packaging No oil price link Energy Sodium silicate Direct oil price link (incl. natural gas) (Silica) CC4 (Performance Sugar (Animal Intermediates) Nutrition) Propylene (Bab
Slide 90: Management compensation
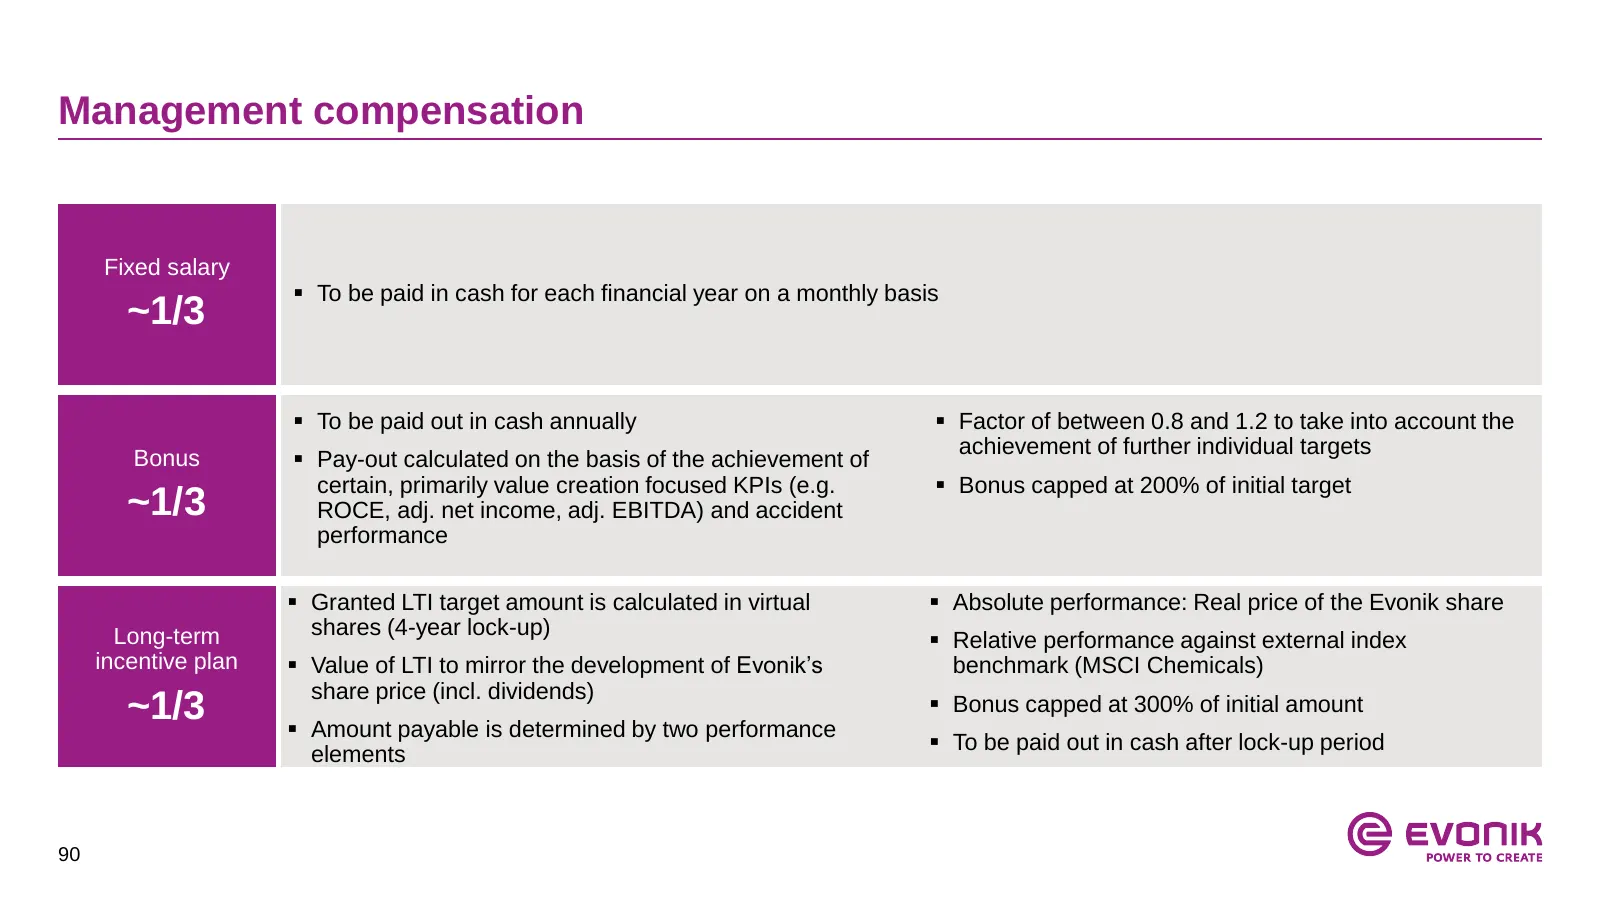
Management compensation Fixed salary To be paid in cash for each financial year on a monthly basis ~1/3 To be paid out in cash annually Factor of between 0.8 and 1.2 to take into account the achievement of further individual targets Bonus Pay-out calculated on the basis of the achievement of
Slide 91: Table of contents
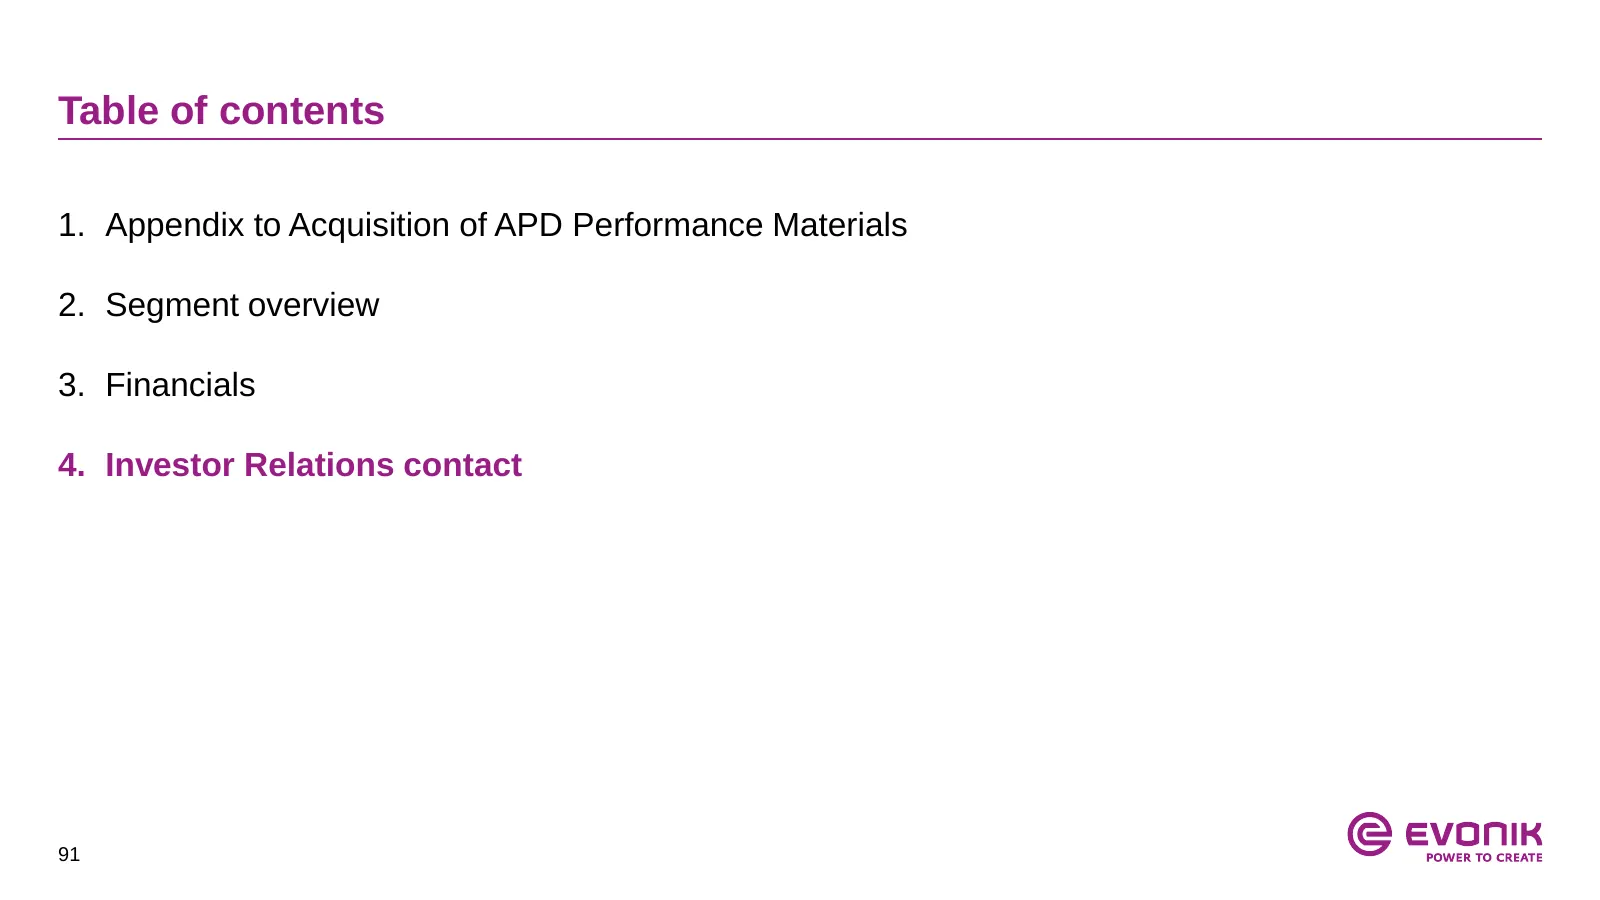
Table of contents 1. Appendix to Acquisition of APD Performance Materials 2. Segment overview 3. Financials 4. Investor Relations contact 91
Slide 92: IR events
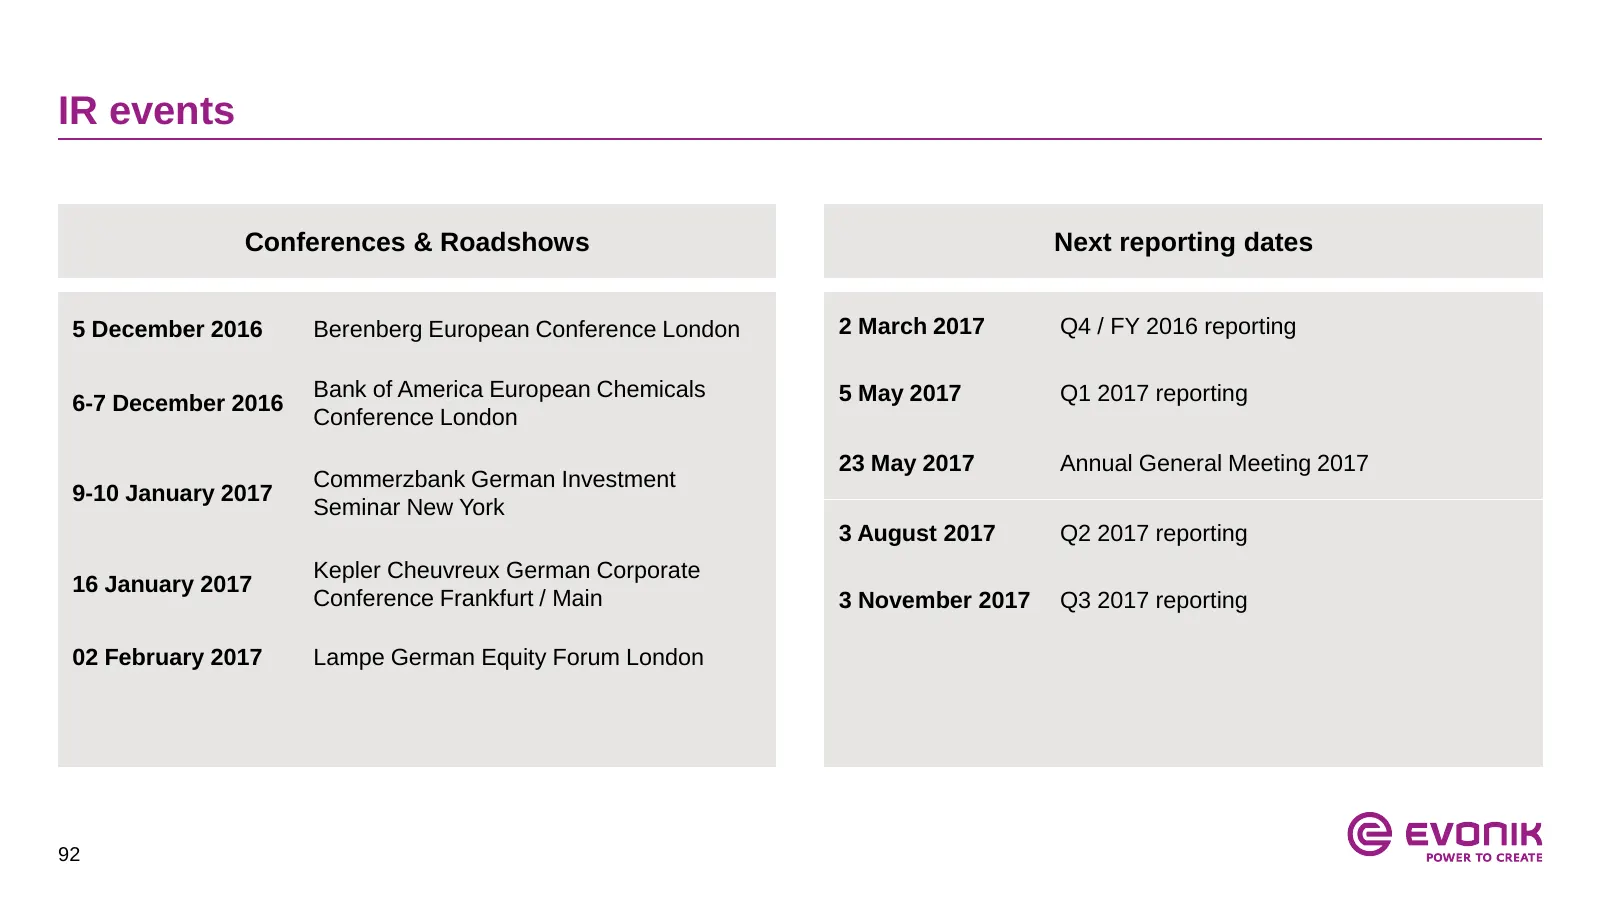
IR events Conferences & Roadshows Next reporting dates 5 December 2016 Berenberg European Conference London 2 March 2017 Q4 / FY 2016 reporting Bank of America European Chemicals 5 May 2017 Q1 2017 reporting 6-7 December 2016 Conference London 23 May 2017 Annual General Meeting 2017 Commerzbank Germ
Slide 93: Evonik Investor Relations team
Evonik Investor Relations team Tim Lange Janine Kanotowsky Head of Investor Relations Team Assistant +49 201 177 3150 +49 201 177 3146 tim.lange@evonik.com janine.kanotowsky@evonik.com Daniel Györy Kai Kirchhoff Investor Relations Manager Investor Relations Manager +49 201 177 3147 +49 201 177 3145
Slide 94: Disclaimer
Disclaimer In so far as forecasts or expectations are expressed in this presentation or where our statements concern the future, these forecasts, expectations or statements may involve known or unknown risks and uncertainties. Actual results or developments may vary, depending on changes in the oper
Slide 95: © evonik
© evonik
Source: Internet Archive copy of corporate.evonik.de
More decks from Evonik Industries AG
 Q3 2026 Earnings Presentation34 slides · Nov 3, 2026
 Q2 2026 Earnings Presentation27 slides · Aug 4, 2026
 Q2 2026 Earnings Presentation39 slides · August 2026
 Q1 2026 Earnings Presentation26 slides · May 8, 2026
 Q4 2025 Earnings Presentation44 slides · Feb 5, 2026
 Q3 2025 Earnings Presentation35 slides · Nov 4, 2025