State Bank Financial Corporation
State Bank Financial — 2017 Gulf South Bank Conference
18 slides from State Bank Financial's conference presentation, May 8, 2017
Slide 1: State Bank Financial Corporation – 2017 Gulf South Bank Conference
State Bank Financial Corporation May 8, 2017 2017 Gulf South Bank Conference
Slide 2: Cautionary Note Regarding Forward-Looking Statements
2 Cautionary Note Regarding Forward-Looking Statements This presentation contains forward-looking statements within the meaning of the federal securities laws. These forward-looking statements, which are based on certain assumptions and describe our future plans, strategies, and expectations, can ge
Slide 3: State Bank Financial Corporation Profile
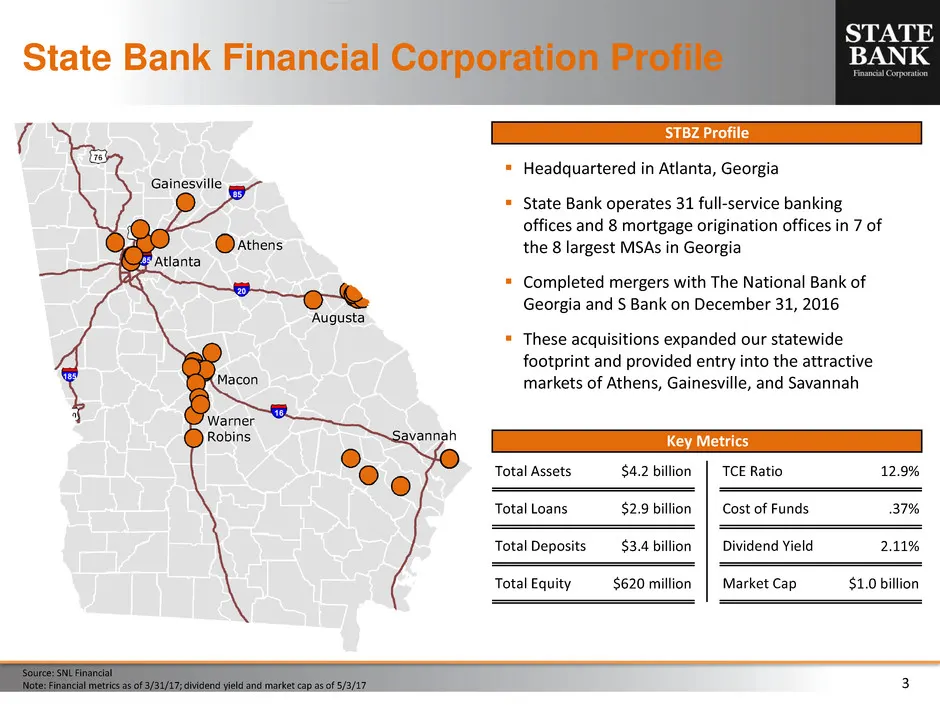
3 Headquartered in Atlanta, Georgia State Bank operates 31 full-service banking offices and 8 mortgage origination offices in 7 of the 8 largest MSAs in Georgia Completed mergers with The National Bank of Georgia and S Bank on December 31, 2016 These acquisitions expanded our statewide footp
Slide 4: Investment Thesis
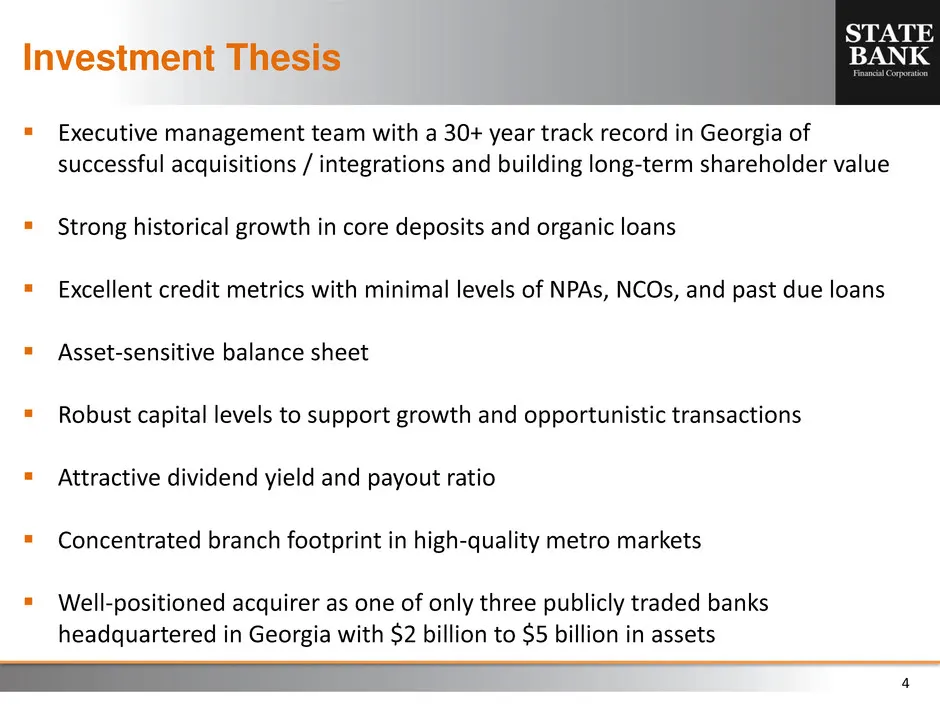
4 Investment Thesis Executive management team with a 30+ year track record in Georgia of successful acquisitions / integrations and building long-term shareholder value Strong historical growth in core deposits and organic loans Excellent credit metrics with minimal levels of NPAs, NCOs, and p
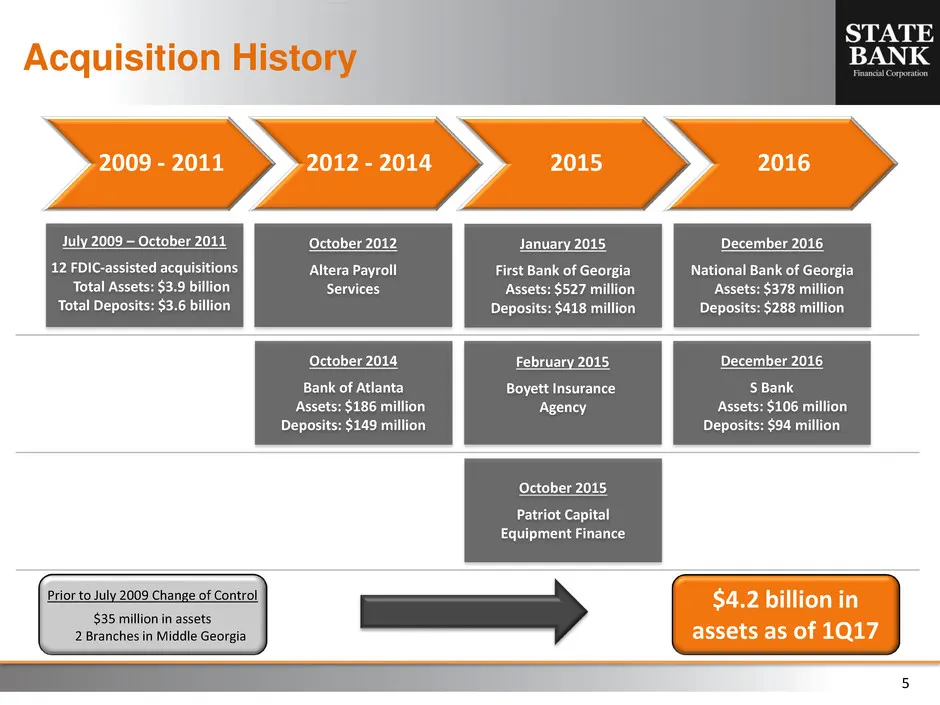
Slide 5: Acquisition History
5 Acquisition History July 2009 – October 2011 12 FDIC-assisted acquisitions Total Assets: $3.9 billion Total Deposits: $3.6 billion January 2015 First Bank of Georgia Assets: $527 million Deposits: $418 million December 2016 National Bank of Georgia Assets: $378 million Deposits: $288 million Febru
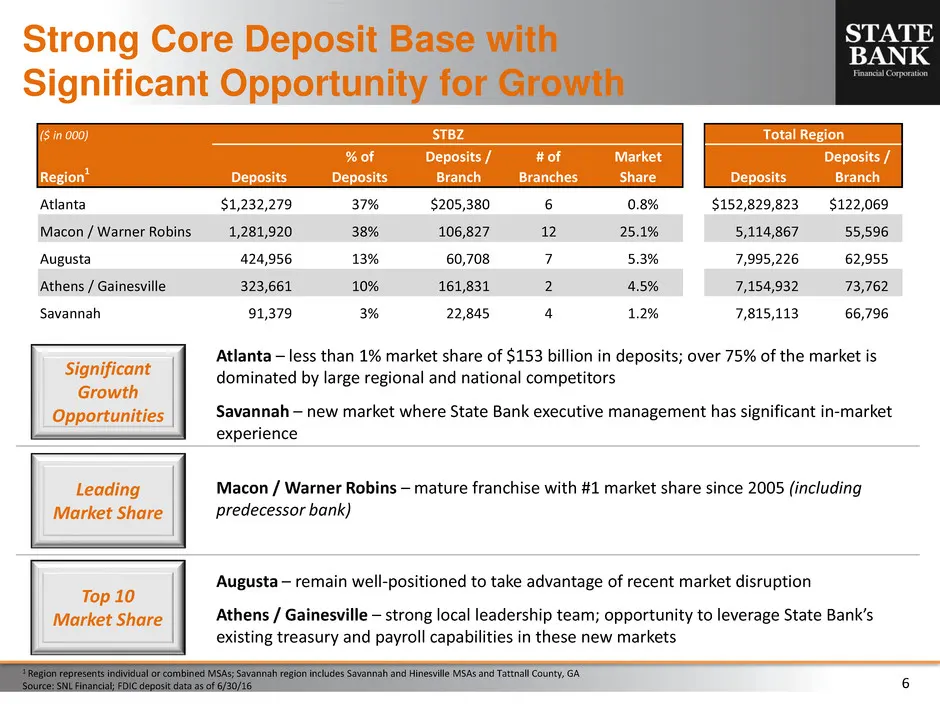
Slide 6: Strong Core Deposit Base with Significant Opportunity for Growth
6 Strong Core Deposit Base with Significant Opportunity for Growth 1 Region represents individual or combined MSAs; Savannah region includes Savannah and Hinesville MSAs and Tattnall County, GA Source: SNL Financial; FDIC deposit data as of 6/30/16 Atlanta – less than 1% market share of $153 billion
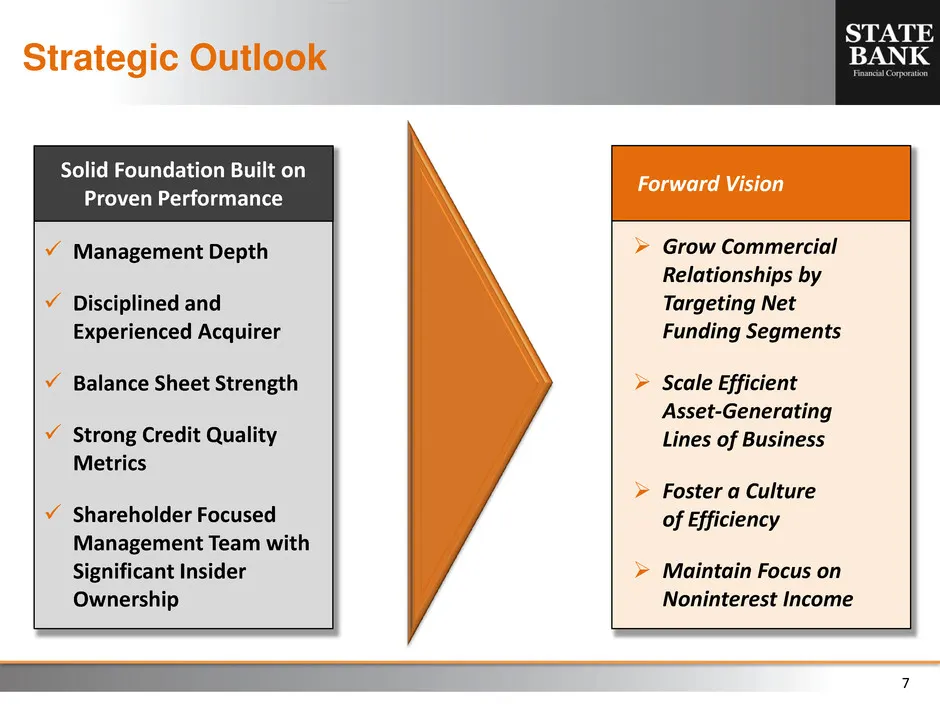
Slide 7: Strategic Outlook
7 Grow Commercial Relationships by Targeting Net Funding Segments Scale Efficient Asset-Generating Lines of Business Foster a Culture of Efficiency Maintain Focus on Noninterest Income Strategic Outlook Management Depth Disciplined and Experienced Acquirer Balance Sheet Strength Stro
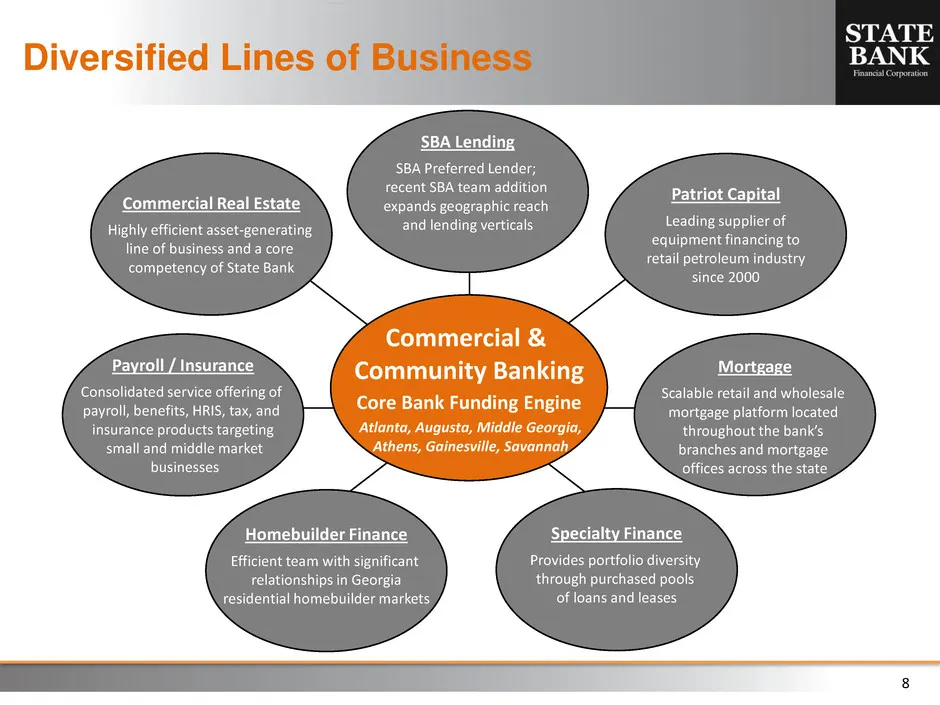
Slide 8: Diversified Lines of Business
8 Diversified Lines of Business Commercial & Community Banking Core Bank Funding Engine Atlanta, Augusta, Middle Georgia, Athens, Gainesville, Savannah Mortgage Scalable retail and wholesale mortgage platform located throughout the bank’s branches and mortgage offices across the state Patriot Capita
Slide 9: 1Q 2017 Financial Results
STATE BANK 1Q 2017 Financial Results
Slide 10: Income Statement Highlights
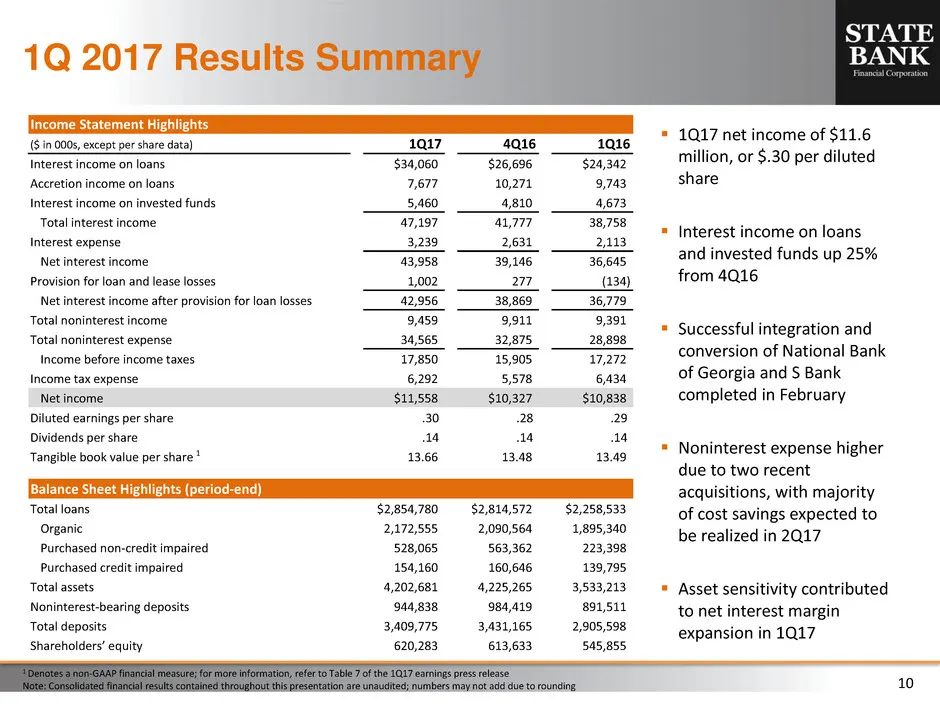
10 Income Statement Highlights ($ in 000s, except per share data) 1Q17 4Q16 1Q16 Interest income on loans $34,060 $26,696 $24,342 Accretion income on loans 7,677 10,271 9,743 Interest income on invested funds 5,460 4,810 4,673 Total interest income 47,197 41,777 38,758 Interest expense 3,239 2,631 2
Slide 11: Revenue Trends – Interest Income
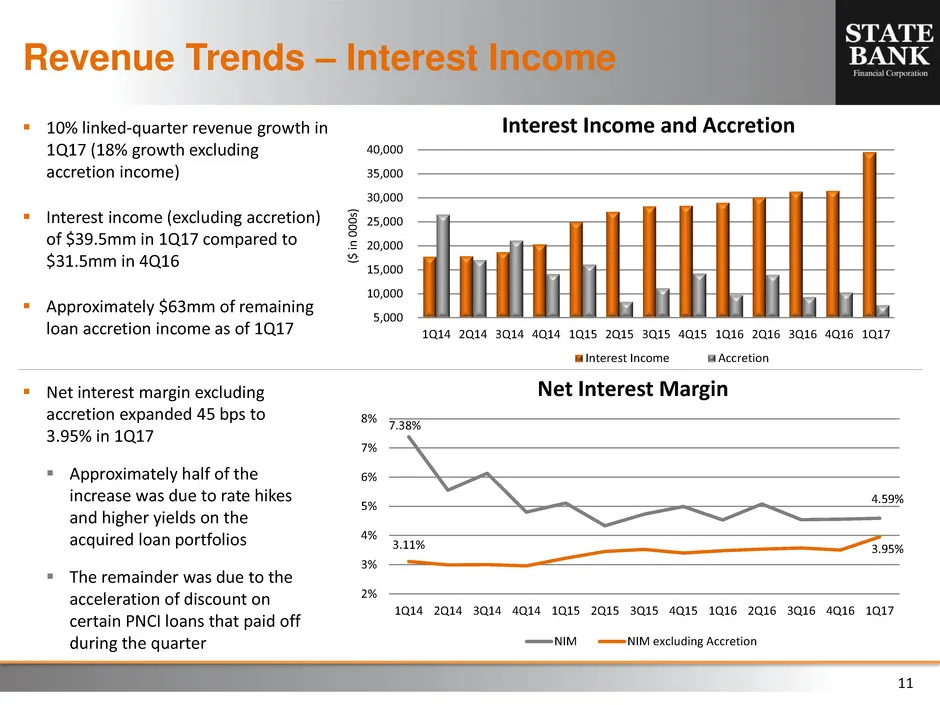
11 Revenue Trends – Interest Income 10% linked-quarter revenue growth in 1Q17 (18% growth excluding accretion income) Interest income (excluding accretion) of $39.5mm in 1Q17 compared to $31.5mm in 4Q16 Approximately $63mm of remaining loan accretion income as of 1Q17 ($ i n 000 s) Net inter
Slide 12: Revenue Trends – Noninterest Income
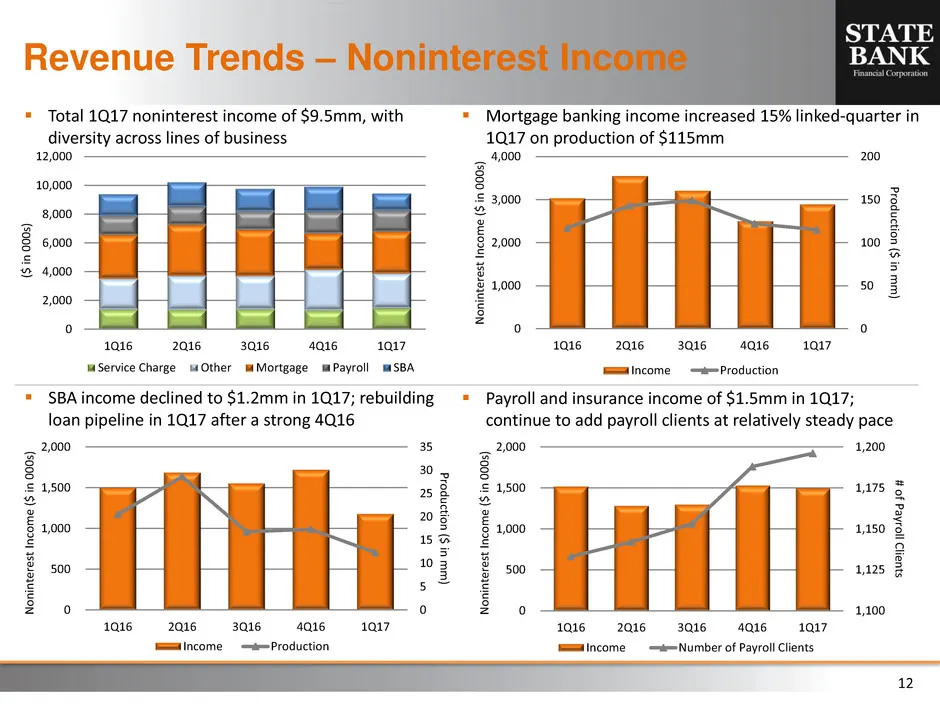
12 SBA income declined to $1.2mm in 1Q17; rebuilding loan pipeline in 1Q17 after a strong 4Q16 Payroll and insurance income of $1.5mm in 1Q17; continue to add payroll clients at relatively steady pace Revenue Trends – Noninterest Income Mortgage banking income increased 15% linked-quarter in 1
Slide 13: Focused on Improving Efficiency
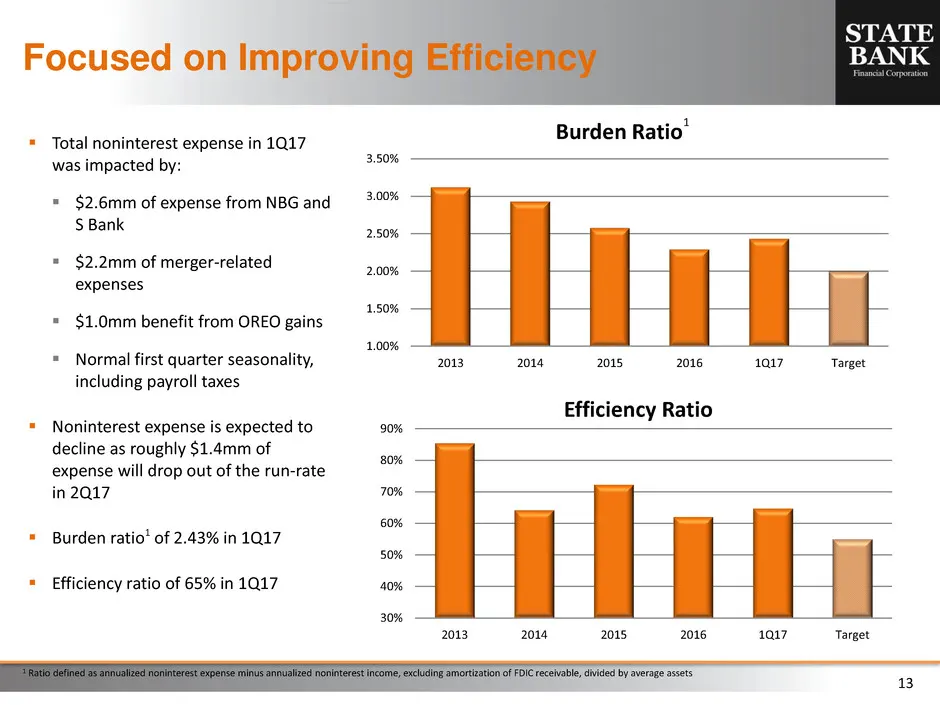
13 Focused on Improving Efficiency Total noninterest expense in 1Q17 was impacted by: $2.6mm of expense from NBG and S Bank $2.2mm of merger-related expenses $1.0mm benefit from OREO gains Normal first quarter seasonality, including payroll taxes Noninterest expense is expected to declin
Slide 14: Core Deposit Funding
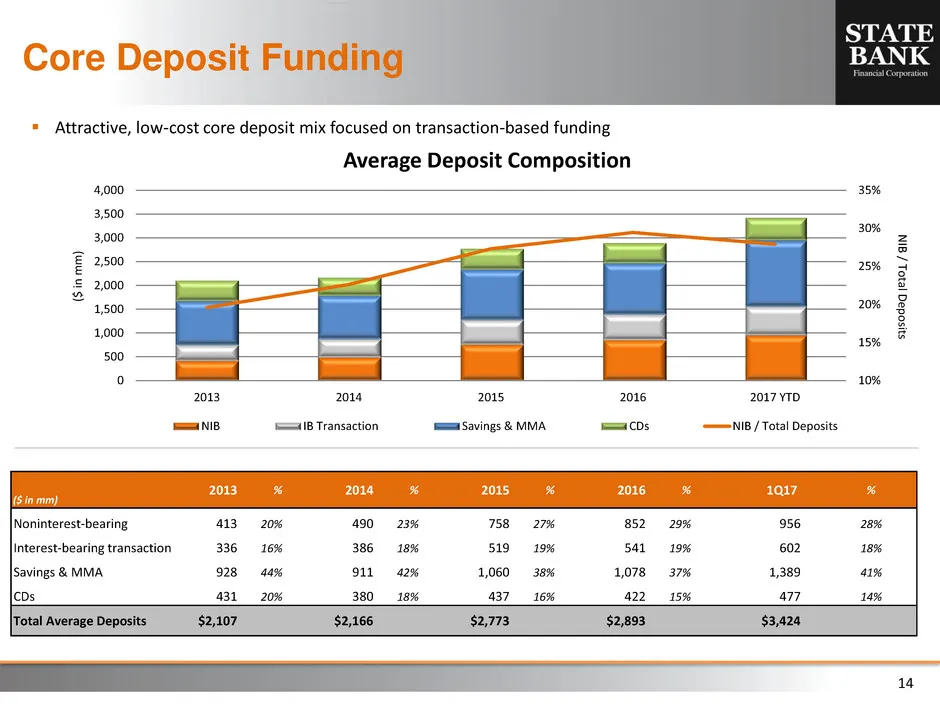
14 Core Deposit Funding ($ i n m m ) N IB / Tot al D ep o sit s Attractive, low-cost core deposit mix focused on transaction-based funding 1 10% 15% 20% 25% 30% 35% 0 500 1,000 1,500 2,000 2,500 3,000 3,500 4,000 2013 2014 2015 2016 2017 YTD Average Deposit Composition NIB IB Transaction Savings &
Slide 15: Core Deposit Funding
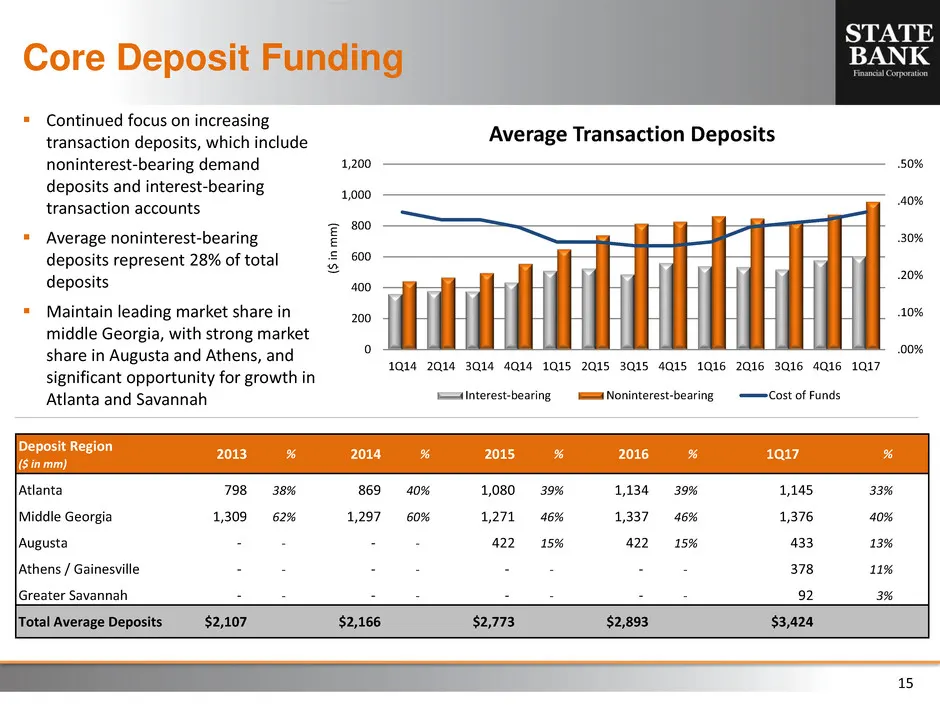
15 Core Deposit Funding Continued focus on increasing transaction deposits, which include noninterest-bearing demand deposits and interest-bearing transaction accounts Average noninterest-bearing deposits represent 28% of total deposits Maintain leading market share in middle Georgia, with str
Slide 16: Loan Portfolio
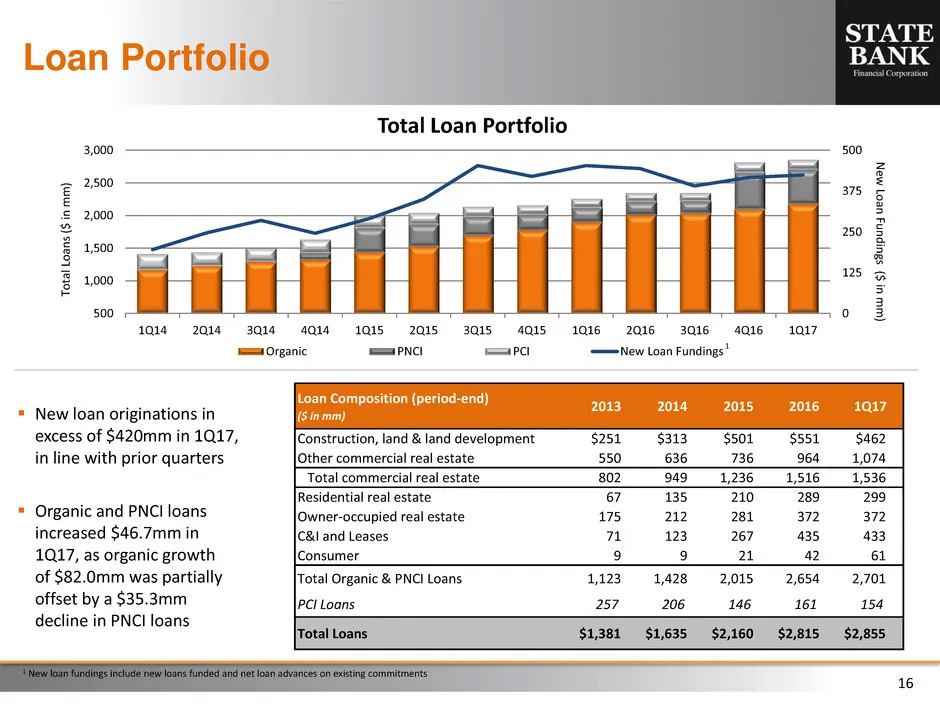
16 0 125 250 375 500 500 1,000 1,500 2,000 2,500 3,000 1Q14 2Q14 3Q14 4Q14 1Q15 2Q15 3Q15 4Q15 1Q16 2Q16 3Q16 4Q16 1Q17 Total Loan Portfolio Organic PNCI PCI New Loan Fundings Loan Portfolio To ta l L o an s ($ in m m ) 1 New loan fundings include new loans funded and net loan advances on existing c
Slide 17: Loan Portfolio and CRE Composition
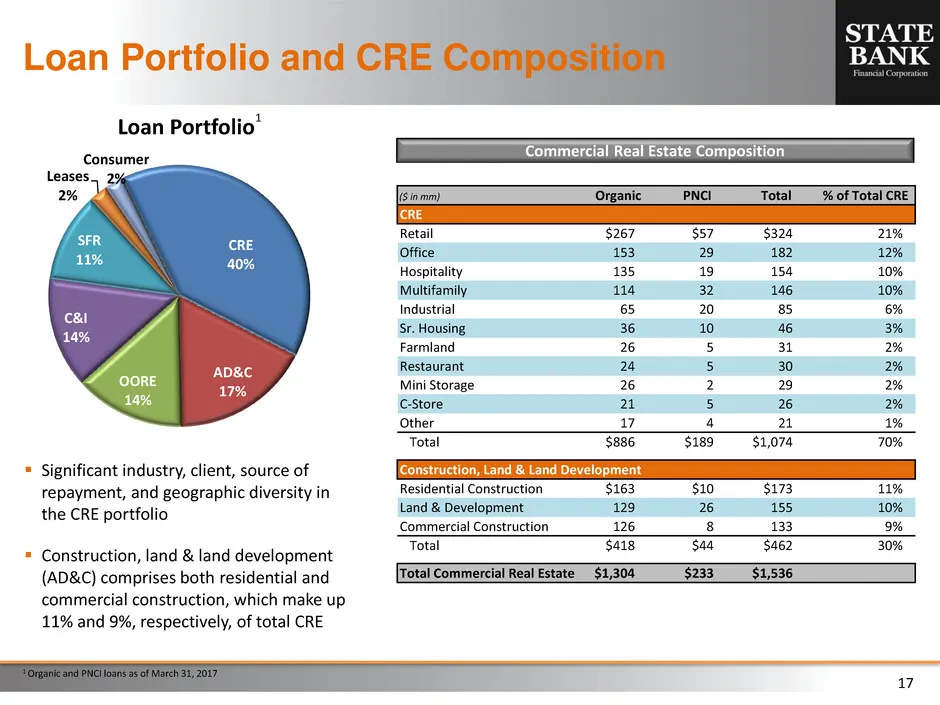
17 Loan Portfolio and CRE Composition 1 Organic and PNCI loans as of March 31, 2017 Commercial Real Estate Composition Significant industry, client, source of repayment, and geographic diversity in the CRE portfolio Construction, land & land development (AD&C) comprises both residential and comm
Slide 18: Asset Quality
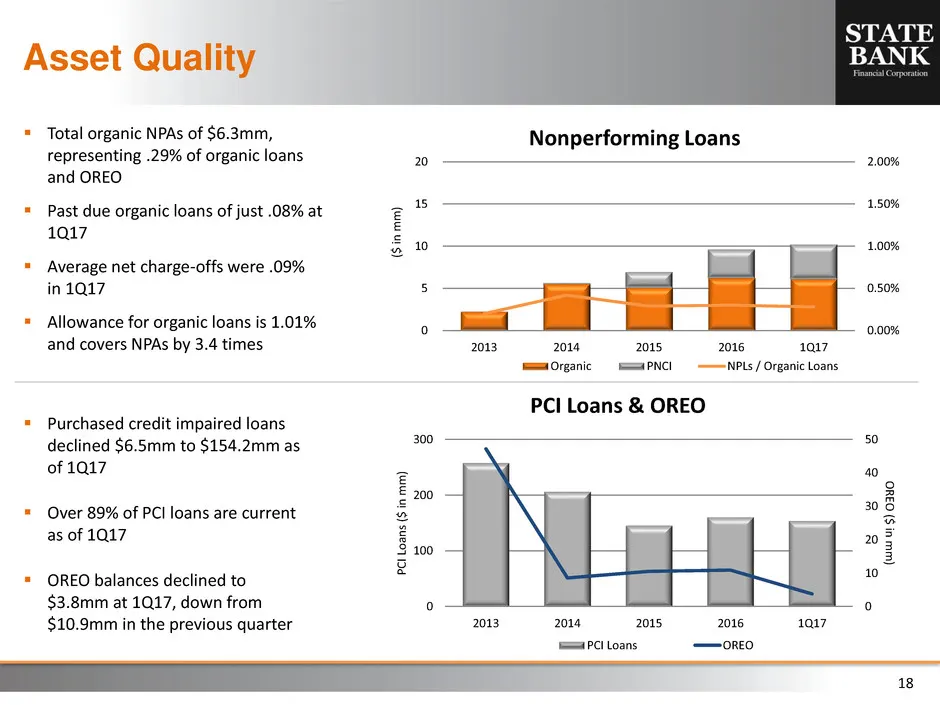
18 Purchased credit impaired loans declined $6.5mm to $154.2mm as of 1Q17 Over 89% of PCI loans are current as of 1Q17 OREO balances declined to $3.8mm at 1Q17, down from $10.9mm in the previous quarter Asset Quality ($ i n m m ) Total organic NPAs of $6.3mm, representing .29% of organic loa
Source: SEC EDGAR · 8-K filed May 8, 2017
More decks from State Bank Financial Corporation
 Merger or Acquisition (May 2018)20 slides · May 14, 2018
 Investor Presentation (May 2018)18 slides · May 7, 2018
 Q1 2018 Earnings Presentation11 slides · Apr 26, 2018
 Q4 2017 Earnings Presentation14 slides · Jan 25, 2018
 Investor Presentation (December 2017)18 slides · Dec 11, 2017
 Q3 2017 Earnings Presentation12 slides · Oct 26, 2017