Premier Foods plc · LSE:PFD
Premier Foods — H1 FY26/27 Earnings Presentation
40 slides from Premier Foods's earnings presentation, Nov 12, 2026
Slide 1: Half year results for 26 weeks ended 26 September 2026
Half year results for 26 weeks ended 26 September 2026 12 November 2026
Slide 2: Alex Whitehouse, CEO
(Cremer FOODS Alex Whitehouse CEO Ga (-exichine life THROUGH FOOD’
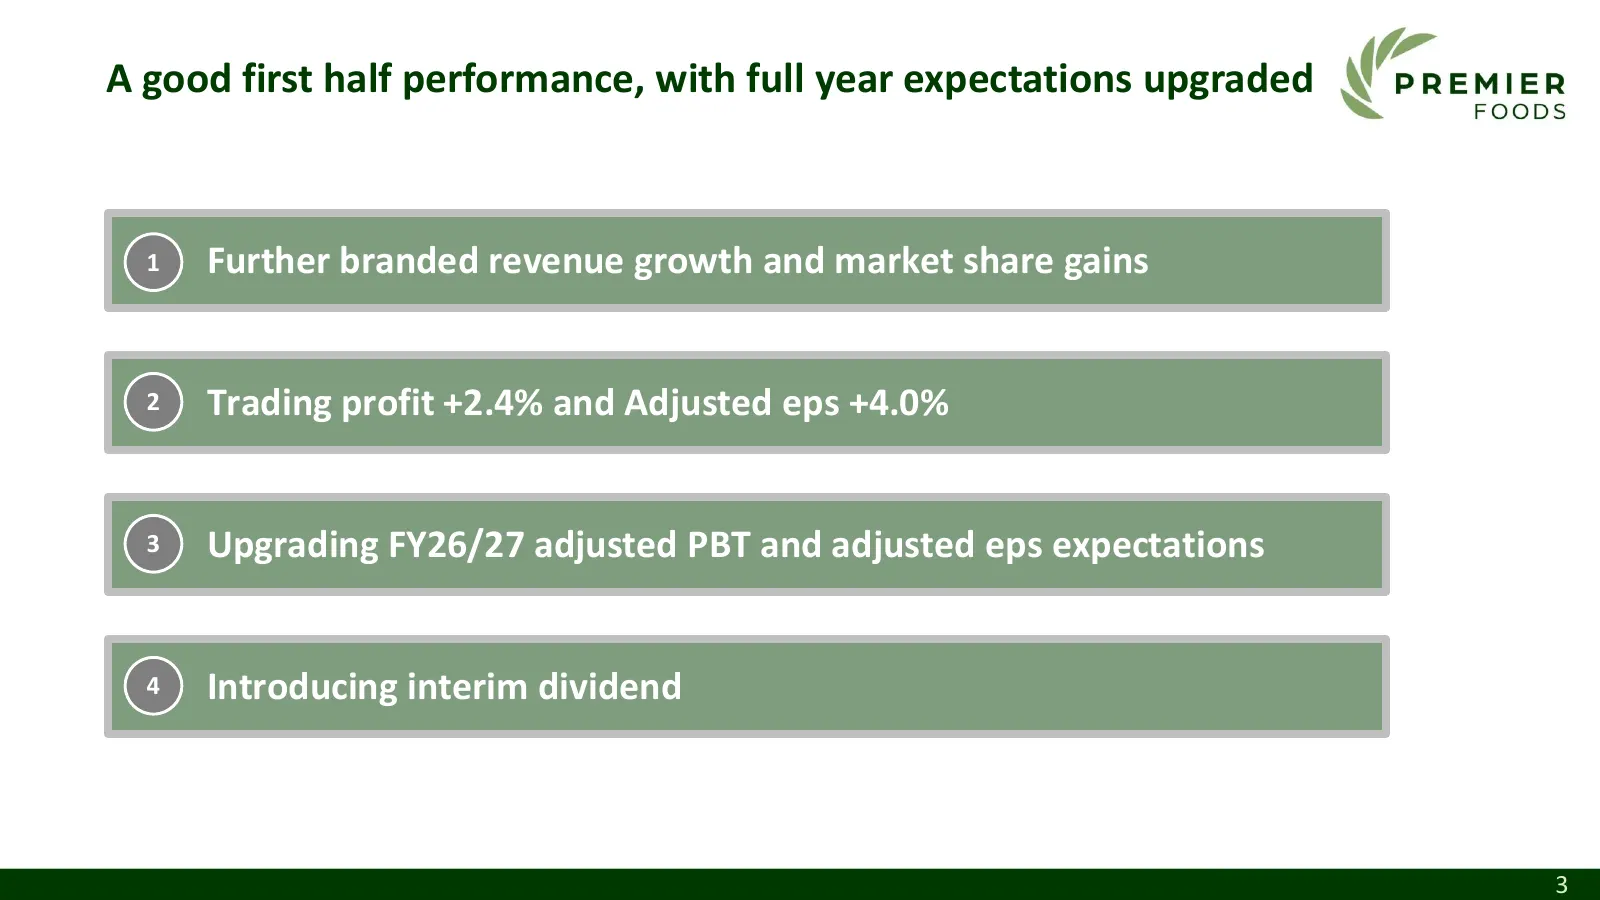
Slide 3: A good first half performance, with full year expectations upgraded
A good first half performance, with full year expectations upgraded 1 Further branded revenue growth and market share gains 2 Trading profit +2.4% and Adjusted eps +4.0% 3 Upgrading FY26/27 adjusted PBT and adjusted eps expectations 4 Introducing interim dividend 3
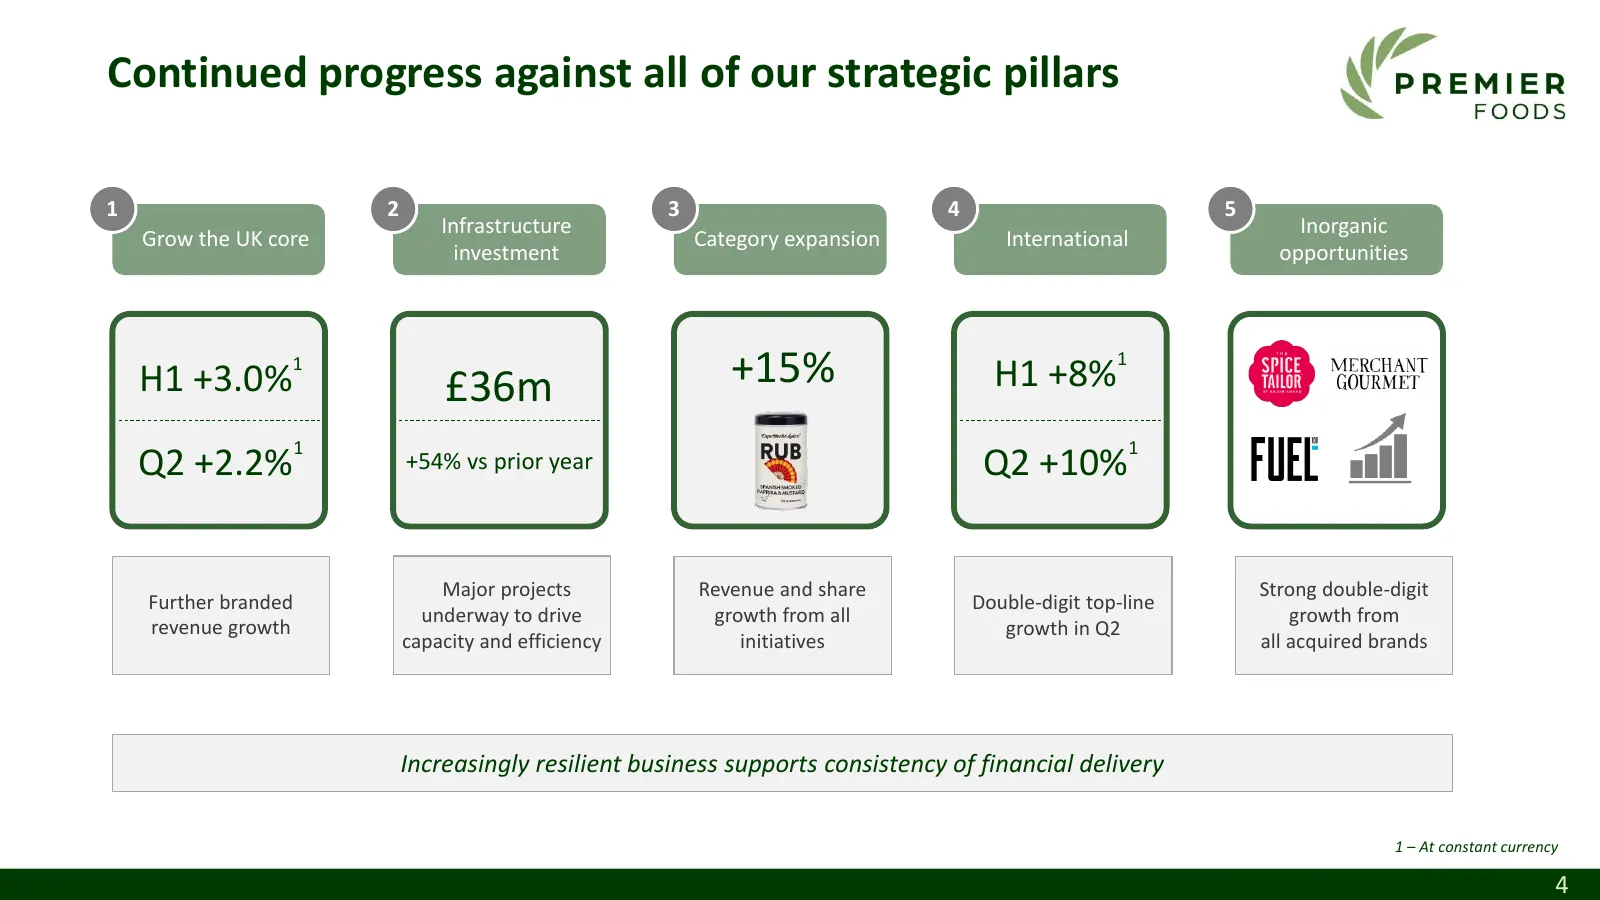
Slide 4: Continued progress against all of our strategic pillars
Continued progress against all of our strategic pillars 1 2 3 4 5 Infrastructure Inorganic Grow the UK core Category expansion International investment opportunities H1 +3.0% 1 £36m +15% H1 +8% 1 1 1 Q2 +2.2% +54% vs prior year Q2 +10% Major projects Revenue and share Strong double-digit Further bra
Slide 5: Duncan Leggett
PREMIER FOODS (- vy ~~ ~~ cod) on on cD) ol c © 1S] c > a) Oo me O g life ( enrichin THROUGH FOOD’
Slide 6: Focused on delivering further shareholder value
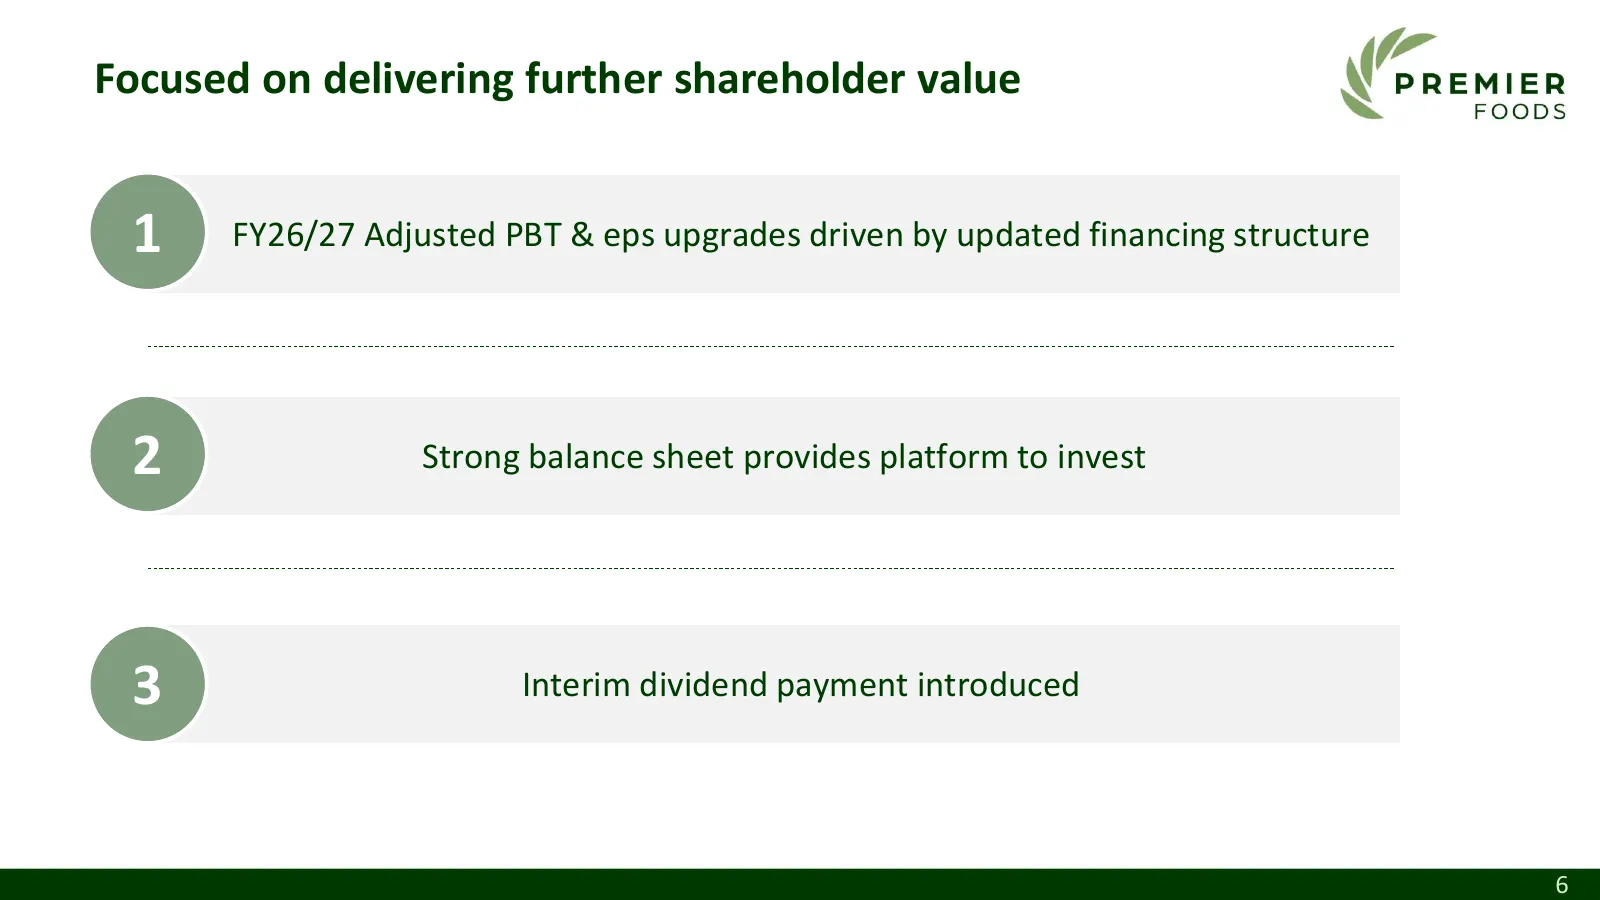
Focused on delivering further shareholder value 1 FY26/27 Adjusted PBT & eps upgrades driven by updated financing structure 2 Strong balance sheet provides platform to invest 3 Interim dividend payment introduced 6
Slide 7: Good financial progress on all key measures
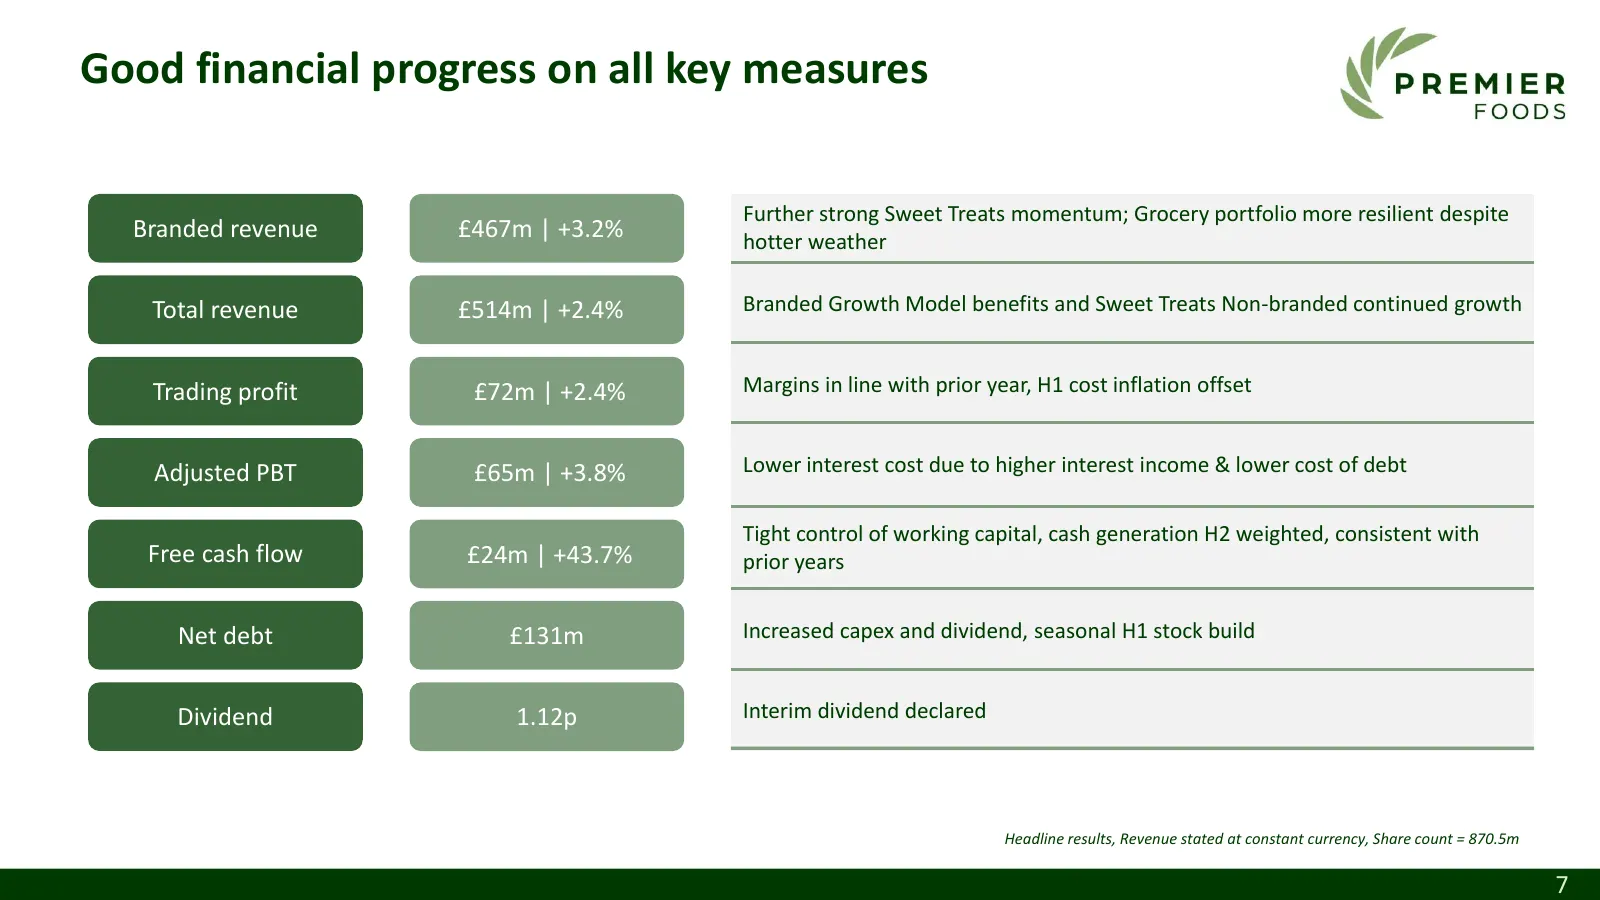
Good financial progress on all key measures Further strong Sweet Treats momentum; Grocery portfolio more resilient despite Branded revenue £467m | +3.2% hotter weather Total revenue £514m | +2.4% Branded Growth Model benefits and Sweet Treats Non-branded continued growth Trading profit £72m | +2.4%
Slide 8: Branded Growth Model delivering good revenue progress
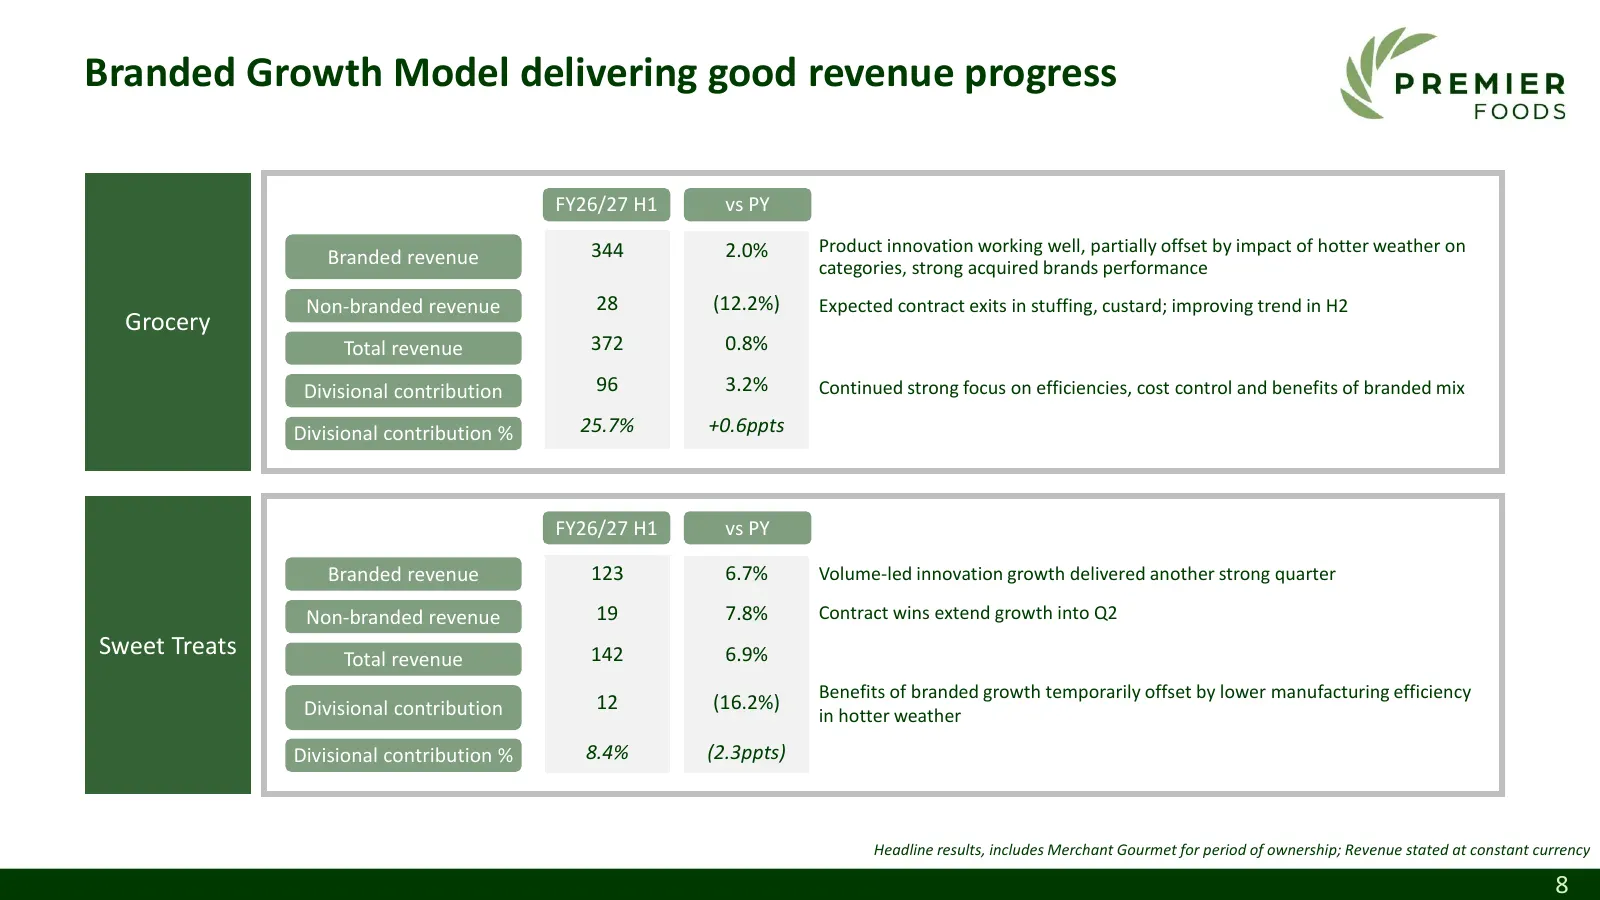
Branded Growth Model delivering good revenue progress FY26/27 H1 vs PY 344 2.0% Product innovation working well, partially offset by impact of hotter weather on Branded revenue categories, strong acquired brands performance Non-branded revenue 28 (12.2%) Expected contract exits in stuffing, custard;
Slide 9: A balance sheet focused on value creation
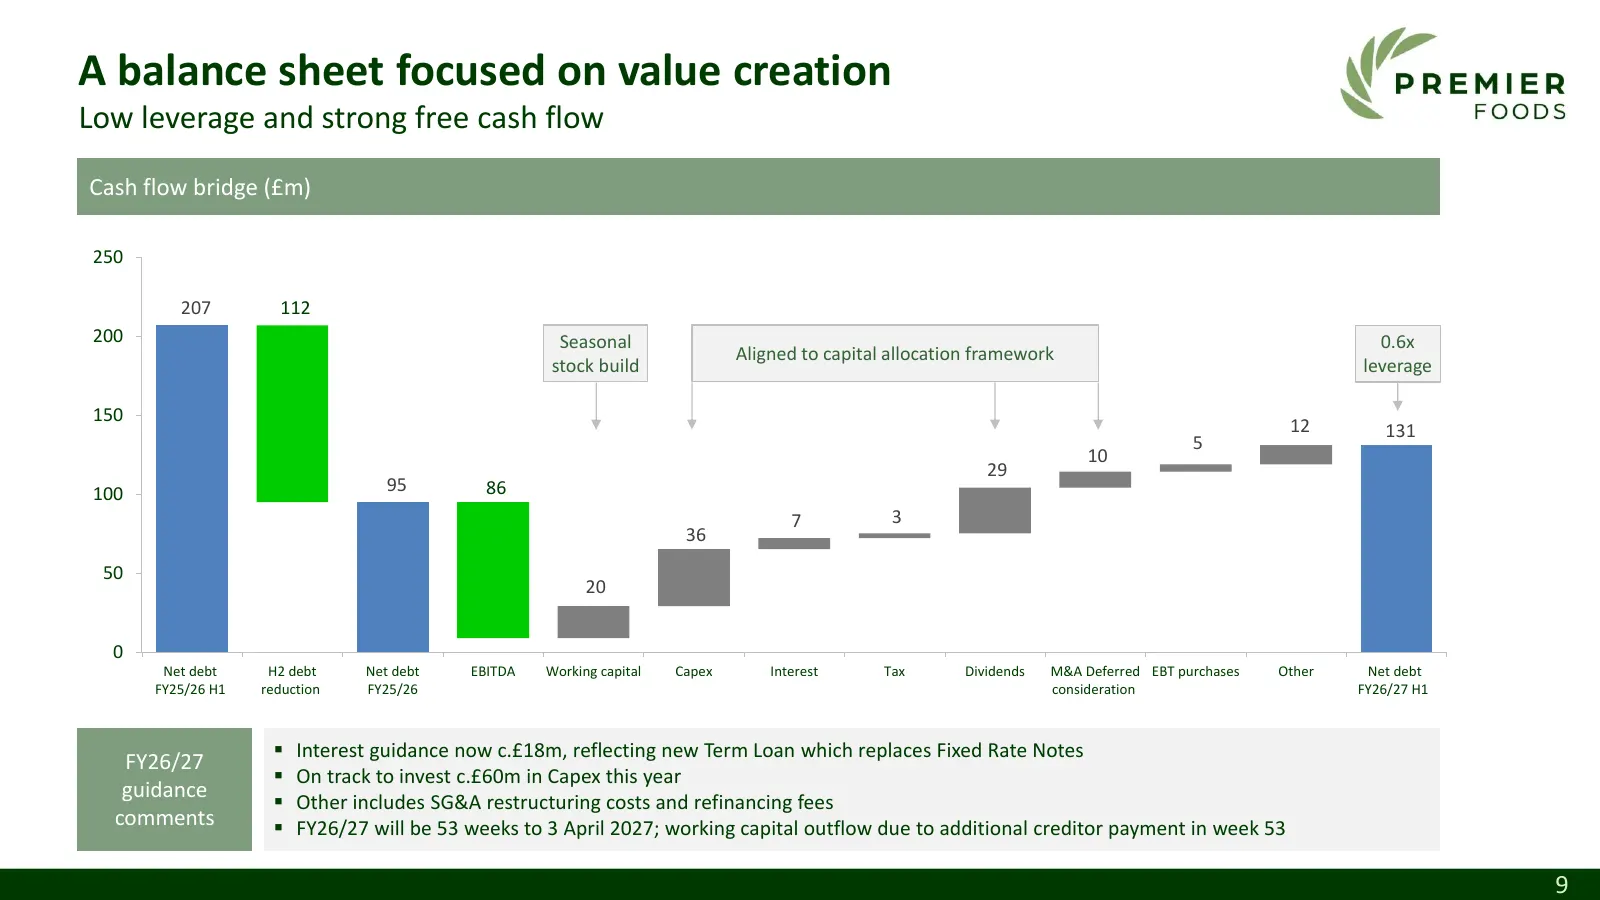
A balance sheet focused on value creation Low leverage and strong free cash flow Cash flow bridge (£m) 250 207 112 200 Seasonal 0.6x Aligned to capital allocation framework stock build leverage 150 12 131 5 10 29 100 95 86 7 3 36 50 20 0 Net debt H2 debt Net debt EBITDA Working capital Capex Interes
Slide 10: Debt structure update drives earnings upgrade
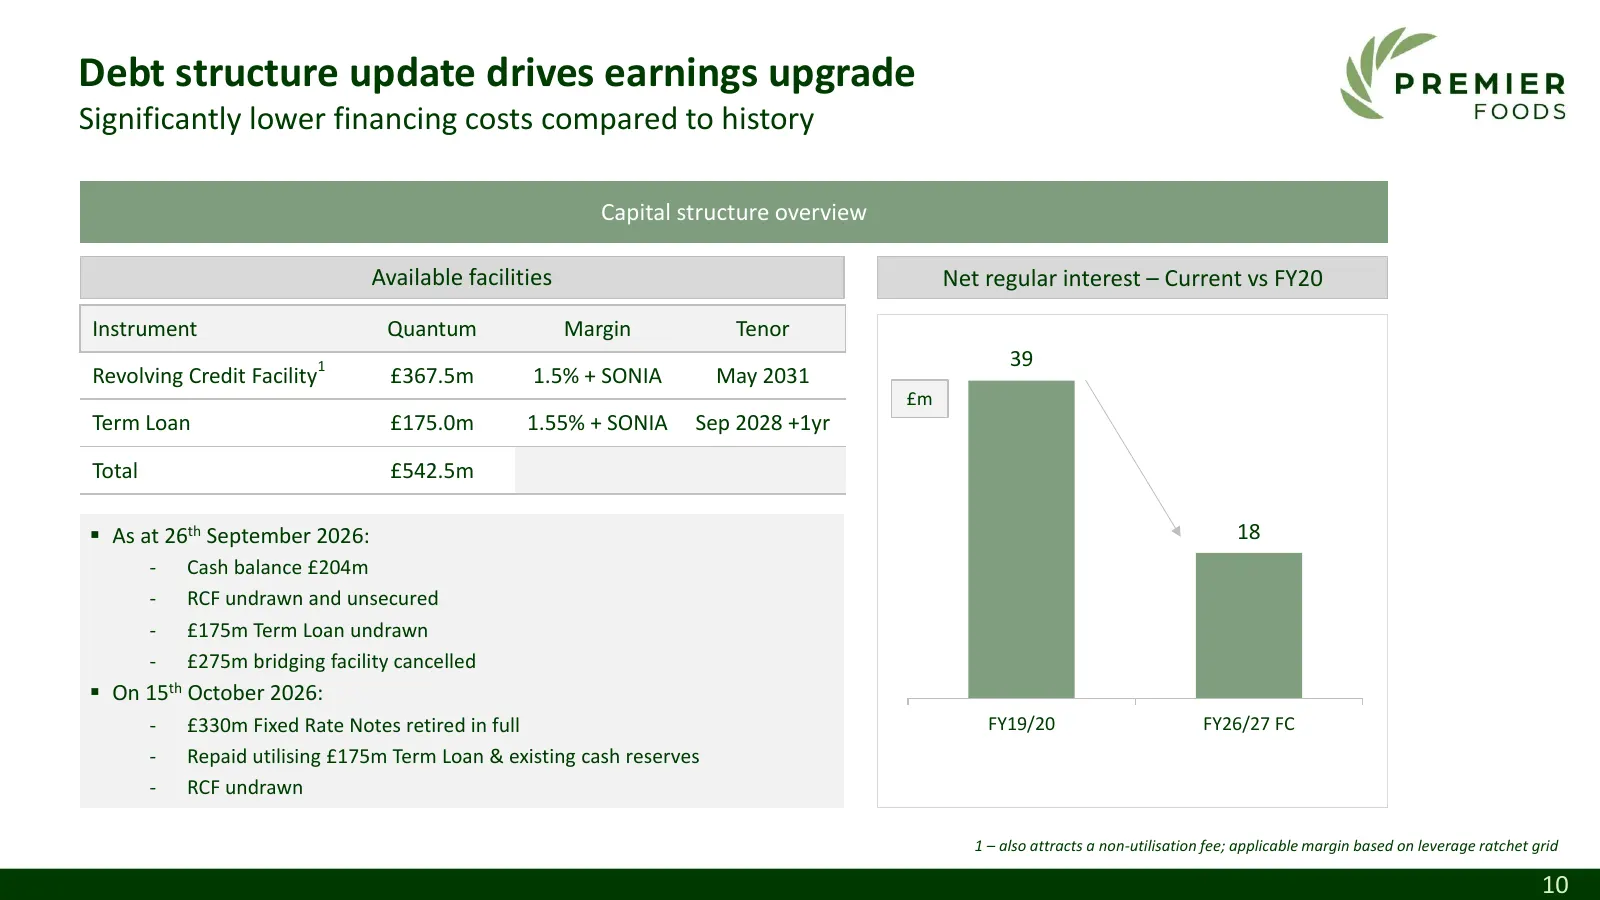
Debt structure update drives earnings upgrade Significantly lower financing costs compared to history Capital structure overview Available facilities Net regular interest – Current vs FY20 Instrument Quantum Margin Tenor 39 Revolving Credit Facility1 £367.5m 1.5% + SONIA May 2031 £m Term Loan £175.0
Slide 11: Pension Scheme reminder
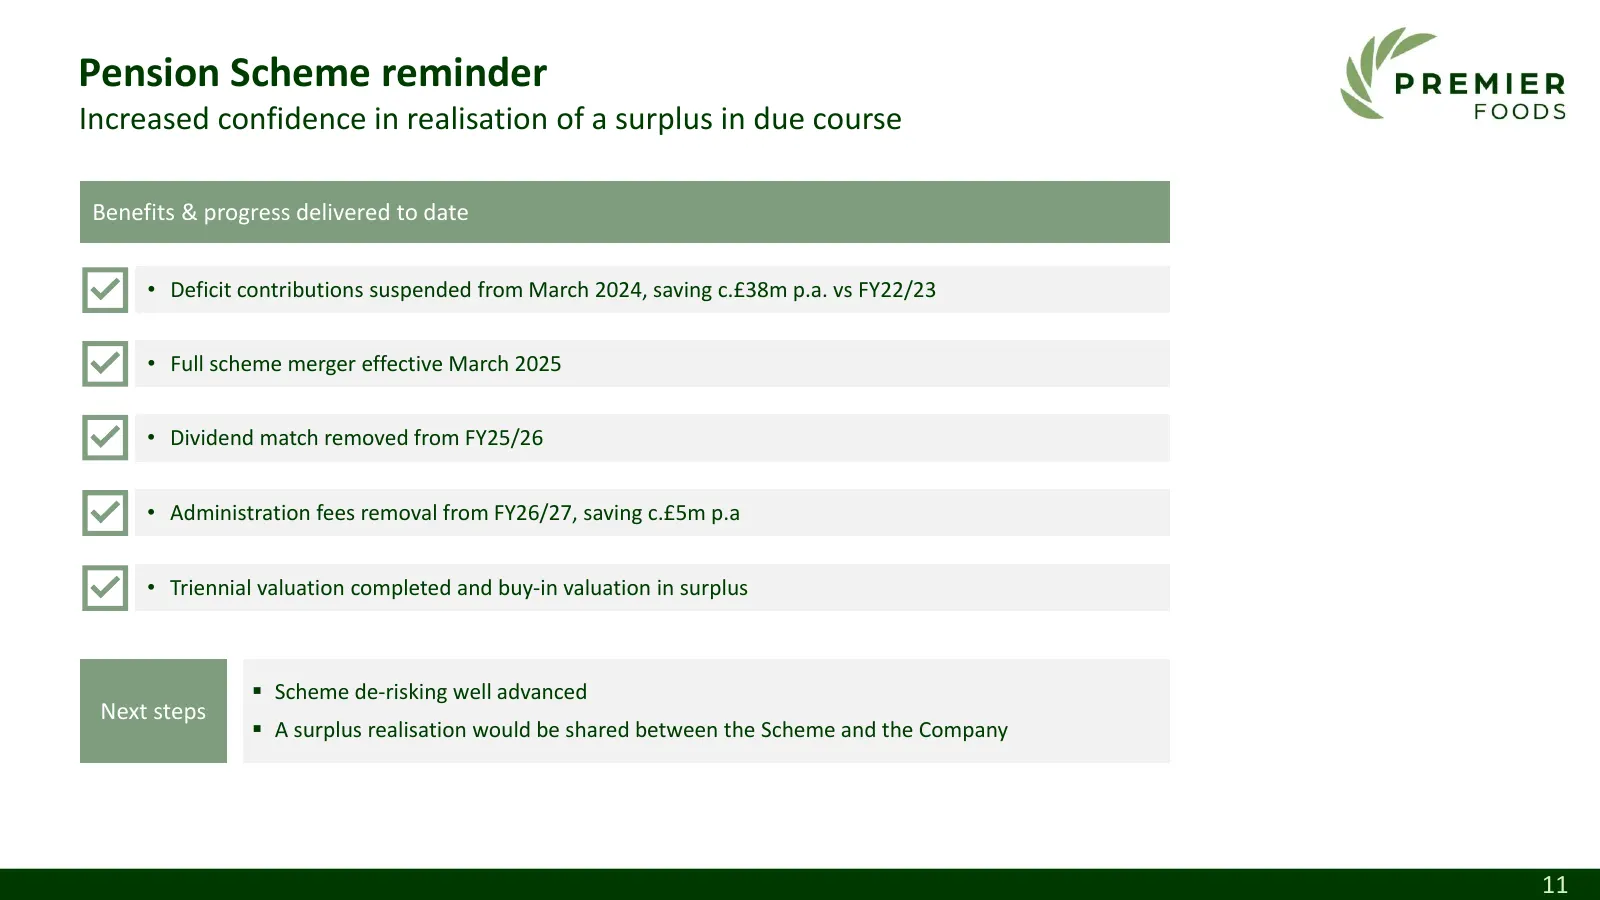
Pension Scheme reminder Increased confidence in realisation of a surplus in due course Benefits & progress delivered to date • Deficit contributions suspended from March 2024, saving c.£38m p.a. vs FY22/23 • Full scheme merger effective March 2025 • Dividend match removed from FY25/26 • Administrati
Slide 12: Consistent & disciplined approach to value creating capital allocation
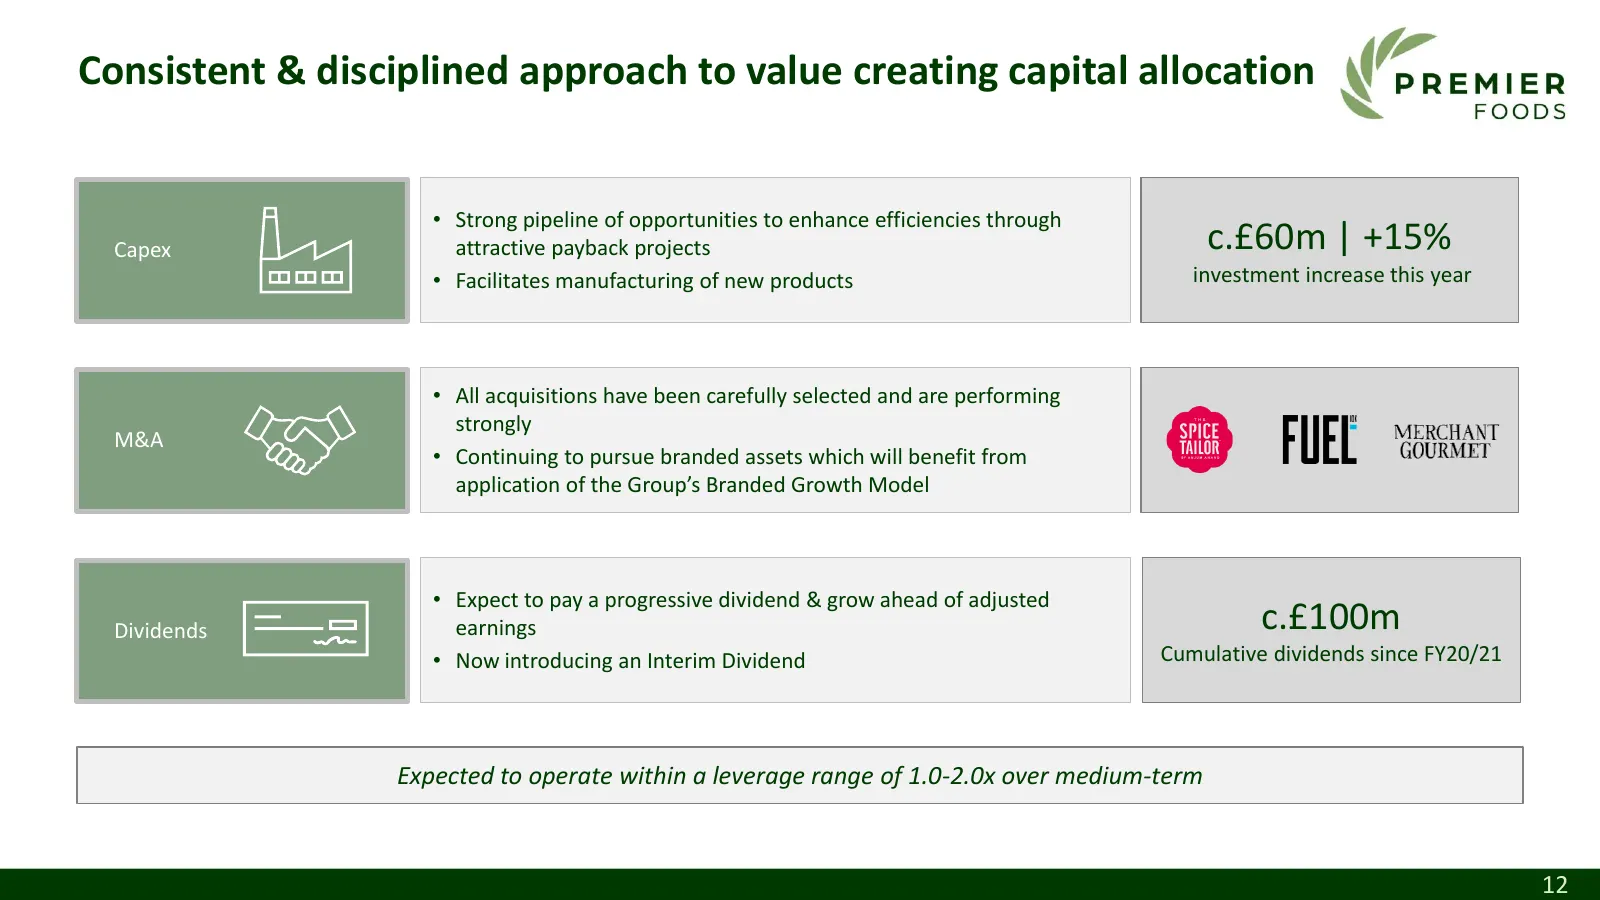
Consistent & disciplined approach to value creating capital allocation • Strong pipeline of opportunities to enhance efficiencies through Capex attractive payback projects c.£60m | +15% • Facilitates manufacturing of new products investment increase this year • All acquisitions have been carefully s
Slide 13: A strong platform for growth and value creation
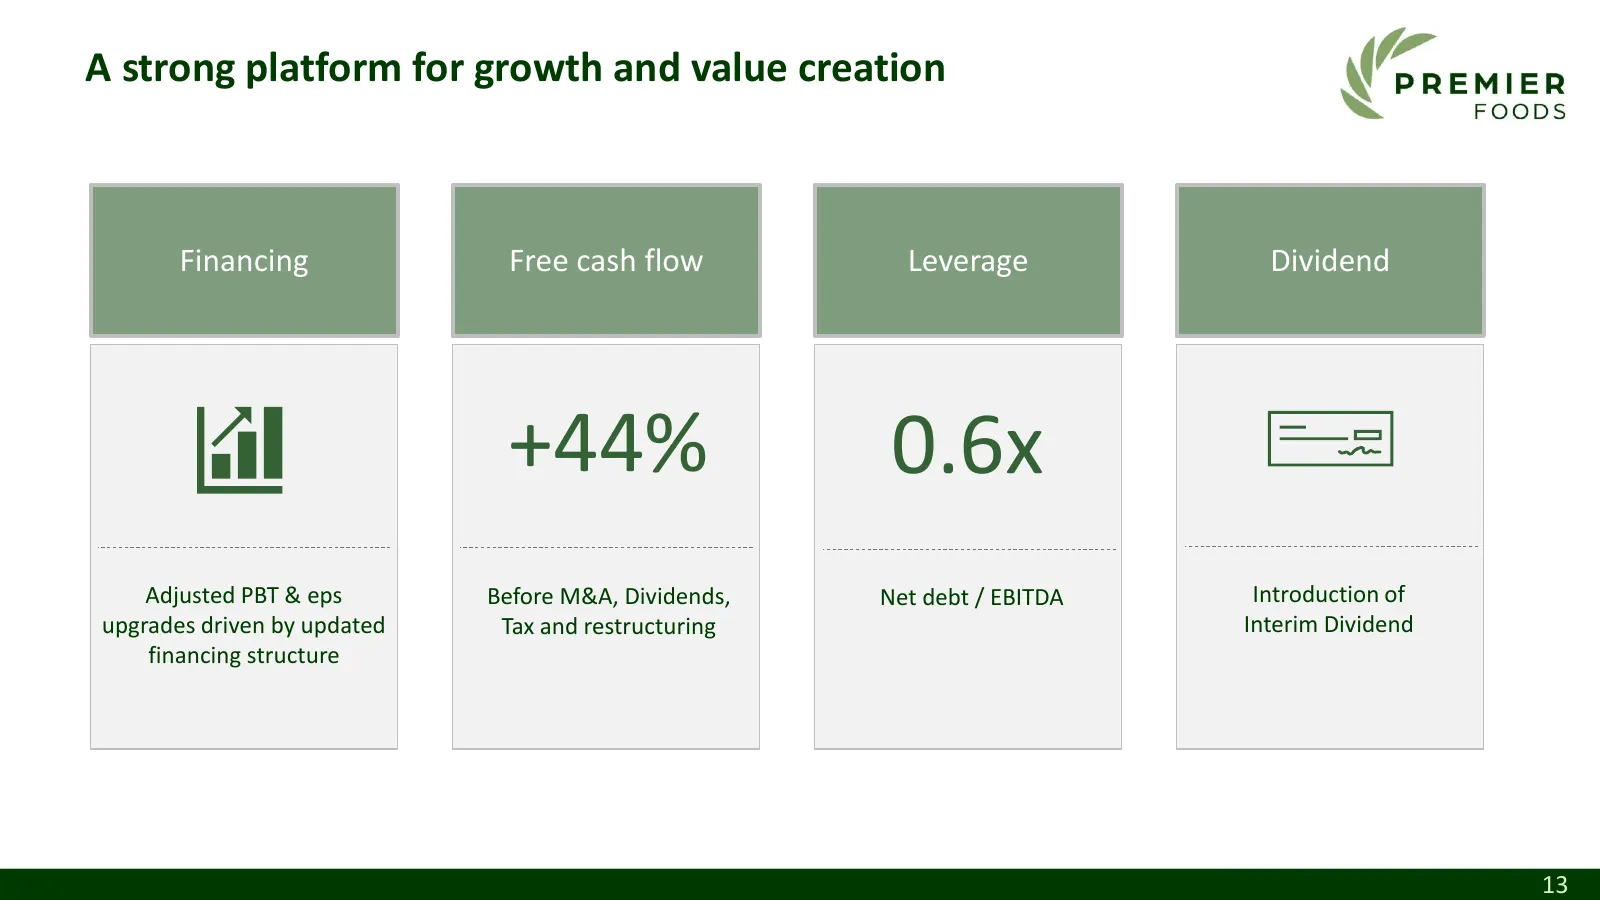
A strong platform for growth and value creation Financing Free cash flow Leverage Dividend +44% 0.6x Adjusted PBT & eps Before M&A, Dividends, Net debt / EBITDA Introduction of upgrades driven by updated Tax and restructuring Interim Dividend financing structure 13
Slide 14: Alex Whitehouse, CEO
(~ Woremen FOODS Alex Whitehouse CEO Ga (-exichine life THROUGH FOOD’
Slide 15: Our strategy
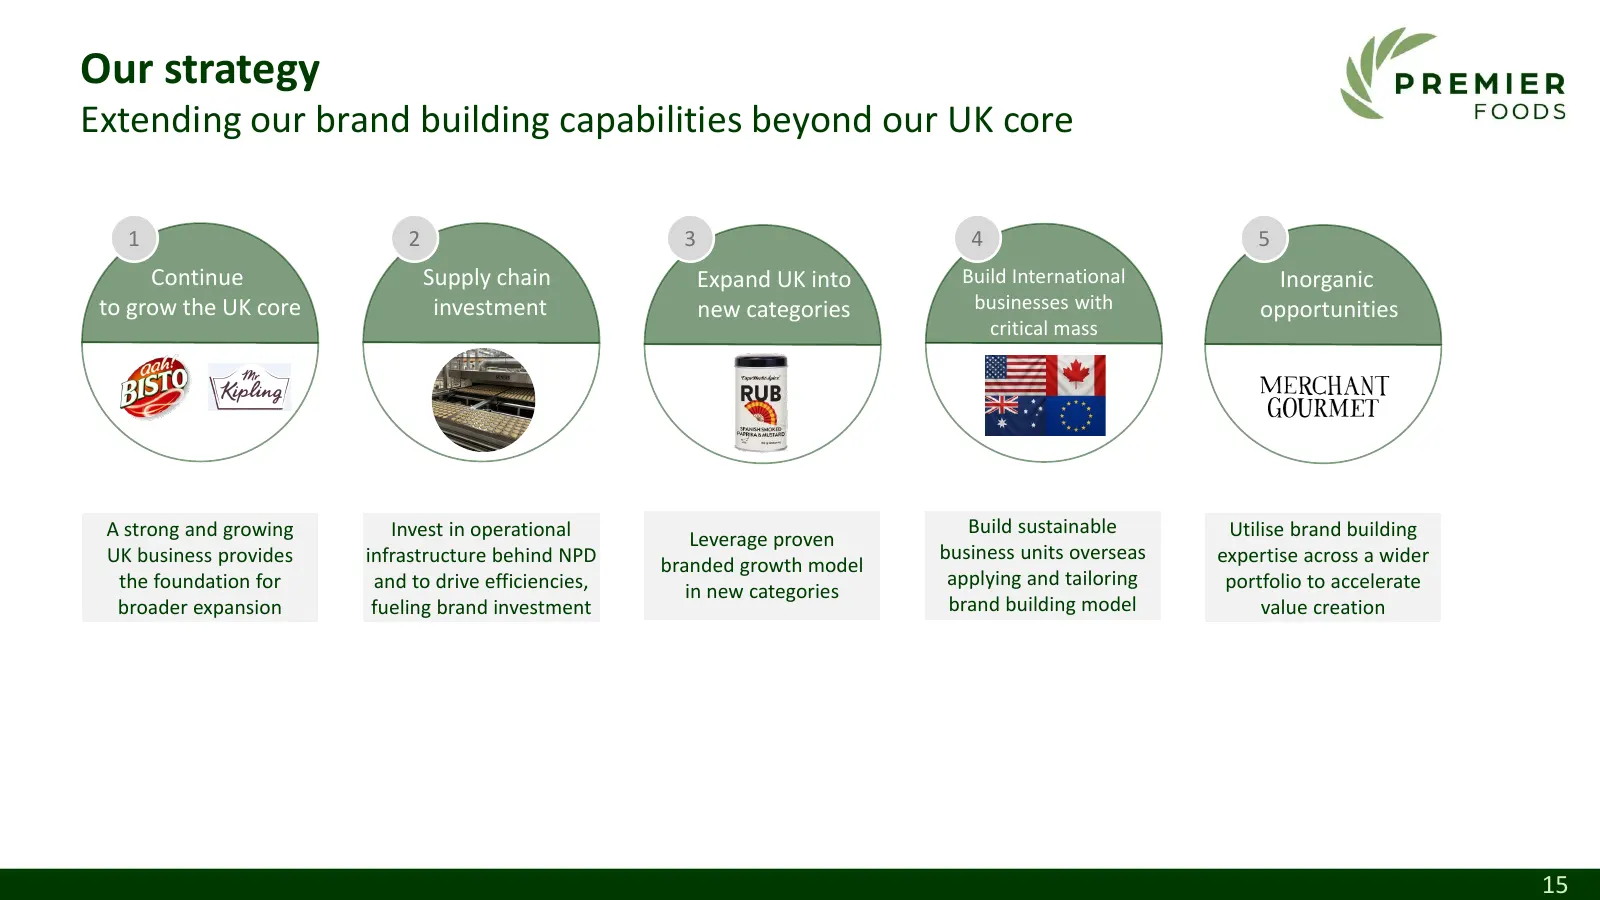
Our strategy Extending our brand building capabilities beyond our UK core 1 2 3 4 5 Continue Supply chain Expand UK into Build International Inorganic to grow the UK core investment new categories businesses with opportunities critical mass A strong and growing Invest in operational Build sustainabl
Slide 16: Our branded growth model is at the core of what we do
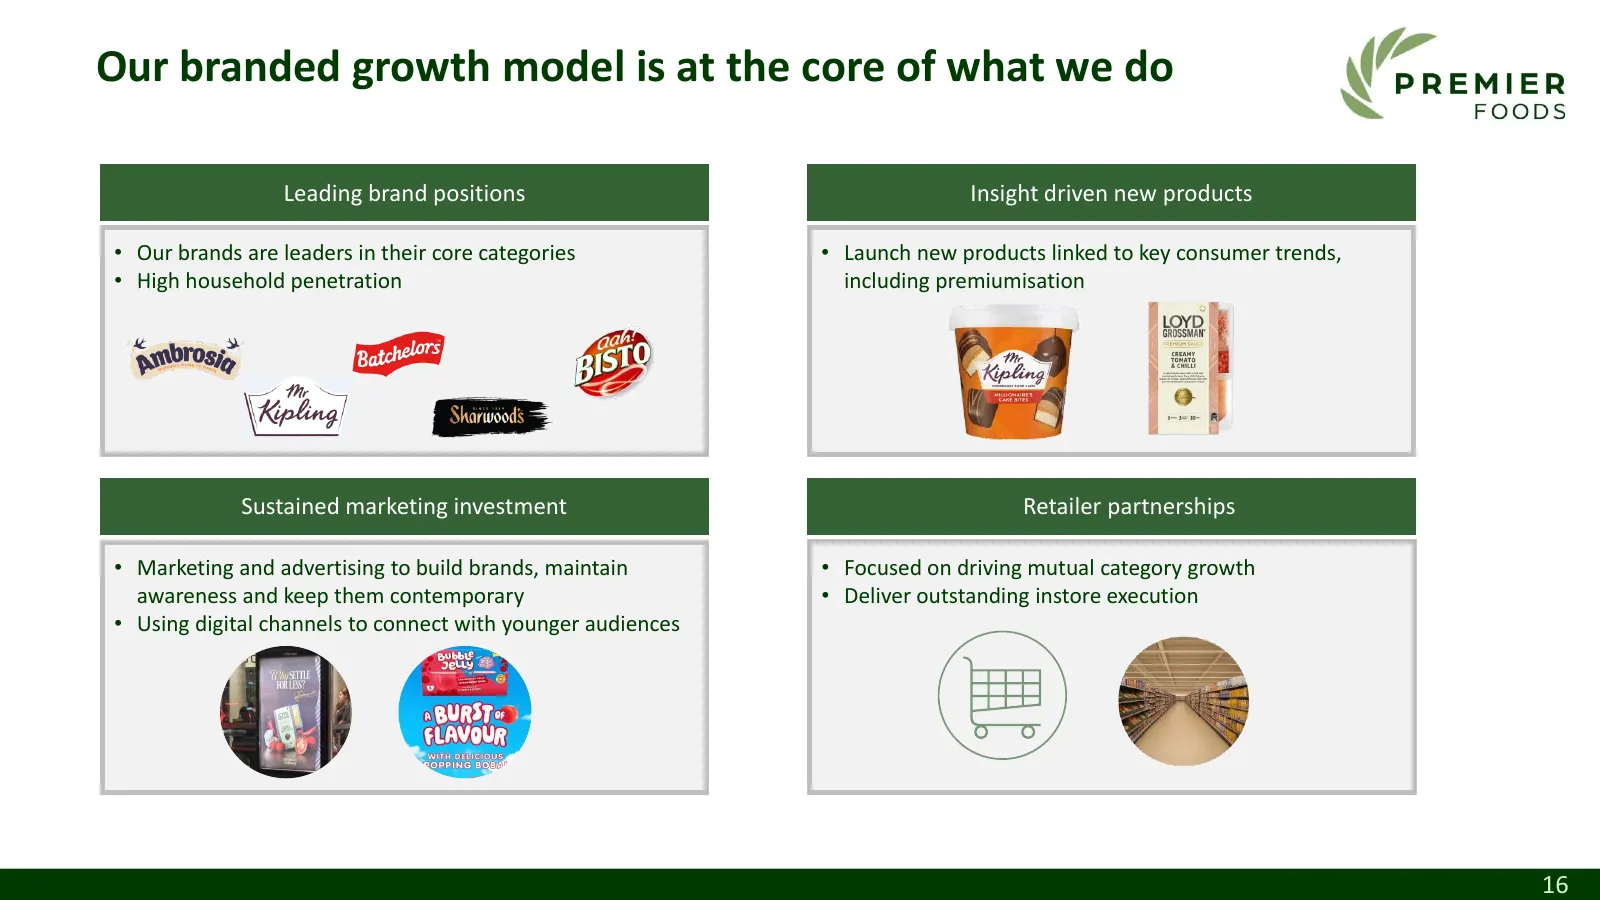
Our branded growth model is at the core of what we do Leading brand positions Insight driven new products • Our brands are leaders in their core categories • Launch new products linked to key consumer trends, • High household penetration including premiumisation Sustained marketing investment Retail
Slide 17: Continued Branded Revenue growth
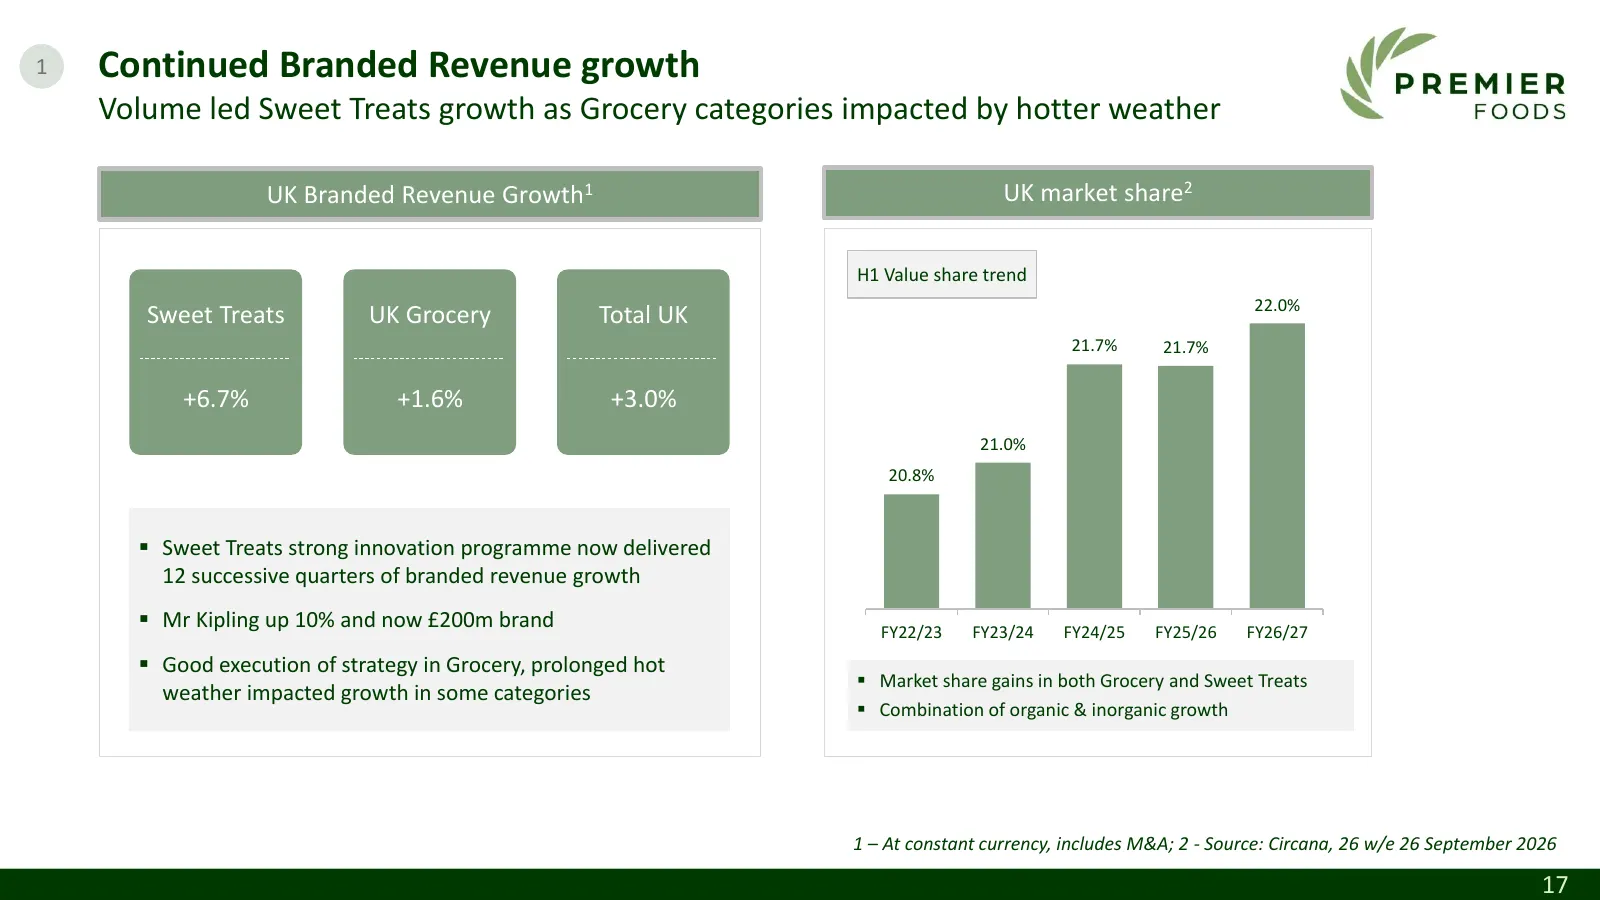
1 Continued Branded Revenue growth Volume led Sweet Treats growth as Grocery categories impacted by hotter weather UK Branded Revenue Growth1 UK market share2 H1 Value share trend 22.0% Sweet Treats UK Grocery Total UK 21.7% 21.7% +6.7% +1.6% +3.0% 21.0% 20.8% ▪ Sweet Treats strong innovation progra
Slide 18: Innovation programme based on deep consumer understanding
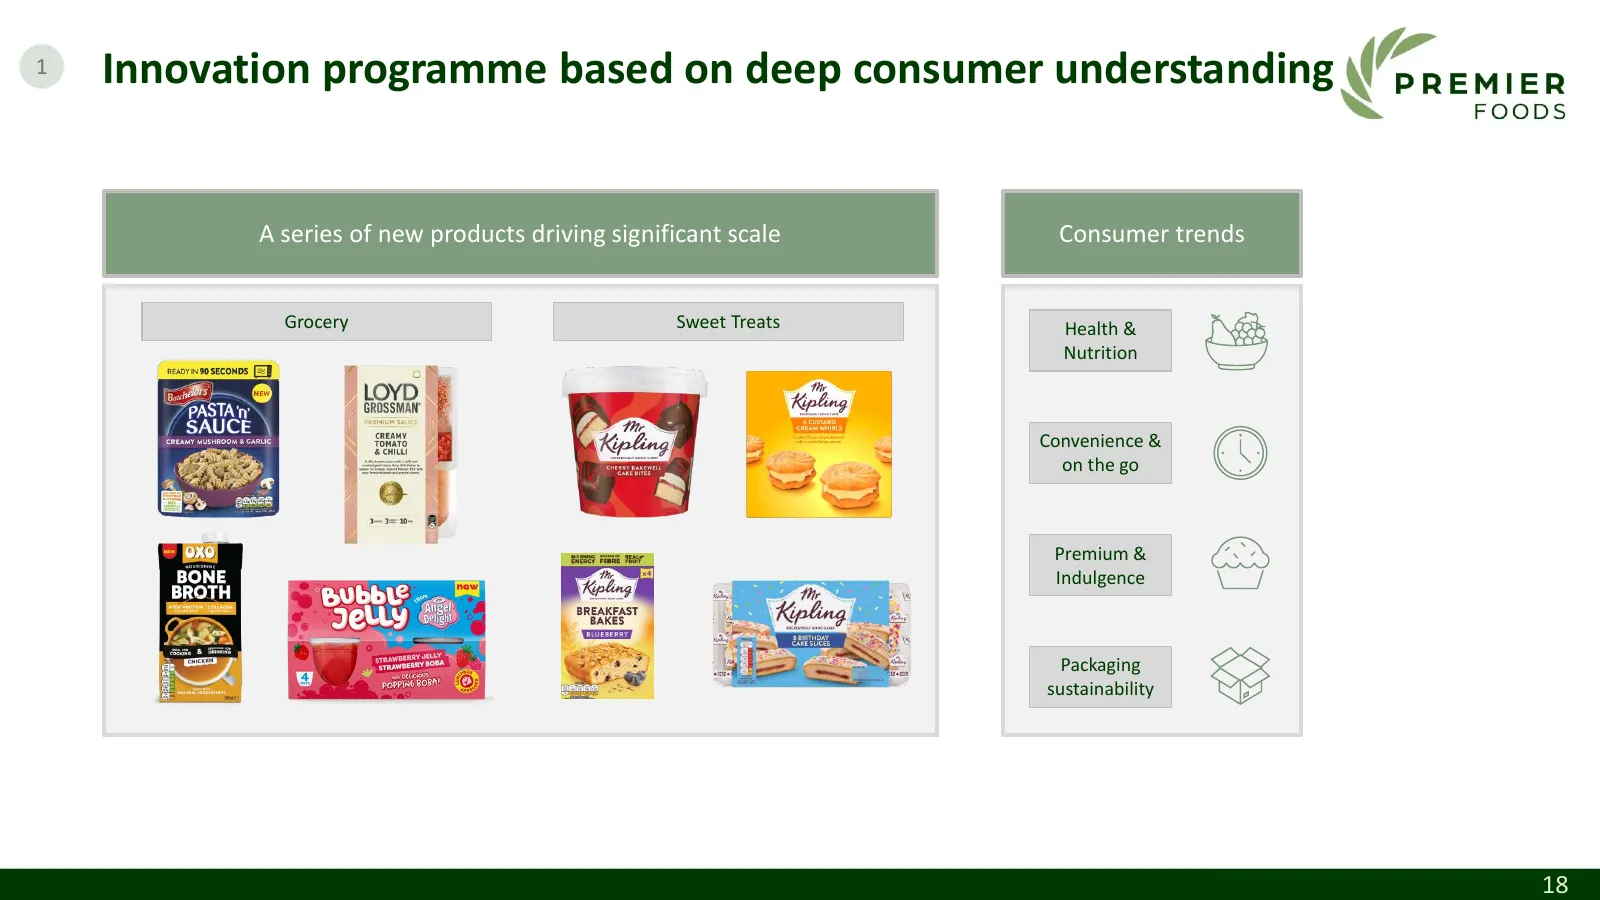
1 Innovation programme based on deep consumer understanding A series of new products driving significant scale Consumer trends Grocery Sweet Treats Health & Nutrition Convenience & on the go Premium & Indulgence Packaging sustainability 18
Slide 19: Continued marketing investment in H1
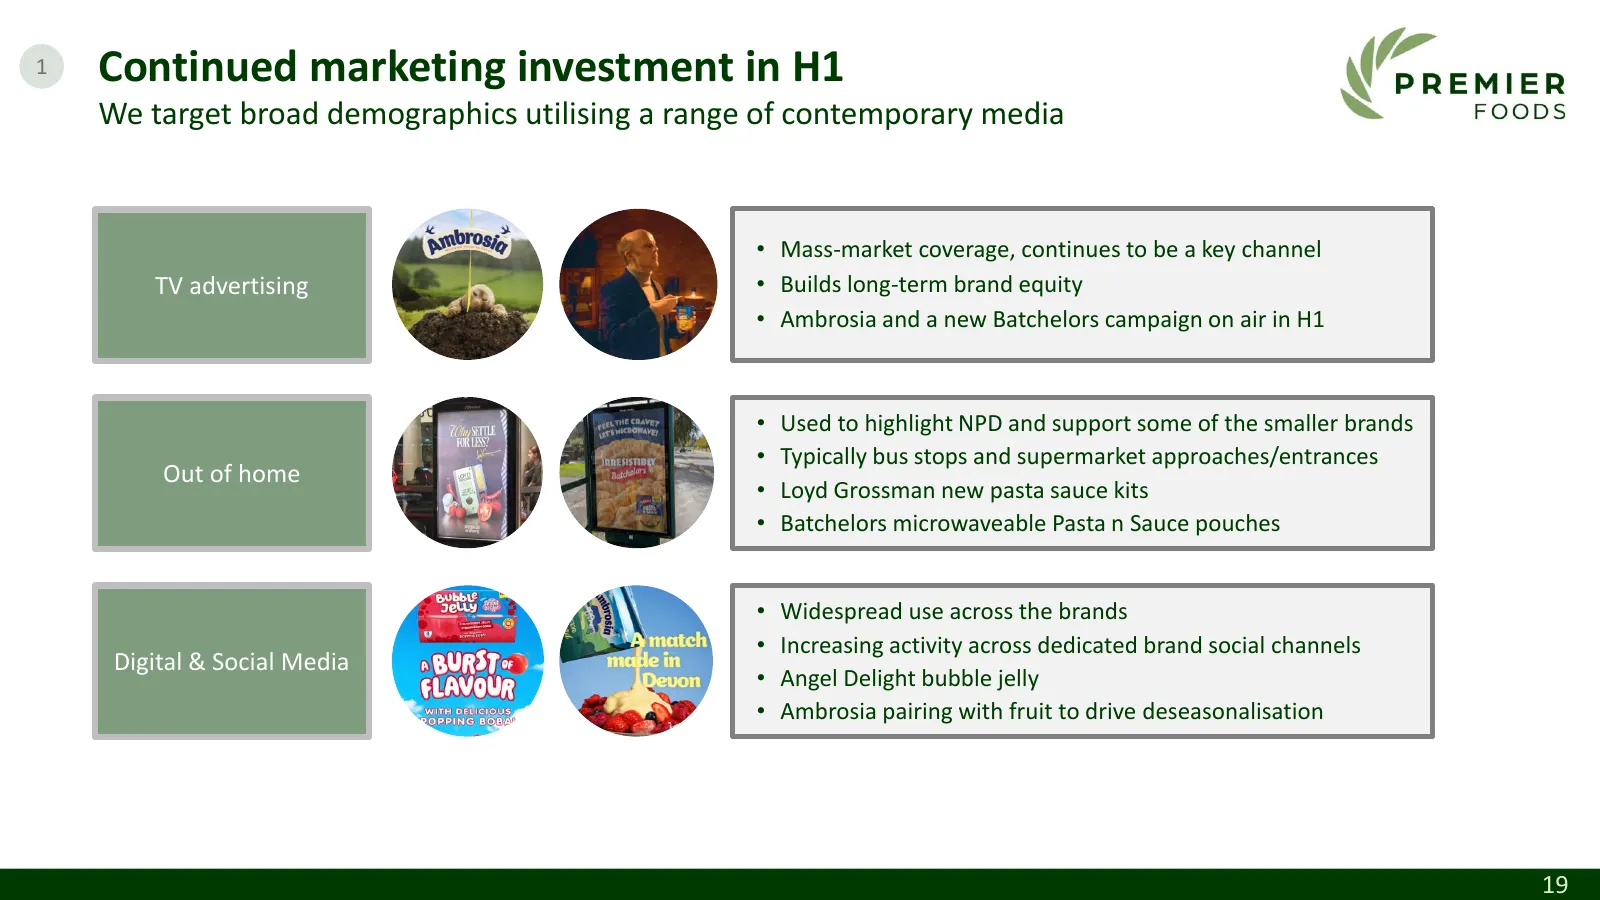
1 Continued marketing investment in H1 We target broad demographics utilising a range of contemporary media • Mass-market coverage, continues to be a key channel TV advertising • Builds long-term brand equity • Ambrosia and a new Batchelors campaign on air in H1 • Used to highlight NPD and support s
Slide 20: Increased share of distribution supported by strong innovation
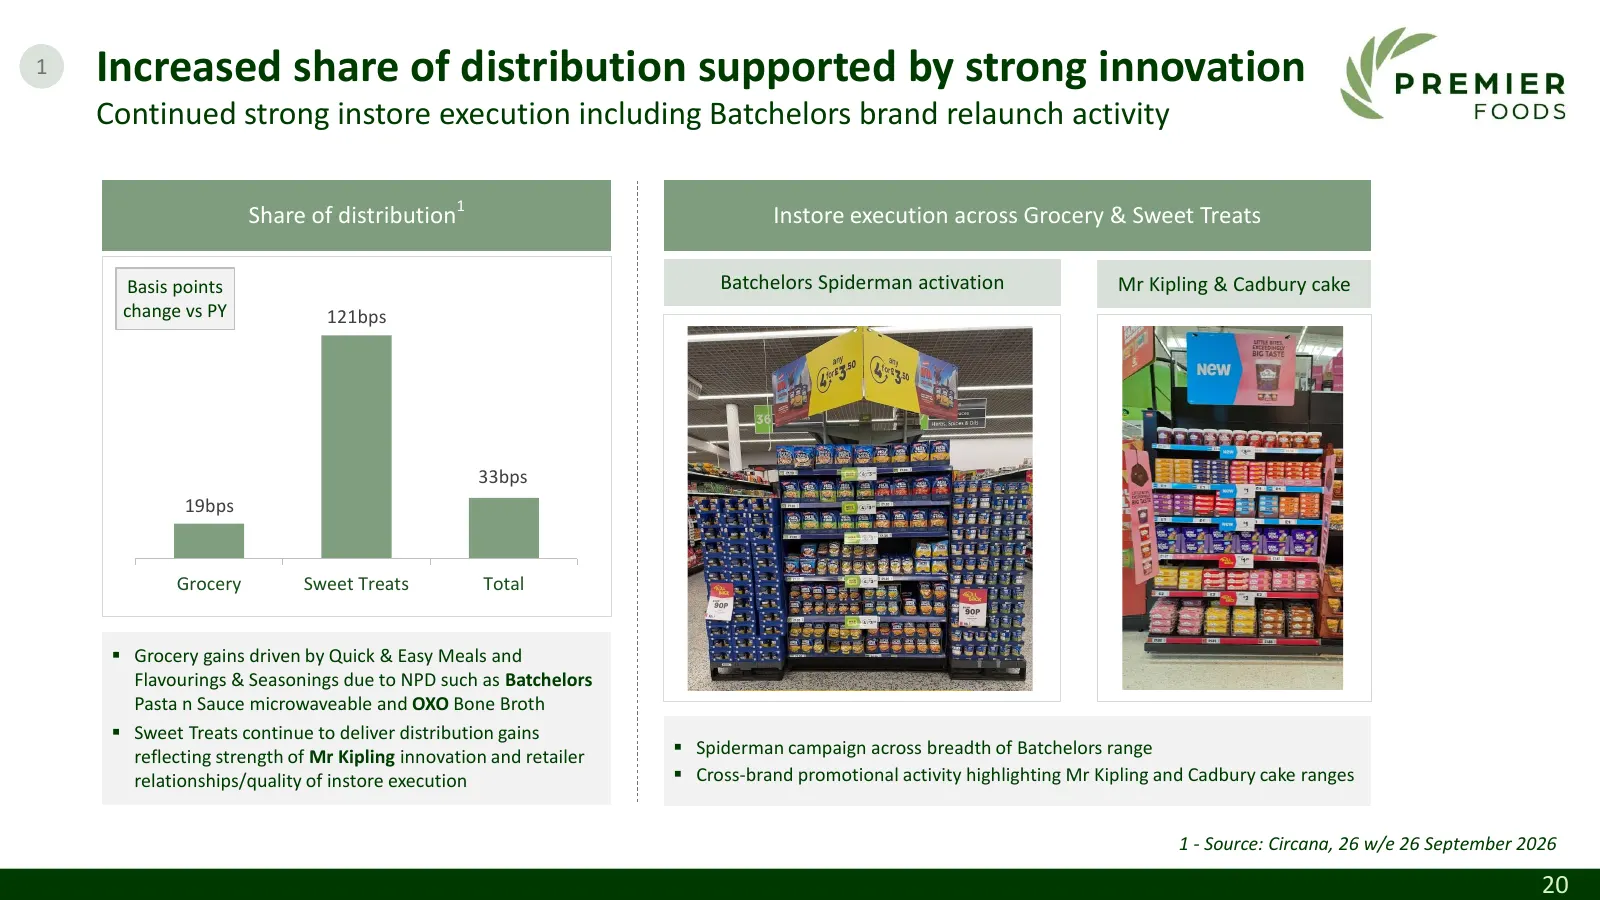
1 Increased share of distribution supported by strong innovation Continued strong instore execution including Batchelors brand relaunch activity 1 Share of distribution Instore execution across Grocery & Sweet Treats Basis points Batchelors Spiderman activation Mr Kipling & Cadbury cake change vs PY
Slide 21: Overall expected upside from GLP-1
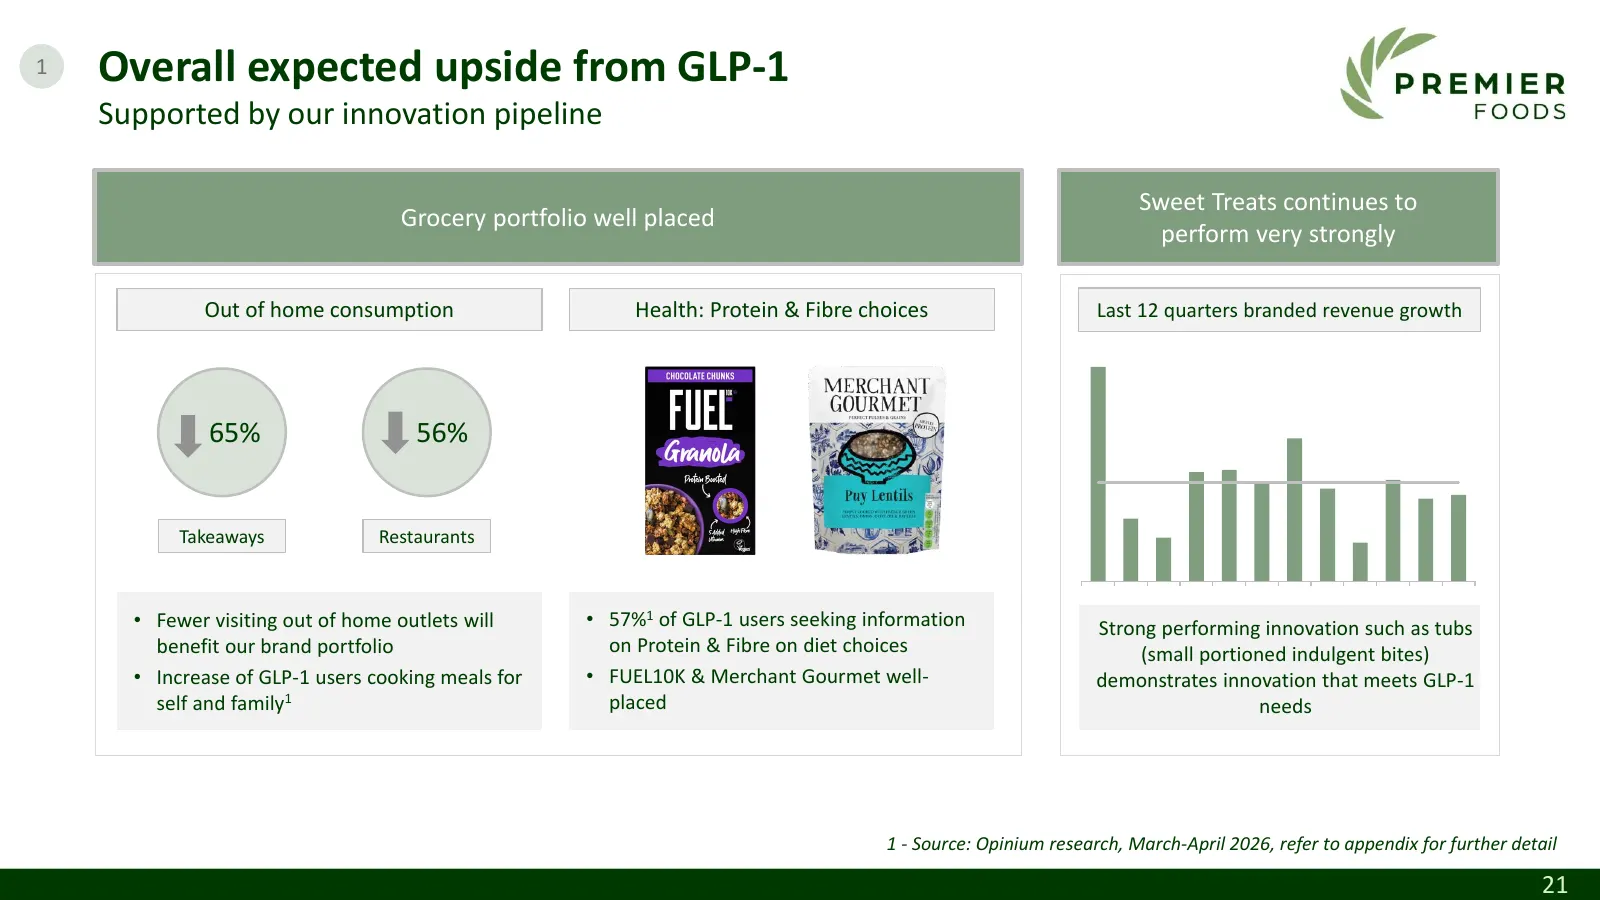
1 Overall expected upside from GLP-1 Supported by our innovation pipeline Sweet Treats continues to Grocery portfolio well placed perform very strongly Out of home consumption Health: Protein & Fibre choices Last 12 quarters branded revenue growth 65% 56% Takeaways Restaurants • Fewer visiting out o
Slide 22: Continuing to upweight our capital investment
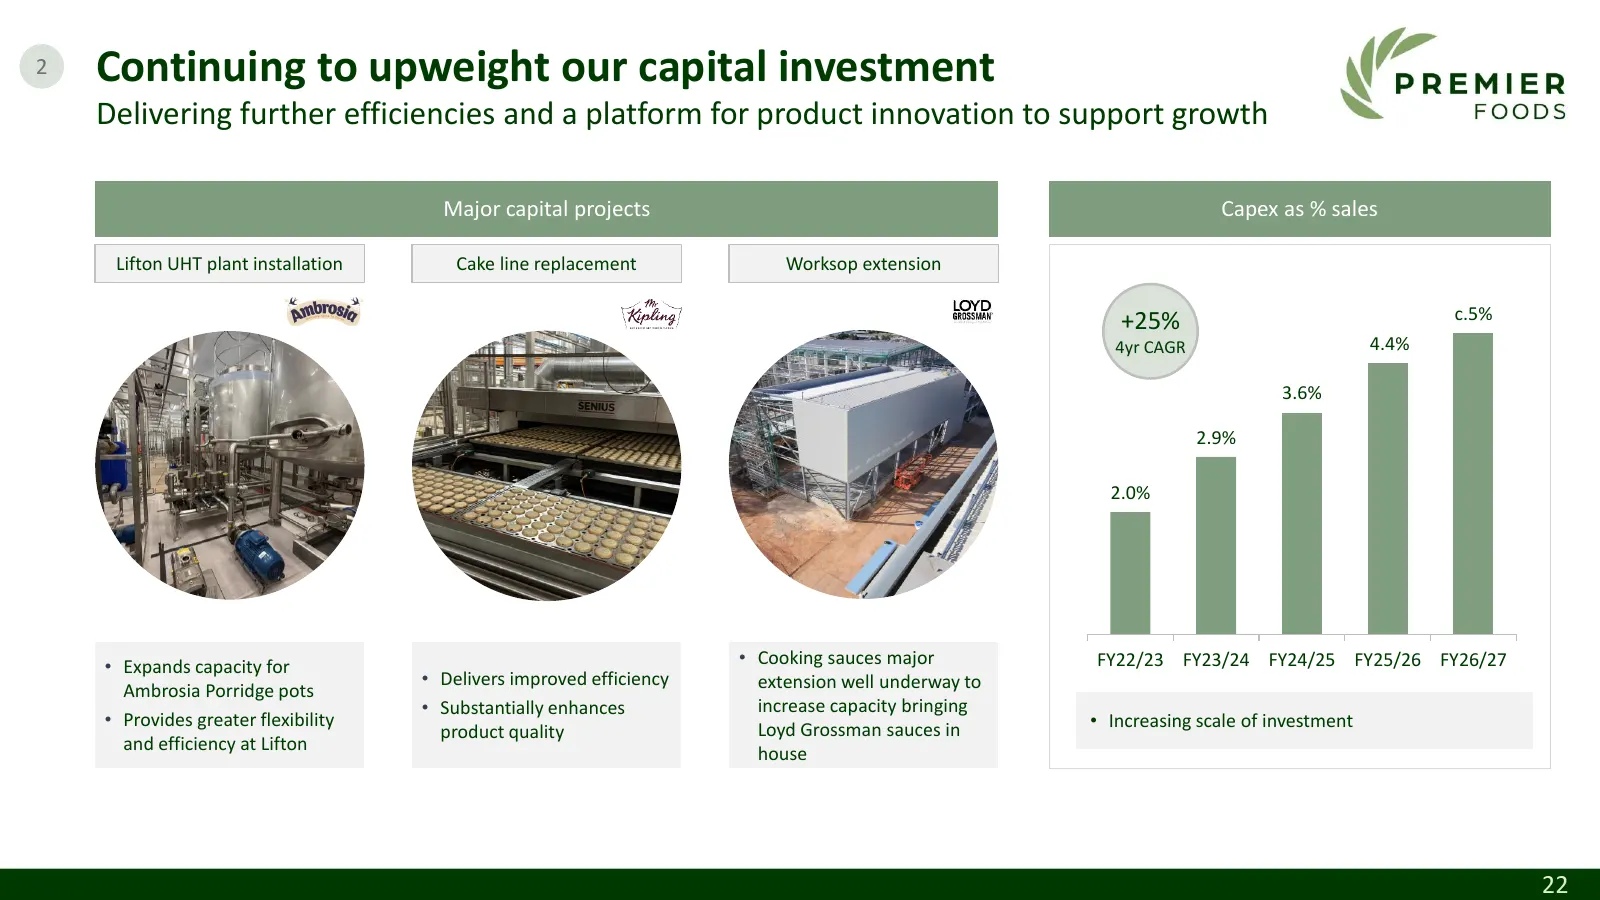
2 Continuing to upweight our capital investment Delivering further efficiencies and a platform for product innovation to support growth Major capital projects Capex as % sales Lifton UHT plant installation Cake line replacement Worksop extension +25% c.5% 4yr CAGR 4.4% 3.6% 2.9% 2.0% • Expands capac
Slide 23: New categories initiatives growing revenue & share
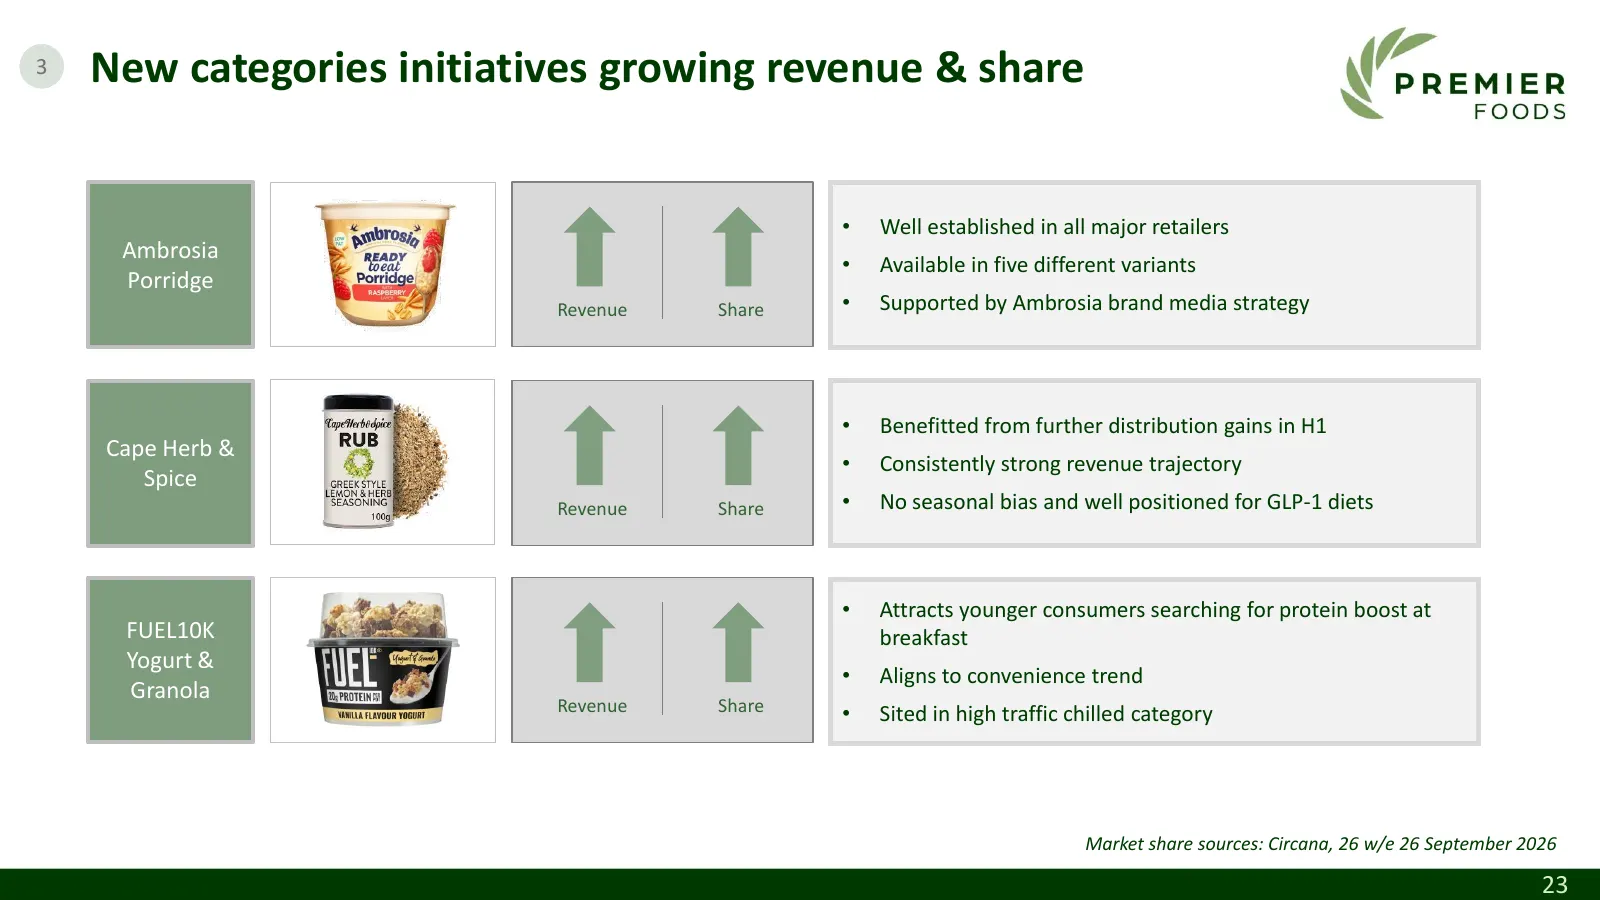
3 New categories initiatives growing revenue & share • Well established in all major retailers Ambrosia • Available in five different variants Porridge Revenue Share • Supported by Ambrosia brand media strategy • Benefitted from further distribution gains in H1 Cape Herb & • Consistently strong reve
Slide 24: Further strong progress in all overseas markets
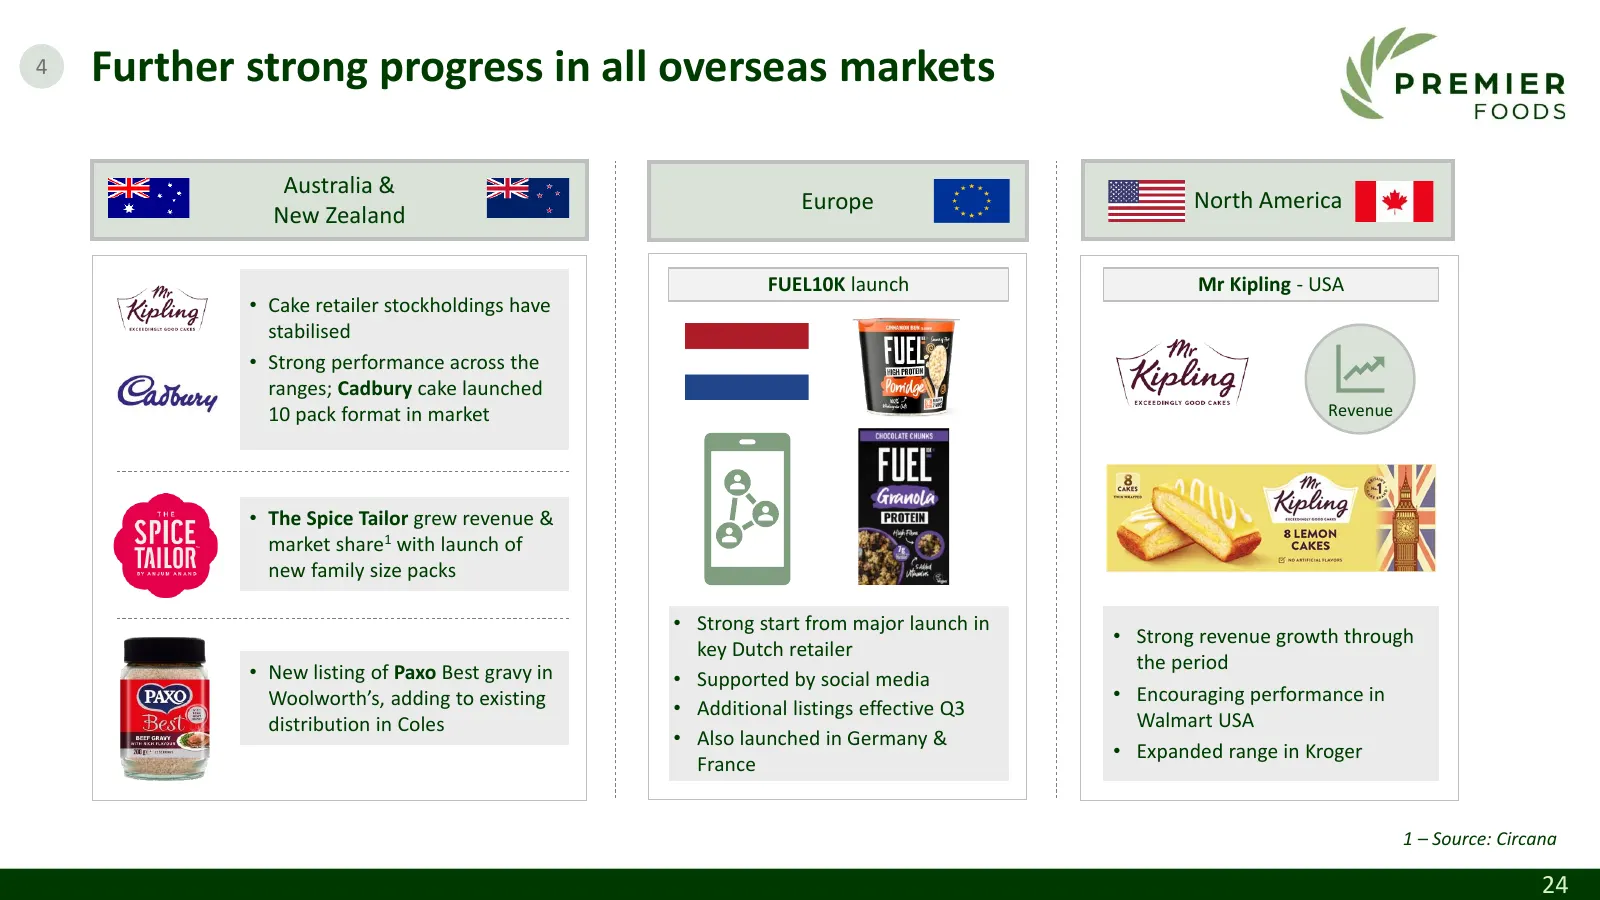
4 Further strong progress in all overseas markets Australia & Europe North America New Zealand FUEL10K launch Mr Kipling - USA • Cake retailer stockholdings have stabilised • Strong performance across the ranges; Cadbury cake launched 10 pack format in market Revenue • The Spice Tailor grew revenue
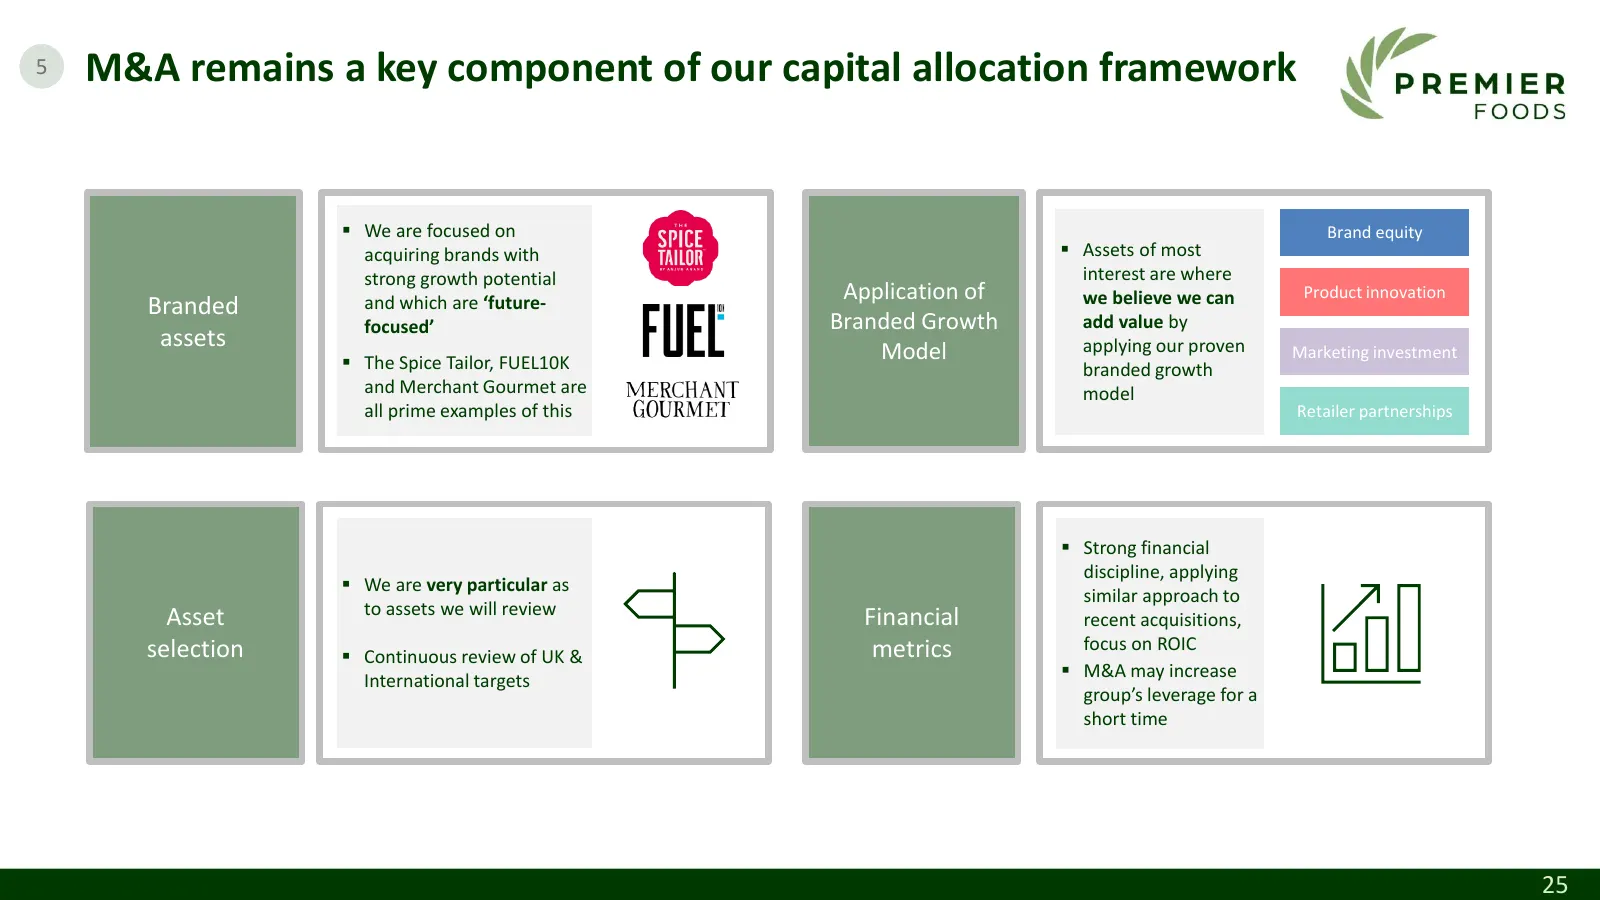
Slide 25: M&A remains a key component of our capital allocation framework
5 M&A remains a key component of our capital allocation framework ▪ We are focused on Brand equity acquiring brands with ▪ Assets of most strong growth potential interest are where and which are ‘future- Application of we believe we can Product innovation Branded focused’ Branded Growth add value by
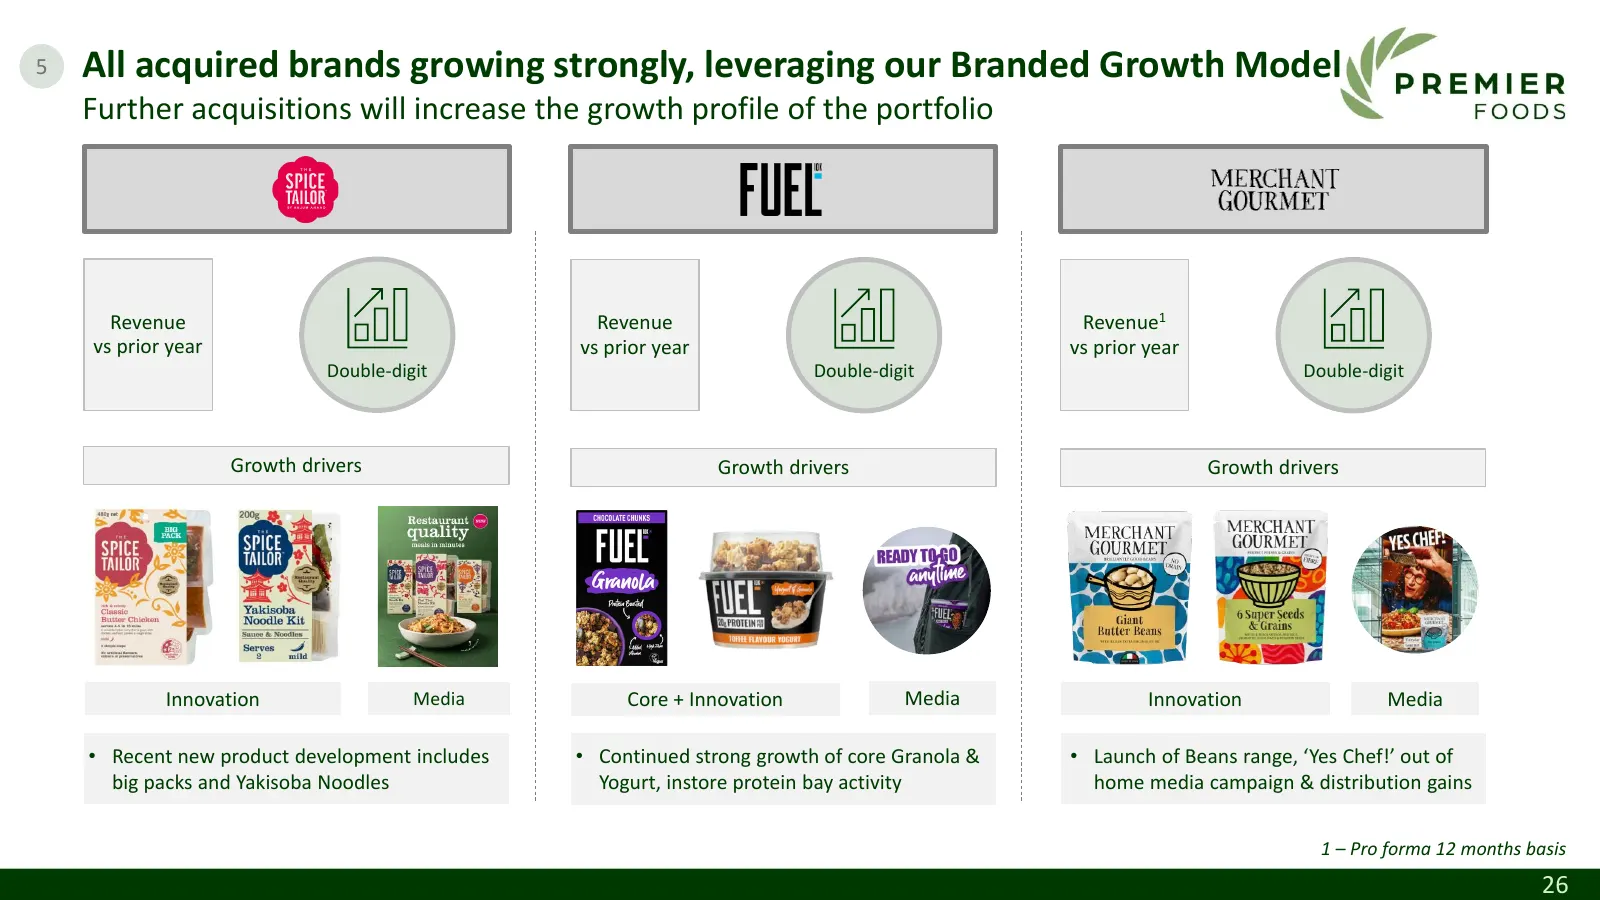
Slide 26: All acquired brands growing strongly, leveraging our Branded Growth Model
5 All acquired brands growing strongly, leveraging our Branded Growth Model Further acquisitions will increase the growth profile of the portfolio Revenue Revenue Revenue1 vs prior year vs prior year vs prior year Double-digit Double-digit Double-digit Growth drivers Growth drivers Growth drivers In
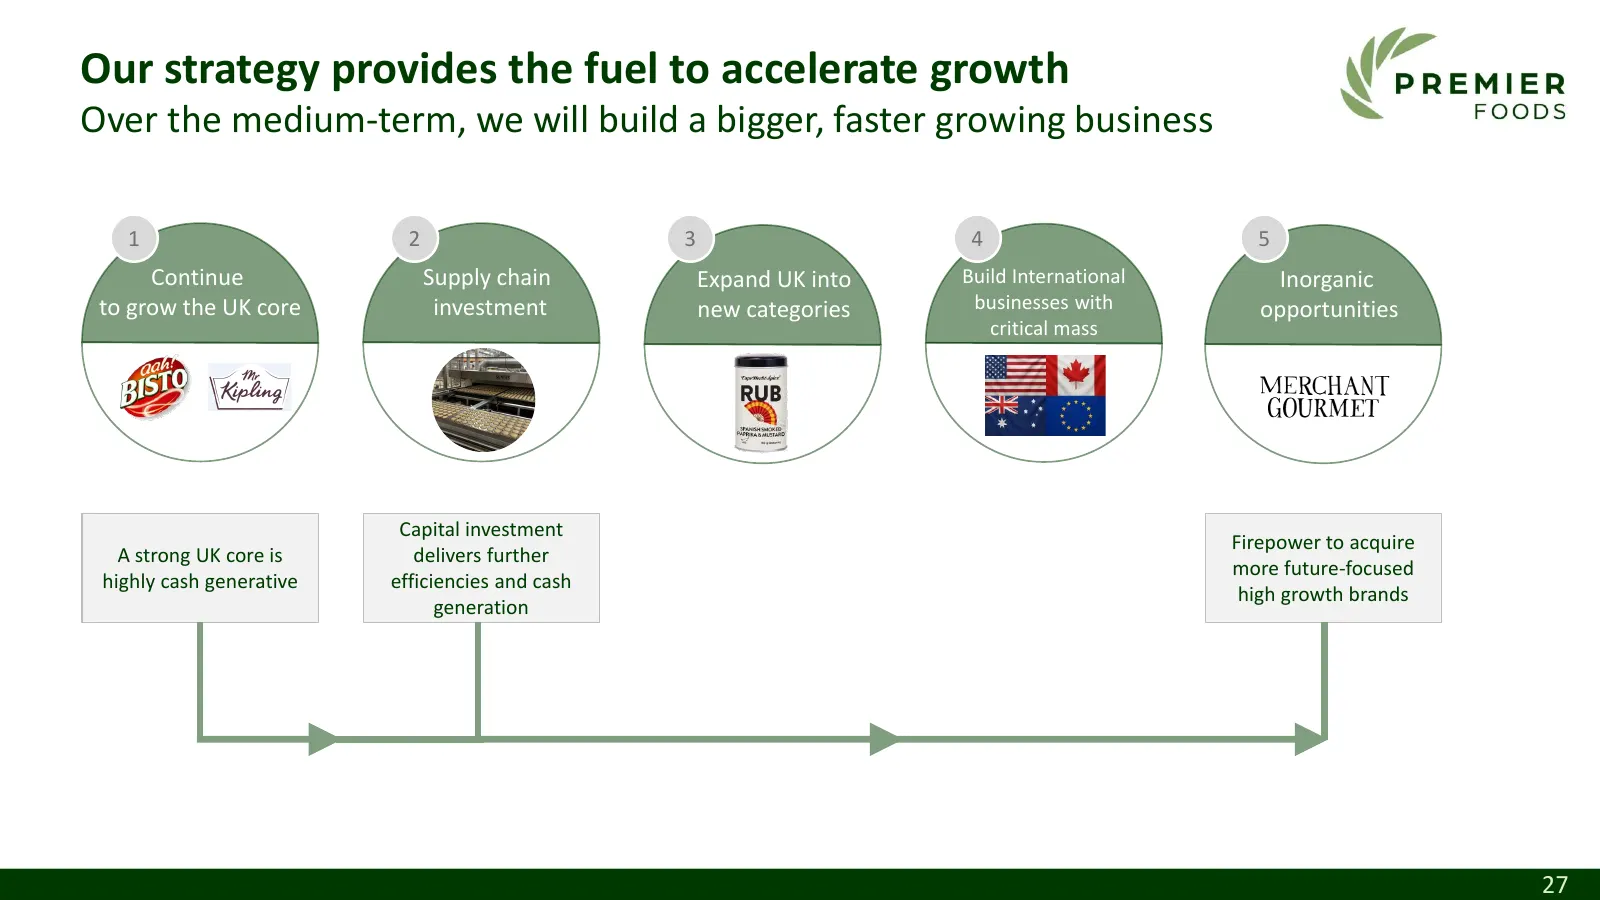
Slide 27: Our strategy provides the fuel to accelerate growth
Our strategy provides the fuel to accelerate growth Over the medium-term, we will build a bigger, faster growing business 1 2 3 4 5 Continue Supply chain Expand UK into Build International Inorganic to grow the UK core investment new categories businesses with opportunities critical mass Capital inv
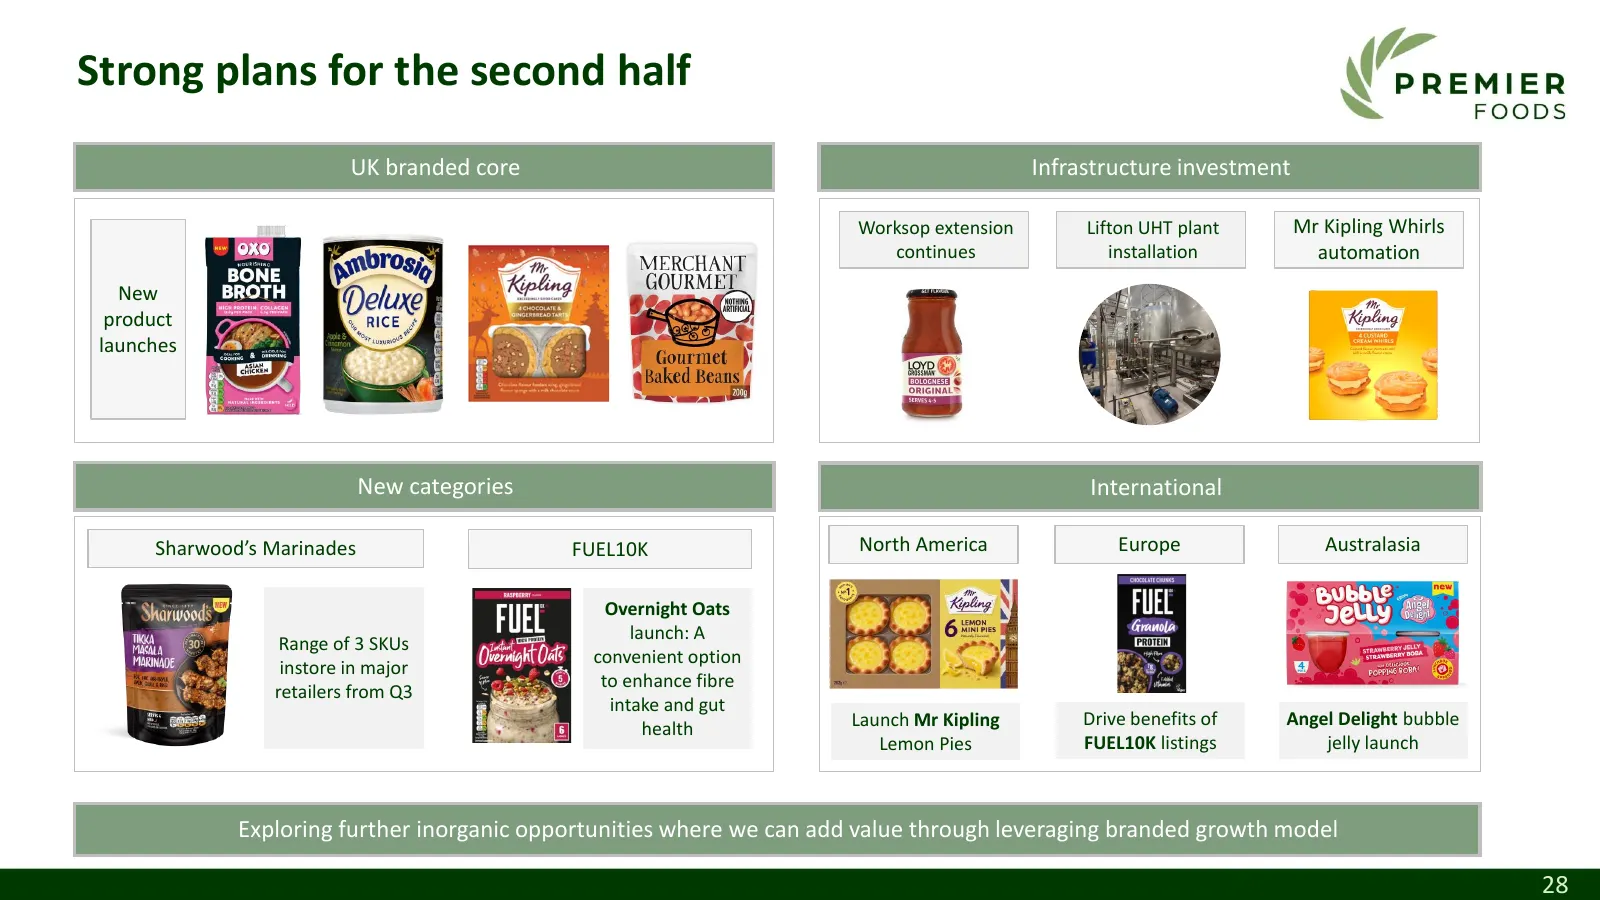
Slide 28: Strong plans for the second half
Strong plans for the second half UK branded core Infrastructure investment Worksop extension Lifton UHT plant Mr Kipling Whirls continues installation automation New product launches New categories International Sharwood’s Marinades FUEL10K North America Europe Australasia Overnight Oats launch: A R
Slide 29: Summary & Outlook
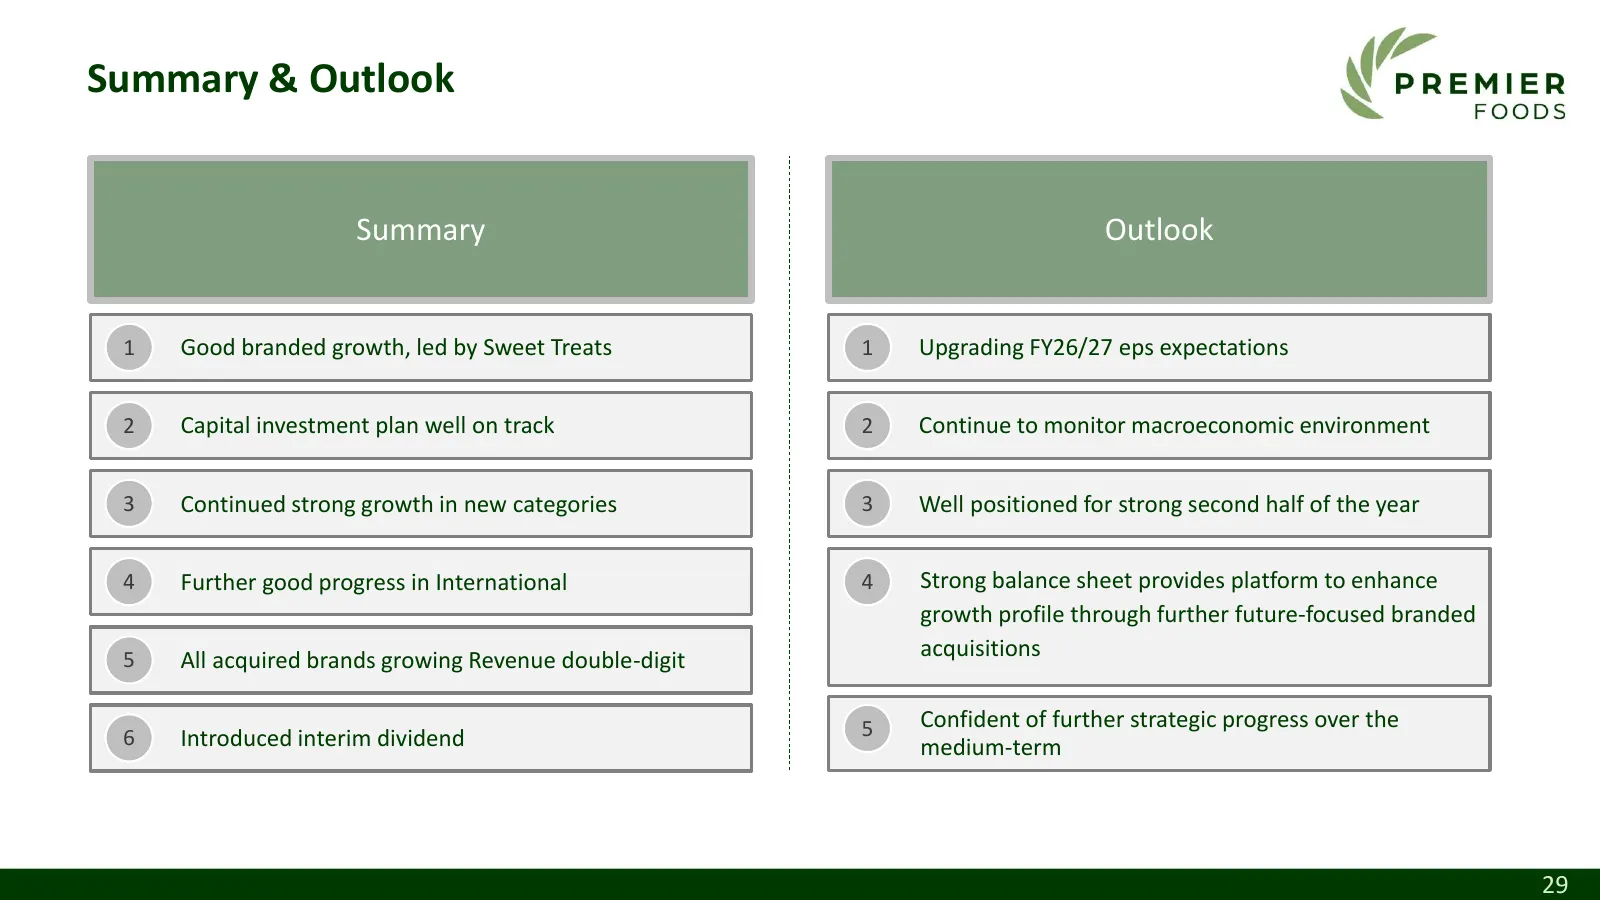
Summary & Outlook Summary Outlook 1 Good branded growth, led by Sweet Treats 1 Upgrading FY26/27 eps expectations 2 Capital investment plan well on track 2 Continue to monitor macroeconomic environment 3 Continued strong growth in new categories 3 Well positioned for strong second half of the year 4
Slide 30: Q&A
( NPremes Q&A Ga (-exichine life THROUGH FOOD’
Slide 31: Appendix
PREMIER FOODS Appendix
Slide 32: Cautionary statement
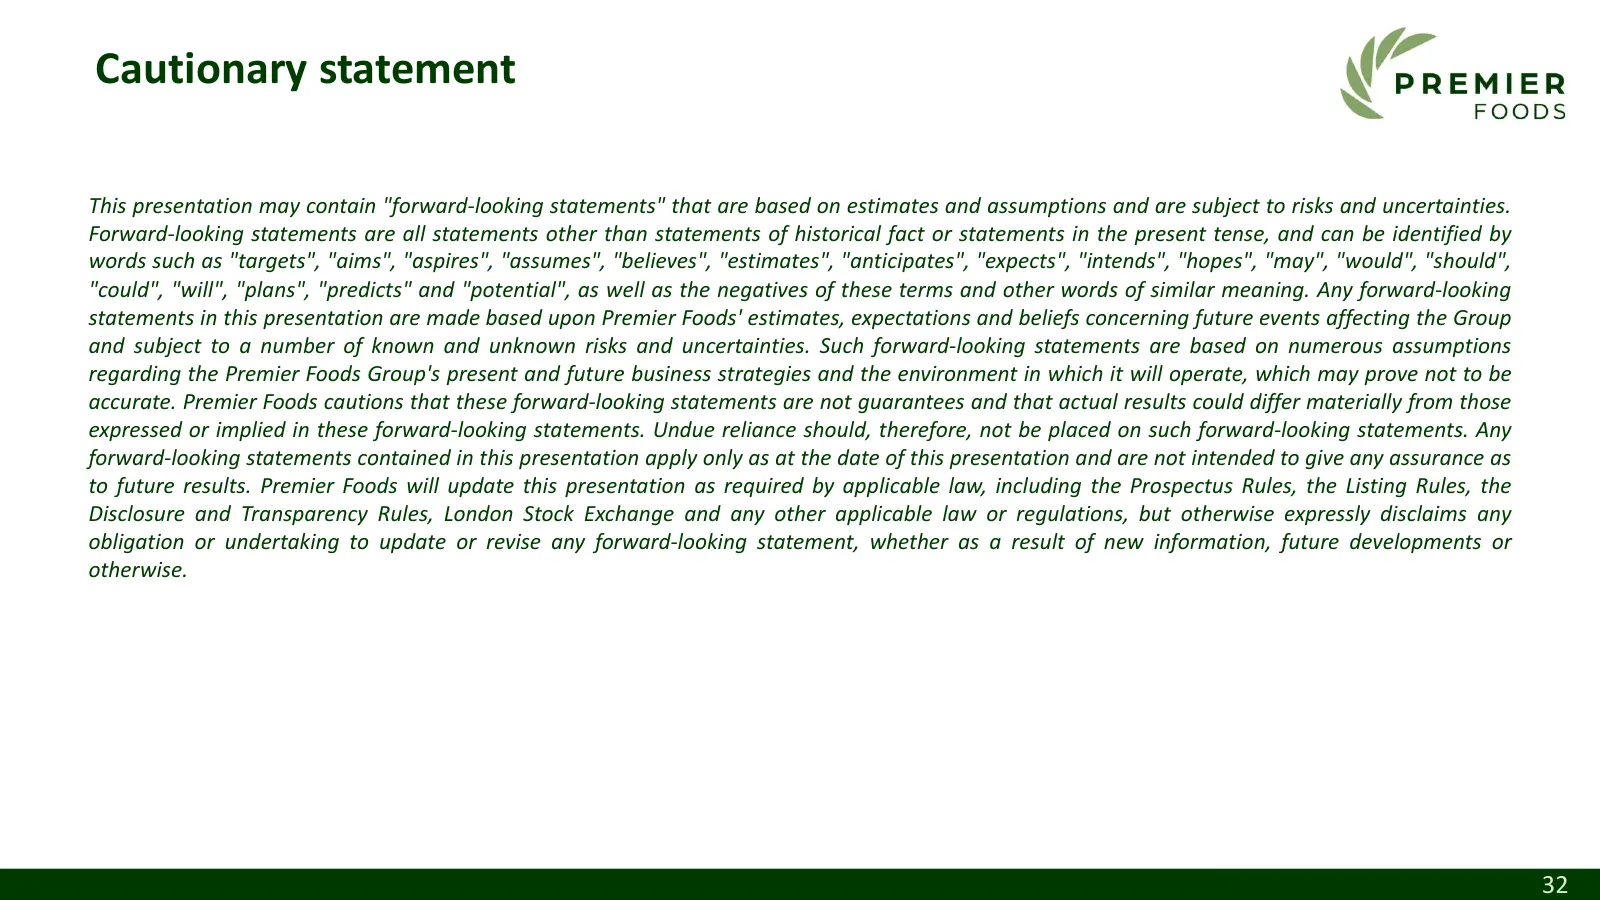
Cautionary statement This presentation may contain "forward-looking statements" that are based on estimates and assumptions and are subject to risks and uncertainties. Forward-looking statements are all statements other than statements of historical fact or statements in the present tense, and can b
Slide 33: Definitions
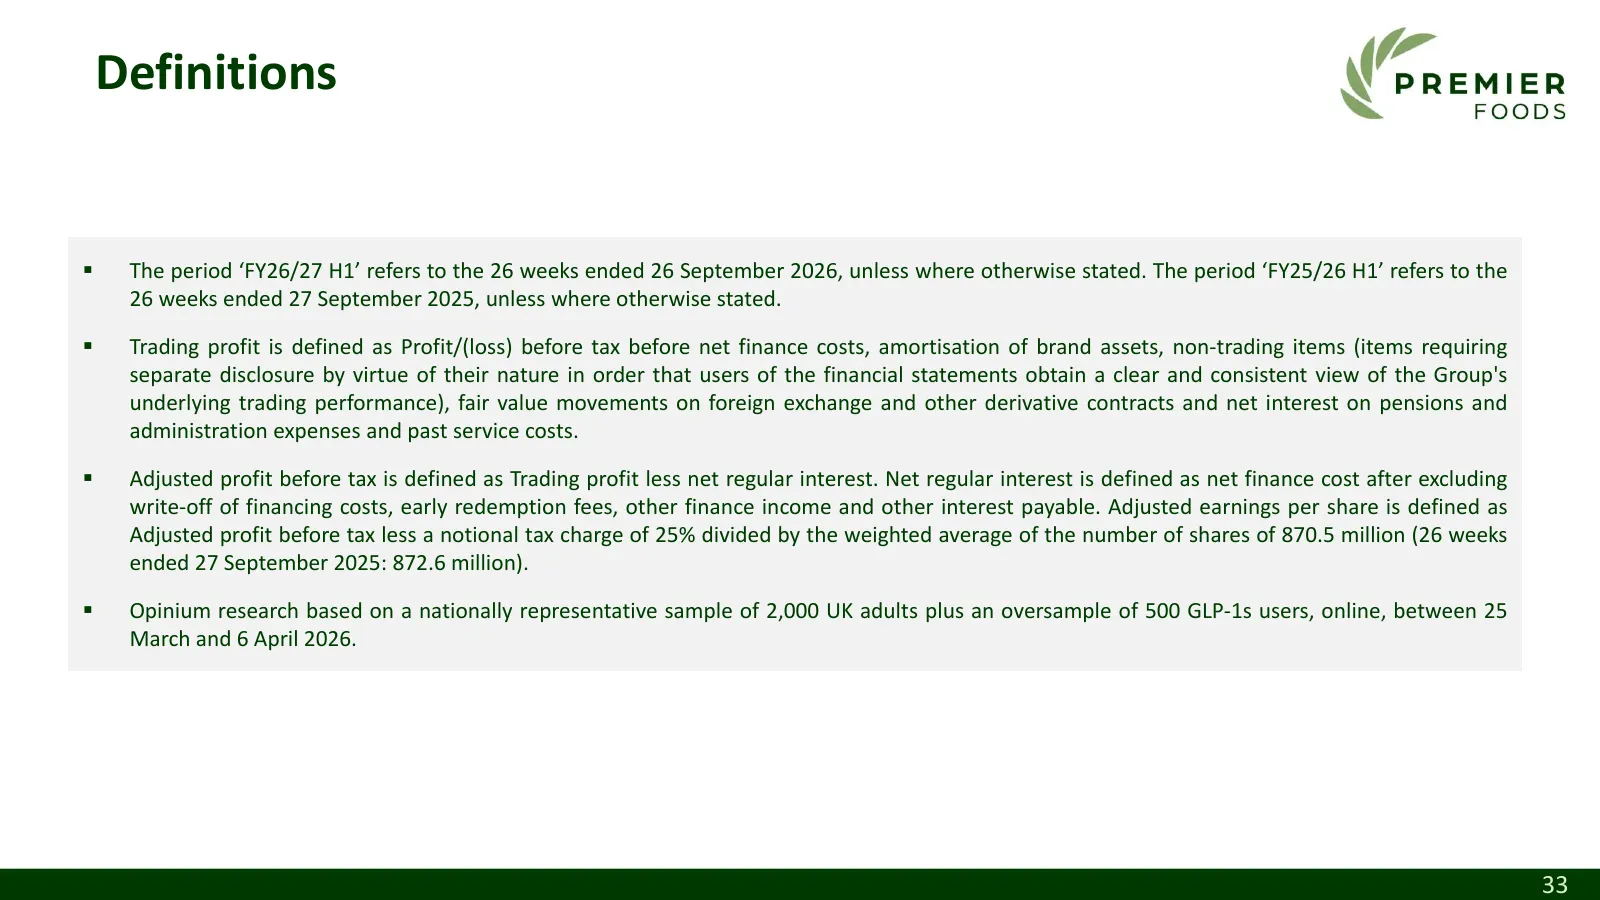
Definitions ▪ The period ‘FY26/27 H1’ refers to the 26 weeks ended 26 September 2026, unless where otherwise stated. The period ‘FY25/26 H1’ refers to the 26 weeks ended 27 September 2025, unless where otherwise stated. ▪ Trading profit is defined as Profit/(loss) before tax before net finance costs
Slide 34: Why invest in Premier Foods?
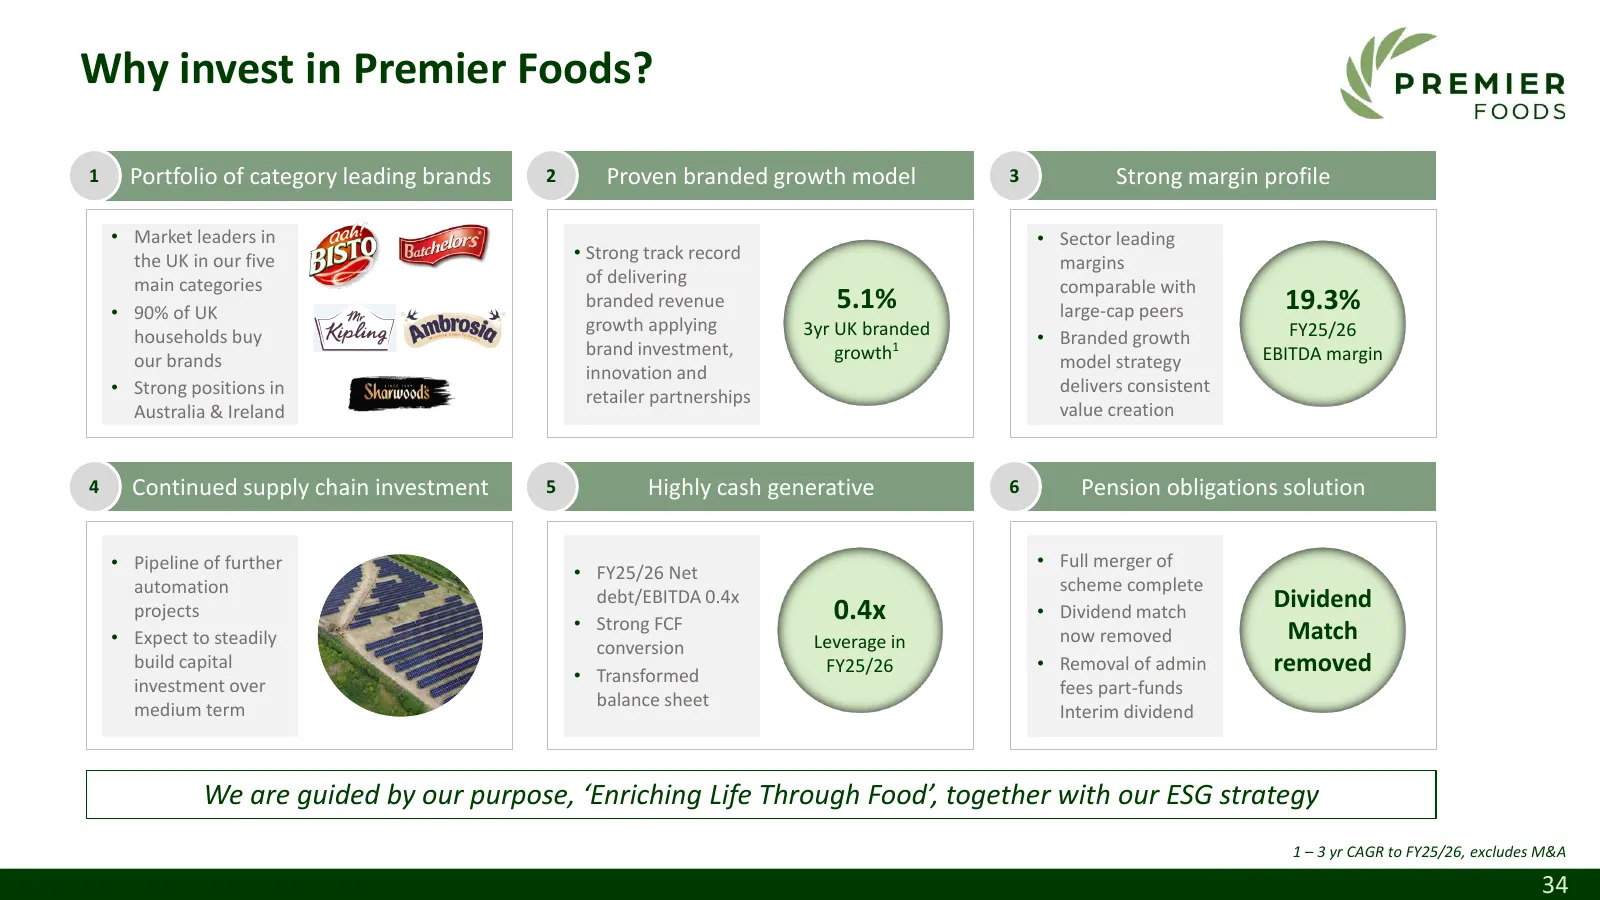
Why invest in Premier Foods? 1 Portfolio of category leading brands 2 Proven branded growth model 3 Strong margin profile • Market leaders in • Sector leading the UK in our five • Strong track record margins main categories of delivering comparable with • 90% of UK branded revenue 5.1% large-cap pee
Slide 35: Statutory vs Headline Revenue
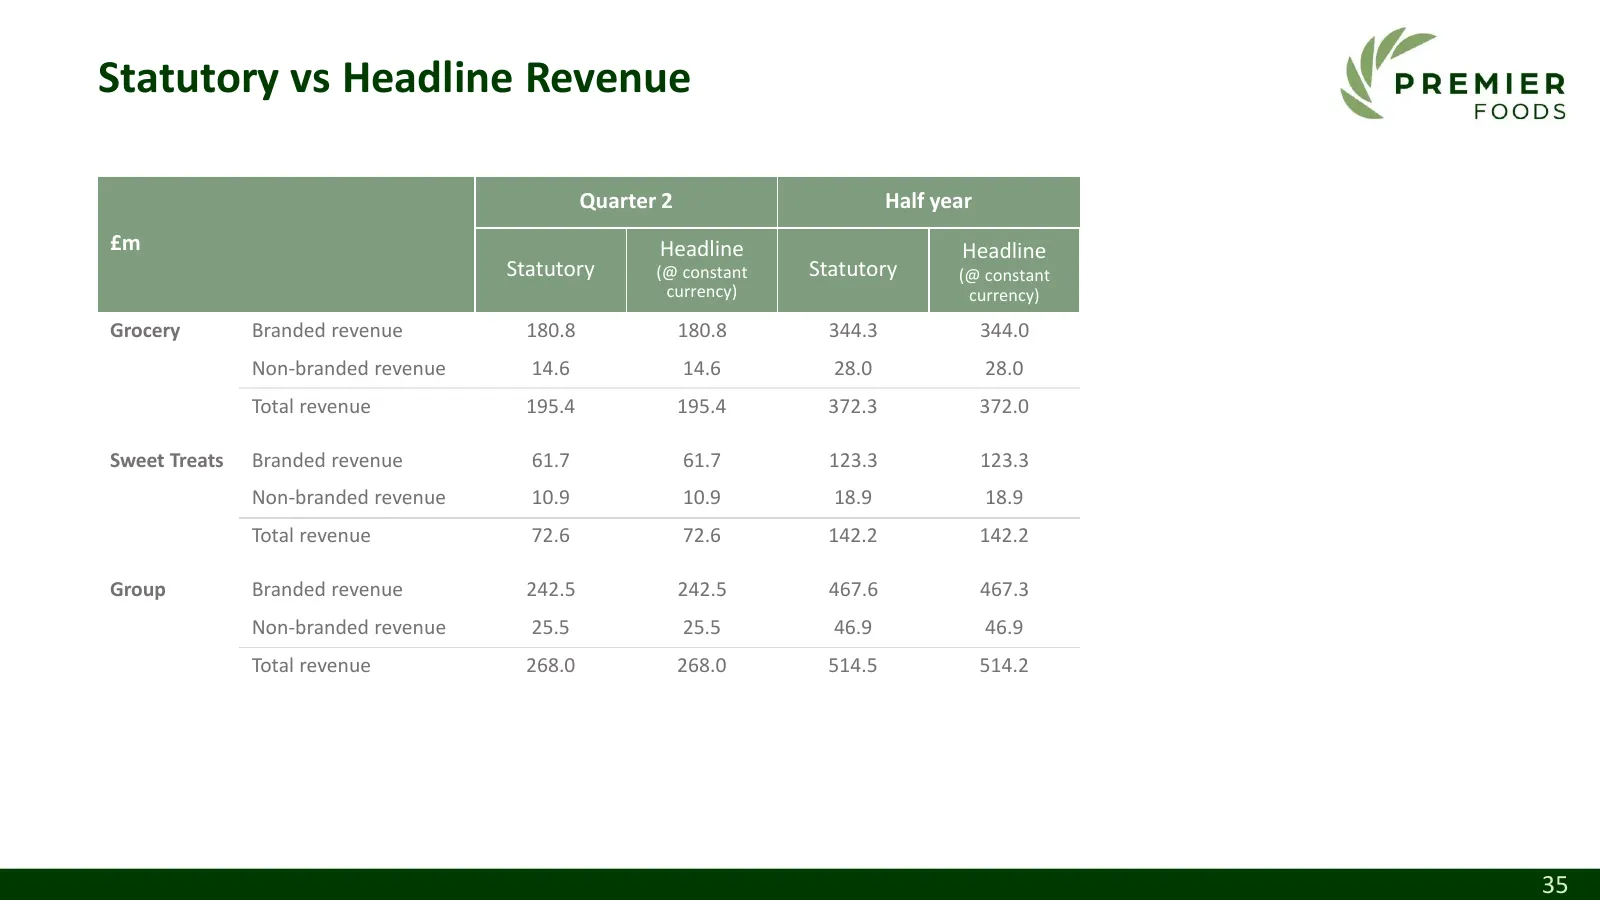
Statutory vs Headline Revenue Quarter 2 Half year £m Headline Headline Statutory (@ constant Statutory (@ constant currency) currency) Grocery Branded revenue 180.8 180.8 344.3 344.0 Non-branded revenue 14.6 14.6 28.0 28.0 Total revenue 195.4 195.4 372.3 372.0 Sweet Treats Branded revenue 61.7 61.7
Slide 36: Adjusted earnings per share
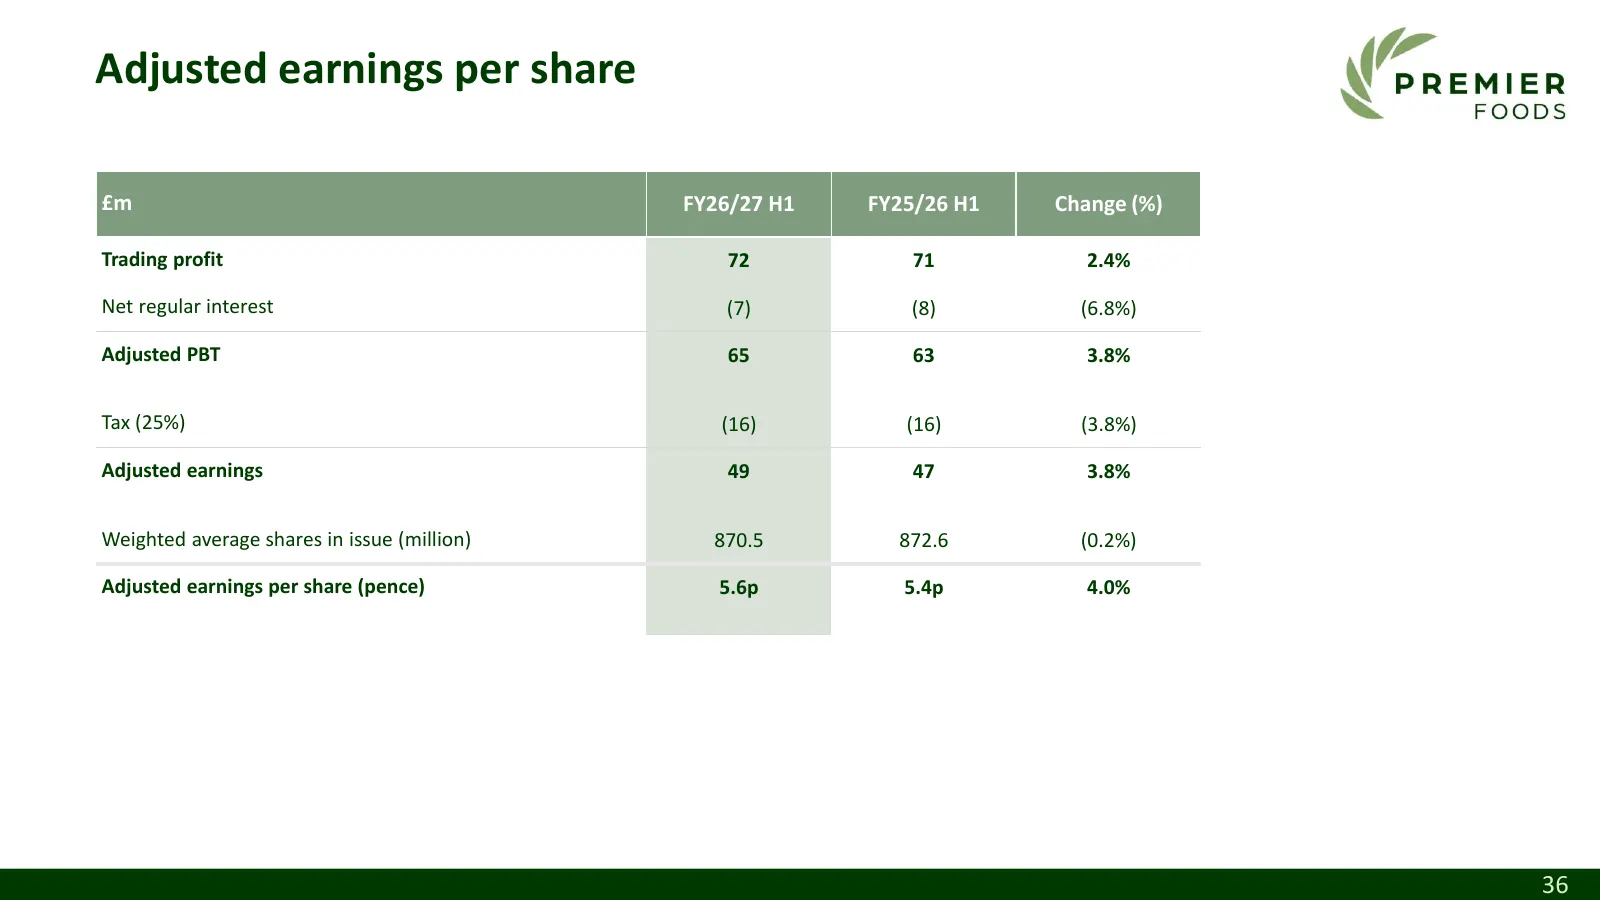
Adjusted earnings per share £m FY26/27 H1 FY25/26 H1 Change (%) Trading profit 72 71 2.4% Net regular interest (7) (8) (6.8%) Adjusted PBT 65 63 3.8% Tax (25%) (16) (16) (3.8%) Adjusted earnings 49 47 3.8% Weighted average shares in issue (million) 870.5 872.6 (0.2%) Adjusted earnings per share (pen
Slide 37: Interest and taxation
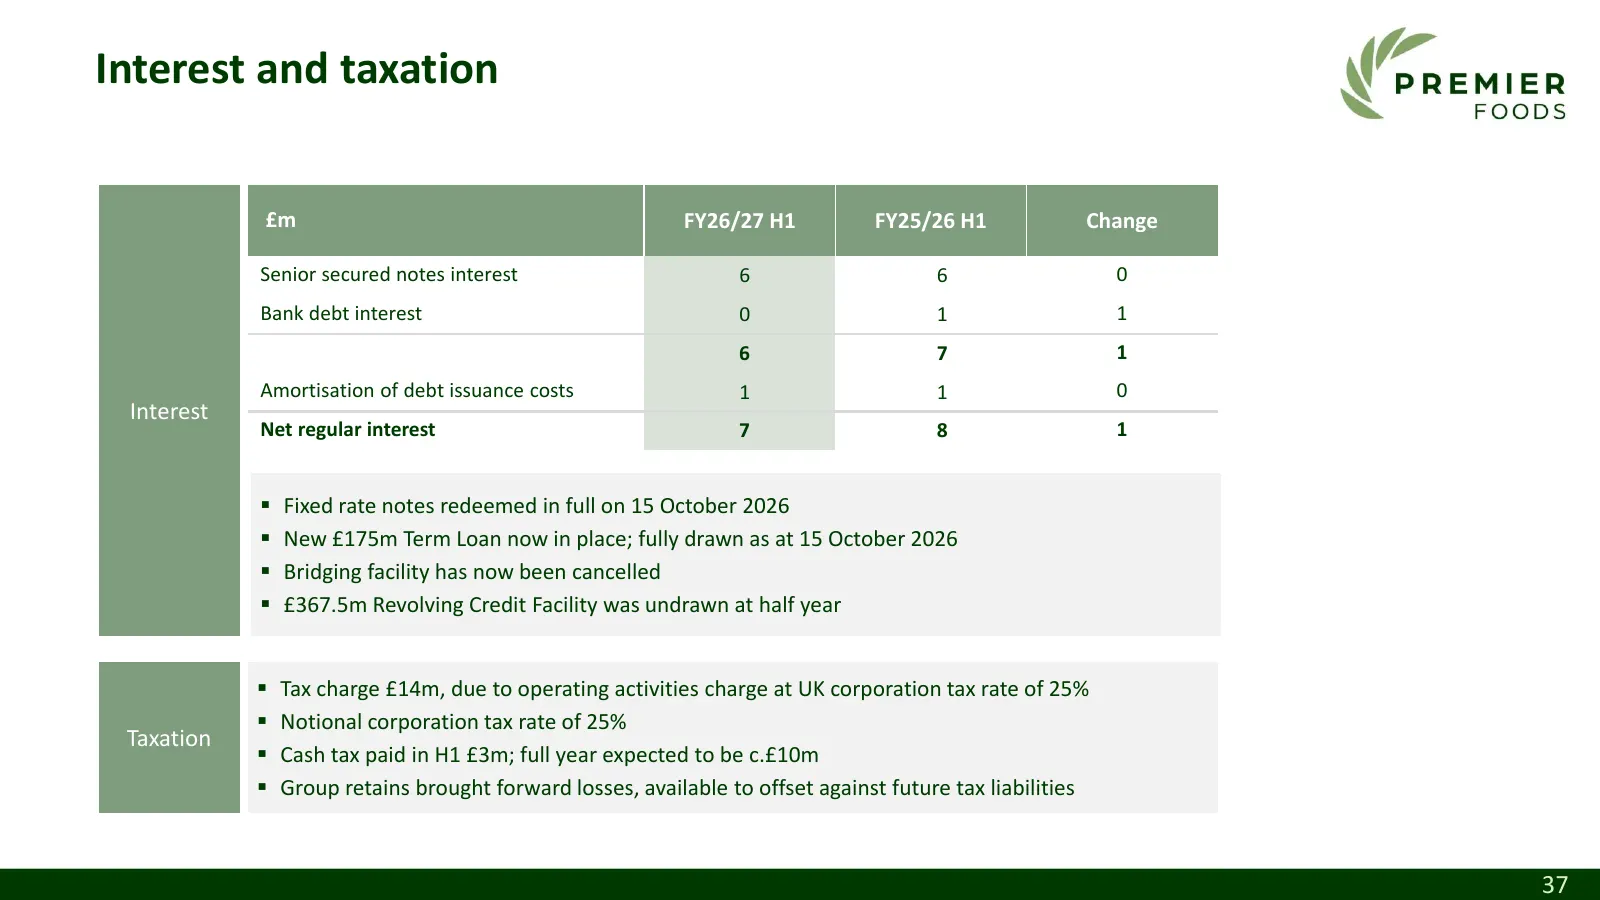
Interest and taxation £m FY26/27 H1 FY25/26 H1 Change Senior secured notes interest 6 6 0 Bank debt interest 0 1 1 6 7 1 Amortisation of debt issuance costs 1 1 0 Interest Net regular interest 7 8 1 ▪ Fixed rate notes redeemed in full on 15 October 2026 ▪ New £175m Term Loan now in place; fully draw
Slide 38: Pensions
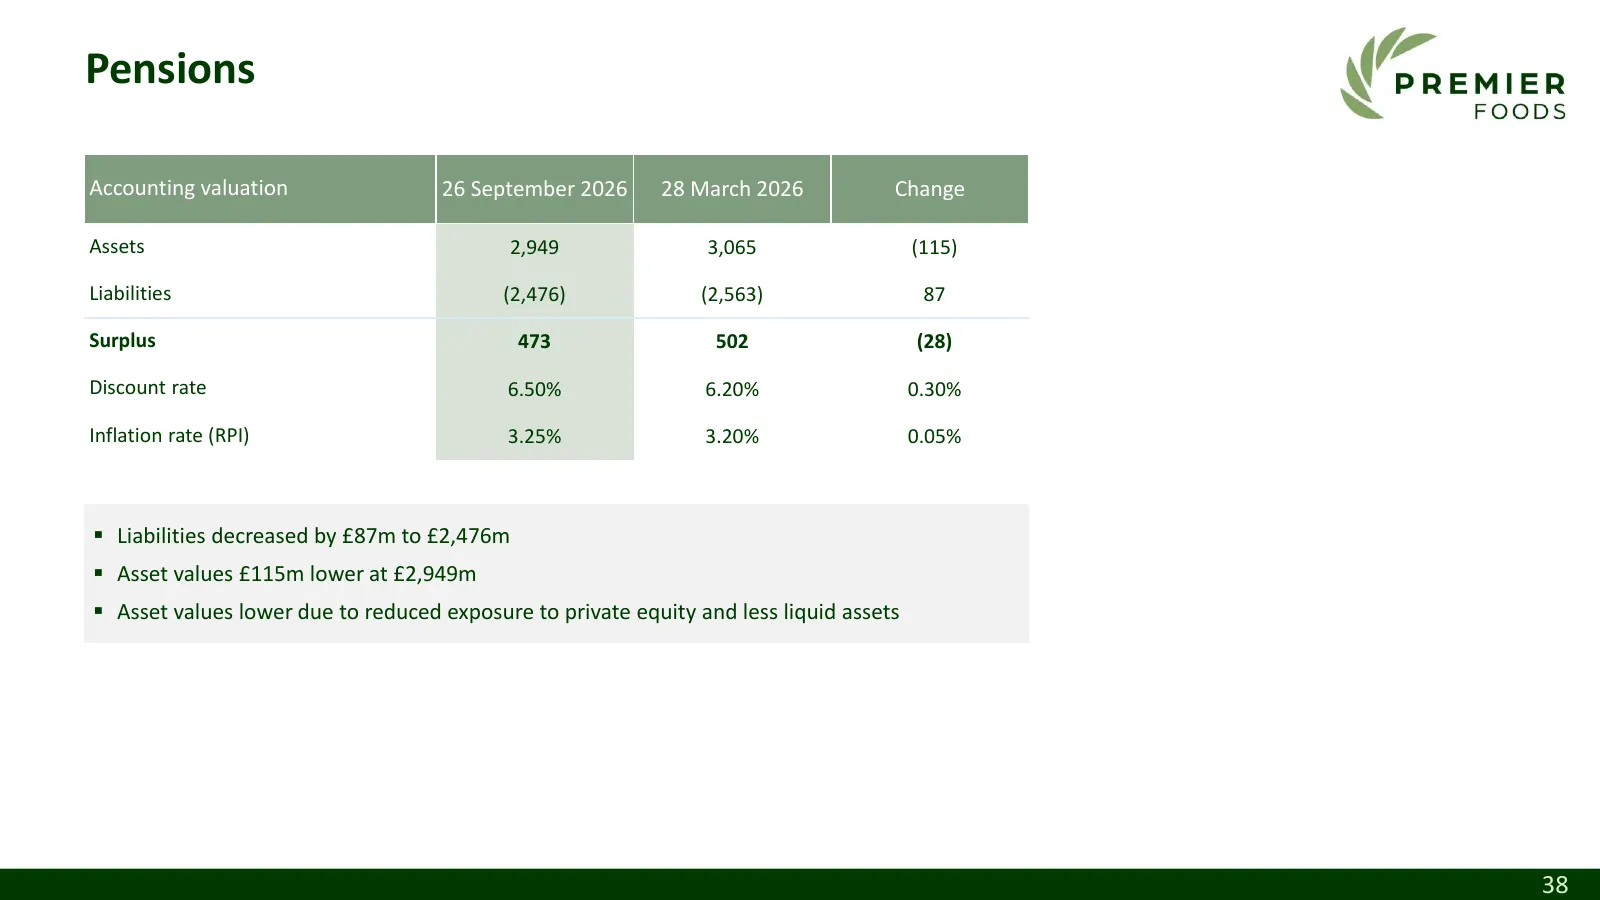
Pensions Accounting valuation 26 September 2026 28 March 2026 Change Assets 2,949 3,065 (115) Liabilities (2,476) (2,563) 87 Surplus 473 502 (28) Discount rate 6.50% 6.20% 0.30% Inflation rate (RPI) 3.25% 3.20% 0.05% ▪ Liabilities decreased by £87m to £2,476m ▪ Asset values £115m lower at £2,949m ▪
Slide 39: FY26/27 guidance
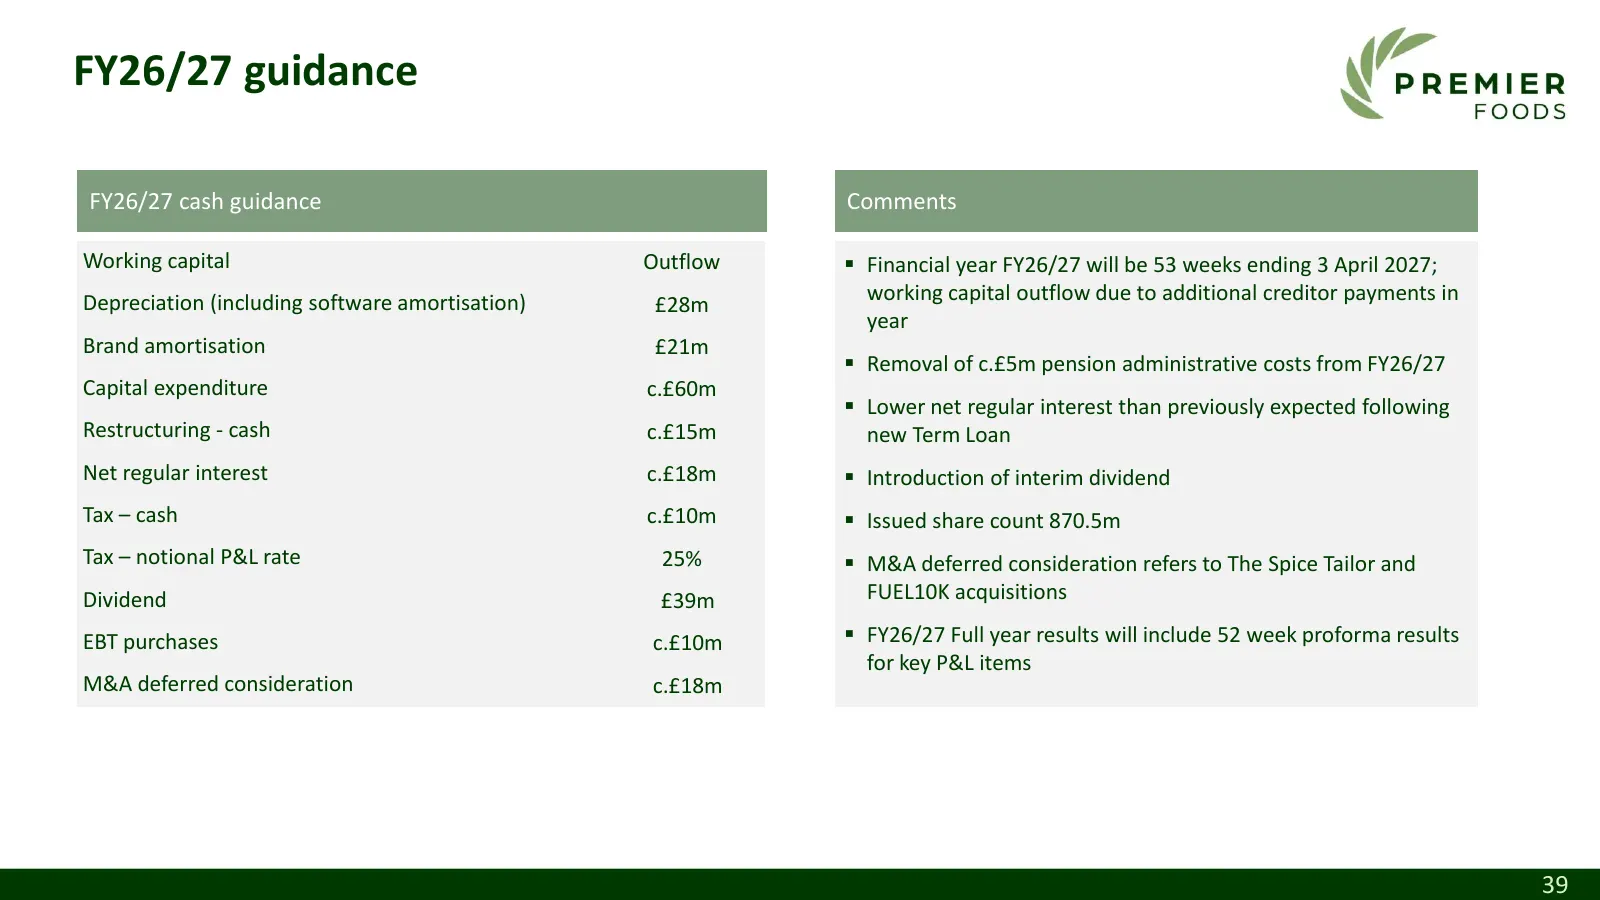
FY26/27 guidance FY26/27 cash guidance Comments Working capital Outflow ▪ Financial year FY26/27 will be 53 weeks ending 3 April 2027; Depreciation (including software amortisation) working capital outflow due to additional creditor payments in £28m year Brand amortisation £21m ▪ Removal of c.£5m pe
Slide 40: Summarised balance sheet
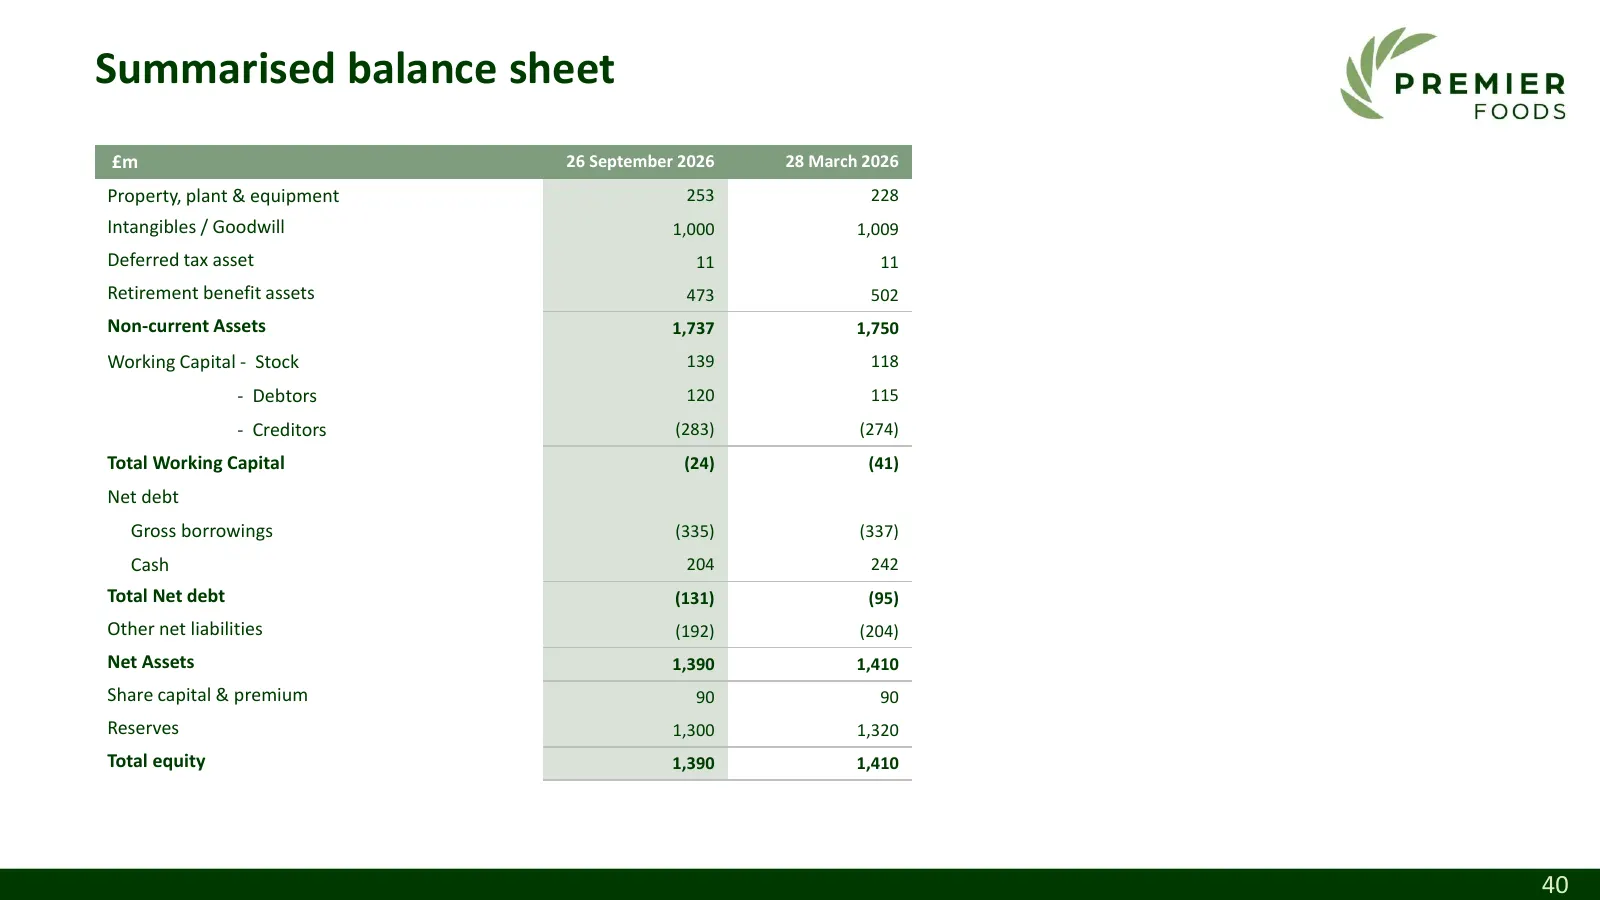
Summarised balance sheet £m 26 September 2026 28 March 2026 Property, plant & equipment 253 228 Intangibles / Goodwill 1,000 1,009 Deferred tax asset 11 11 Retirement benefit assets 473 502 Non-current Assets 1,737 1,750 Working Capital - Stock 139 118 - Debtors 120 115 - Creditors (283) (274) Total
Source: company website
More decks from Premier Foods plc
 FY2025/26 Earnings Presentation40 slides · May 14, 2026
 Investor Presentation (March 2026)39 slides · March 2026
 H1 2025/26 Earnings Presentation38 slides · Nov 13, 2025
 Merger or Acquisition (August 2025)7 slides · Aug 21, 2025
 FY2024/25 Earnings Presentation40 slides · May 15, 2025
 H1 FY2024/25 Earnings Presentation38 slides · Nov 14, 2024