Enel SpA · MIL:ENEL
Enel SpA — Investor Presentation (April 2001)
70 slides from Enel SpA's investor presentation, April 2001
Slide 1: Analyst Presentation
Analyst Presentation April, 2001
Slide 2: Disclaimer
THESE SLIDES HAVE BEEN PREPARED BY THE COMPANY SOLELY FOR USE AT THE ANALYST PRESENTATIONS IN MILAN AND LONDON. THE INFORMATION CONTAINED HEREIN HAS NOT BEEN INDEPENDENTLY VERIFIED AND NO REPRESENTATION OR WARRANTY EXPRESSED OR IMPLIED IS MADE AS TO AND NO RELIANCE SHOULD BE PLACED ON THE FAIRNESS,

Slide 3
Slide 4: Agenda
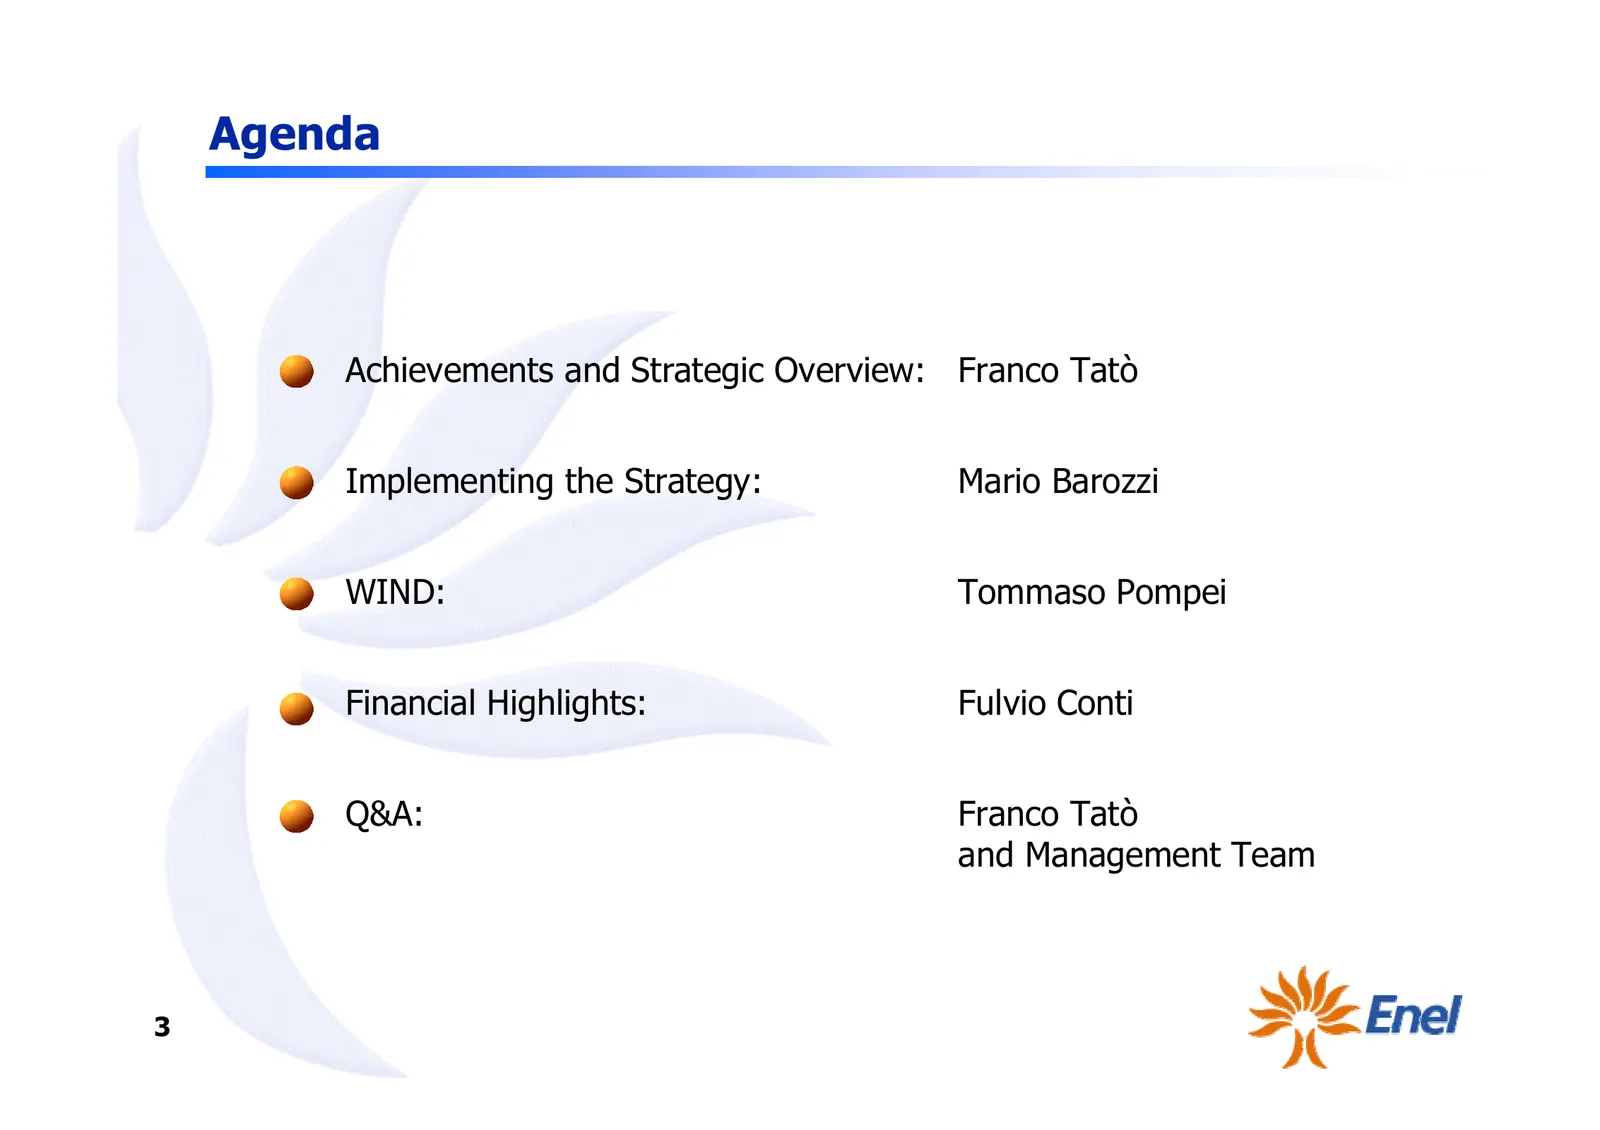
Agenda • Achievements and Strategic Overview: Franco Tatò • Implementing the Strategy: Mario Barozzi • WIND: Tommaso Pompei • Financial Highlights: Fulvio Conti • Q&A: Franco Tatò and Management Team 3

Slide 5: Achievements and Strategic Overview
Achievements and Strategic Overview Franco Tatò
Slide 6: Key Strategic Objectives
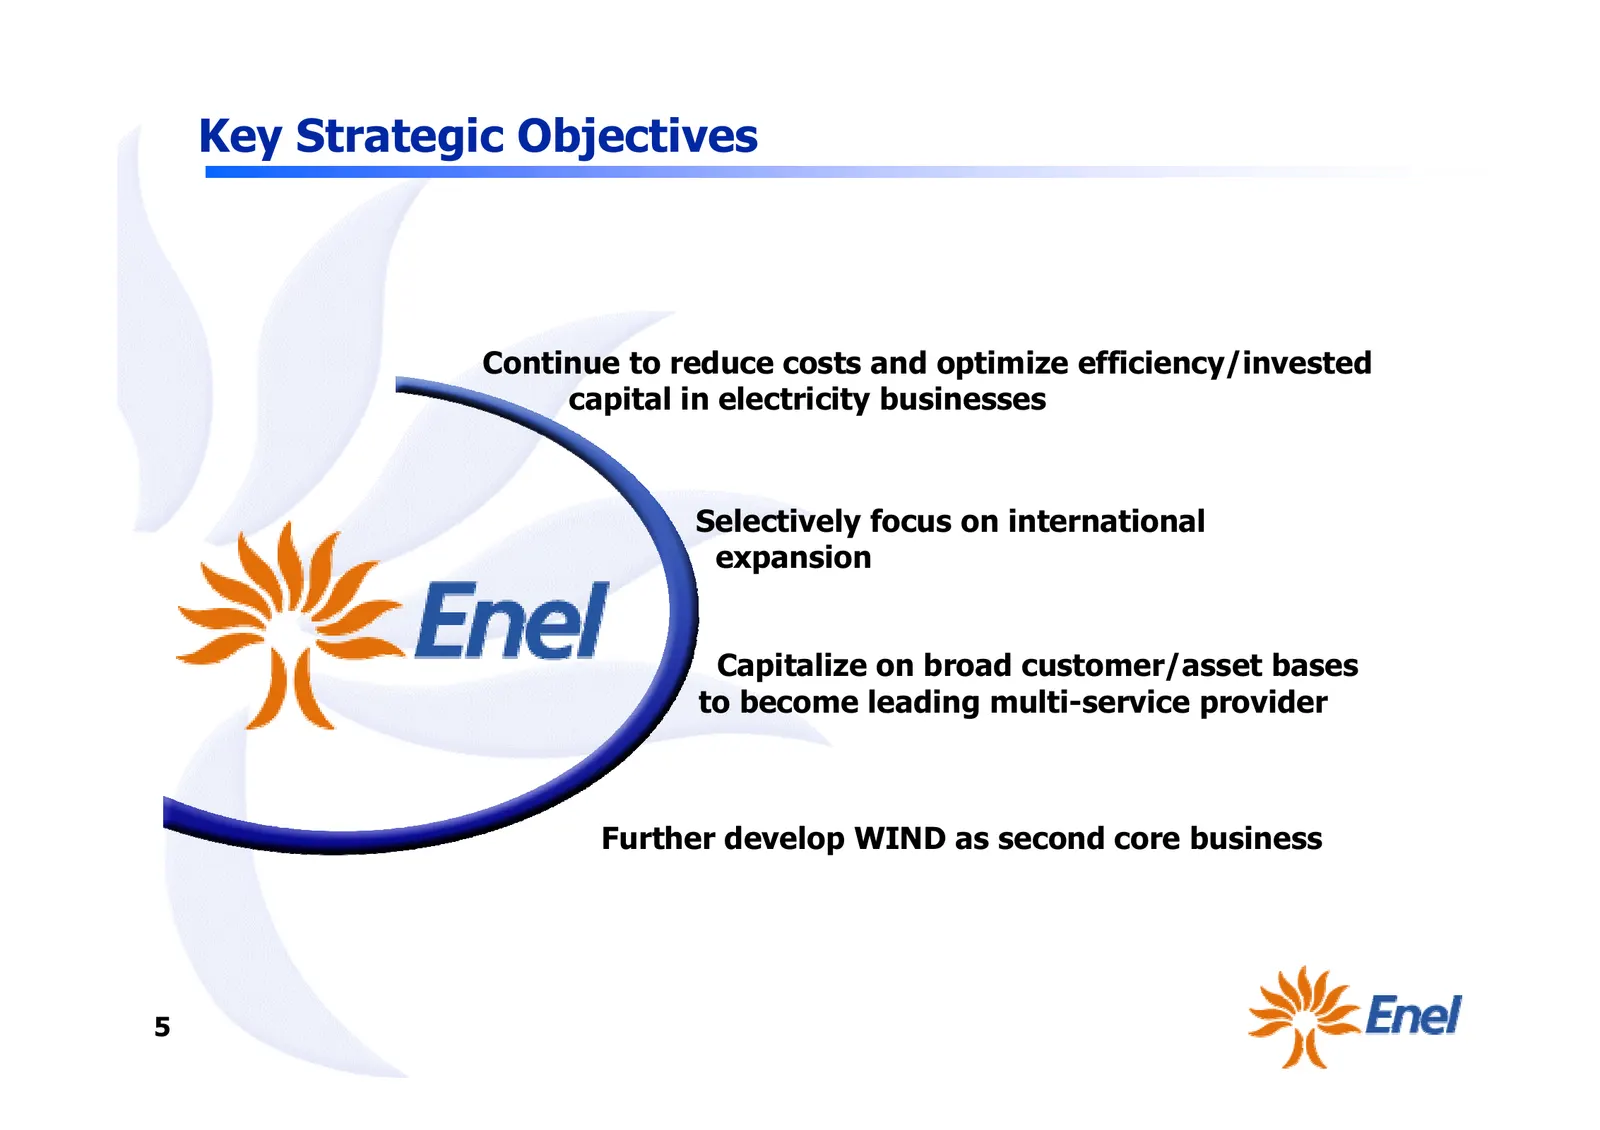
Key Strategic Objectives Continue to reduce costs and optimize efficiency/invested capital in electricity businesses Selectively focus on international expansion Capitalize on broad customer/asset bases to become leading multi-service provider Further develop WIND as second core business 5
Slide 7: Key Strategic Achievements
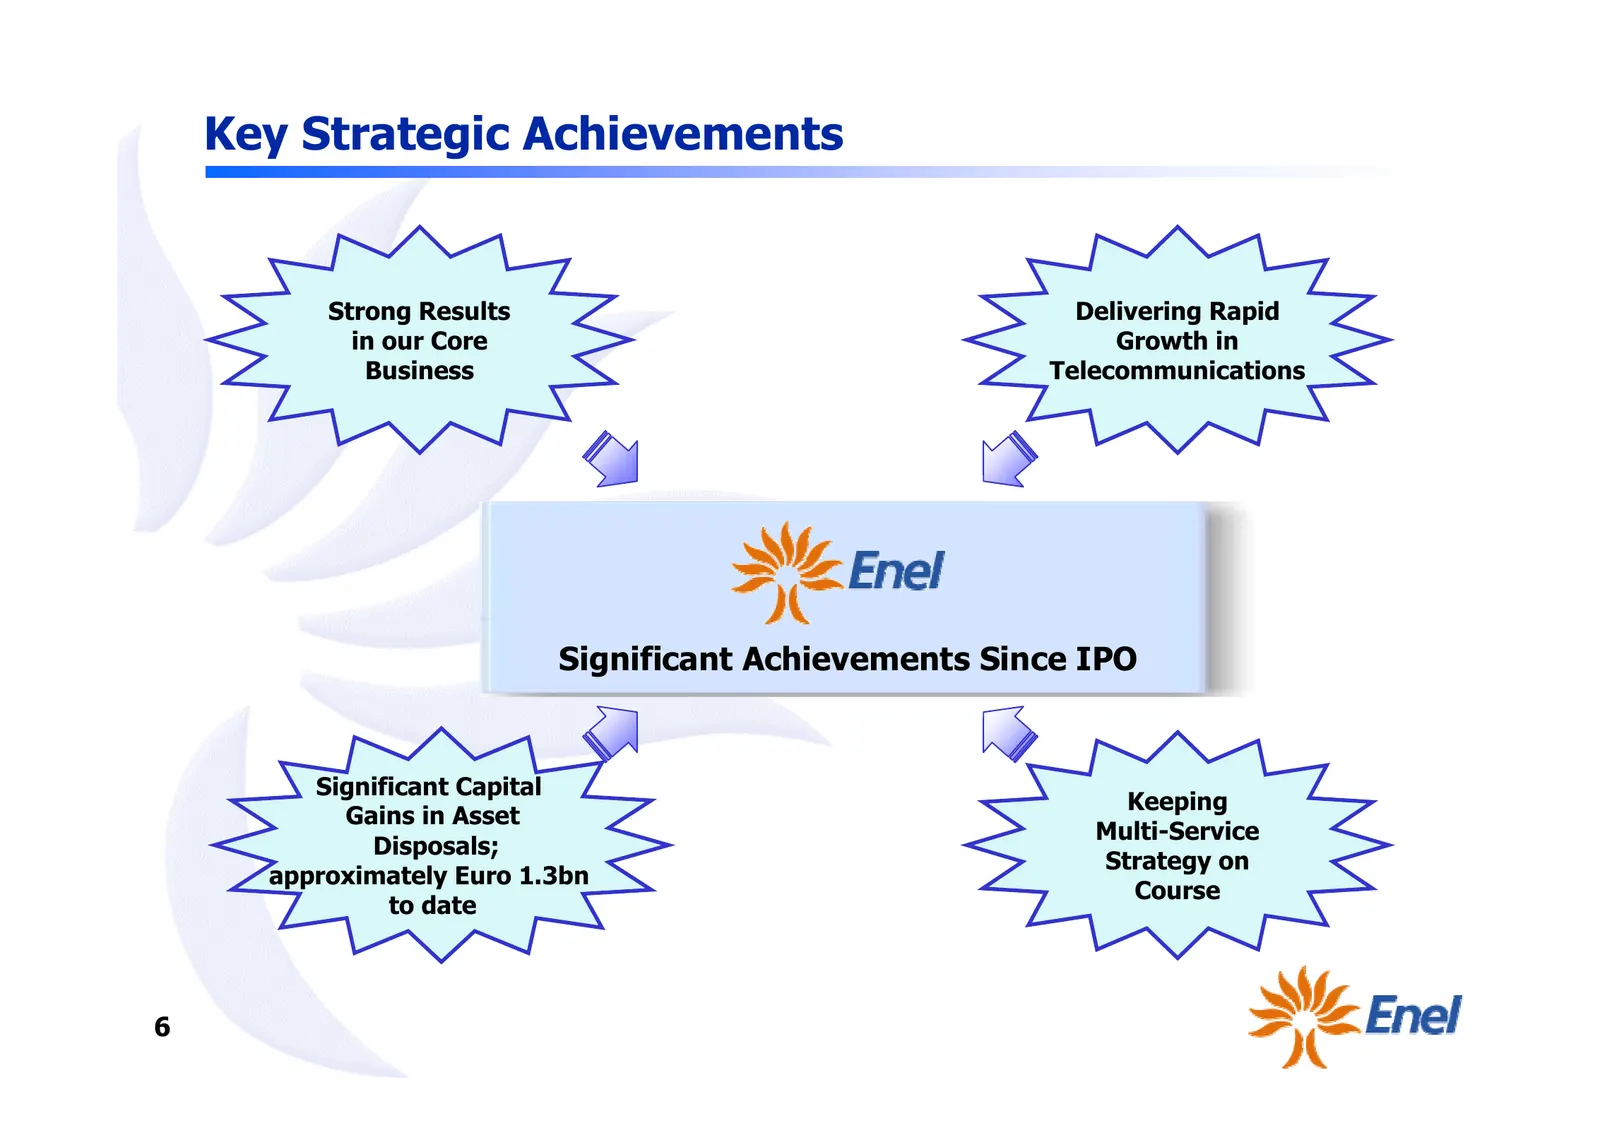
Key Strategic Achievements Strong Results Delivering Rapid in our Core Growth in Business Telecommunications Significant Achievements Since IPO Significant Capital Keeping Gains in Asset Multi-Service Disposals; Strategy on approximately Euro 1.3bn Course to date 6
Slide 8: Increased Value Contribution to Shareholders
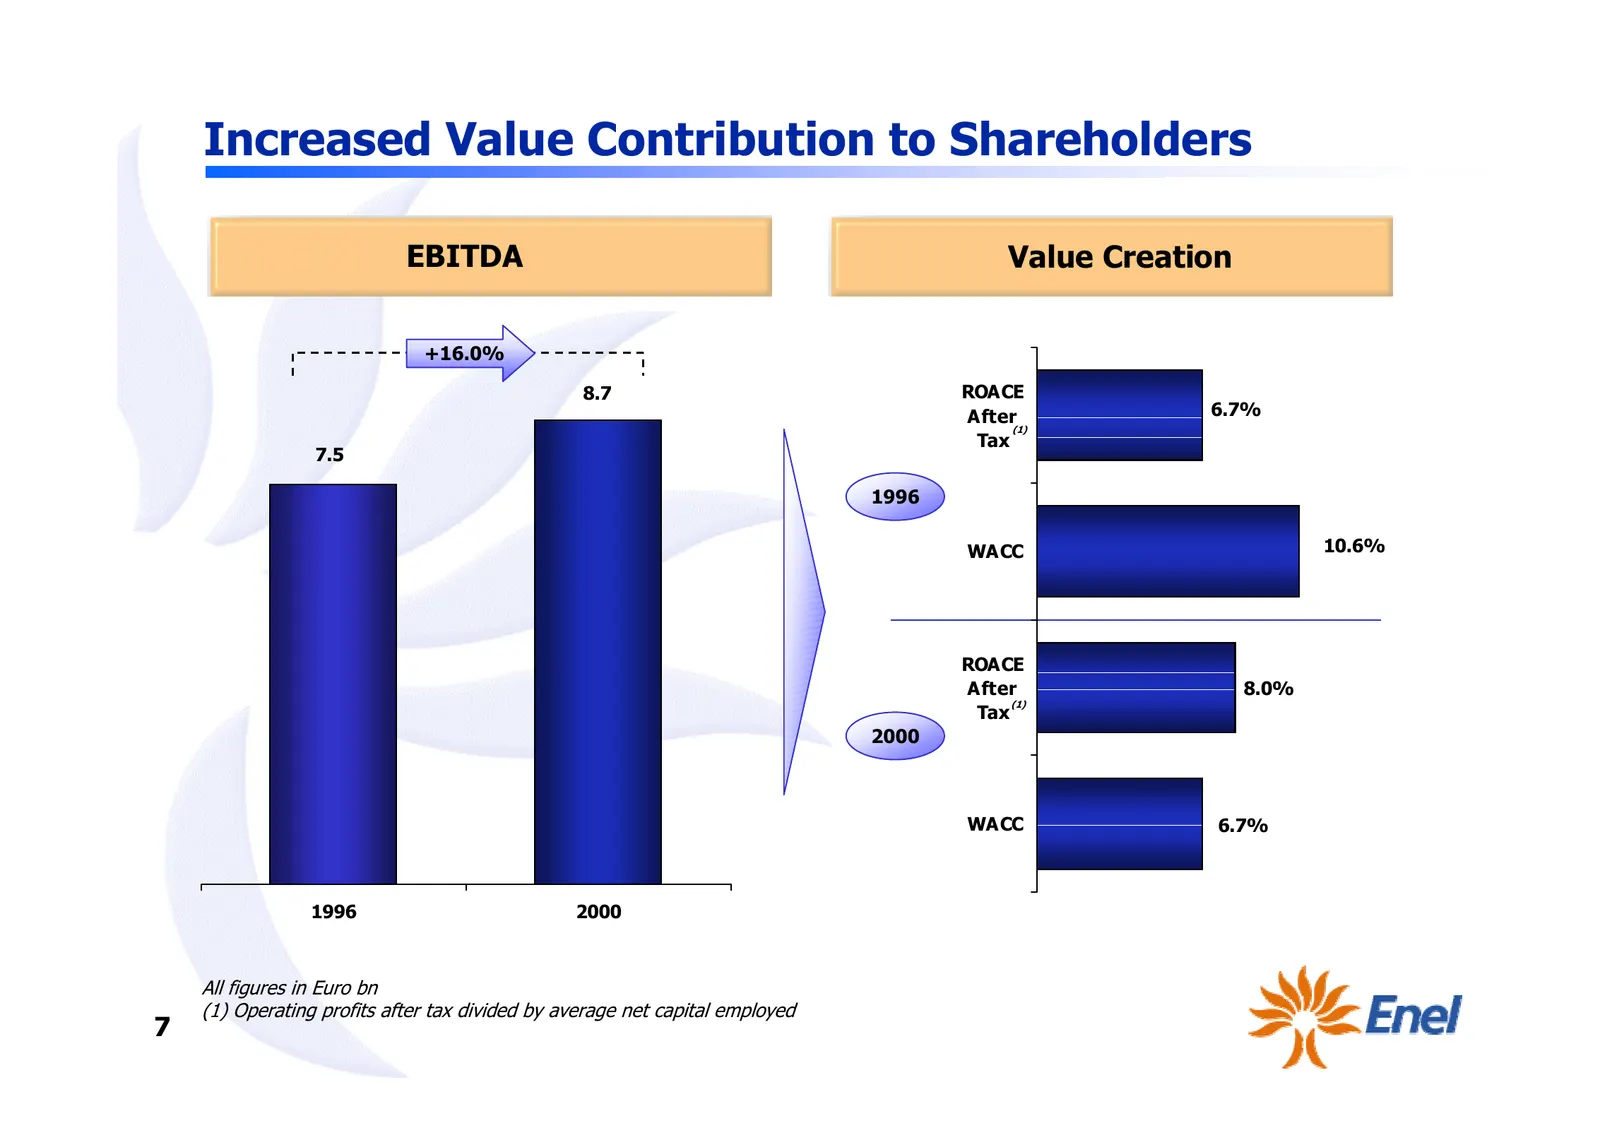
Increased Value Contribution to Shareholders EBITDA Value Creation +16.0% 8.7 ROACE After 6.7% (1) Tax 7.5 1996 WACC 10.6% ROACE After 8.0% (1) Tax 2000 WACC 6.7% 1996 2000 All figures in Euro bn (1) Operating profits after tax divided by average net capital employed 7
Slide 9: Successfully Managing the Electricity Business
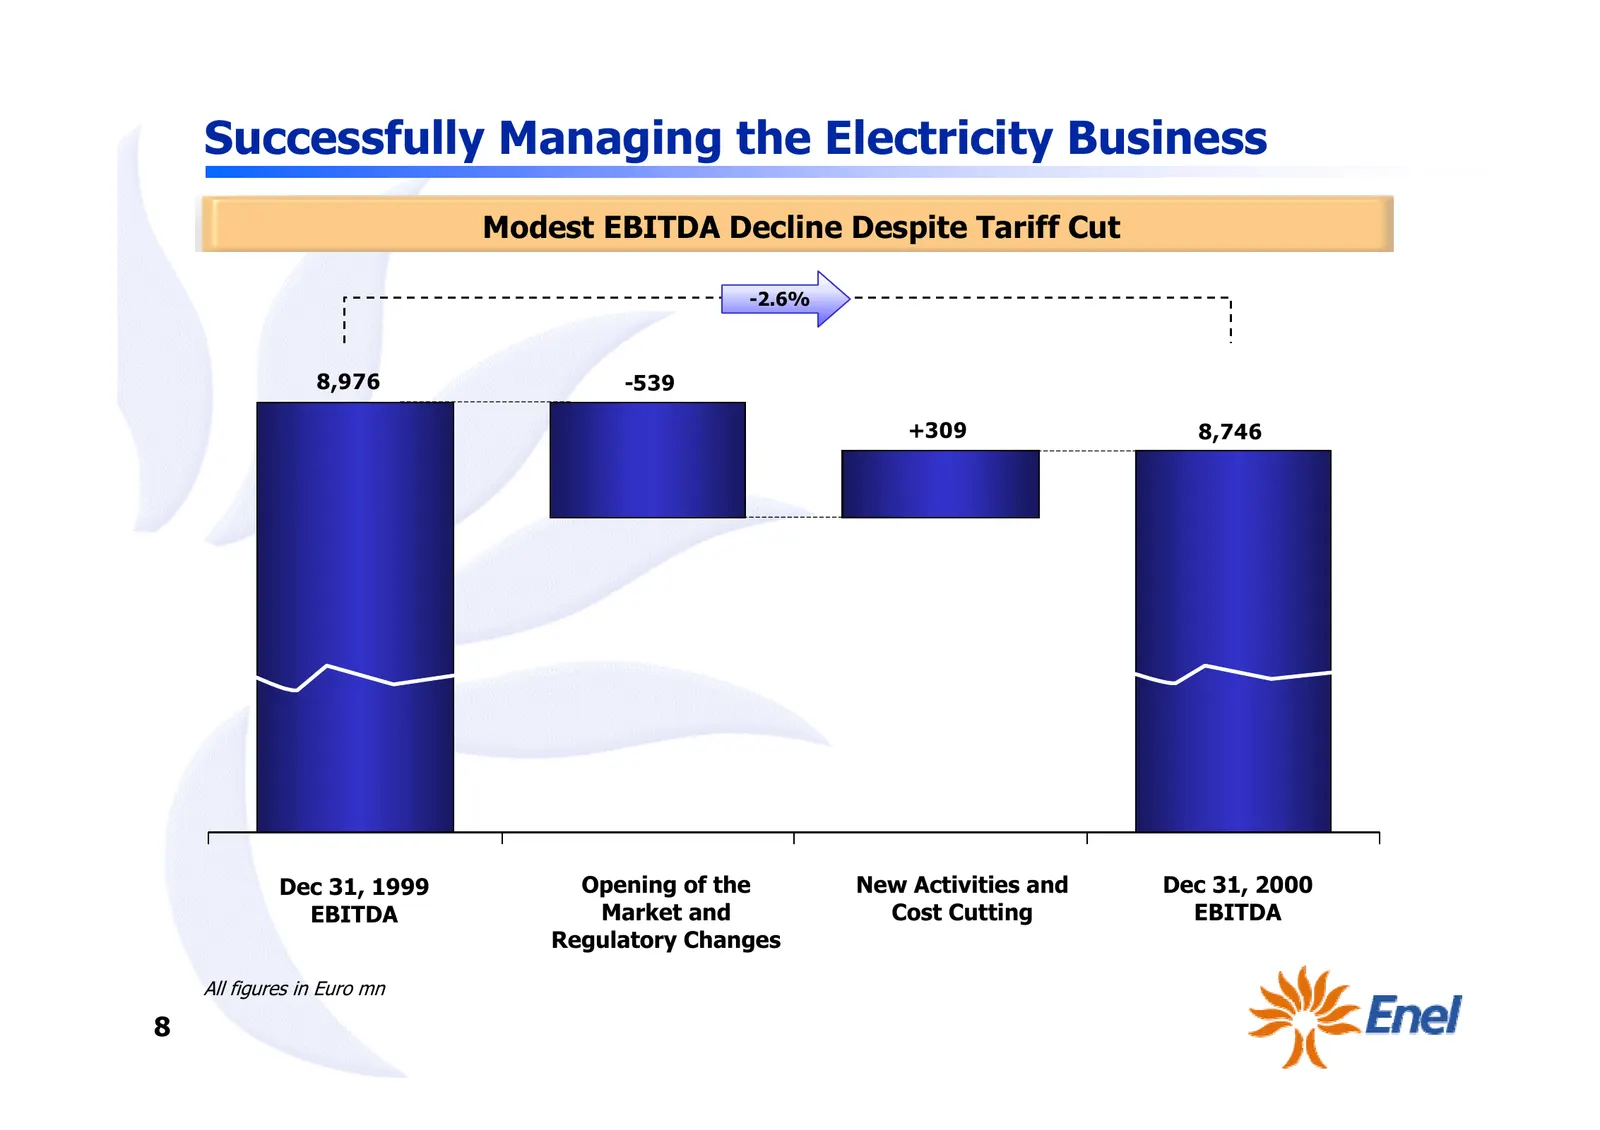
Successfully Managing the Electricity Business Modest EBITDA Decline Despite Tariff Cut -2.6% 8,976 -539 +309 8,746 Dec 31, 1999 Opening of the New Activities and Dec 31, 2000 EBITDA Market and Cost Cutting EBITDA Regulatory Changes All figures in Euro mn 8
Slide 10: Continue Aggressive Cost Cutting
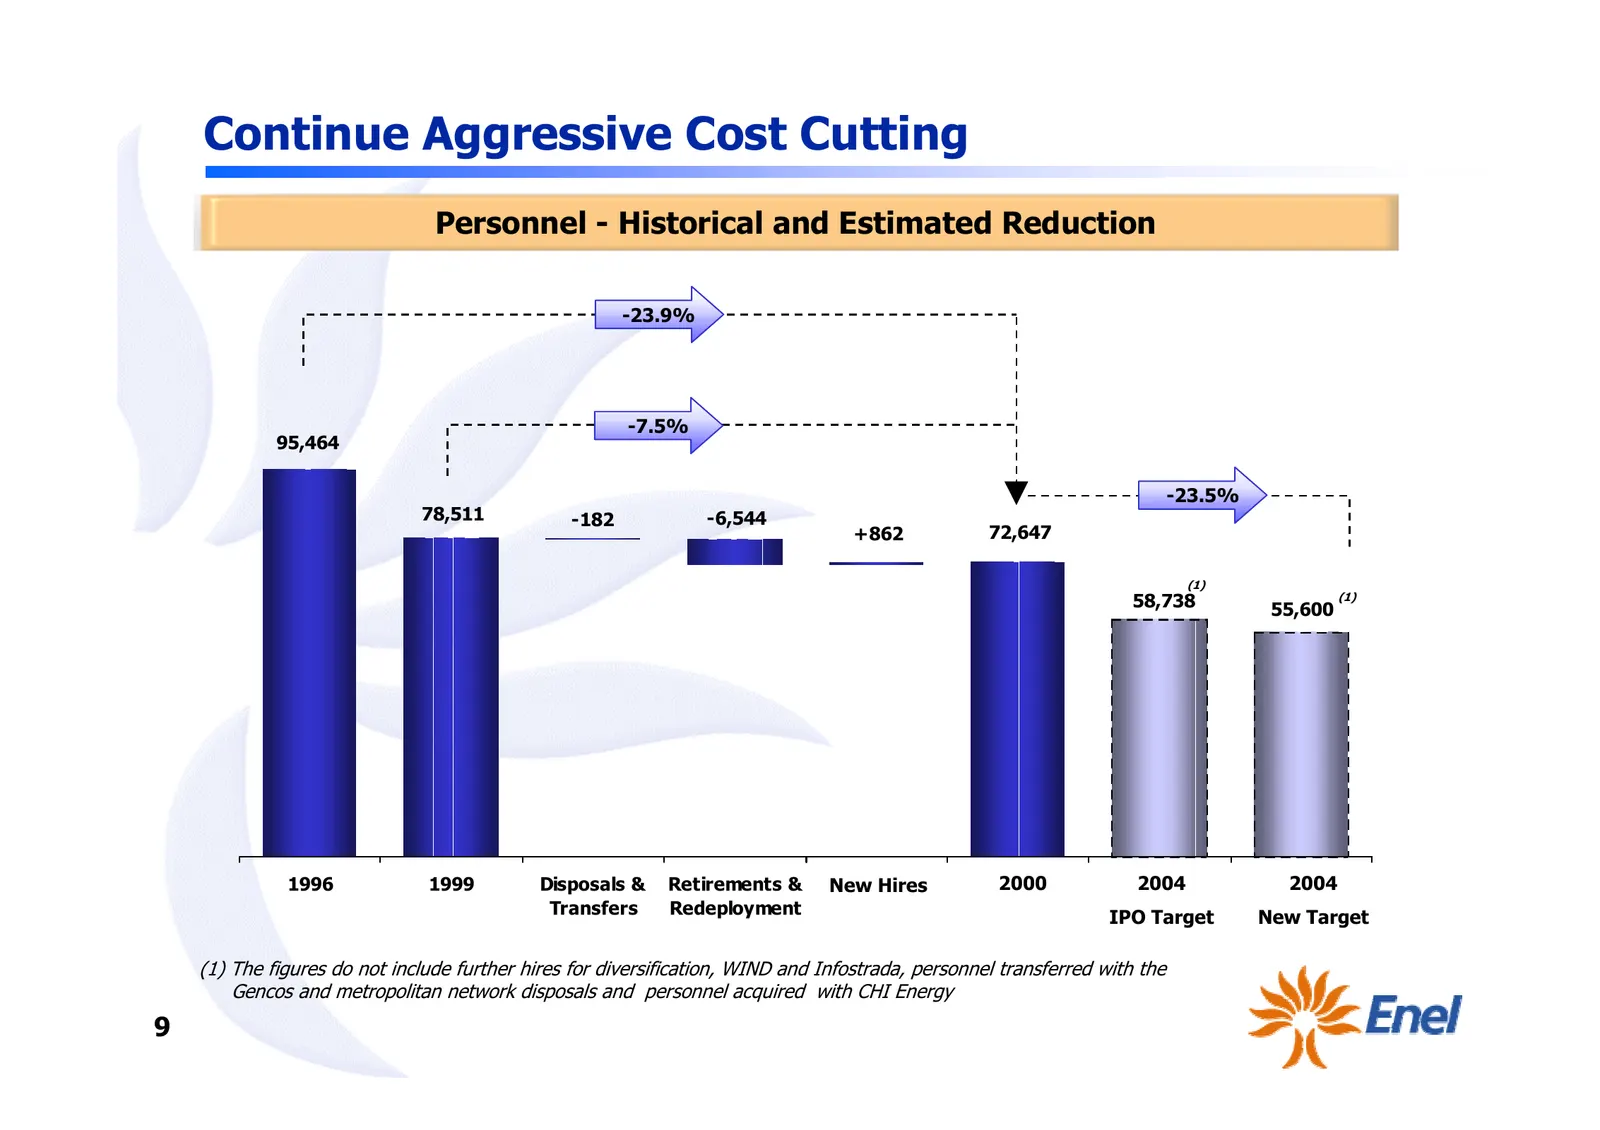
Continue Aggressive Cost Cutting Personnel - Historical and Estimated Reduction -23.9% -7.5% 95,464 -23.5% 78,511 -182 -6,544 +862 72,647 (1) 58,738 55,600 (1) 1996 1999 Disposals & Retirements & New Hires 2000 2004 2004 Transfers Redeployment IPO Target New Target (1) The figures do not include fur
Slide 11: The Electricity Businesses: Comparable Analysis
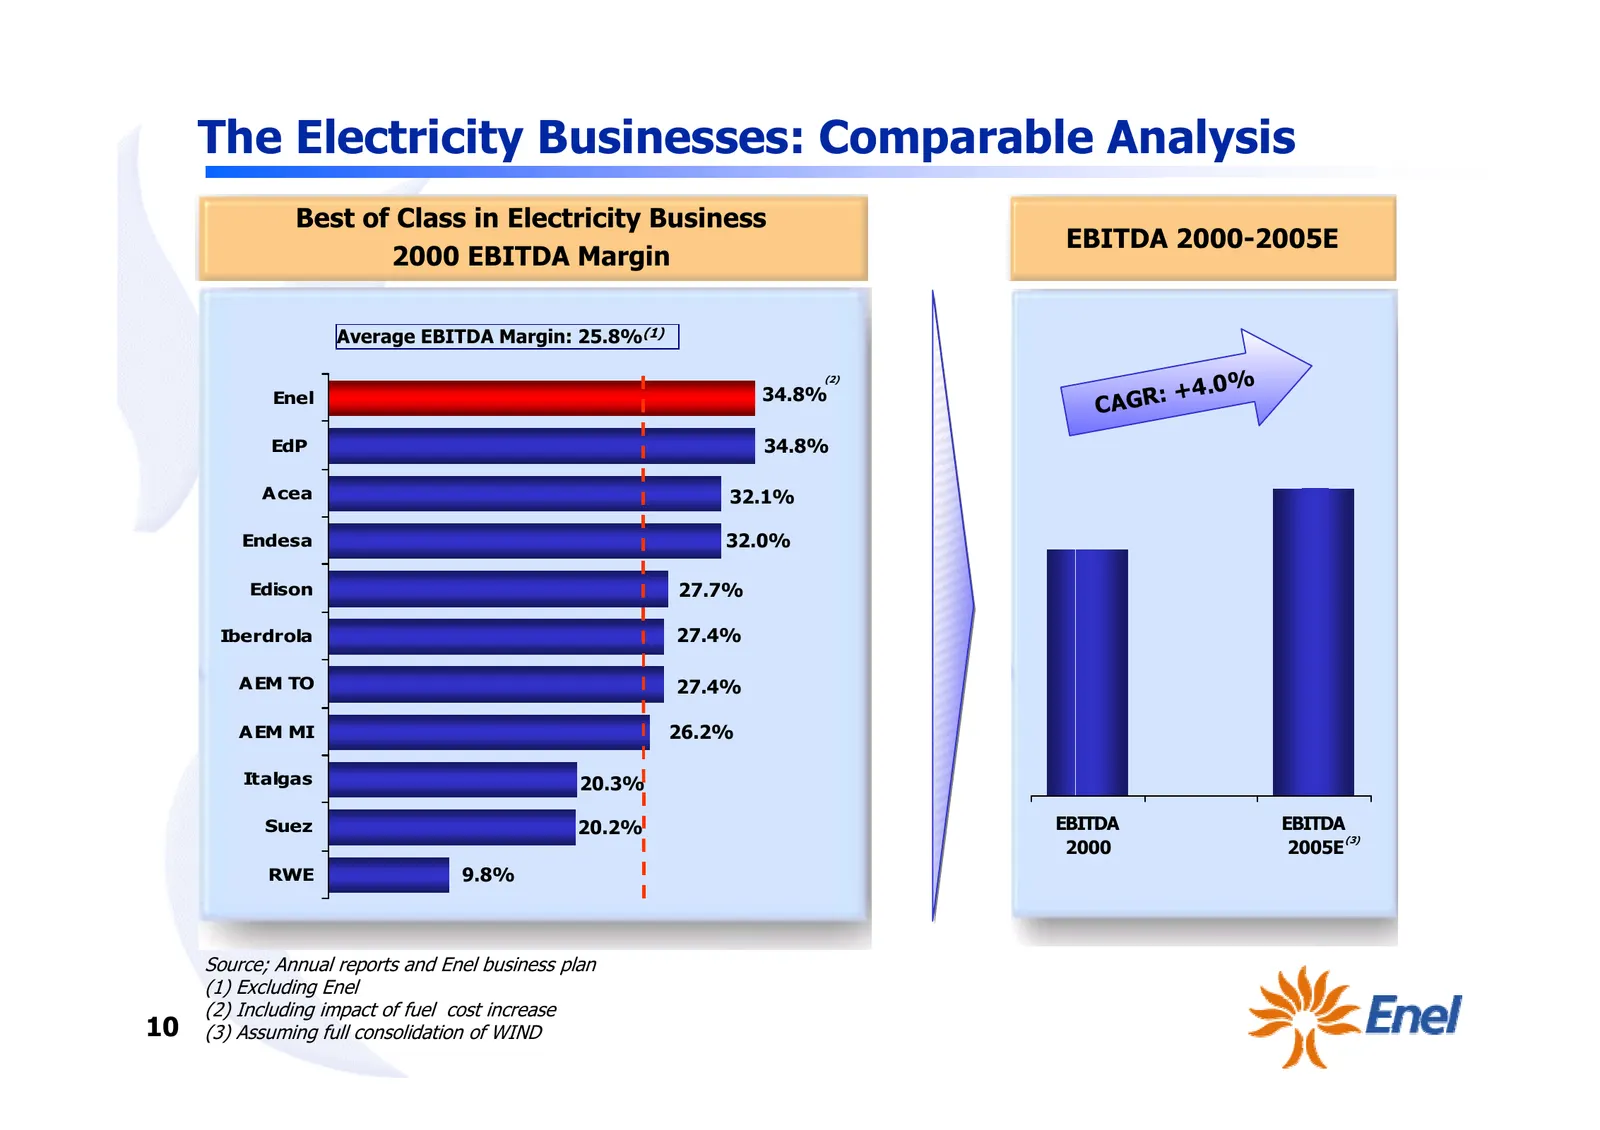
The Electricity Businesses: Comparable Analysis Best of Class in Electricity Business EBITDA 2000-2005E 2000 EBITDA Margin Average EBITDA Margin: 25.8%(1) +4.0% (2) 34.8% : Enel CAGR EdP 34.8% A cea 32.1% Endesa 32.0% Edison 27.7% Iberdrola 27.4% A EM TO 27.4% A EM MI 26.2% Italgas 20.3% Suez 20.2%
Slide 12: The Electricity Businesses: Main Initiatives
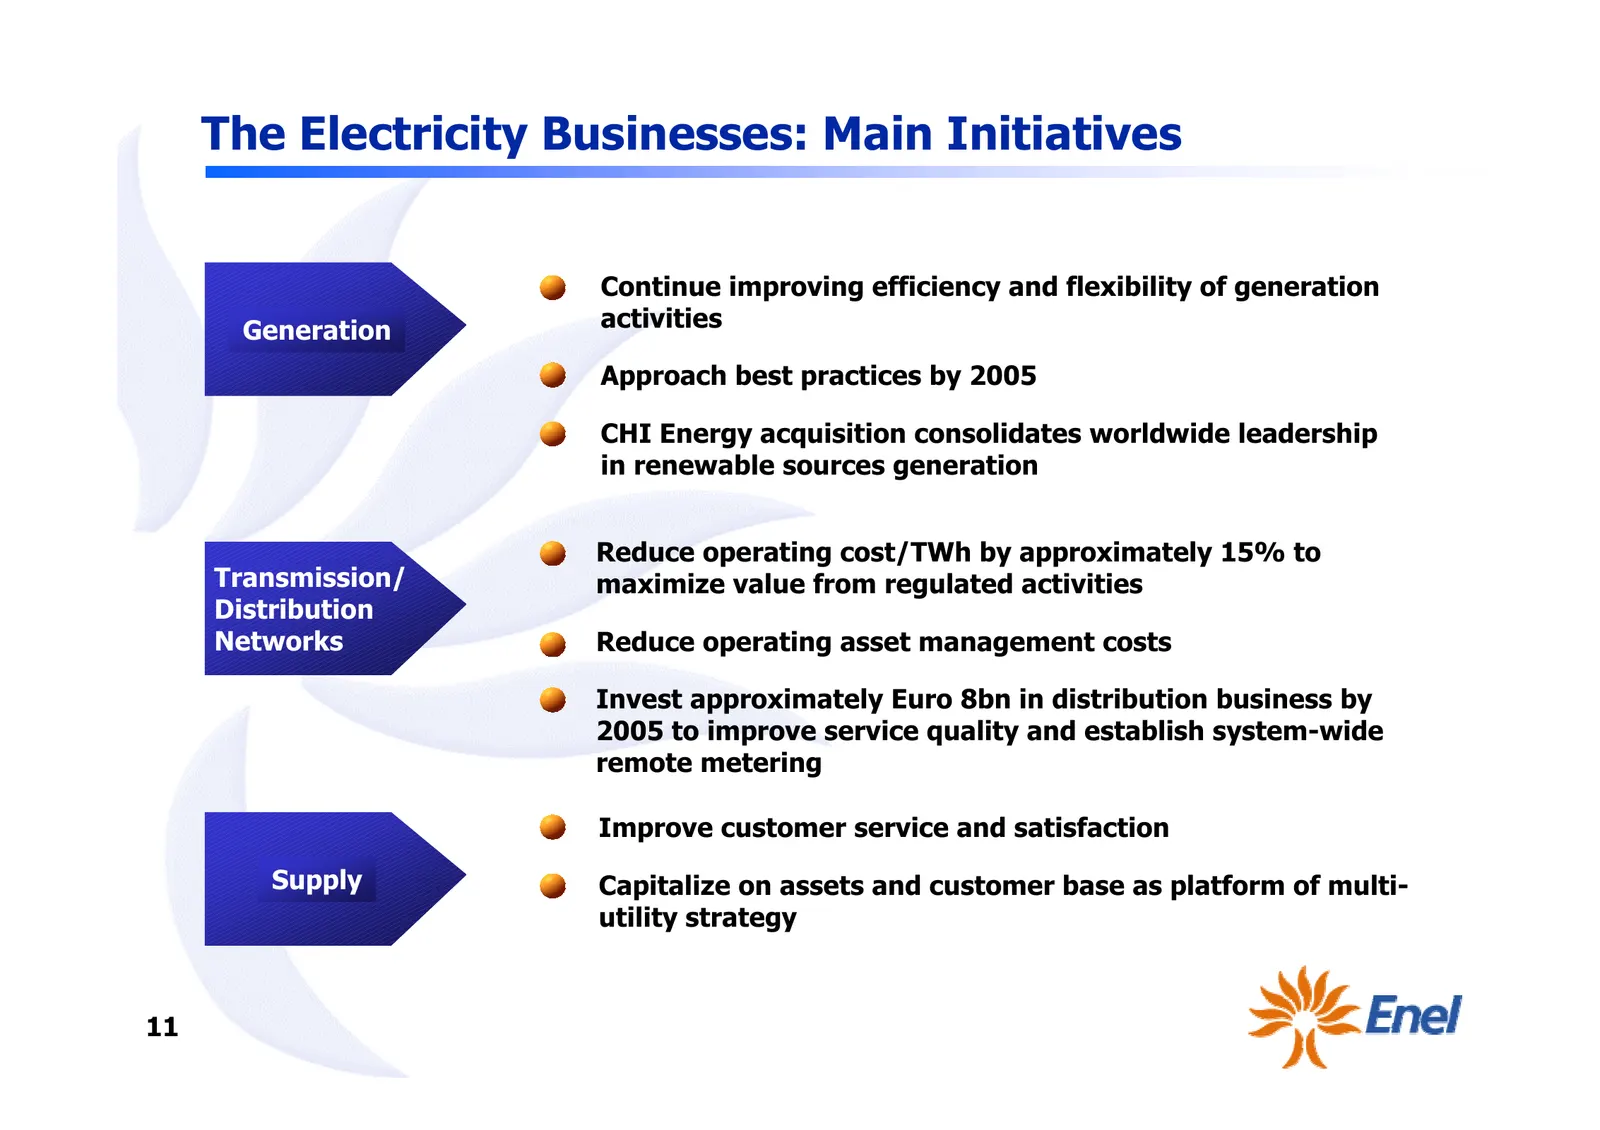
The Electricity Businesses: Main Initiatives • Continue improving efficiency and flexibility of generation Generation activities • Approach best practices by 2005 • CHI Energy acquisition consolidates worldwide leadership in renewable sources generation • Reduce operating cost/TWh by approximately 1
Slide 13: The Electricity Businesses: Enel's Market Shares
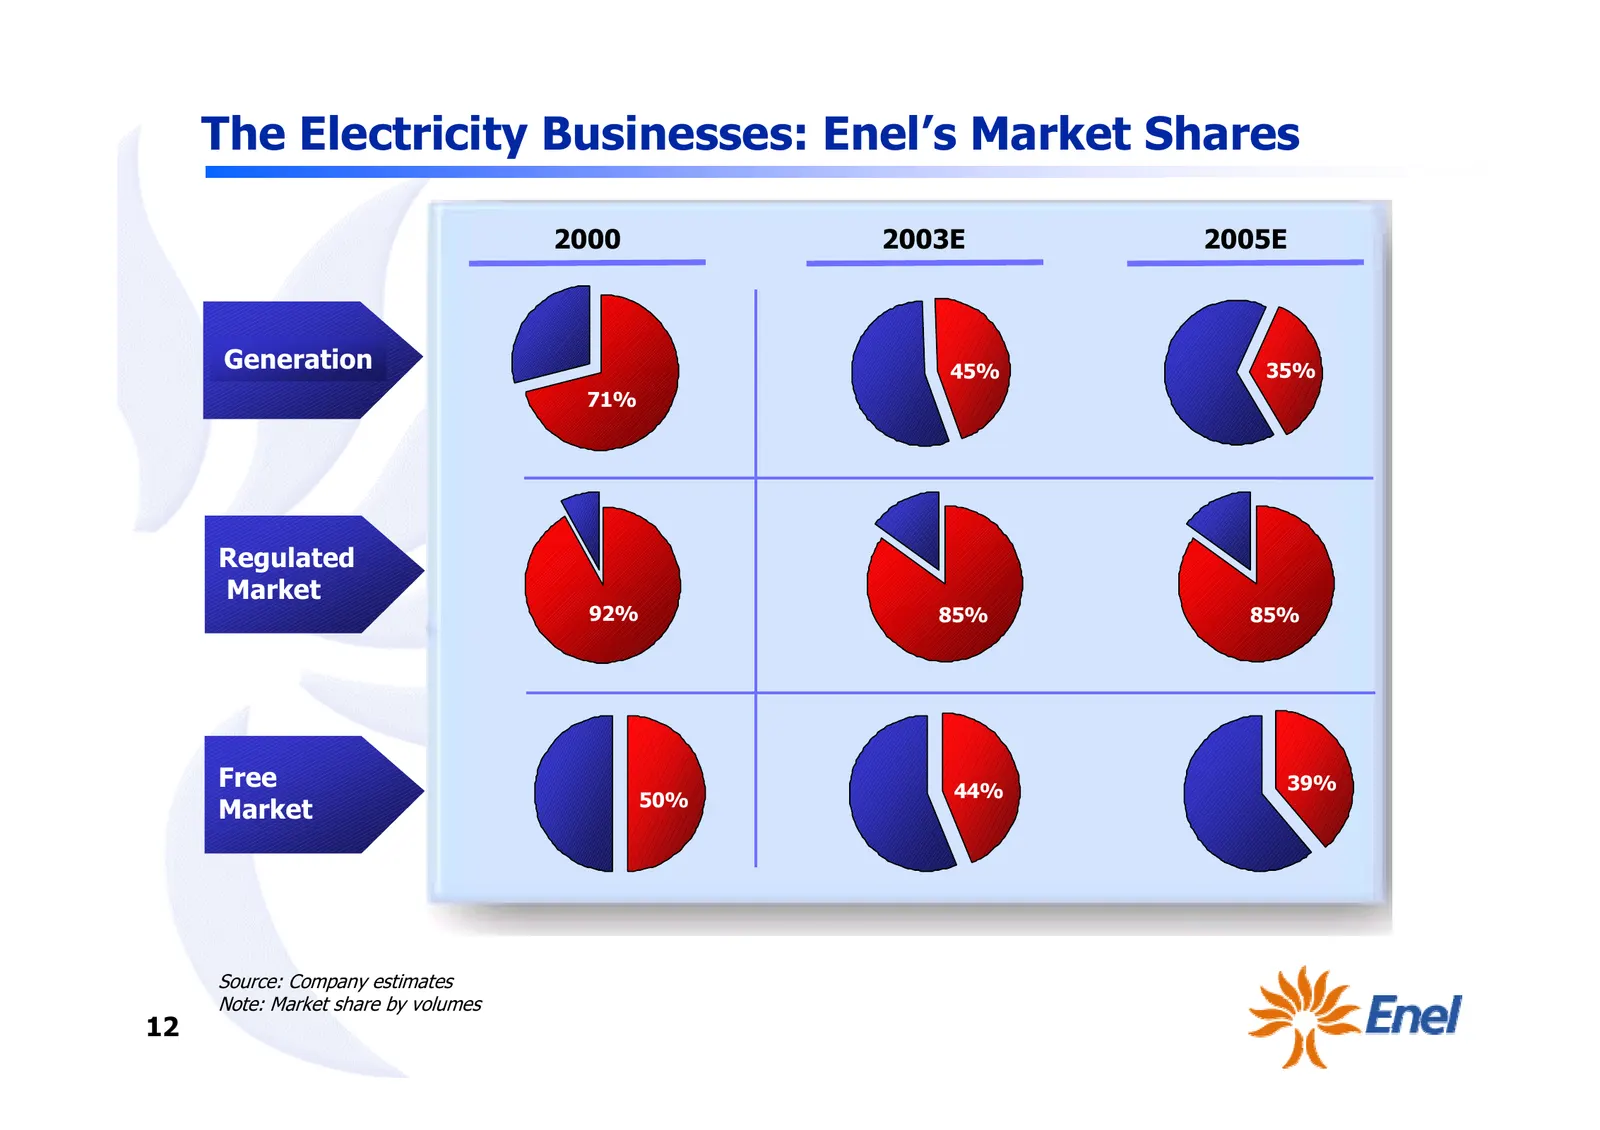
The Electricity Businesses: Enel’s Market Shares 2000 2003E 2005E Generation 45% 35% 71% Regulated Market 92% 85% 85% Free 44% 39% 50% Market Source: Company estimates Note: Market share by volumes 12
Slide 14: Key Strategic Objectives
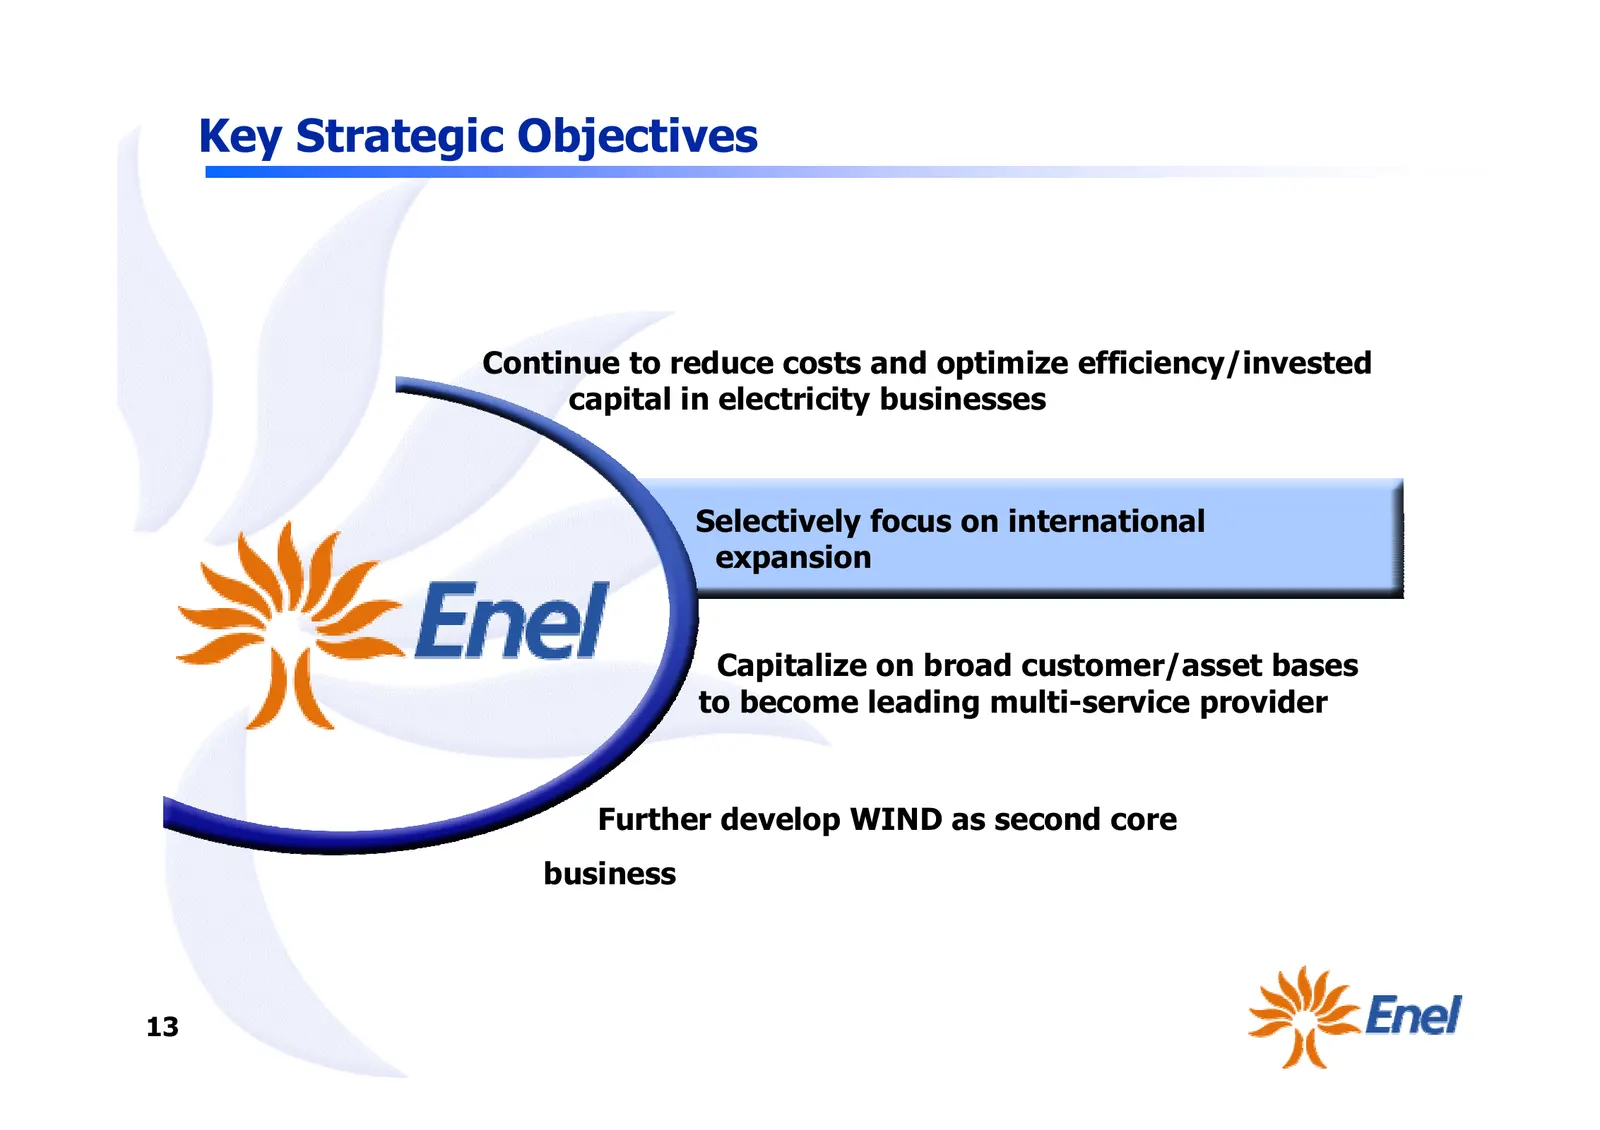
Key Strategic Objectives Continue to reduce costs and optimize efficiency/invested capital in electricity businesses Selectively focus on international expansion Capitalize on broad customer/asset bases to become leading multi-service provider Further develop WIND as second core business 13
Slide 15: International Expansion: Key Targets
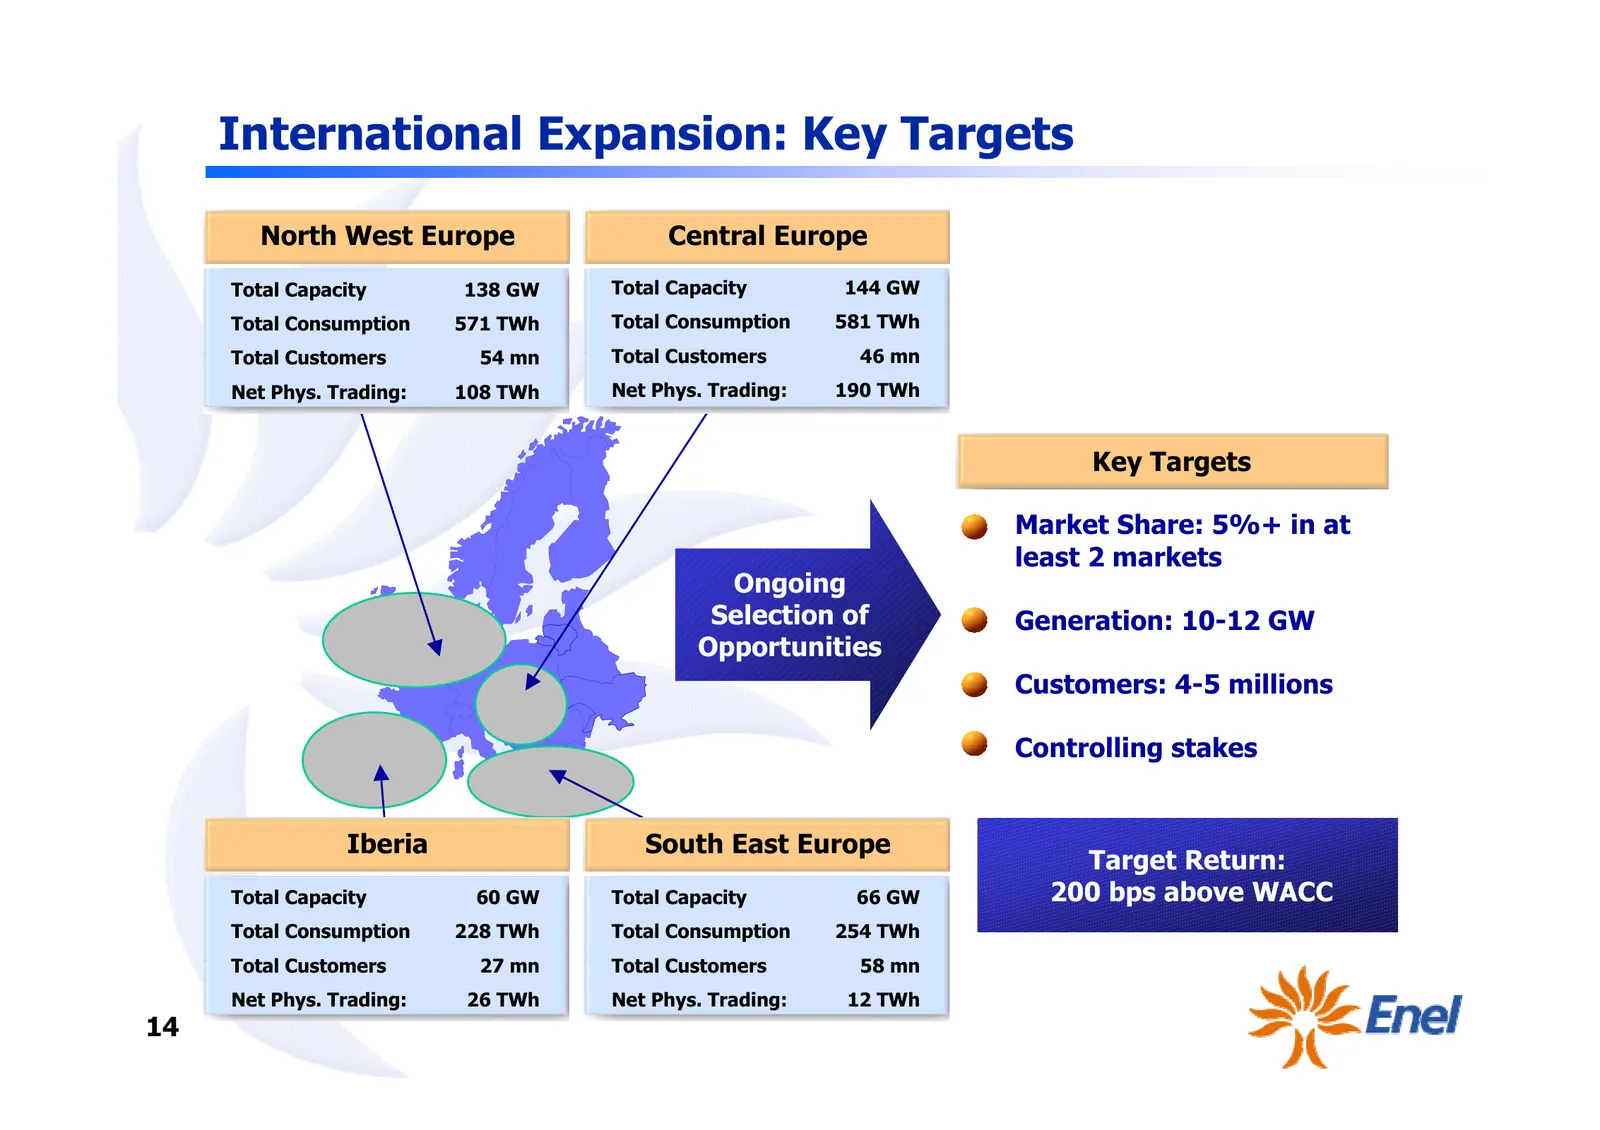
International Expansion: Key Targets North West Europe Central Europe Total Capacity 138 GW Total Capacity 144 GW Total Consumption 571 TWh Total Consumption 581 TWh Total Customers 54 mn Total Customers 46 mn Net Phys. Trading: 108 TWh Net Phys. Trading: 190 TWh Key Targets • Market Share: 5%+ in a
Slide 16: International Expansion: CHI Energy Acquisition
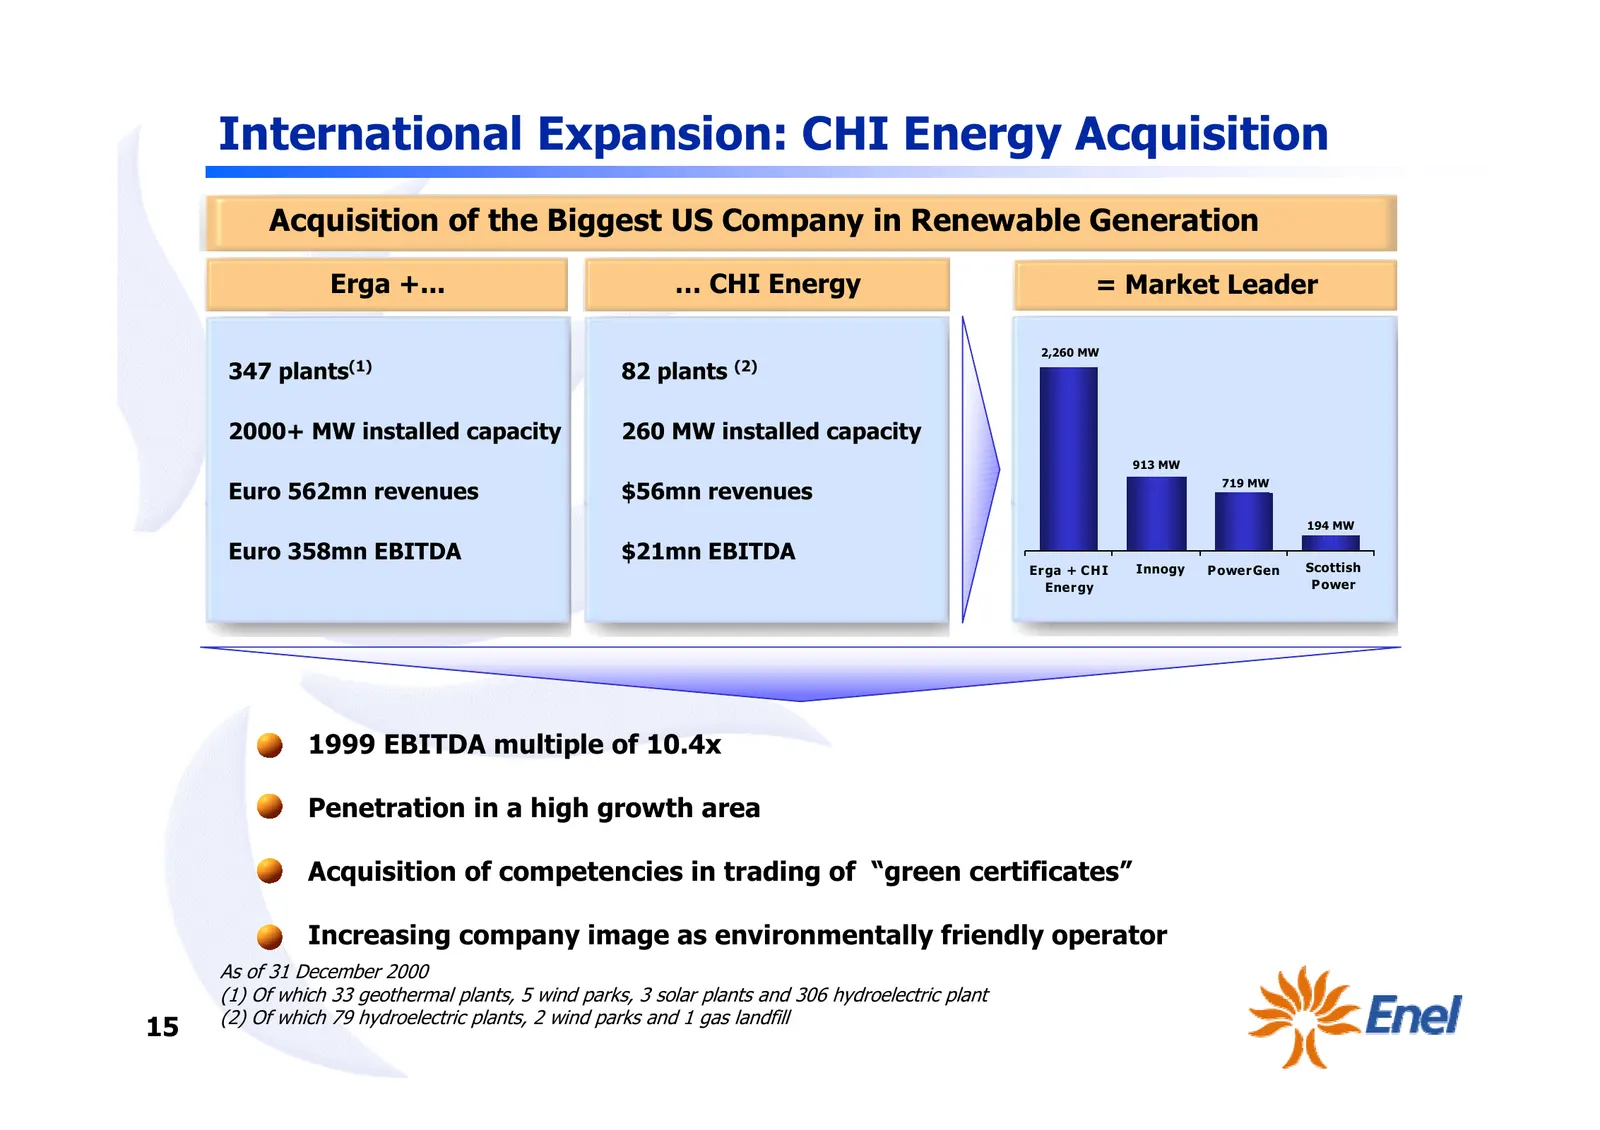
International Expansion: CHI Energy Acquisition Acquisition of the Biggest US Company in Renewable Generation Erga +... … CHI Energy = Market Leader 2,260 MW 347 plants(1) 82 plants (2) 2000+ MW installed capacity 260 MW installed capacity 913 MW 719 MW Euro 562mn revenues $56mn revenues 194 MW Euro
Slide 17: Multi-Utility Services
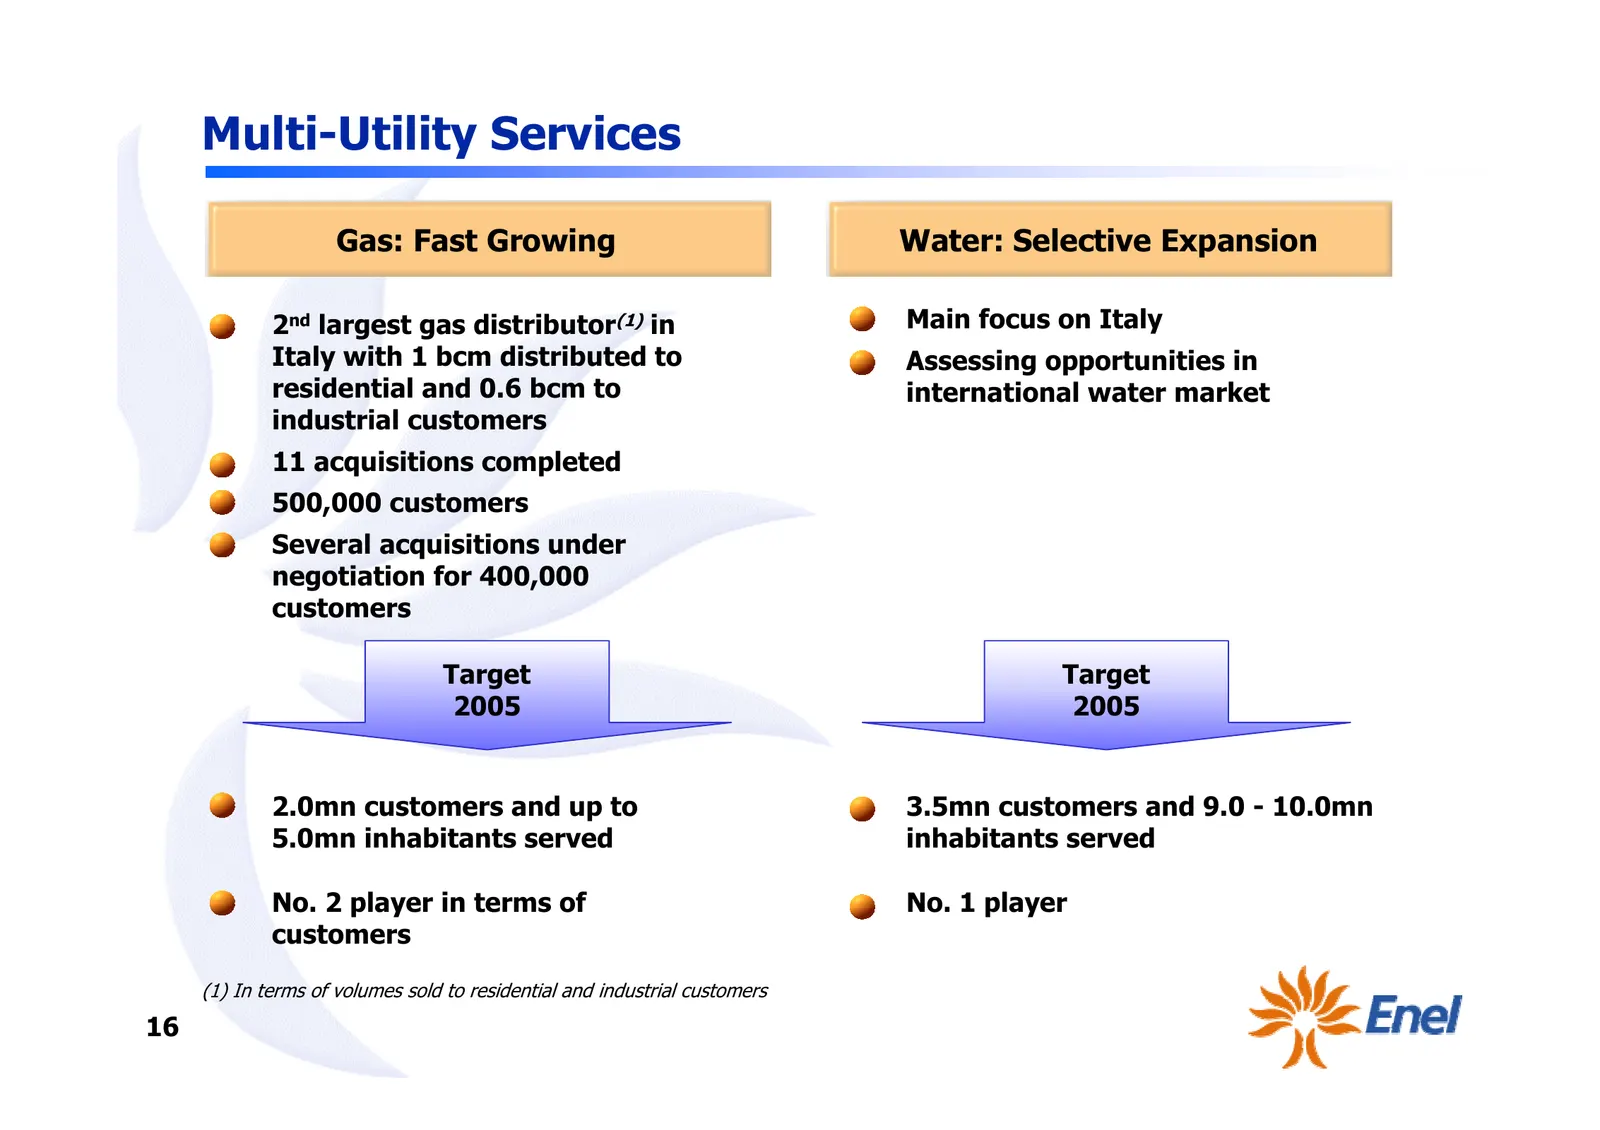
Multi-Utility Services Gas: Fast Growing Water: Selective Expansion • 2nd largest gas distributor(1) in • Main focus on Italy Italy with 1 bcm distributed to • Assessing opportunities in residential and 0.6 bcm to international water market industrial customers • 11 acquisitions completed • 500,000
Slide 18: Telecommunications
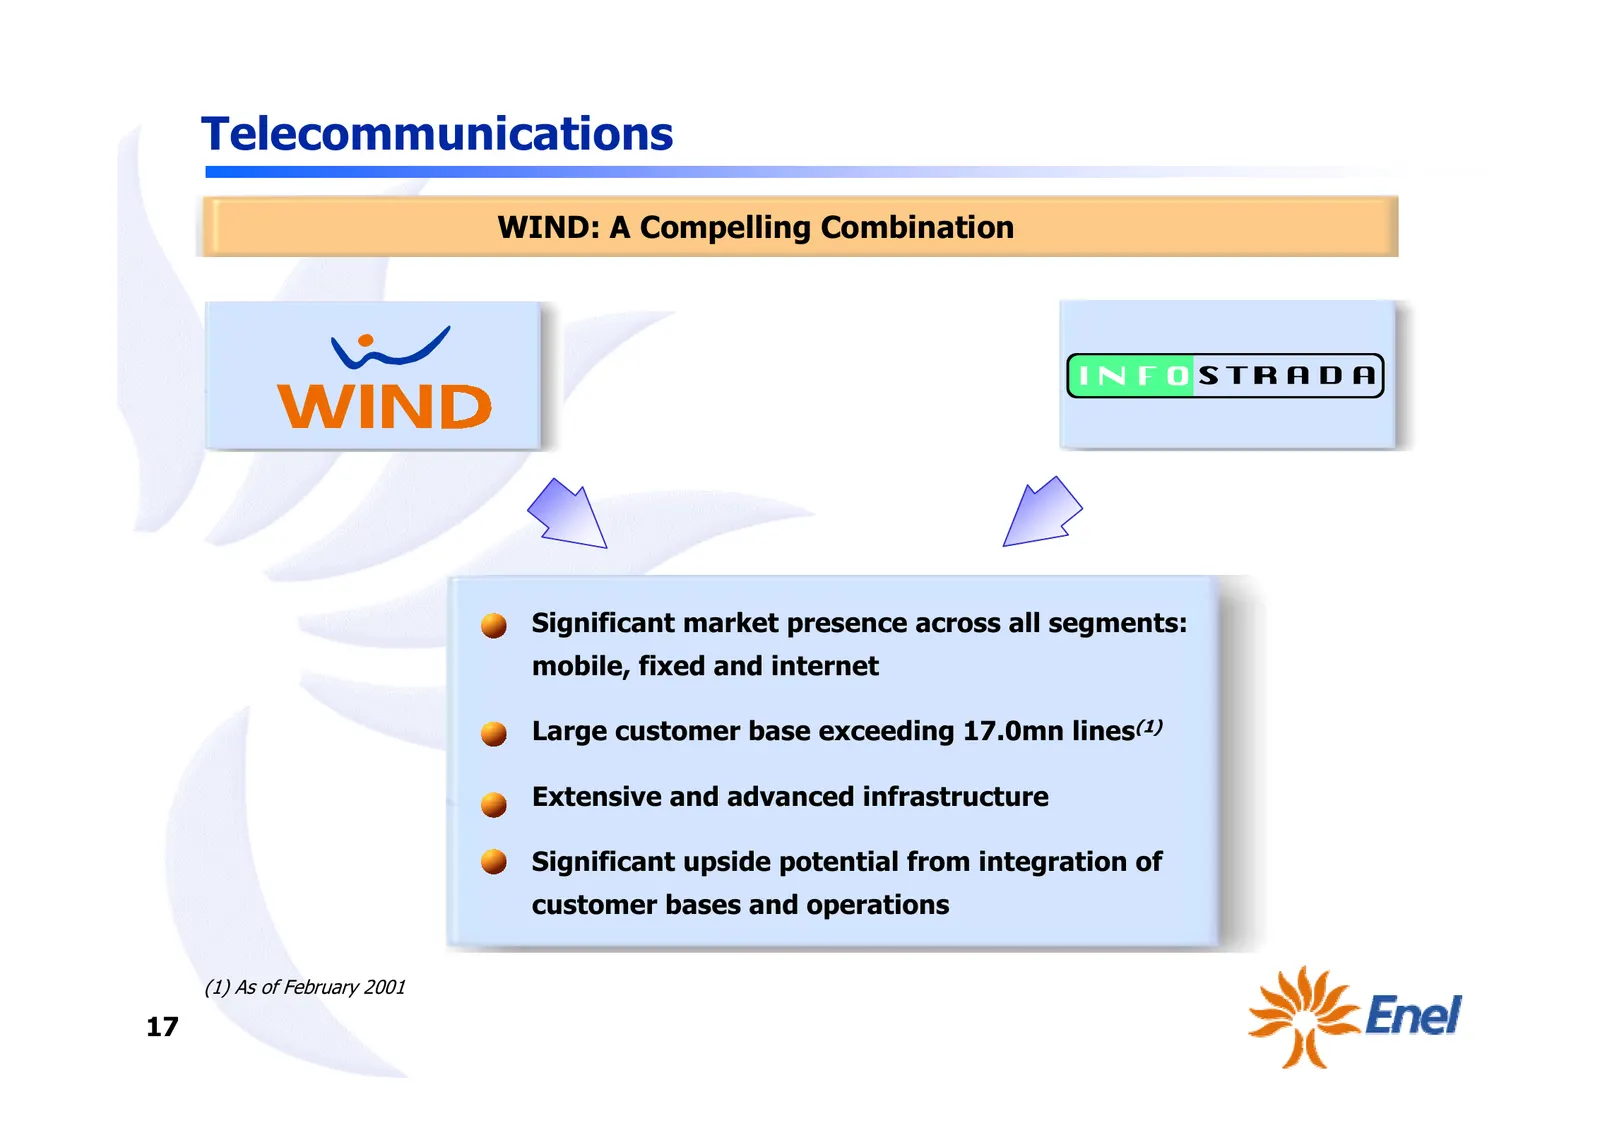
Telecommunications WIND: A Compelling Combination • Significant market presence across all segments: mobile, fixed and internet • Large customer base exceeding 17.0mn lines(1) • Extensive and advanced infrastructure • Significant upside potential from integration of customer bases and operations (1)
Slide 19: Financial Results
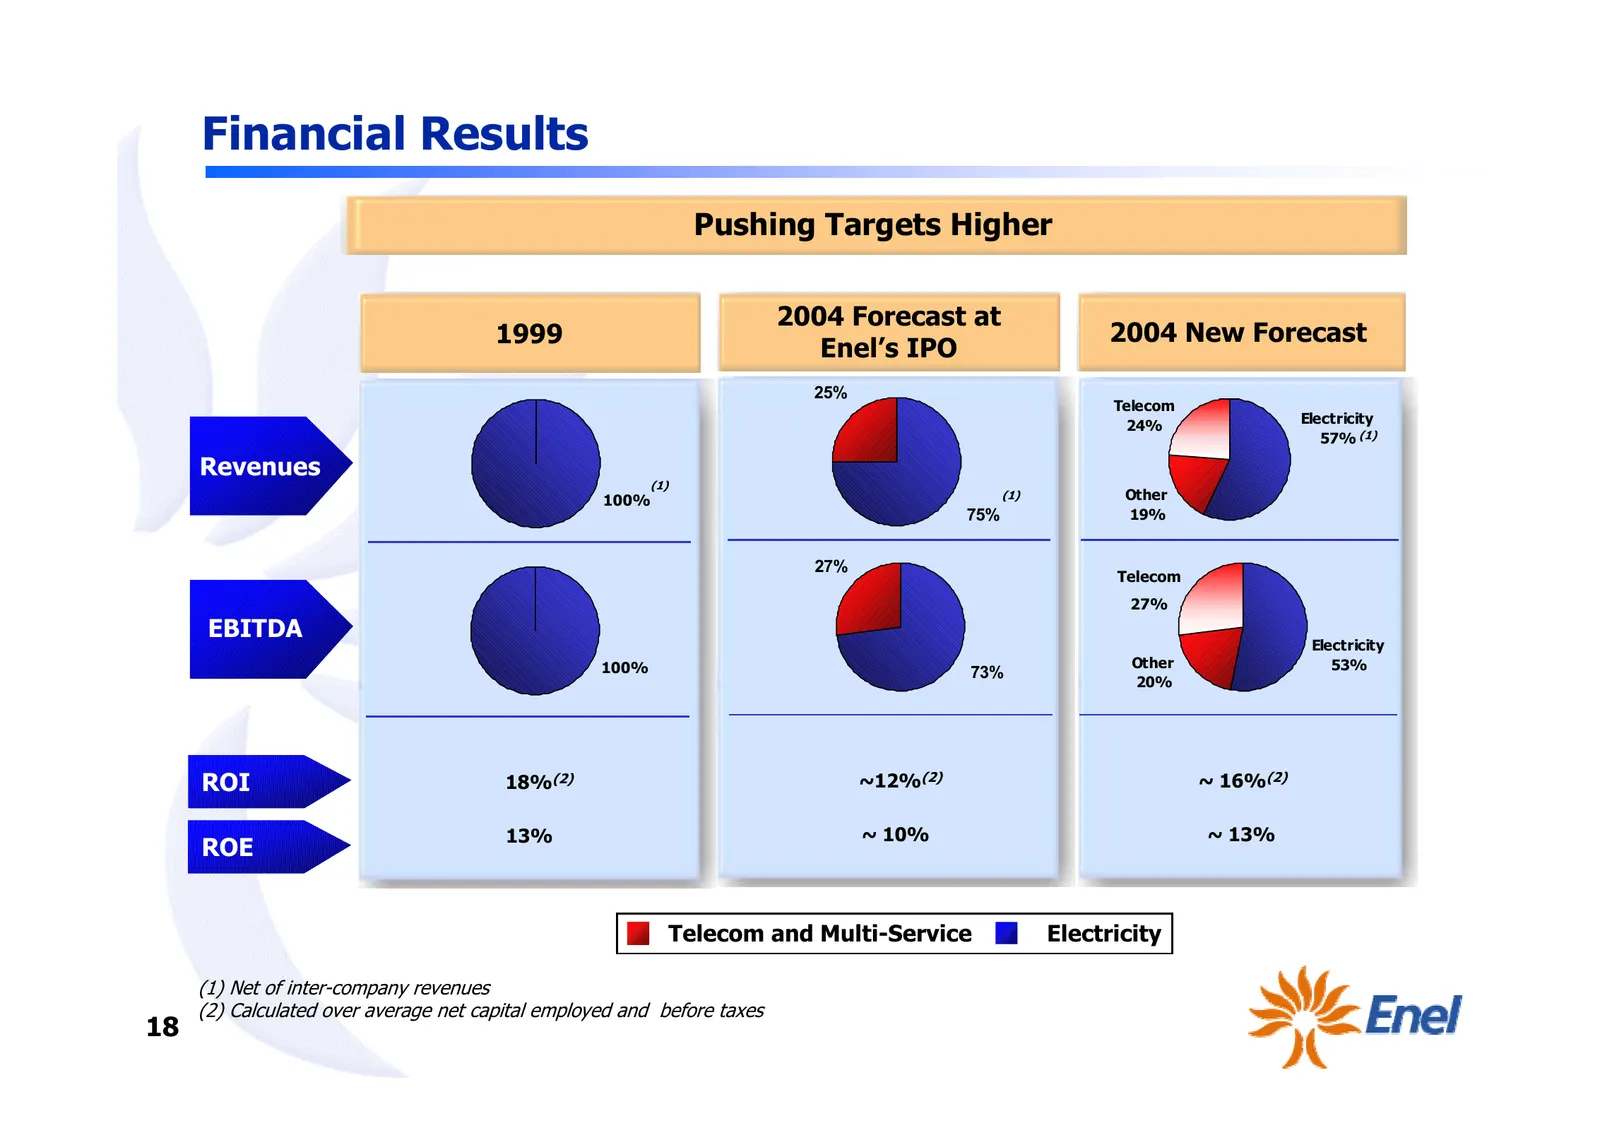
Financial Results Pushing Targets Higher 2004 Forecast at 1999 2004 New Forecast Enel’s IPO 25% Telecom 24% Electricity 57% (1) Revenues (1) 100% (1) Other 75% 19% 27% Telecom 27% EBITDA Electricity 100% Other 53% 73% 20% ROI 18%(2) ~12%(2) ~ 16%(2) 13% ~ 10% ~ 13% ROE Telecom and Multi-Service Elec
Slide 20: Competitive Dividend Policy
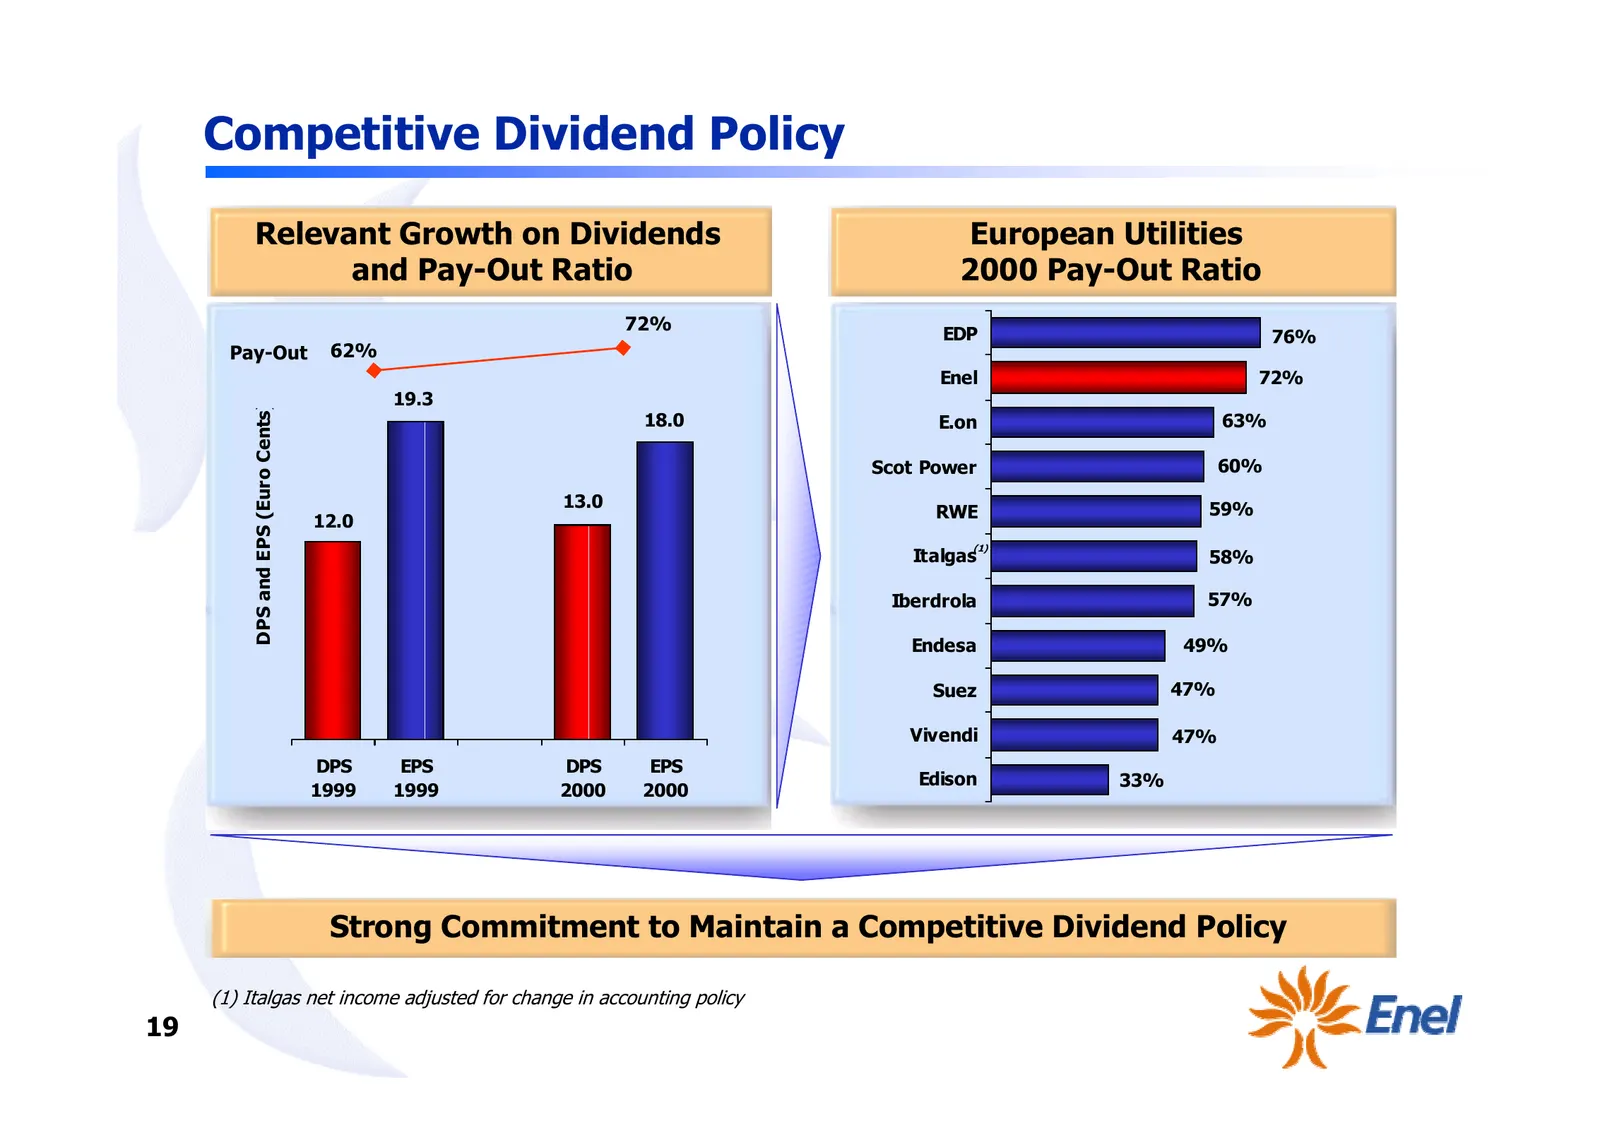
Competitive Dividend Policy Relevant Growth on Dividends European Utilities and Pay-Out Ratio 2000 Pay-Out Ratio 72% EDP 76% Pay-Out 62% Enel 72% 19.3 DPS and EPS (Euro Cents) 18.0 E.on 63% Scot Power 60% 13.0 59% RWE 12.0 (1) Italgas 58% Iberdrola 57% Endesa 49% Suez 47% Vivendi 47% DPS EPS DPS EPS
Slide 21: Implementing the Strategy
Implementing the Strategy Mario Barozzi

Slide 22

Slide 23

Slide 24

Slide 25

Slide 26

Slide 27

Slide 28

Slide 29

Slide 30

Slide 31

Slide 32

Slide 33

Slide 34

Slide 35

Slide 36

Slide 37

Slide 38
Slide 39: New WIND
New WIND Tommaso Pompei
Slide 40: Key Strategic Objectives
Key Strategic Objectives Continue to reduce costs and optimize efficiency/invested capital in electricity businesses Selectively focus on international expansion Capitalize on broad customer/asset bases to become leading multi-service provider Further develop New WIND as second core business 1
Slide 41: New WIND: Sole Challenger to the Incumbent
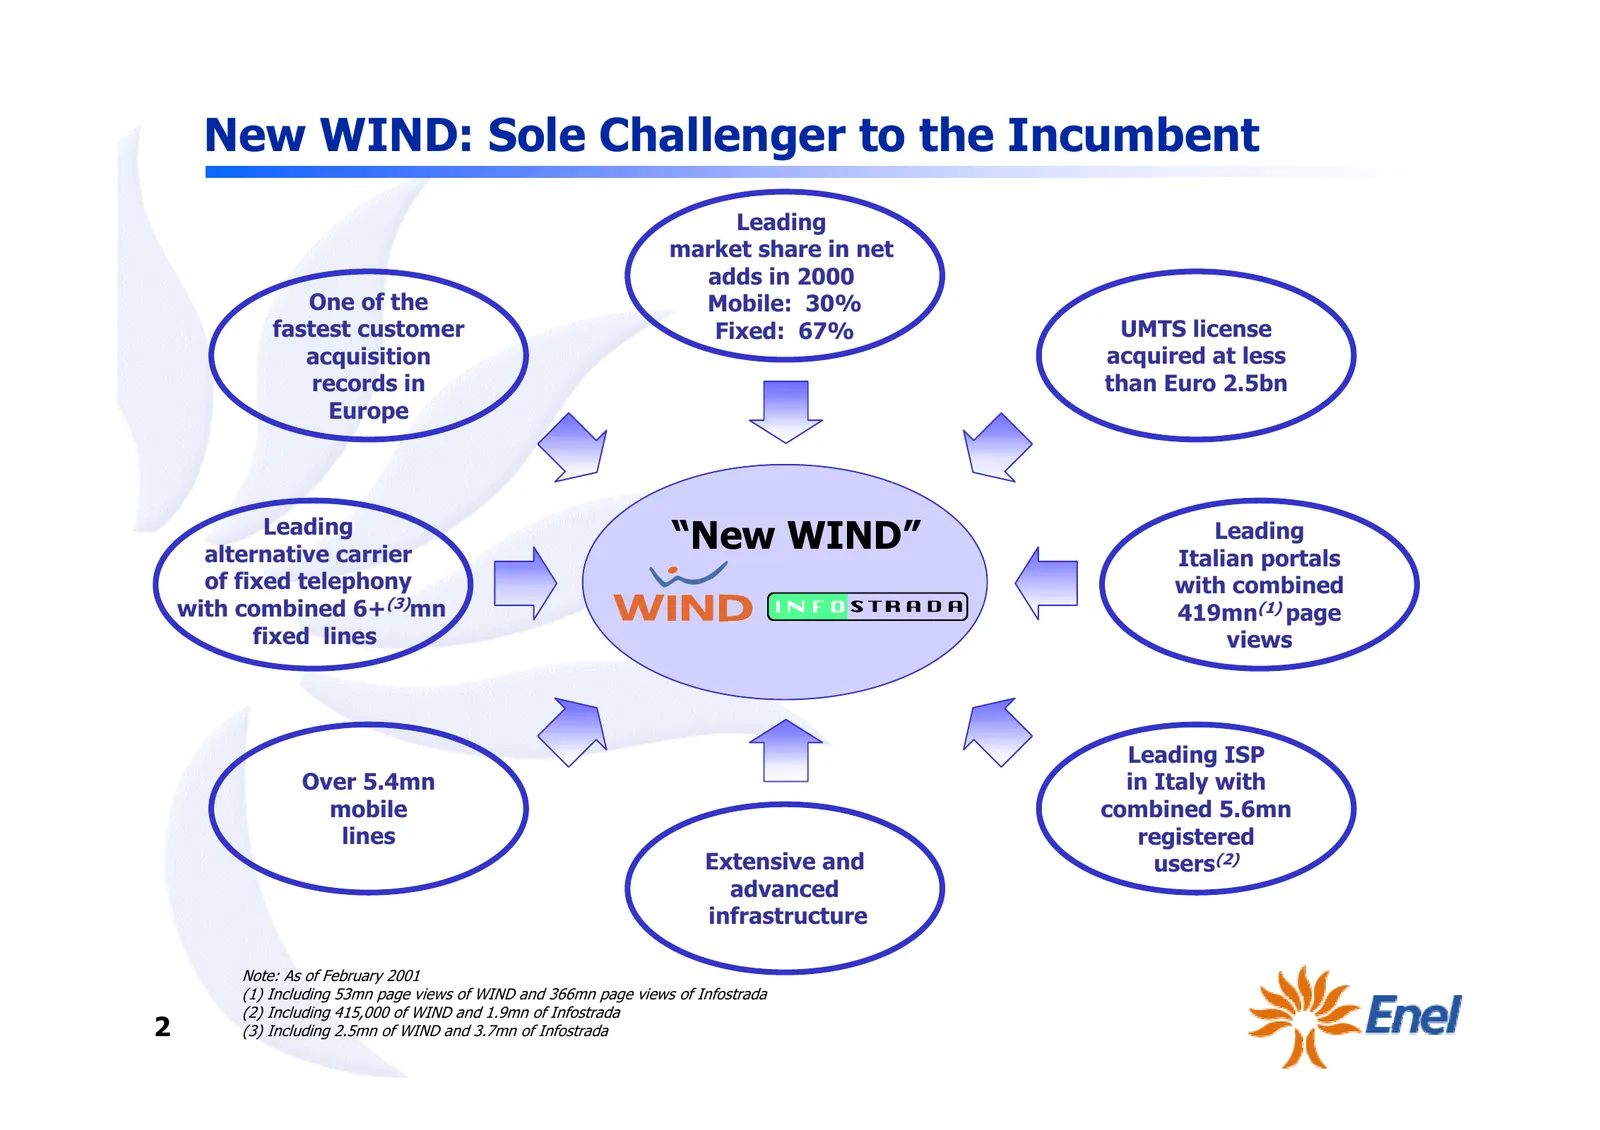
New WIND: Sole Challenger to the Incumbent Leading market share in net adds in 2000 One of the Mobile: 30% fastest customer Fixed: 67% UMTS license acquisition acquired at less records in than Euro 2.5bn Europe Leading alternative carrier “New WIND” Leading Italian portals of fixed telephony with co

Slide 42

Slide 43

Slide 44

Slide 45

Slide 46

Slide 47

Slide 48

Slide 49

Slide 50

Slide 51

Slide 52
Slide 53: Financial Highlights
Financial Highlights Fulvio Conti
Slide 54: Year 2000 Results at a Glance
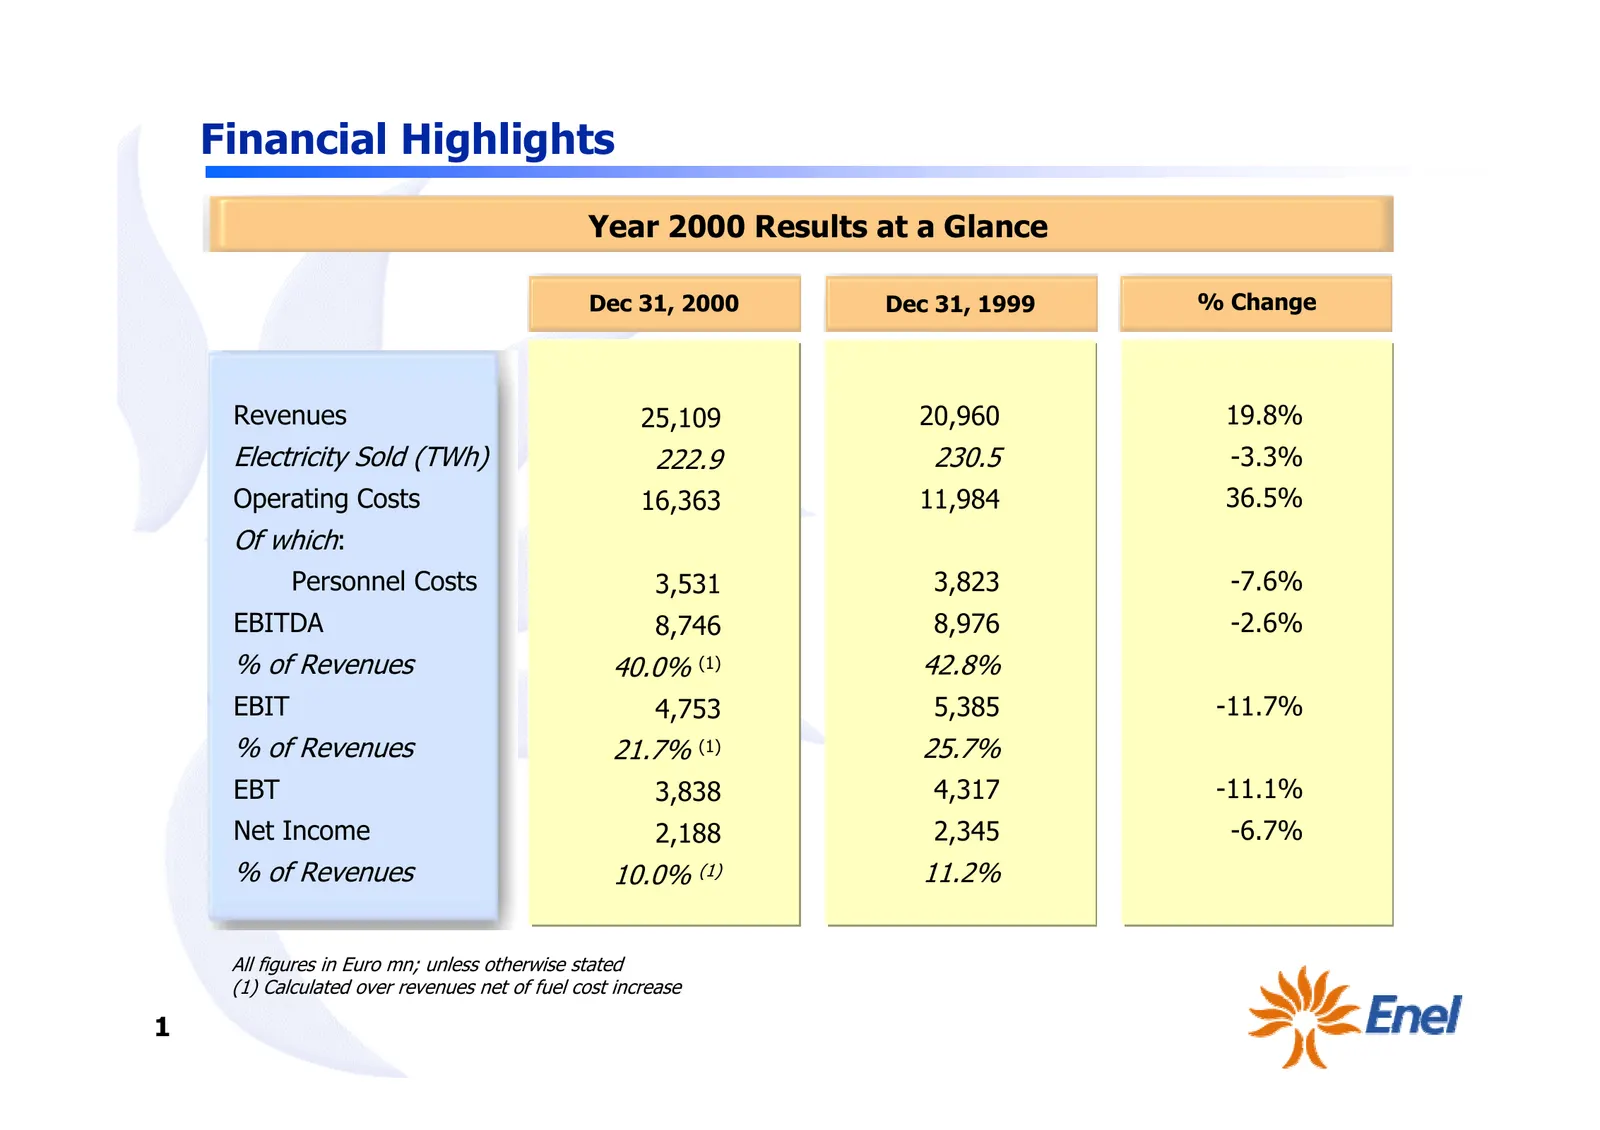
Financial Highlights Year 2000 Results at a Glance Dec 31, 2000 Dec 31, 1999 % Change Revenues 25,109 20,960 19.8% Electricity Sold (TWh) 222.9 230.5 -3.3% Operating Costs 16,363 11,984 36.5% Of which: Personnel Costs 3,531 3,823 -7.6% EBITDA 8,746 8,976 -2.6% % of Revenues 40.0% (1) 42.8% EBIT 4,75
Slide 55: Year 2000 Results at a Glance - Cont'd
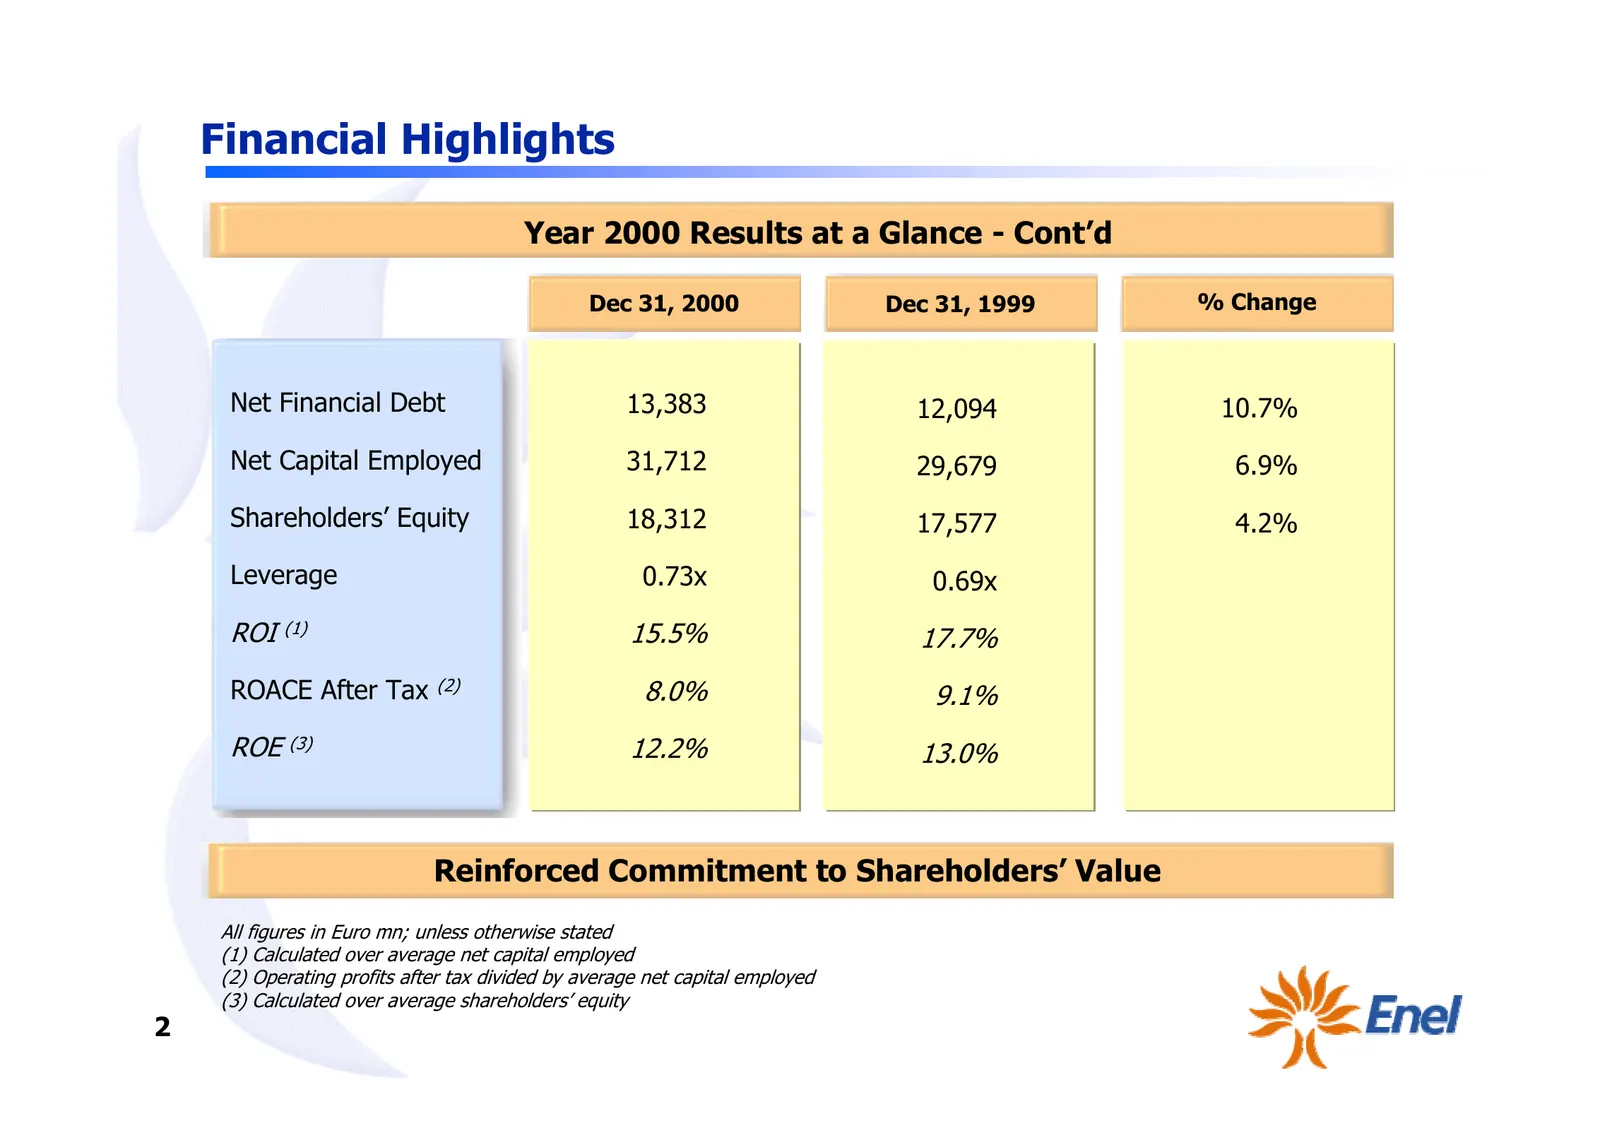
Financial Highlights Year 2000 Results at a Glance - Cont’d Dec 31, 2000 Dec 31, 1999 % Change Net Financial Debt 13,383 12,094 10.7% Net Capital Employed 31,712 29,679 6.9% Shareholders’ Equity 18,312 17,577 4.2% Leverage 0.73x 0.69x ROI (1) 15.5% 17.7% ROACE After Tax (2) 8.0% 9.1% ROE (3) 12.2% 1
Slide 56: Managing the Tariff Cut
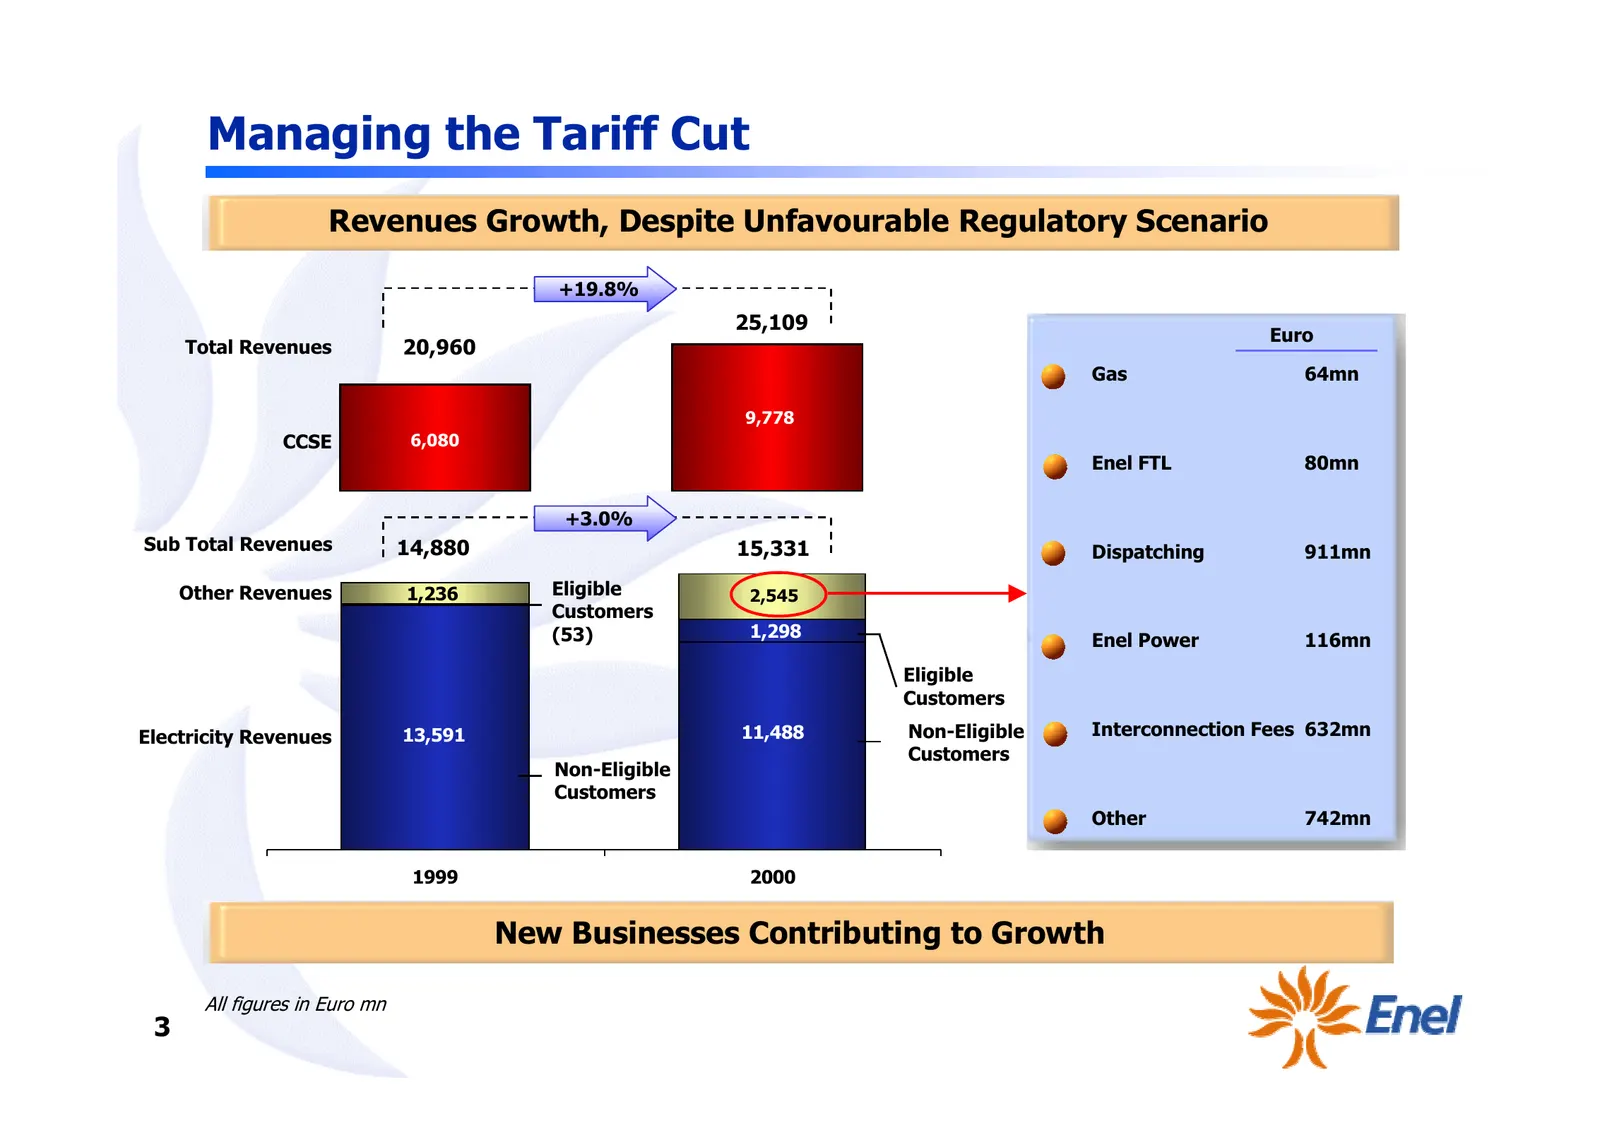
Managing the Tariff Cut Revenues Growth, Despite Unfavourable Regulatory Scenario +19.8% 25,109 Euro Total Revenues 20,960 • Gas 64mn 9,778 9,778 CCSE 6,080 • Enel FTL 80mn +3.0% Sub Total Revenues 14,880 15,331 • Dispatching 911mn Other Revenues 1,236 Eligible 2,545 Customers (53) 1,298 • Enel Powe
Slide 57: Electricity Revenue Evolution
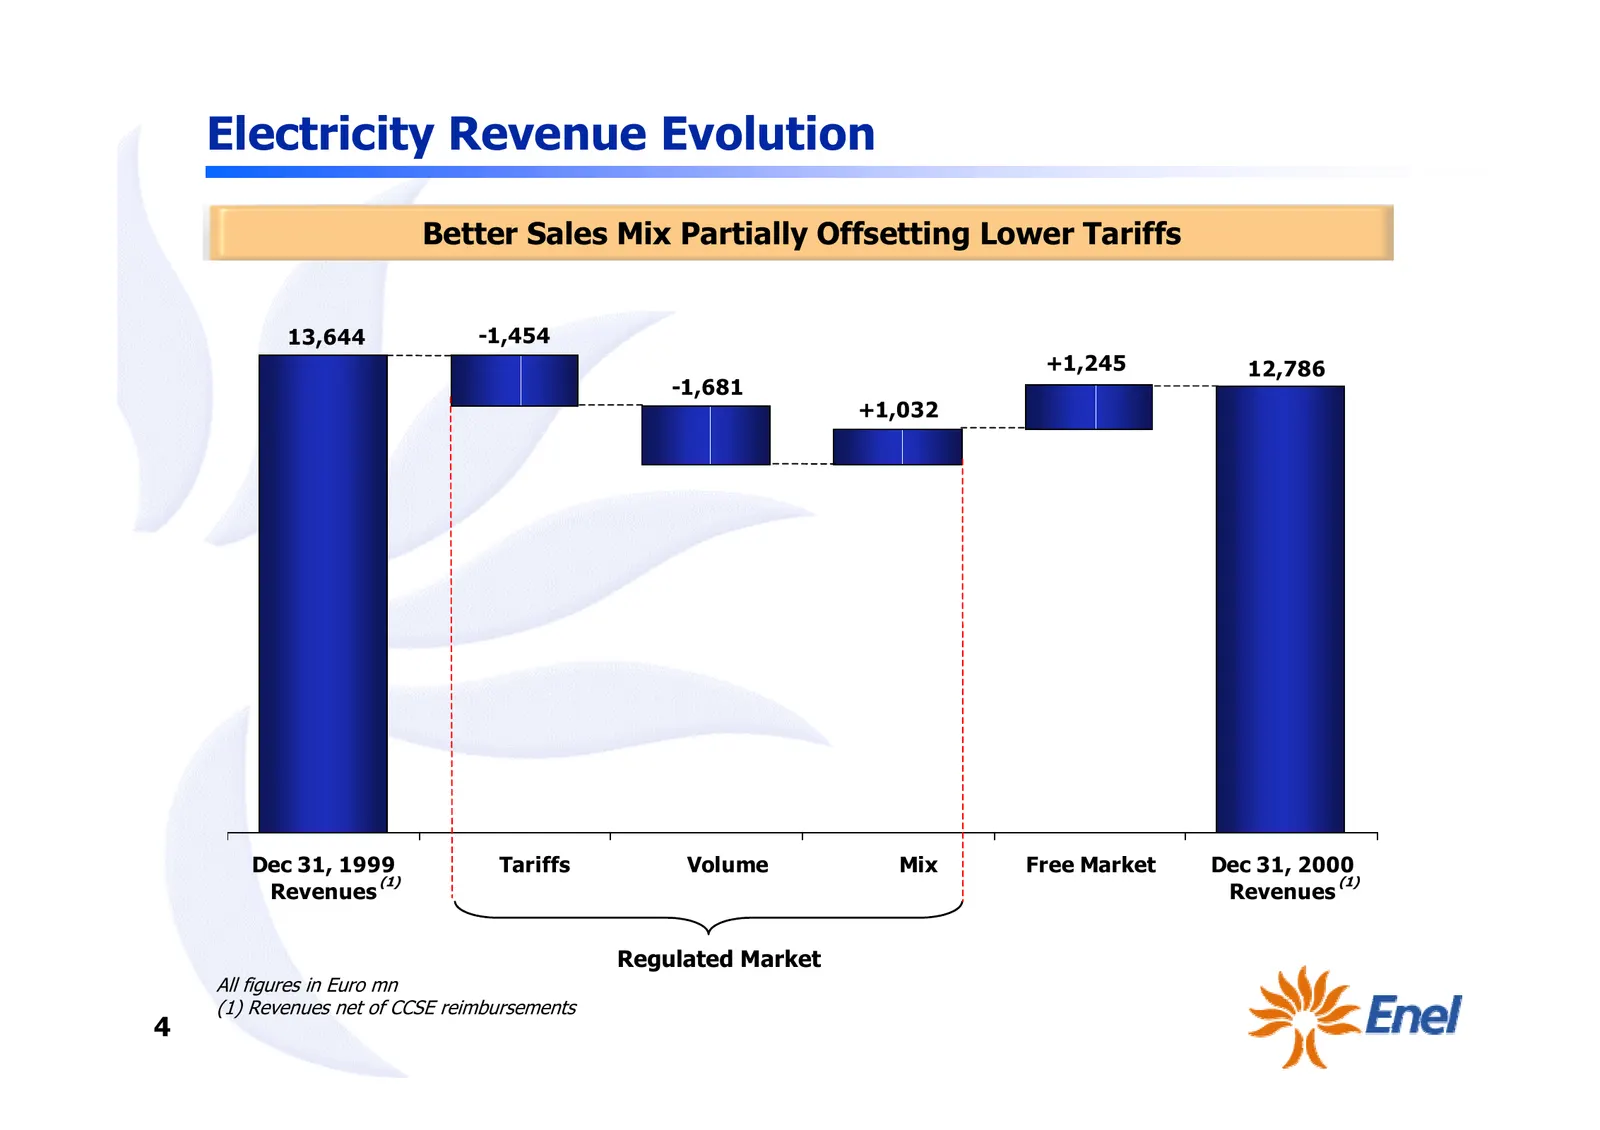
Electricity Revenue Evolution Better Sales Mix Partially Offsetting Lower Tariffs 13,644 -1,454 +1,245 12,786 -1,681 +1,032 Dec 31, 1999 ∆ Tariffs ∆ Volume ∆ Mix Free Market Dec 31, 2000 (1) (1) Revenues Revenues Regulated Market All figures in Euro mn (1) Revenues net of CCSE reimbursements 4
Slide 58: Establishing the Leading Share in the Free Market
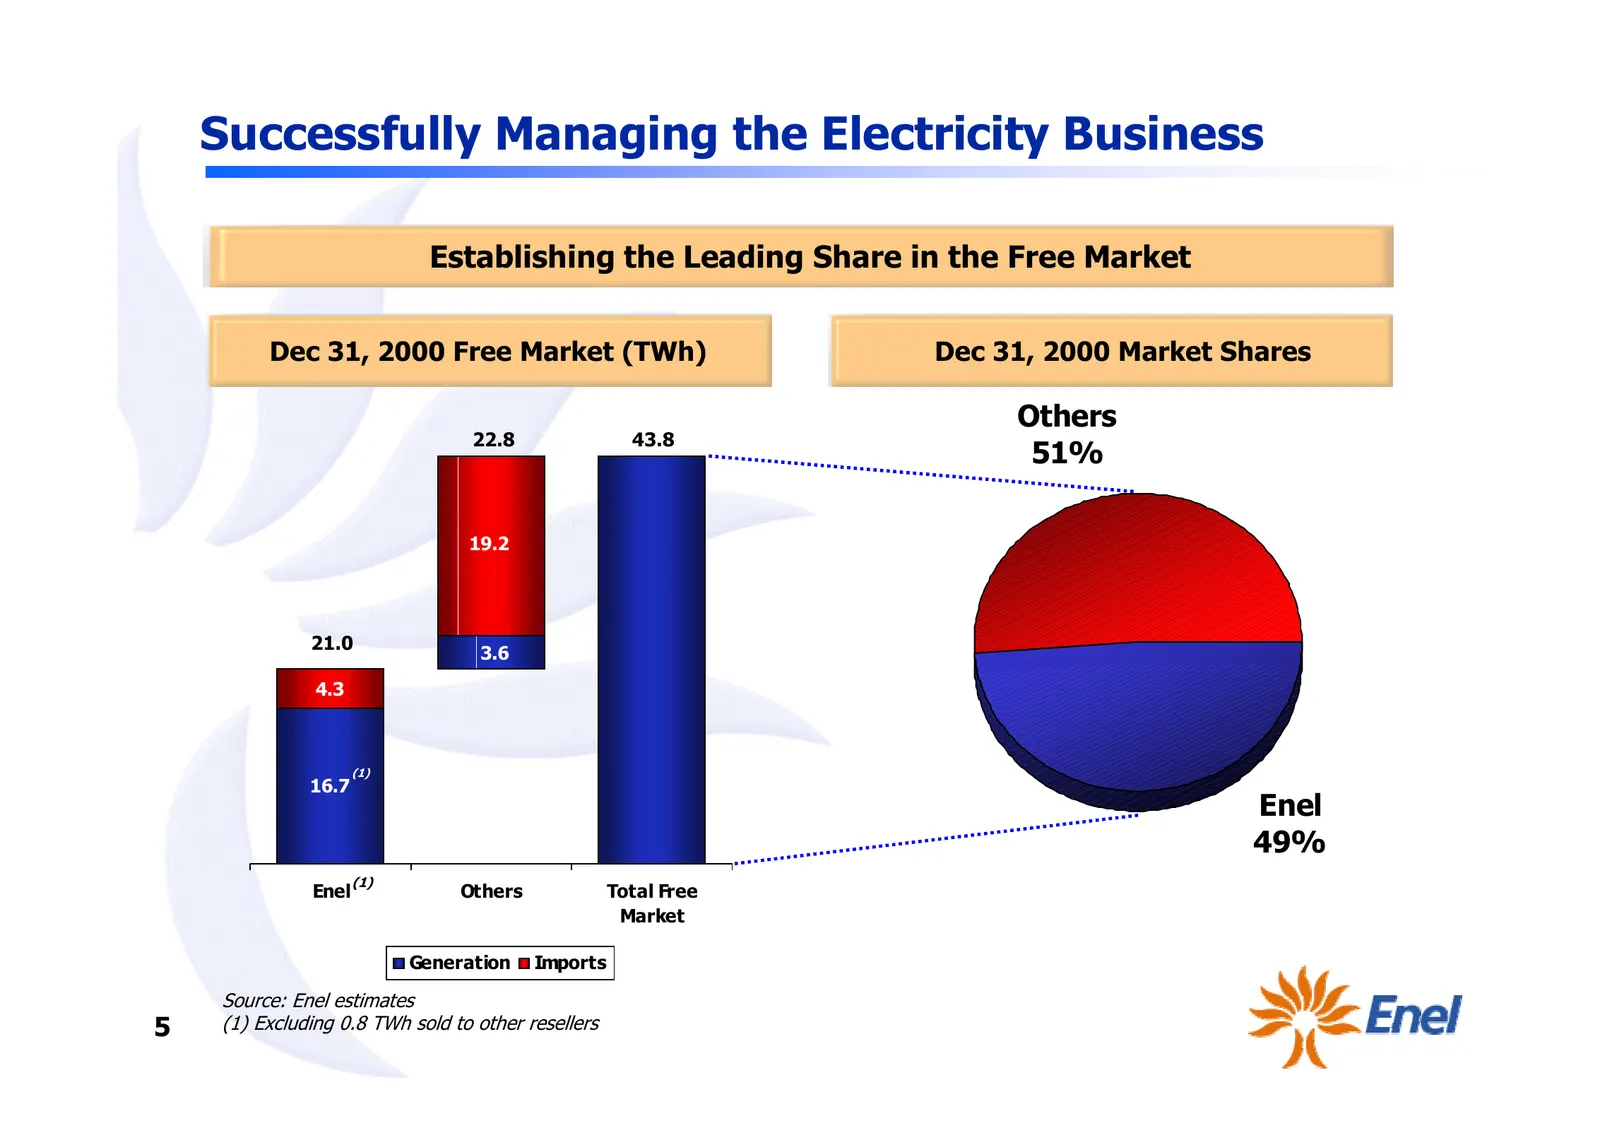
Successfully Managing the Electricity Business Establishing the Leading Share in the Free Market Dec 31, 2000 Free Market (TWh) Dec 31, 2000 Market Shares 43.8 Others 22.8 43.8 51% 19.2 21.0 3.6 4.3 (1) 16.7 Enel 49% (1) Enel Others Total Free Market Generation Imports Source: Enel estimates 5 (1) E
Slide 59: Higher Low Voltage Volumes Partially Offset Market Opening
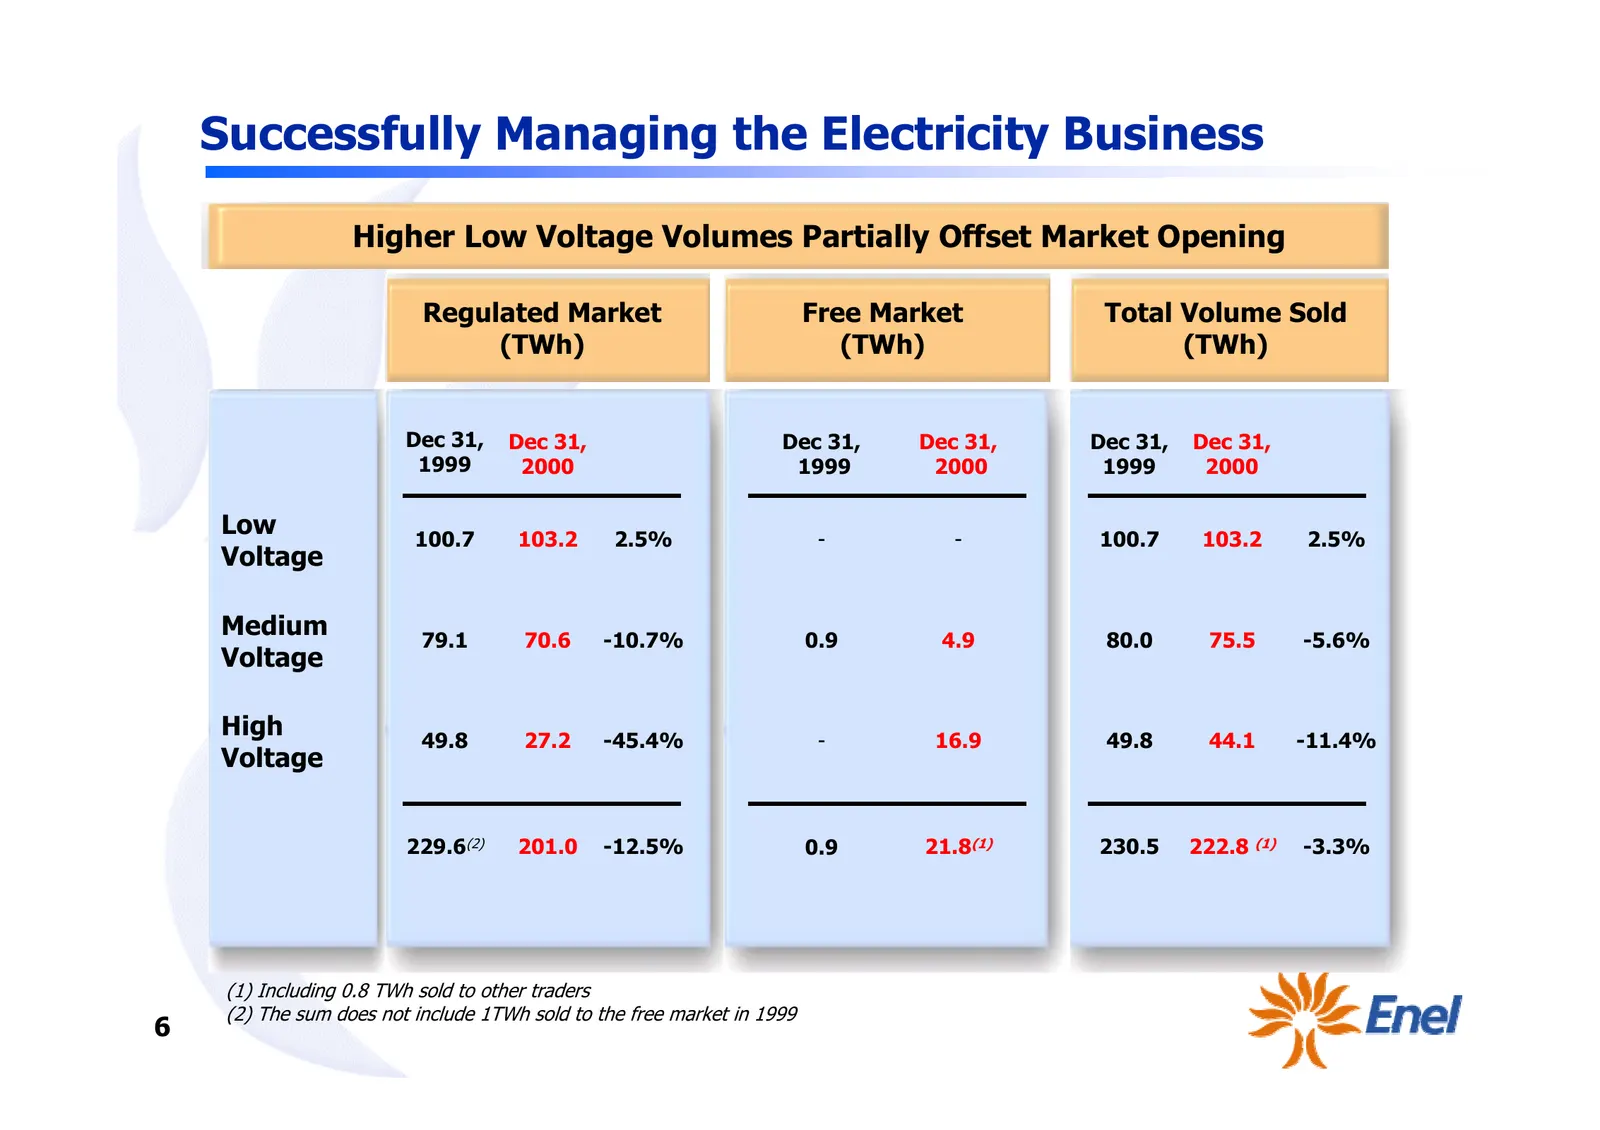
Successfully Managing the Electricity Business Higher Low Voltage Volumes Partially Offset Market Opening Regulated Market Free Market Total Volume Sold (TWh) (TWh) (TWh) Dec 31, Dec 31, Dec 31, Dec 31, Dec 31, Dec 31, 1999 2000 1999 2000 1999 2000 Low 100.7 103.2 2.5% - - 100.7 103.2 2.5% Voltage M
Slide 60: Reduction in Cost of Labour and Cost per Employee
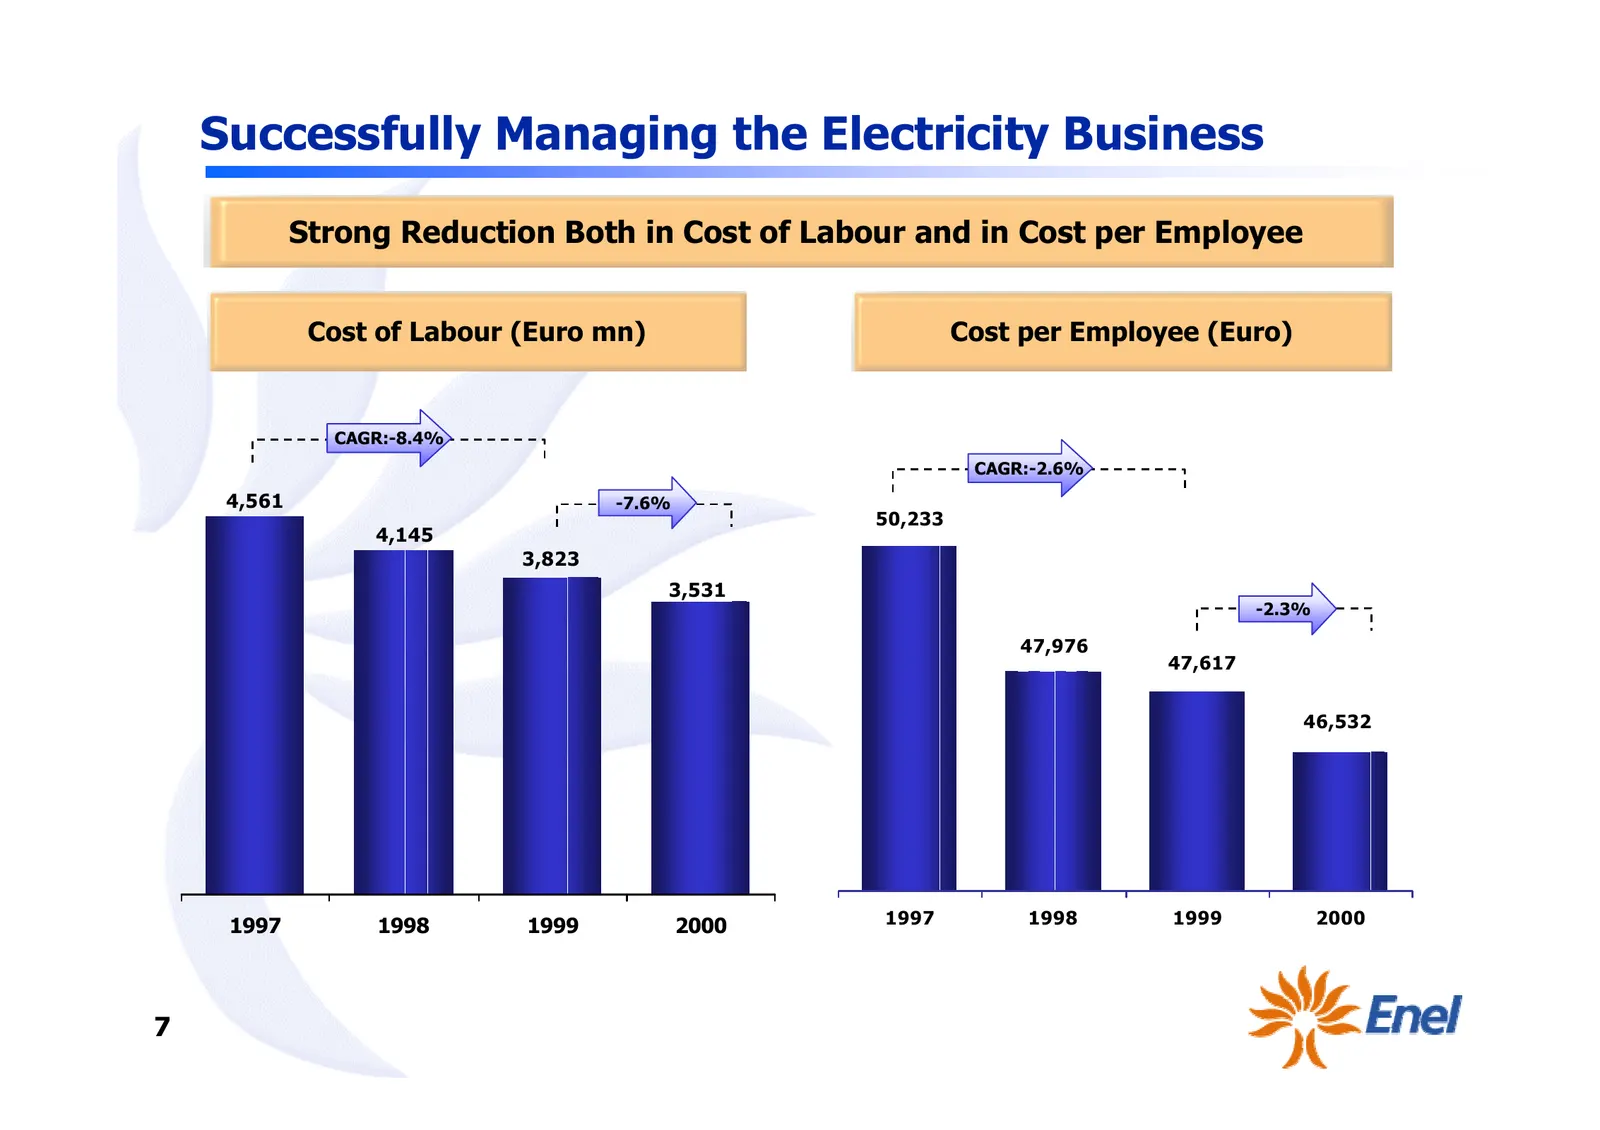
Successfully Managing the Electricity Business Strong Reduction Both in Cost of Labour and in Cost per Employee Cost of Labour (Euro mn) Cost per Employee (Euro) CAGR:-8.4% CAGR:-2.6% 4,561 -7.6% 50,233 4,145 3,823 3,531 -2.3% 47,976 47,617 46,532 1997 1998 1999 2000 1997 1998 1999 2000 7
Slide 61: Personnel Reduction Ahead of Target
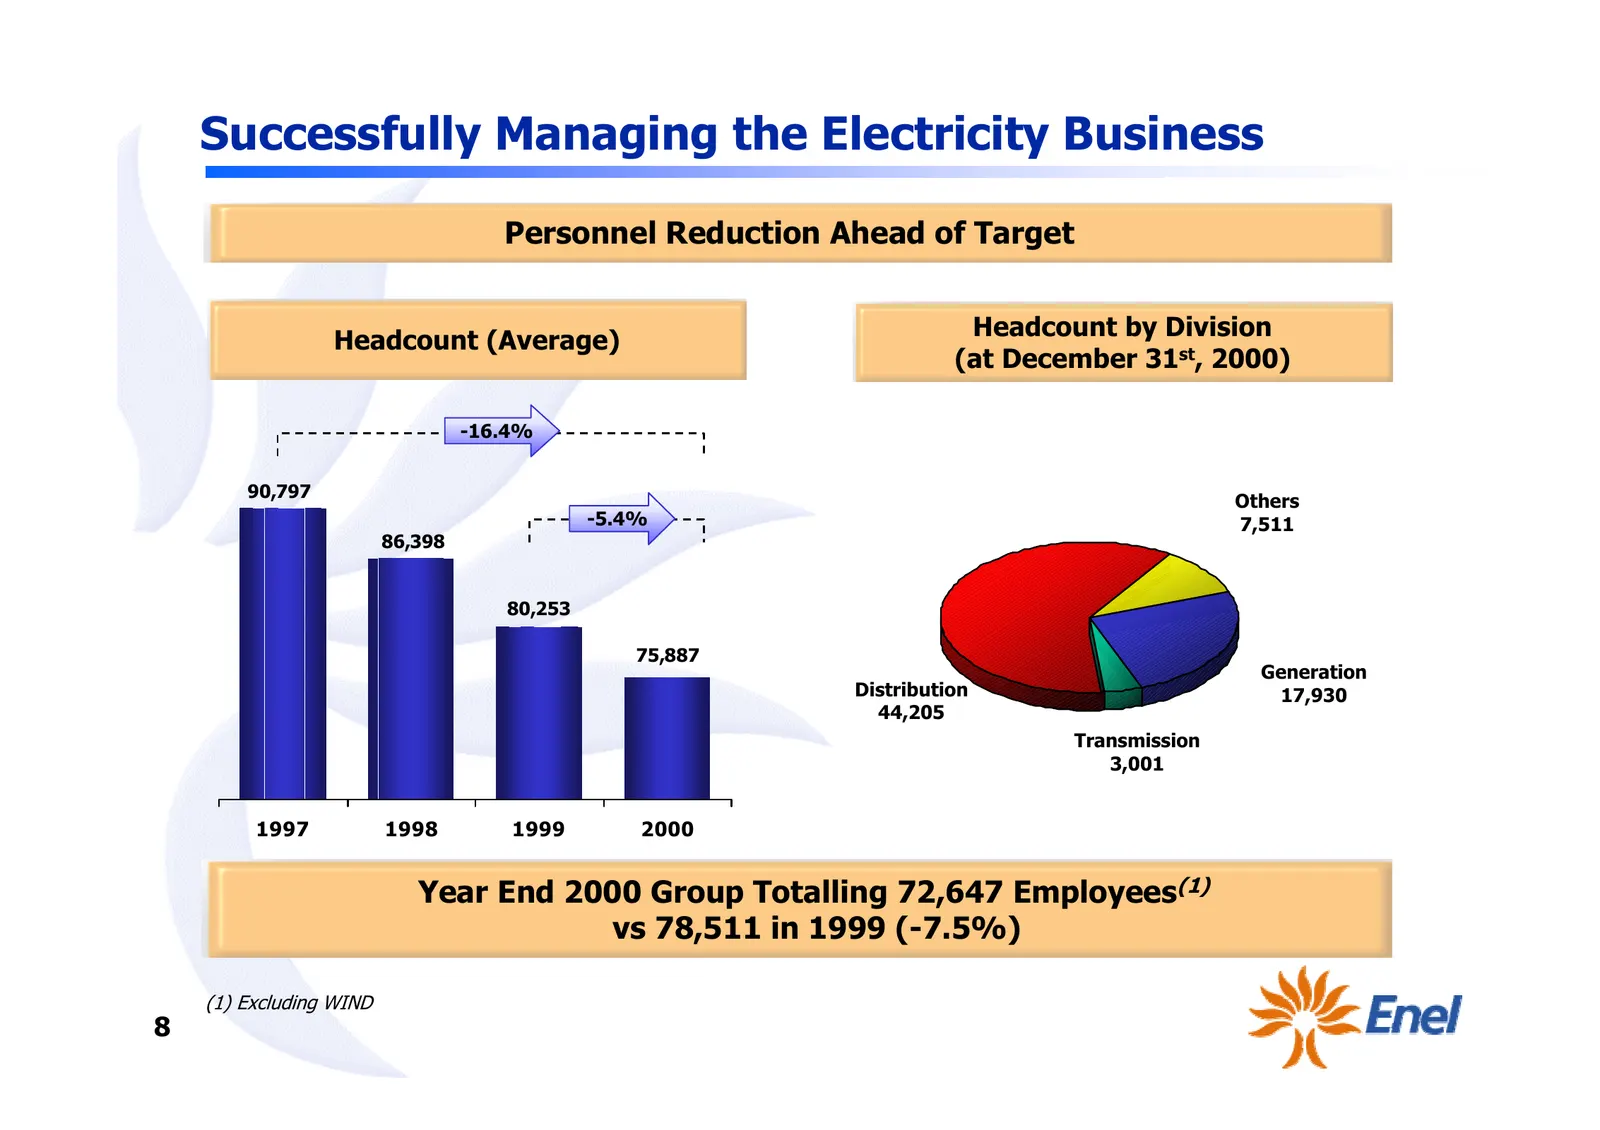
Successfully Managing the Electricity Business Personnel Reduction Ahead of Target Headcount by Division Headcount (Average) (at December 31st, 2000) -16.4% 90,797 Others -5.4% 7,511 86,398 80,253 75,887 Generation Distribution 17,930 44,205 Transmission 3,001 1997 1998 1999 2000 Year End 2000 Group
Slide 62: Other Operating Costs
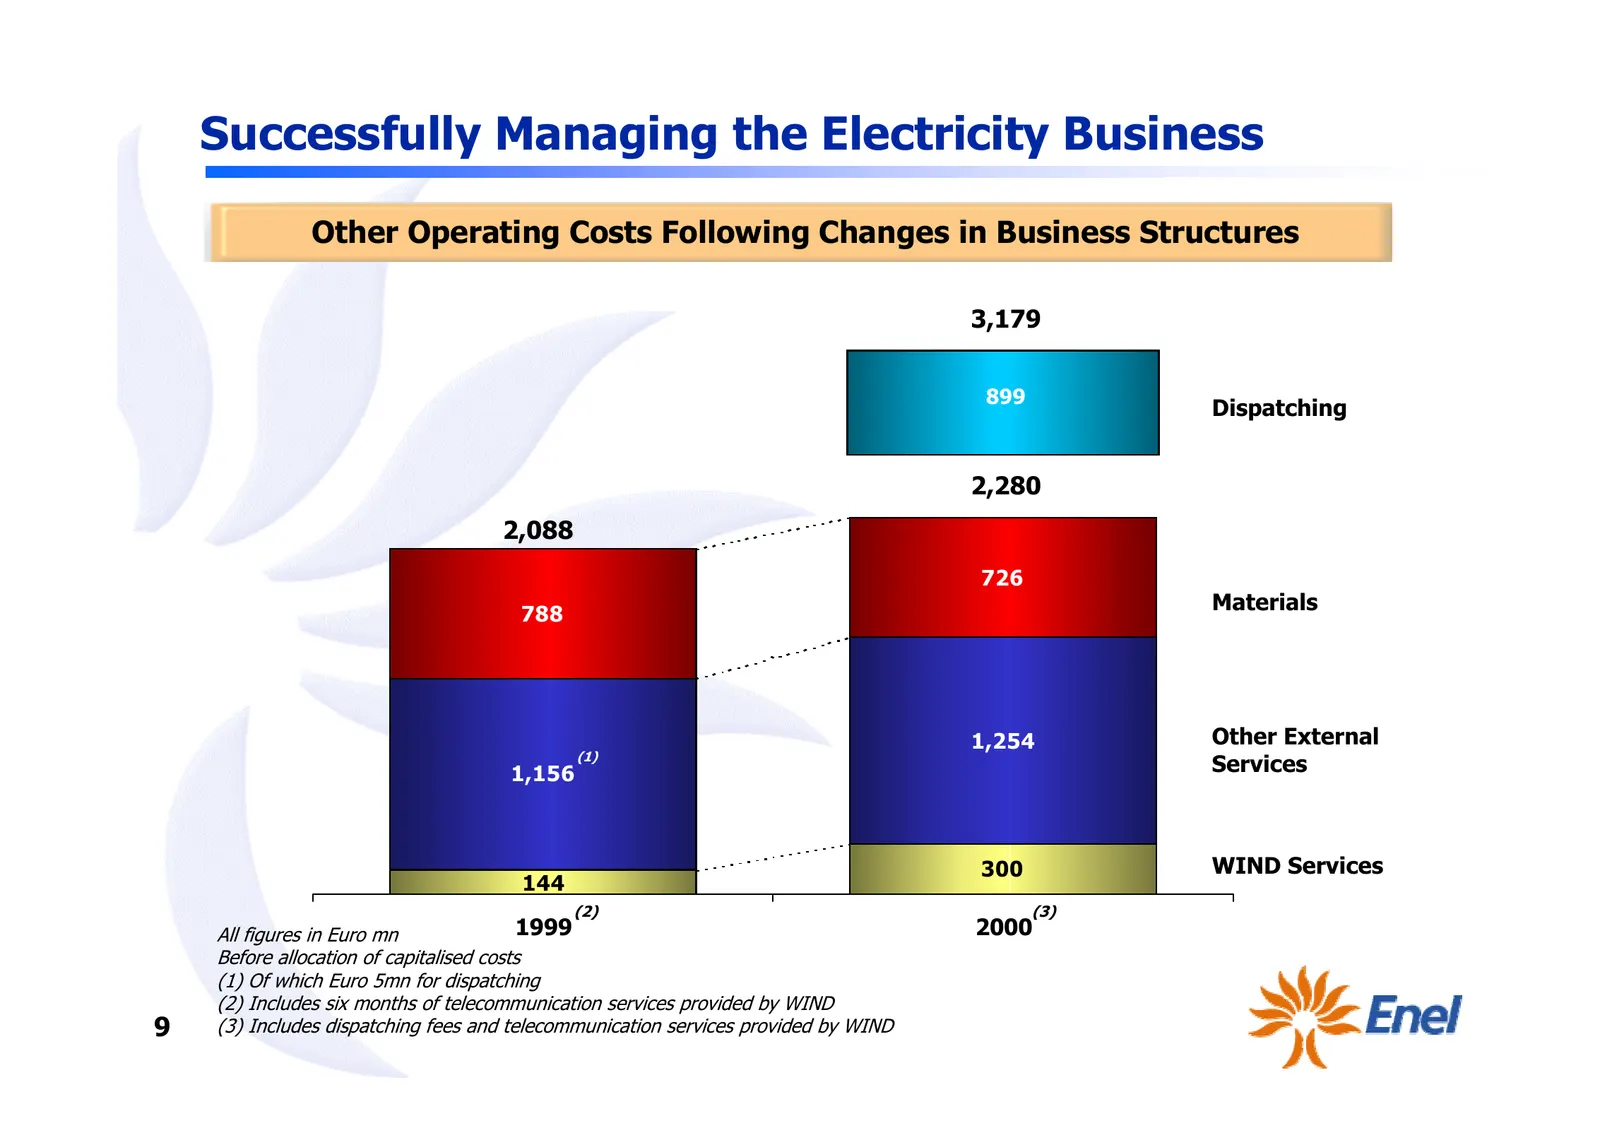
Successfully Managing the Electricity Business Other Operating Costs Following Changes in Business Structures 3,179 899 Dispatching 2,280 2,088 726 788 Materials 1,254 Other External (1) 1,156 Services 300 WIND Services 144 (2) (3) All figures in Euro mn 1999 2000 Before allocation of capitalised co
Slide 63: EBITDA Evolution
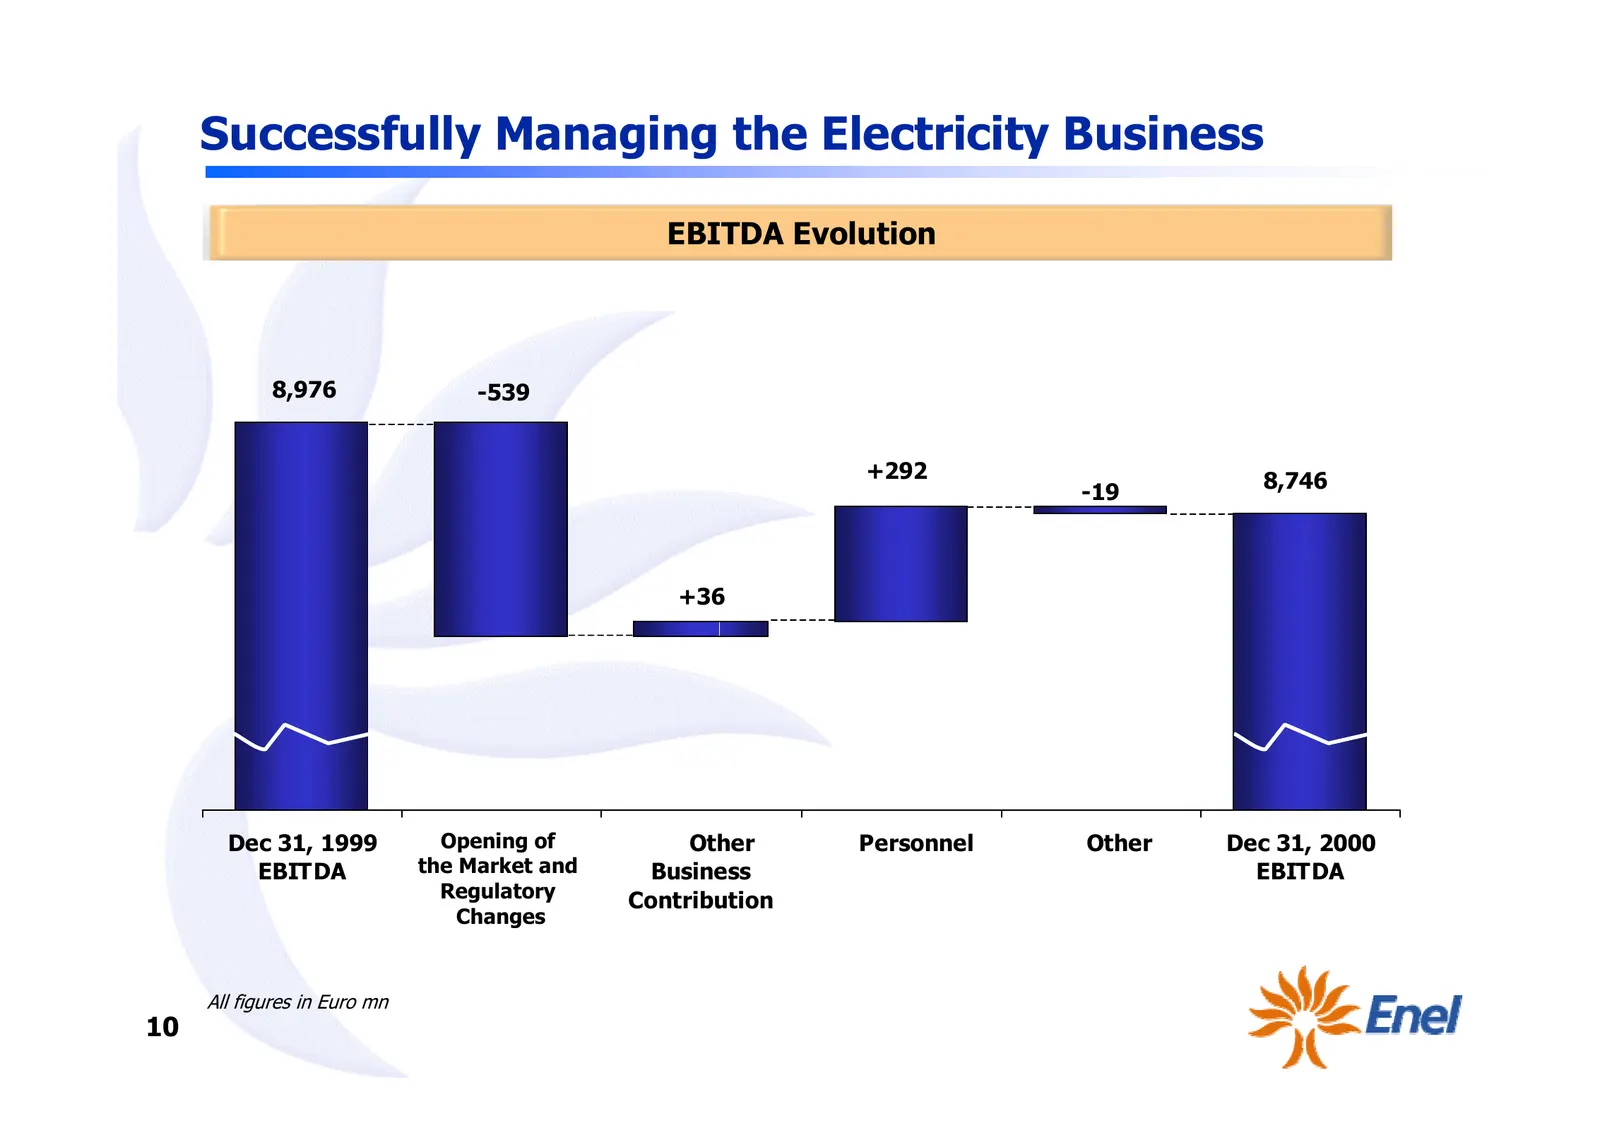
Successfully Managing the Electricity Business EBITDA Evolution 8,976 -539 +292 8,746 -19 +36 Dec 31, 1999 Opening of ∆ Other ∆ Personnel ∆ Other Dec 31, 2000 EBITDA the Market and Business EBITDA Regulatory Contribution Changes All figures in Euro mn 10
Slide 64: EBITDA Breakdown by Business Sector
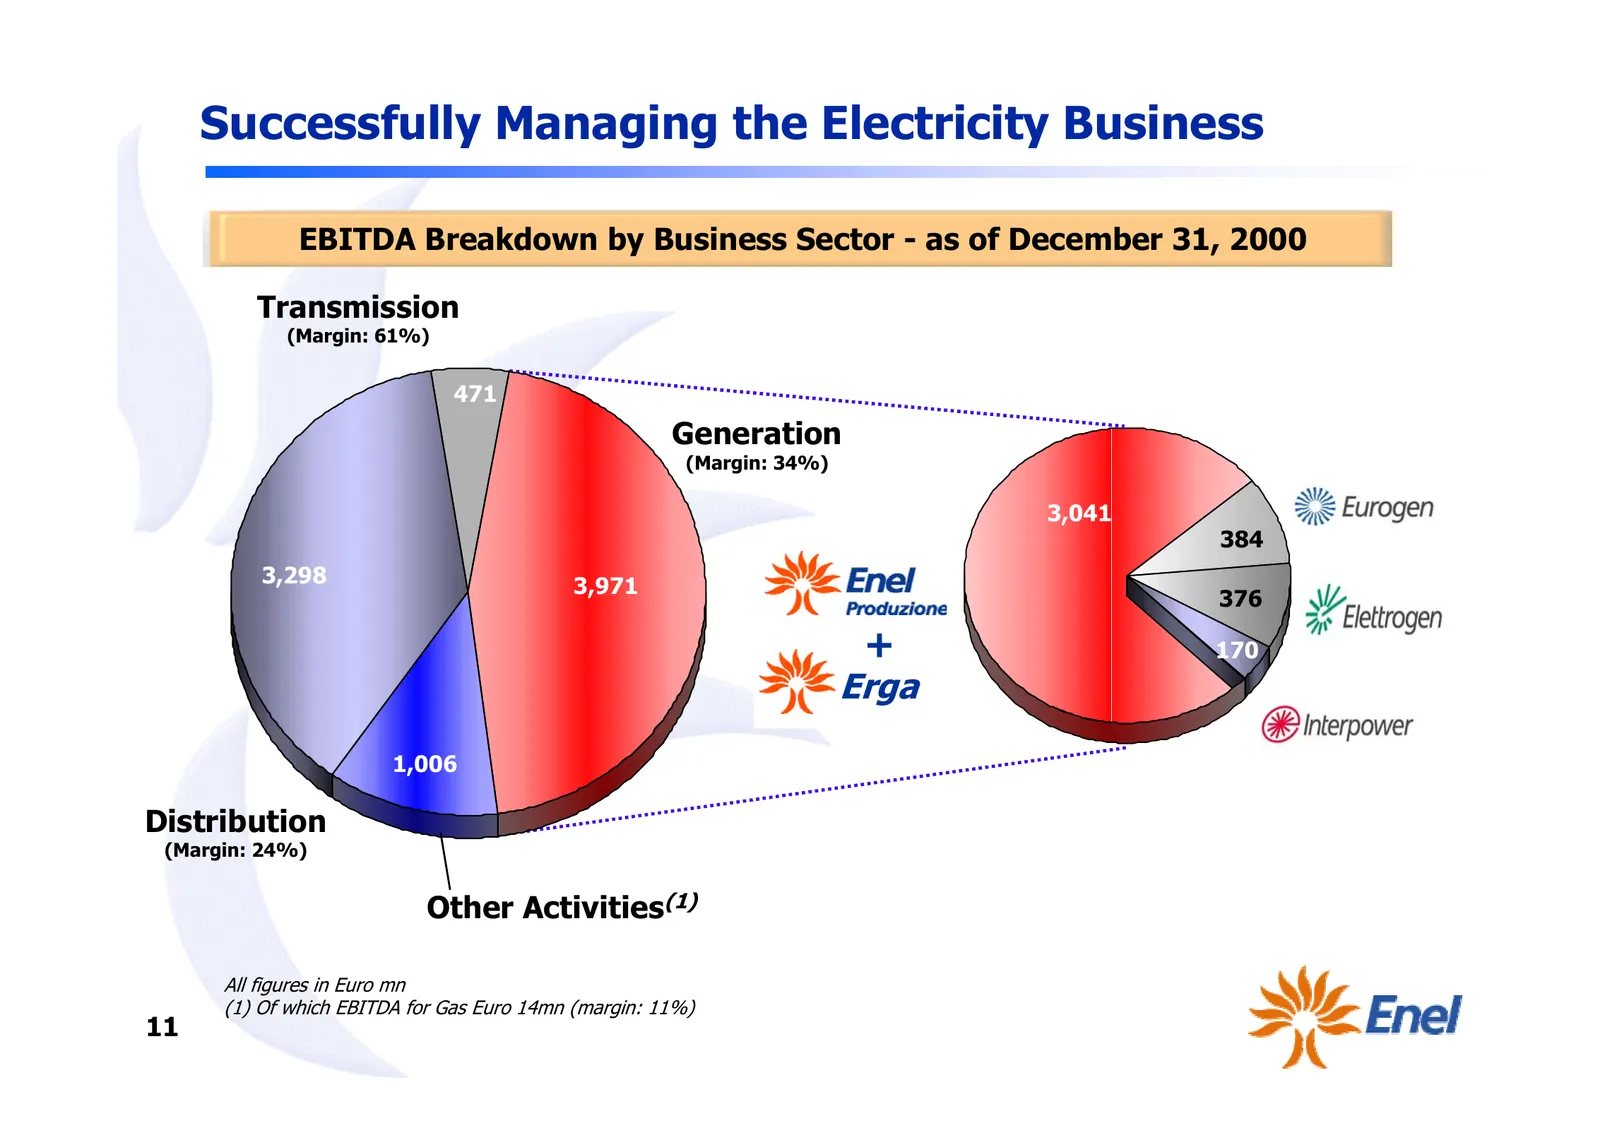
Successfully Managing the Electricity Business EBITDA Breakdown by Business Sector - as of December 31, 2000 Transmission (Margin: 61%) 471 Generation (Margin: 34%) 3,041 384 3,298 3,971 376 + 170 Erga 1,006 Distribution (Margin: 24%) Other Activities(1) All figures in Euro mn (1) Of which EBITDA fo
Slide 65: Sound Financial Management
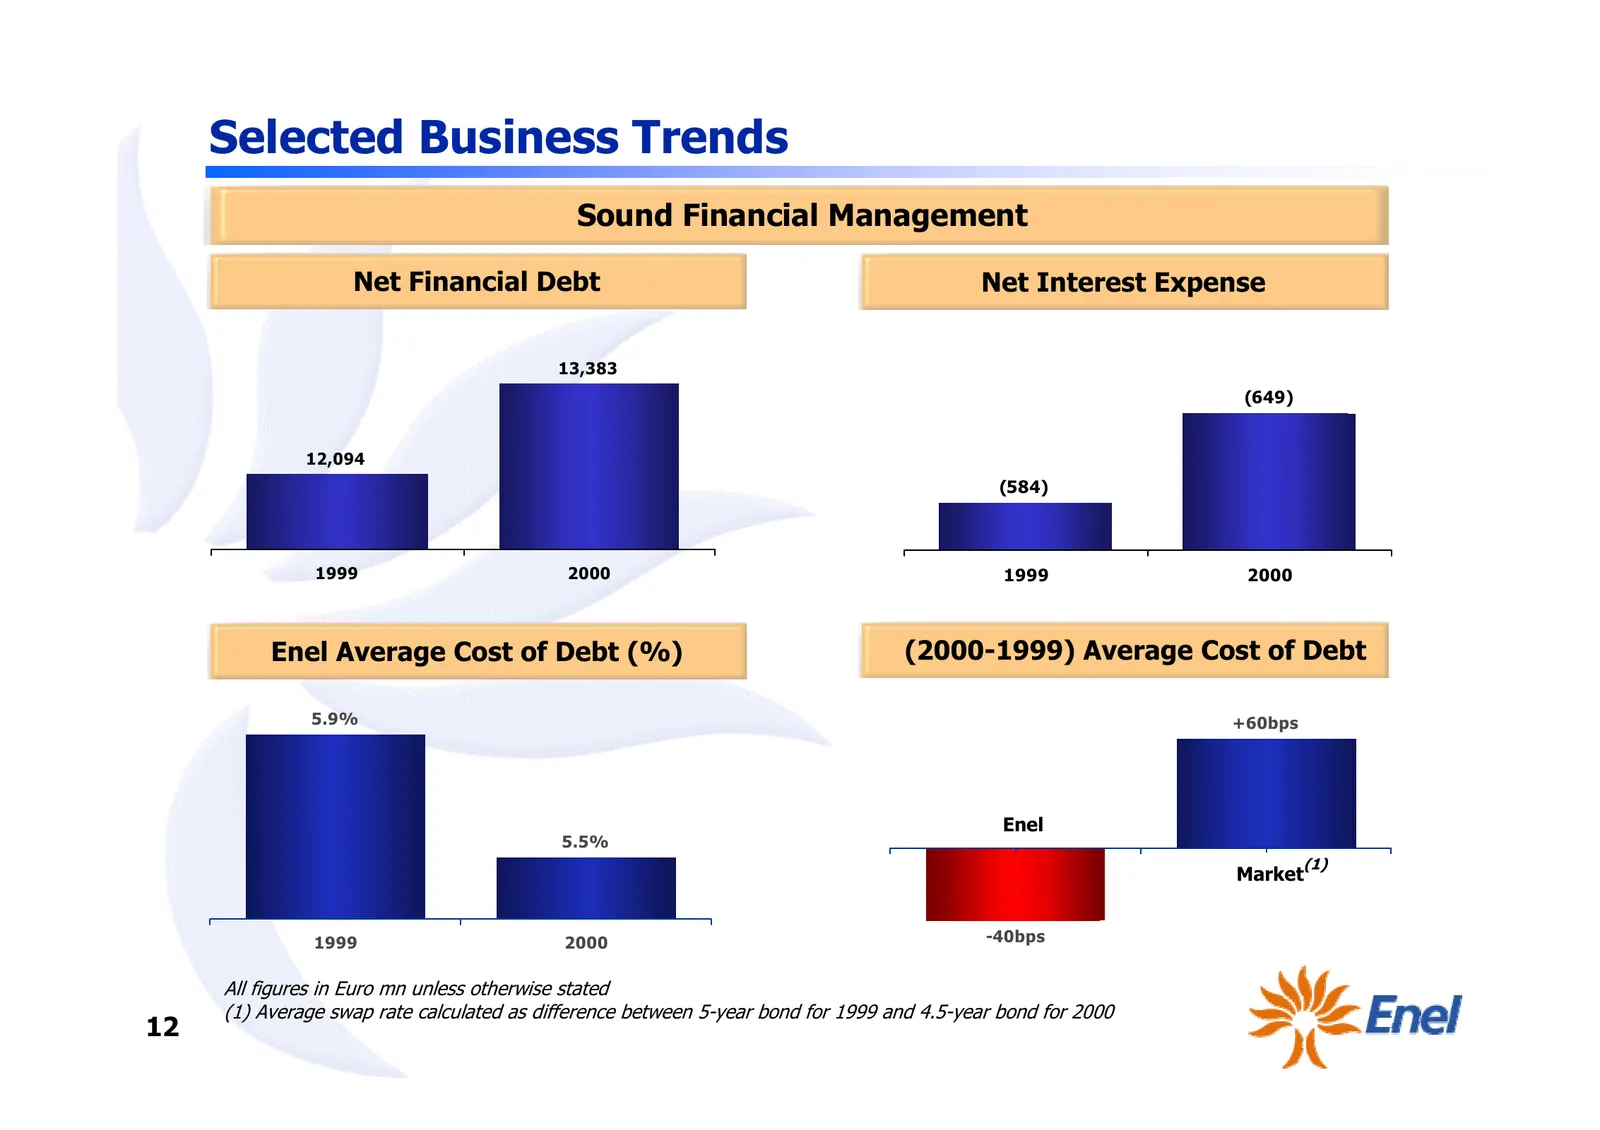
Selected Business Trends Sound Financial Management Net Financial Debt Net Interest Expense 13,383 (649) 12,094 (584) 1999 2000 1999 2000 Enel Average Cost of Debt (%) ∆ (2000-1999) Average Cost of Debt 5.9% +60bps Enel 5.5% (1) Market 1999 2000 -40bps All figures in Euro mn unless otherwise stated
Slide 66: Tax Effects on Net Profit
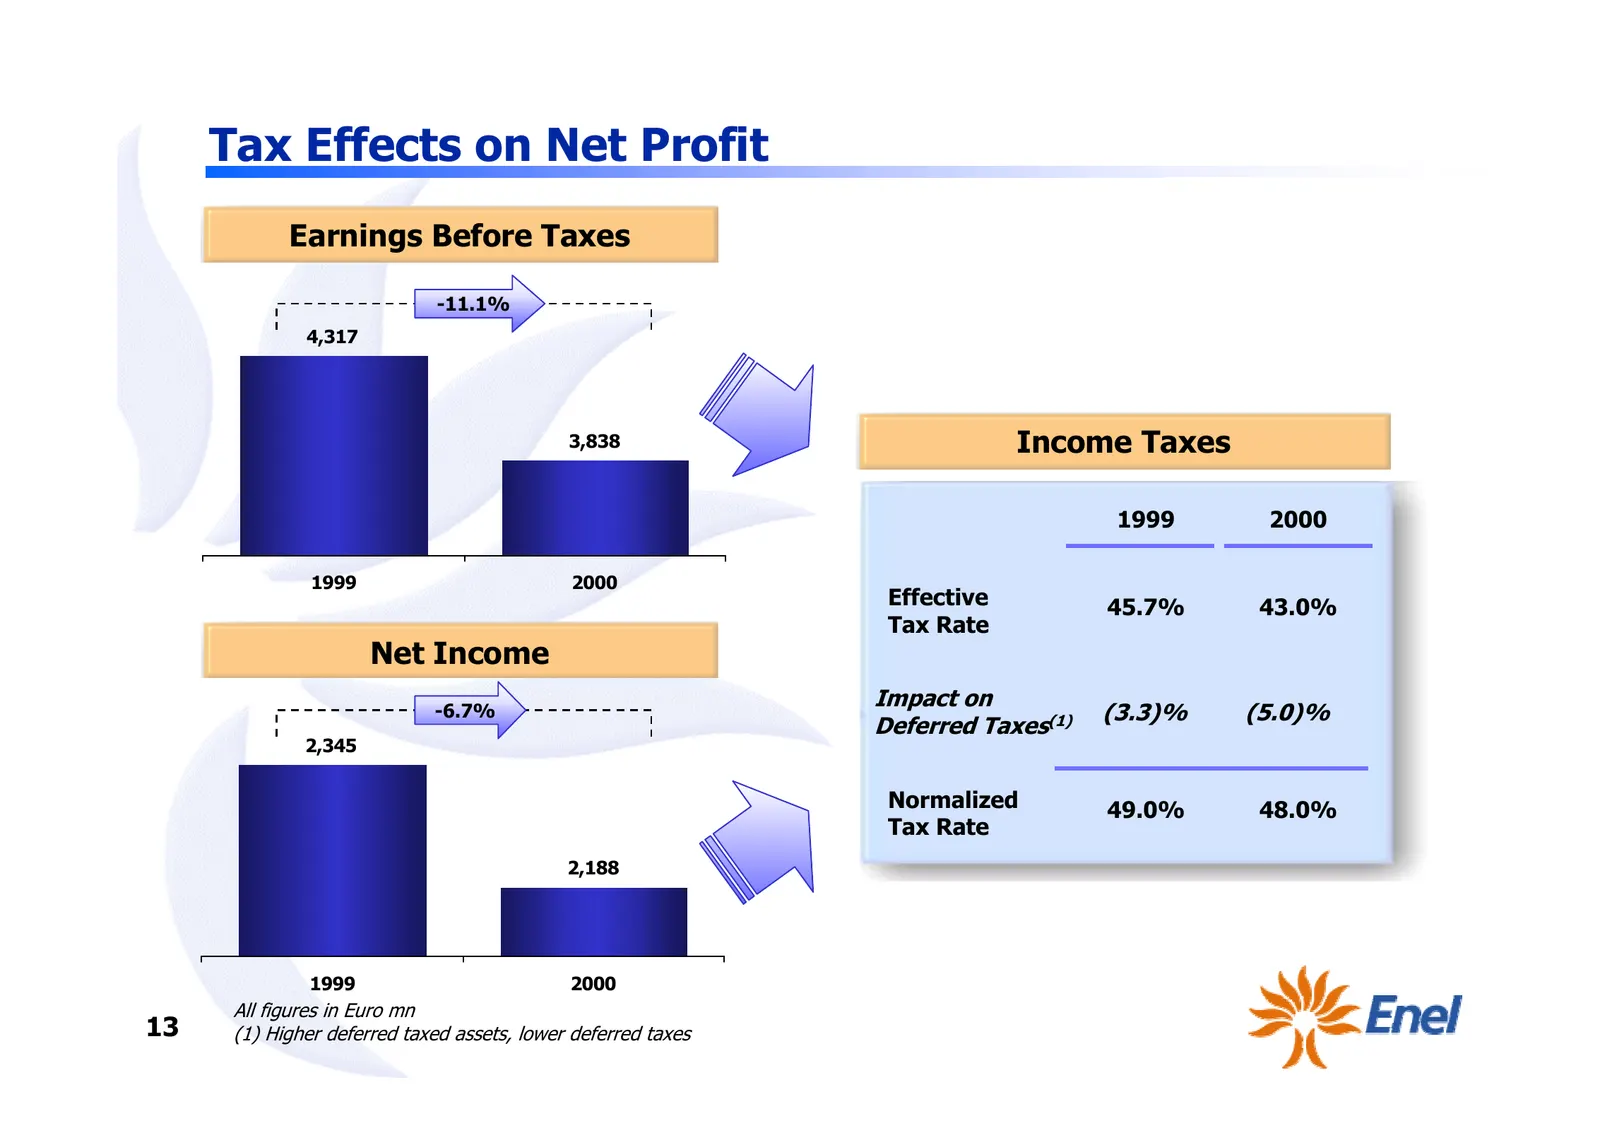
Tax Effects on Net Profit Earnings Before Taxes -11.1% 4,317 3,838 Income Taxes 1999 2000 1999 2000 Effective 45.7% 43.0% Tax Rate Net Income Impact on -6.7% (3.3)% (5.0)% Deferred Taxes(1) 2,345 Normalized 49.0% 48.0% Tax Rate 2,188 1999 2000 All figures in Euro mn 13 (1) Higher deferred taxed asse
Slide 67: Corporate Goals
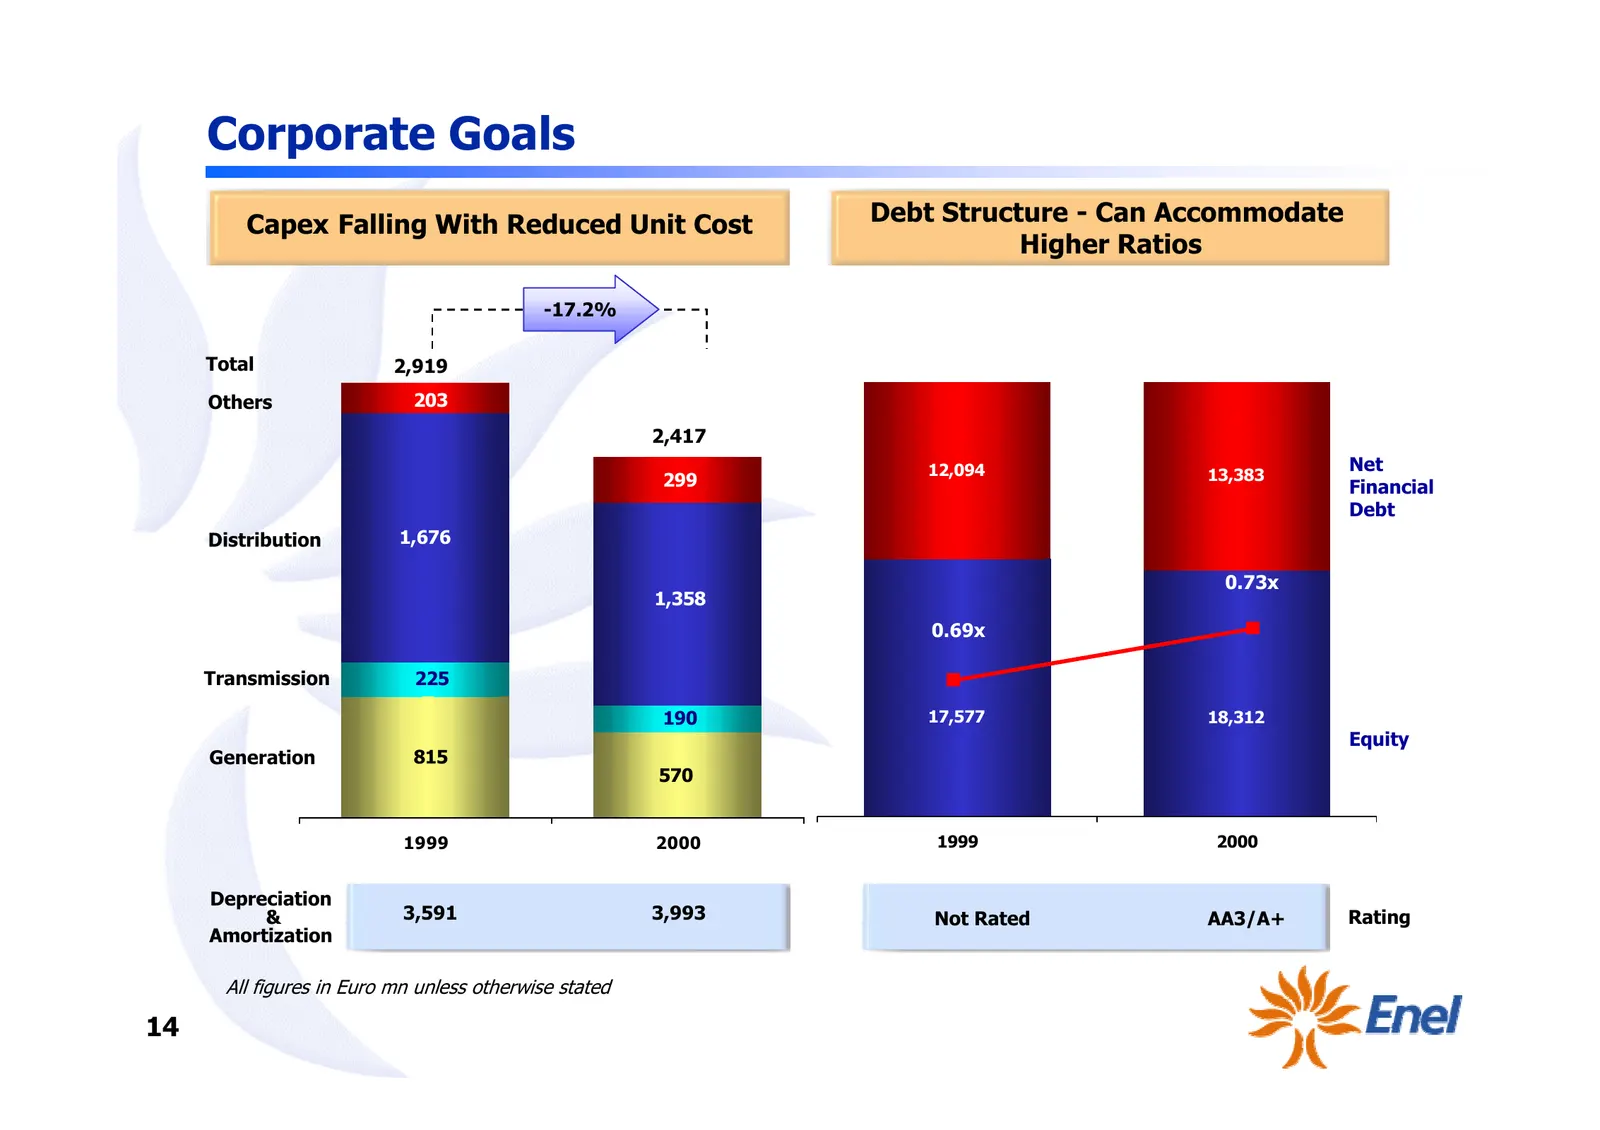
Corporate Goals Capex Falling With Reduced Unit Cost Debt Structure - Can Accommodate Higher Ratios -17.2% Total 2,919 Others 203 2,417 12,094 Net 299 13,383 Financial Debt Distribution 1,676 [1,658] 0.73x 1,358 0.69x Transmission 225 190 17,577 18,312 Equity Generation 815 570 1999 2000 1999 2000 D
Slide 68: Strong Cash Generation as Fuel for Strategy
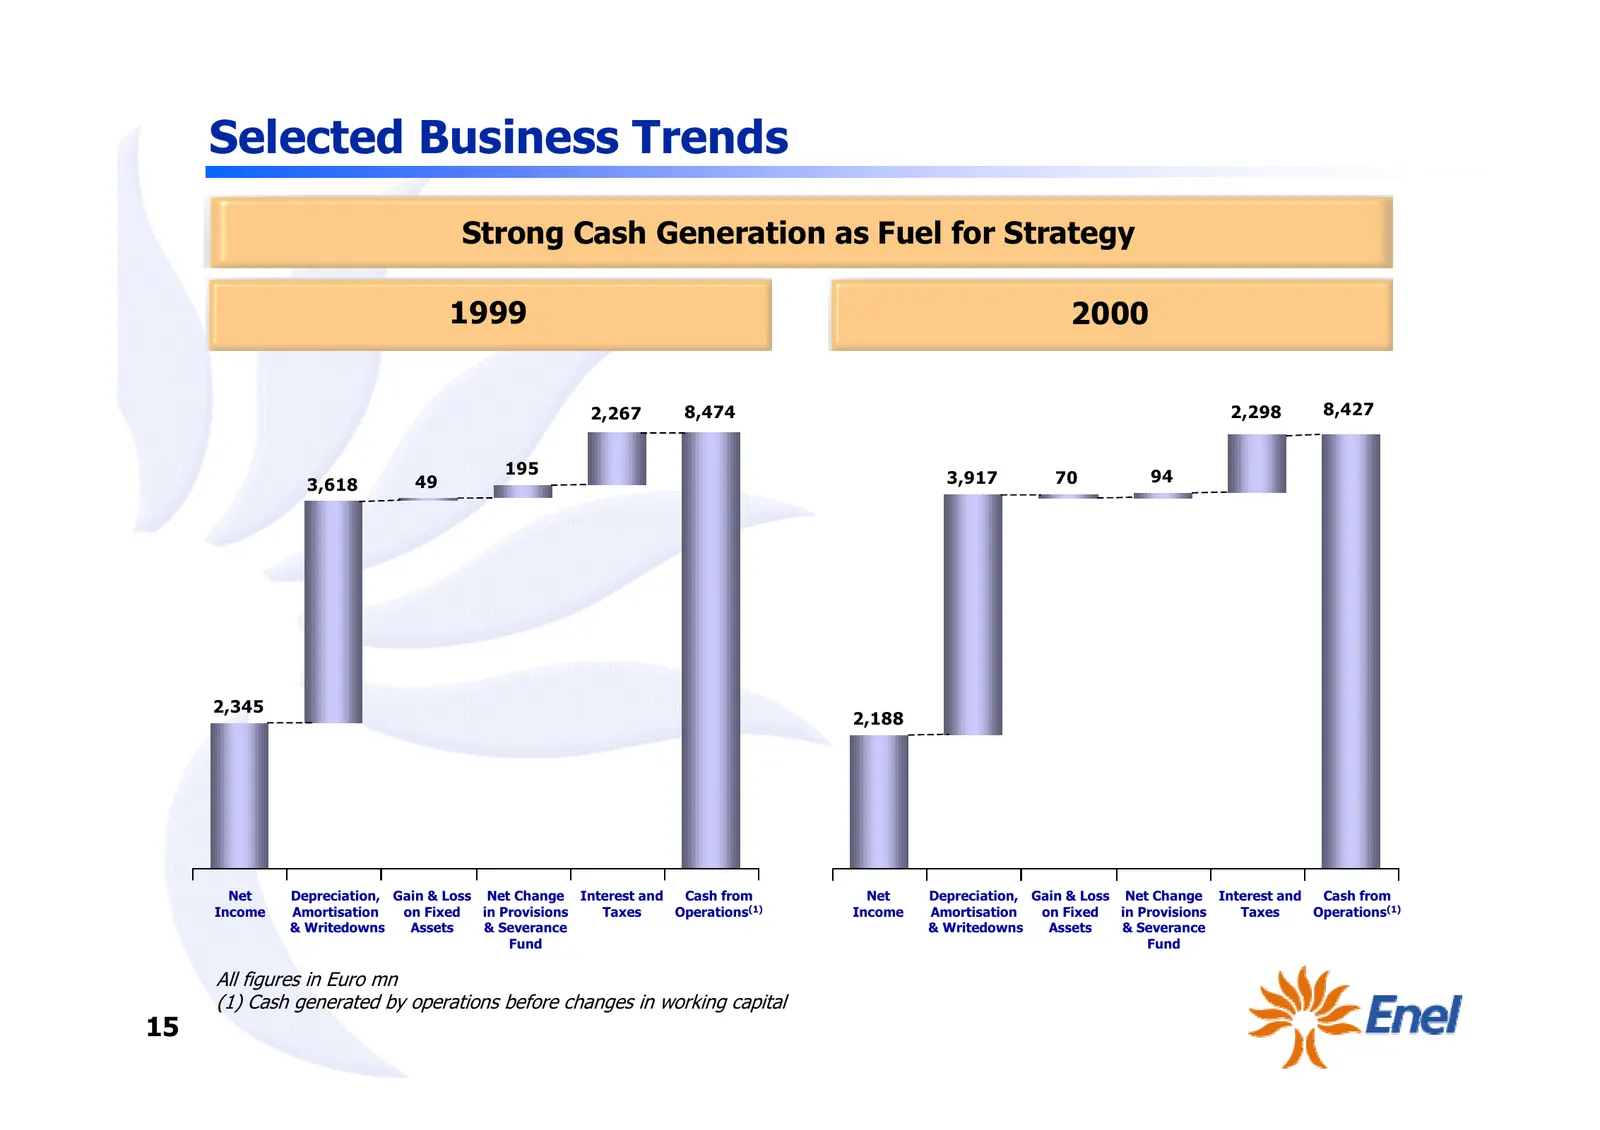
Selected Business Trends Strong Cash Generation as Fuel for Strategy 1999 2000 2,267 8,474 2,298 8,427 195 94 3,618 49 3,917 70 2,345 2,188 Net Depreciation, Gain & Loss Net Change Interest and Cash from Net Depreciation, Gain & Loss Net Change Interest and Cash from Income Amortisation on Fixed in
Slide 69: Main Disposals
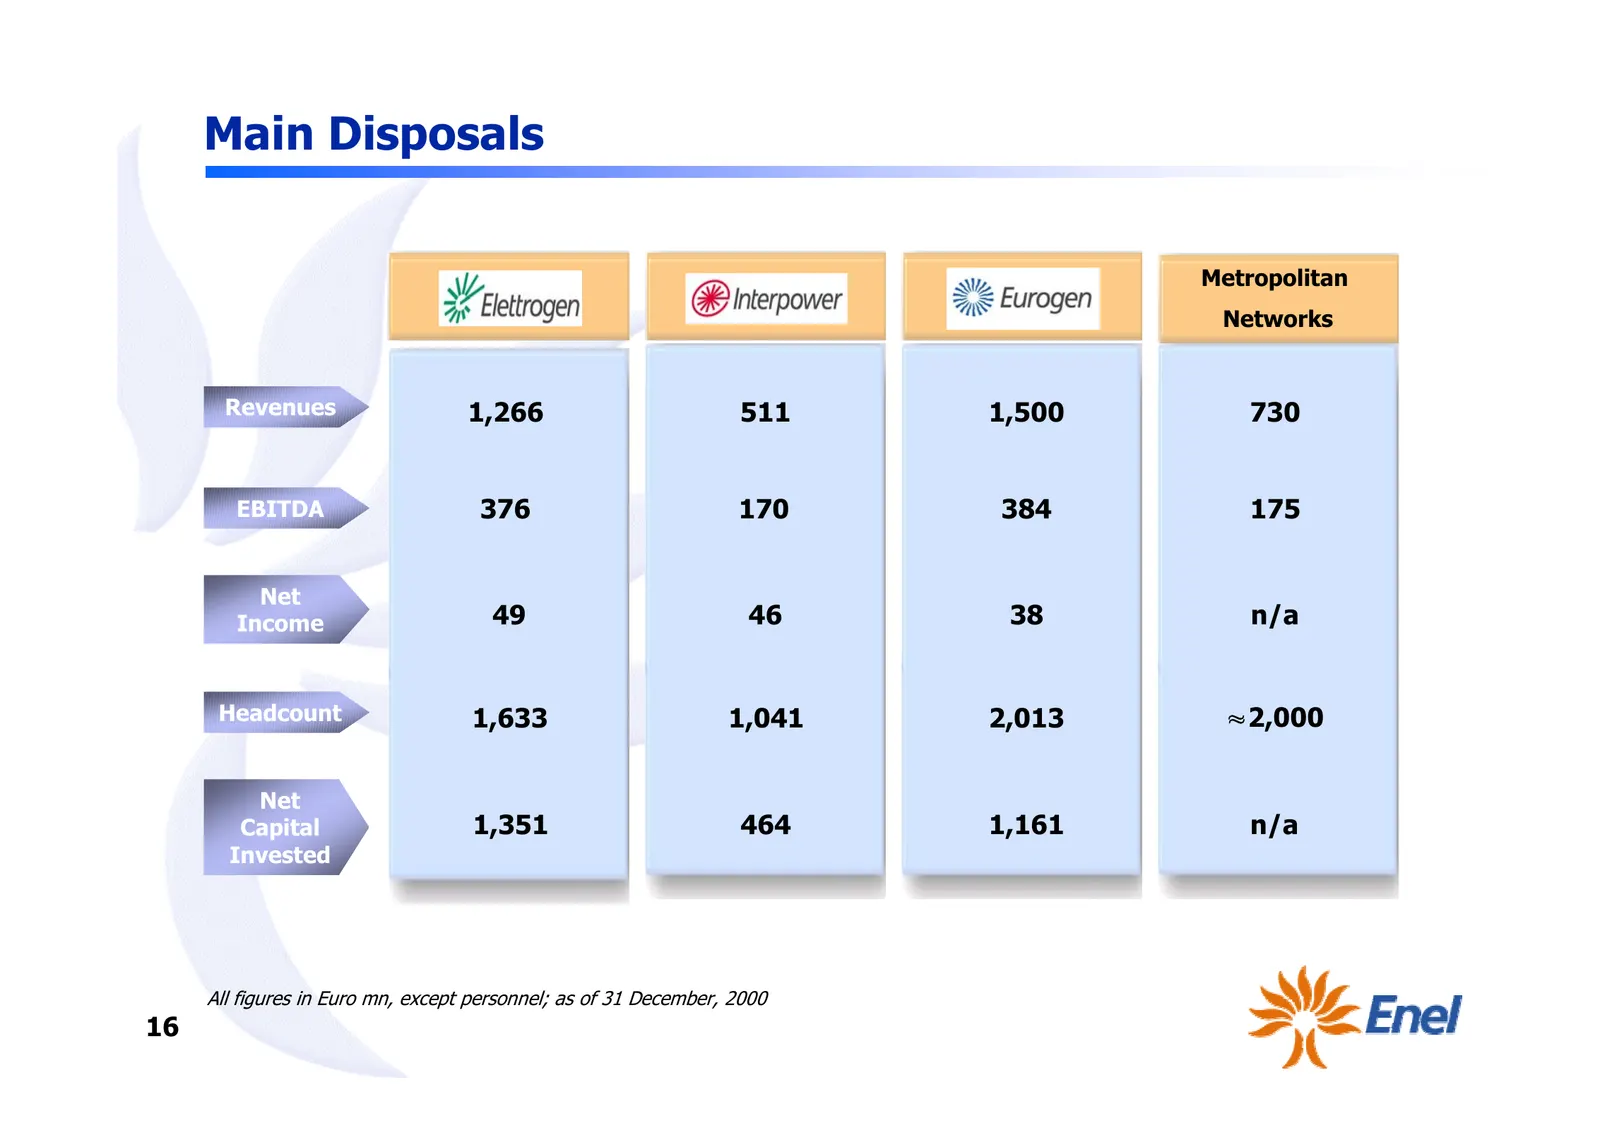
Main Disposals Metropolitan Networks Revenues 1,266 511 1,500 730 EBITDA 376 170 384 175 Net Income 49 46 38 n/a Headcount 1,633 1,041 2,013 ≈ 2,000 Net Capital 1,351 464 1,161 n/a Invested All figures in Euro mn, except personnel; as of 31 December, 2000 16
Slide 70: Analyst Presentation
Analyst Presentation April, 2001
Source: Internet Archive copy of enel.com
More decks from Enel SpA
 Q1 2026 Earnings Presentation38 slides · May 7, 2026
 FY2025 Earnings Presentation30 slides · Mar 19, 2026
 Investor Day (February 2026)41 slides · Feb 23, 2026
 Investor Presentation (November 2025)139 slides · November 2025
 Presentazione Servizi inlingua ENEL10 slides · Sep 3, 2025
 Investor Presentation (September 2025)146 slides · September 2025