Summit Financial — Debt Investor Presentation (November 2021)
43 slides from Summit Financial's debt investor presentation, Nov 17, 2021

Slide 1: Subordinated Debt Offering November 2021
Confidential Subordinated Debt Offering November 2021
Slide 2: Disclaimer
Confidential Disclaimer The inf ormation contained in this confidential presentation is a summary and it is not complete. It has been prepared f or use only in connection with the priv ate placement (the “Placement”) of securities (the “Securities”) of Summit Financial Group, Inc. (the “Company”). T
Slide 3: Forward-Looking Statements
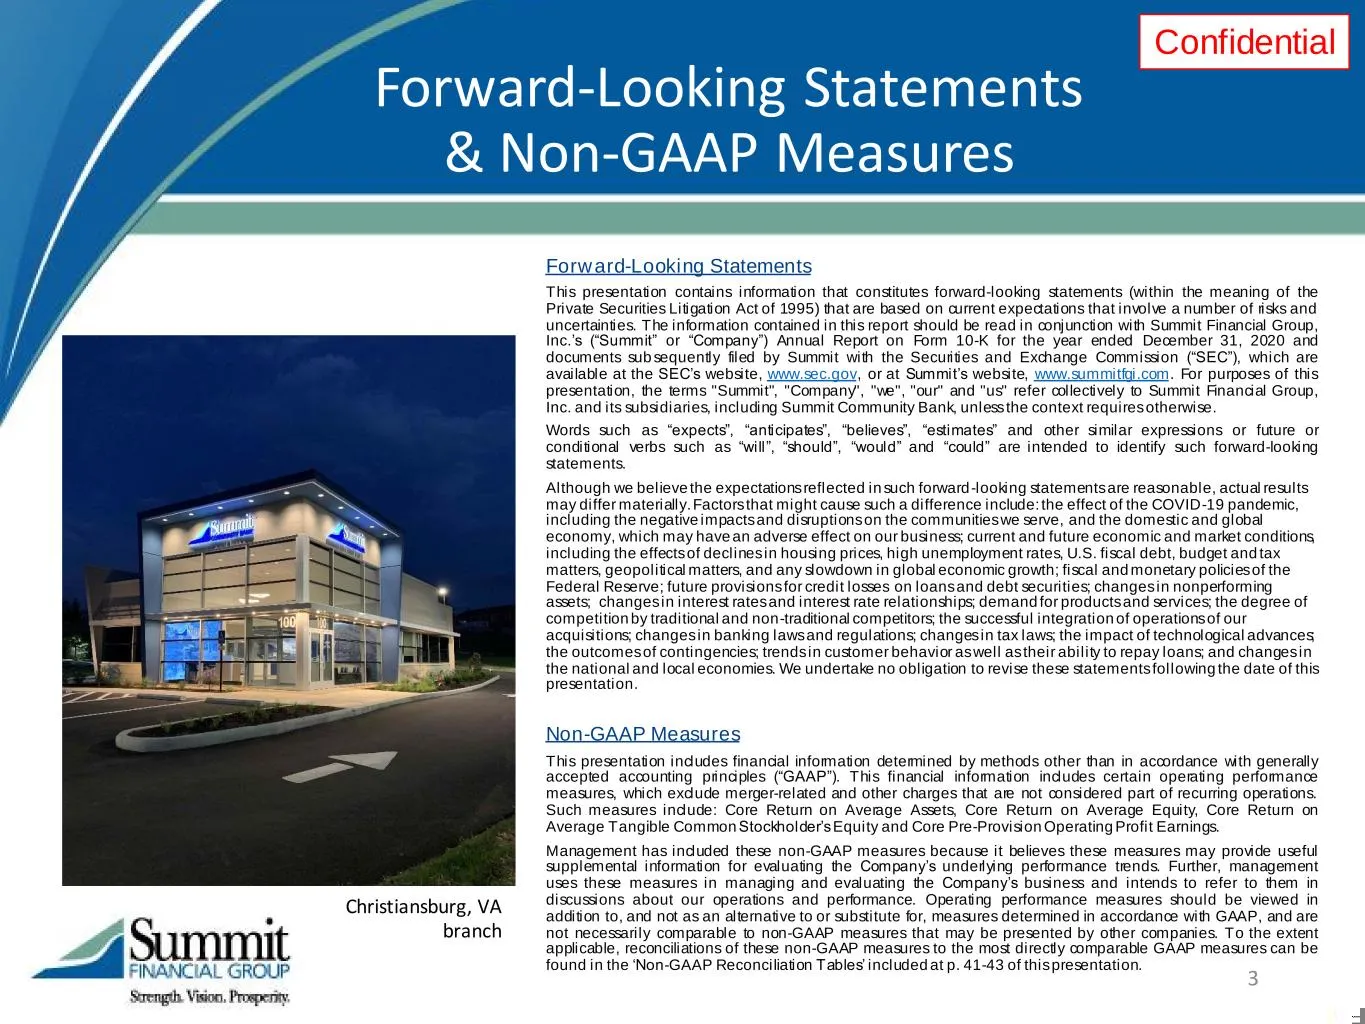
Confidential Forward-Looking Statements This presentation contains information that constitutes forward-looking statements (within the meaning of the Private Securities Litigation Act of 1995) that are based on current expectations that involve a number of risks and uncertainties. The information co
Slide 4: Terms of Proposed Subordinated Debt Offering
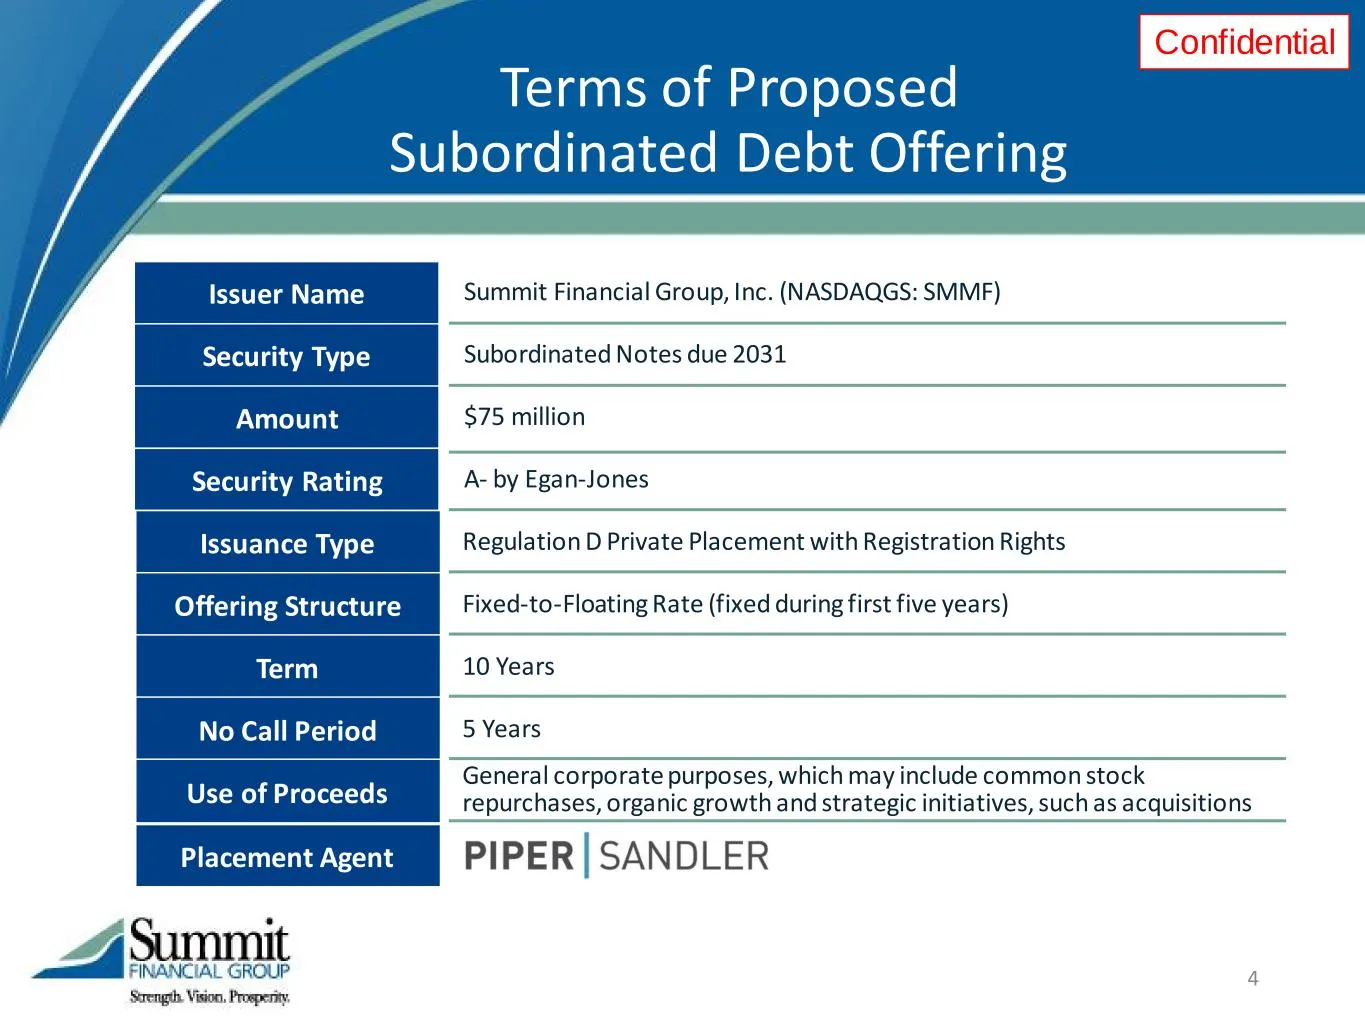
Confidential Terms of Proposed Subordinated Debt Offering 4 Issuer Name Security Type Amount Security Rating Issuance Type Offering Structure Term No Call Period Use of Proceeds Placement Agent Summit Financial Group, Inc. (NASDAQGS: SMMF) Subordinated Notes due 2031 $75 million A- by Egan-Jones Reg
Slide 5: Company Overview
Confidential Company Overview 5
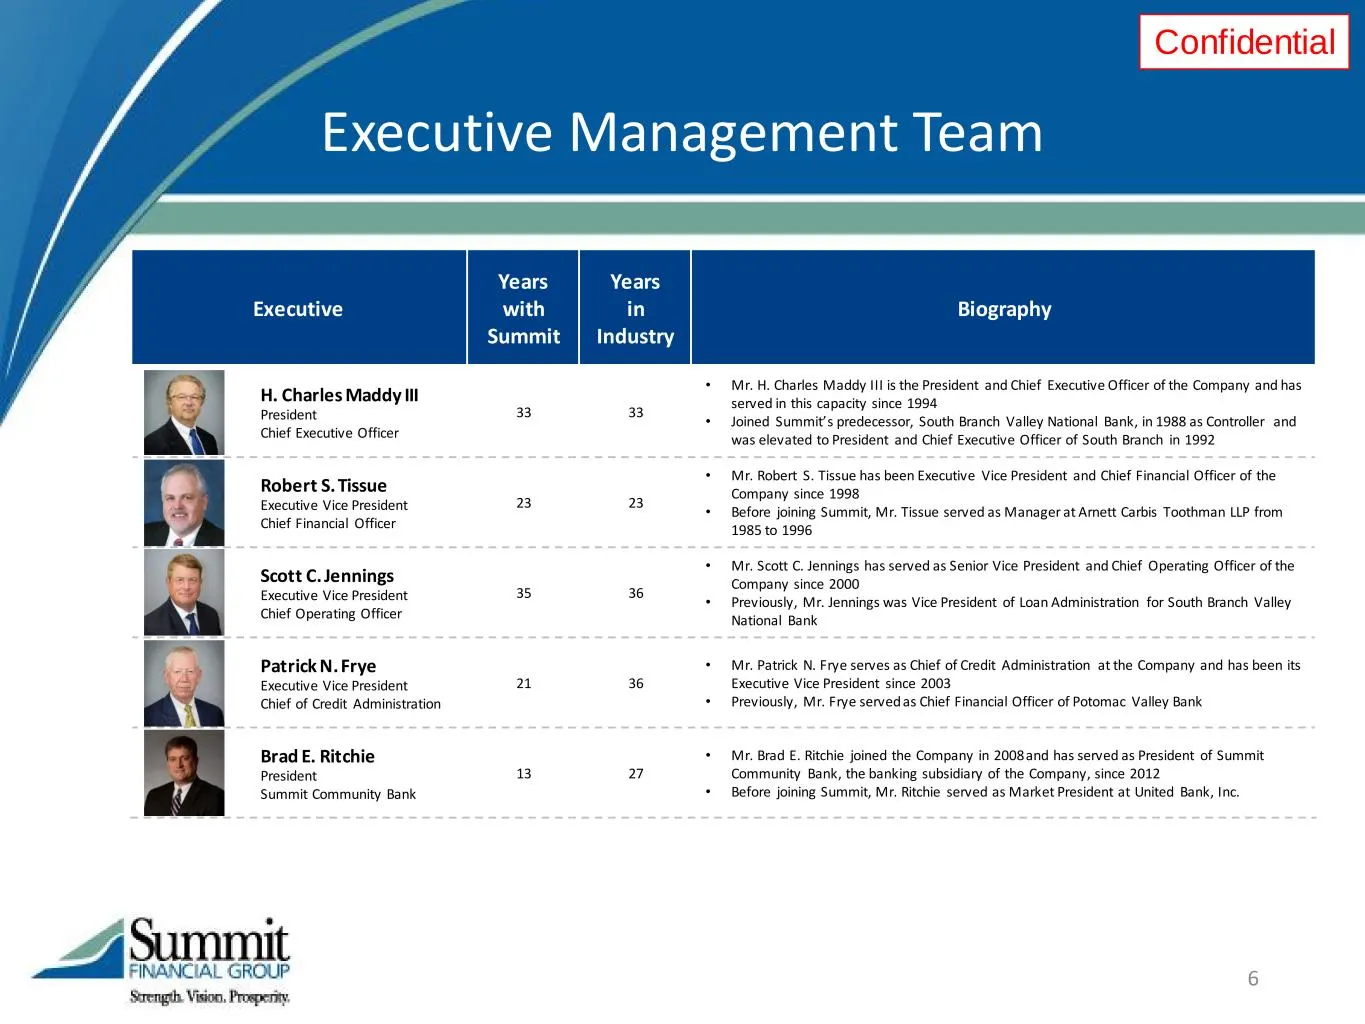
Slide 6: Executive Management Biographies
Confidential Executive Years with Summit Years in Industry Biography H. Charles Maddy III President Chief Executive Officer 33 33 • Mr. H. Charles Maddy III is the President and Chief Executive Officer of the Company and has served in this capacity since 1994 • Joined Summit’s predecessor, South Bra
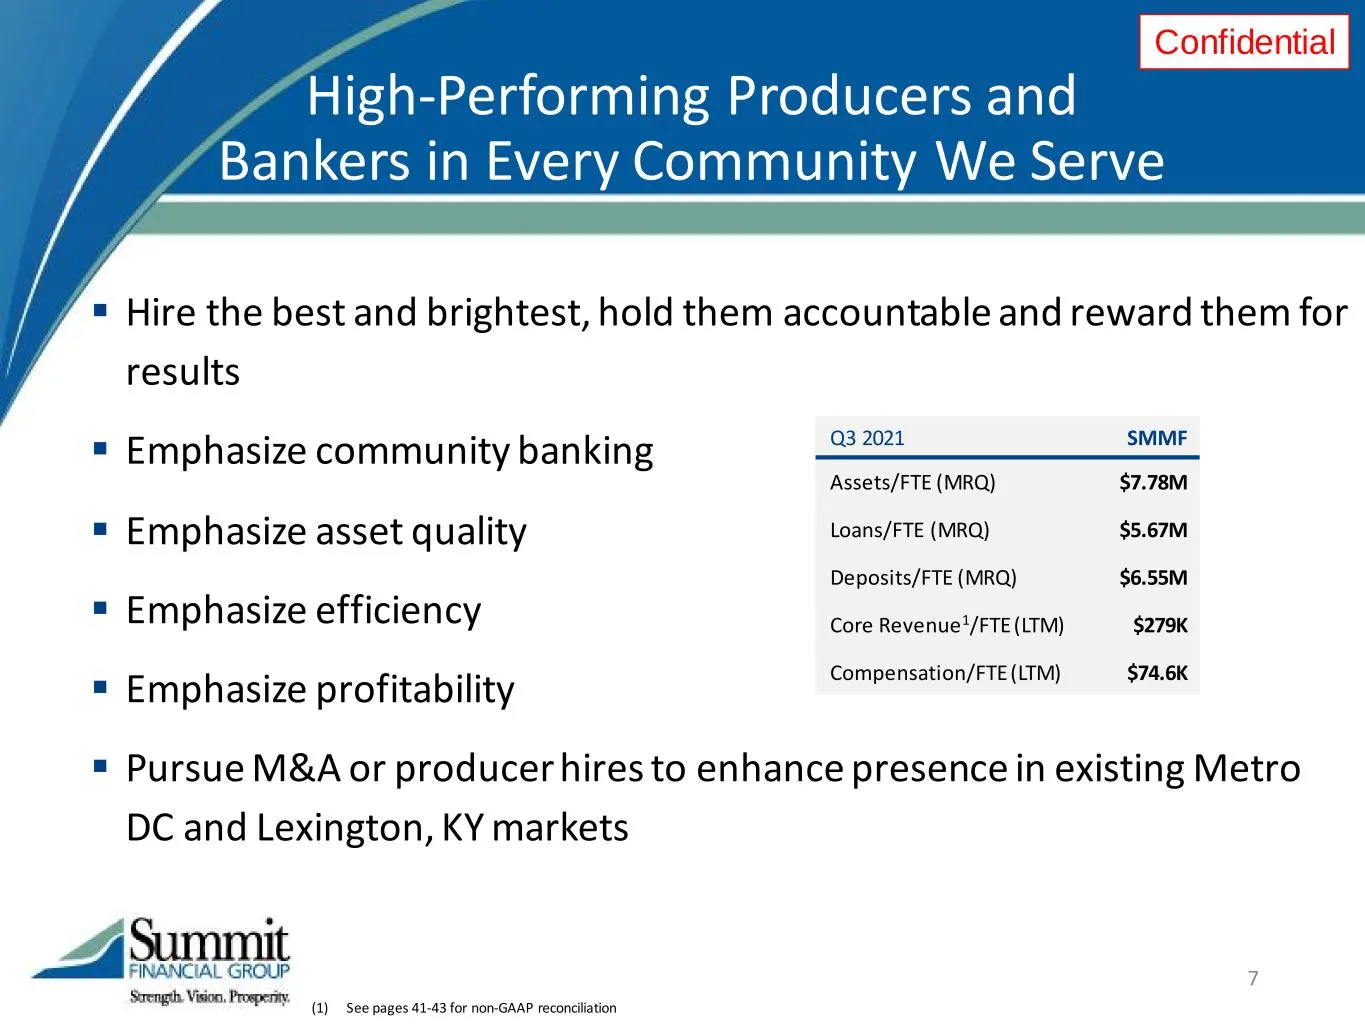
Slide 7: High-Performing Producers and Bankers in Every Community We Serve
Confidential High-Performing Producers and Bankers in Every Community We Serve Hire the best and brightest, hold them accountable and reward them for results Emphasize community banking Emphasize asset quality Emphasize efficiency Emphasize profitability Pursue M&A or producer hires to e
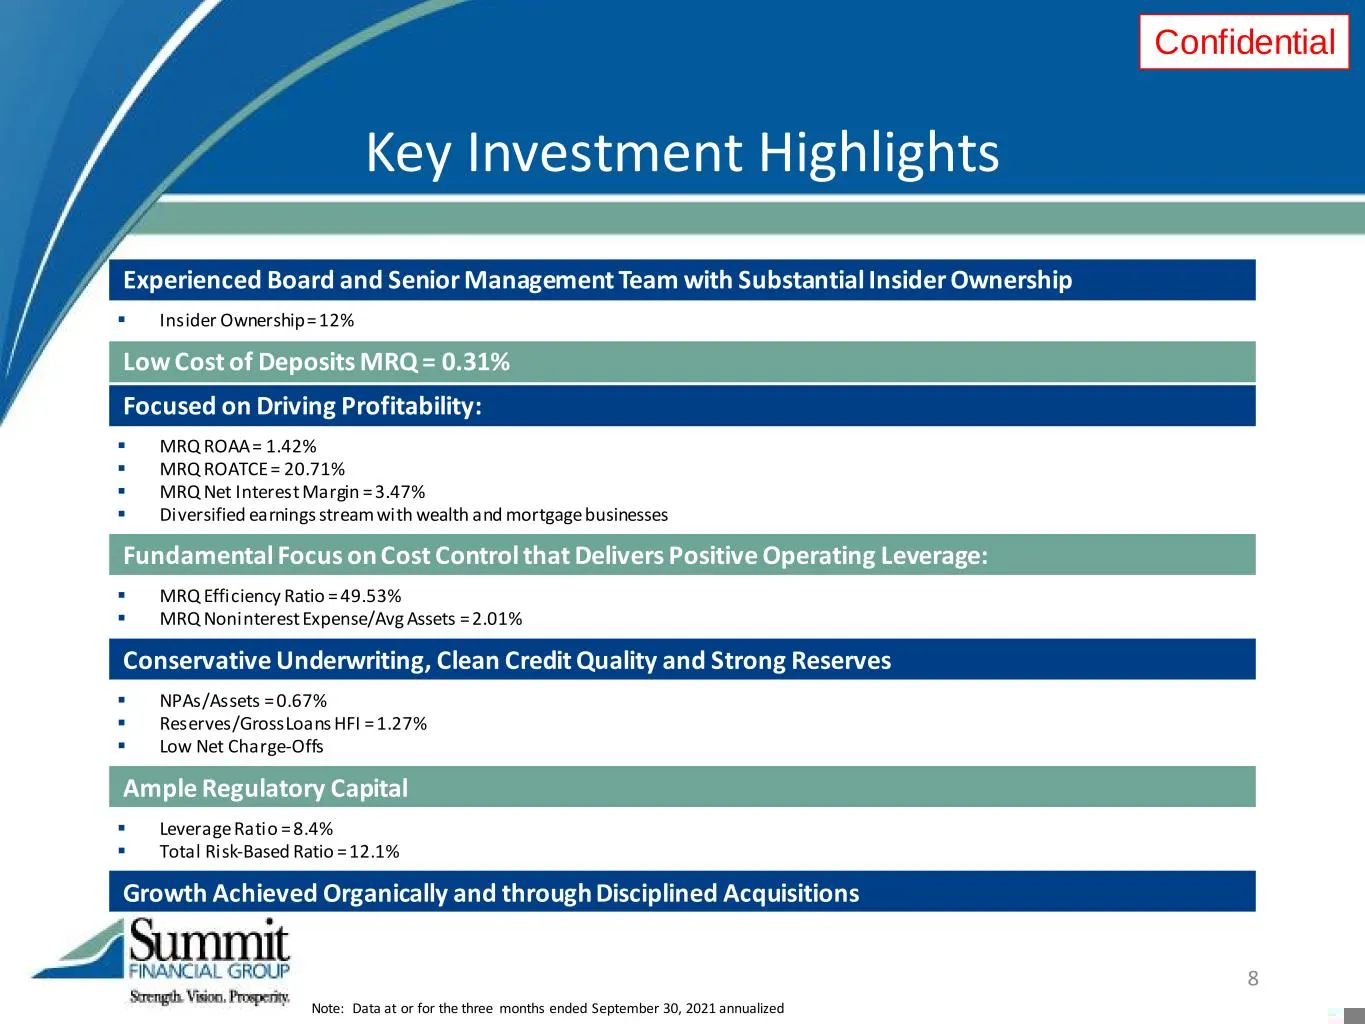
Slide 8: Key Investment Highlights
Confidential Key Investment Highlights Note: Data at or for the three months ended September 30, 2021 annualized 8 Low Cost of Deposits MRQ = 0.31% Experienced Board and Senior Management Team with Substantial Insider Ownership Insider Ownership = 12% Fundamental Focus on Cost Control that Deliver
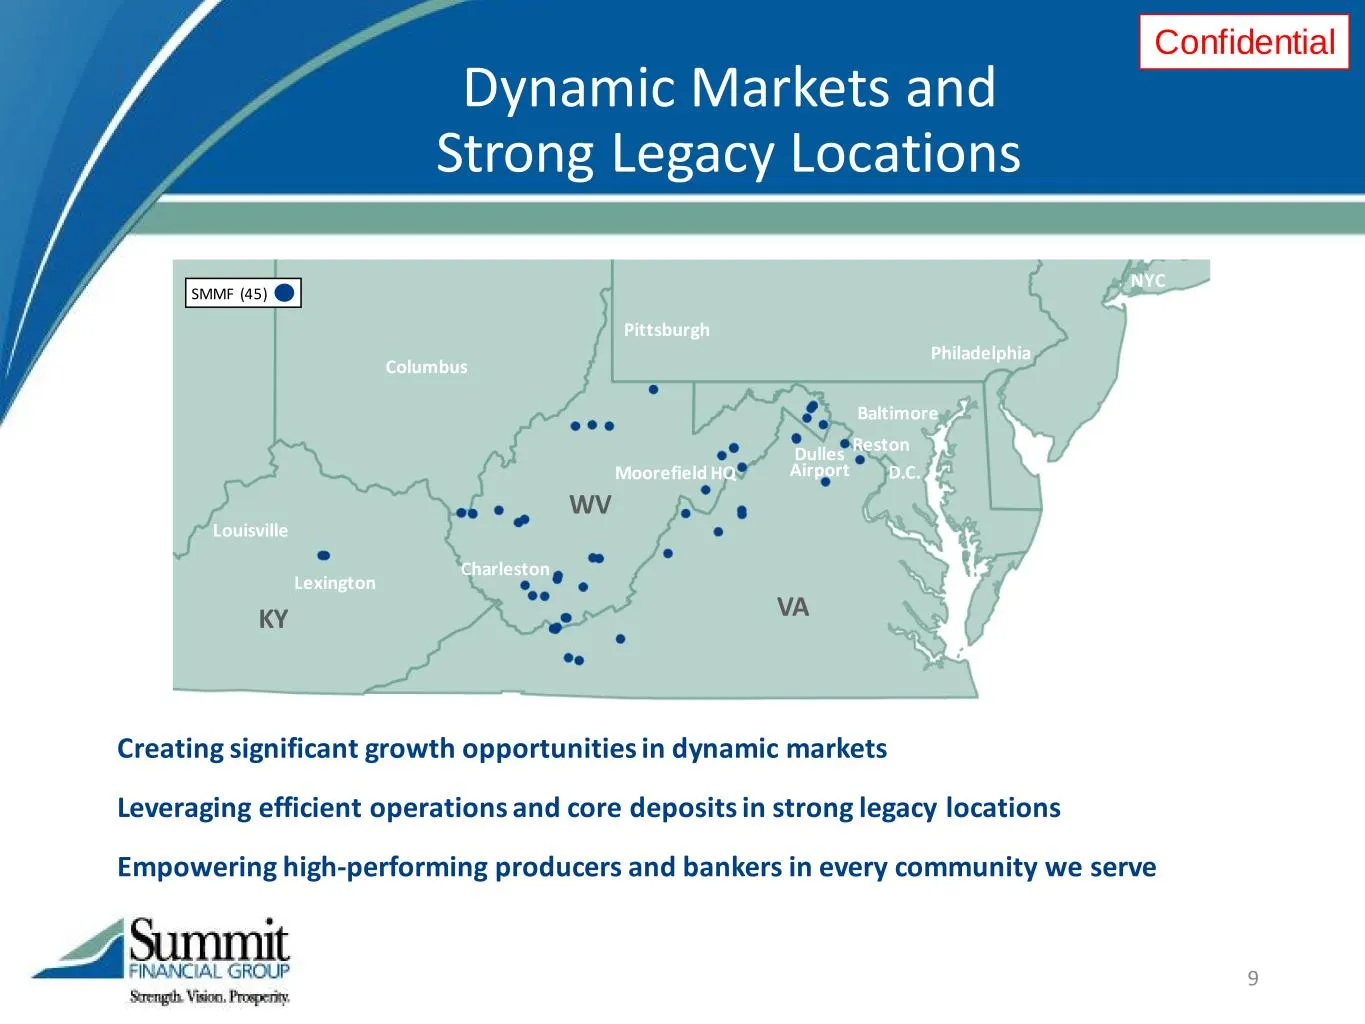
Slide 9: Dynamic Markets and Strong Legacy Locations
Confidential Dynamic Markets and Strong Legacy Locations 9 Creating significant growth opportunities in dynamic markets Leveraging efficient operations and core deposits in strong legacy locations Empowering high-performing producers and bankers in every community we serve SMMF (45) VA WV KY NYC Phi
Slide 10: Our Markets
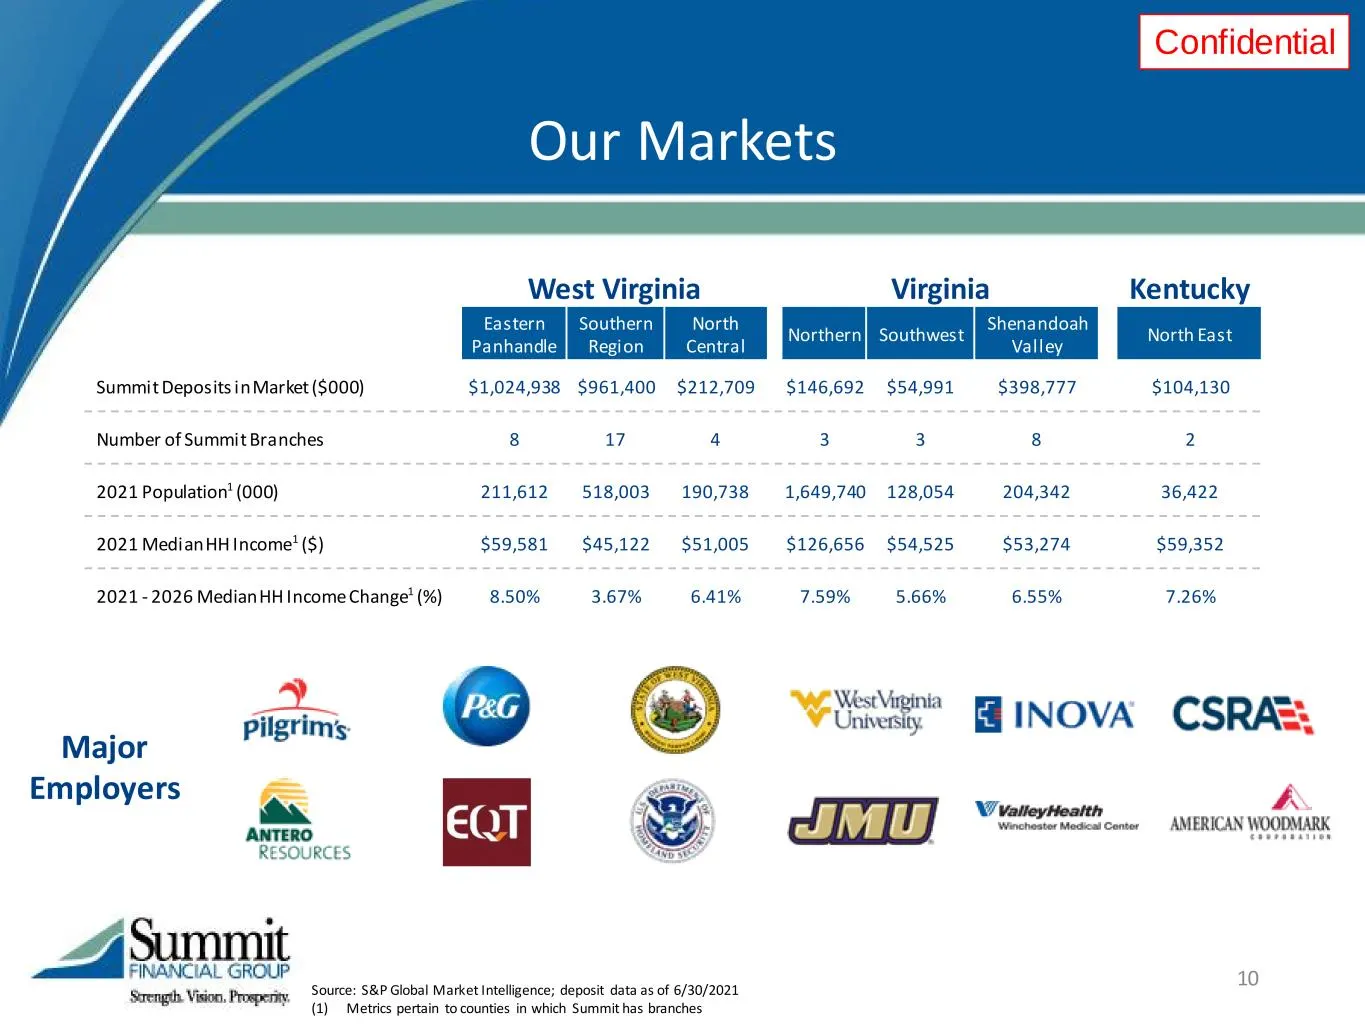
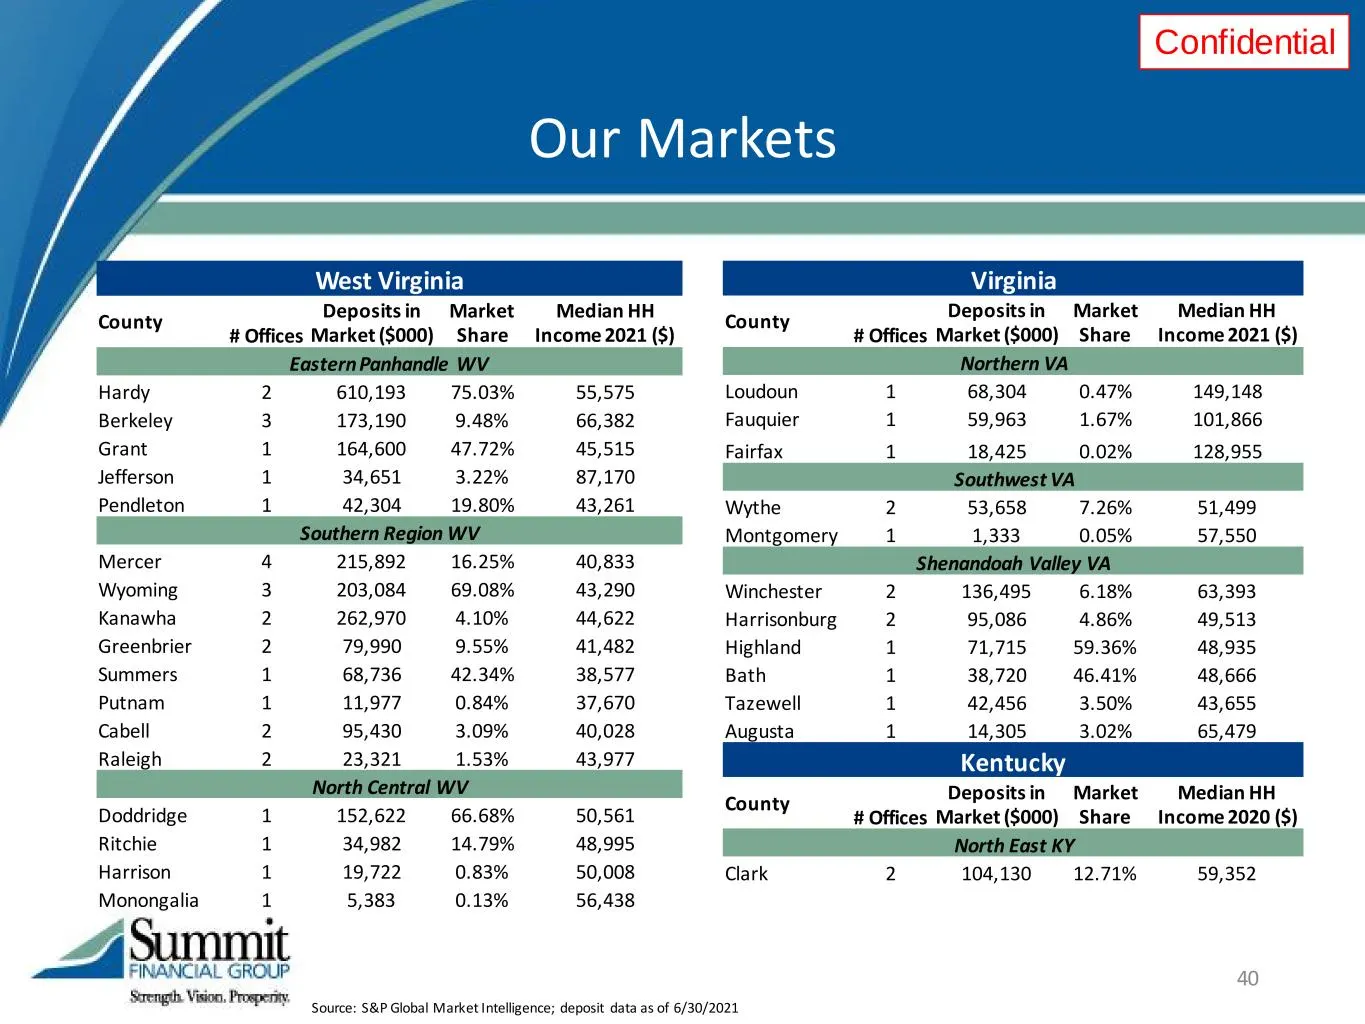
Confidential Our Markets Source: S&P Global Market Intelligence; deposit data as of 6/30/2021 (1) Metrics pertain to counties in which Summit has branches Major Employers 10 West Virginia Virginia Kentucky Eastern Panhandle Southern Region North Central Northern Southwest Shenandoah Valley North Eas
Slide 11: Q3 2021 Highlights
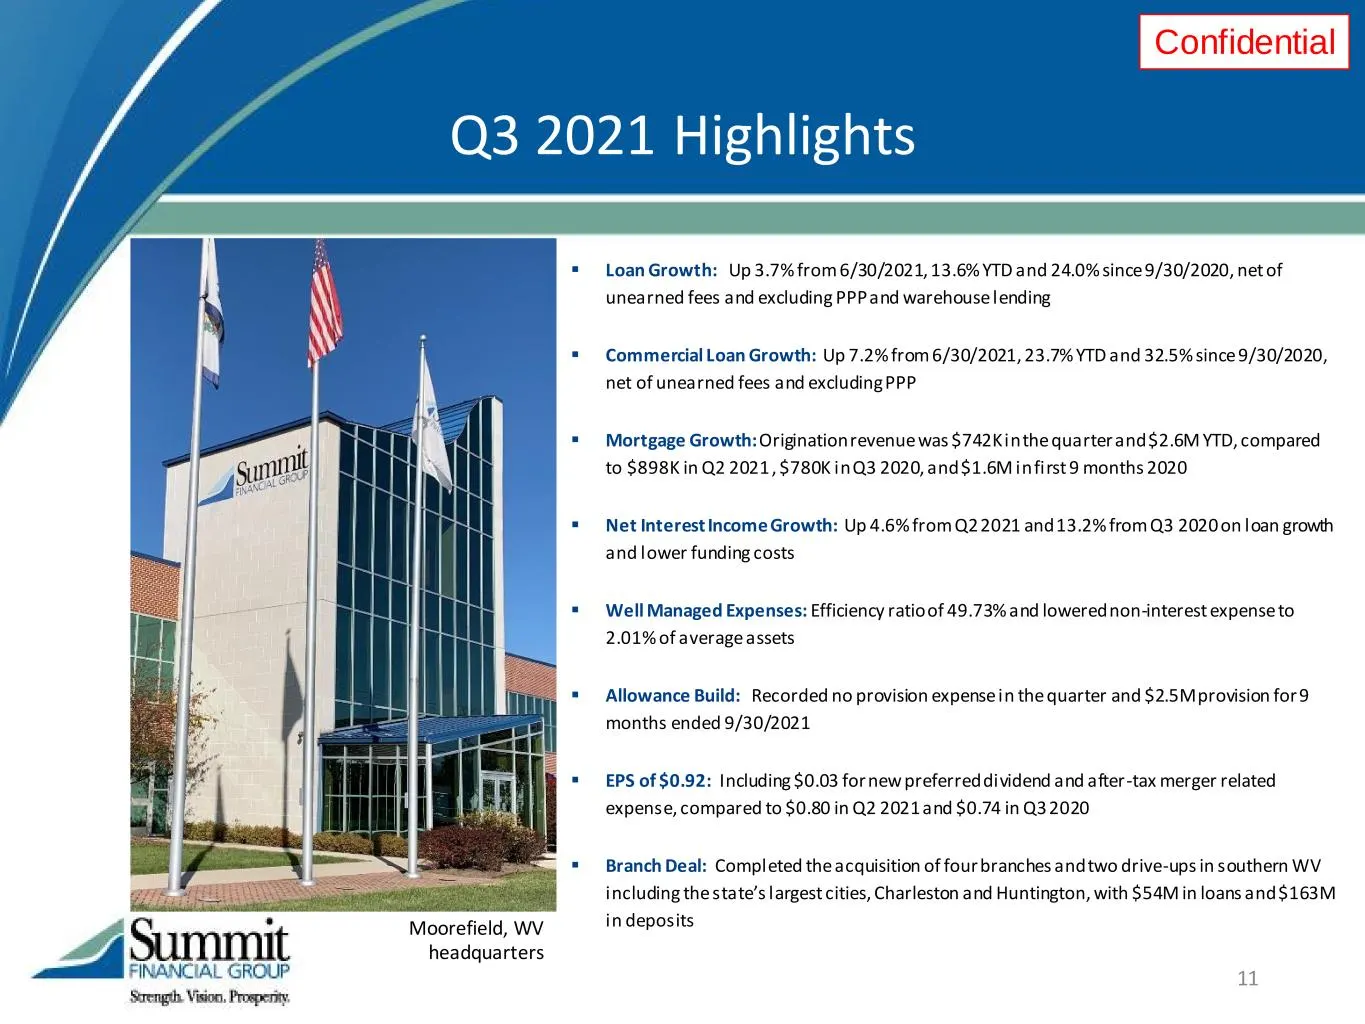
Confidential Q3 2021 Highlights Loan Growth: Up 3.7% from 6/30/2021, 13.6% YTD and 24.0% since 9/30/2020, net of unearned fees and excluding PPP and warehouse lending Commercial Loan Growth: Up 7.2% from 6/30/2021, 23.7% YTD and 32.5% since 9/30/2020, net of unearned fees and excluding PPP Mor
Slide 12: Track Record of Success as Disciplined Acquiror
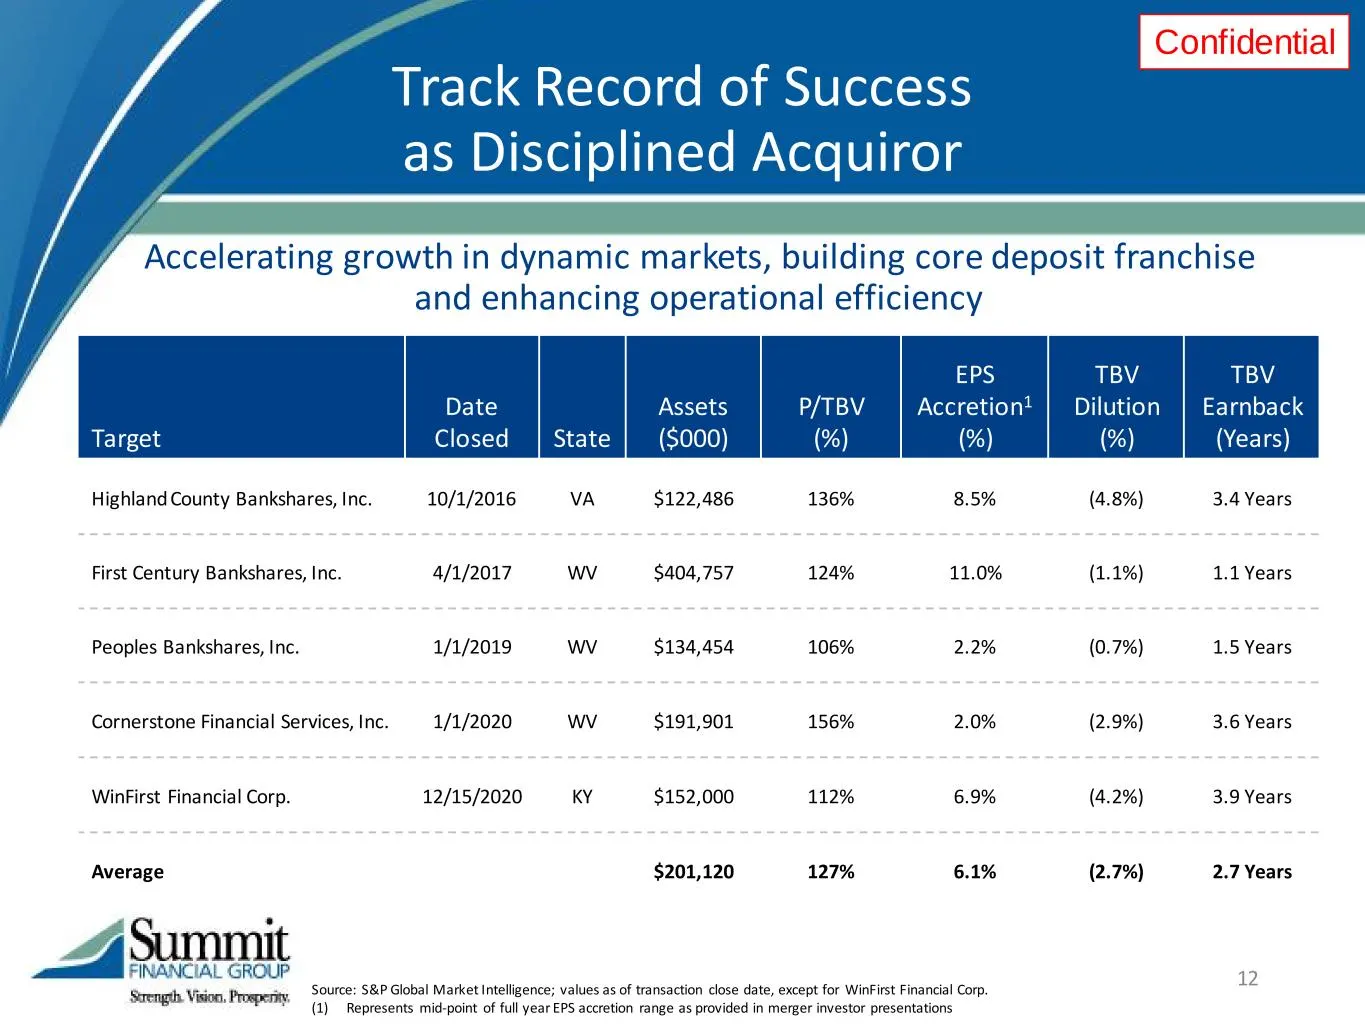
Confidential Track Record of Success as Disciplined Acquiror 12 Source: S&P Global Market Intelligence; values as of transaction close date, except for WinFirst Financial Corp. (1) Represents mid-point of full year EPS accretion range as provided in merger investor presentations Accelerating growth
Slide 13: Recent Branch Acquisitions and De Novo Openings
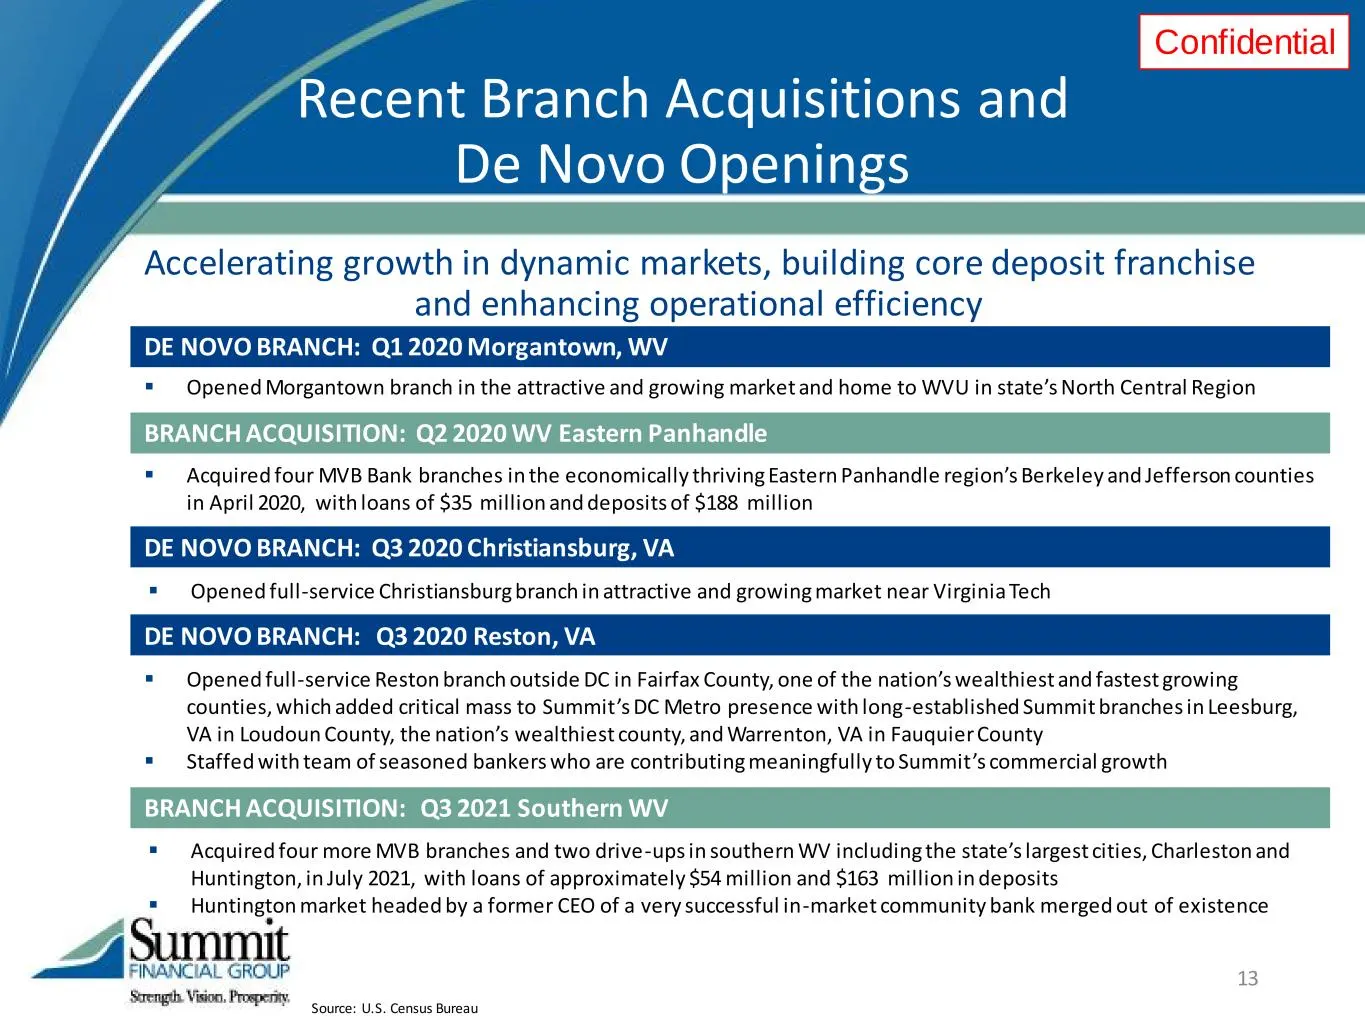
Confidential Recent Branch Acquisitions and De Novo Openings Source: U.S. Census Bureau 13 BRANCH ACQUISITION: Q2 2020 WV Eastern Panhandle DE NOVO BRANCH: Q3 2020 Christiansburg, VA DE NOVO BRANCH: Q3 2020 Reston, VA Acquired four MVB Bank branches in the economically thriving Eastern Panhandle r
Slide 14: Balance Sheet
Confidential Balance Sheet 14
Slide 15: Dynamic Markets and Growth
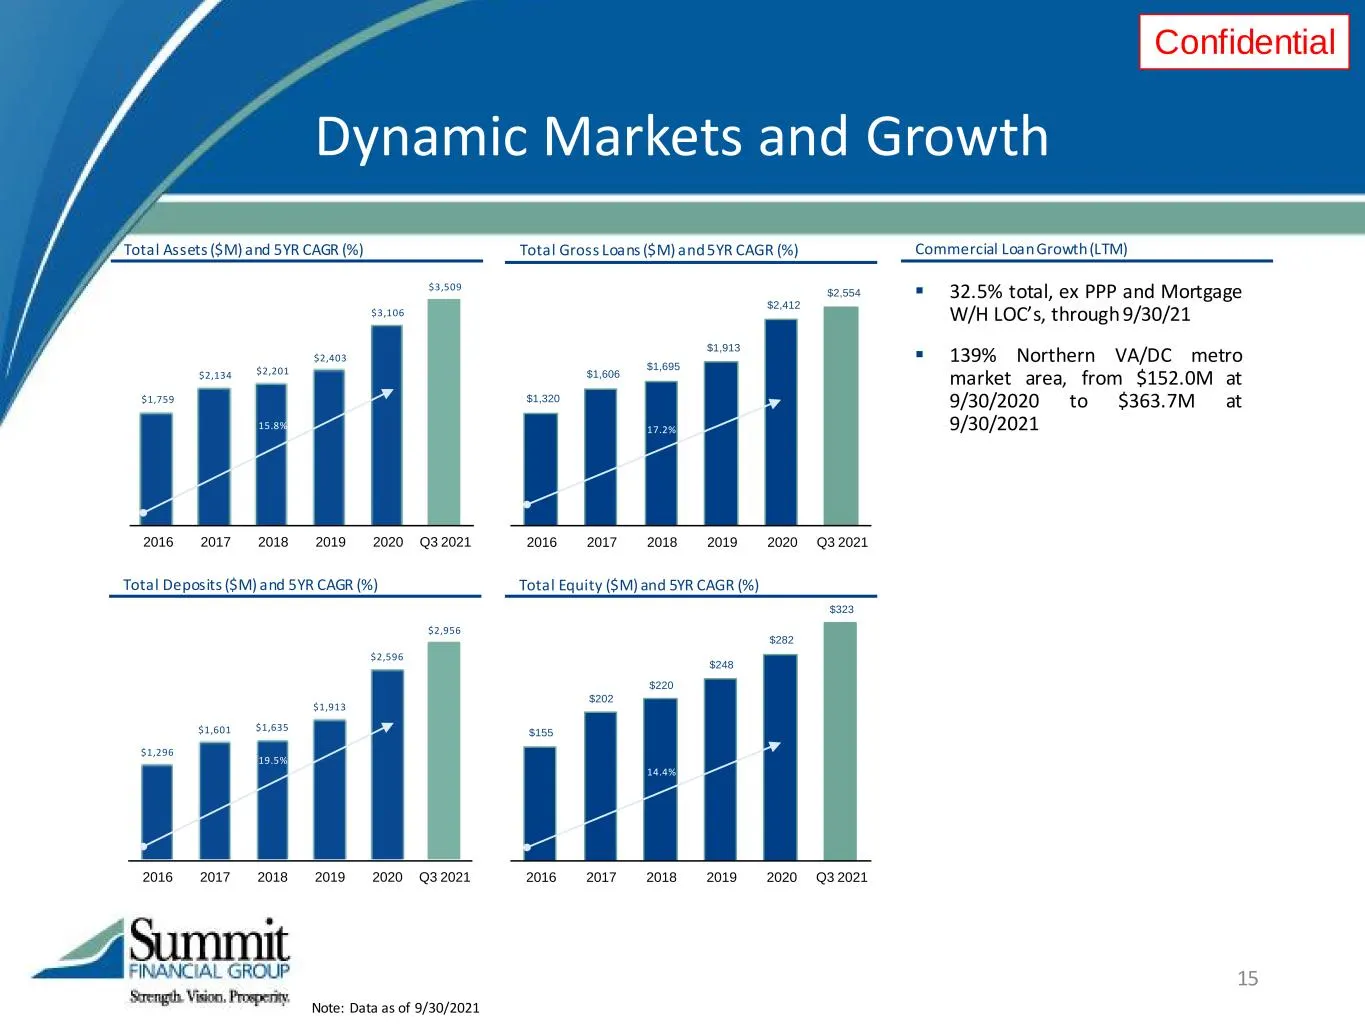
Confidential $1,296 $1,601 $1,635 $1,913 $2,596 $2,956 2016 2017 2018 2019 2020 Q3 2021 Note: Data as of 9/30/2021 15 $1,320 $1,606 $1,695 $1,913 $2,412 $2,554 2016 2017 2018 2019 2020 Q3 2021 Total Gross Loans ($M) and 5YR CAGR (%) Dynamic Markets and Growth $1,759 $2,134 $2,201 $2,403 $3,106 $3,50
Slide 16: Diversified Loan Portfolio
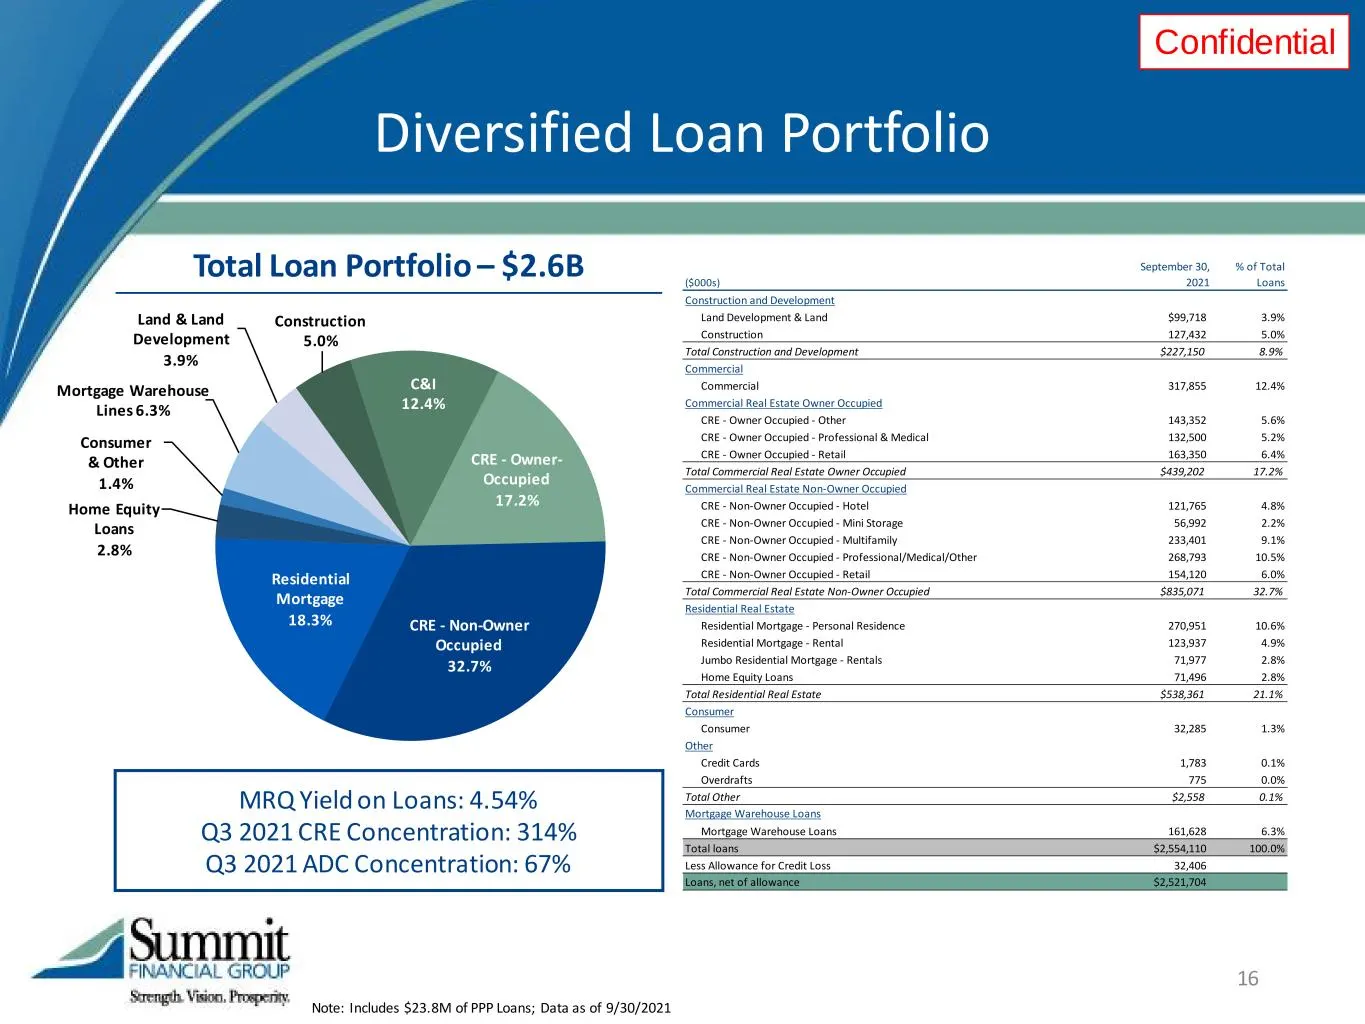
Confidential Diversified Loan Portfolio 16 Land & Land Development 3.9% Construction 5.0% C&I 12.4% CRE - Owner- Occupied 17.2% CRE - Non-Owner Occupied 32.7% Residential Mortgage 18.3% Home Equity Loans 2.8% Consumer & Other 1.4% Mortgage Warehouse Lines 6.3% Total Loan Portfolio – $2.6B Note: Incl
Slide 17: Enhancing Geographic Diversity of Loan Portfolio
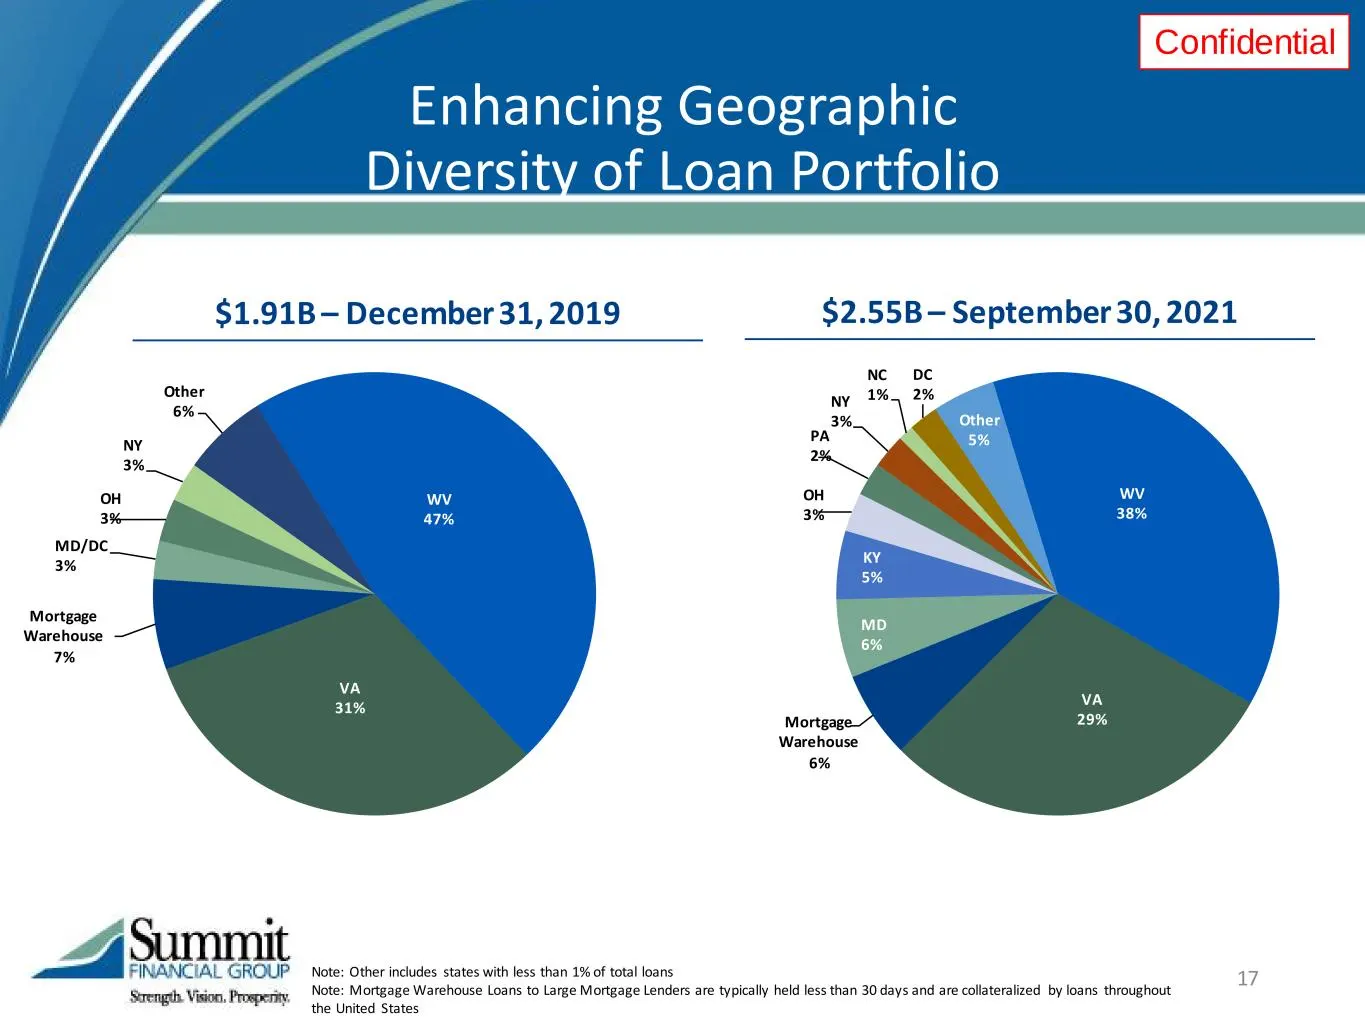
Confidential WV 38% VA 29%Mortgage Warehouse 6% MD 6% KY 5% OH 3% PA 2% NY 3% NC 1% DC 2% Other 5% Enhancing Geographic Diversity of Loan Portfolio Note: Other includes states with less than 1% of total loans Note: Mortgage Warehouse Loans to Large Mortgage Lenders are typically held less than 30 da
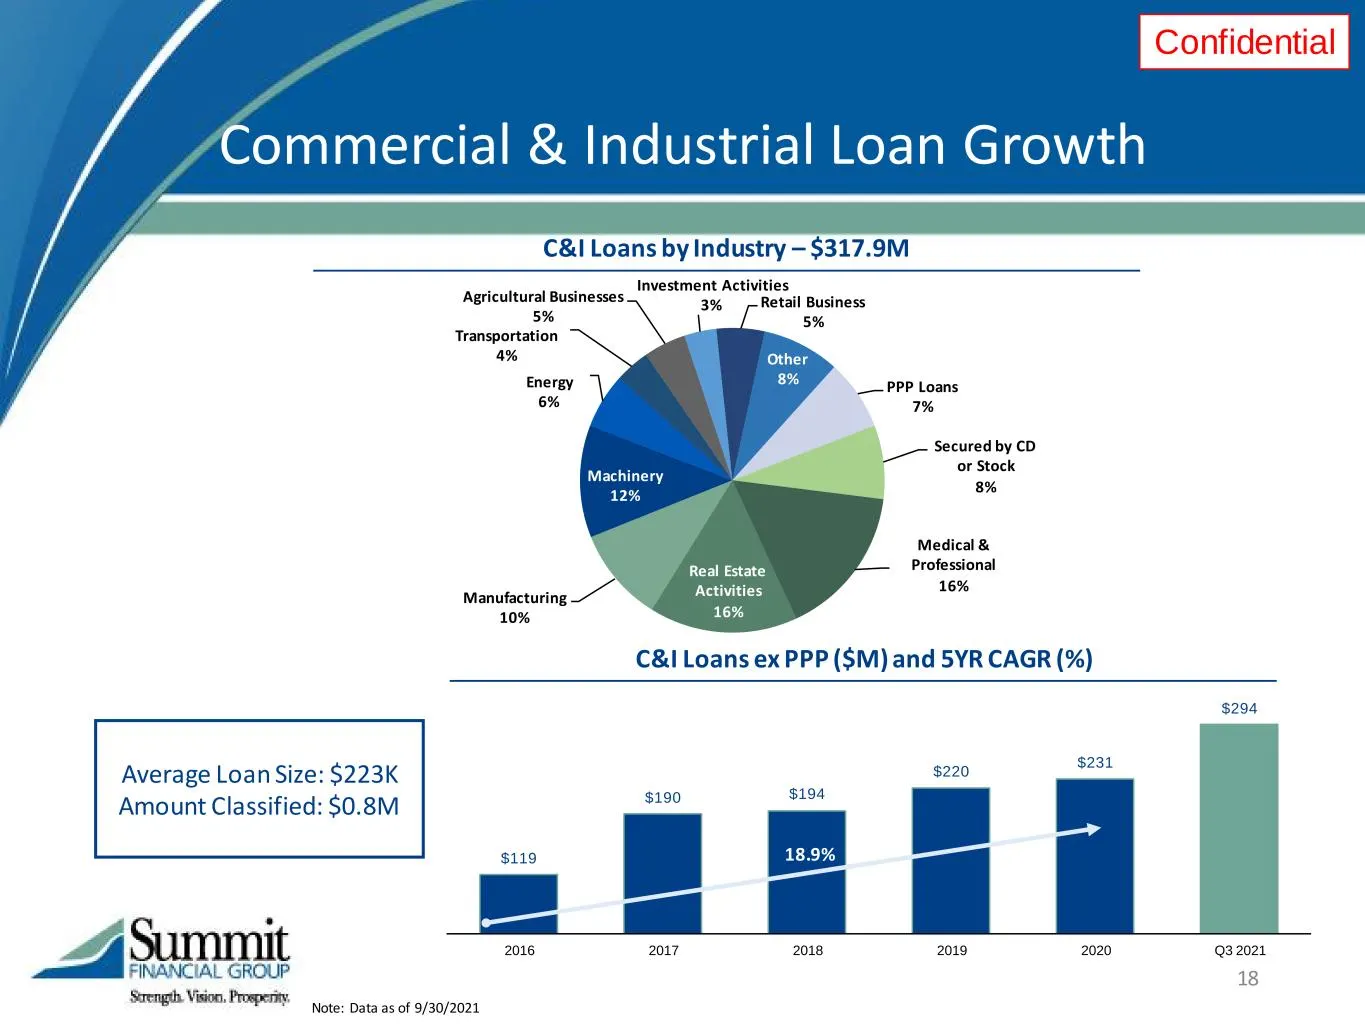
Slide 18: Commercial & Industrial Loan Growth
Confidential Commercial & Industrial Loan Growth 18 C&I Loans by Industry – $317.9M PPP Loans 7% Secured by CD or Stock 8% Medical & Professional 16% Real Estate Activities 16% Manufacturing 10% Machinery 12% Energy 6% Transportation 4% Agricultural Businesses 5% Investment Activities 3% Retail Busi
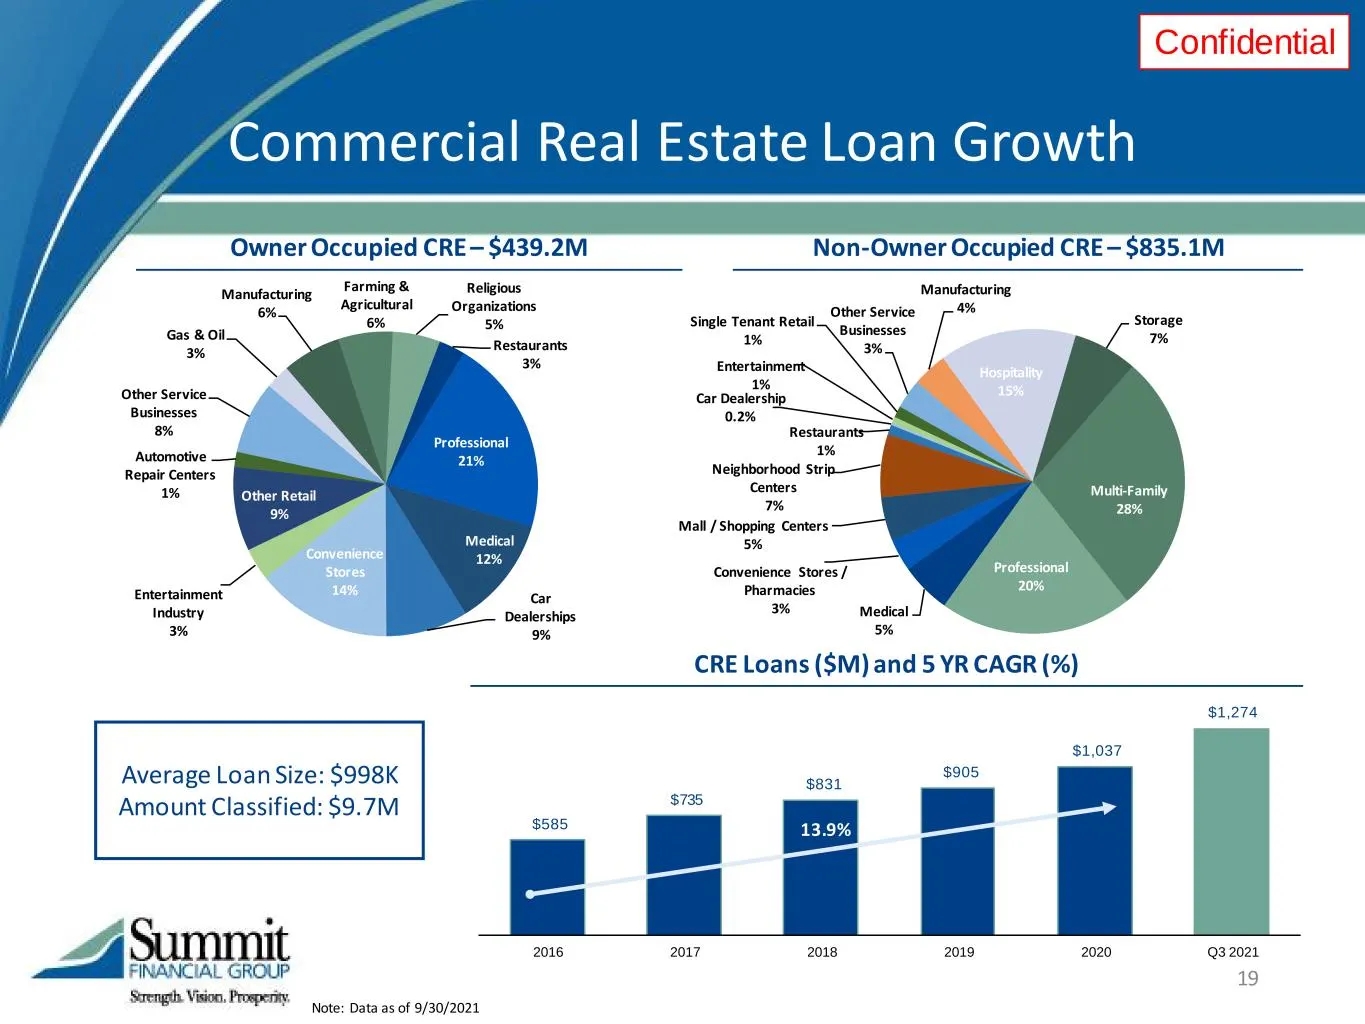
Slide 19: Commercial Real Estate Loan Growth
Confidential Commercial Real Estate Loan Growth 19 Gas & Oil 3% Manufacturing 6% Farming & Agricultural 6% Religious Organizations 5% Restaurants 3% Professional 21% Medical 12% Car Dealerships 9% Convenience Stores 14%Entertainment Industry 3% Other Retail 9% Automotive Repair Centers 1% Other Serv
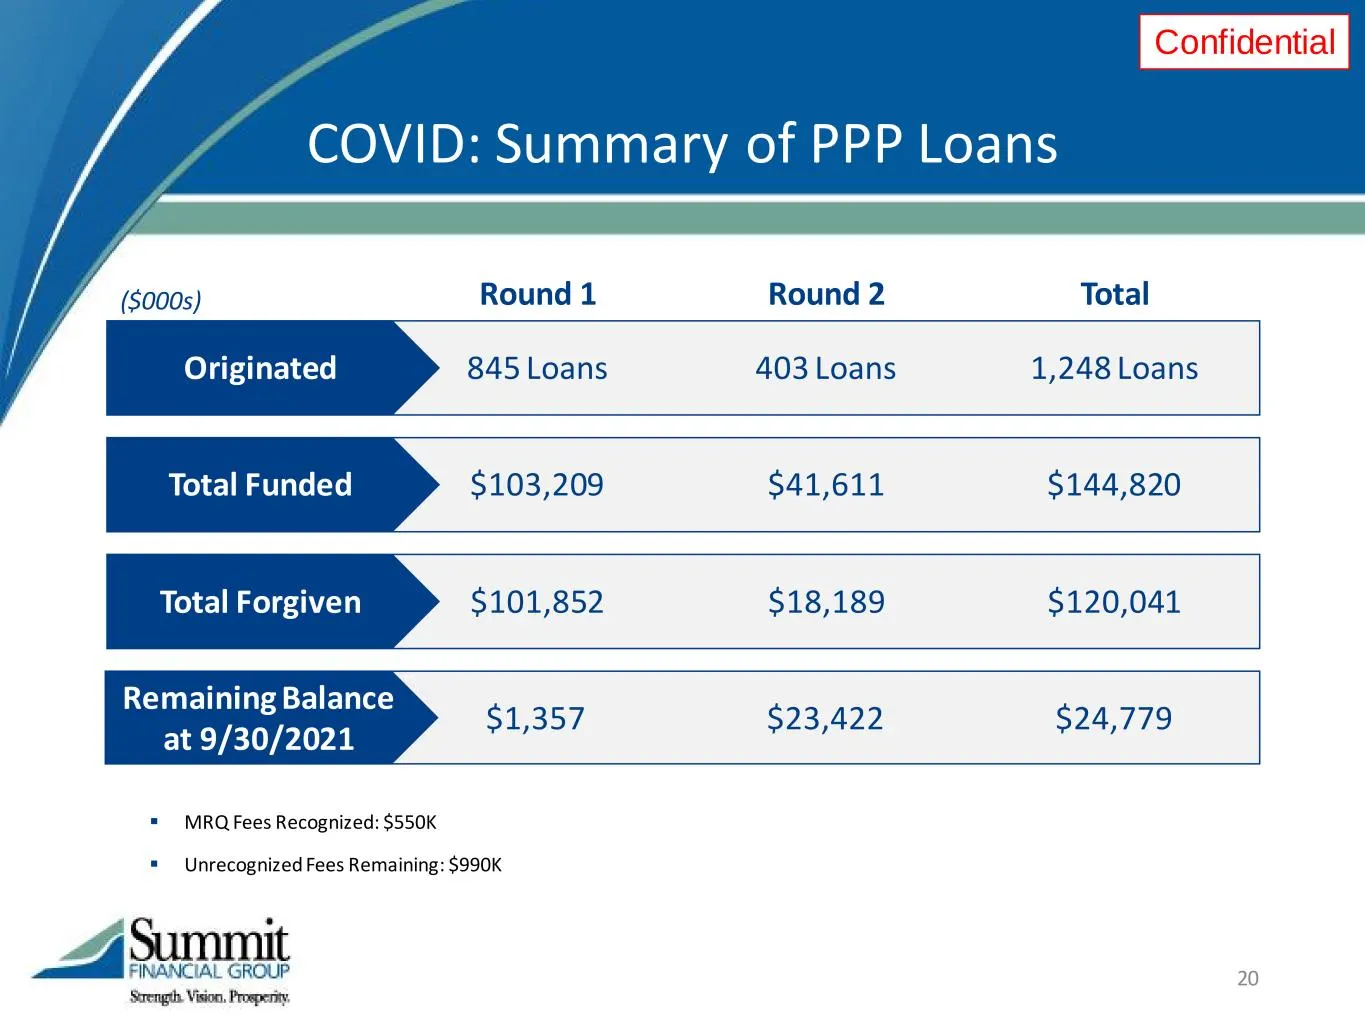
Slide 20: COVID: Summary of PPP Loans Originated
Confidential 20 COVID: Summary of PPP Loans Originated 845 Loans 403 Loans 1,248 Loans Total Funded $103,209 $41,611 $144,820 Total Forgiven $101,852 $18,189 $120,041 Remaining Balance at 9/30/2021 $1,357 $23,422 $24,779 Round 1 Round 2 Total($000s) MRQ Fees Recognized: $550K Unrecognized Fees R
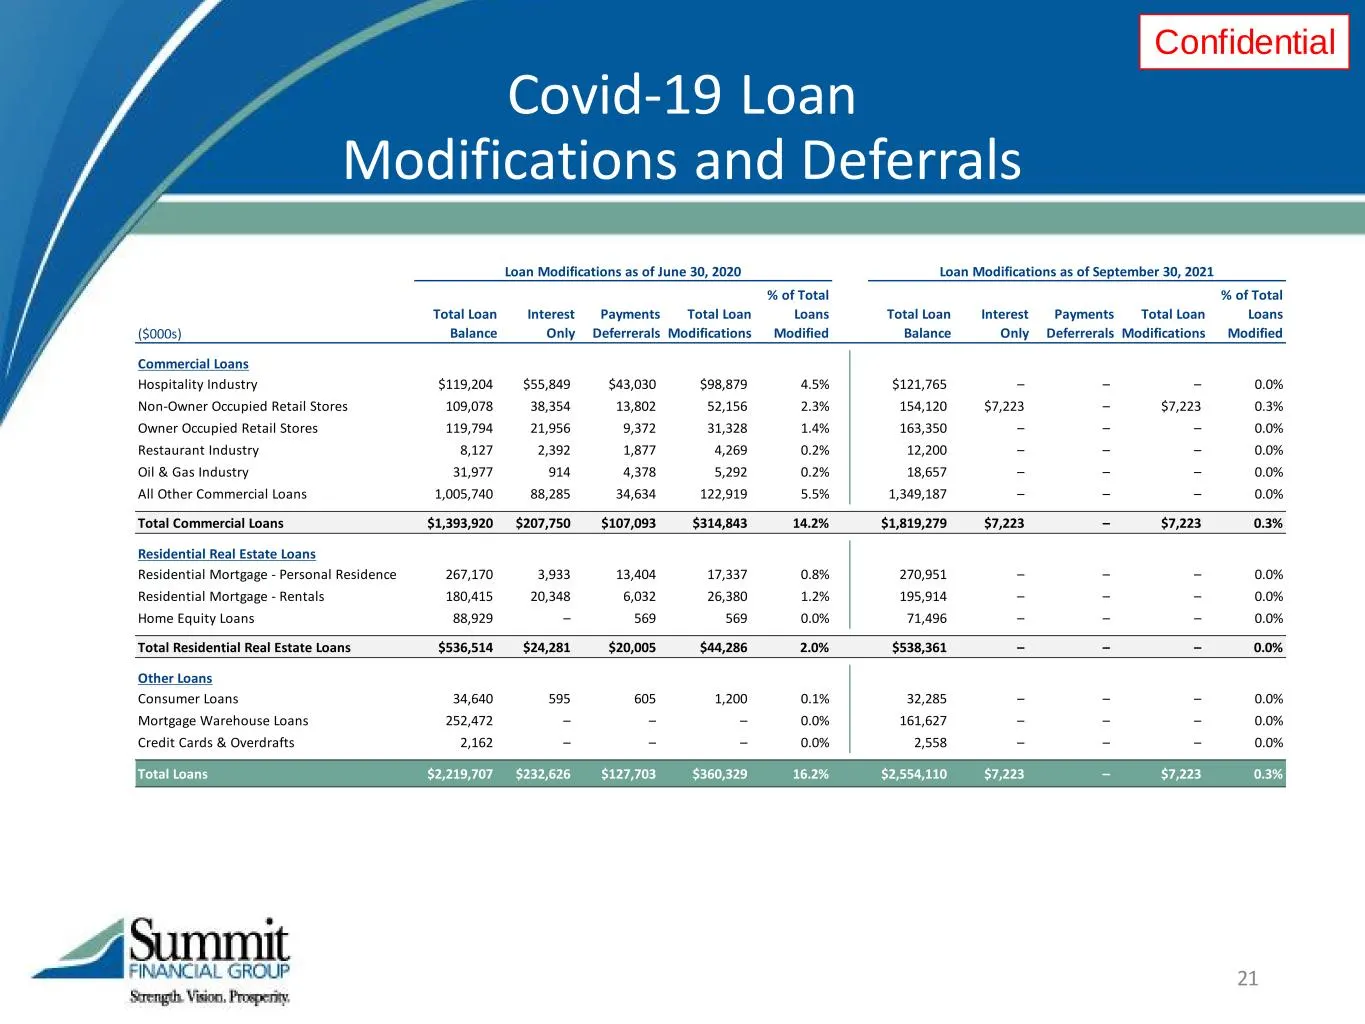
Slide 21: Covid-19 Loan Modifications and Deferrals
Confidential 21 Covid-19 Loan Modifications and Deferrals Loan Modifications as of June 30, 2020 Loan Modifications as of September 30, 2021 ($000s) Total Loan Balance Interest Only Payments Deferrerals Total Loan Modifications % of Total Loans Modified Total Loan Balance Interest Only Payments Defe
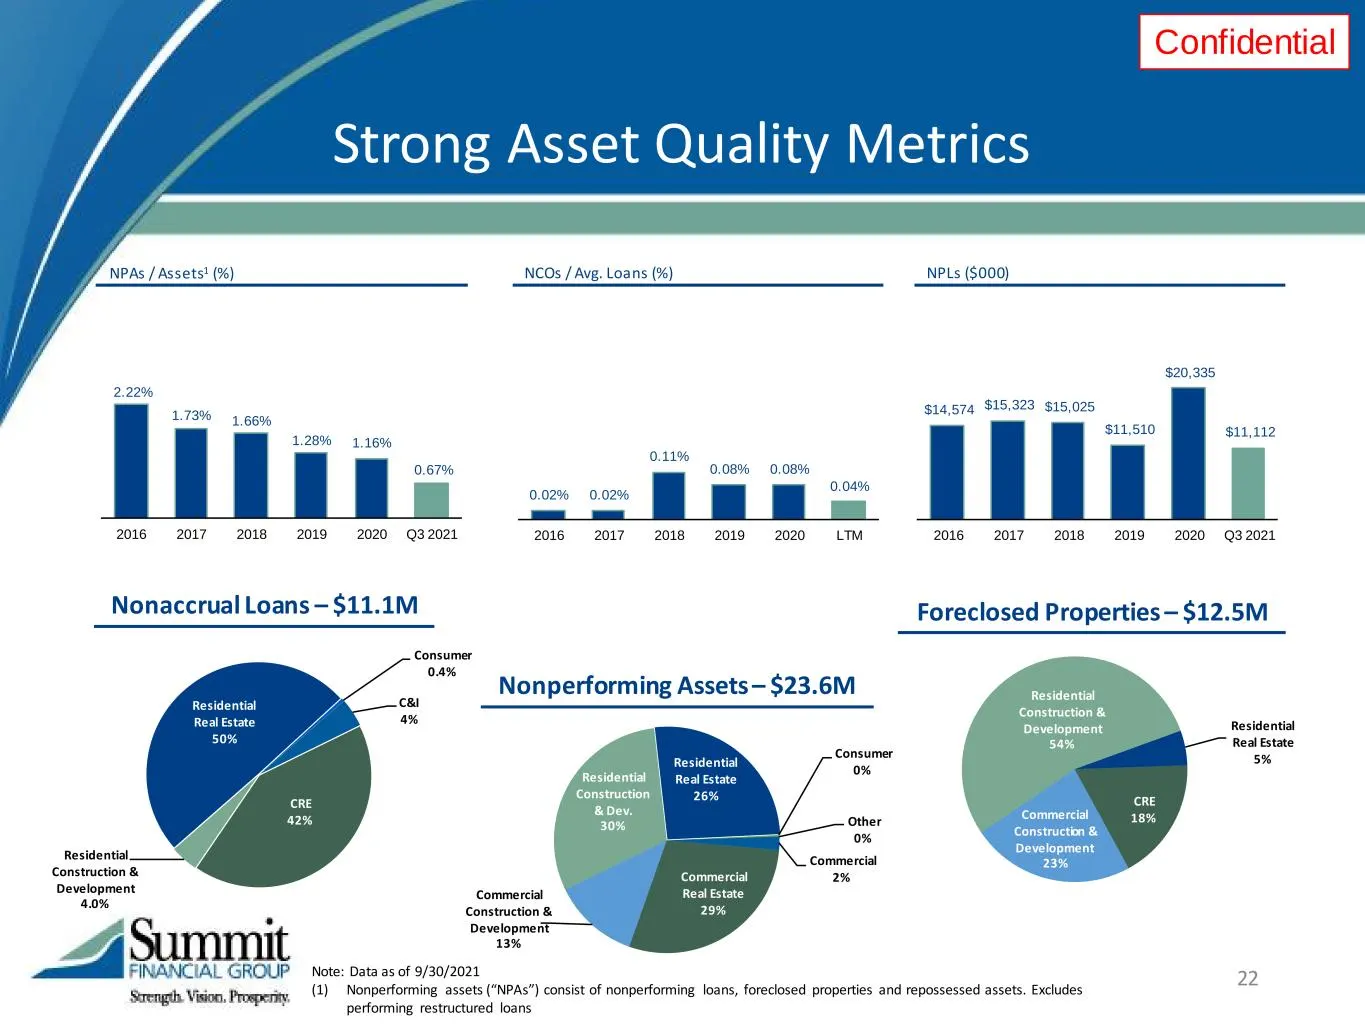
Slide 22: Strong Asset Quality Metrics
Confidential 22 Strong Asset Quality Metrics Nonaccrual Loans – $11.1M C&I 4% CRE 42% Residential Construction & Development 4.0% Residential Real Estate 50% Consumer 0.4% Foreclosed Properties – $12.5M CRE 18%Commercial Construction & Development 23% Residential Construction & Development 54% Resid
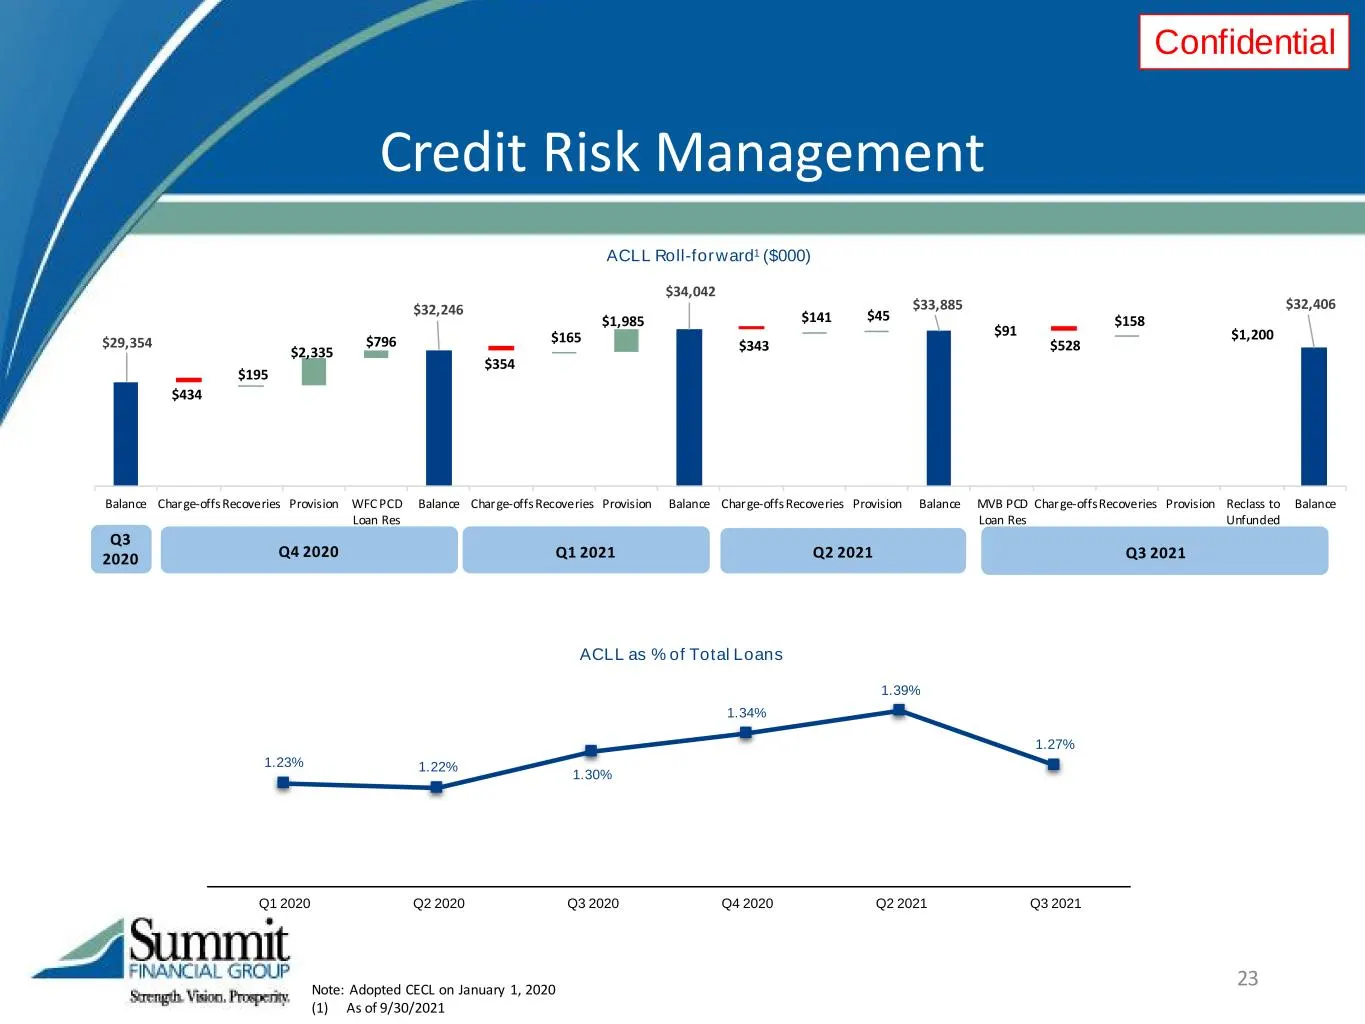
Slide 23: Credit Risk Management
Confidential $29,354 $32,246 $34,042 $33,885 $32,406 $195 $2,335 $796 $165 $1,985 $141 $45 $91 $158 $434 $354 $343 $528 $1,200 Balance Charge-offs Recoveries Provision WFC PCD Loan Res Balance Charge-offs Recoveries Provision Balance Charge-offs Recoveries Provision Balance MVB PCD Loan Res Charge-o
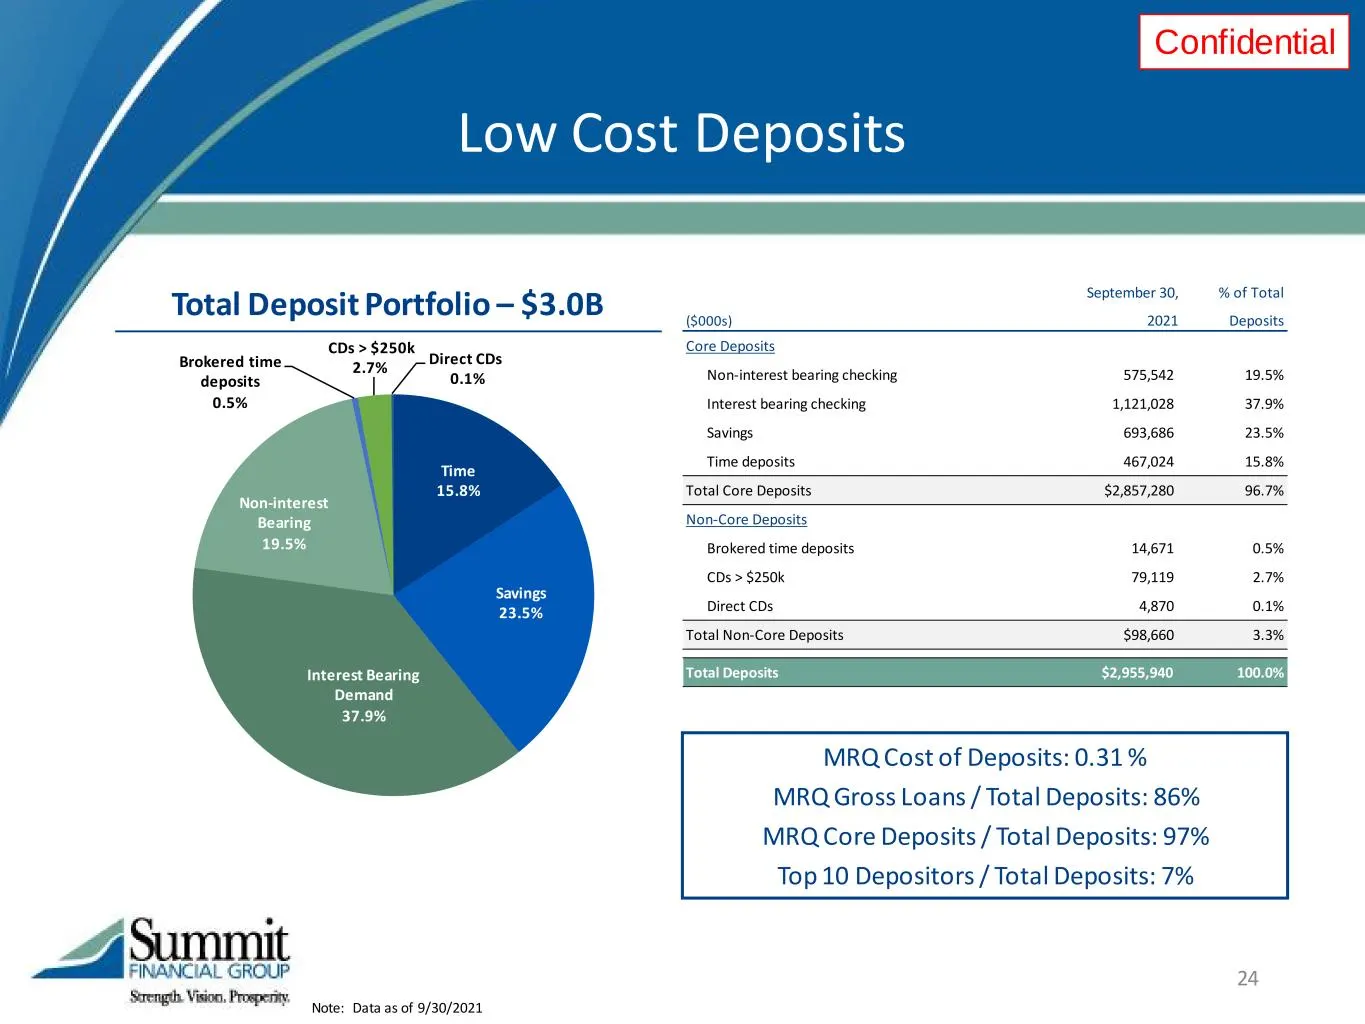
Slide 24: Low Cost Deposits
Confidential Low Cost Deposits 24 Note: Data as of 9/30/2021 Time 15.8% Savings 23.5% Interest Bearing Demand 37.9% Non-interest Bearing 19.5% Brokered time deposits 0.5% CDs > $250k 2.7% Direct CDs Total Deposit Portfolio – $3.0B MRQ Cost of Deposits: 0.31 % MRQ Gross Loans / Total Deposits: 86% MR
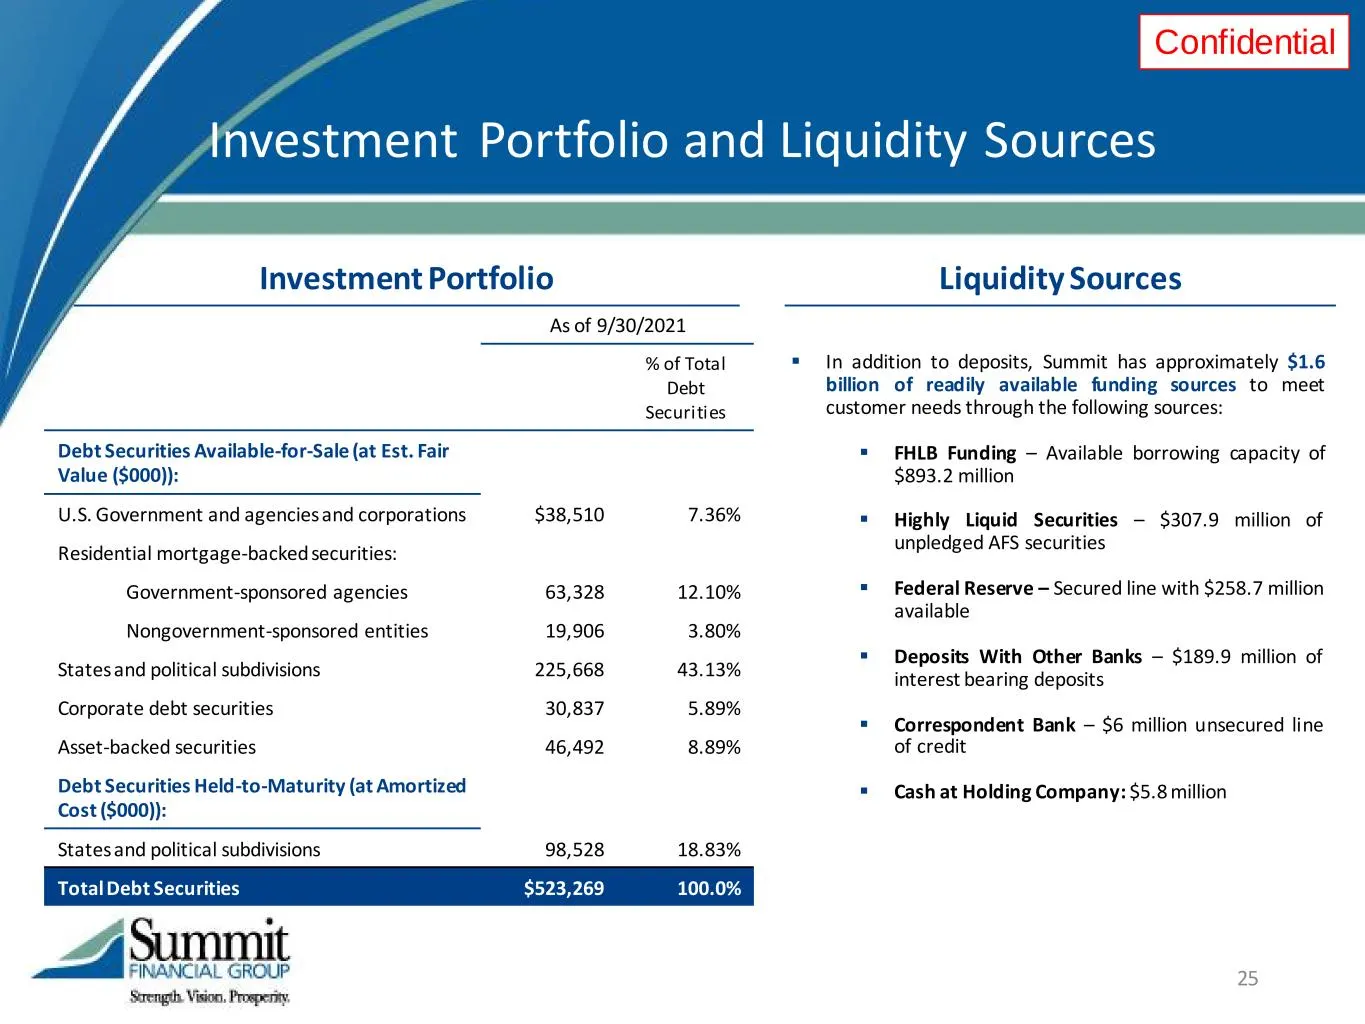
Slide 25: Investment Portfolio and Liquidity Sources
Confidential Investment Portfolio and Liquidity Sources As of 9/30/2021 % of Total Debt Securities Debt Securities Available-for-Sale (at Est. Fair Value ($000)): U.S. Government and agencies and corporations $38,510 7.36% Residential mortgage-backed securities: Government-sponsored agencies 63,328
Slide 26: Profitability
Confidential Profitability 26
Slide 27: Profitable Growth
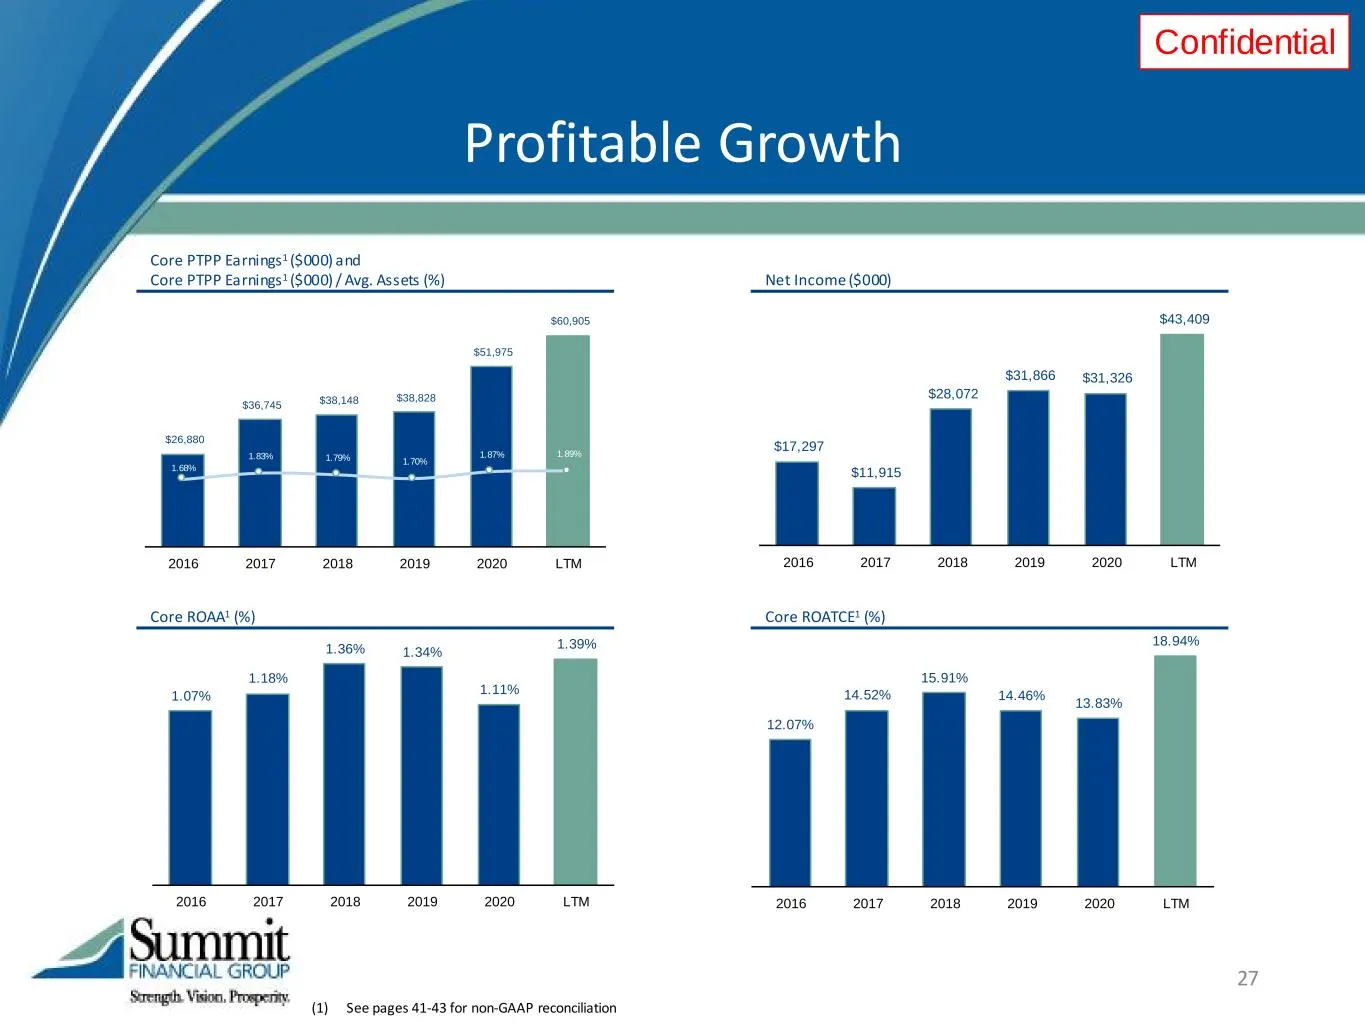
Confidential $17,297 $11,915 $28,072 $31,866 $31,326 $43,409 2016 2017 2018 2019 2020 LTM Net Income ($000) 27 Profitable Growth 1.07% 1.18% 1.36% 1.34% 1.11% 1.39% 2016 2017 2018 2019 2020 LTM 12.07% 14.52% 15.91% 14.46% 13.83% 18.94% 2016 2017 2018 2019 2020 LTM Core ROAA1 (%) Core ROATCE1 (%) $26
Slide 28: Growing Revenue and Improving Operating Leverage
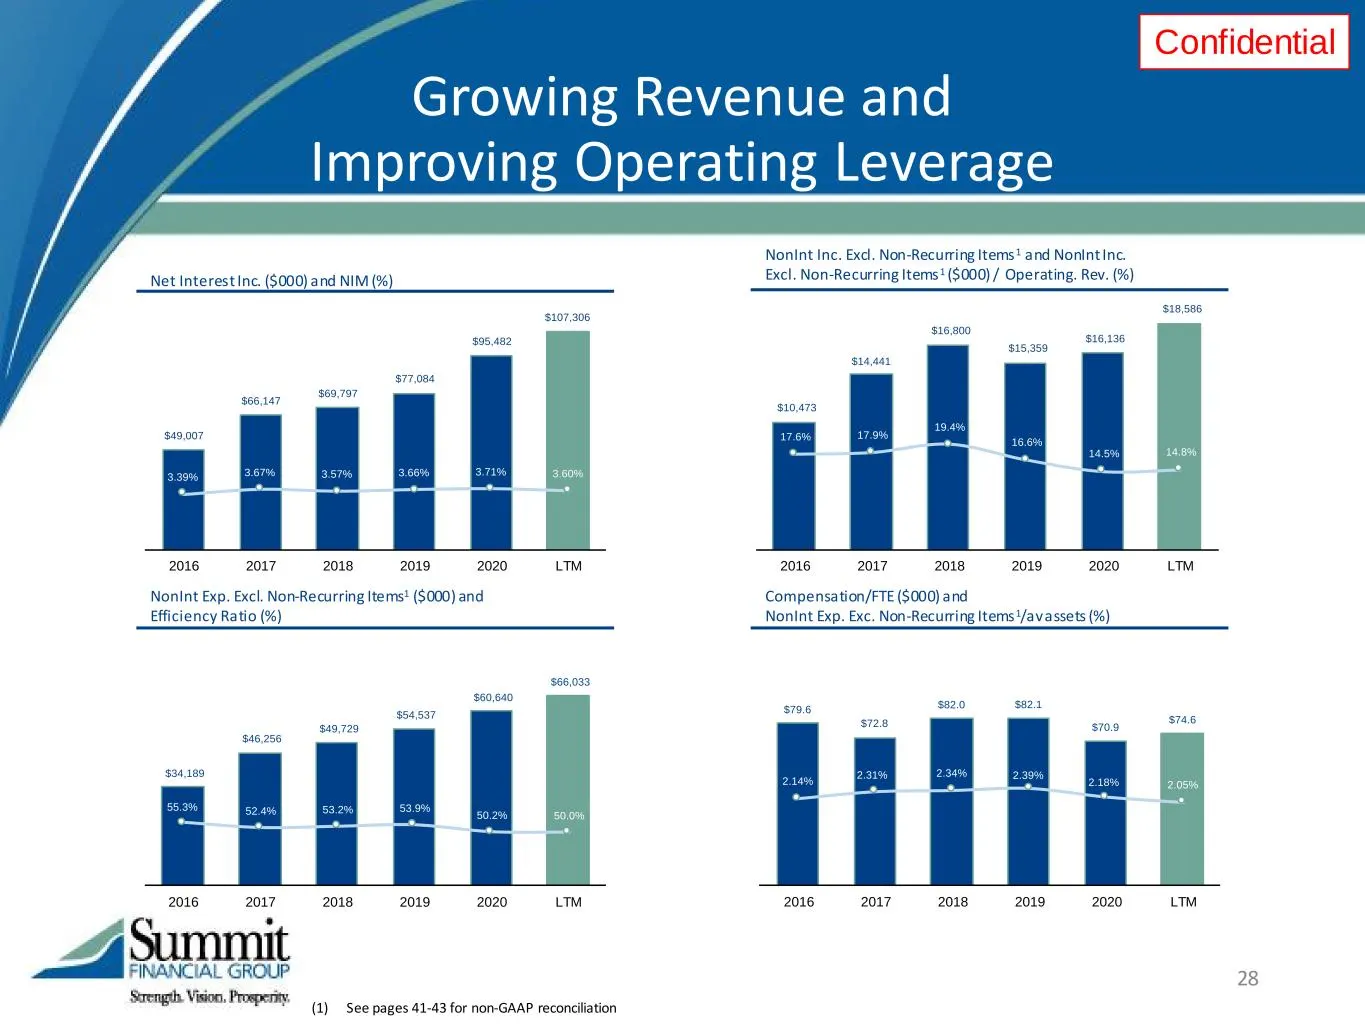
Confidential NonInt Inc. Excl. Non-Recurring Items1 and NonInt Inc. Excl. Non-Recurring Items1 ($000) / Operating. Rev. (%) 28 NonInt Exp. Excl. Non-Recurring Items1 ($000) and Efficiency Ratio (%) Compensation/FTE ($000) and NonInt Exp. Exc. Non-Recurring Items1/av assets (%) Net Interest Inc. ($00
Slide 29: Interest Rate Sensitivity
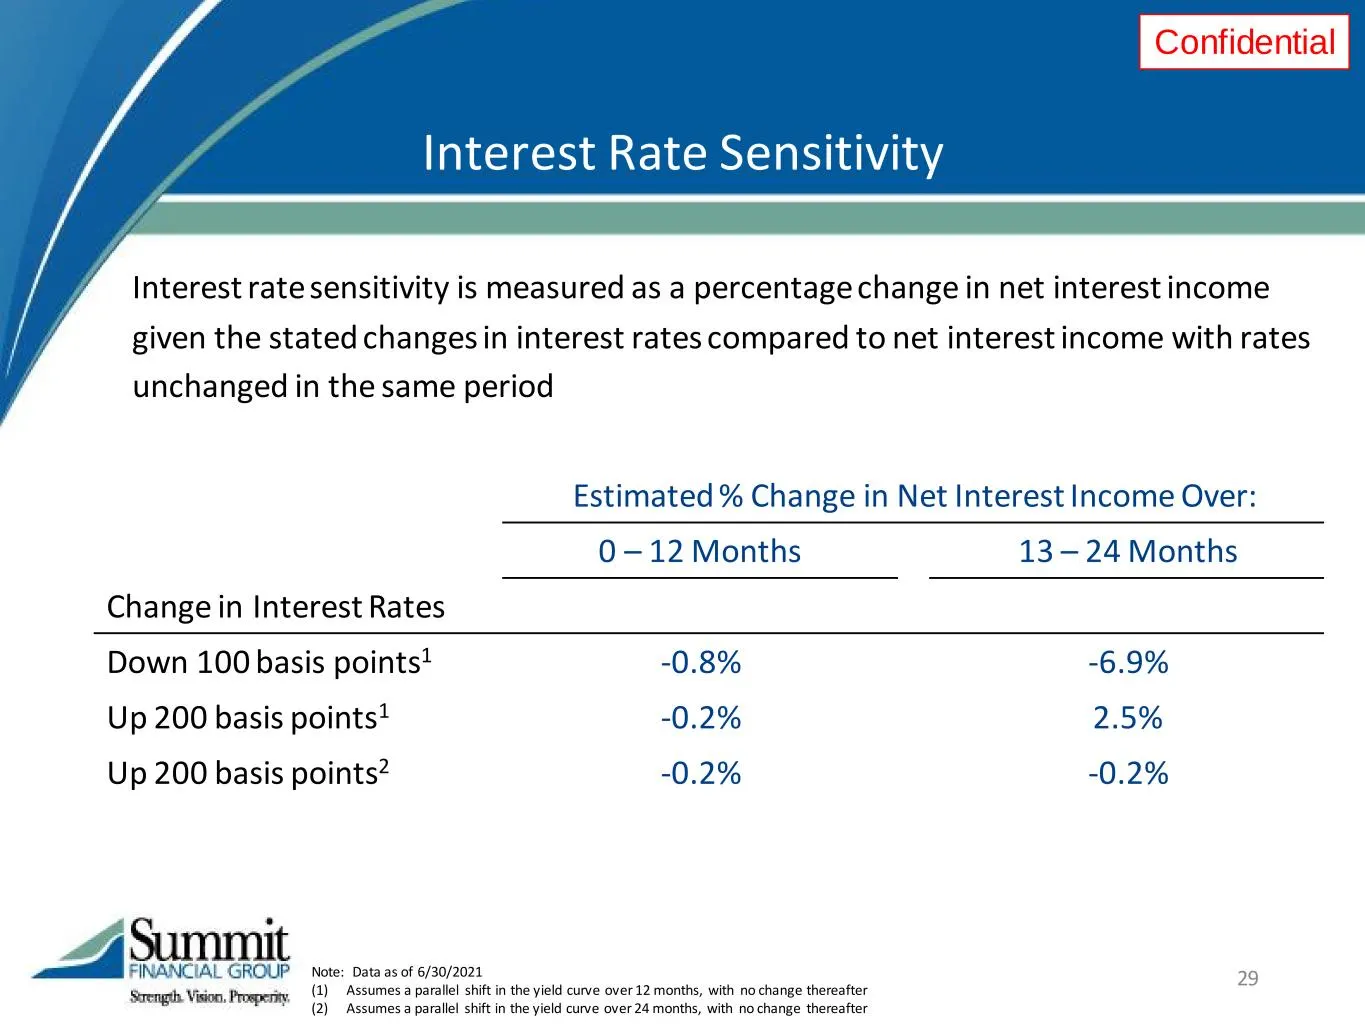
Confidential Estimated % Change in Net Interest Income Over: 0 – 12 Months 13 – 24 Months Change in Interest Rates Down 100 basis points1 -0.8% -6.9% Up 200 basis points1 -0.2% 2.5% Up 200 basis points2 -0.2% -0.2% 29 Interest rate sensitivity is measured as a percentage change in net interest incom
Slide 30: Capital
Confidential Capital A FINANCIAL GROUP 0 ‘Strength. Vision, Prosperity.
Slide 31: Capital
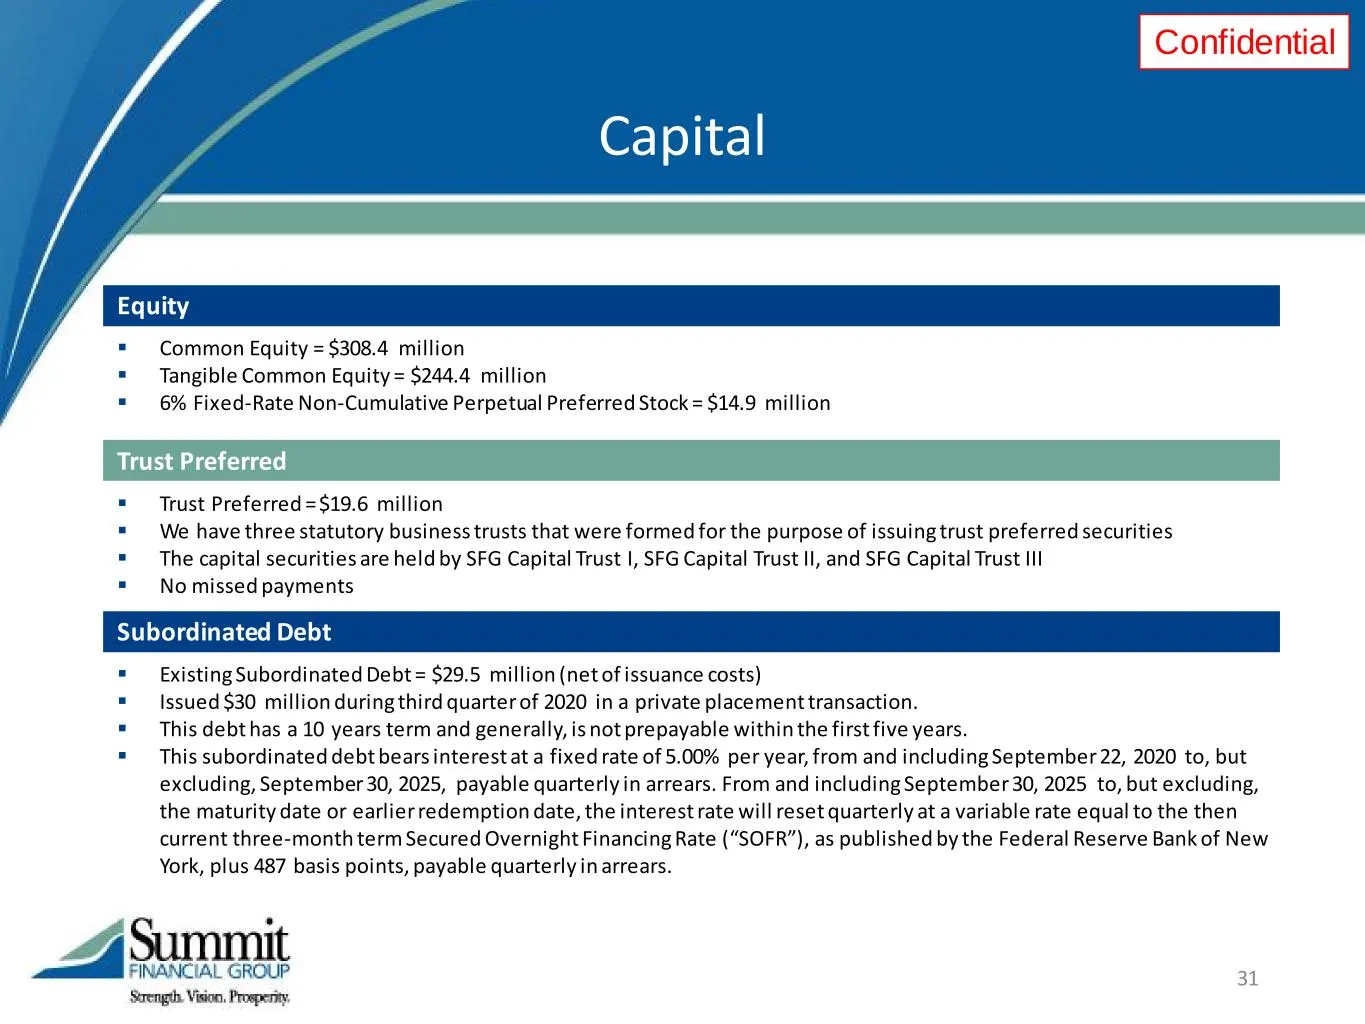
Confidential 31 Capital Trust Preferred Trust Preferred = $19.6 million We have three statutory business trusts that were formed for the purpose of issuing trust preferred securities The capital securities are held by SFG Capital Trust I, SFG Capital Trust II, and SFG Capital Trust III No mi
Slide 32: Well-Capitalized Position
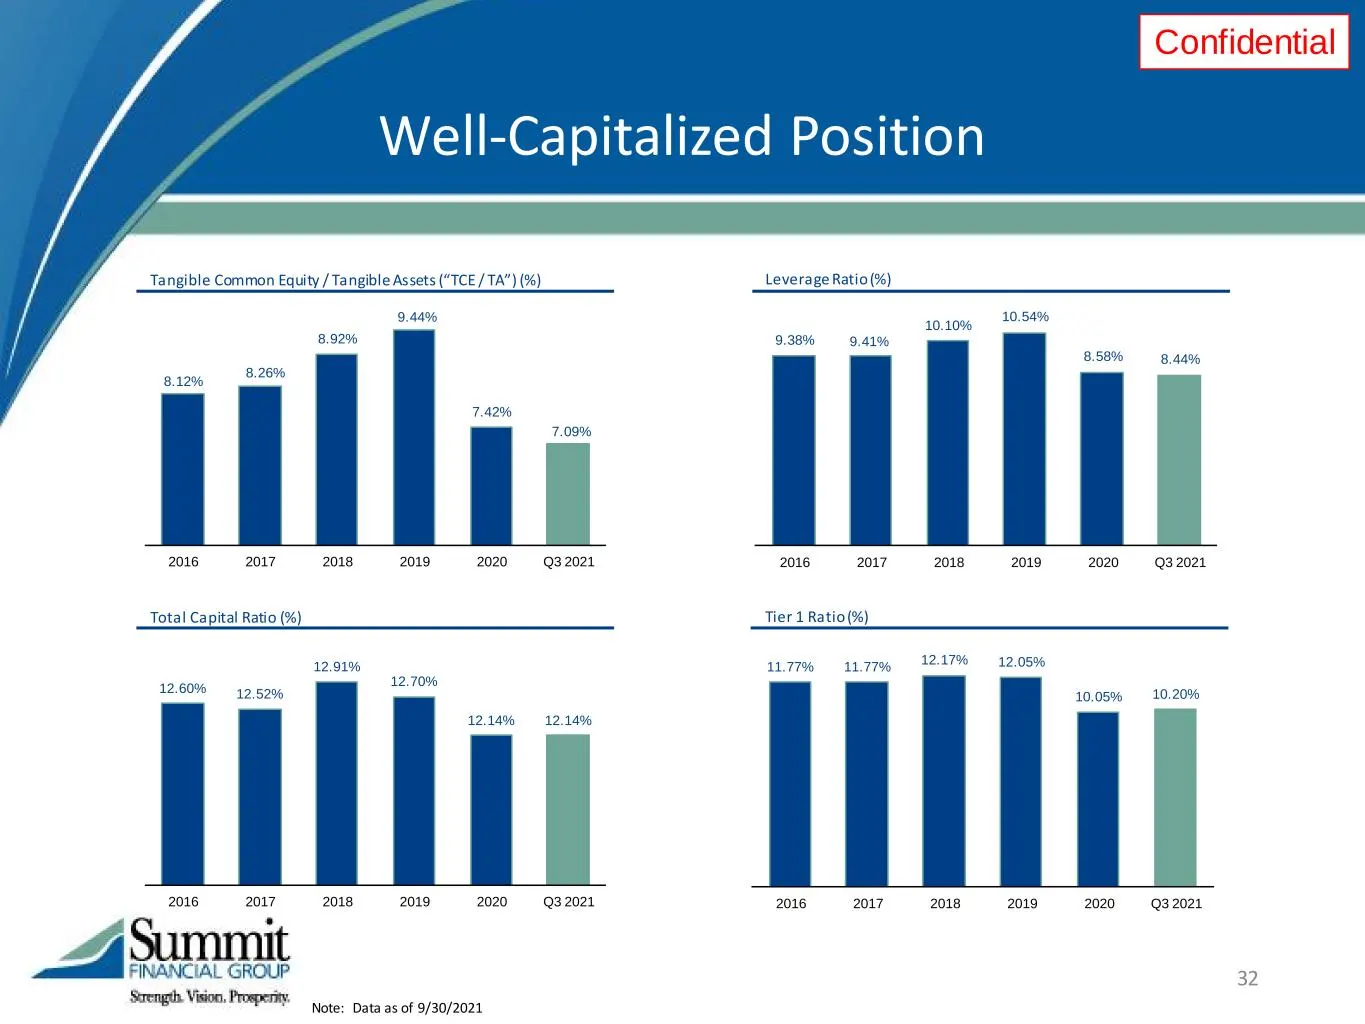
Confidential 32 Note: Data as of 9/30/2021 Well-Capitalized Position 8.12% 8.26% 8.92% 9.44% 7.42% 7.09% 2016 2017 2018 2019 2020 Q3 2021 Tangible Common Equity / Tangible Assets (“TCE / TA”) (%) 12.60% 12.52% 12.91% 12.70% 12.14% 12.14% 2016 2017 2018 2019 2020 Q3 2021 Total Capital Ratio (%) 9.38%
Slide 33: Pro Forma Capital Ratios
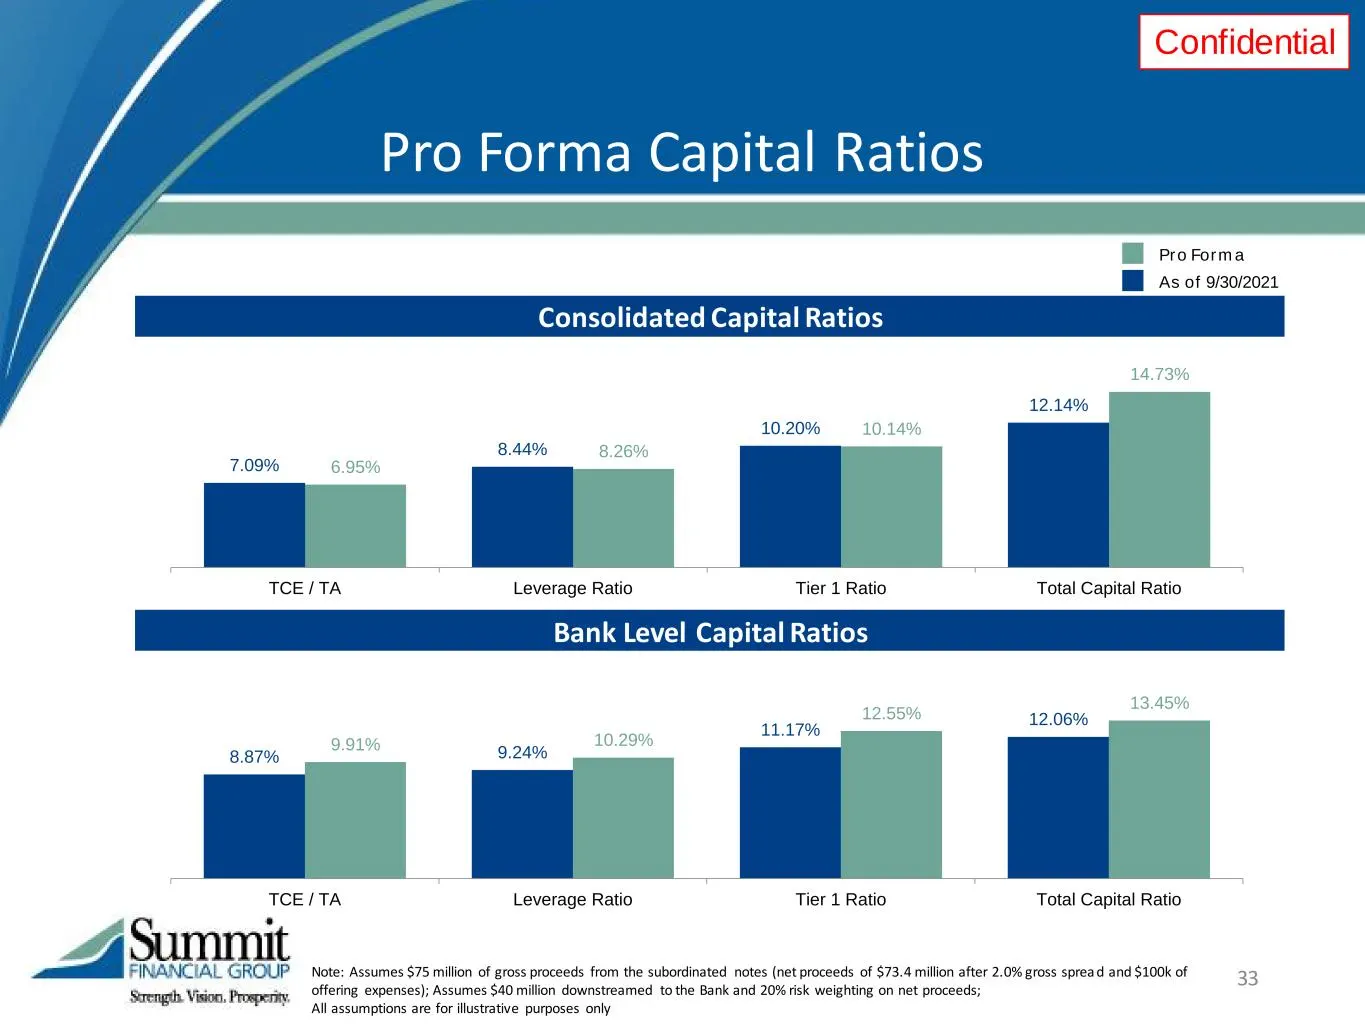
Confidential 33Note: Assumes $75 million of gross proceeds from the subordinated notes (net proceeds of $73.4 million after 2.0% gross sprea d and $100k of offering expenses); Assumes $40 million downstreamed to the Bank and 20% risk weighting on net proceeds; All assumptions are for illustrative pu
Slide 34: Double Leverage & Interest Coverage Ratio
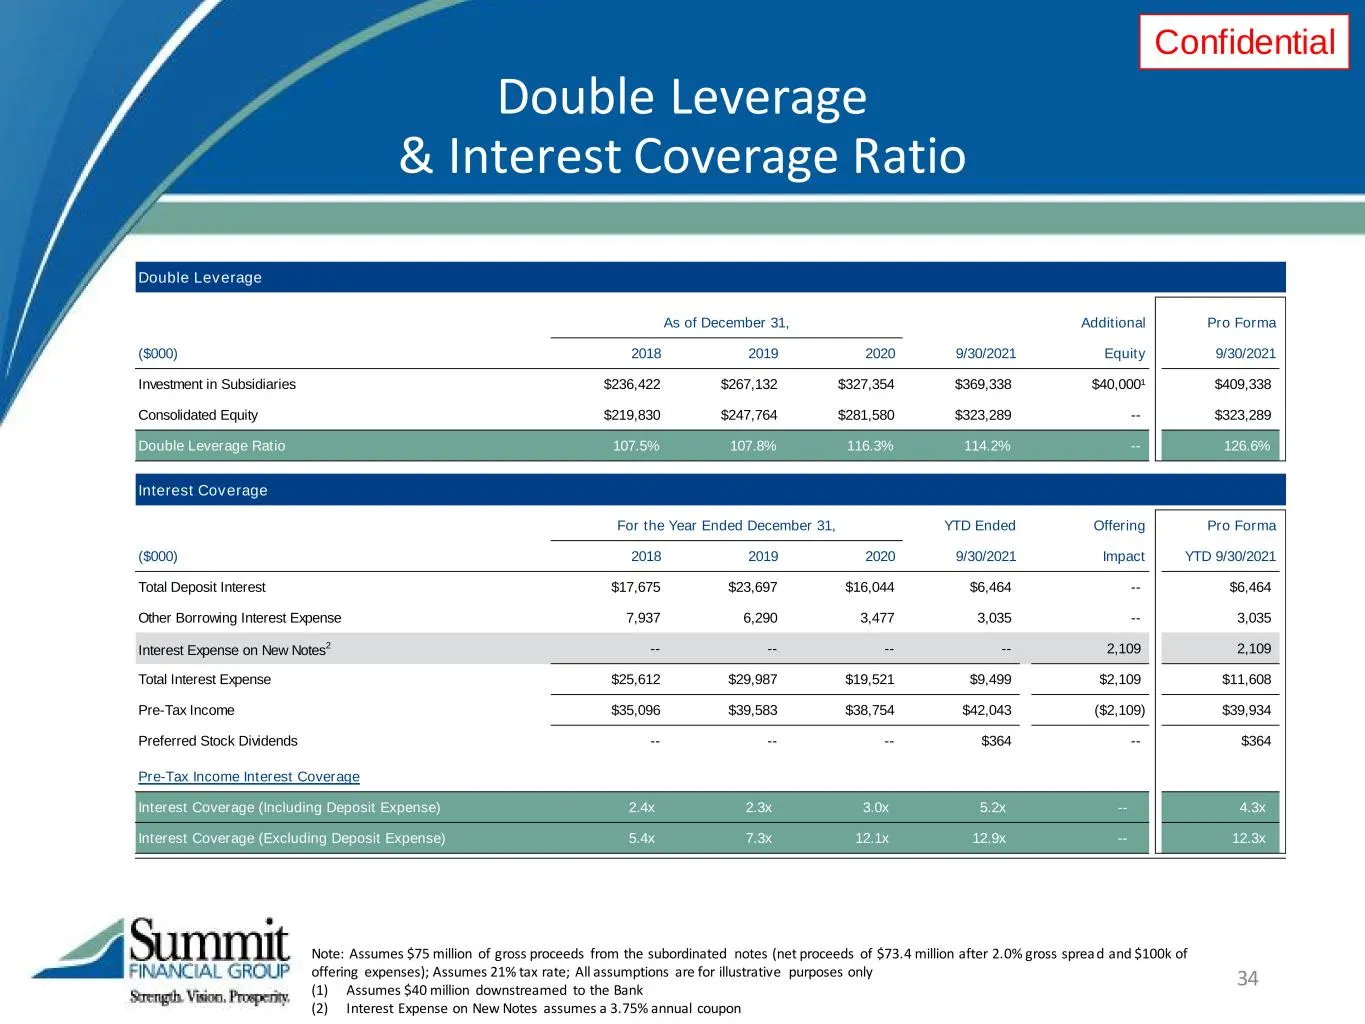
Confidential 34 Note: Assumes $75 million of gross proceeds from the subordinated notes (net proceeds of $73.4 million after 2.0% gross sprea d and $100k of offering expenses); Assumes 21% tax rate; All assumptions are for illustrative purposes only (1) Assumes $40 million downstreamed to the Bank (
Slide 35: Appendix
Appendix Strength. Vision, Prosperity,
Slide 36: Selected Balance Sheet Data
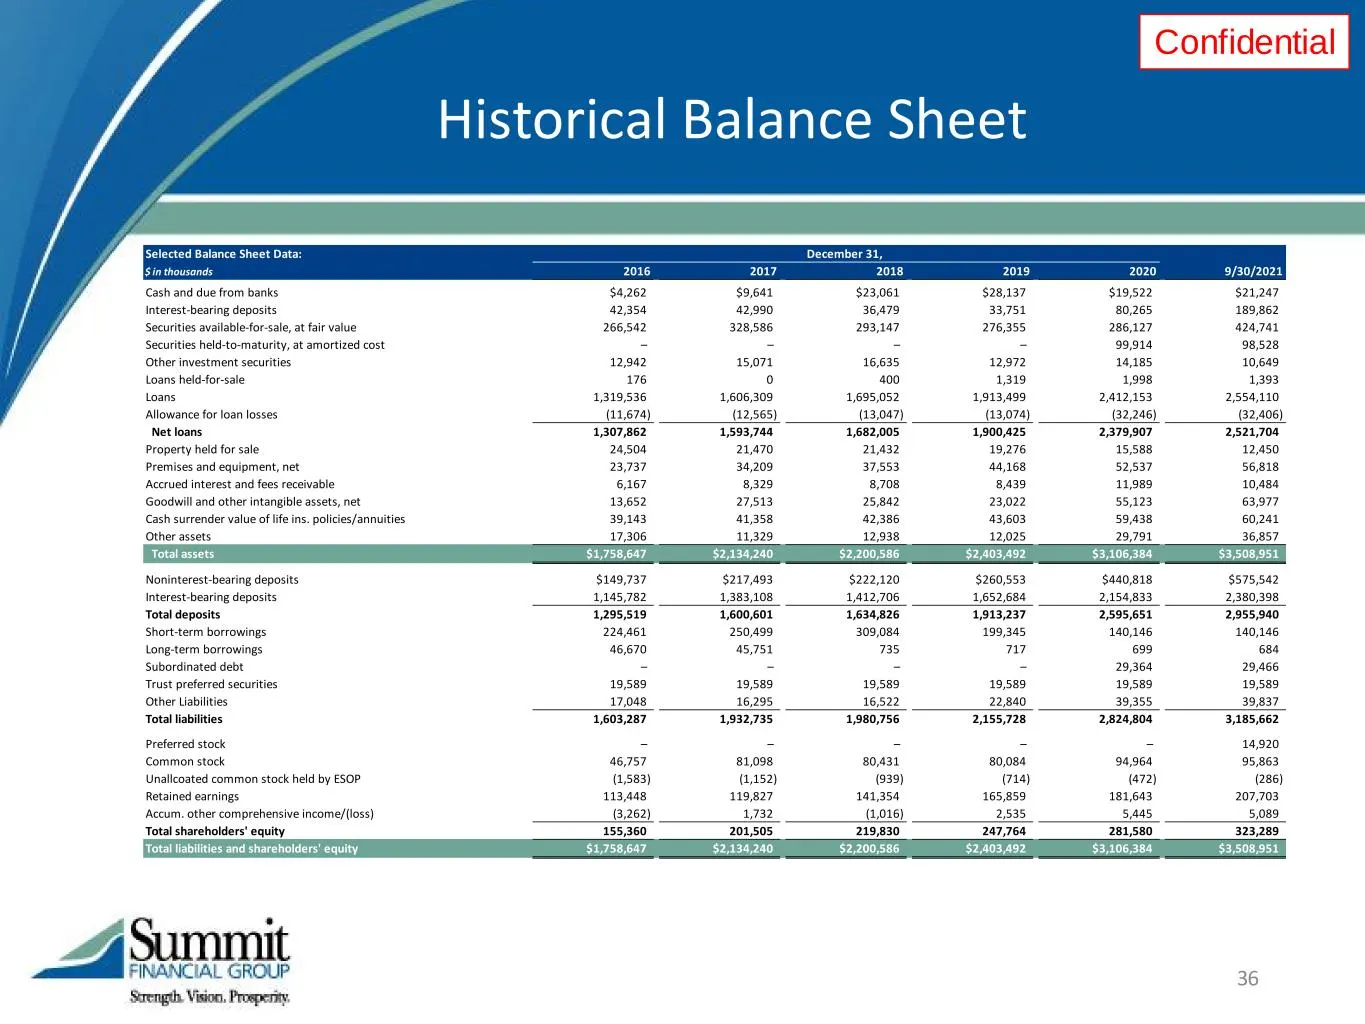
Confidential Selected Balance Sheet Data: $ in thousands 2016 2017 2018 2019 2020 9/30/2021 Cash and due from banks $4,262 $9,641 $23,061 $28,137 $19,522 $21,247 Interest-bearing deposits 42,354 42,990 36,479 33,751 80,265 189,862 Securities available-for-sale, at fair value 266,542 328,586 293,147
Slide 37: Historical Income Statement
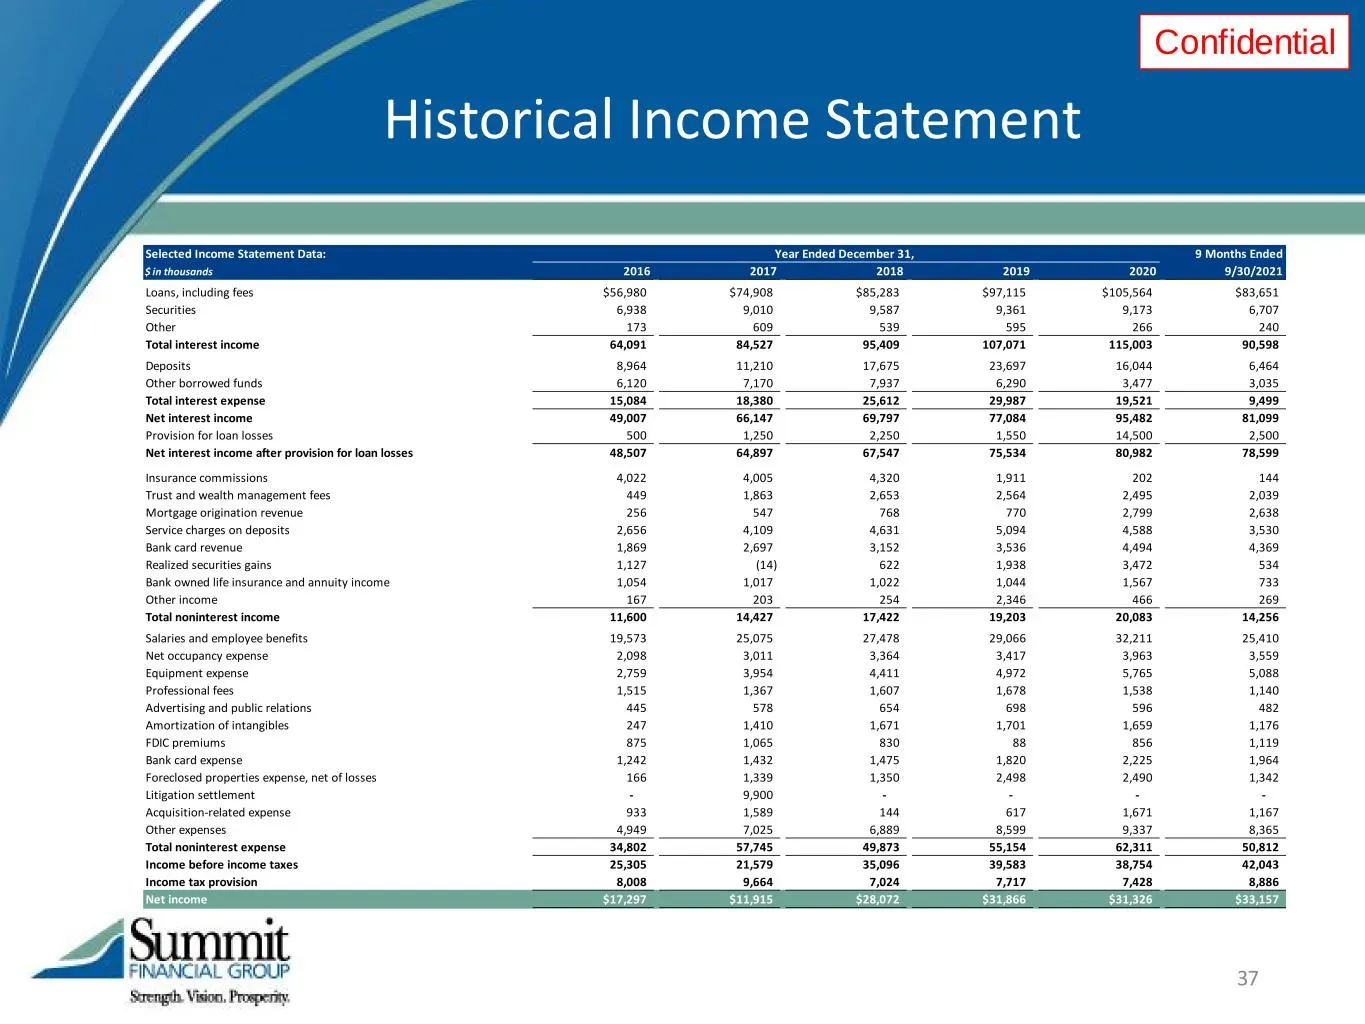
Confidential 37 Historical Income Statement Selected Income Statement Data: 9 Months Ended $ in thousands 2016 2017 2018 2019 2020 9/30/2021 Loans, including fees $56,980 $74,908 $85,283 $97,115 $105,564 $83,651 Securities 6,938 9,010 9,587 9,361 9,173 6,707 Other 173 609 539 595 266 240 Total inter
Slide 38: CD Maturity Schedule
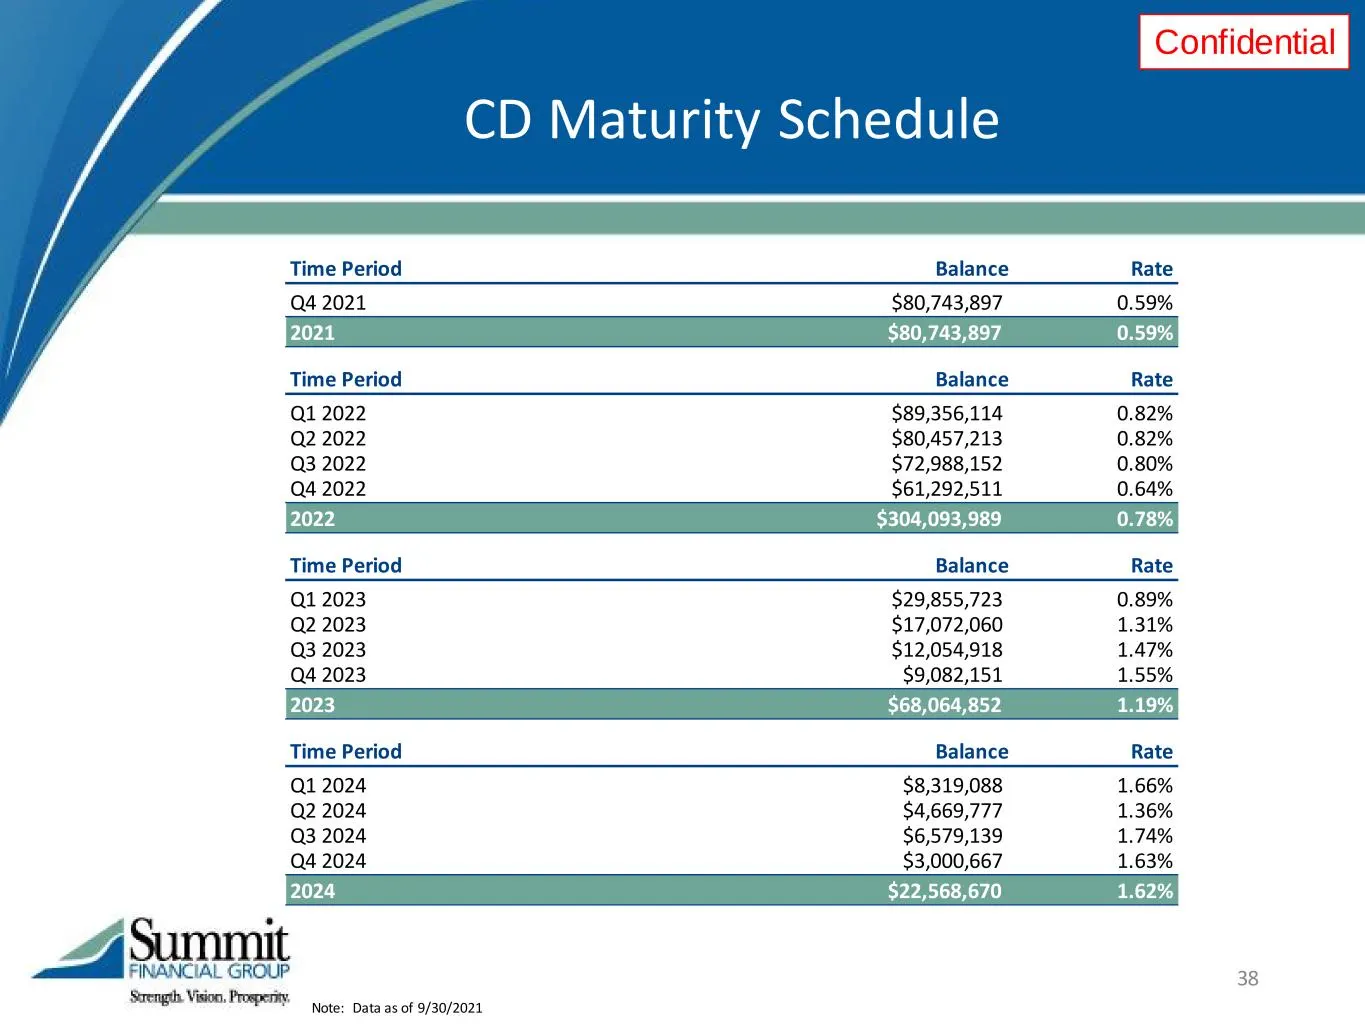
Confidential Note: Data as of 9/30/2021 38 CD Maturity Schedule Time Period Balance Rate Q4 2021 $80,743,897 0.59% 2021 $80,743,897 0.59% Time Period Balance Rate Q1 2022 $89,356,114 0.82% Q2 2022 $80,457,213 0.82% Q3 2022 $72,988,152 0.80% Q4 2022 $61,292,511 0.64% 2022 $304,093,989 0.78% Time Peri
Slide 39: FHLB Advances
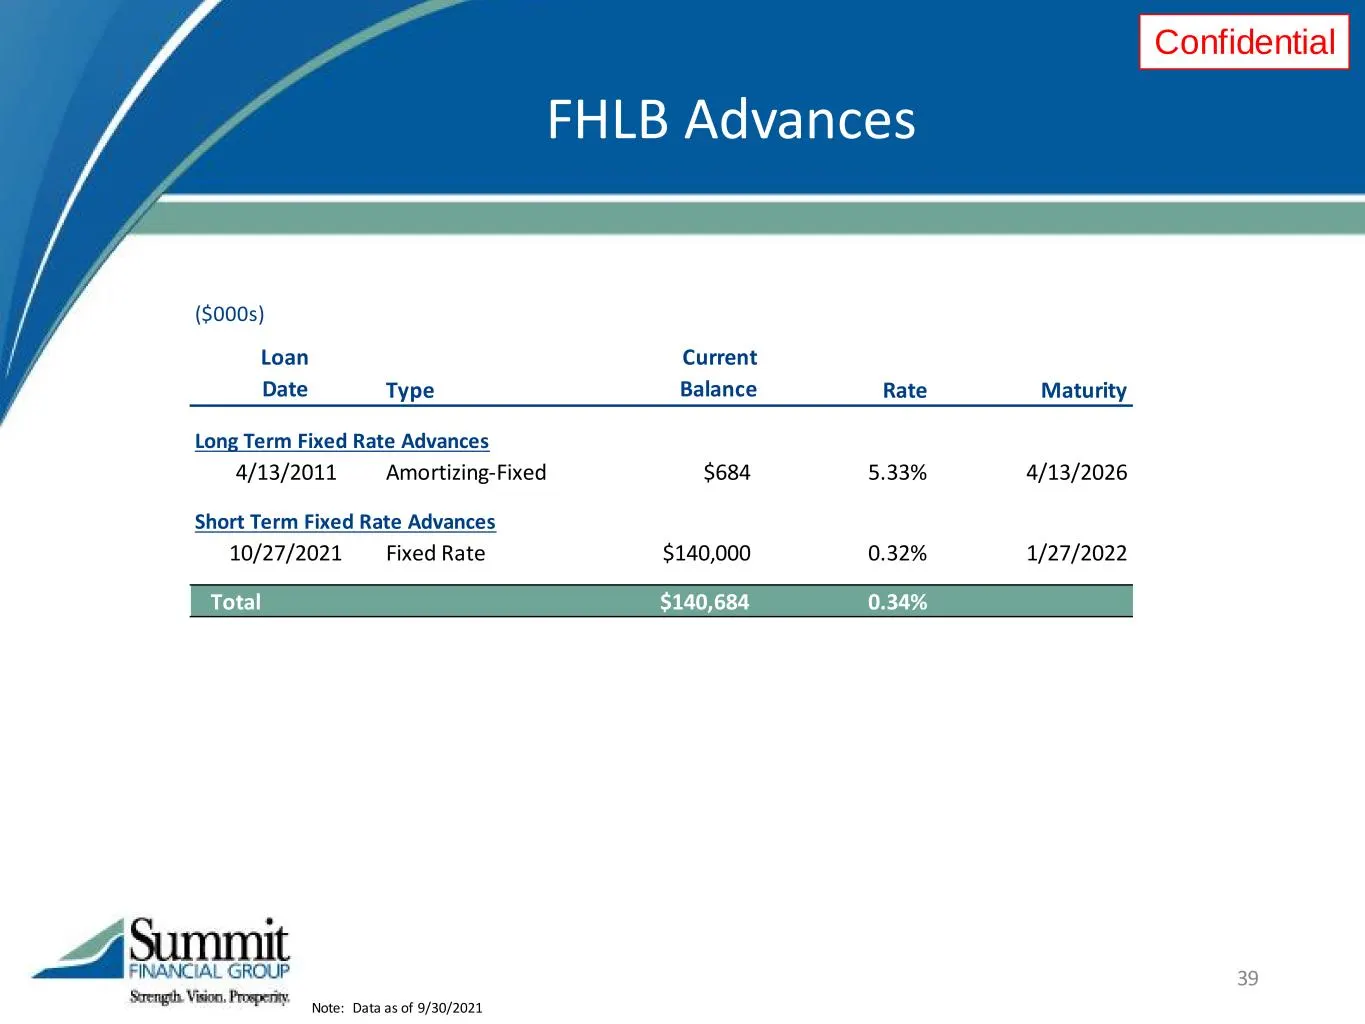
Confidential Note: Data as of 9/30/2021 39 FHLB Advances ($000s) Loan Date Type Current Balance Rate Maturity Long Term Fixed Rate Advances 4/13/2011 Amortizing-Fixed $684 5.33% 4/13/2026 Short Term Fixed Rate Advances 10/27/2021 Fixed Rate $140,000 0.32% 1/27/2022 Total $140,684 0.34%
Slide 40: Our Markets
Confidential Our Markets Source: S&P Global Market Intelligence; deposit data as of 6/30/2021 40 Virginia County # Offices Deposits in Market ($000) Market Share Median HH Income 2021 ($) Northern VA Loudoun 1 68,304 0.47% 149,148 Fauquier 1 59,963 1.67% 101,866 Fairfax 1 18,425 0.02% 128,955 Southw
Slide 41: Non-GAAP Reconciliations
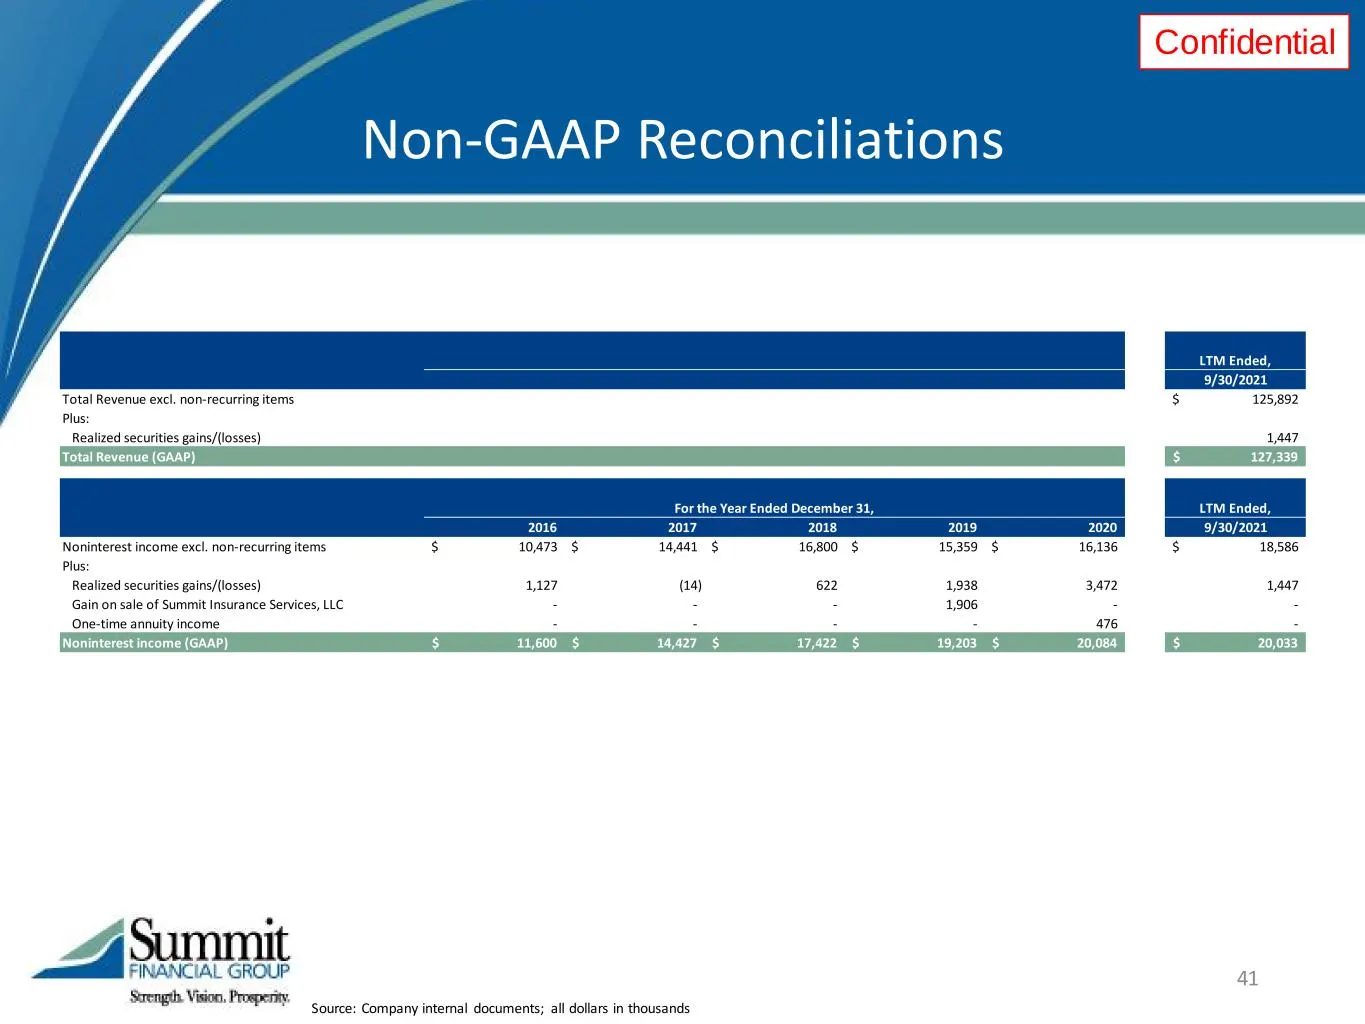
Confidential Source: Company internal documents; all dollars in thousands 41 Non-GAAP Reconciliations LTM Ended, 9/30/2021 Total Revenue excl. non-recurring items 125,892$ Plus: Realized securities gains/(losses) 1,447 Total Revenue (GAAP) 127,339$ For the Year Ended December 31, LTM Ended, 2016 201
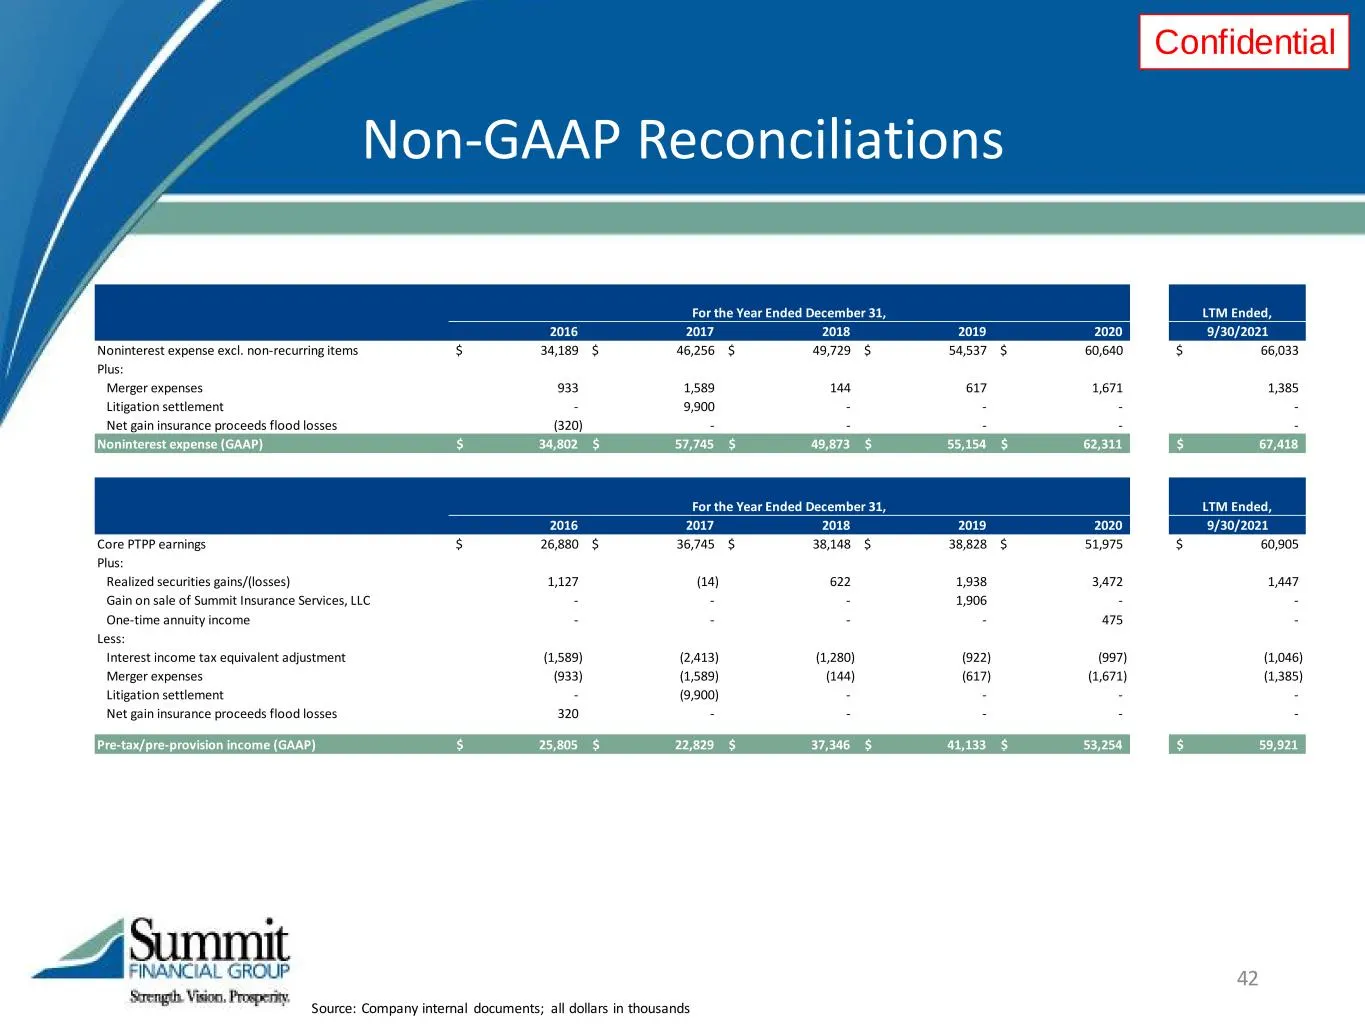
Slide 42: Non-GAAP Reconciliations
Confidential Source: Company internal documents; all dollars in thousands 42 Non-GAAP Reconciliations For the Year Ended December 31, LTM Ended, 2016 2017 2018 2019 2020 9/30/2021 Noninterest expense excl. non-recurring items 34,189$ 46,256$ 49,729$ 54,537$ 60,640$ 66,033$ Plus: Merger expenses 933
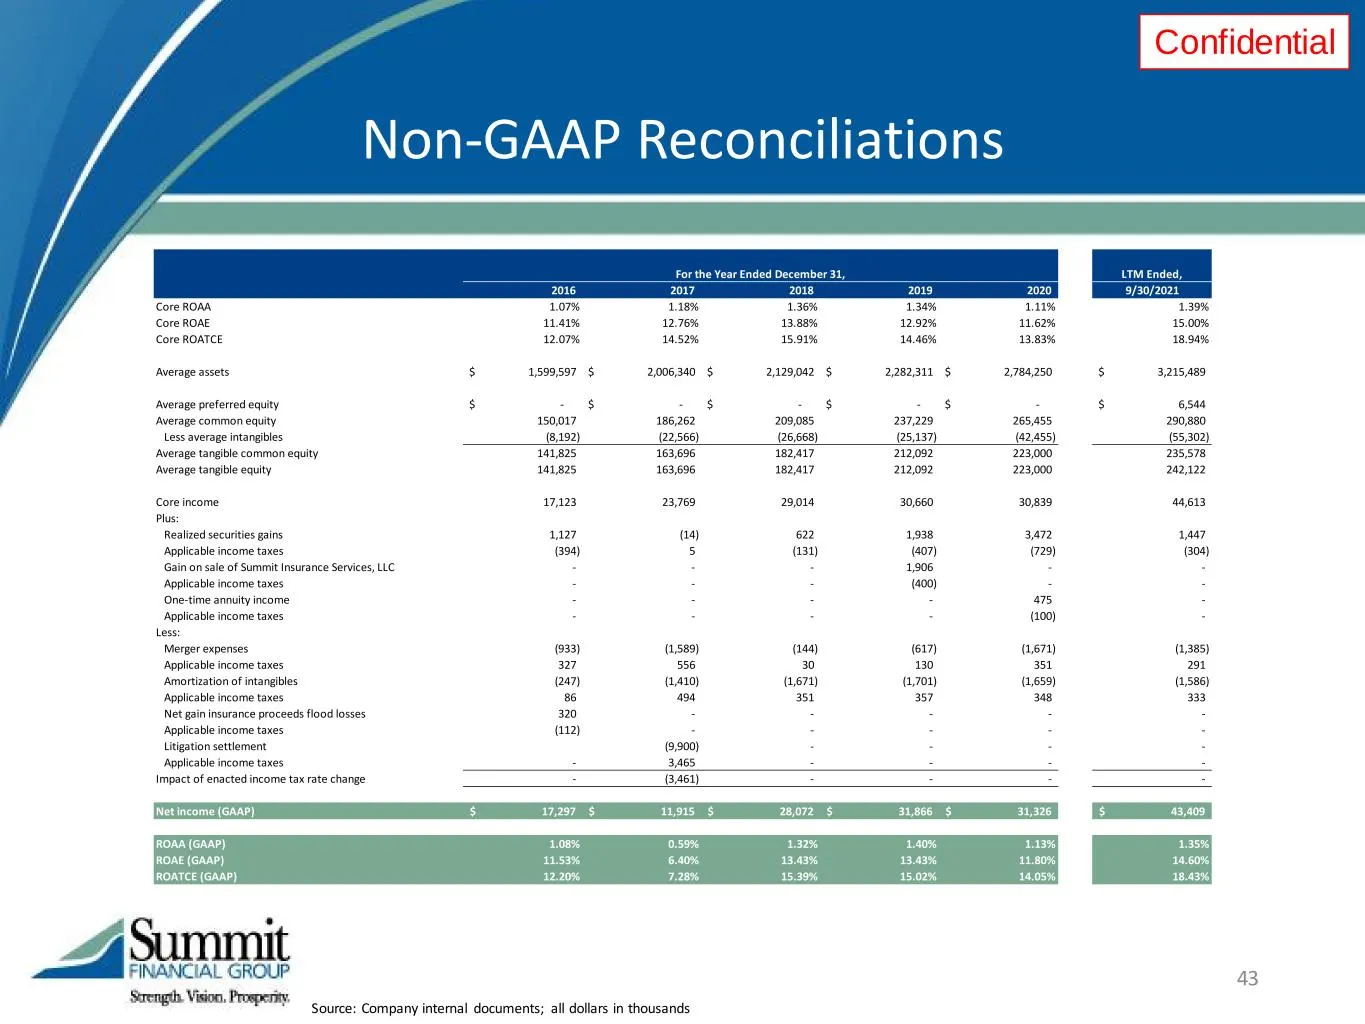
Slide 43: Non-GAAP Reconciliations
Confidential Source: Company internal documents; all dollars in thousands 43 Non-GAAP Reconciliations For the Year Ended December 31, LTM Ended, 2016 2017 2018 2019 2020 9/30/2021 Core ROAA 1.07% 1.18% 1.36% 1.34% 1.11% 1.39% Core ROAE 11.41% 12.76% 13.88% 12.92% 11.62% 15.00% Core ROATCE 12.07% 14.
Source: SEC EDGAR · 8-K filed Nov 17, 2021
More decks from Summit Financial Group Inc
 Q4 2023 Earnings Presentation26 slides · Feb 6, 2024
 Merger or Acquisition (November 2023)27 slides · Nov 20, 2023
 Merger or Acquisition (August 2023)7 slides · Aug 25, 2023
 Merger or Acquisition (August 2023)7 slides · Aug 25, 2023
 Merger or Acquisition (August 2023)6 slides · Aug 25, 2023
 Merger or Acquisition (August 2023)24 slides · Aug 24, 2023