Markwest Energy Partners LP — Investor Day (May 2013)
91 slides from Markwest Energy Partners LP's investor day presentation, May 29, 2013
Slide 1: Investor & Analyst Conference May 29, 2013
INVESTOR & ANALYST CONFERENCE MAY 29, 2013
Slide 2: Forward-Looking Statements
Forward-Looking Statements This presentation contains forward-looking statements and information. These forward-looking statements, which in many instances can be identified by words like “could,” “may,” “will,” “should,” “expects,” “plans,” “project,” “anticipates,” “believes,” “planned,” “proposed
Slide 3: Non-GAAP Measures
Non-GAAP Measures Distributable Cash Flow, Adjusted EBITDA, and Net Operating Margin are not measures of performance calculated in accordance with GAAP, and should not be considered separately from or as a substitute for net income, income from operations, or cash flow as reflected in our financial
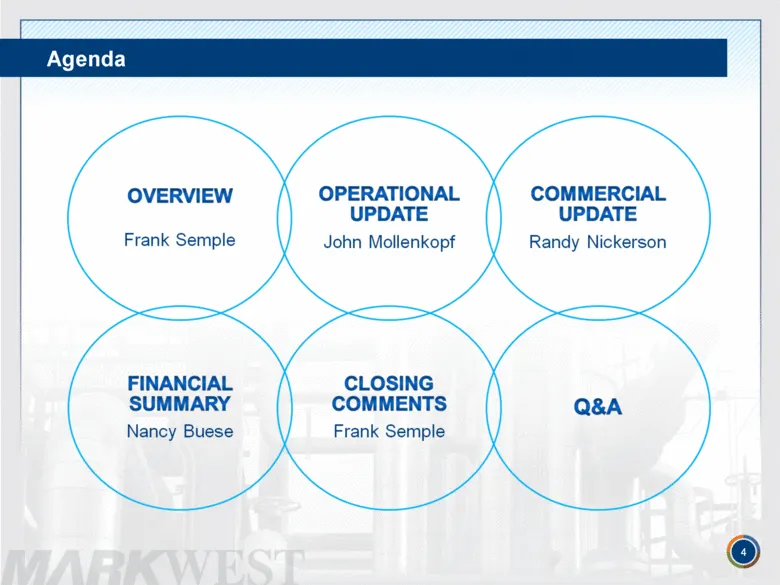
Slide 4: Agenda
Agenda OVERVIEW Frank Semple FINANCIAL SUMMARY Nancy Buese OPERATIONAL UPDATE John Mollenkopf CLOSING COMMENTS Frank Semple COMMERCIAL UPDATE Randy Nickerson
Slide 5: Overview – Frank Semple
OVERVIEW FRANK SEMPLE Chairman, President & Chief Executive Officer
Slide 6: Key Investment Considerations
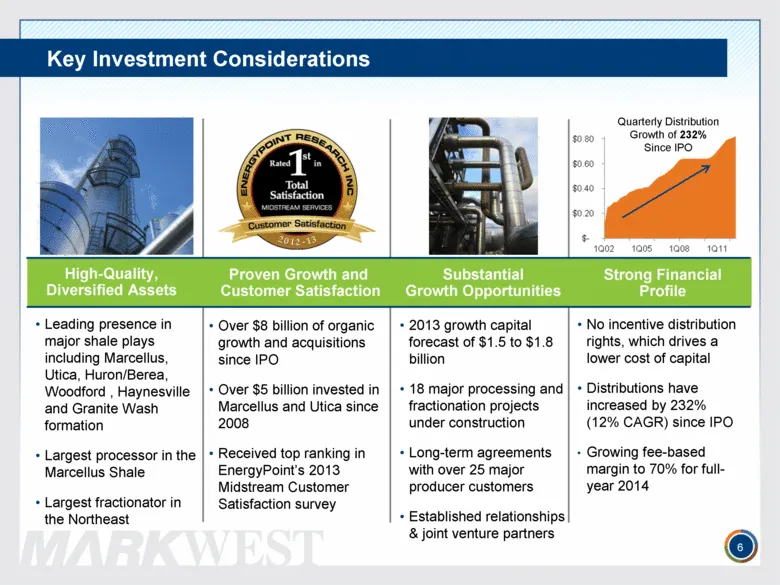
Key Investment Considerations 6 High-Quality, Diversified Assets Proven Growth and Customer Satisfaction Substantial Growth Opportunities Strong Financial Profile Leading presence in major shale plays including Marcellus, Utica, Huron/Berea, Woodford , Haynesville and Granite Wash formation Largest
Slide 7: MarkWest Assets: Expansion and Diversification
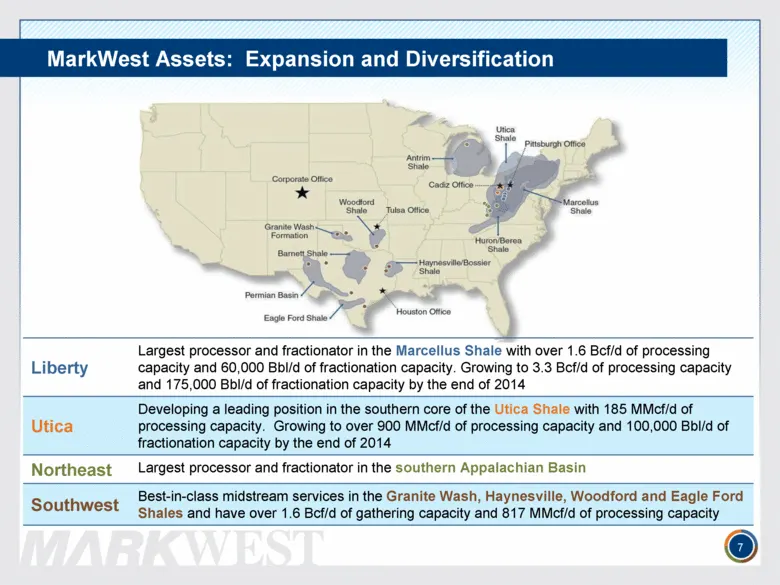
MarkWest Assets: Expansion and Diversification 7 Liberty Largest processor and fractionator in the Marcellus Shale with over 1.6 Bcf/d of processing capacity and 60,000 Bbl/d of fractionation capacity. Growing to 3.3 Bcf/d of processing capacity and 175,000 Bbl/d of fractionation capacity by the end
Slide 8: U.S. Shale Plays are Driving Natural Gas Supply
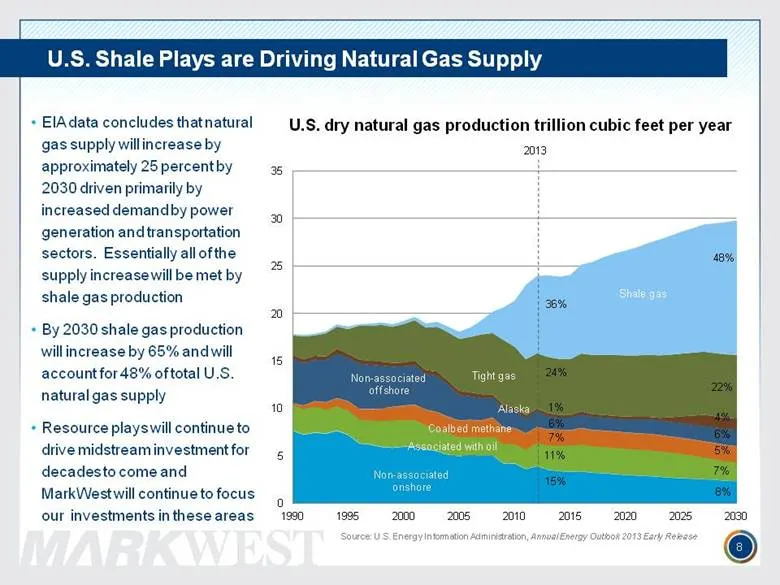
U.S. Shale Plays are Driving Natural Gas Supply 8 EIA data concludes that natural gas supply will increase by approximately 25 percent by 2030 driven primarily by increased demand by power generation and transportation sectors. Essentially all of the supply increase will be met by shale gas producti
Slide 9: U.S. Shale Play Volume Growth
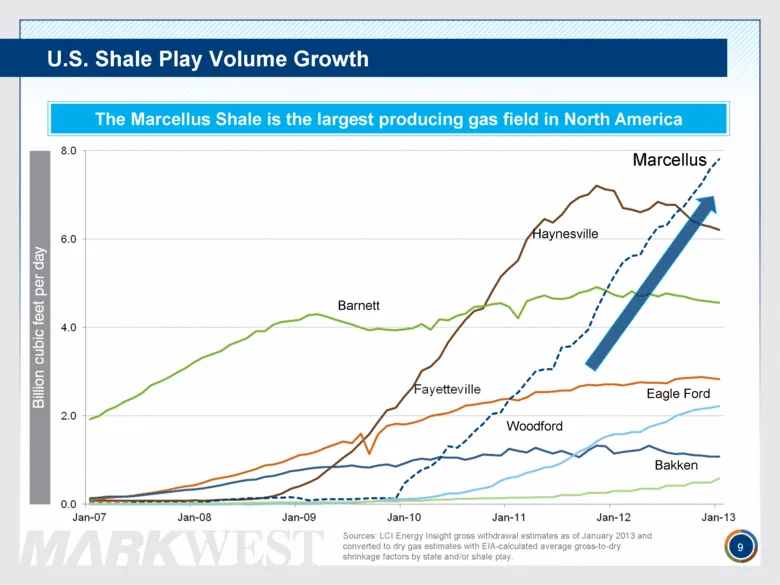
U.S. Shale Play Volume Growth 9 The Marcellus Shale is the largest producing gas field in North America Barnett Haynesville Marcellus Sources: LCI Energy Insight gross withdrawal estimates as of January 2013 and converted to dry gas estimates with EIA-calculated average gross-to-dry shrinkage factor
Slide 10: Commitment to Resource Plays
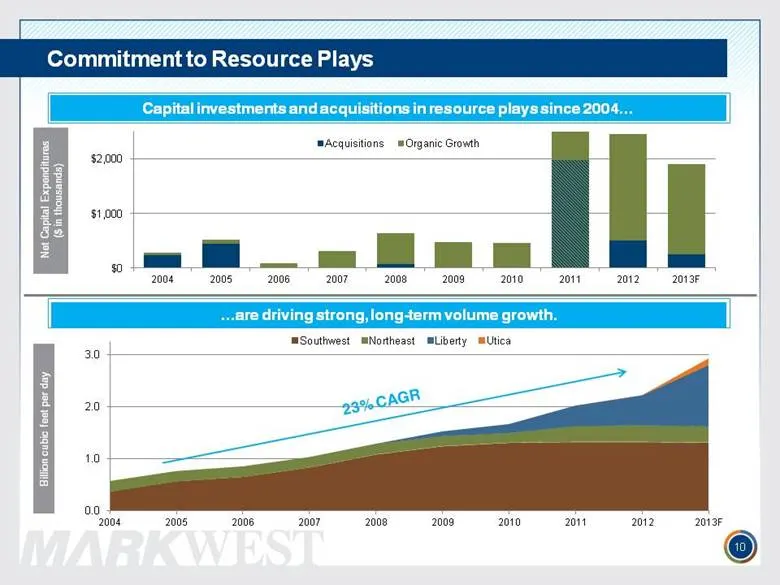
Commitment to Resource Plays 10 Capital investments and acquisitions in resource plays since 2004 are driving strong, long-term volume growth.
Slide 11: Distribution Growth Since IPO
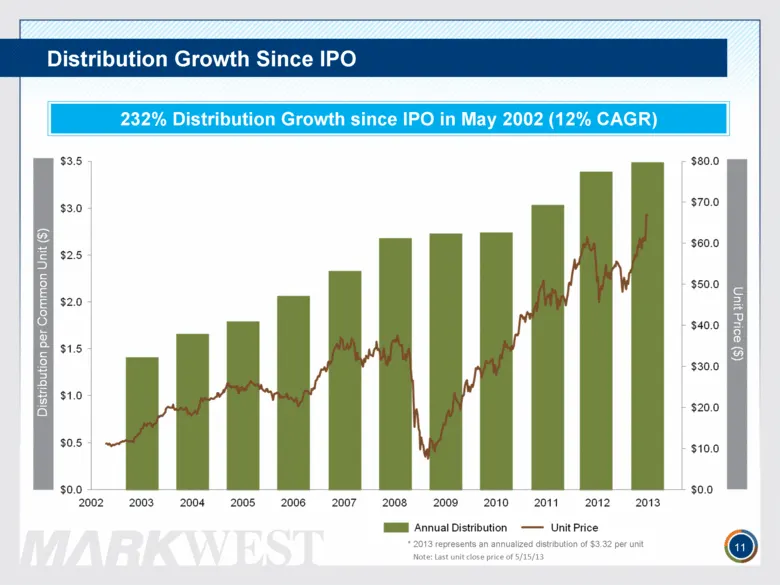
Distribution Growth Since IPO 11 232% Distribution Growth since IPO in May 2002 (12% CAGR) Note: Last unit close price of 5/15/13 * 2013 represents an annualized distribution of $3.32 per unit
Slide 12: Operational Update – John Mollenkopf
OPERATIONAL UPDATE JOHN MOLLENKOPF Senior Vice President, Chief Operating Officer
Slide 13: Operational Overview and Philosophy
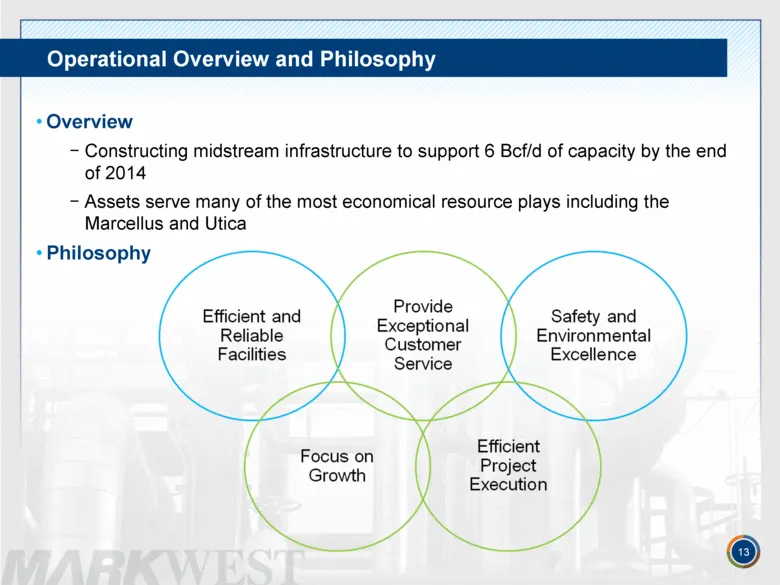
Operational Overview and Philosophy 13 Overview Constructing midstream infrastructure to support 6 Bcf/d of capacity by the end of 2014 Assets serve many of the most economical resource plays including the Marcellus and Utica Philosophy
Slide 14: Growth Driven By Customer Satisfaction
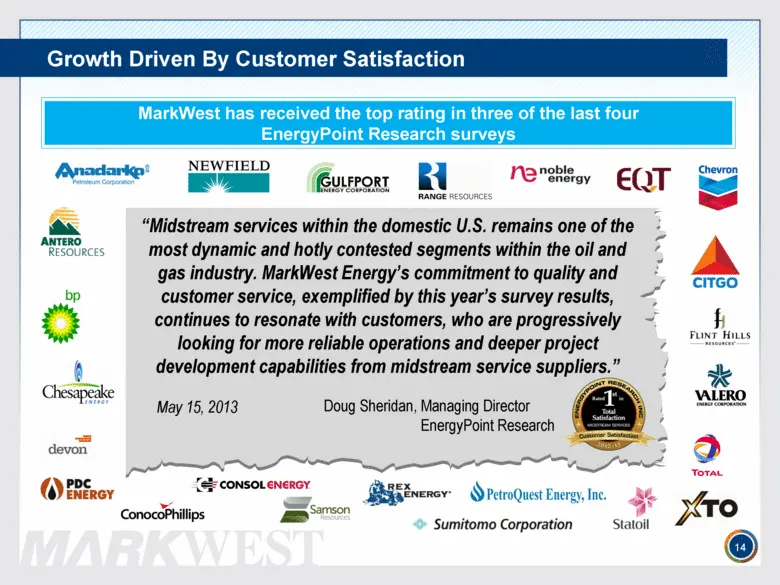
Growth Driven By Customer Satisfaction 14 MarkWest has received the top rating in three of the last four EnergyPoint Research surveys “Midstream services within the domestic U.S. remains one of the most dynamic and hotly contested segments within the oil and gas industry. MarkWest Energy’s commitmen
Slide 15: Processing Capacity Growth
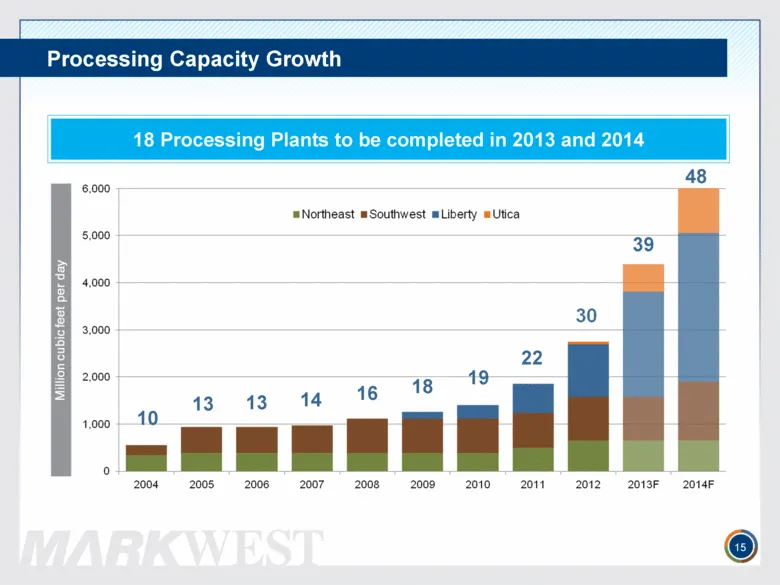
Processing Capacity Growth 15 18 Processing Plants to be completed in 2013 and 2014 10 13 13 14 16 18 19 22 39 48
Slide 16: Significant Growth Requires a Highly Skilled Team
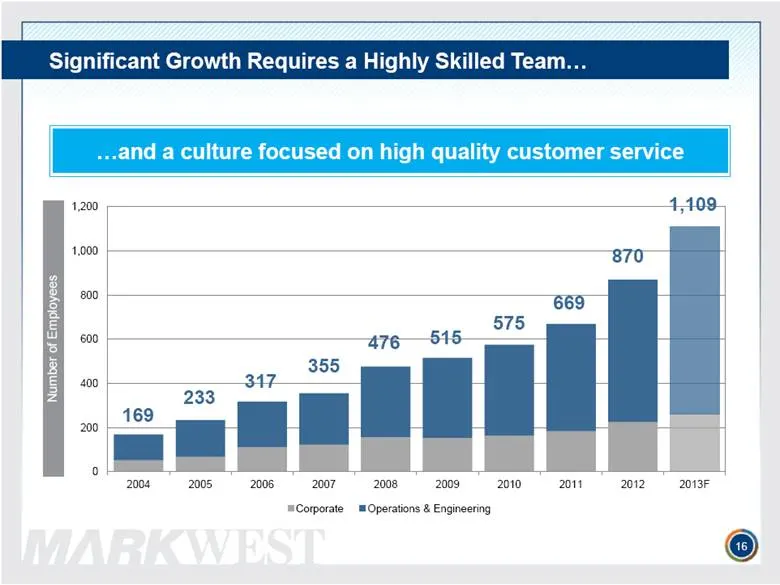
Significant Growth Requires a Highly Skilled Team 16 and a culture focused on high quality customer service 169 233
Slide 17: 2013 Forecasted Segment Operating Income
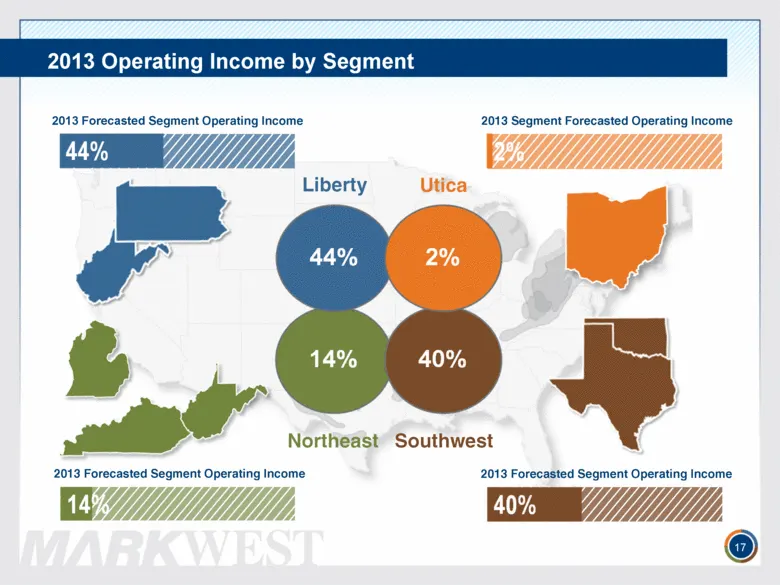
2013 Forecasted Segment Operating Income 2013 Segment Forecasted Operating Income 2013 Forecasted Segment Operating Income Northeast Liberty Utica Southwest 17 2013 Forecasted Segment Operating Income 17 2013 Operating Income by Segment
Slide 18: Southwest Segment
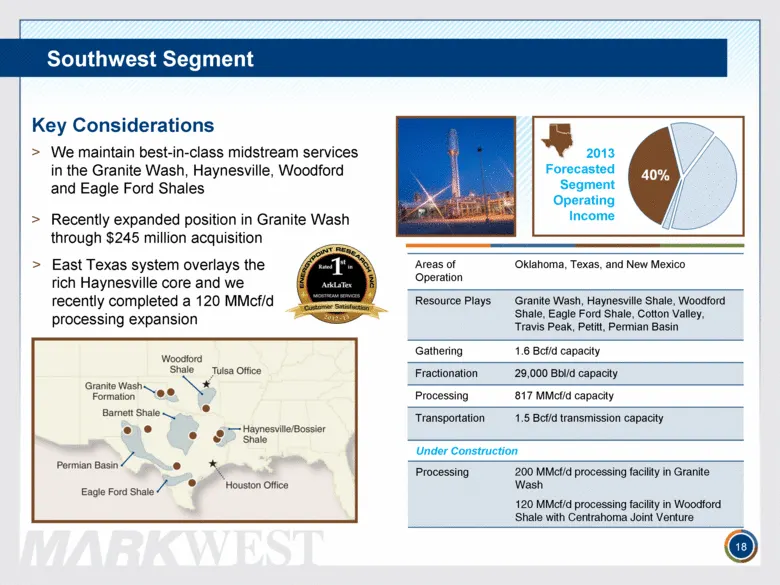
Areas of Operation Oklahoma, Texas, and New Mexico Resource Plays Granite Wash, Haynesville Shale, Woodford Shale, Eagle Ford Shale, Cotton Valley, Travis Peak, Petitt, Permian Basin Gathering 1.6 Bcf/d capacity Fractionation 29,000 Bbl/d capacity Processing 817 MMcf/d capacity Transportation 1.5 Bc
Slide 19: Northeast Segment
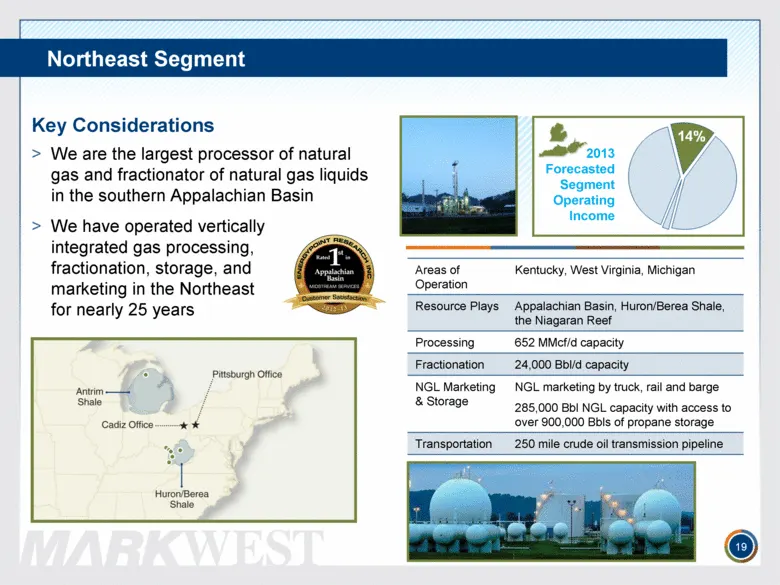
Northeast Segment 19 Key Considerations We are the largest processor of natural gas and fractionator of natural gas liquids in the southern Appalachian Basin 2013 Forecasted Segment Operating Income Areas of Operation Kentucky, West Virginia, Michigan Resource Plays Appalachian Basin, Huron/Berea Sh
Slide 20: Liberty Segment
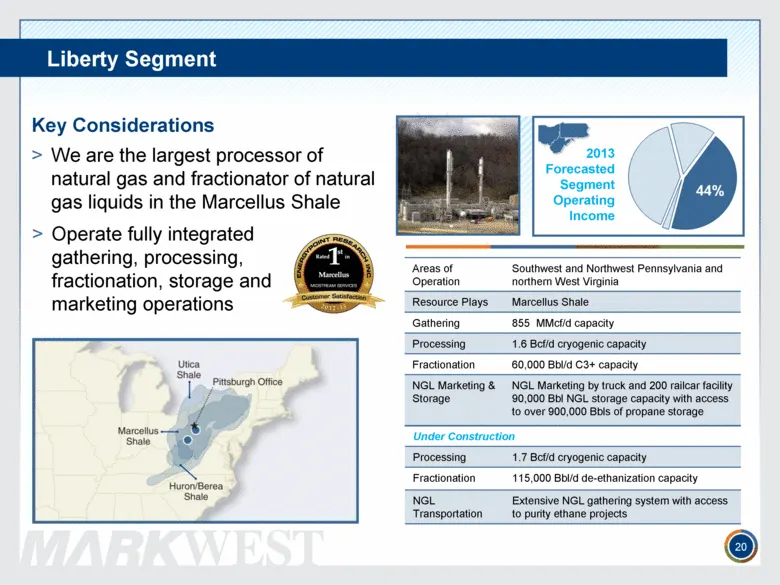
Liberty Segment 20 2013 Forecasted Segment Operating Income Key Considerations We are the largest processor of natural gas and fractionator of natural gas liquids in the Marcellus Shale Areas of Operation Southwest and Northwest Pennsylvania and northern West Virginia Resource Plays Marcellus Shale
Slide 21: Utica Segment
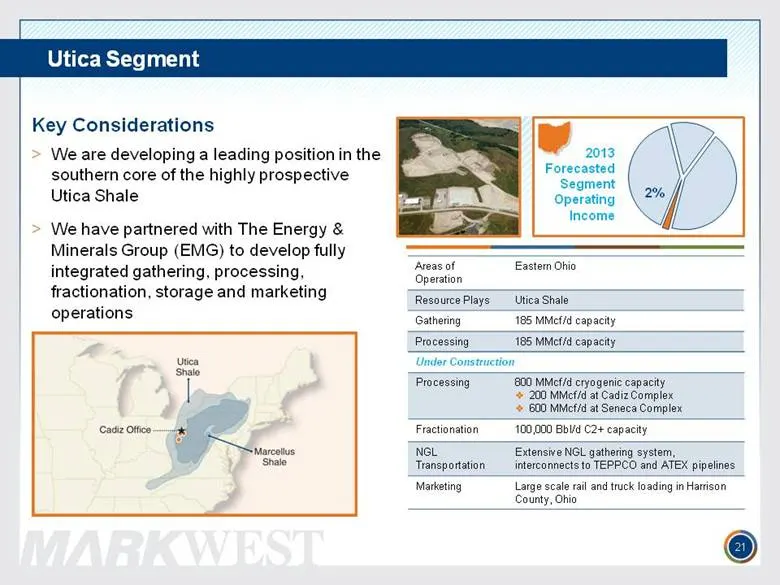
Areas of Operation Eastern Ohio Resource Plays Utica Shale Gathering 185 MMcf/d capacity Processing 185 MMcf/d capacity Utica Segment 21 Key Considerations We are developing a leading position in the southern core of the highly prospective Utica Shale We have partnered with The Energy & Minerals Gro
Slide 22: Marcellus and Utica Gathering Areas Map
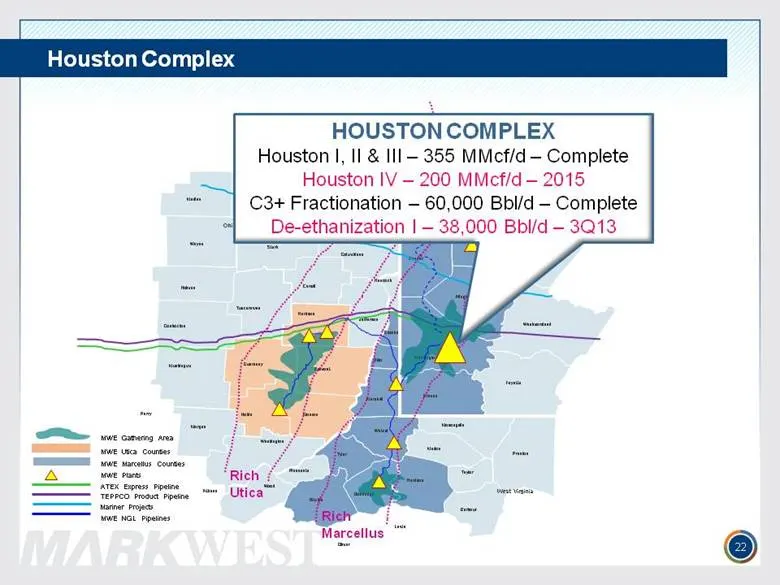
Barbour Brooke Doddridge Gilmer Hancock Harrison Lewis Marion Marshall Monongalia Ohio Pleasants Preston Ritchie Taylor Tyler Wetzel Wood Athens Belmont Carroll Columbiana Coshocton Guernsey Harrison Holmes Mahoning Medina Monroe Morgan Muskingum Noble Perry Portage Stark Summit Trumbull Tuscarawas
Slide 23: Houston Complex
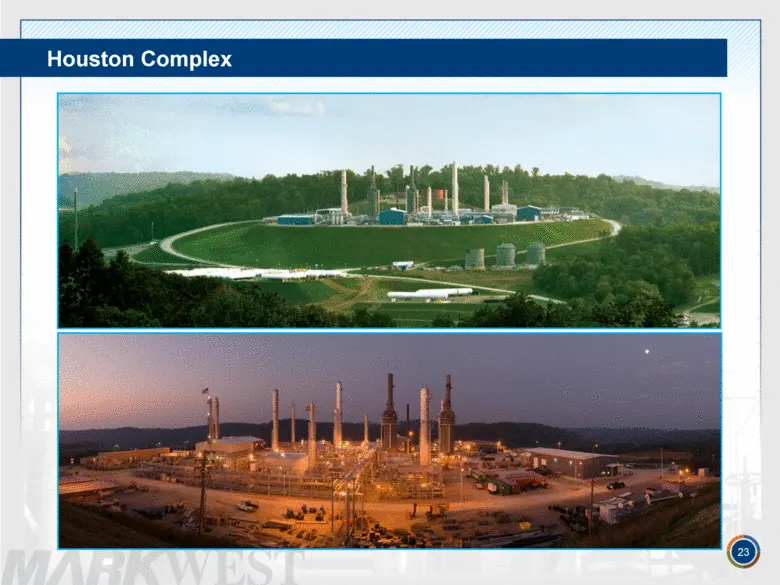
Houston Complex 23
Slide 24: Houston Complex
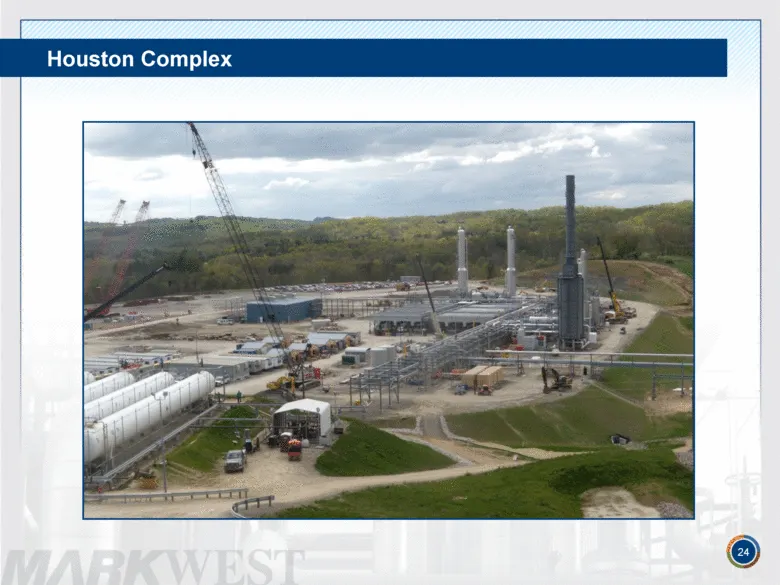
Houston Complex 24
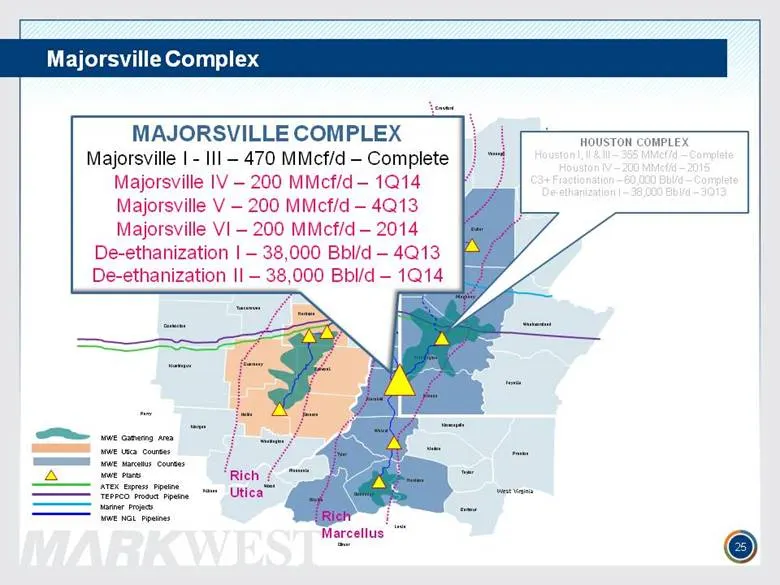
Slide 25: Houston Complex Map
Barbour Brooke Doddridge Gilmer Hancock Harrison Lewis Marion Marshall Monongalia Ohio Pleasants Preston Ritchie Taylor Tyler Wetzel Wood Athens Belmont Carroll Columbiana Coshocton Guernsey Harrison Holmes Mahoning Medina Monroe Morgan Muskingum Noble Perry Portage Stark Summit Trumbull Tuscarawas
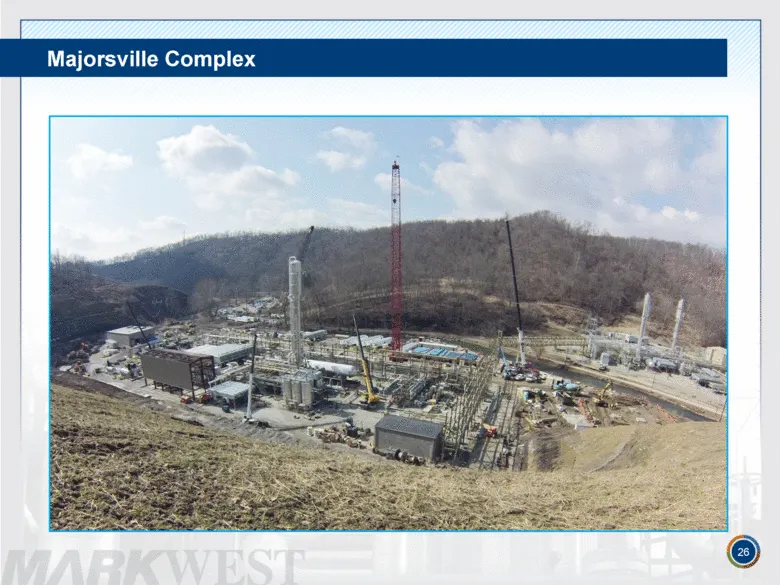
Slide 26: Majorsville Complex
Majorsville Complex 26
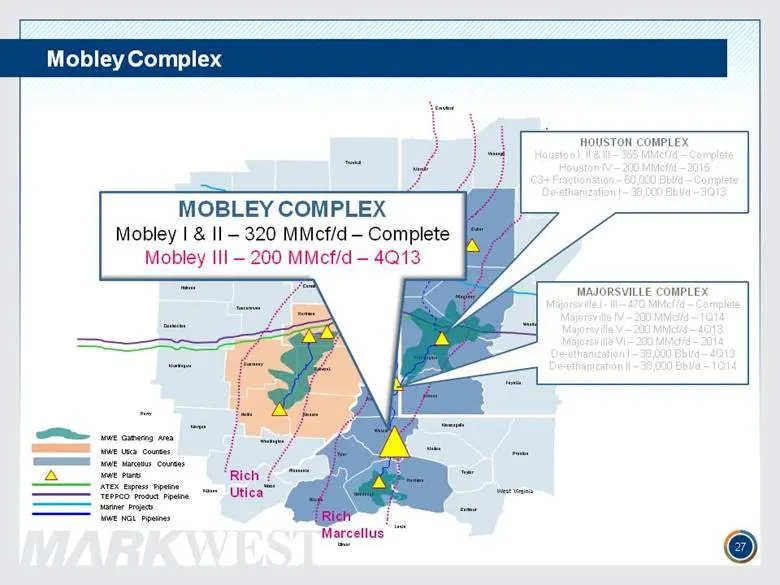
Slide 27: Majorsville Complex Map
Barbour Brooke Doddridge Gilmer Hancock Harrison Lewis Marion Marshall Monongalia Ohio Pleasants Preston Ritchie Taylor Tyler Wetzel Wood Athens Belmont Carroll Columbiana Coshocton Guernsey Harrison Holmes Mahoning Medina Monroe Morgan Muskingum Noble Perry Portage Stark Summit Trumbull Tuscarawas
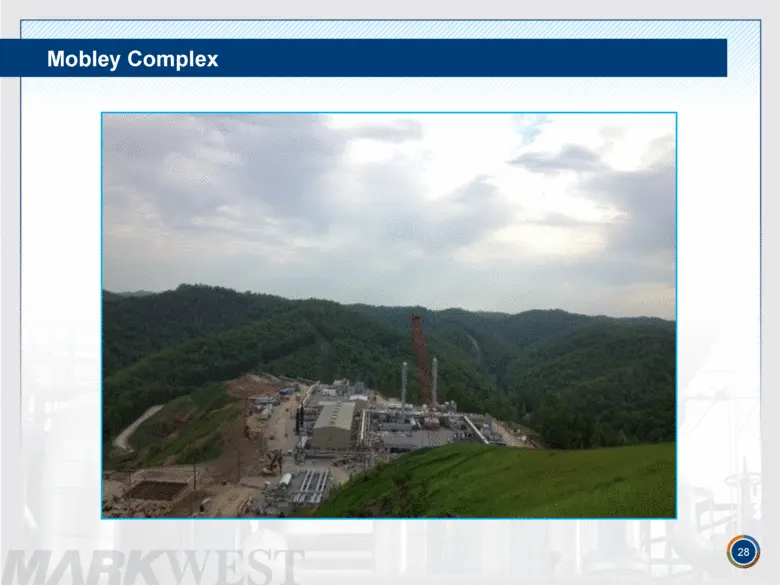
Slide 28: Mobley Complex
Mobley Complex 28
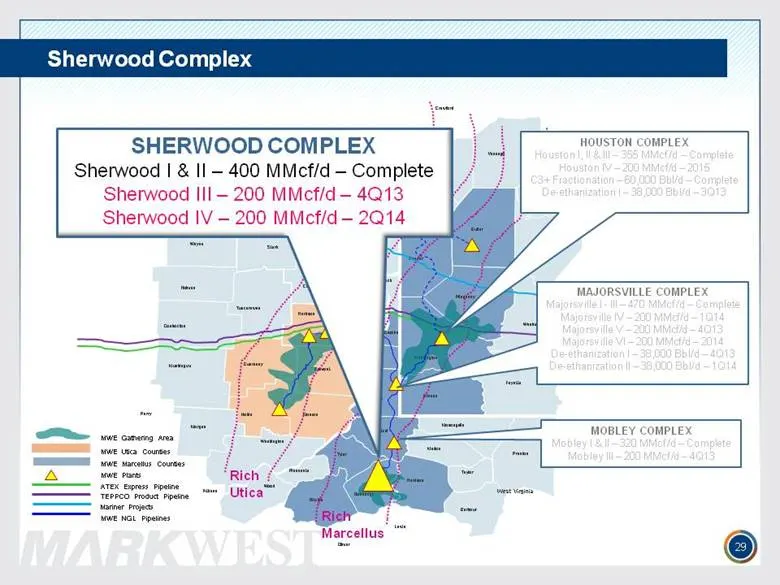
Slide 29: Mobley and Sherwood Complexes Map
Barbour Brooke Doddridge Gilmer Hancock Harrison Lewis Marion Marshall Monongalia Ohio Pleasants Preston Ritchie Taylor Tyler Wetzel Wood Athens Belmont Carroll Columbiana Coshocton Guernsey Harrison Holmes Mahoning Medina Monroe Morgan Muskingum Noble Perry Portage Stark Summit Trumbull Tuscarawas
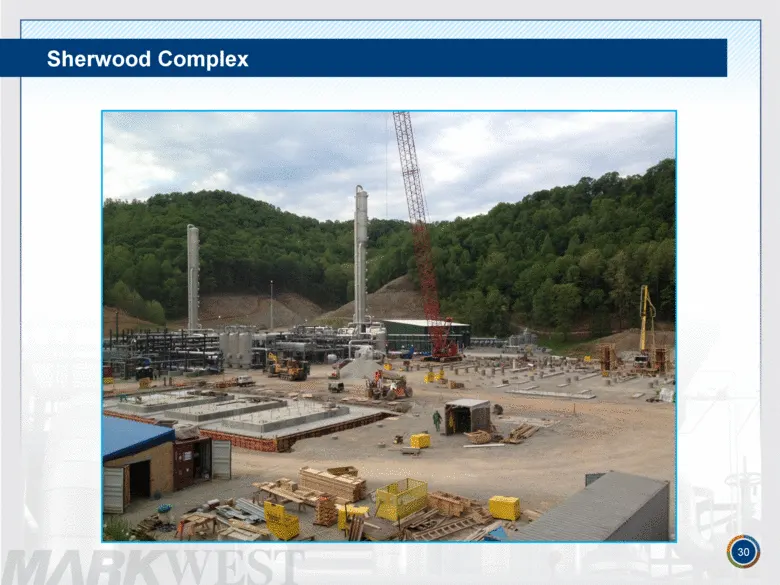
Slide 30: Sherwood Complex
Sherwood Complex 30
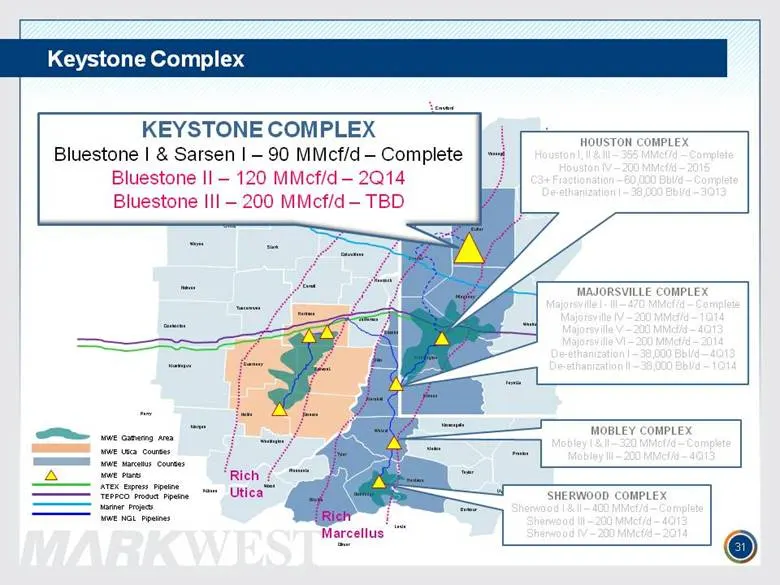
Slide 31: Keystone Complex Map
Barbour Brooke Doddridge Gilmer Hancock Harrison Lewis Marion Marshall Monongalia Ohio Pleasants Preston Ritchie Taylor Tyler Wetzel Wood Athens Belmont Carroll Columbiana Coshocton Guernsey Harrison Holmes Mahoning Medina Monroe Morgan Muskingum Noble Perry Portage Stark Summit Trumbull Tuscarawas
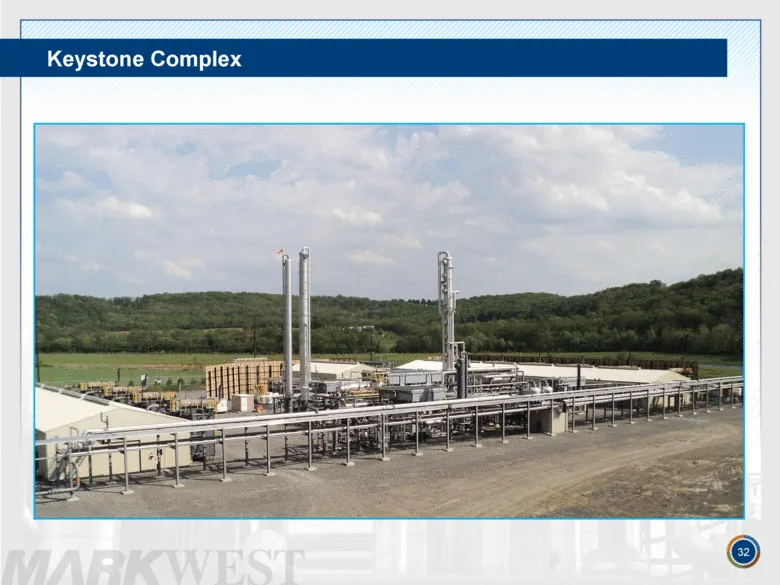
Slide 32: Keystone Complex
Keystone Complex 32
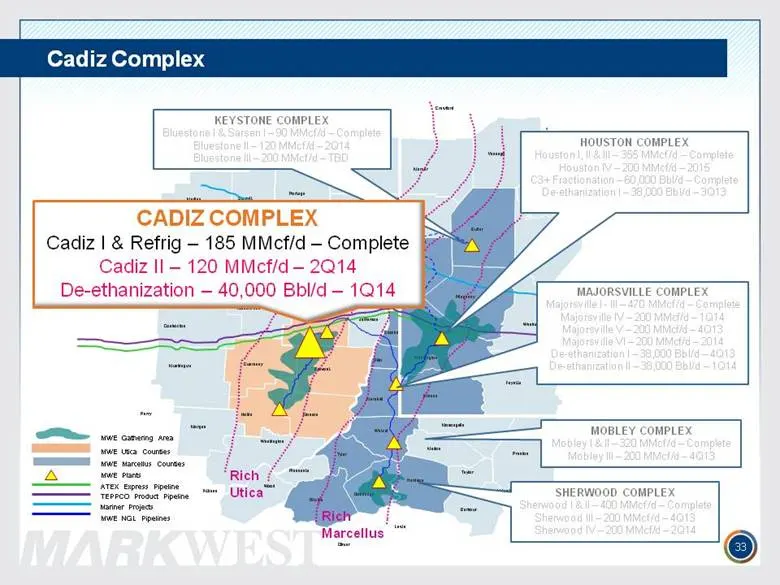
Slide 33: Cadiz Complex Map
Barbour Brooke Doddridge Gilmer Hancock Harrison Lewis Marion Marshall Monongalia Ohio Pleasants Preston Ritchie Taylor Tyler Wetzel Wood Athens Belmont Carroll Columbiana Coshocton Guernsey Harrison Holmes Mahoning Medina Monroe Morgan Muskingum Noble Perry Portage Stark Summit Trumbull Tuscarawas
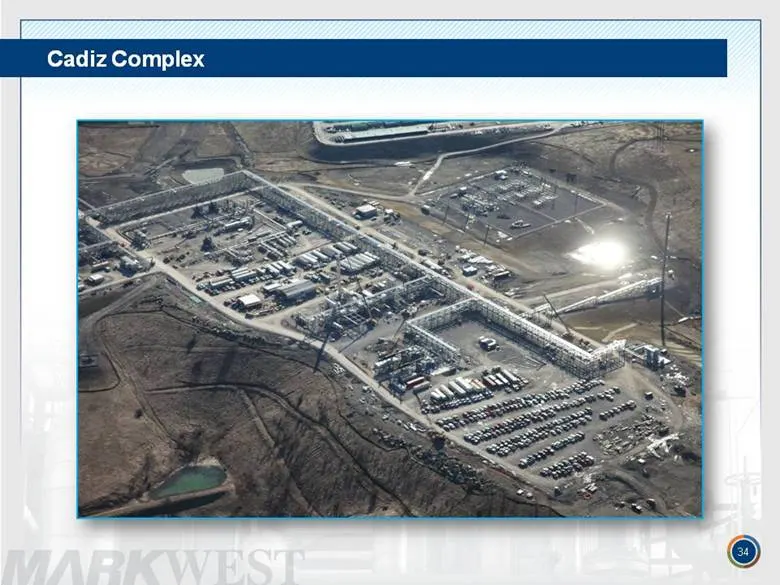
Slide 34: Cadiz Complex
Cadiz Complex 34
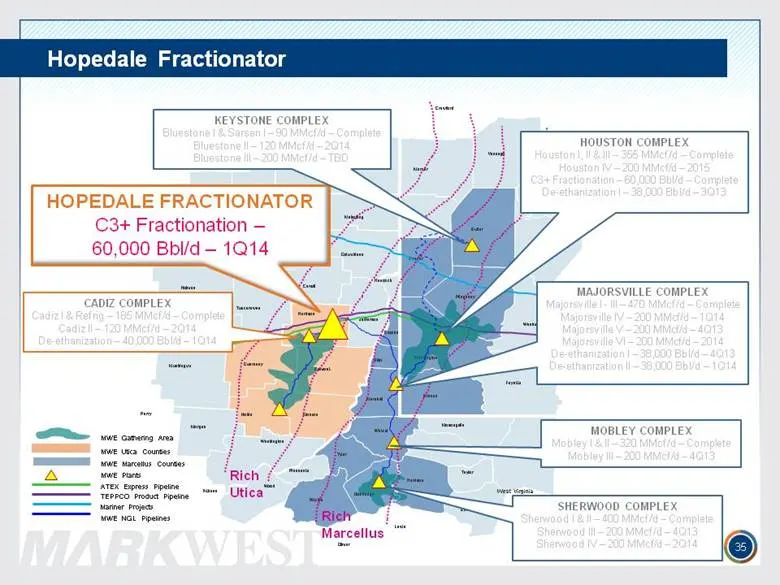
Slide 35: Hopedale Fractionator Map
Barbour Brooke Doddridge Gilmer Hancock Harrison Lewis Marion Marshall Monongalia Ohio Pleasants Preston Ritchie Taylor Tyler Wetzel Wood Athens Belmont Carroll Columbiana Coshocton Guernsey Harrison Holmes Mahoning Medina Monroe Morgan Muskingum Noble Perry Portage Stark Summit Trumbull Tuscarawas
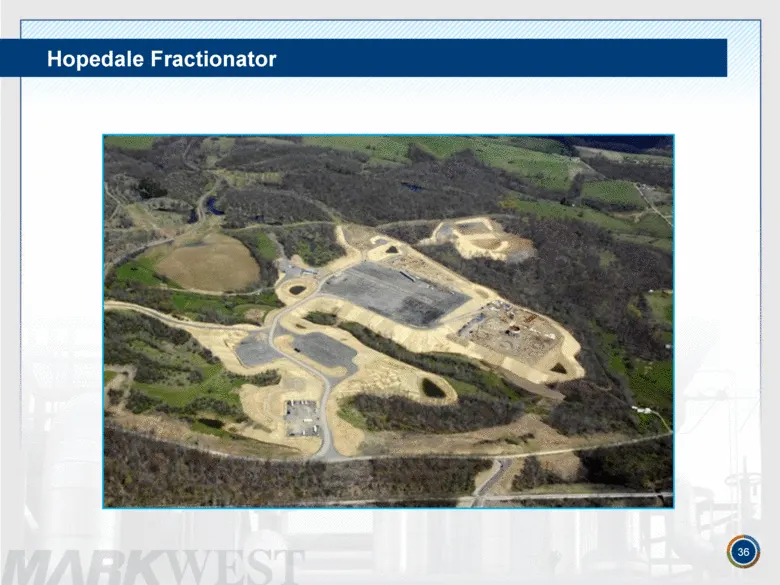
Slide 36: Hopedale Fractionator
Hopedale Fractionator 36
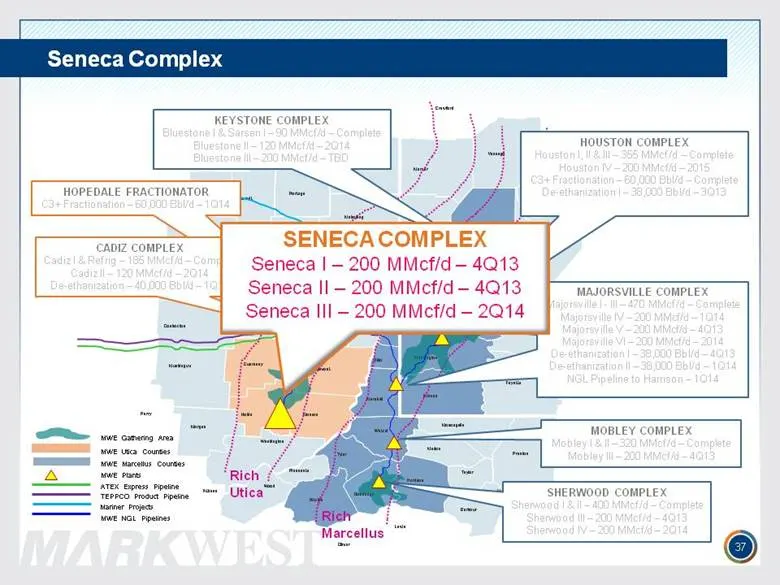
Slide 37: Seneca Complex Map
Barbour Brooke Doddridge Gilmer Hancock Harrison Lewis Marion Marshall Monongalia Ohio Pleasants Preston Ritchie Taylor Tyler Wetzel Wood Athens Belmont Carroll Columbiana Coshocton Guernsey Harrison Holmes Mahoning Medina Monroe Morgan Muskingum Noble Perry Portage Stark Summit Trumbull Tuscarawas
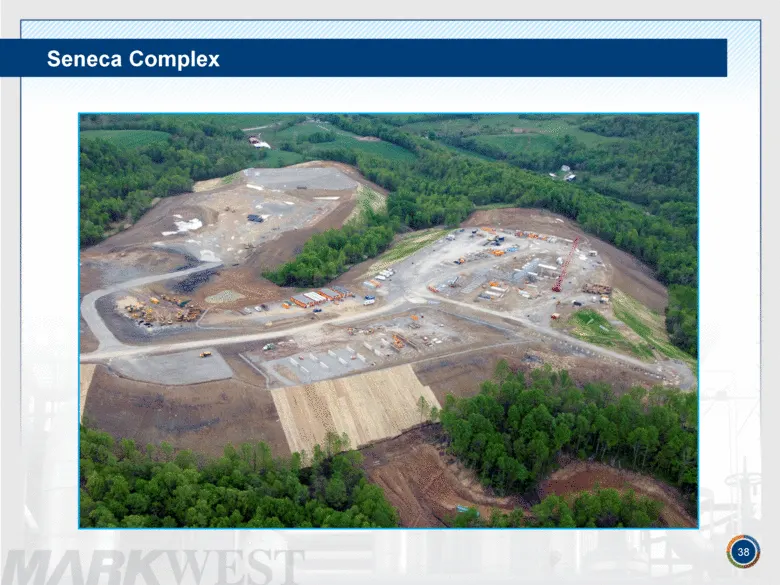
Slide 38: Seneca Complex
Seneca Complex 38
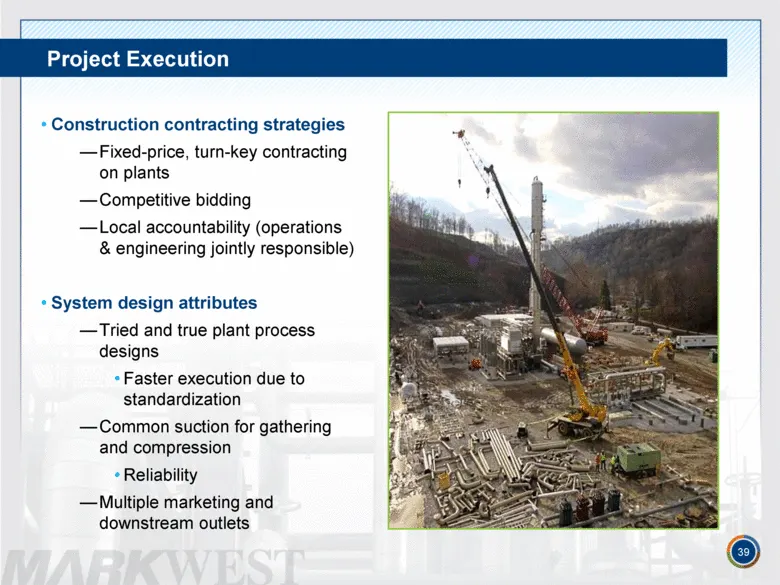
Slide 39: Project Execution
Project Execution Construction contracting strategies Fixed-price, turn-key contracting on plants Competitive bidding Local accountability (operations & engineering jointly responsible) System design attributes Tried and true plant process designs Faster execution due to standardization Common sucti
Slide 40: Regulatory and Permitting Strategies
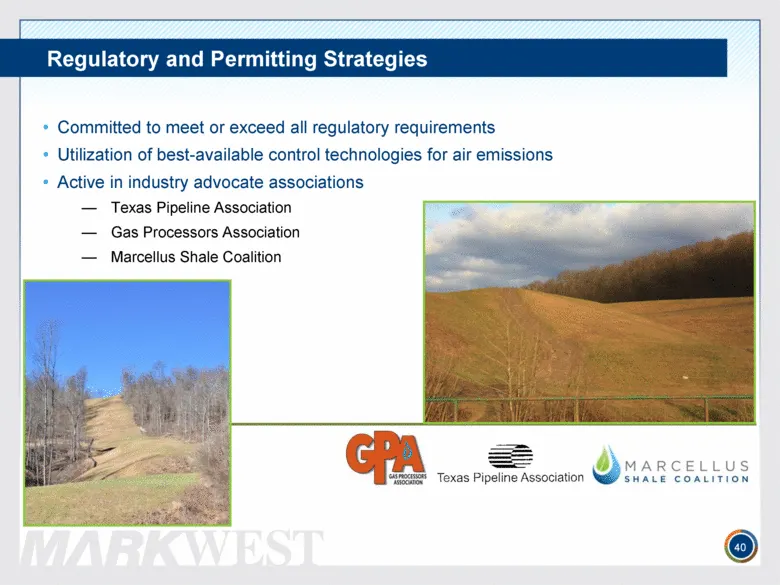
Regulatory and Permitting Strategies 40 Committed to meet or exceed all regulatory requirements Utilization of best-available control technologies for air emissions Active in industry advocate associations Texas Pipeline Association Gas Processors Association Marcellus Shale Coalition
Slide 41: Operational Summary
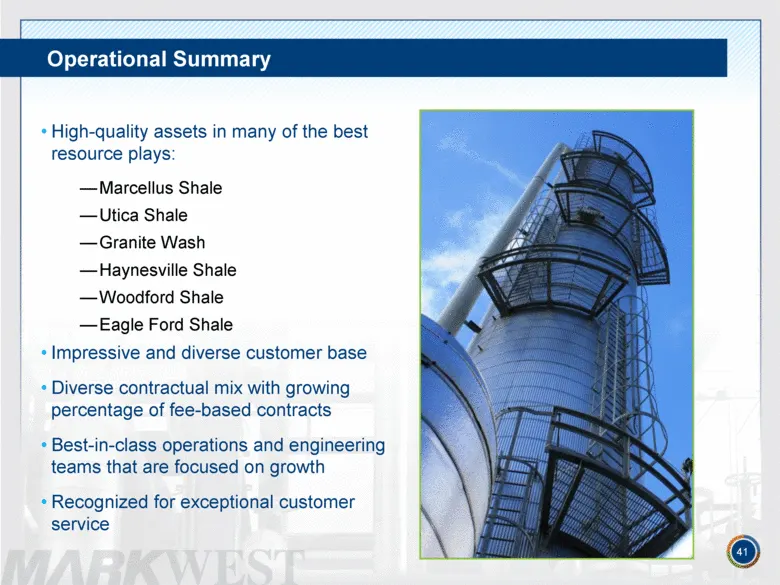
Operational Summary 41 High-quality assets in many of the best resource plays: Marcellus Shale Utica Shale Granite Wash Haynesville Shale Woodford Shale Eagle Ford Shale Impressive and diverse customer base Diverse contractual mix with growing percentage of fee-based contracts Best-in-class operatio
Slide 42: Commercial Update – Randy Nickerson
COMMERCIAL UPDATE RANDY NICKERSON Senior Vice President, Chief Commercial Officer
Slide 43: Vision Becoming Reality
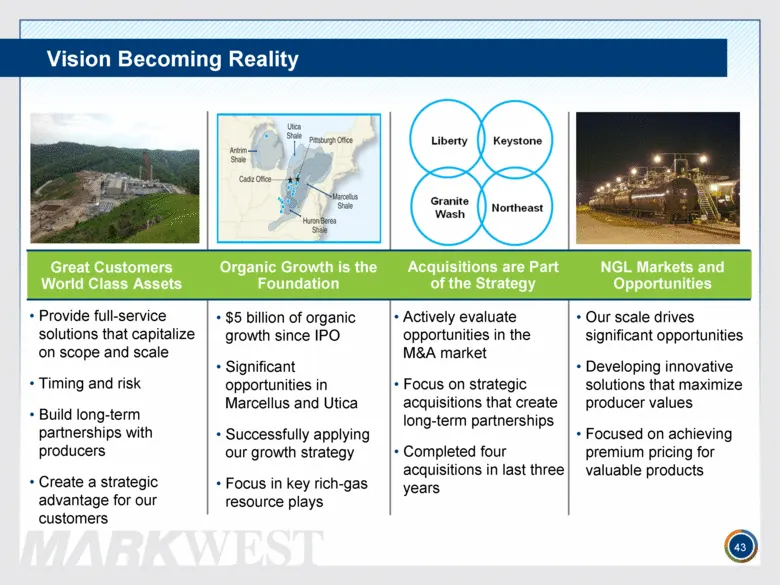
Vision Becoming Reality 43 Great Customers World Class Assets Organic Growth is the Foundation Acquisitions are Part of the Strategy NGL Markets and Opportunities Provide full-service solutions that capitalize on scope and scale Timing and risk Build long-term partnerships with producers Create a st
Slide 44: Our Strategy: Customer First
OUR STRATEGY CUSTOMER FIRST
Slide 45: Our strategy combines world class assets and service
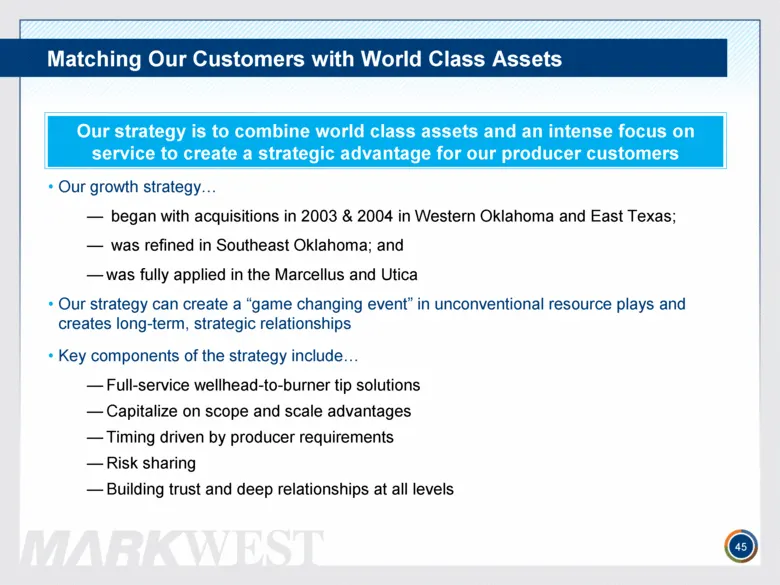
Our strategy is to combine world class assets and an intense focus on service to create a strategic advantage for our producer customers Matching Our Customers with World Class Assets Our growth strategy began with acquisitions in 2003 & 2004 in Western Oklahoma and East Texas; was refined in Southe
Slide 46: Our Strategy Drives Organic Growth
OUR STRATEGY DRIVES ORGANIC GROWTH $4 BILLION FROM 2011 THROUGH 2013
Slide 47: Applying the Vision in the Marcellus
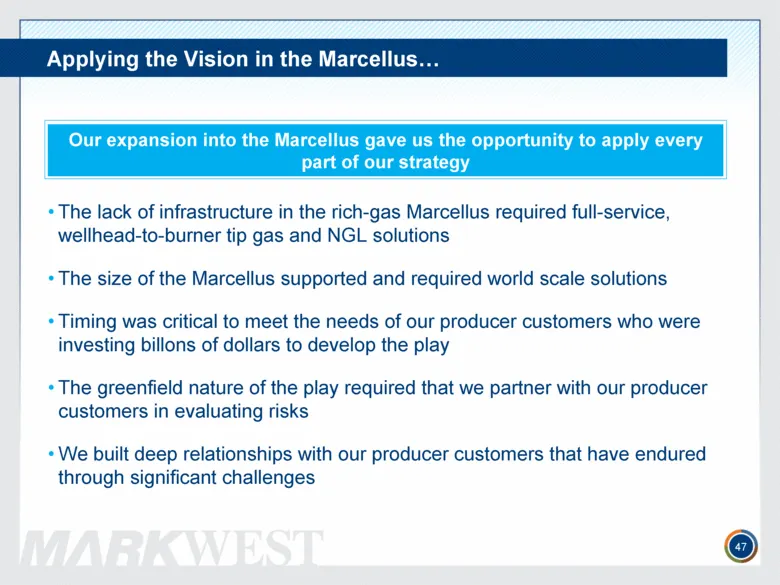
Our expansion into the Marcellus gave us the opportunity to apply every part of our strategy Applying the Vision in the Marcellus The lack of infrastructure in the rich-gas Marcellus required full-service, wellhead-to-burner tip gas and NGL solutions The size of the Marcellus supported and required
Slide 48: Marcellus Shale: Critical Relationships with Key Producers
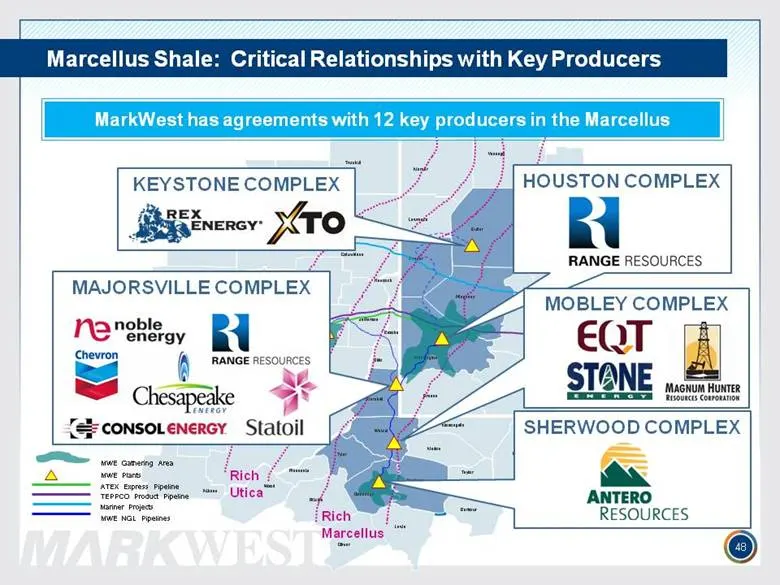
Barbour Brooke Doddridge Gilmer Hancock Harrison Lewis Marion Marshall Monongalia Ohio Pleasants Preston Ritchie Taylor Tyler Wetzel Wood Athens Belmont Carroll Columbiana Coshocton Guernsey Harrison Holmes Mahoning Medina Monroe Morgan Muskingum Noble Perry Portage Stark Summit Trumbull Tuscarawas
Slide 49: Enormous Growth in Liberty Processing Volumes
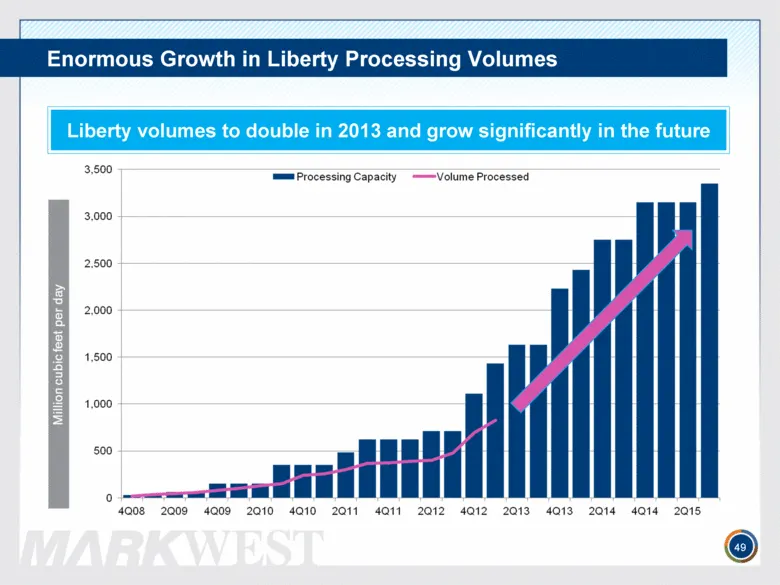
Enormous Growth in Liberty Processing Volumes 49 Liberty volumes to double in 2013 and grow significantly in the future
Slide 50: Utica Expansion: The Shale Next Door
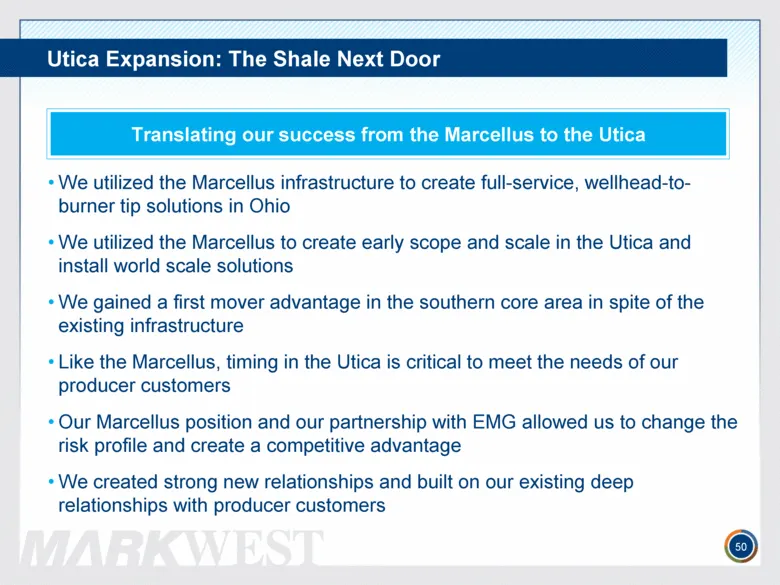
Utica Expansion: The Shale Next Door We utilized the Marcellus infrastructure to create full-service, wellhead-to-burner tip solutions in Ohio We utilized the Marcellus to create early scope and scale in the Utica and install world scale solutions We gained a first mover advantage in the southern co
Slide 51: Utica: Developing The Southern Core
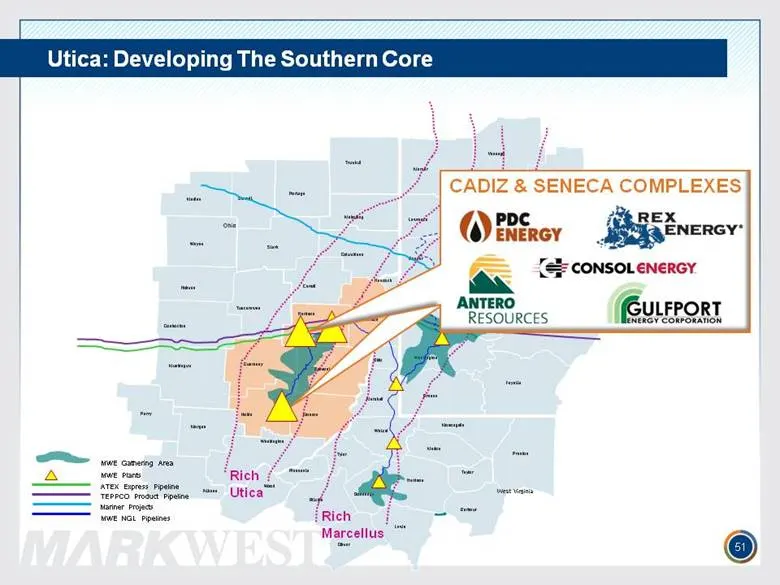
Barbour Brooke Doddridge Gilmer Hancock Harrison Lewis Marion Marshall Monongalia Ohio Pleasants Preston Ritchie Taylor Tyler Wetzel Wood Athens Belmont Carroll Columbiana Coshocton Guernsey Harrison Holmes Mahoning Medina Monroe Morgan Muskingum Noble Perry Portage Stark Summit Trumbull Tuscarawas
Slide 52: Utica: Processing Volume Growth
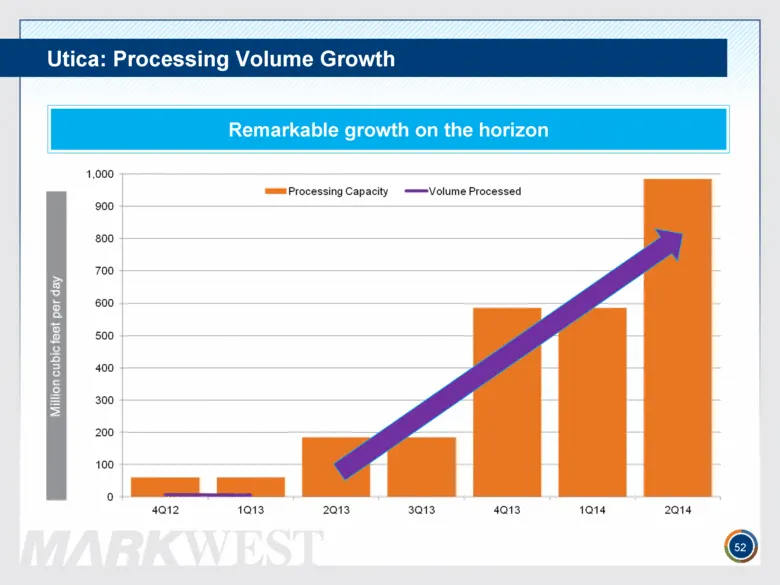
Utica: Processing Volume Growth 52 Remarkable growth on the horizon
Slide 53: East Texas: Continuing Growth Opportunities
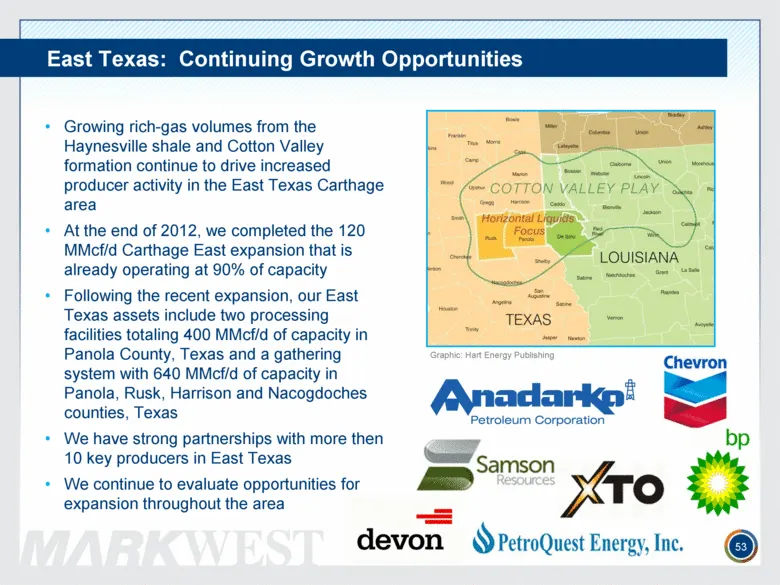
East Texas: Continuing Growth Opportunities Growing rich-gas volumes from the Haynesville shale and Cotton Valley formation continue to drive increased producer activity in the East Texas Carthage area At the end of 2012, we completed the 120 MMcf/d Carthage East expansion that is already operating
Slide 54: Organic Projects Drive Volume Growth
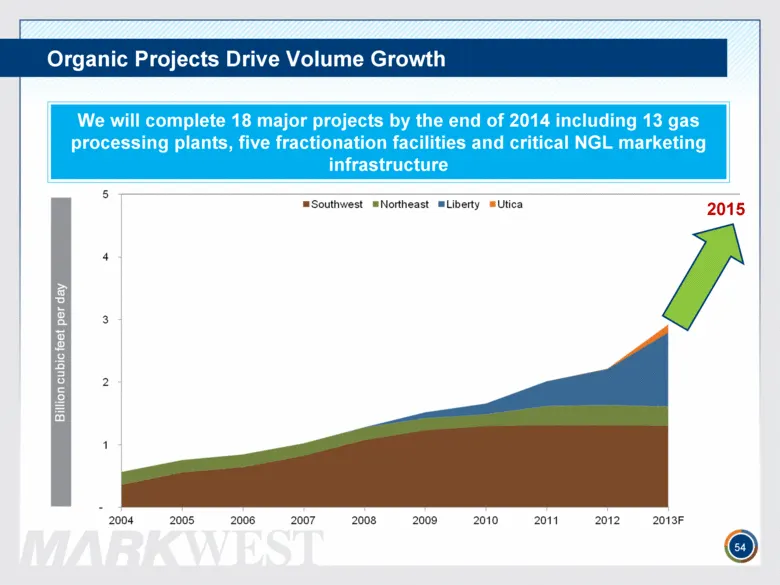
Organic Projects Drive Volume Growth 54 We will complete 18 major projects by the end of 2014 including 13 gas processing plants, five fractionation facilities and critical NGL marketing infrastructure 2015
Slide 55: Building Relationships, Creating Growth
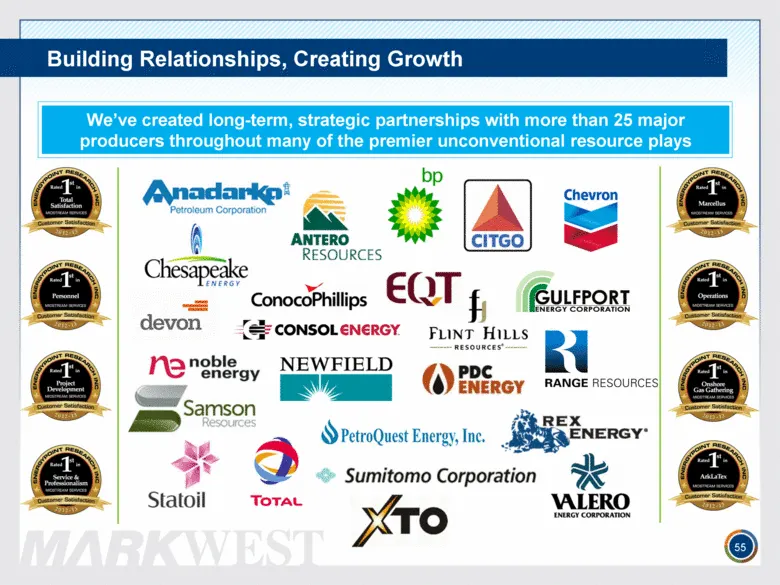
Building Relationships, Creating Growth 55 We’ve created long-term, strategic partnerships with more than 25 major producers throughout many of the premier unconventional resource plays
Slide 56: Acquisitions Are Part of the Plan
ACQUISITIONS ARE PART OF THE PLAN OPPORTUNITIES ABOUND
Slide 57: Acquisitions: Critical to the Strategy
Acquisitions: Critical to the Strategy We continue to actively evaluating strategic acquisitions We focus on opportunities where we can readily apply our strategy and favor acquisitions in areas where we have a significant position In the past three years we have completed four acquisitions: Liberty
Slide 58: Granite Wash: Expanding our Presence
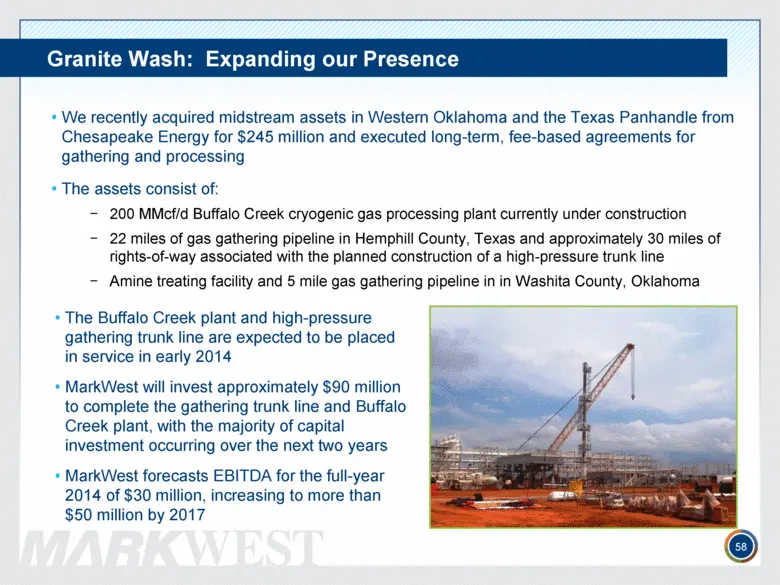
Granite Wash: Expanding our Presence We recently acquired midstream assets in Western Oklahoma and the Texas Panhandle from Chesapeake Energy for $245 million and executed long-term, fee-based agreements for gathering and processing The assets consist of: 200 MMcf/d Buffalo Creek cryogenic gas proce
Slide 59: Granite Wash: Acquisition Complements Existing System
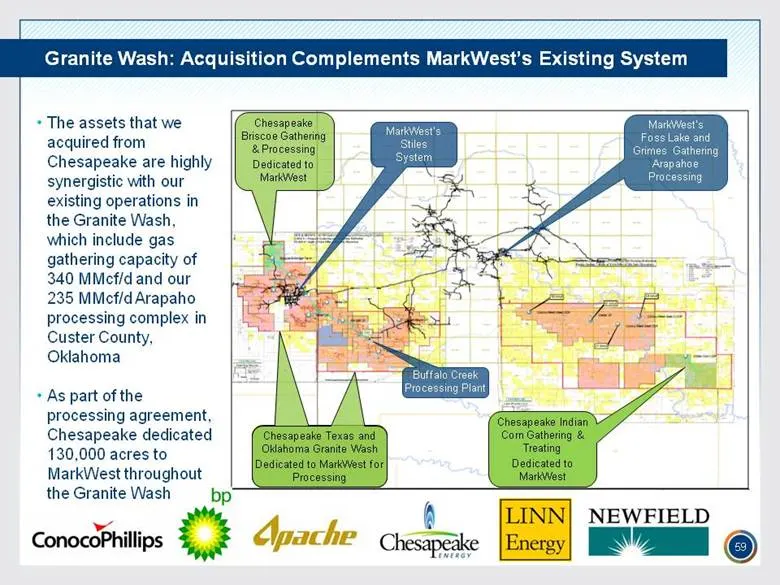
Granite Wash: Acquisition Complements MarkWest’s Existing System Chesapeake Indian Corn Gathering & Treating Dedicated to MarkWest Chesapeake Briscoe Gathering & Processing Dedicated to MarkWest MarkWest’s Foss Lake and Grimes Gathering Arapahoe Processing MarkWest’s Stiles System Chesapeake Texas a
Slide 60: Eagle Ford: Developing a Foothold
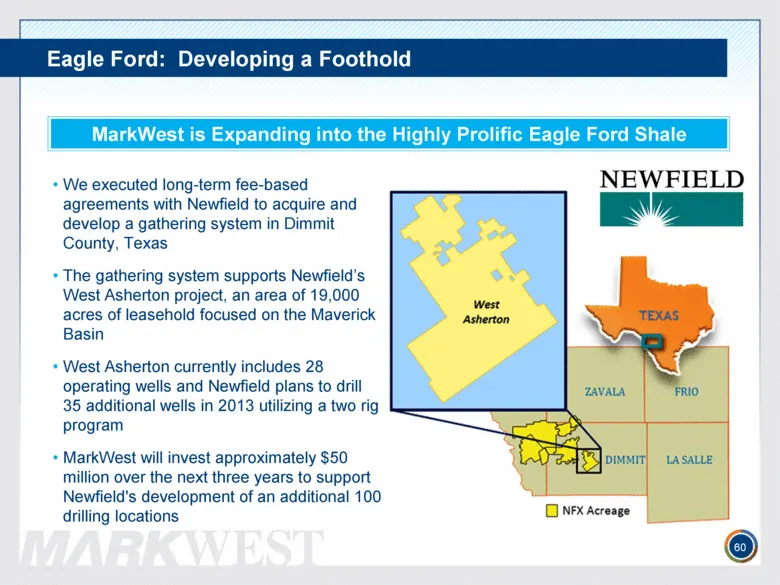
Eagle Ford: Developing a Foothold MarkWest is Expanding into the Highly Prolific Eagle Ford Shale 60 We executed long-term fee-based agreements with Newfield to acquire and develop a gathering system in Dimmit County, Texas The gathering system supports Newfield’s West Asherton project, an area of 1
Slide 61: NGL Markets: Clear Opportunity
NGL MARKETS CLEAR OPPORTUNITY
Slide 62: U.S. Processing Capacity Additions
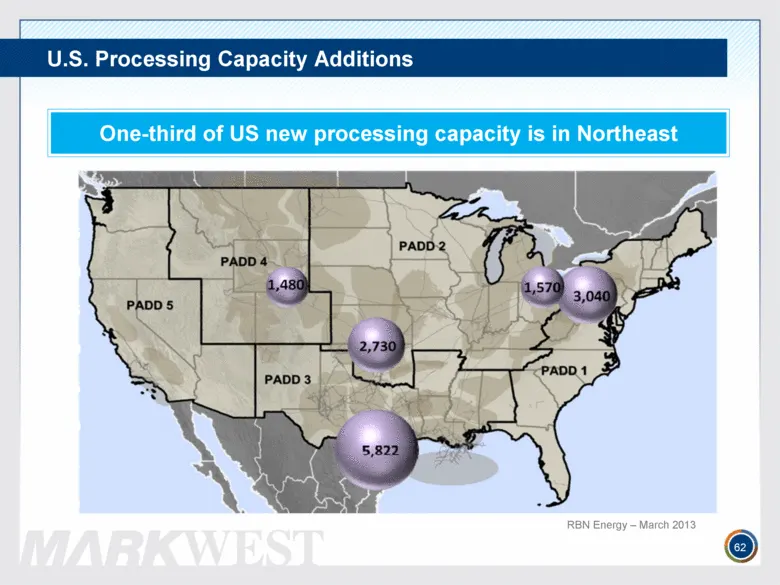
U.S. Processing Capacity Additions 62 One-third of US new processing capacity is in Northeast RBN Energy – March 2013
Slide 63: U.S. NGL Market Growth
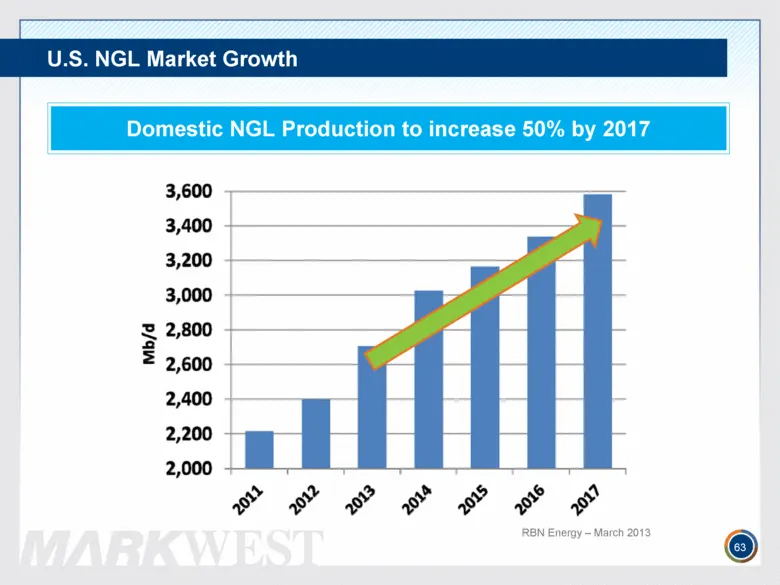
U.S. NGL Market Growth 63 Domestic NGL Production to increase 50% by 2017 RBN Energy – March 2013
Slide 64: Northeast NGL Production: Set for Liftoff
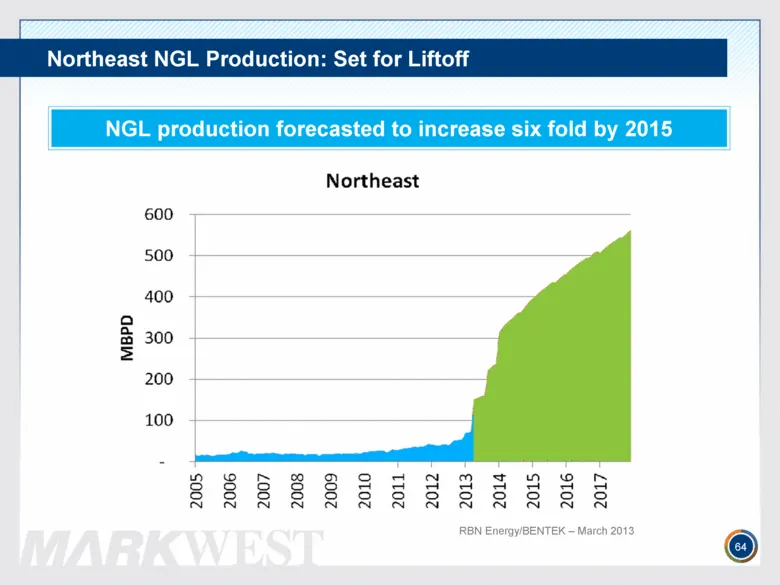
Northeast NGL Production: Set for Liftoff NGL production forecasted to increase six fold by 2015 RBN Energy/BENTEK – March 2013 64
Slide 65: Marcellus & Utica Processing Capacity
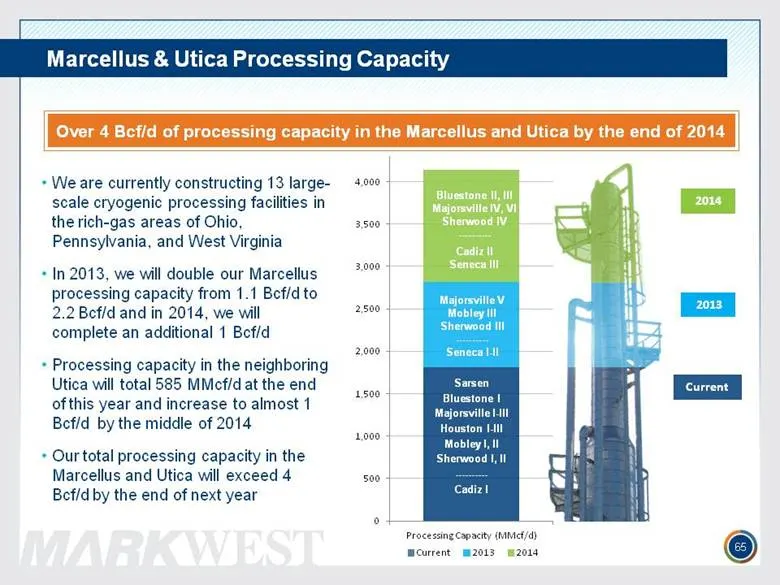
Marcellus & Utica Processing Capacity 65 Sarsen Bluestone I Majorsville I-III Houston I-III Mobley I, II Sherwood I, II ---------- Cadiz I Majorsville V Mobley III Sherwood III ---------- Seneca I-II Bluestone II, III Majorsville IV, VI Sherwood IV ---------- Cadiz II Seneca III 2014 2013 Current We
Slide 66: Northeast Ethane Fractionation
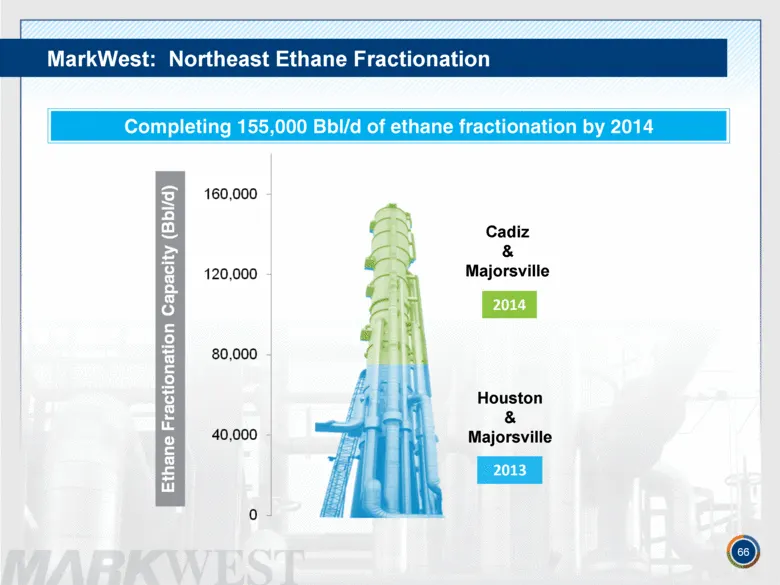
MarkWest: Northeast Ethane Fractionation 66 Completing 155,000 Bbl/d of ethane fractionation by 2014 2014 2013 Cadiz & Majorsville Houston & Majorsville
Slide 67: Marcellus & Utica C2 Potential
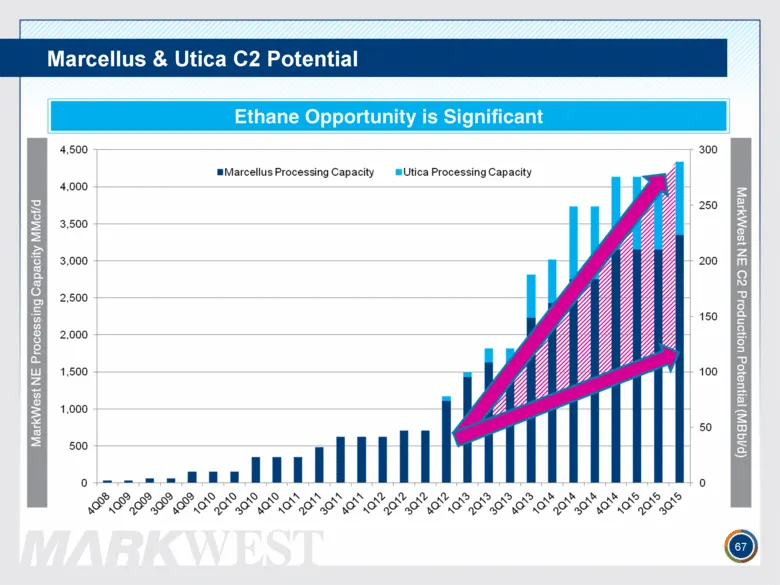
Marcellus & Utica C2 Potential 67 Ethane Opportunity is Significant
Slide 68: Northeast Ethane: Innovative Solutions
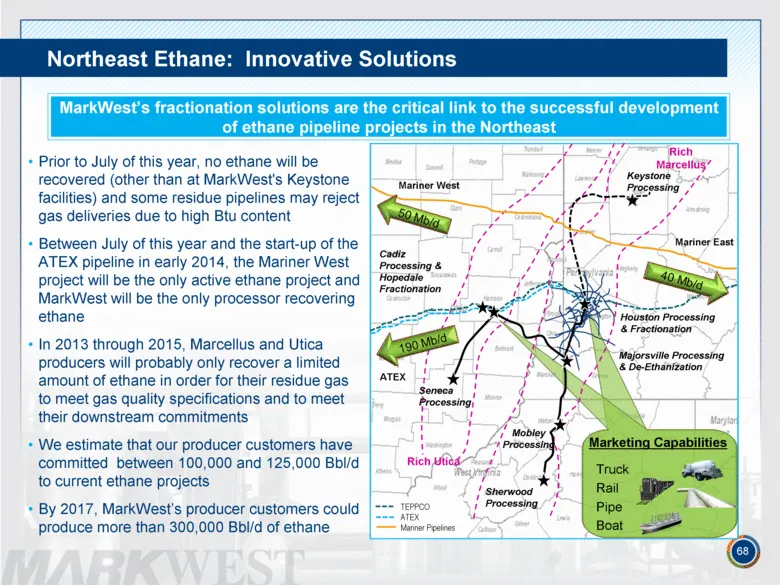
Northeast Ethane: Innovative Solutions Prior to July of this year, no ethane will be recovered (other than at MarkWest's Keystone facilities) and some residue pipelines may reject gas deliveries due to high Btu content Between July of this year and the start-up of the ATEX pipeline in early 2014, th
Slide 69: Northeast Propane Plus Fractionation
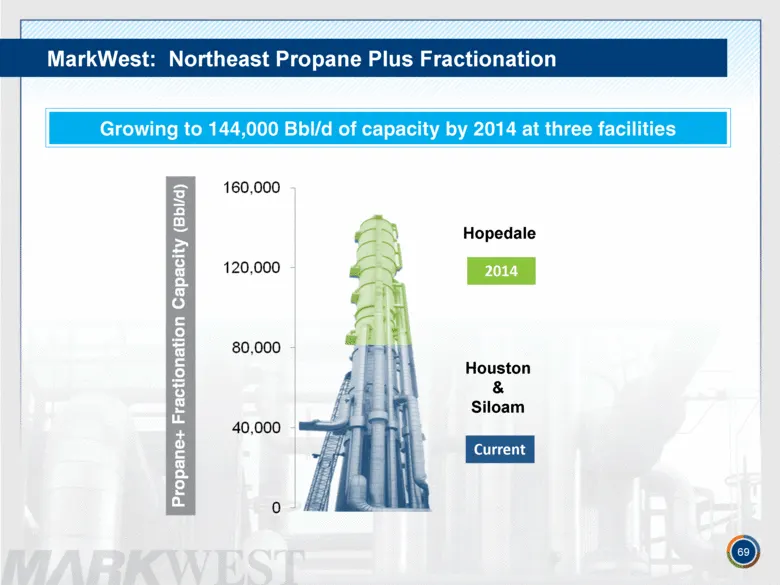
MarkWest: Northeast Propane Plus Fractionation 69 Growing to 144,000 Bbl/d of capacity by 2014 at three facilities 2014 Current Houston & Siloam Hopedale
Slide 70: Marcellus & Utica Propane Plus Potential
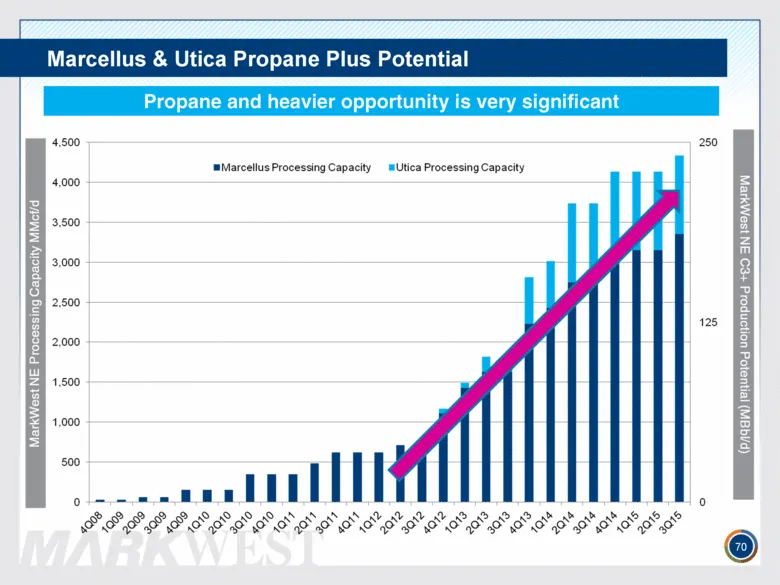
Marcellus & Utica Propane Plus Potential Propane and heavier opportunity is very significant 70
Slide 71: Northeast NGL Markets Present Opportunity
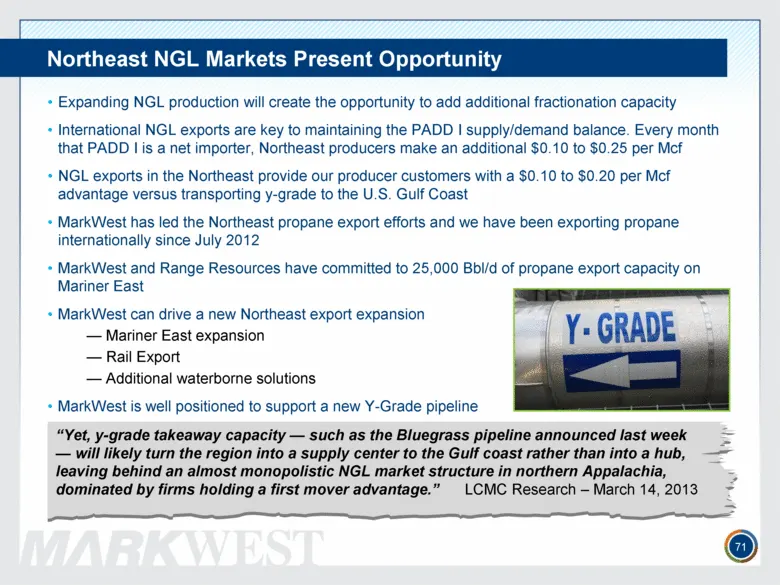
Northeast NGL Markets Present Opportunity Expanding NGL production will create the opportunity to add additional fractionation capacity International NGL exports are key to maintaining the PADD I supply/demand balance. Every month that PADD I is a net importer, Northeast producers make an additional
Slide 72: Financial Summary – Nancy Buese
FINANCIAL SUMMARY NANCY BUESE Senior Vice President, Chief Financial Officer
Slide 73: Financial Strategy
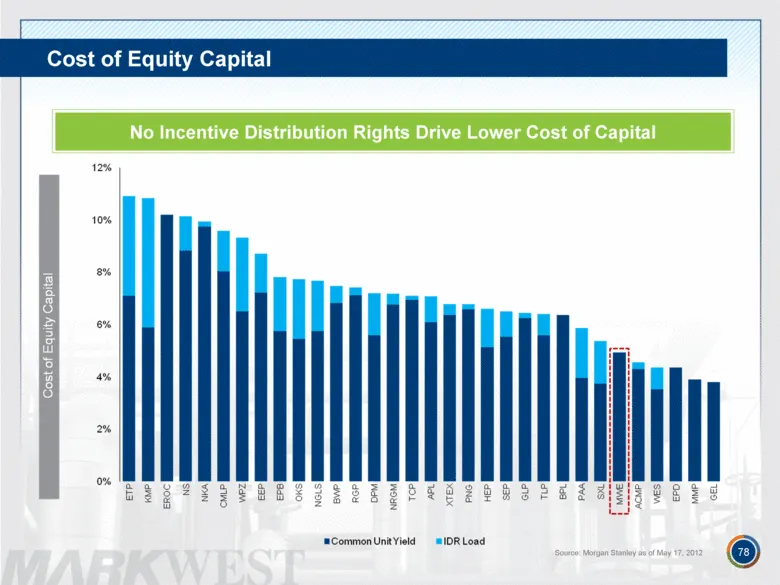
Financial Strategy MarkWest is a growth MLP focused on generating strong financial returns and delivering long-term, top-quartile total returns for its unitholders No incentive distribution rights, which drives a lower cost of capital Flexible and responsive to producer requirements Increasing perce
Slide 74: DCF and Capital Investments
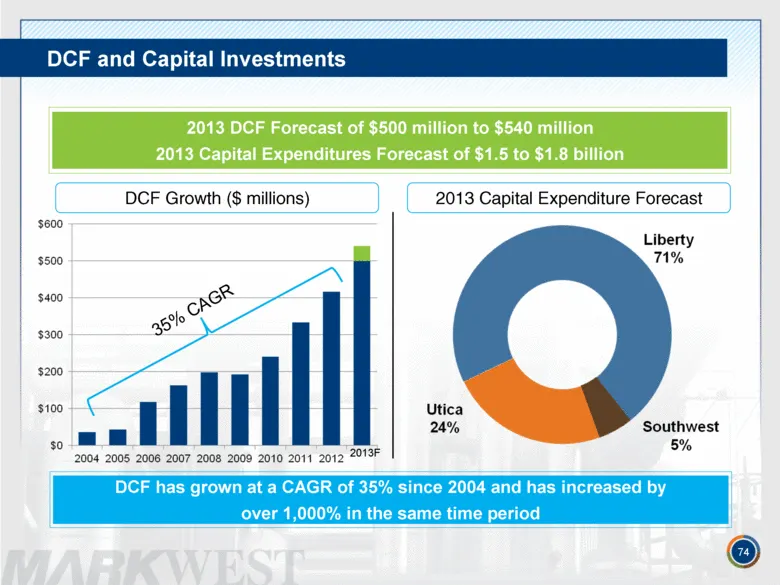
DCF and Capital Investments 74 2013 Capital Expenditure Forecast DCF Growth ($ millions) 35% CAGR 2013 DCF Forecast of $500 million to $540 million 2013 Capital Expenditures Forecast of $1.5 to $1.8 billion DCF has grown at a CAGR of 35% since 2004 and has increased by over 1,000% in the same time p
Slide 75: Capital Markets and Liquidity Update
The Partnership is well positioned to fund its ongoing capital growth plans and currently has approximately $1.4 billion of liquidity Capital Markets and Liquidity Update In January 2013, the Partnership successfully completed a $1 billion senior unsecured notes offering at 4.5% due in 2023, the low
Slide 76: Capital Structure
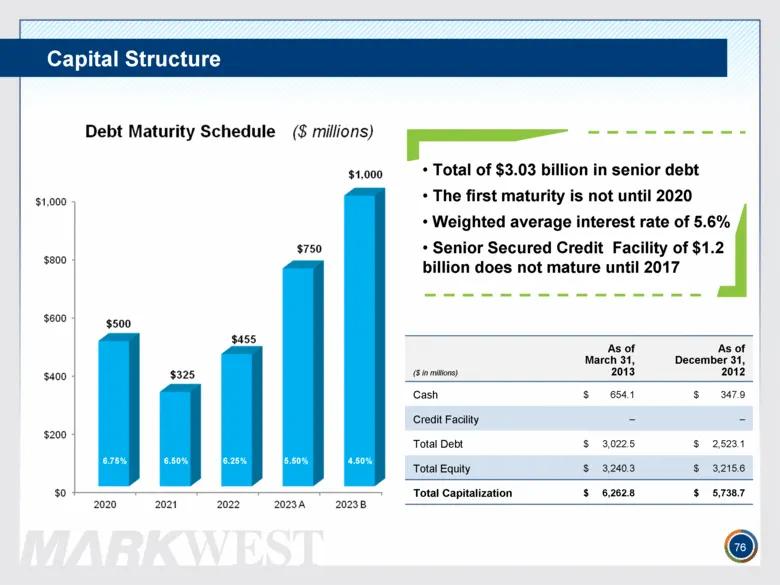
Capital Structure 76 ($ in millions) As of March 31, 2013 As of December 31, 2012 Cash $ 654.1 $ 347.9 Credit Facility – – Total Debt $ 3,022.5 $ 2,523.1 Total Equity $ 3,240.3 $ 3,215.6 Total Capitalization $ 6,262.8 $ 5,738.7 6.75% 6.50% 6.25% 5.50% 4.50% Total of $3.03 billion in senior debt The
Slide 77: Current Yield on Senior Notes
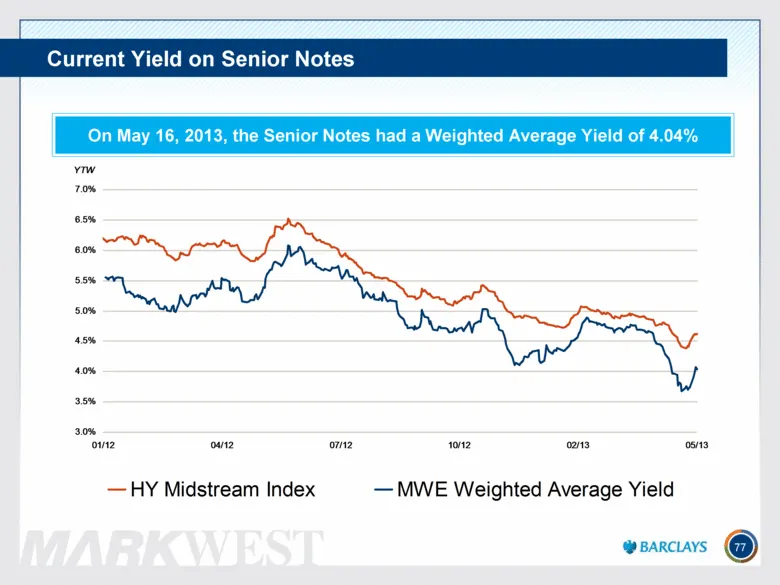
Current Yield on Senior Notes 77 On May 16, 2013, the Senior Notes had a Weighted Average Yield of 4.04% 3.0% 3.5% 4.0% 4.5% 5.0% 5.5% 6.0% 6.5% 7.0% 01/12 04/12 07/12 10/12 02/13 05/13 YTW HY Midstream Index MWE Weighted Average Yield
Slide 78: Cost of Equity Capital
Source: Morgan Stanley as of May 17, 2012 Cost of Equity Capital 78 No Incentive Distribution Rights Drive Lower Cost of Capital
Slide 79: Risk Management Program
Risk Management Program 79 We are committed to increasing our fee-based margin We have a disciplined approach to managing the risk associated with our commodity price exposure and we evaluate our long positions and hedge transactions on a 36-month rolling basis We primarily execute direct product he
Slide 80: Increasing Fee-Based Margin
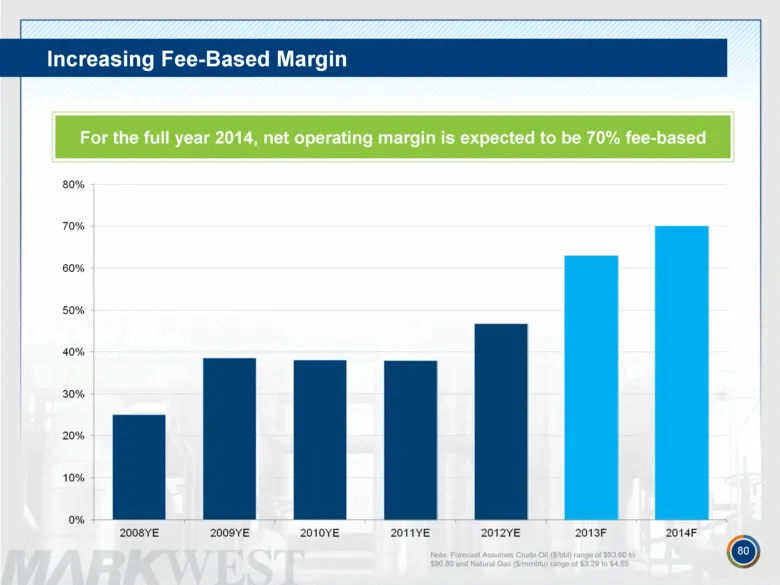
Note: Forecast Assumes Crude Oil ($/bbl) range of $93.60 to $90.80 and Natural Gas ($/mmbtu) range of $3.29 to $4.55 80 For the full year 2014, net operating margin is expected to be 70% fee-based Increasing Fee-Based Margin
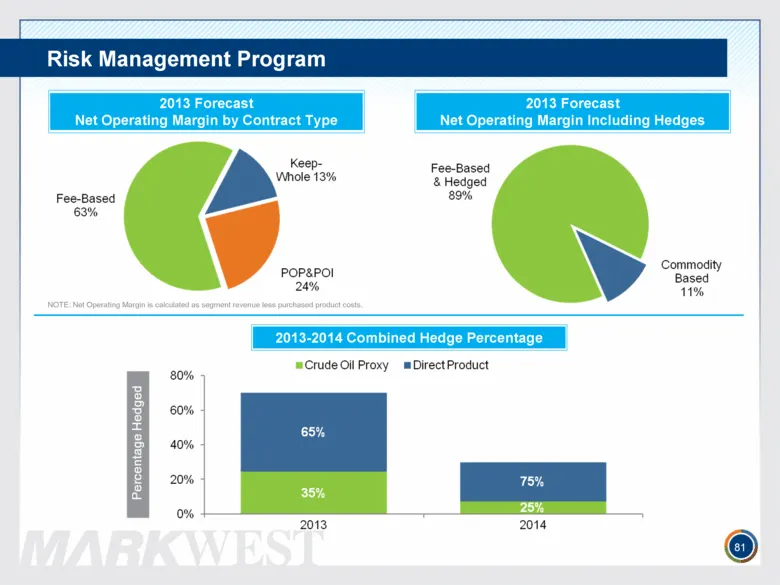
Slide 81: Risk Management Program: Hedge Percentage
Risk Management Program 81 NOTE: Net Operating Margin is calculated as segment revenue less purchased product costs. 2013-2014 Combined Hedge Percentage 2013 Forecast Net Operating Margin by Contract Type 2013 Forecast Net Operating Margin Including Hedges
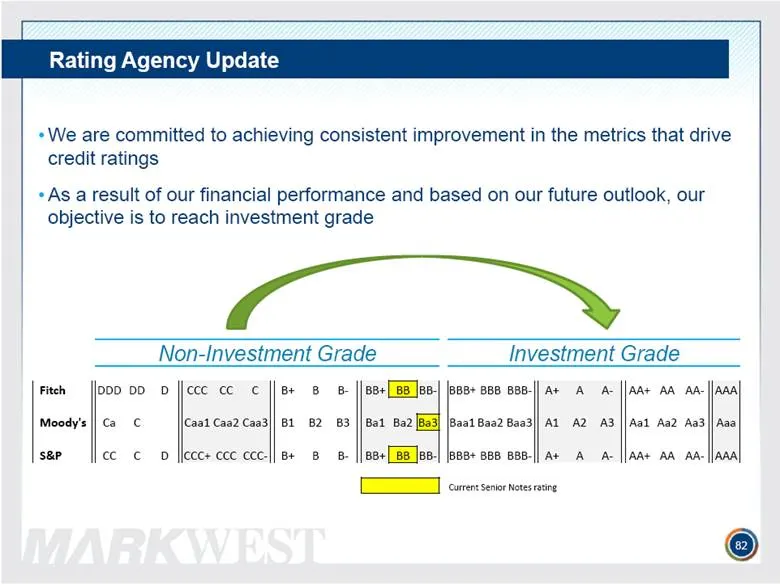
Slide 82: Rating Agency Update
Non-Investment Grade Investment Grade Fitch DDD DD D CCC CC C B+ B B- BB+ BB BB- BBB+ BBB BBB- A+ A A- AA+ AA AA- AAA Moody's Ca C Caa1 Caa2 Caa3 B1 B2 B3 Ba1 Ba2 Ba3 Baa1 Baa2 Baa3 A1 A2 A3 Aa1 Aa2 Aa3 Aaa S&P CC C D CCC+ CCC CCC- B+ B B- BB+ BB BB- BBB+ BBB BBB- A+ A A- AA+ AA AA- AAA Current Seni
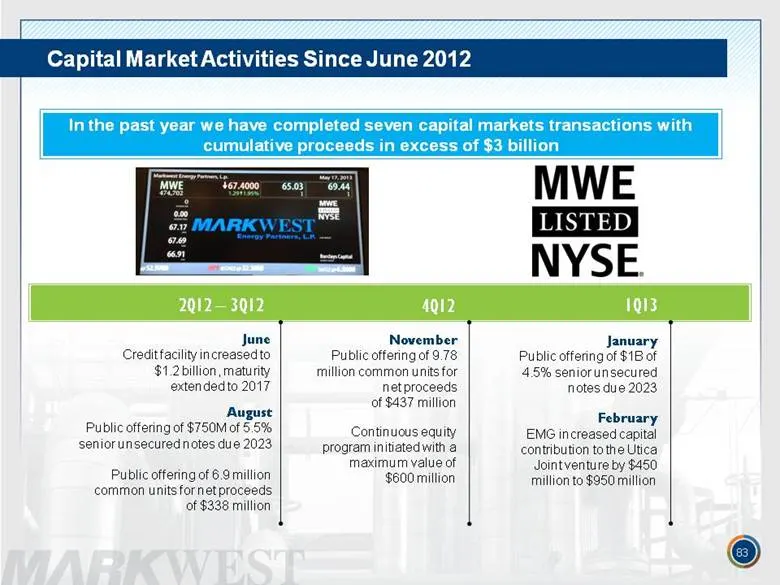
Slide 83: Capital Market Activities Since June 2012
2Q12 – 3Q12 4Q12 1Q13 August Public offering of $750M of 5.5% senior unsecured notes due 2023 Public offering of 6.9 million common units for net proceeds of $338 million November Public offering of 9.78 million common units for net proceeds of $437 million January Public offering of $1B of 4.5% sen
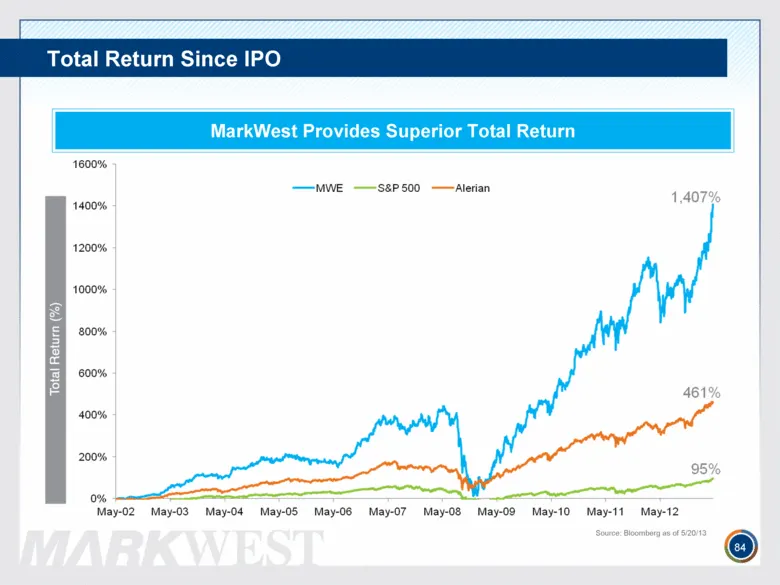
Slide 84: Total Return Since IPO
Total Return Since IPO 84 Source: Bloomberg as of 5/20/13 MarkWest Provides Superior Total Return
Slide 85: Closing Comments – Frank Semple
CLOSING COMMENTS FRANK SEMPLE
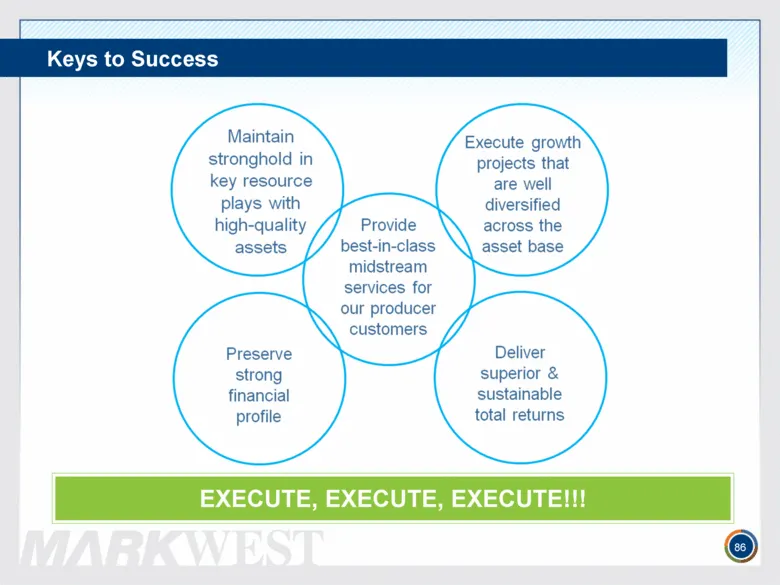
Slide 86: Keys to Success
Keys to Success 86 EXECUTE, EXECUTE, EXECUTE!!!

Slide 87: Questions & Answers
QUESTIONS & ANSWERS
Slide 88: Appendix
APPENDIX
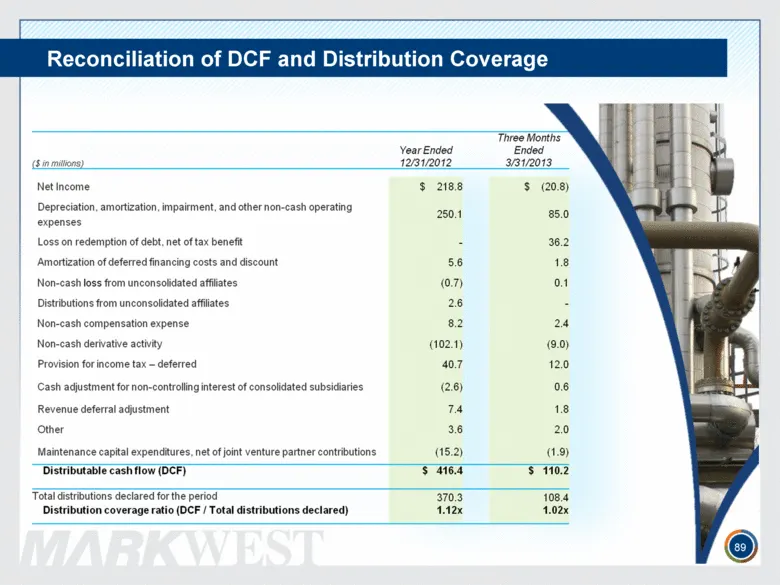
Slide 89: Reconciliation of DCF and Distribution Coverage
Reconciliation of DCF and Distribution Coverage 89
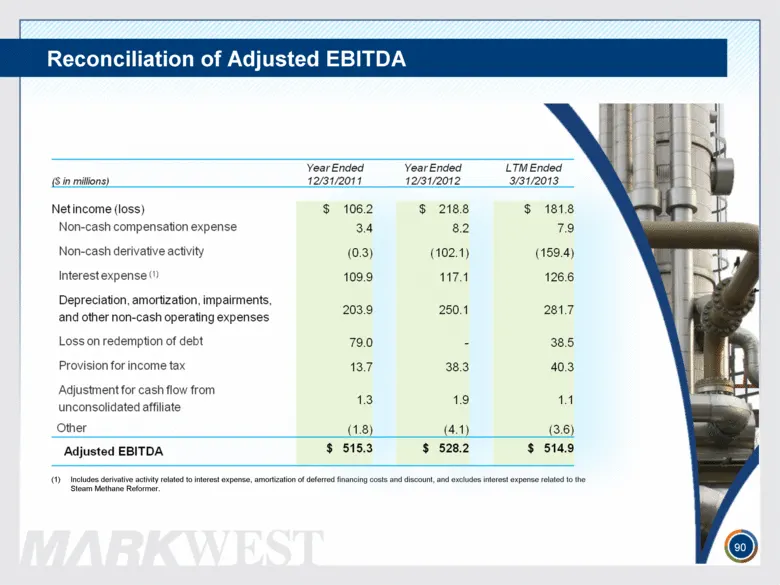
Slide 90: Reconciliation of Adjusted EBITDA
Reconciliation of Adjusted EBITDA 90 Includes derivative activity related to interest expense, amortization of deferred financing costs and discount, and excludes interest expense related to the Steam Methane Reformer.
Slide 91: Contact
1515 Arapahoe Street Tower 1, Suite 1600 Denver, Colorado 80202 Phone: 303-925-9200 Investor Relations: 866-858-0482 Email: investorrelations@markwest.com Website: www.markwest.com
Source: SEC EDGAR · 8-K filed May 29, 2013
More decks from Markwest Energy Partners LP
 Fact Sheet (July 2017)1 slide · July 2017
 Fact Sheet (July 2017)1 slide · July 2017
 Fact Sheet (July 2017)1 slide · July 2017
 Markwest Energy Partners L P — Investor Day (December 2015)116 slides · Dec 3, 2015
 Merger or Acquisition (November 2015)17 slides · Nov 13, 2015
 Merger or Acquisition (November 2015)17 slides · Nov 12, 2015