Mead Johnson Nutrition — Morgan Stanley Global Consumer Conference 2012
31 slides from Mead Johnson Nutrition's conference presentation, Nov 13, 2012

Slide 1: Morgan Stanley Global Consumer Conference
0 Morgan Stanley Global Consumer Conference November 13, 2012 New York City Kathy MacDonald Vice President – Investor Relations Pete Leemputte Executive Vice President and CFO
Slide 2: Safe Harbor Statement
1 Safe Harbor Statement Forward-Looking Statements Certain statements in this presentation are forward looking as defined in the Private Securities Litigation Reform Act of 1995. These statements, which are identified by words such as “expects,” “intends” and “believes,” involve certain risks, uncer
Slide 3: Global, focused pediatric nutrition company
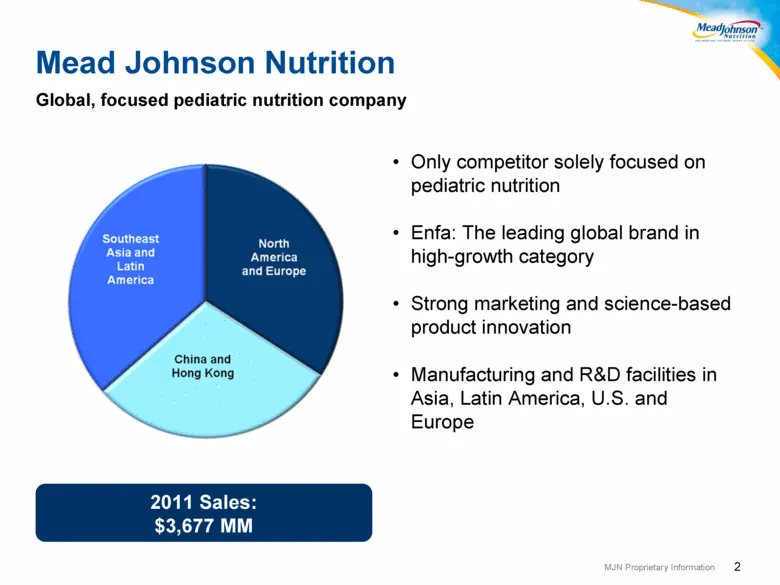
2 Only competitor solely focused on pediatric nutrition Enfa: The leading global brand in high-growth category Strong marketing and science-based product innovation Manufacturing and R&D facilities in Asia, Latin America, U.S. and Europe Mead Johnson Nutrition Global, focused pediatric nutrition com
Slide 4: Broad Product Offering
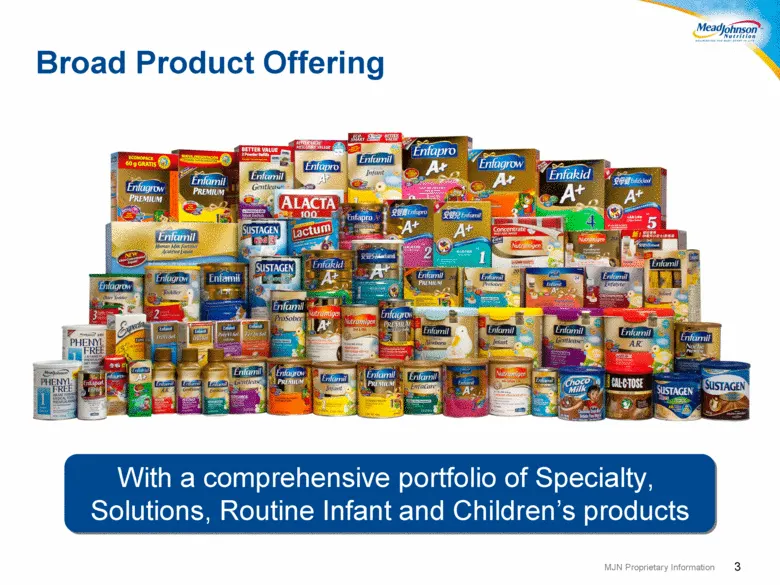
3 With a comprehensive portfolio of Specialty, Solutions, Routine Infant and Children’s products Broad Product Offering
Slide 5: Growth Industry
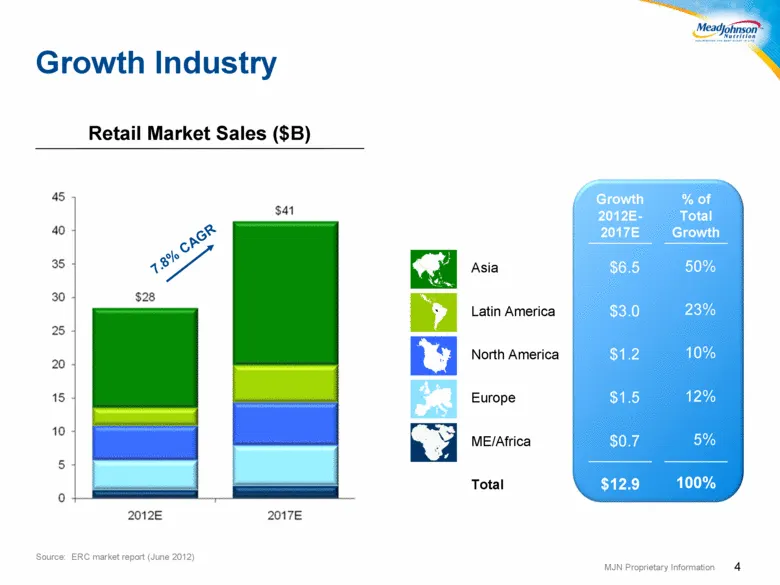
4 Growth Industry Source: ERC market report (June 2012) Asia Latin America North America Europe ME/Africa Total $6.5 $3.0 $1.2 $1.5 $0.7 $12.9 Growth 2012E-2017E 50% 23% 10% 12% 5% 100% % of Total Growth ` 7.8% CAGR Retail Market Sales ($B)
Slide 6: Key Drivers of Longer Term Growth
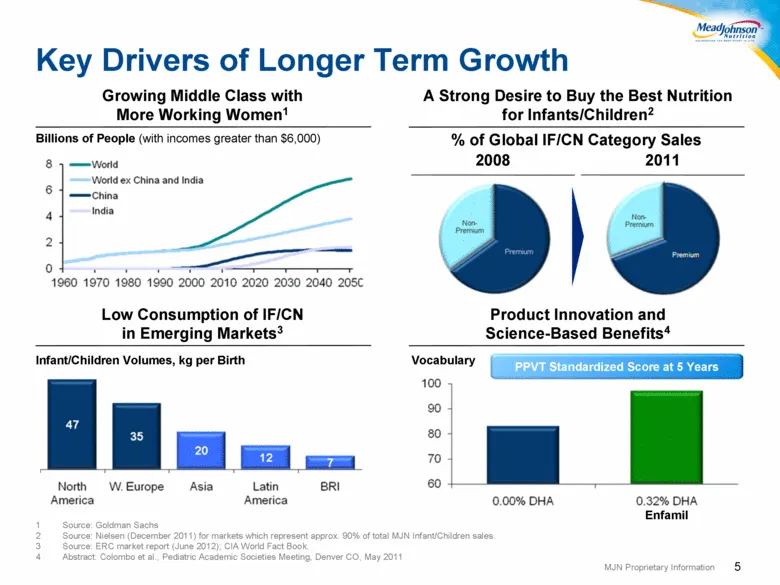
5 Key Drivers of Longer Term Growth Vocabulary Infant/Children Volumes, kg per Birth 2008 2011 Growing Middle Class with More Working Women1 A Strong Desire to Buy the Best Nutrition for Infants/Children2 Low Consumption of IF/CN in Emerging Markets3 Product Innovation and Science-Based Benefits4 So
Slide 7: Scientific Research Drives Innovation
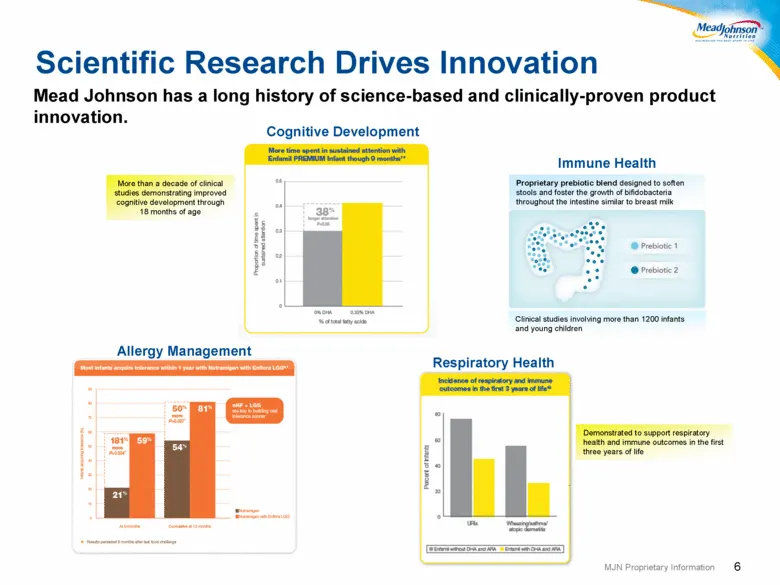
6 Scientific Research Drives Innovation Respiratory Health Immune Health Allergy Management Cognitive Development More than a decade of clinical studies demonstrating improved cognitive development through 18 months of age Proprietary prebiotic blend designed to soften stools and foster the growth o
Slide 8: Strong Pipeline of Innovation
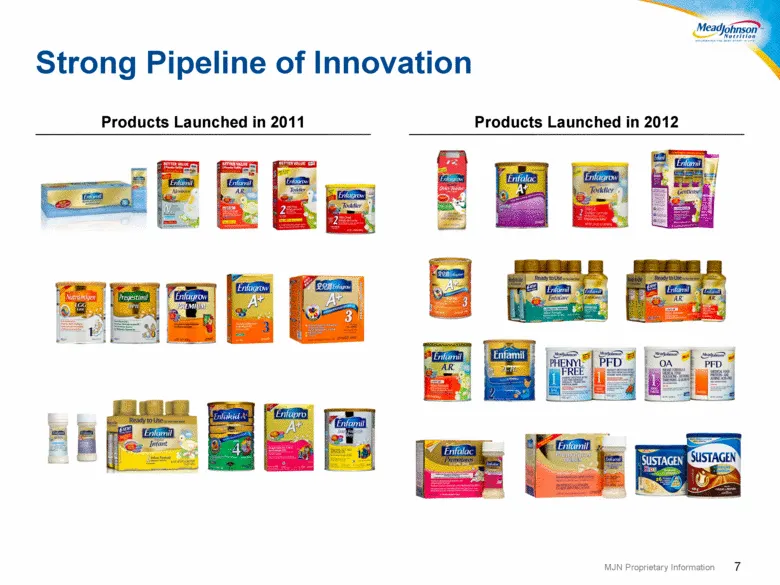
7 Products Launched in 2011 Products Launched in 2012 Strong Pipeline of Innovation
Slide 9: Top-tier Quality, Efficiency and Productivity
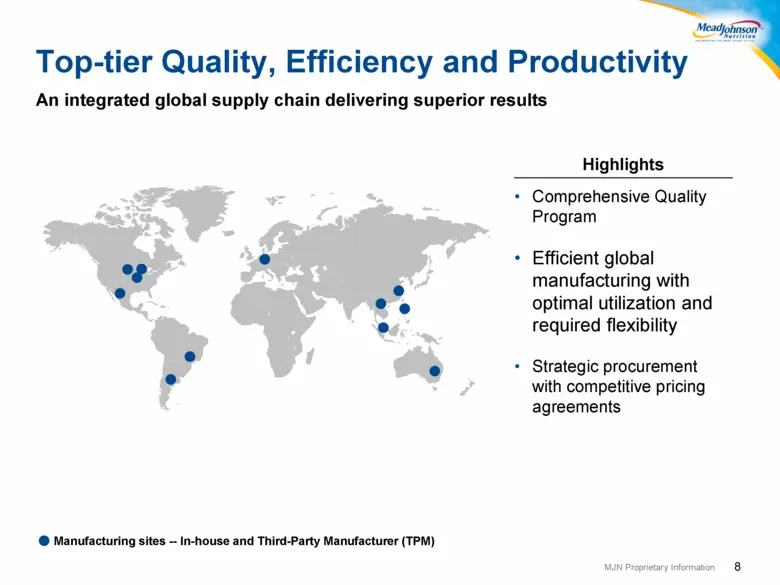
8 Highlights Comprehensive Quality Program Efficient global manufacturing with optimal utilization and required flexibility Strategic procurement with competitive pricing agreements Manufacturing sites -- In-house and Third-Party Manufacturer (TPM) Top-tier Quality, Efficiency and Productivity An in
Slide 10: Proven Demand Generation Model
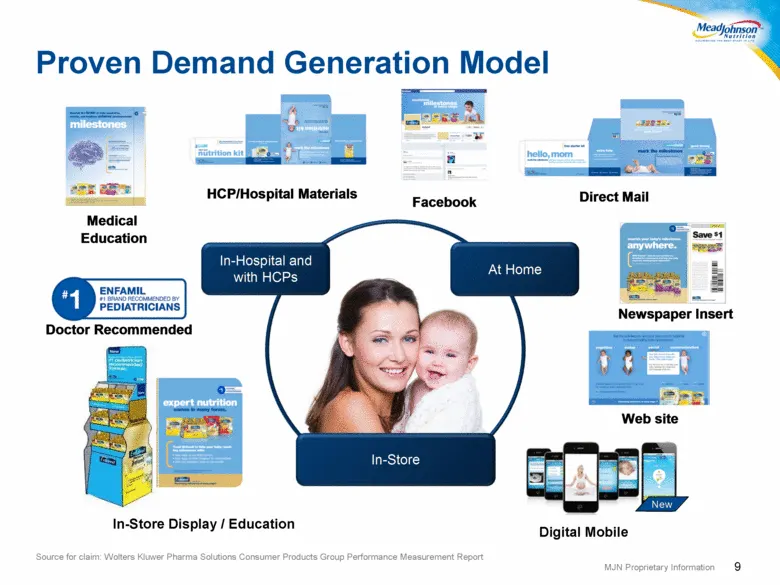
9 Proven Demand Generation Model In-Store Display / Education Digital Mobile Source for claim: Wolters Kluwer Pharma Solutions Consumer Products Group Performance Measurement Report In - Store In - Store In - Hospital and with HCPs In - Hospital and with HCPs At Home At Home New Facebook HCP/Hospita
Slide 11: China Premium Mix
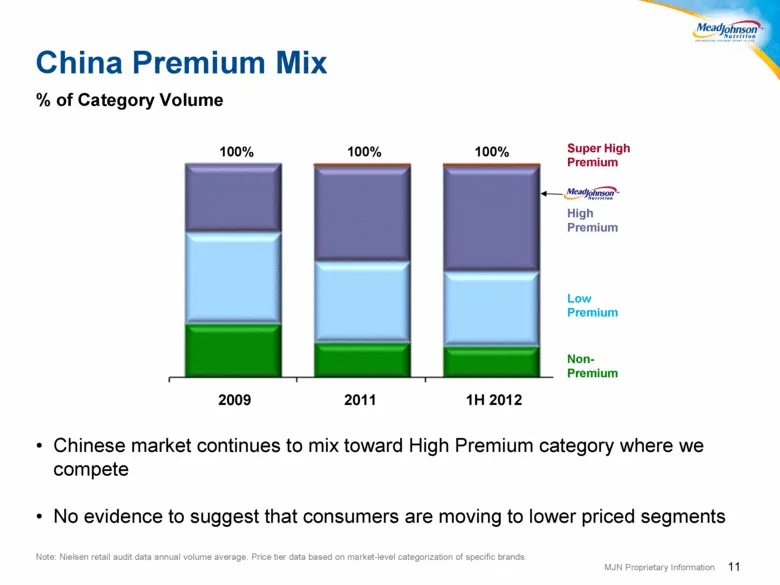
11 China Premium Mix % of Category Volume Chinese market continues to mix toward High Premium category where we compete No evidence to suggest that consumers are moving to lower priced segments High Premium Super High Premium Low Premium Non-Premium 100% 100% 100% Note: Nielsen retail audit data ann
Slide 12: China/Hong Kong Market Share
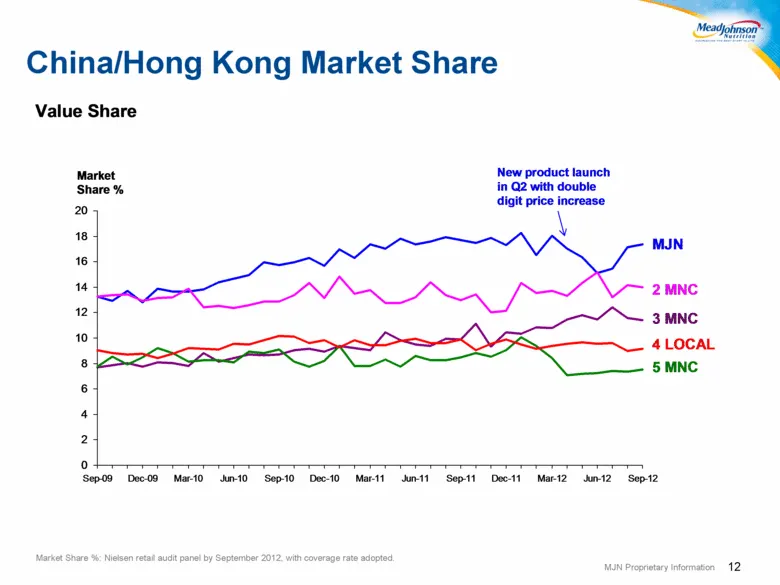
12 China/Hong Kong Market Share Market Share %: Nielsen retail audit panel by September 2012, with coverage rate adopted. 0 2 4 6 8 10 12 14 16 18 20 Sep-09 Dec-09 Mar-10 Jun-10 Sep-10 Dec-10 Mar-11 Jun-11 Sep-11 Dec-11 Mar-12 Jun-12 Sep-12 Market Share % 2 MNC 4 LOCAL 3 MNC MJN 5 MNC Value Share Ne
Slide 13: MJN China Inventory and Market Share
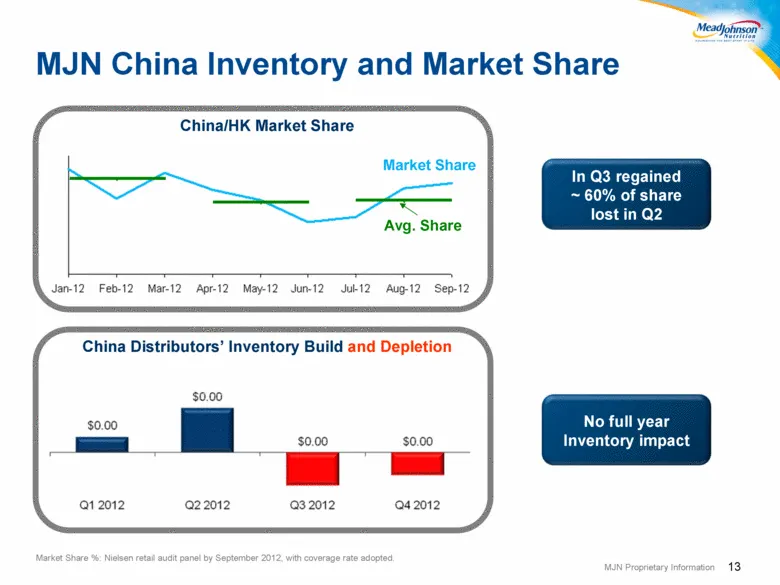
13 MJN China Inventory and Market Share Market Share No full year Inventory impact Avg. Share China Distributors’ Inventory Build and Depletion China/HK Market Share In Q3 regained ~ 60% of share lost in Q2 Market Share %: Nielsen retail audit panel by September 2012, with coverage rate adopted.
Slide 14: 2012 Product Innovation
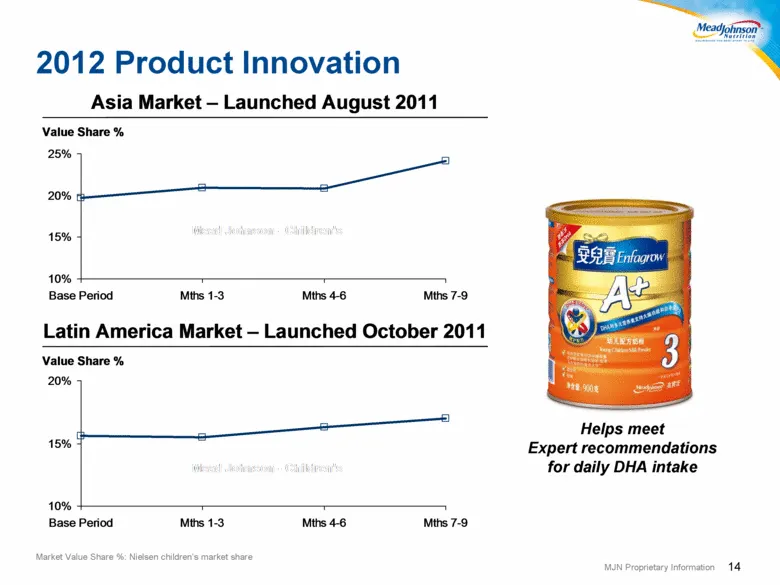
14 2012 Product Innovation Helps meet Expert recommendations for daily DHA intake Market Value Share %: Nielsen children’s market share Value Share % Asia Market – Launched August 2011 Asia Market – Launched August 2011 10% 15% 20% 25% Base Period Mths 1-3 Mths 4-6 Mths 7-9 Value Share % Latin Ameri
Slide 15: United States Near Term Challenges, But Reason for Future Optimism
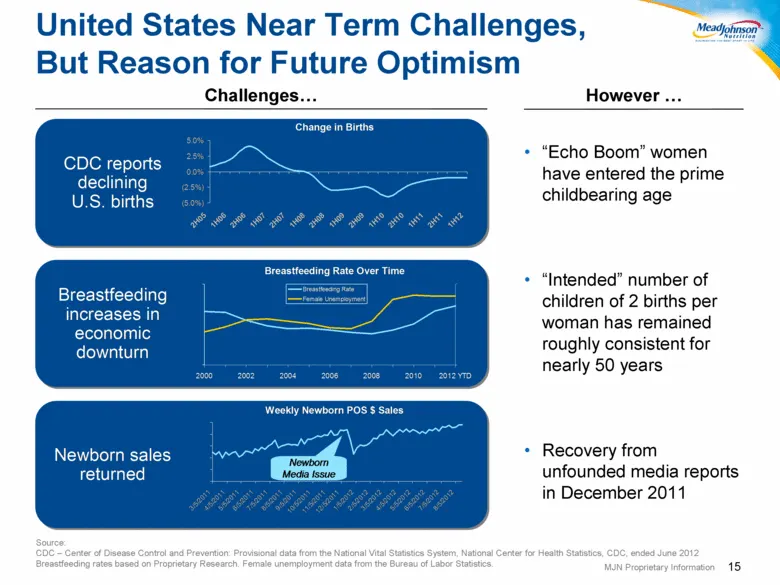
15 “Echo Boom” women have entered the prime childbearing age “Intended” number of children of 2 births per woman has remained roughly consistent for nearly 50 years Recovery from unfounded media reports in December 2011 Challenges However United States Near Term Challenges, But Reason for Future Opt
Slide 16: MJN is an Established Market Leader in Asia
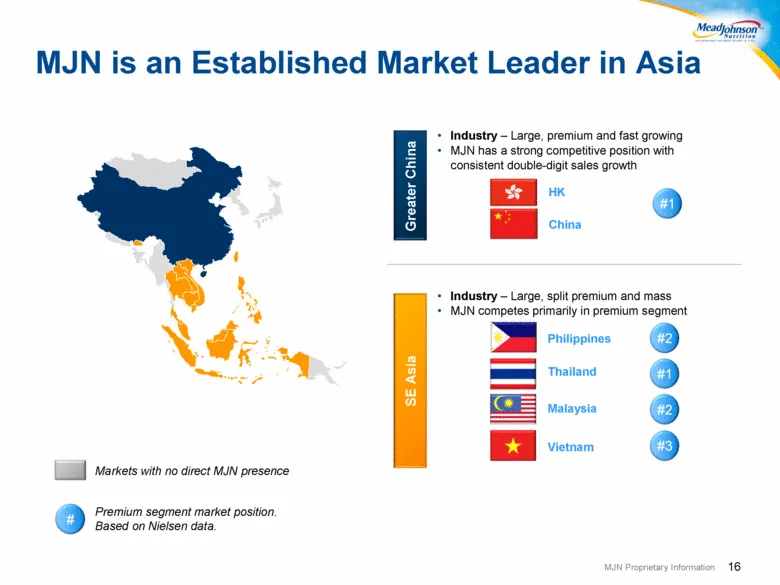
16 MJN is an Established Market Leader in Asia Greater China Markets with no direct MJN presence SE Asia Industry – Large, premium and fast growing MJN has a strong competitive position with consistent double-digit sales growth Industry – Large, split premium and mass MJN competes primarily in premi
Slide 17: Latin America is a Key Pillar of Growth
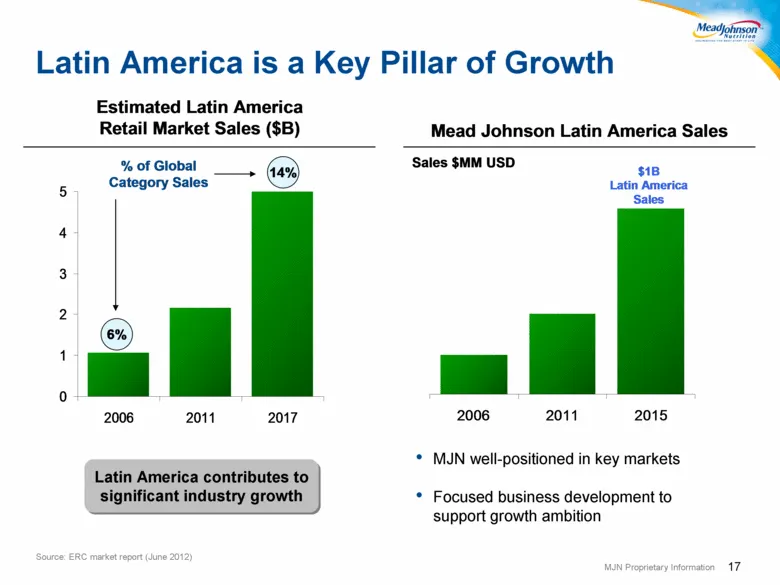
17 17 MJN well-positioned in key markets Focused business development to support growth ambition Latin America contributes to significant industry growth Latin America is a Key Pillar of Growth Source: ERC market report (June 2012) 2006 2011 2015 Sales $MM USD $1B Latin America Sales Mead Johnson La
Slide 18: Poised for Faster Growth in Latin America
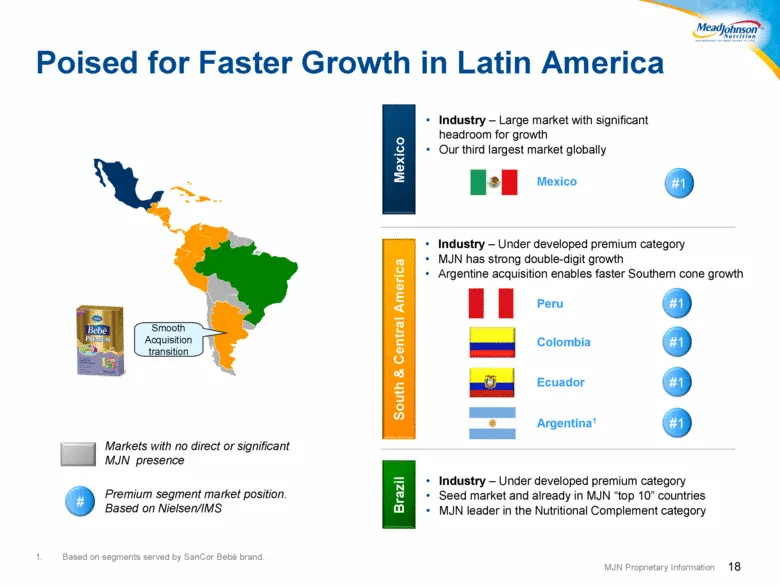
18 Poised for Faster Growth in Latin America Mexico Markets with no direct or significant MJN presence South & Central America Industry – Large market with significant headroom for growth Our third largest market globally Industry – Under developed premium category MJN has strong double-digit growth

Slide 19: Financial Overview
19 Financial Overview
Slide 20: Strong Financial Performance
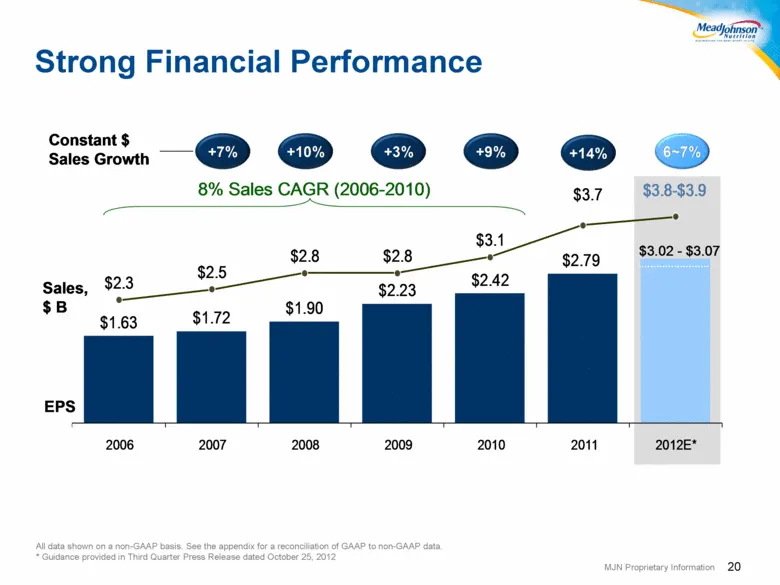
20 Strong Financial Performance All data shown on a non-GAAP basis. See the appendix for a reconciliation of GAAP to non-GAAP data. * Guidance provided in Third Quarter Press Release dated October 25, 2012 $ 1 . 63 $ 1 . 72 $ 1 . 90 $ 2 . 23 $ 2 . 42 $ 2 . 79 $ 2 . 3 $ 2 . 5 $ 2 . 8 $ 2 . 8 $ 3 . 1
Slide 21: WIC Program
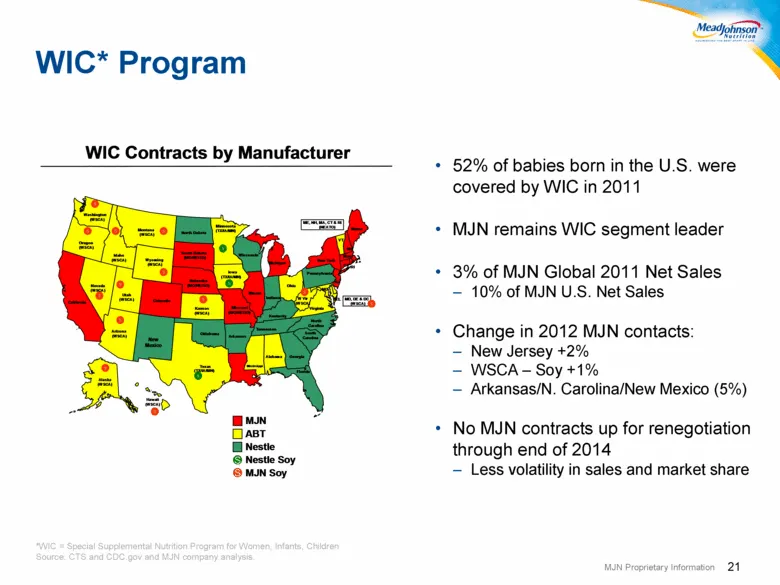
21 WIC* Program 52% of babies born in the U.S. were covered by WIC in 2011 MJN remains WIC segment leader 3% of MJN Global 2011 Net Sales 10% of MJN U.S. Net Sales Change in 2012 MJN contacts: New Jersey +2% WSCA – Soy +1% Arkansas/N. Carolina/New Mexico (5%) No MJN contracts up for renegotiation th
Slide 22: Dairy Spot Prices
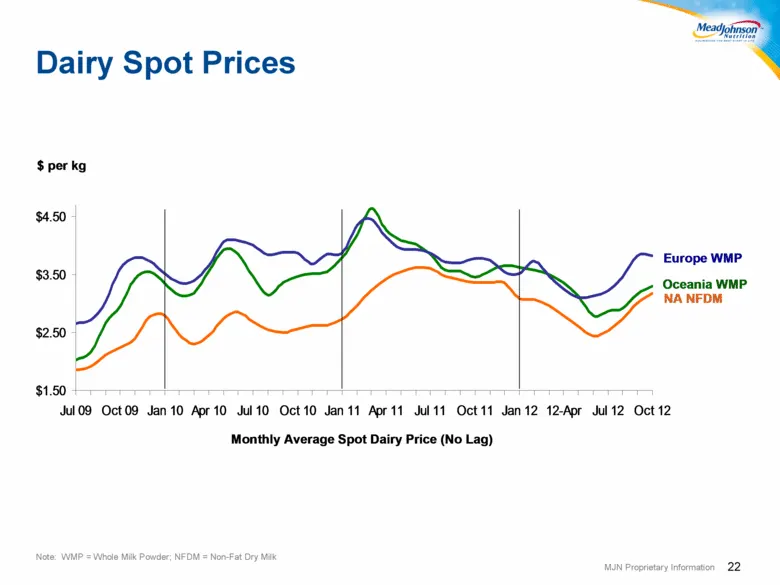
22 Dairy Spot Prices Note: WMP = Whole Milk Powder; NFDM = Non-Fat Dry Milk $1.50 $2.50 $3.50 $4.50 Jul 09 Oct 09 Jan 10 Apr 10 Jul 10 Oct 10 Jan 11 Apr 11 Jul 11 Oct 11 Jan 12 12-Apr Jul 12 Oct 12 $ per kg Monthly Average Spot Dairy Price (No Lag) Europe WMP NA NFDM Oceania WMP
Slide 23: Importance of Productivity to Gross Margins
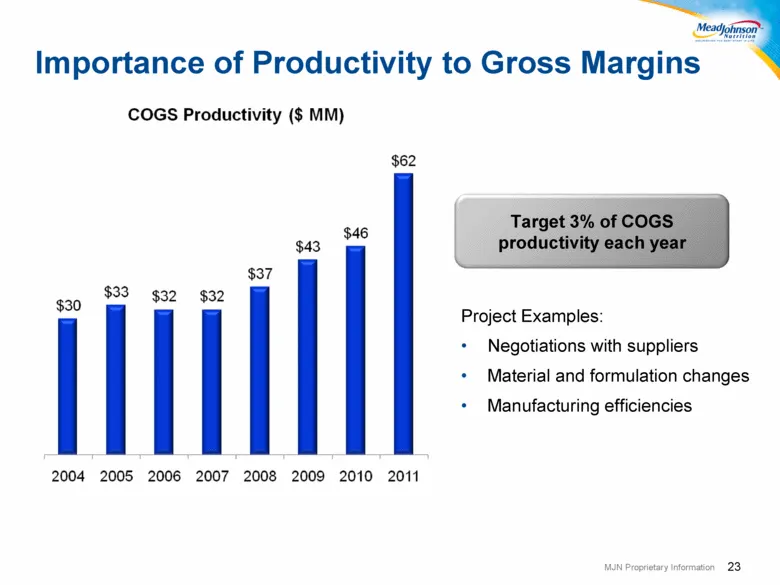
23 Importance of Productivity to Gross Margins Target 3% of COGS productivity each year Project Examples: Negotiations with suppliers Material and formulation changes Manufacturing efficiencies
Slide 24: Efficient G&A Spending; Reduce Effective Tax Rate
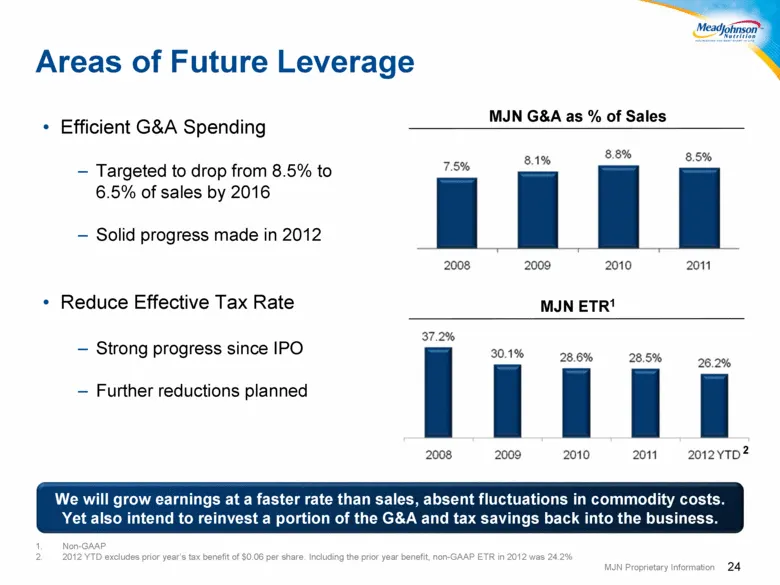
24 Efficient G&A Spending Targeted to drop from 8.5% to 6.5% of sales by 2016 Solid progress made in 2012 Reduce Effective Tax Rate Strong progress since IPO Further reductions planned We will grow earnings at a faster rate than sales, absent fluctuations in commodity costs. Yet also intend to reinv
Slide 25: Strong Cash Flow and Uses of Cash
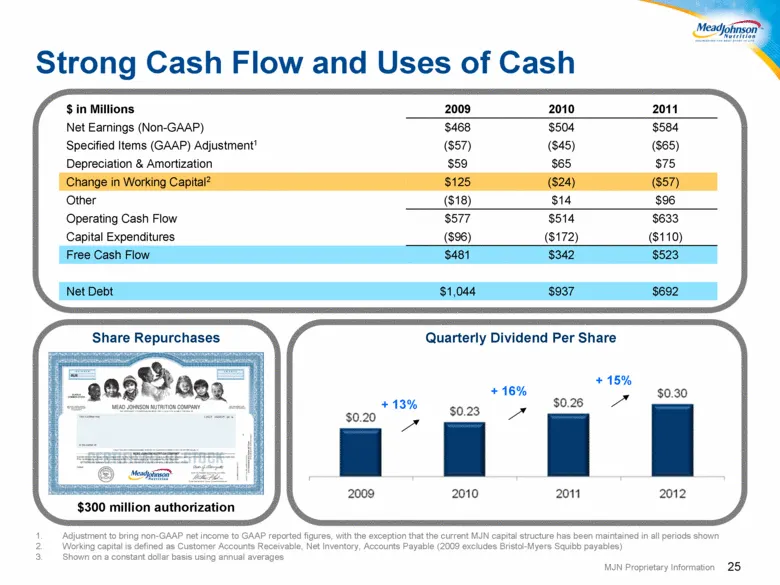
25 Strong Cash Flow and Uses of Cash Share Repurchases $300 million authorization 2009 2010 Full Year $ in Millions 2009 2010 2011 Net Earnings (Non-GAAP) $468 $504 $584 Specified Items (GAAP) Adjustment1 ($57) ($45) ($65) Depreciation & Amortization $59 $65 $75 Change in Working Capital2 $125 ($24)
Slide 26: Early Perspectives on 2013 vs. 2012
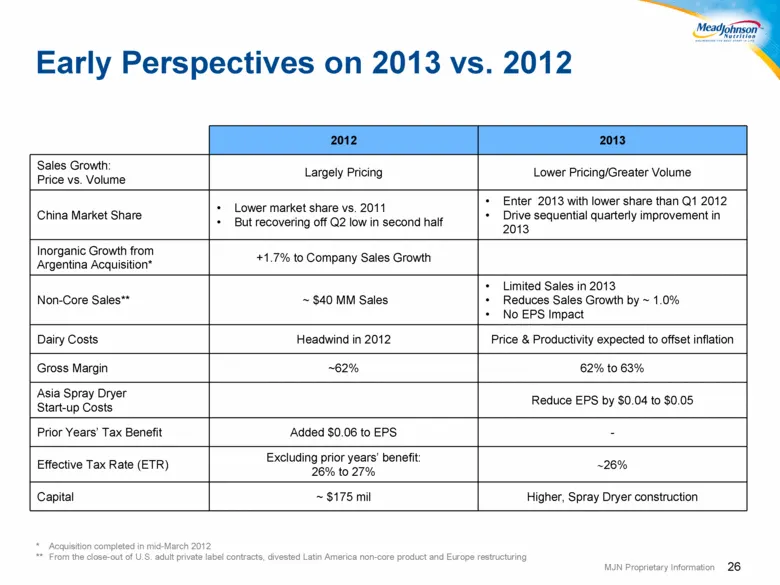
26 2012 2013 Sales Growth: Price vs. Volume Largely Pricing Lower Pricing/Greater Volume China Market Share Lower market share vs. 2011 But recovering off Q2 low in second half Enter 2013 with lower share than Q1 2012 Drive sequential quarterly improvement in 2013 Inorganic Growth from Argentina Acq
Slide 27: Mead Johnson Investment Thesis
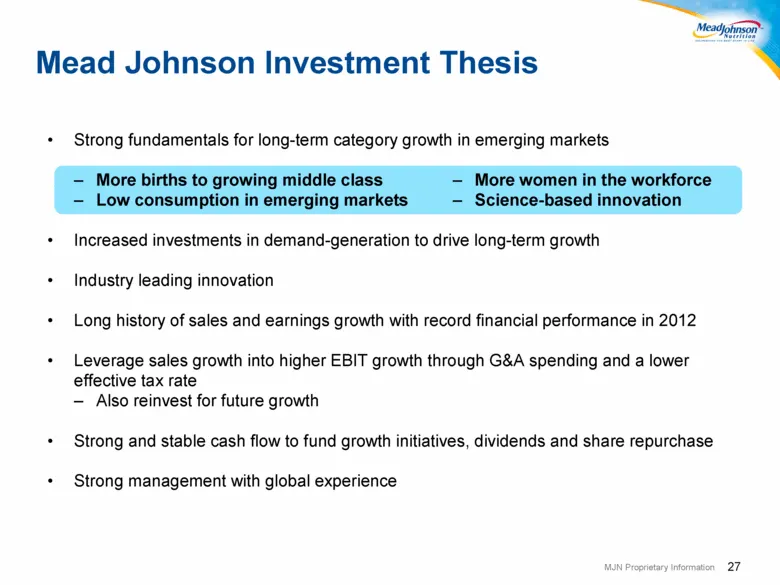
27 Mead Johnson Investment Thesis Strong fundamentals for long-term category growth in emerging markets More births to growing middle class Low consumption in emerging markets Increased investments in demand-generation to drive long-term growth Industry leading innovation Long history of sales and e

Slide 28: 28
28

Slide 29: Appendix
29 Appendix
Slide 30: Reconciliation of GAAP to Non-GAAP
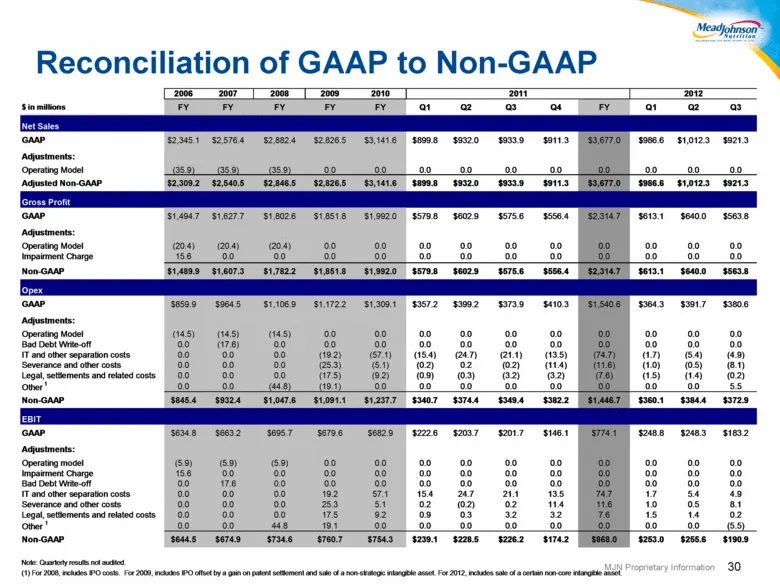
30 Reconciliation of GAAP to Non-GAAP $ in millions FY FY FY FY FY Q1 Q2 Q3 Q4 FY Q1 Q2 Q3 Net Sales GAAP $2,345.1 $2,576.4 $2,882.4 $2,826.5 $3,141.6 $899.8 $932.0 $933.9 $911.3 $3,677.0 $986.6 $1,012.3 $921.3 Adjustments: Operating Model (35.9) (35.9) (35.9) 0.0 0.0 0.0 0.0 0.0 0.0 0.0 0.0 0.0 0.0

Slide 31: 32
32
Source: SEC EDGAR · 8-K filed Nov 13, 2012
More decks from Mead Johnson Nutrition CO
 Morgan Stanley Global Consumer & Retail Conference 201616 slides · Nov 15, 2016
 Barclays Global Consumer Staples Conference 201618 slides · Sep 7, 2016
 Q1 2016 Earnings Presentation20 slides · Apr 28, 2016
 FY2015 Earnings Presentation23 slides · Jan 28, 2016
 Q3 2015 Earnings Presentation26 slides · Oct 22, 2015
 Investor Day (October 2015)15 slides · Oct 22, 2015