Clearwater Paper Corporation · NYSE:CLW
Clearwater Paper — Investor Presentation (June 2022)
18 slides from Clearwater Paper's investor presentation, June 2022
Slide 1: Investor Presentation June 2022
INVESTOR PRESENTATION June 2022
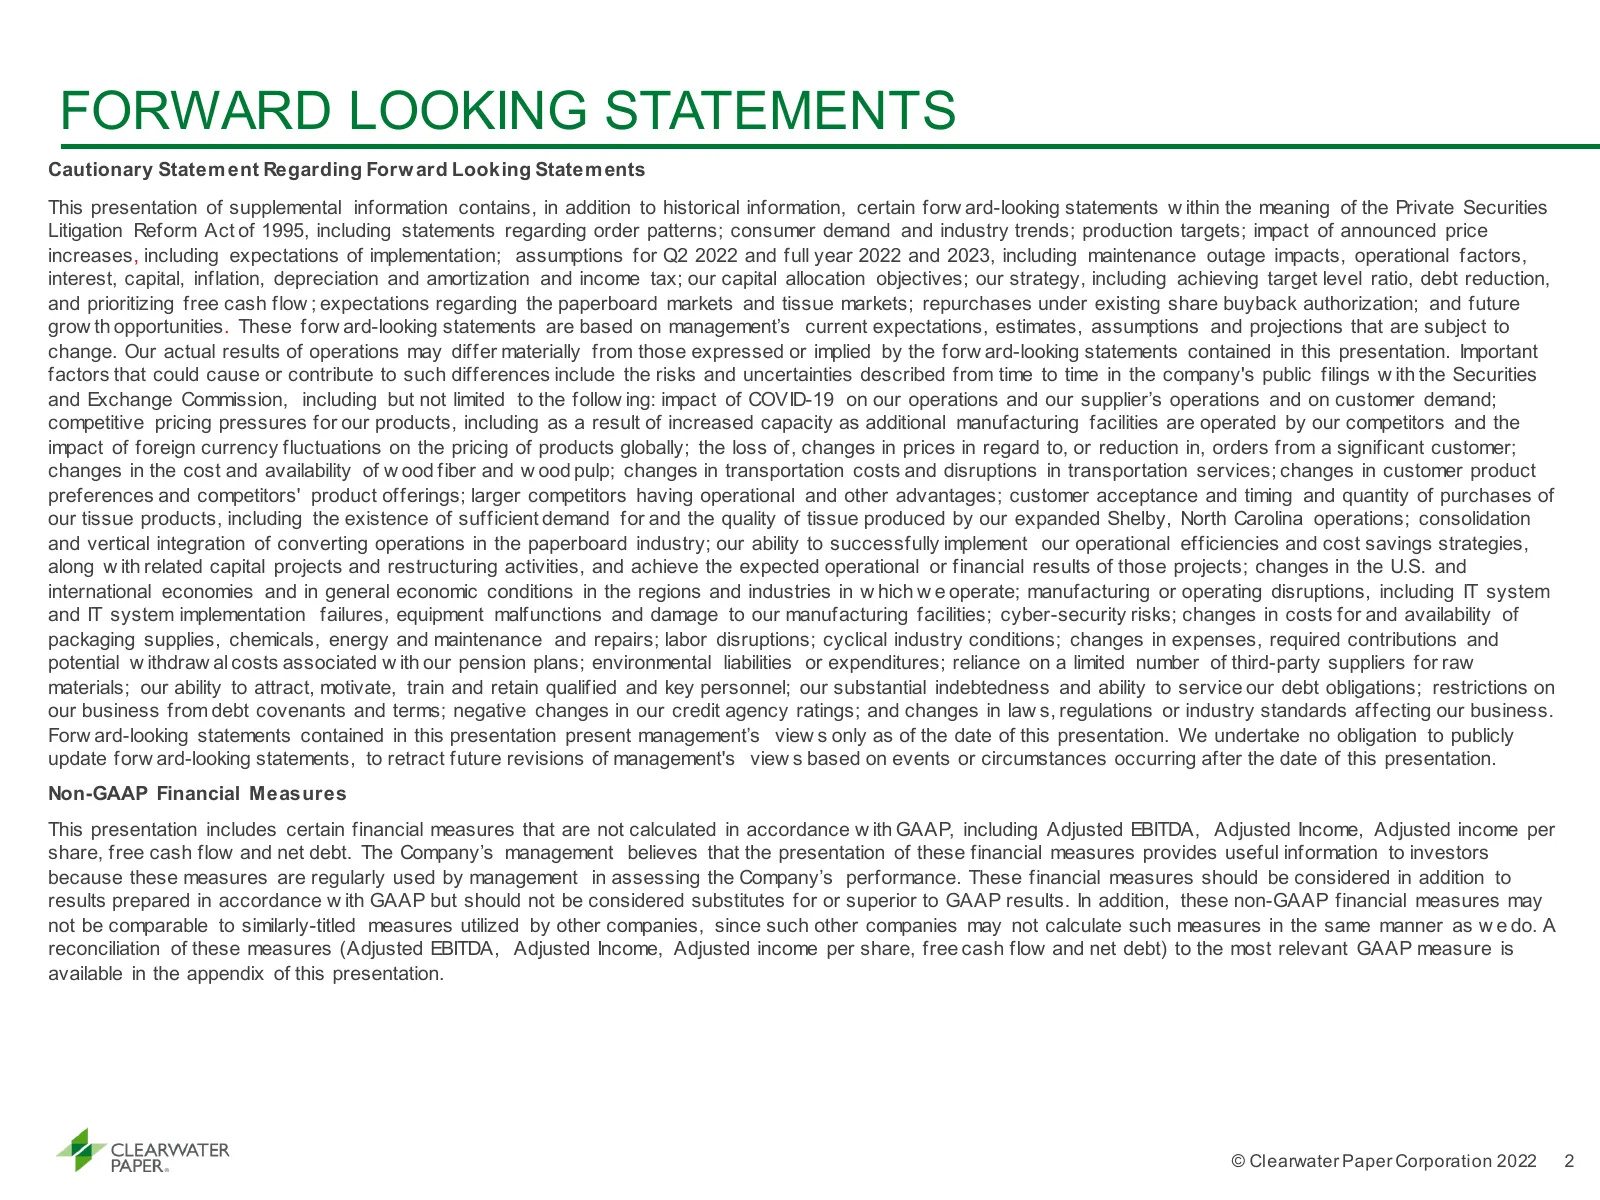
Slide 2: Forward Looking Statements
FORWARD LOOKING STATEMENTS Cautionary Statem ent Regarding Forw ard Looking Statem ents This presentation of supplemental information contains, in addition to historical information, certain forw ard-looking statements w ithin the meaning of the Private Securities Litigation Reform Act of 1995, incl
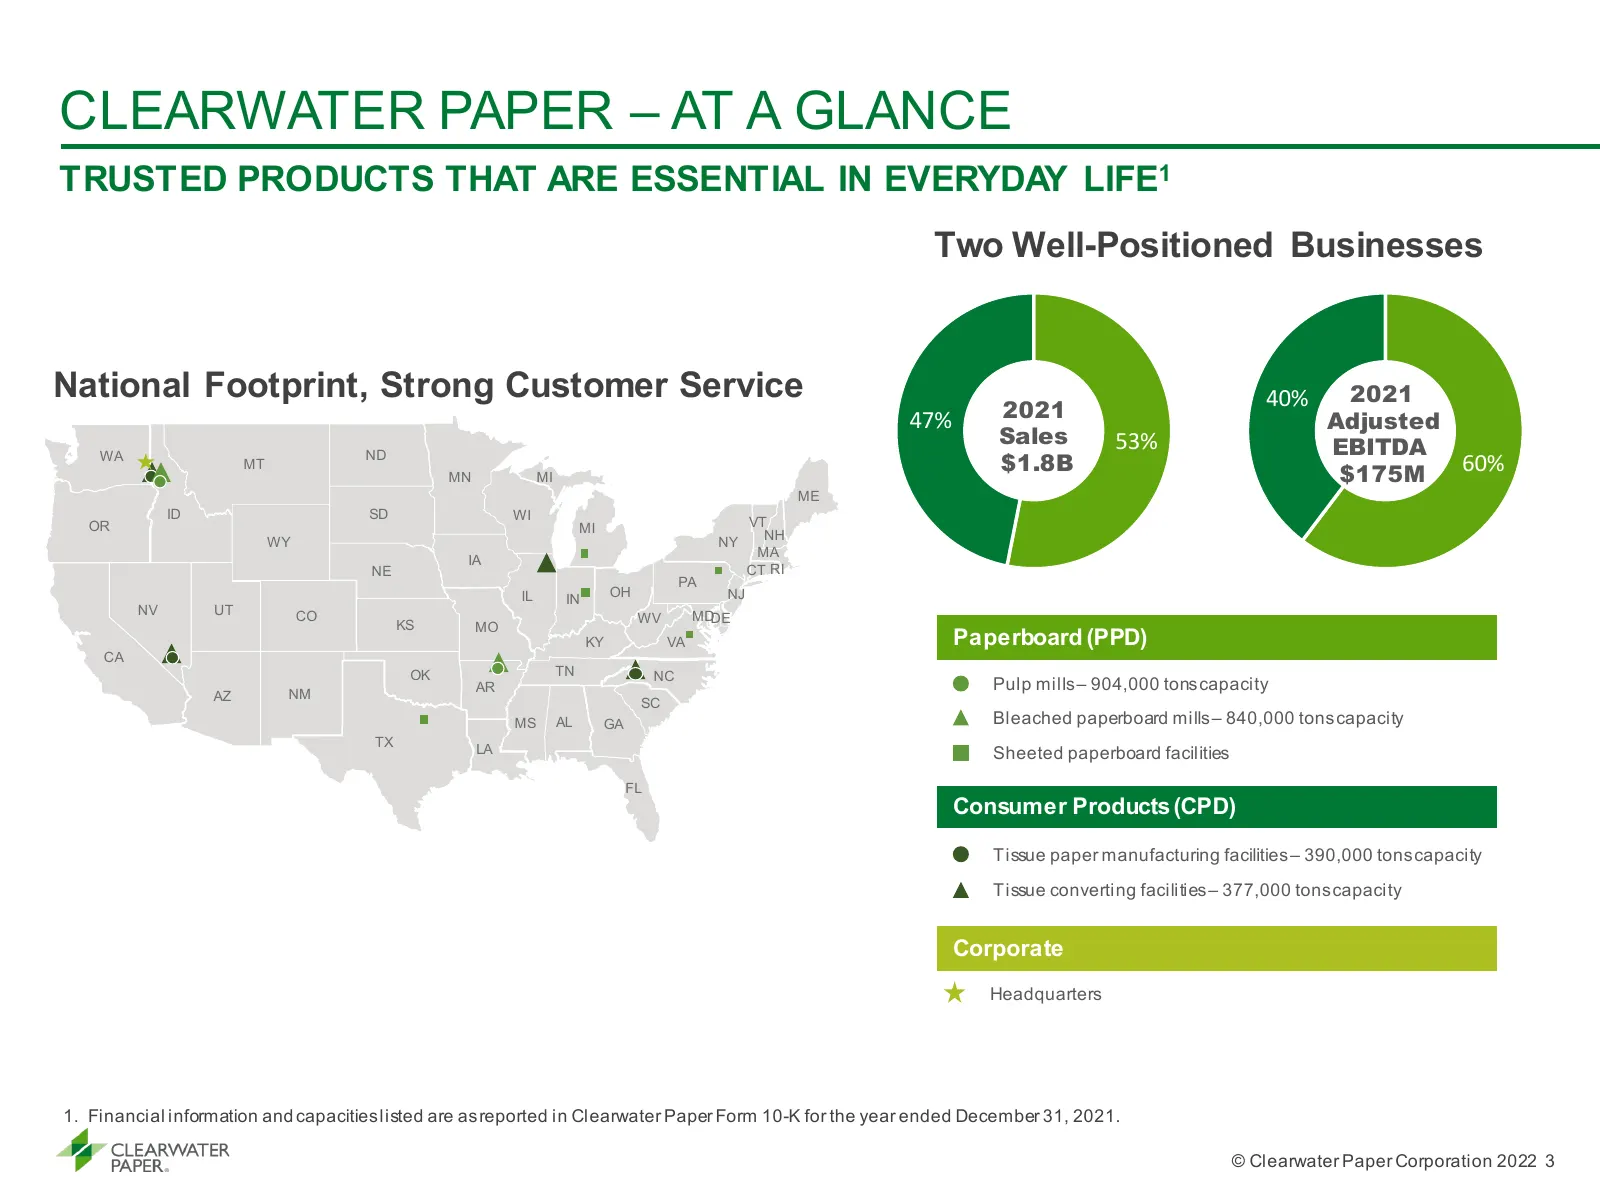
Slide 3: Clearwater Paper – At a Glance
CLEARWATER PAPER – AT A GLANCE TRUSTED PRODUCTS THAT ARE ESSENTIAL IN EVERYDAY LIFE1 Two Well-Positioned Businesses National Footprint, Strong Customer Service 40% 2021 47% 2021 Adjusted Sales 53% EBITDA ND WA MT MN MI $1.8B $175M 60% ME ID SD WI OR MI VT NH WY NY MA IA NE CT RI PA IL IN OH NJ NV UT
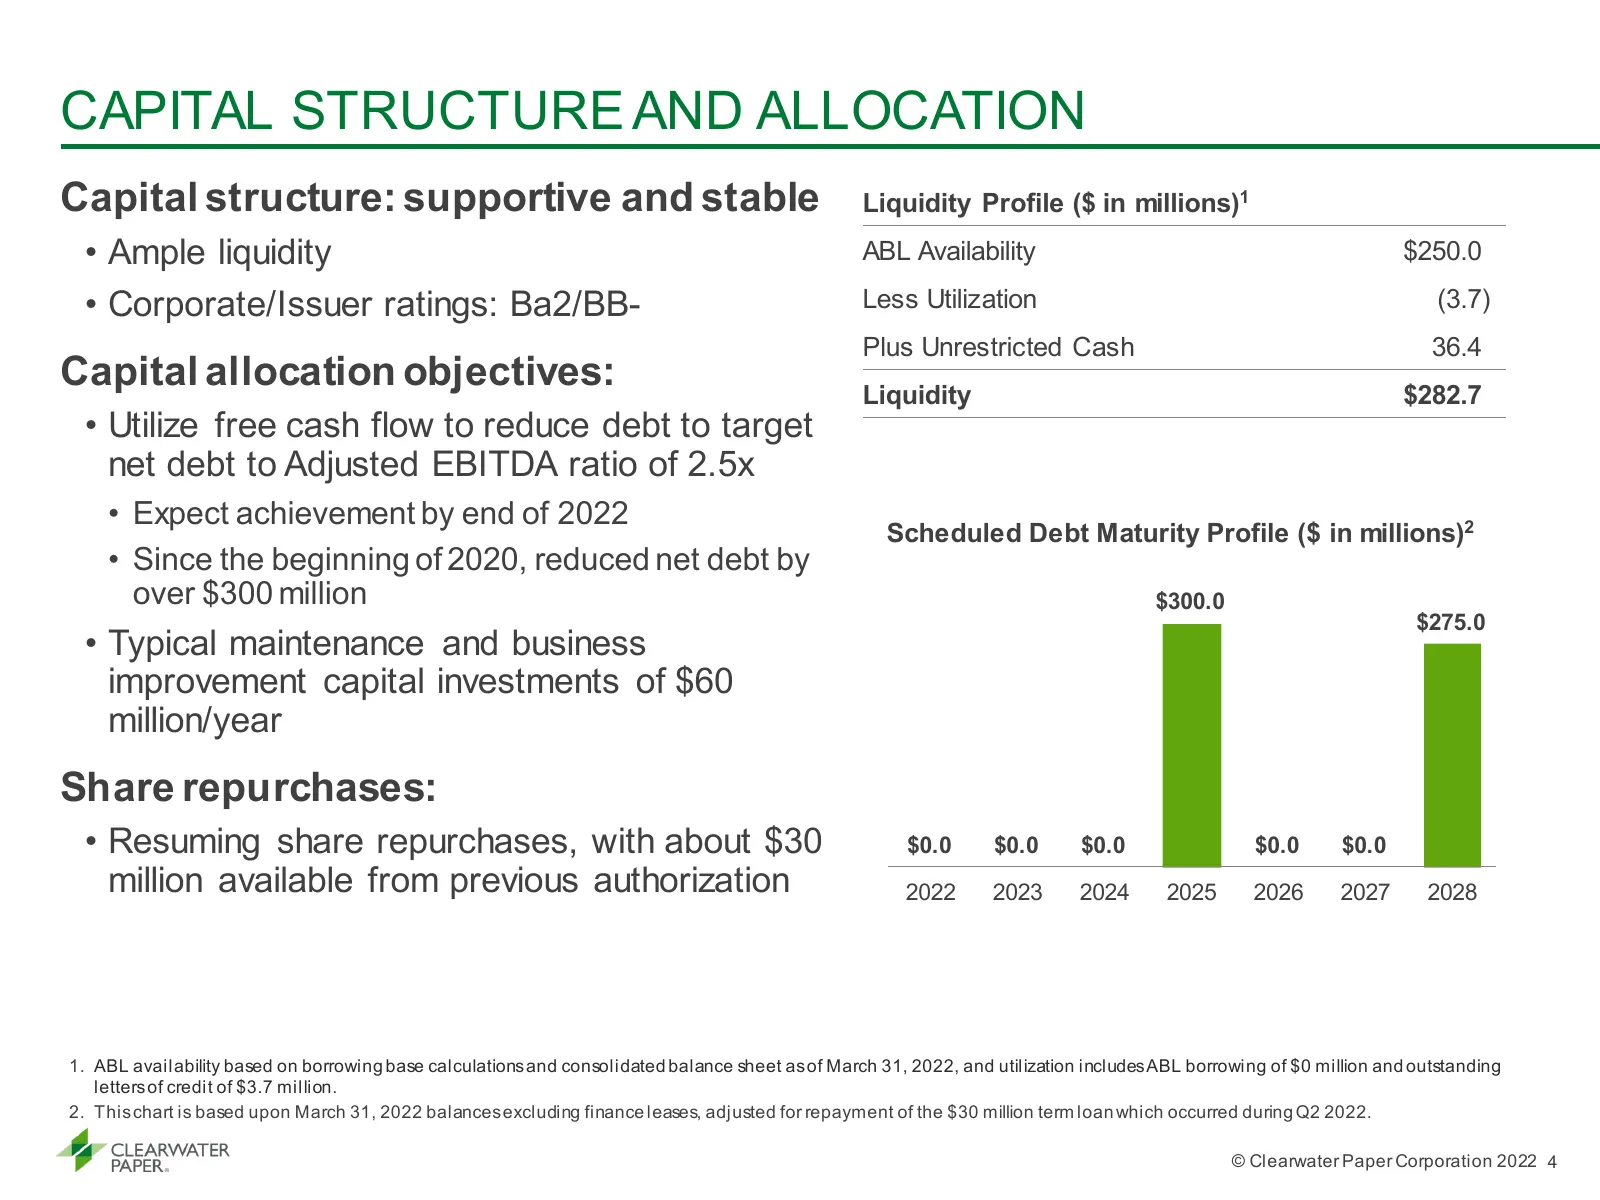
Slide 4: Capital Structure and Allocation
CAPITAL STRUCTURE AND ALLOCATION Capital structure: supportive and stable Liquidity Profile ($ in millions)1 • Ample liquidity ABL Availability $250.0 • Corporate/Issuer ratings: Ba2/BB- Less Utilization (3.7) Plus Unrestricted Cash 36.4 Capital allocation objectives: Liquidity $282.7 • Utilize free
Slide 5: Sustainability – Our Approach
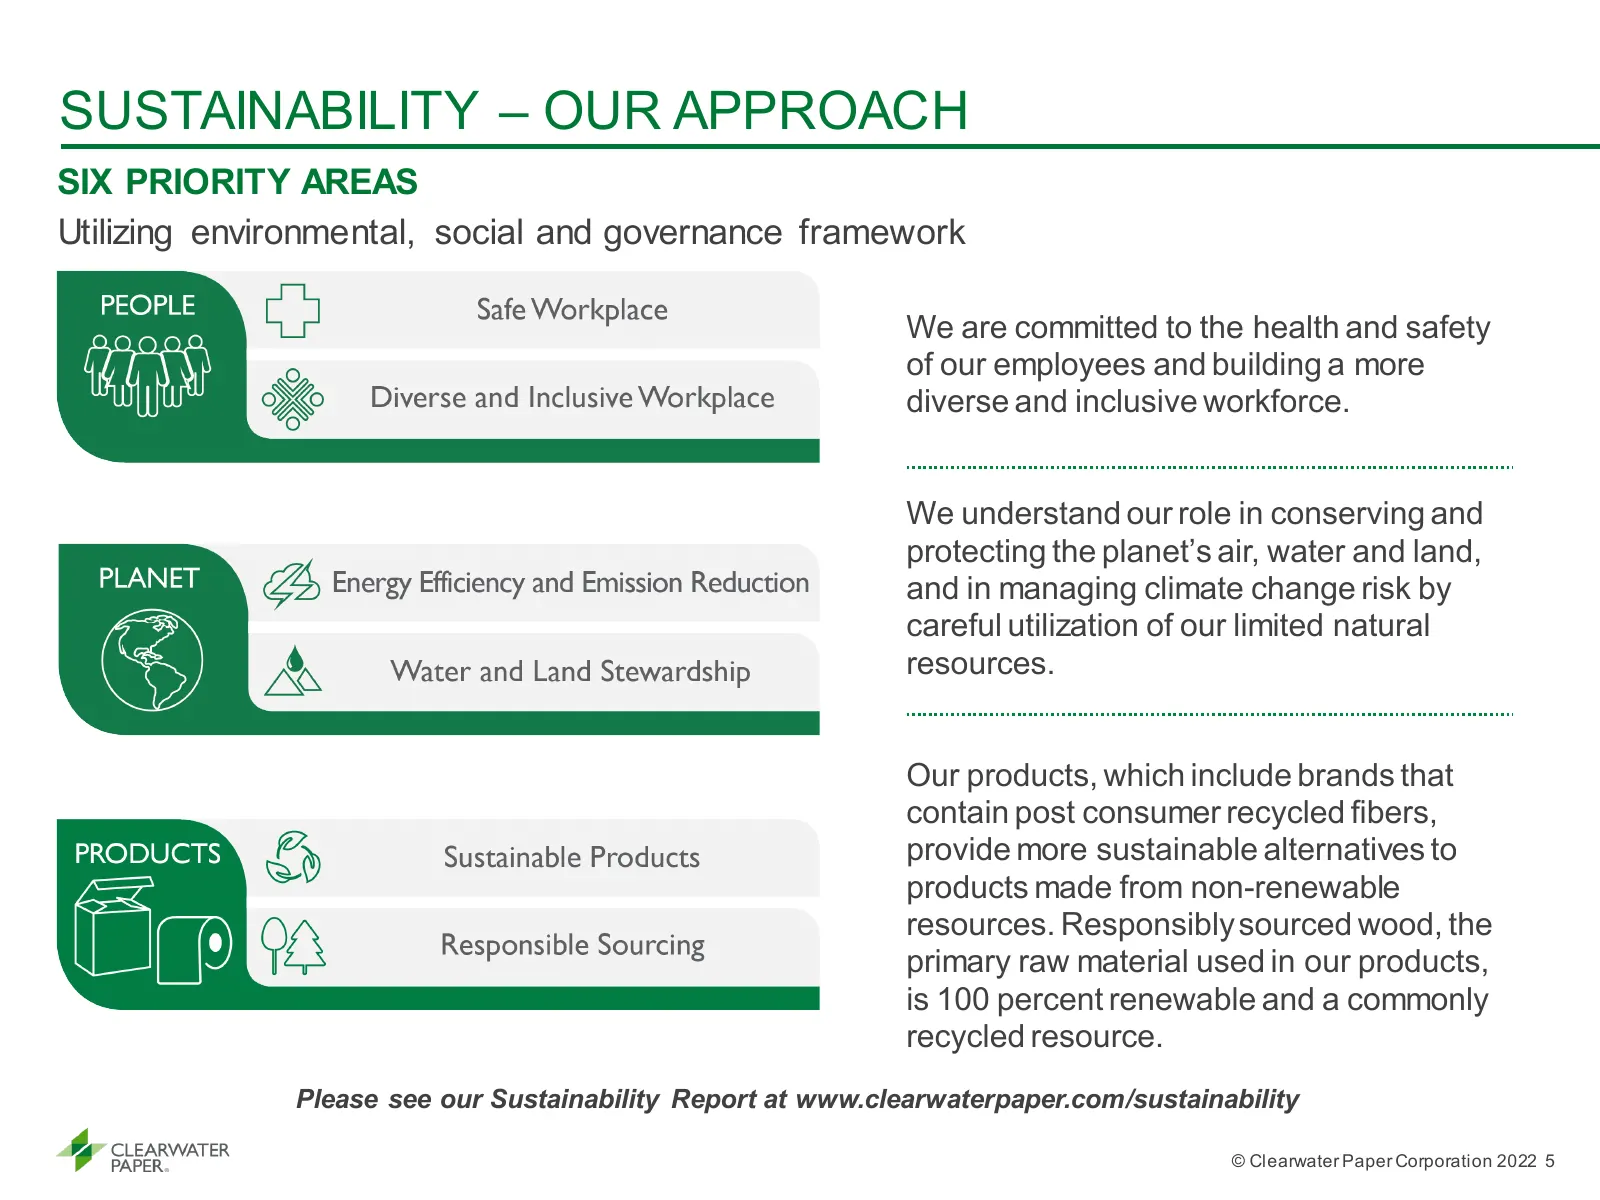
SUSTAINABILITY – OUR APPROACH SIX PRIORITY AREAS Utilizing environmental, social and governance framework We are committed to the health and safety of our employees and building a more diverse and inclusive workforce. We understand our role in conserving and protecting the planet’s air, water and la
Slide 6: Paperboard Products Division
PAPERBOARD PRODUCTS DIVISION © Clearwater Paper Corporation 2022 6
Slide 7: Paperboard Segment Overview
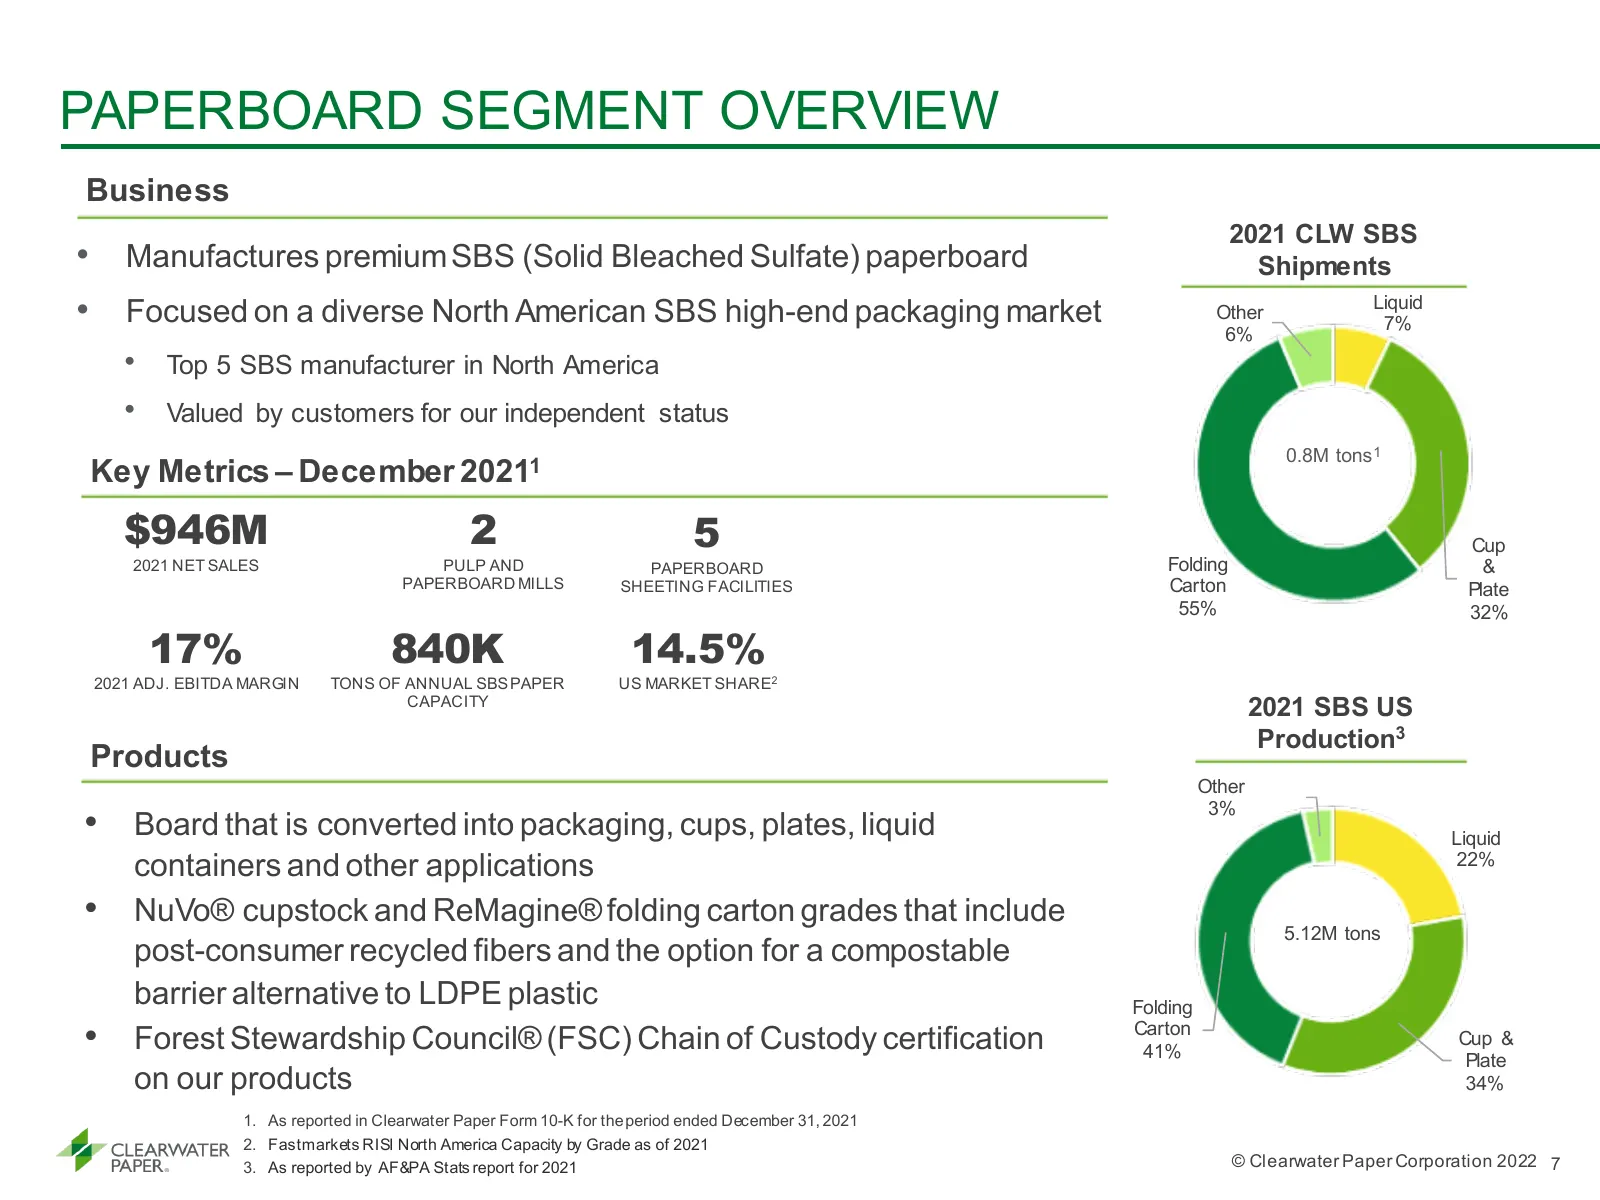
PAPERBOARD SEGMENT OVERVIEW Business 2021 CLW SBS • Manufactures premium SBS (Solid Bleached Sulfate) paperboard Shipments • Focused on a diverse North American SBS high-end packaging market Other 6% Liquid 7% • Top 5 SBS manufacturer in North America • Valued by customers for our independent status
Slide 8: Paperboard Industry Overview
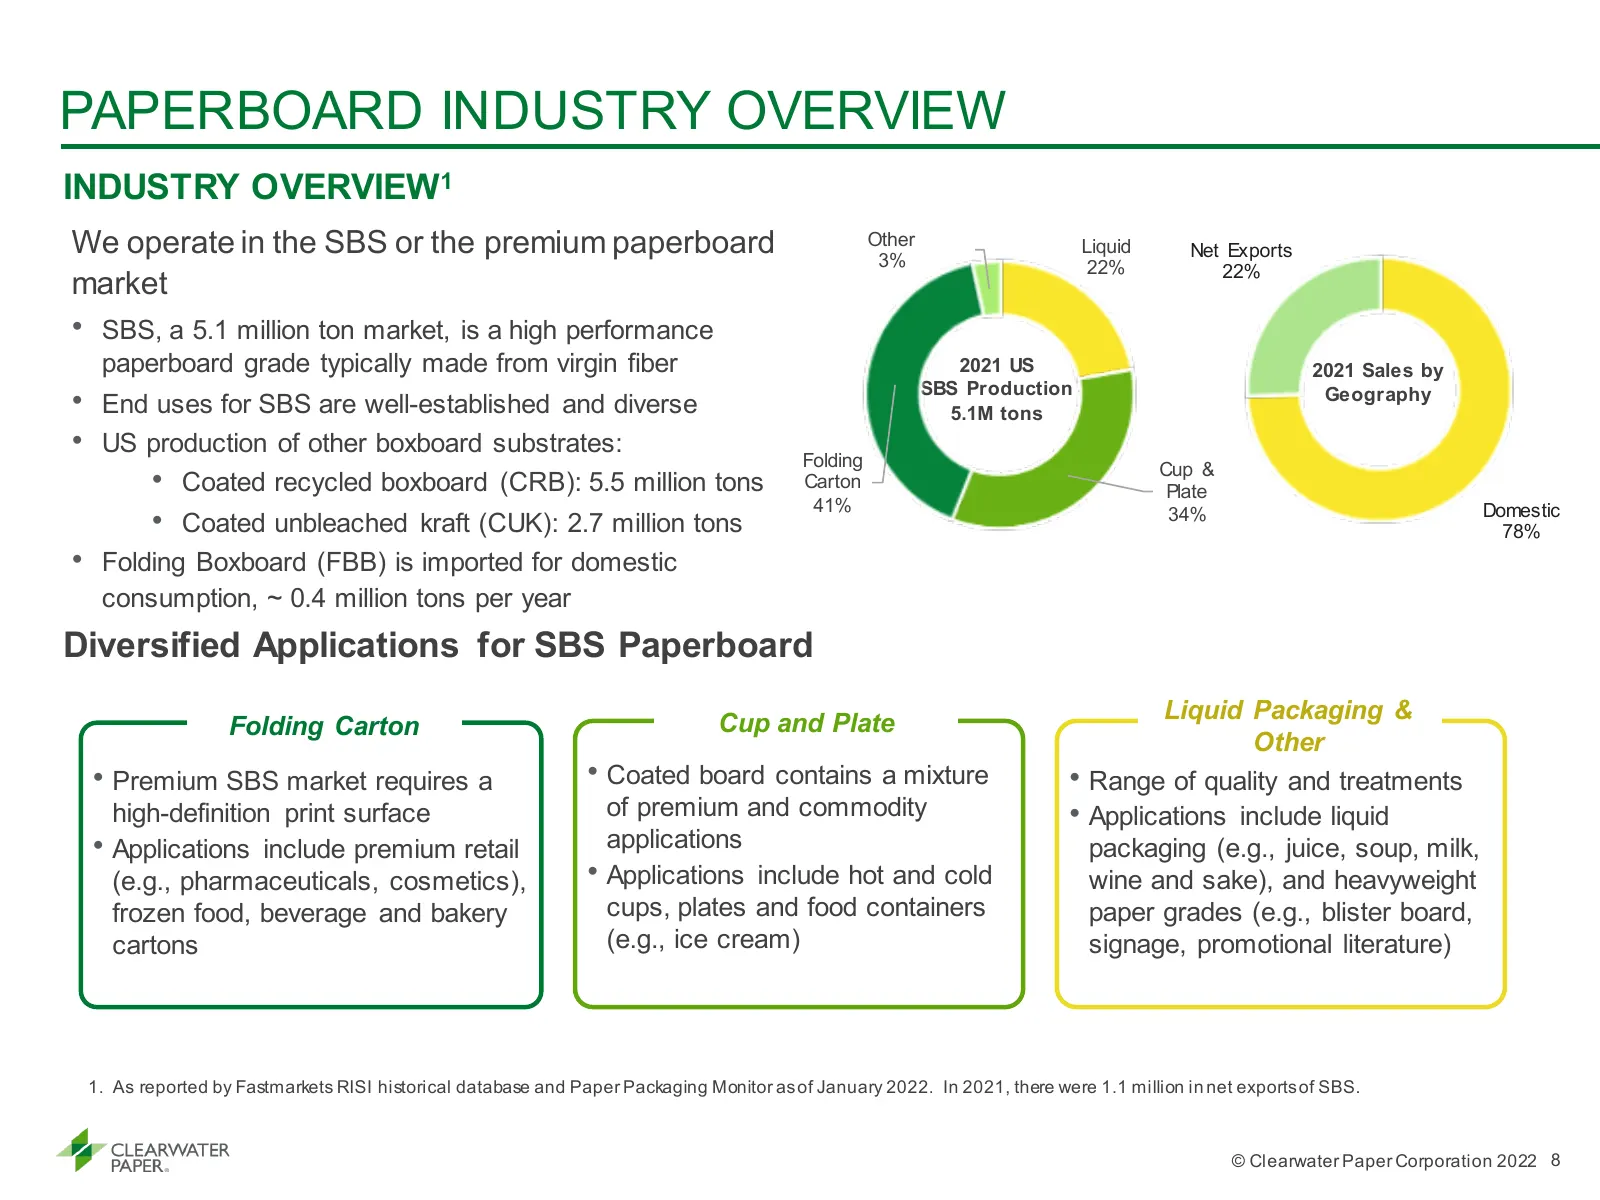
PAPERBOARD INDUSTRY OVERVIEW INDUSTRY OVERVIEW1 We operate in the SBS or the premium paperboard Other 3% Liquid Net Exports 22% 22% market • SBS, a 5.1 million ton market, is a high performance paperboard grade typically made from virgin fiber 2021 US 2021 Sales by SBS Production • End uses for SBS
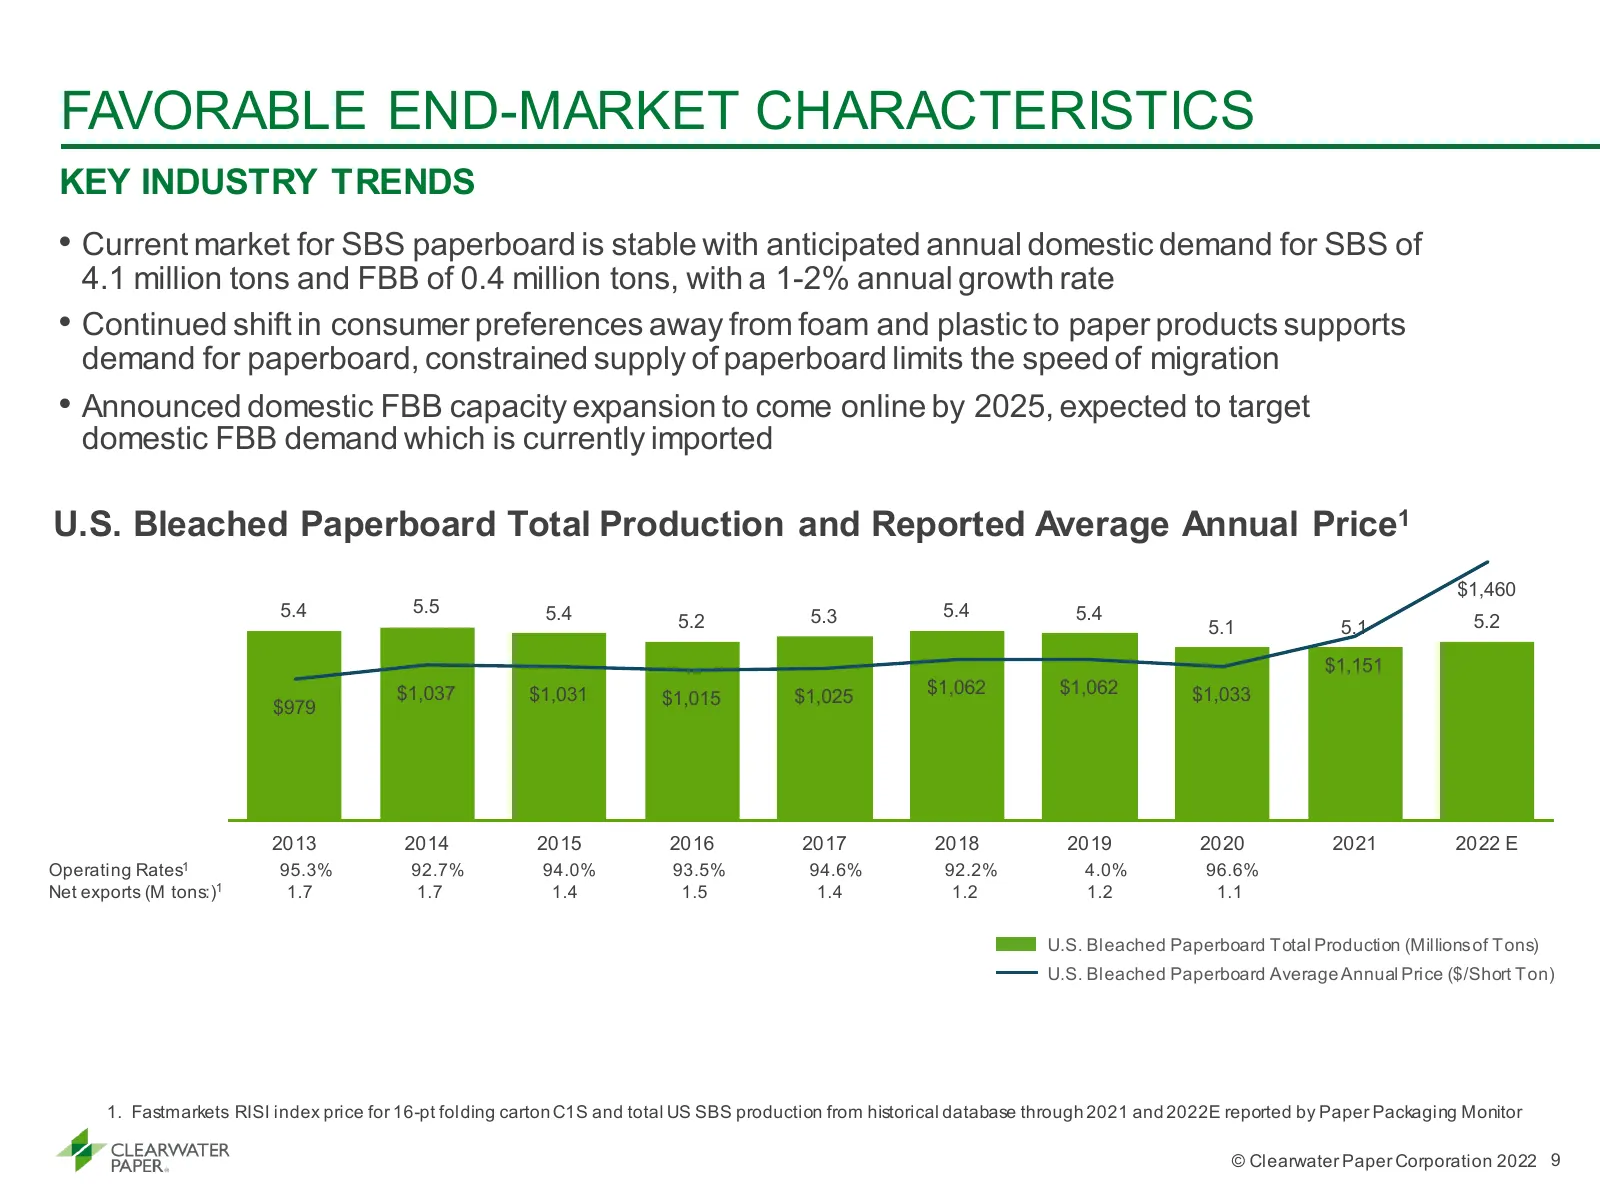
Slide 9: Favorable End-Market Characteristics
FAVORABLE END-MARKET CHARACTERISTICS KEY INDUSTRY TRENDS • Current market for SBS paperboard is stable with anticipated annual domestic demand for SBS of 4.1 million tons and FBB of 0.4 million tons, with a 1-2% annual growth rate • Continued shift in consumer preferences away from foam and plastic
Slide 10: Consumer Products Division
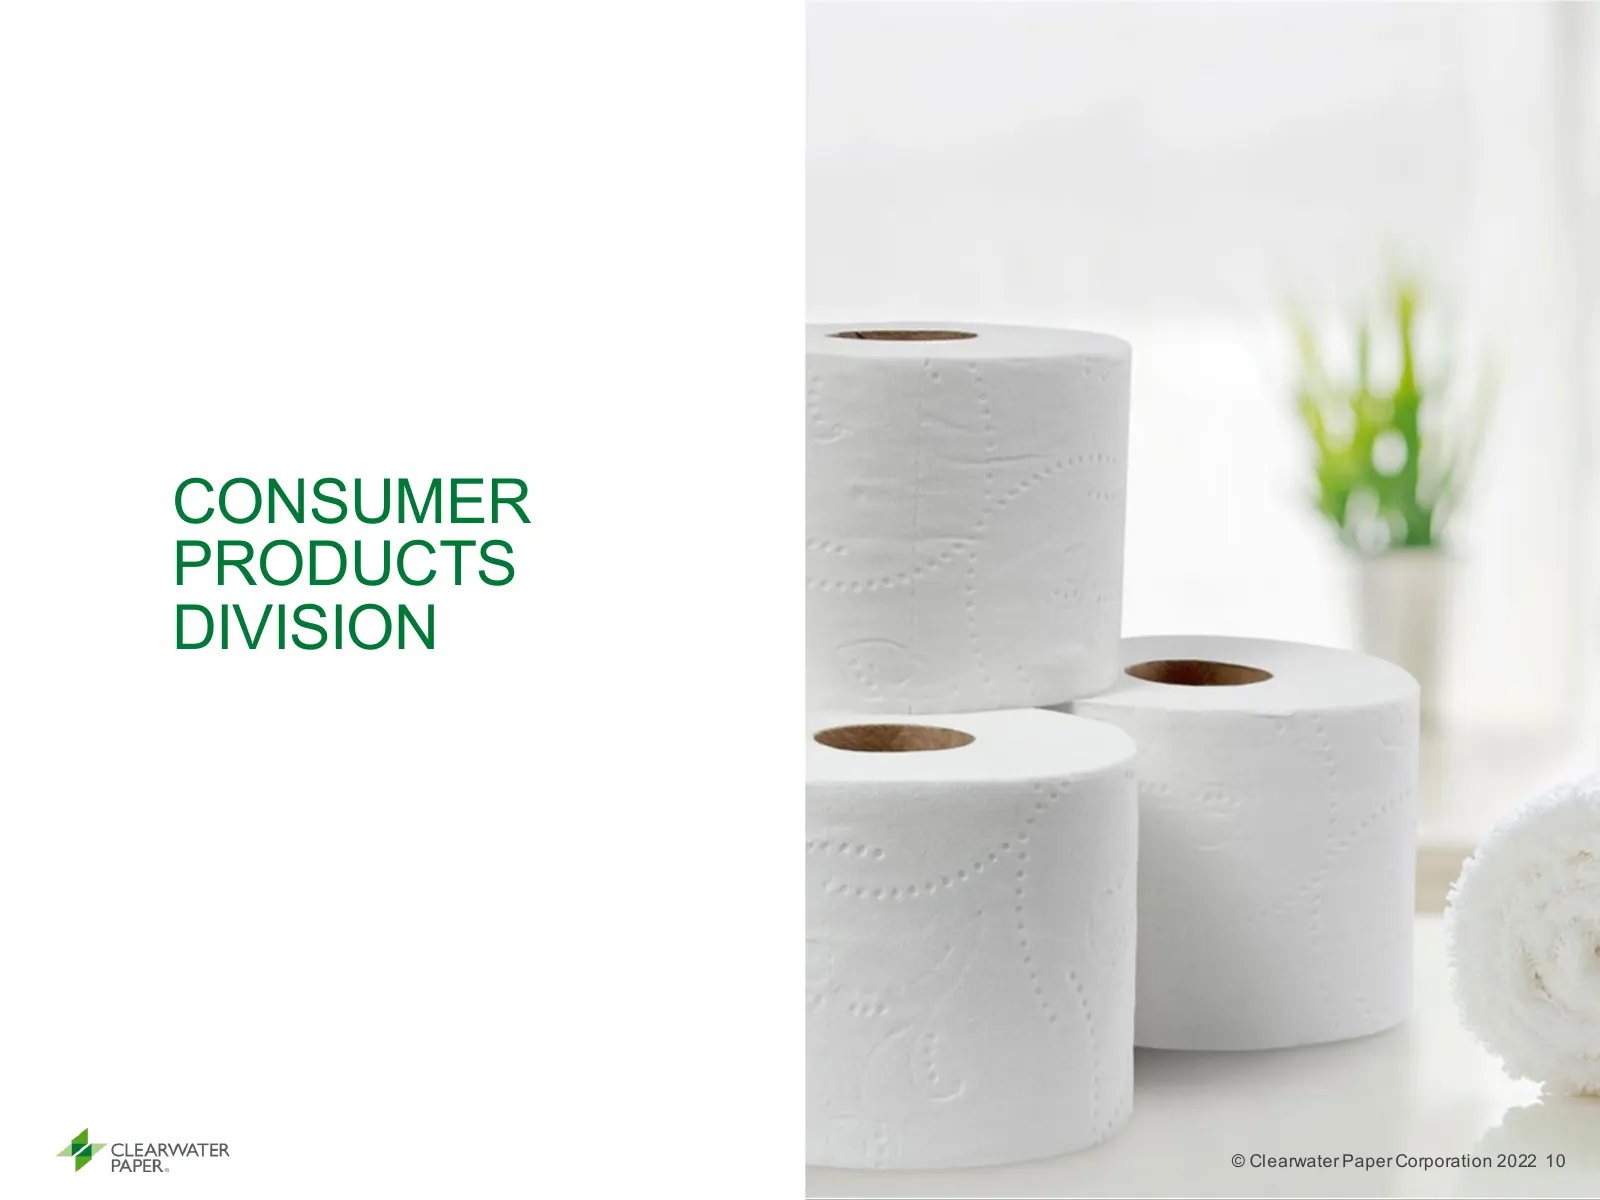
CONSUMER PRODUCTS DIVISION © Clearwater Paper Corporation 2022 10
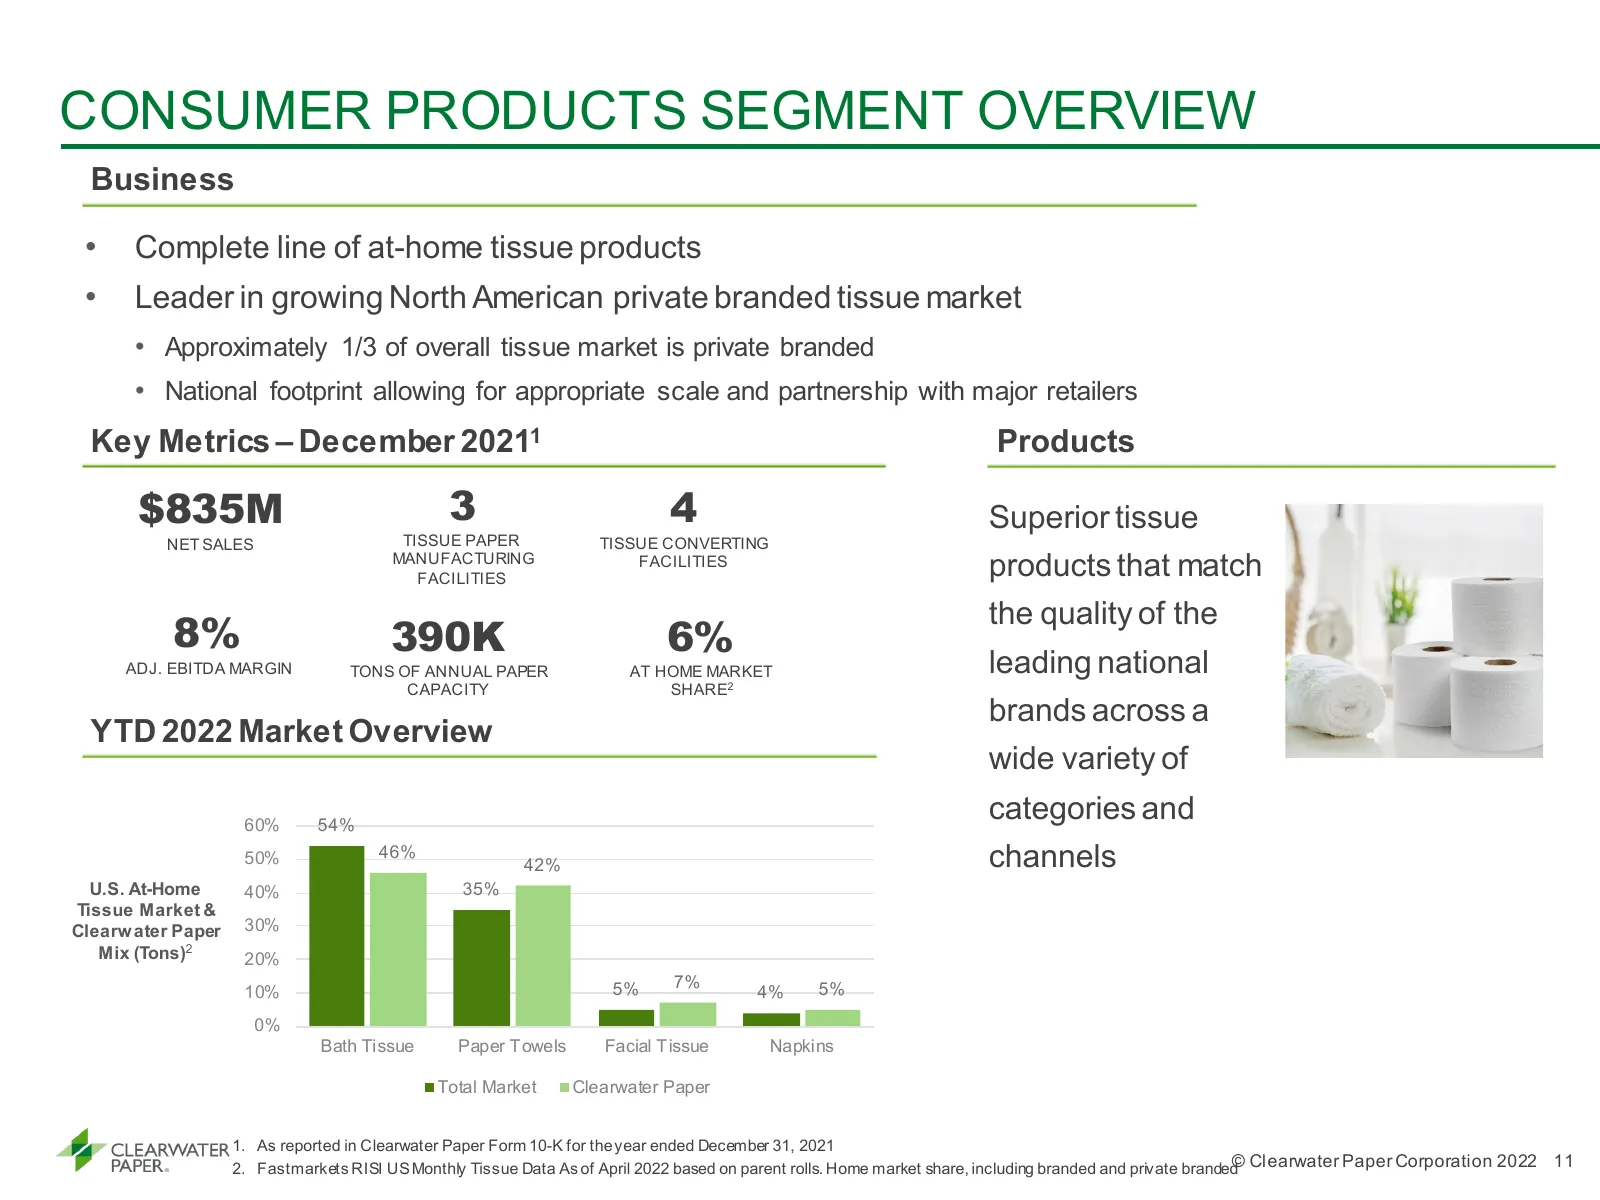
Slide 11: Consumer Products Segment Overview
CONSUMER PRODUCTS SEGMENT OVERVIEW Business • Complete line of at-home tissue products • Leader in growing North American private branded tissue market • Approximately 1/3 of overall tissue market is private branded • National footprint allowing for appropriate scale and partnership with major retai
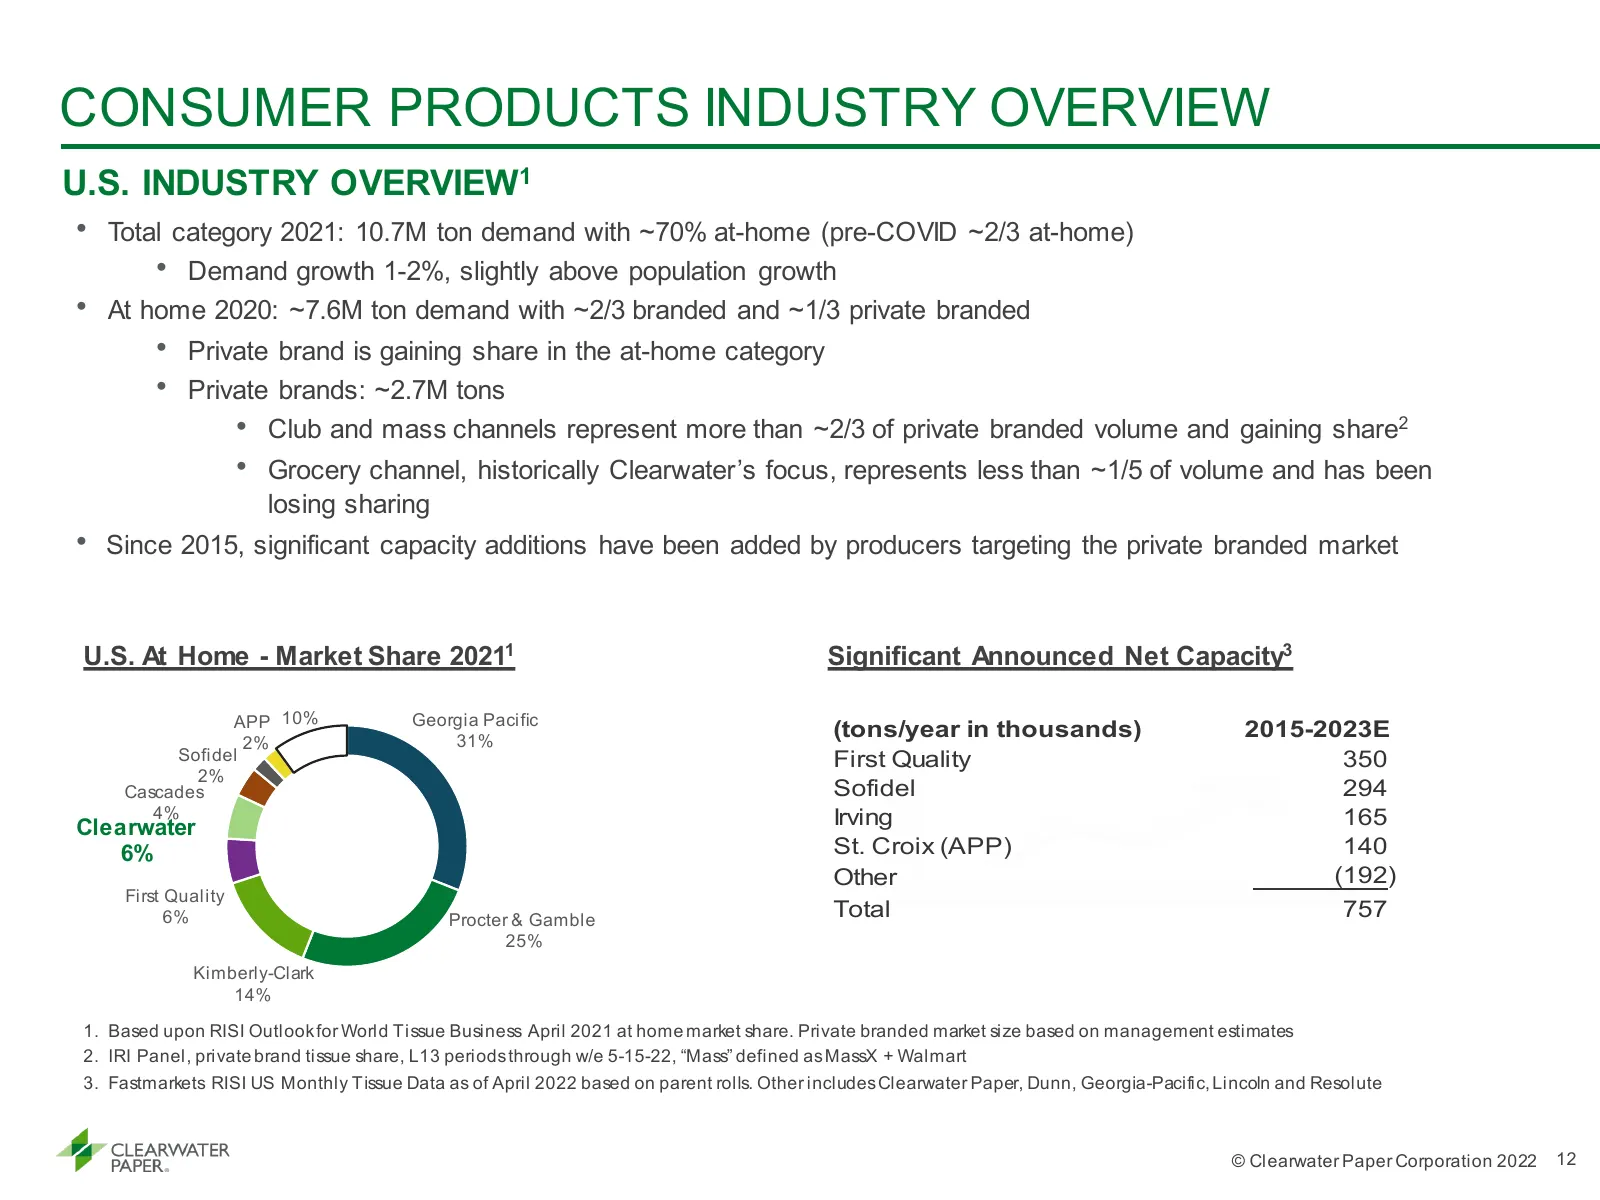
Slide 12: Consumer Products Industry Overview
CONSUMER PRODUCTS INDUSTRY OVERVIEW U.S. INDUSTRY OVERVIEW1 • Total category 2021: 10.7M ton demand with ~70% at-home (pre-COVID ~2/3 at-home) • Demand growth 1-2%, slightly above population growth • At home 2020: ~7.6M ton demand with ~2/3 branded and ~1/3 private branded • Private brand is gaining
Slide 13: Value Proposition
VALUE PROPOSITION © Clearwater Paper Corporation 2022 13
Slide 14: Key Priorities for Value Creation
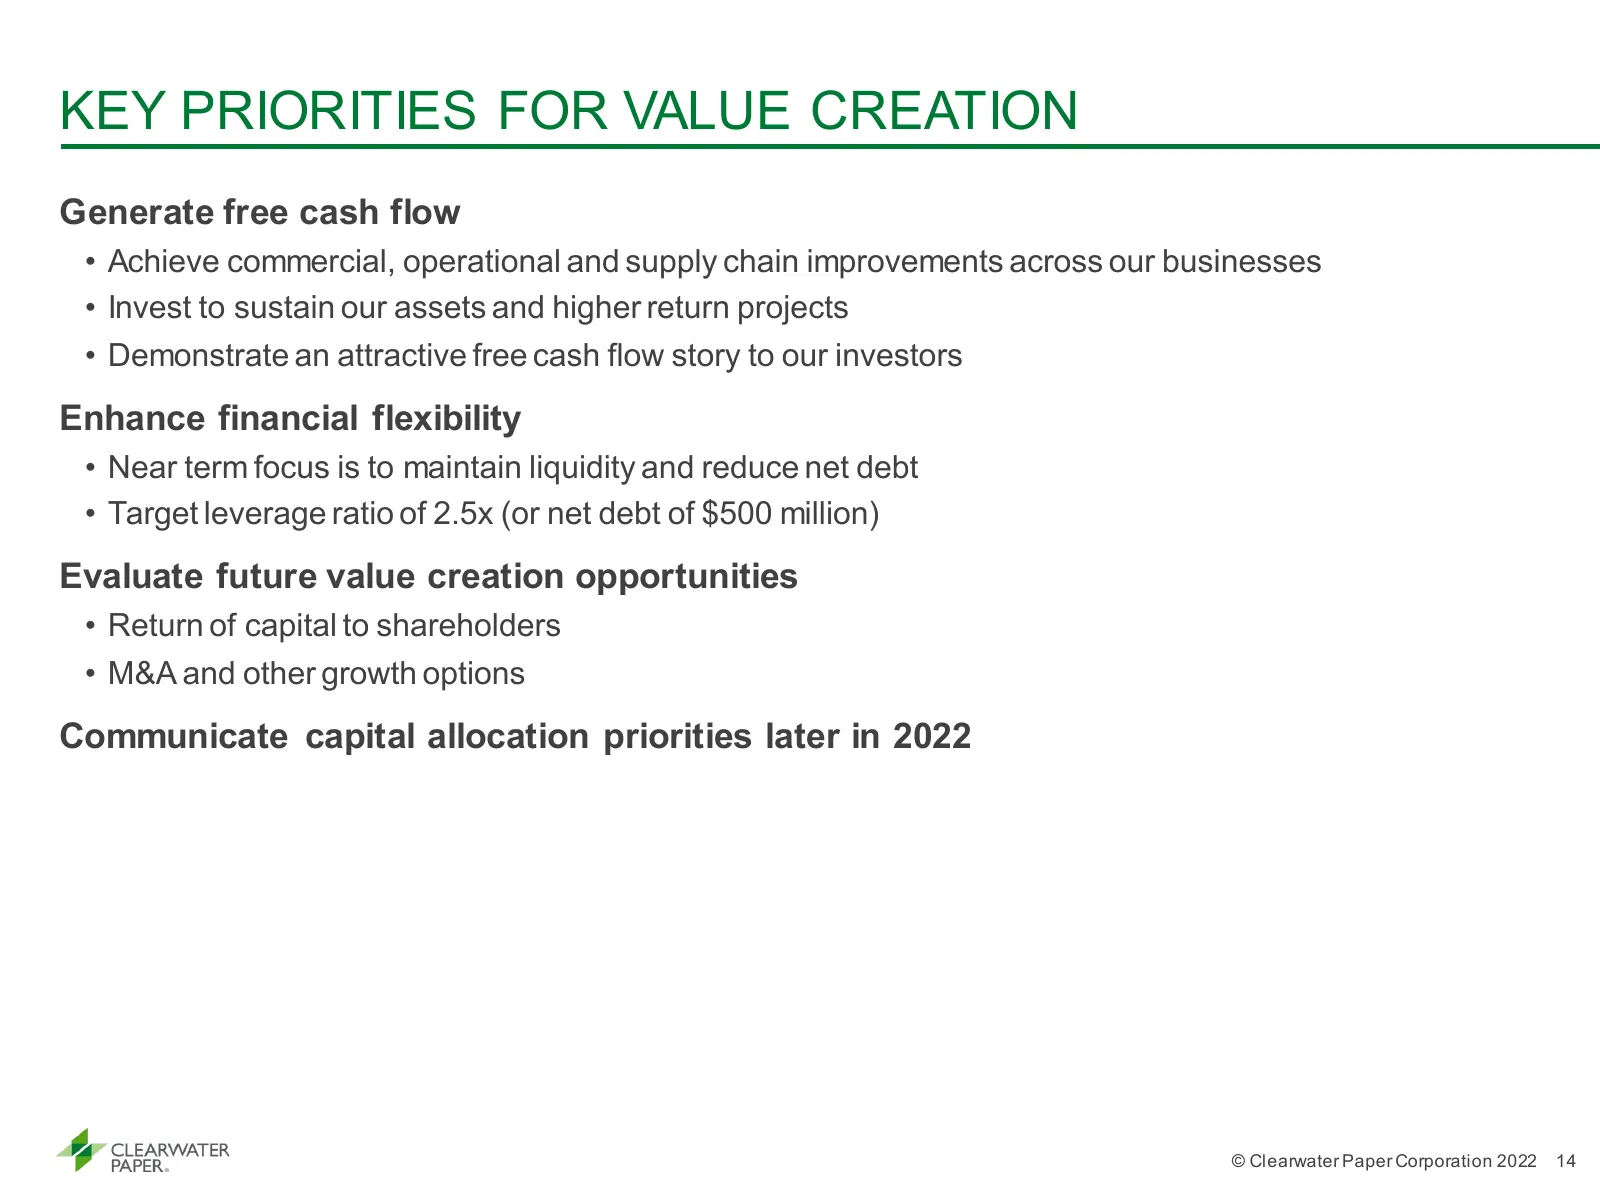
KEY PRIORITIES FOR VALUE CREATION Generate free cash flow • Achieve commercial, operational and supply chain improvements across our businesses • Invest to sustain our assets and higher return projects • Demonstrate an attractive free cash flow story to our investors Enhance financial flexibility •
Slide 15: Appendix
APPENDIX © Clearwater Paper Corporation 2022 15
Slide 16: Key Segment Information
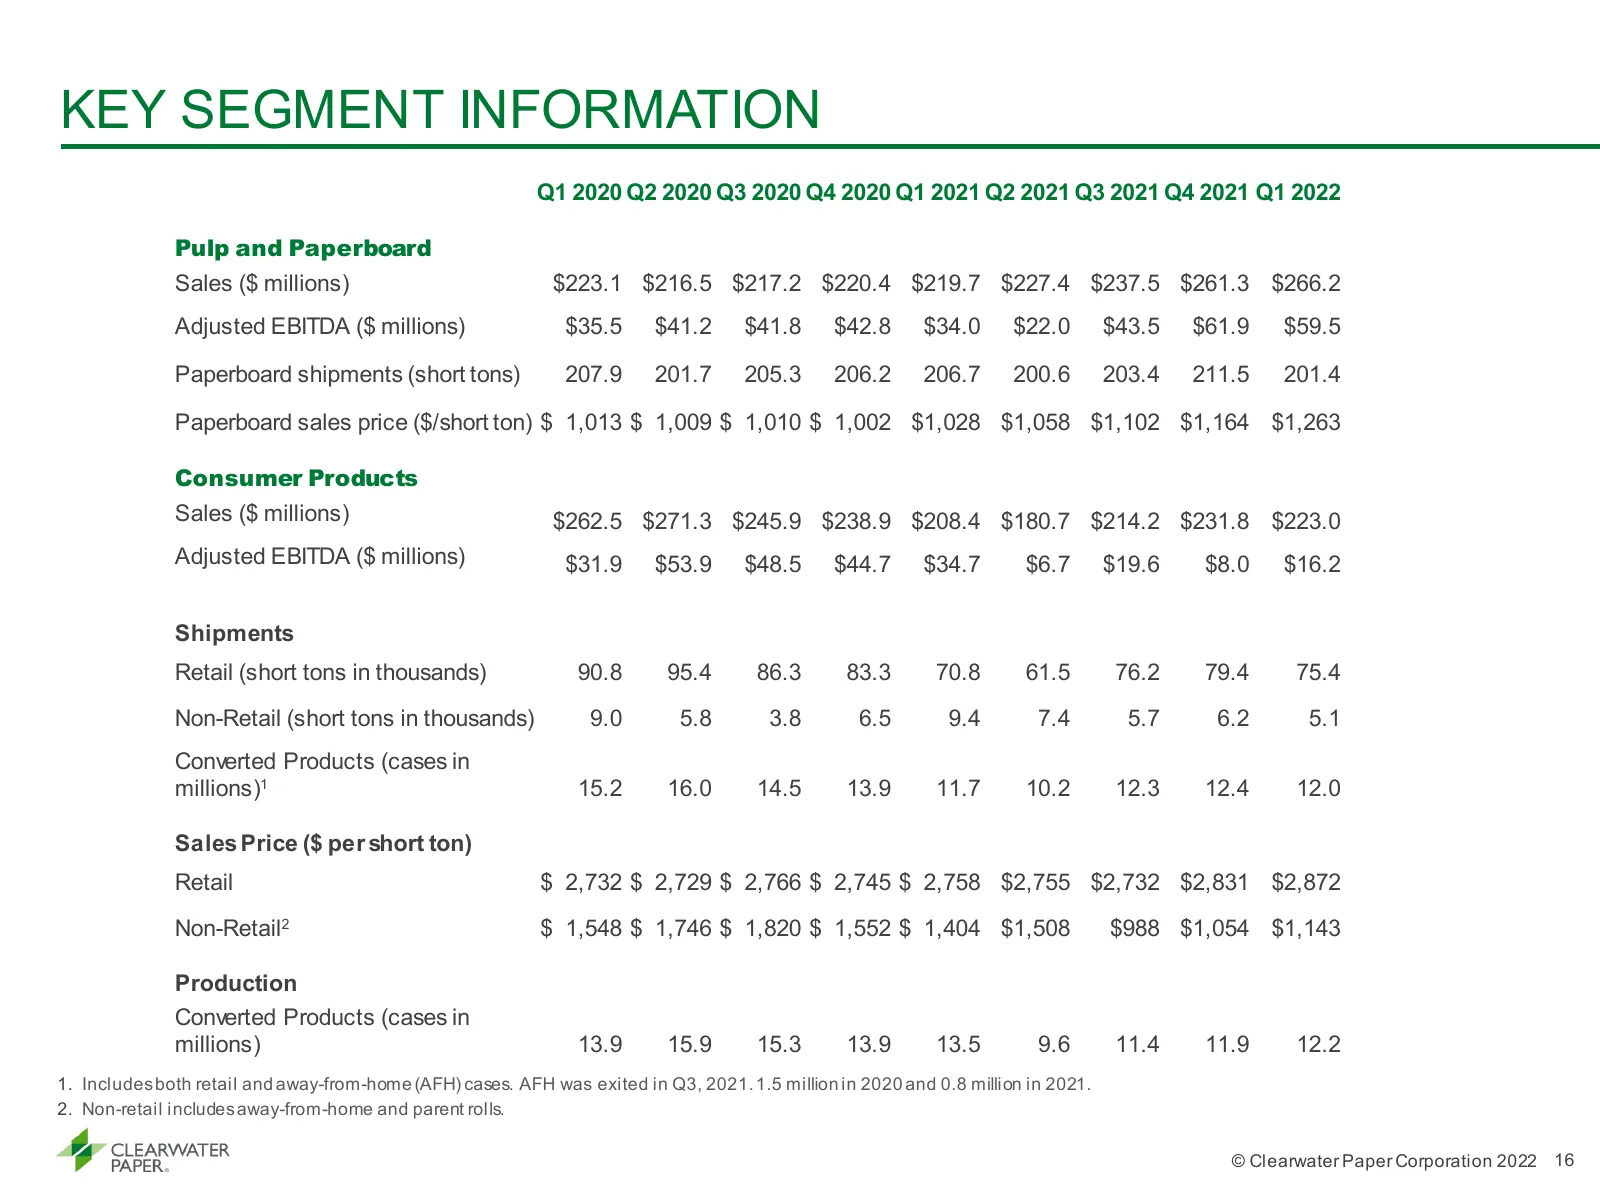
KEY SEGMENT INFORMATION Q1 2020 Q2 2020 Q3 2020 Q4 2020 Q1 2021 Q2 2021 Q3 2021 Q4 2021 Q1 2022 Pulp and Paperboard Sales ($ millions) $223.1 $216.5 $217.2 $220.4 $219.7 $227.4 $237.5 $261.3 $266.2 Adjusted EBITDA ($ millions) $35.5 $41.2 $41.8 $42.8 $34.0 $22.0 $43.5 $61.9 $59.5 Paperboard shipment
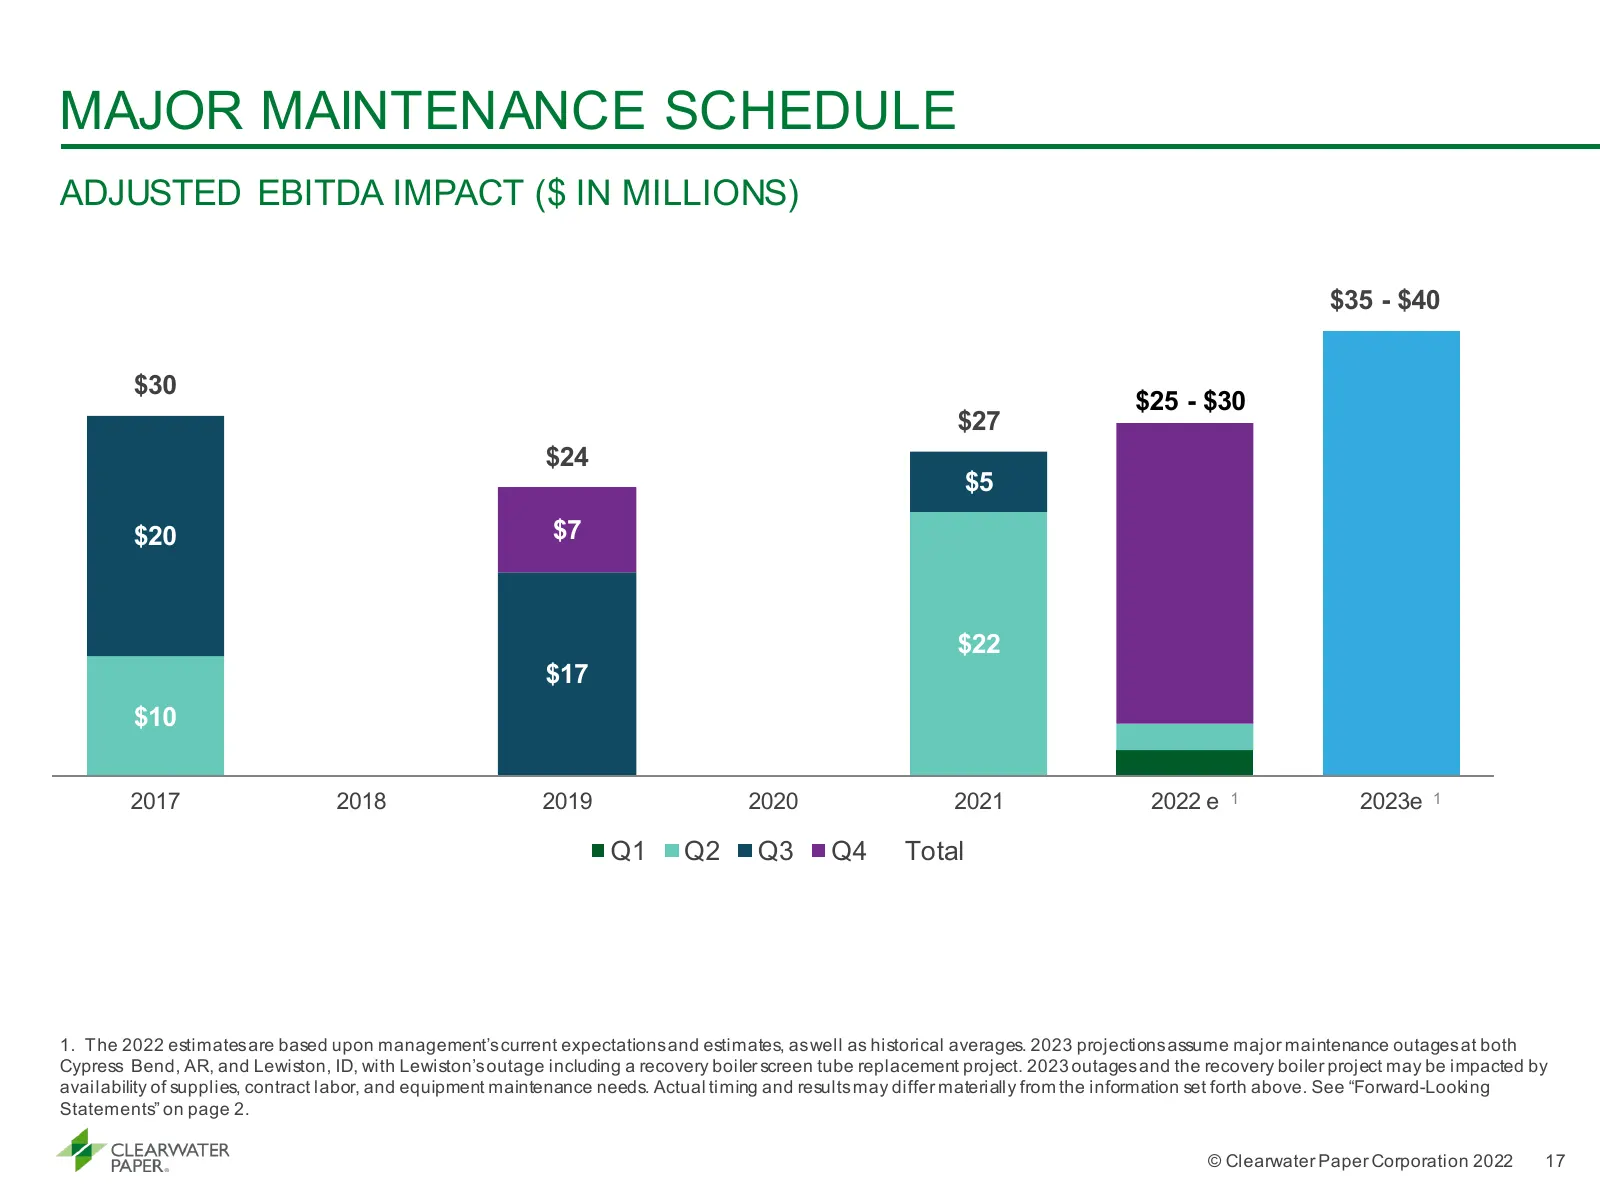
Slide 17: Major Maintenance Schedule
MAJOR MAINTENANCE SCHEDULE ADJUSTED EBITDA IMPACT ($ IN MILLIONS) $35 - $40 $30 $25 - $30 $27 $24 $5 $20 $7 $22 $17 Idaho $10 2017 2018 2019 2020 2021 2022 e 1 2023e 1 Q1 Q2 Q3 Q4 Total 1. The 2022 estimates are based upon management’s current expectations and estimates, as well as historical averag
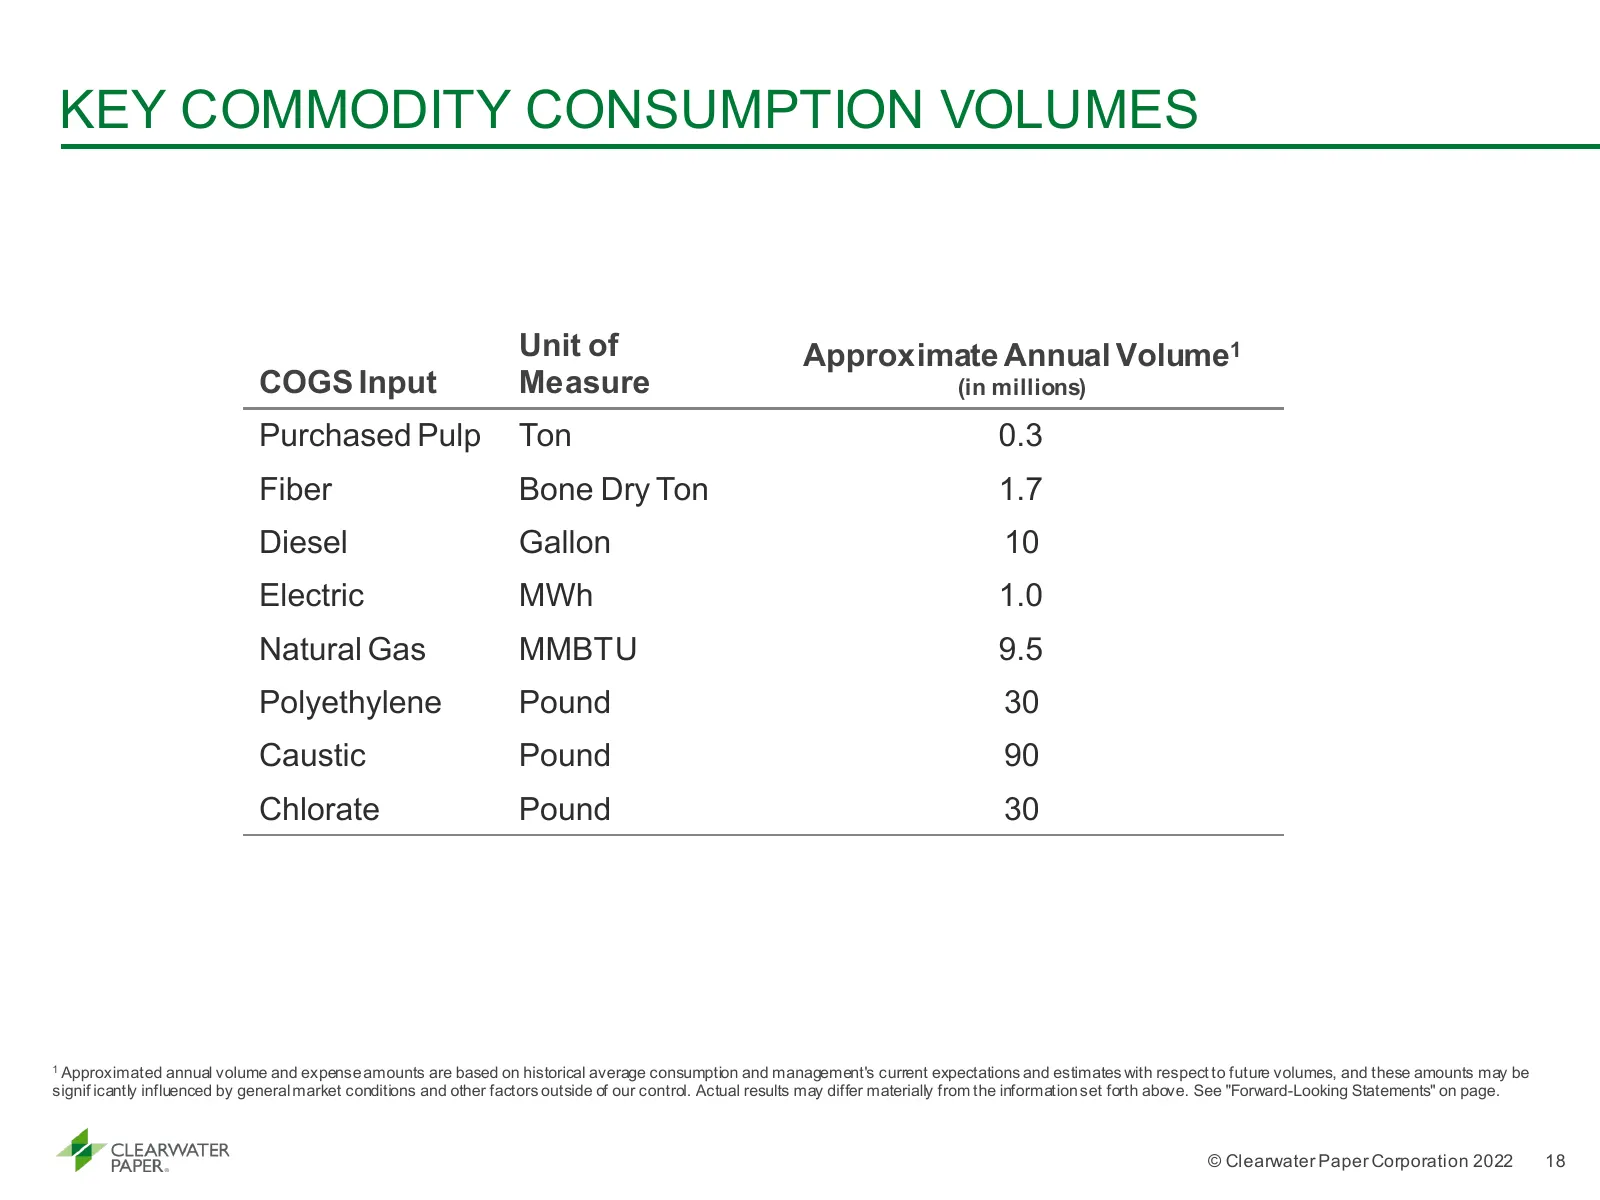
Slide 18: Key Commodity Consumption Volumes
KEY COMMODITY CONSUMPTION VOLUMES Unit of Approximate Annual Volume1 COGS Input Measure (in millions) Purchased Pulp Ton 0.3 Fiber Bone Dry Ton 1.7 Diesel Gallon 10 Electric MWh 1.0 Natural Gas MMBTU 9.5 Polyethylene Pound 30 Caustic Pound 90 Chlorate Pound 30 1 Approximated annual volume and expens
Source: Internet Archive copy of s24.q4cdn.com
More decks from Clearwater Paper Corporation
 Q3 2026 Earnings Presentation17 slides · Oct 26, 2026
 Q2 2026 Earnings Presentation17 slides · Jul 28, 2026
 Investor Presentation (June 2026)15 slides · June 2026
 Q1 2026 Earnings Presentation16 slides · Apr 28, 2026
 Q4 2025 Earnings Presentation18 slides · Feb 18, 2026
 Q3 2025 Earnings Presentation15 slides · Oct 28, 2025