Centrica plc · LSE:CNA
Centrica — FY2017 Earnings Presentation
67 slides from Centrica's earnings presentation, Feb 21, 2018

Slide 1: Centrica plc Preliminary Results
centrica Centrica ple Preliminary Results
Slide 2: Disclaimer
Disclaimer This presentation does not constitute an invitation to underwrite, subscribe for, or otherwise acquire or dispose of any Centrica shares or other securities. This presentation contains certain forward-looking statements with respect to the financial condition, results, operations and busi
Slide 3: centrica
centrica
Slide 4: Summary
centrica Summary * H2 financial results weak, particularly in Business energy supply * Extremely poor 2017 shareholder experience even though 2017 targets delivered * Addressing important questions * Phase 1 of Centrica’s strategic repositioning completed - Encouraging progress as we focus on the cu
Slide 5: 2017 financial performance
centrica 2017 financial performance * Adjusted operating profit down 17% to £1.25bn; adjusted earnings down 22% to £698m * Adjusted EPS down 25% to 12.69 * Adjusted operating cash flow of £2.07bn; EBITDA down 9% to £2.14bn * Centrica Consumer adjusted operating profit down 1%, demonstrating resilien
Slide 6: Important questions we will address today
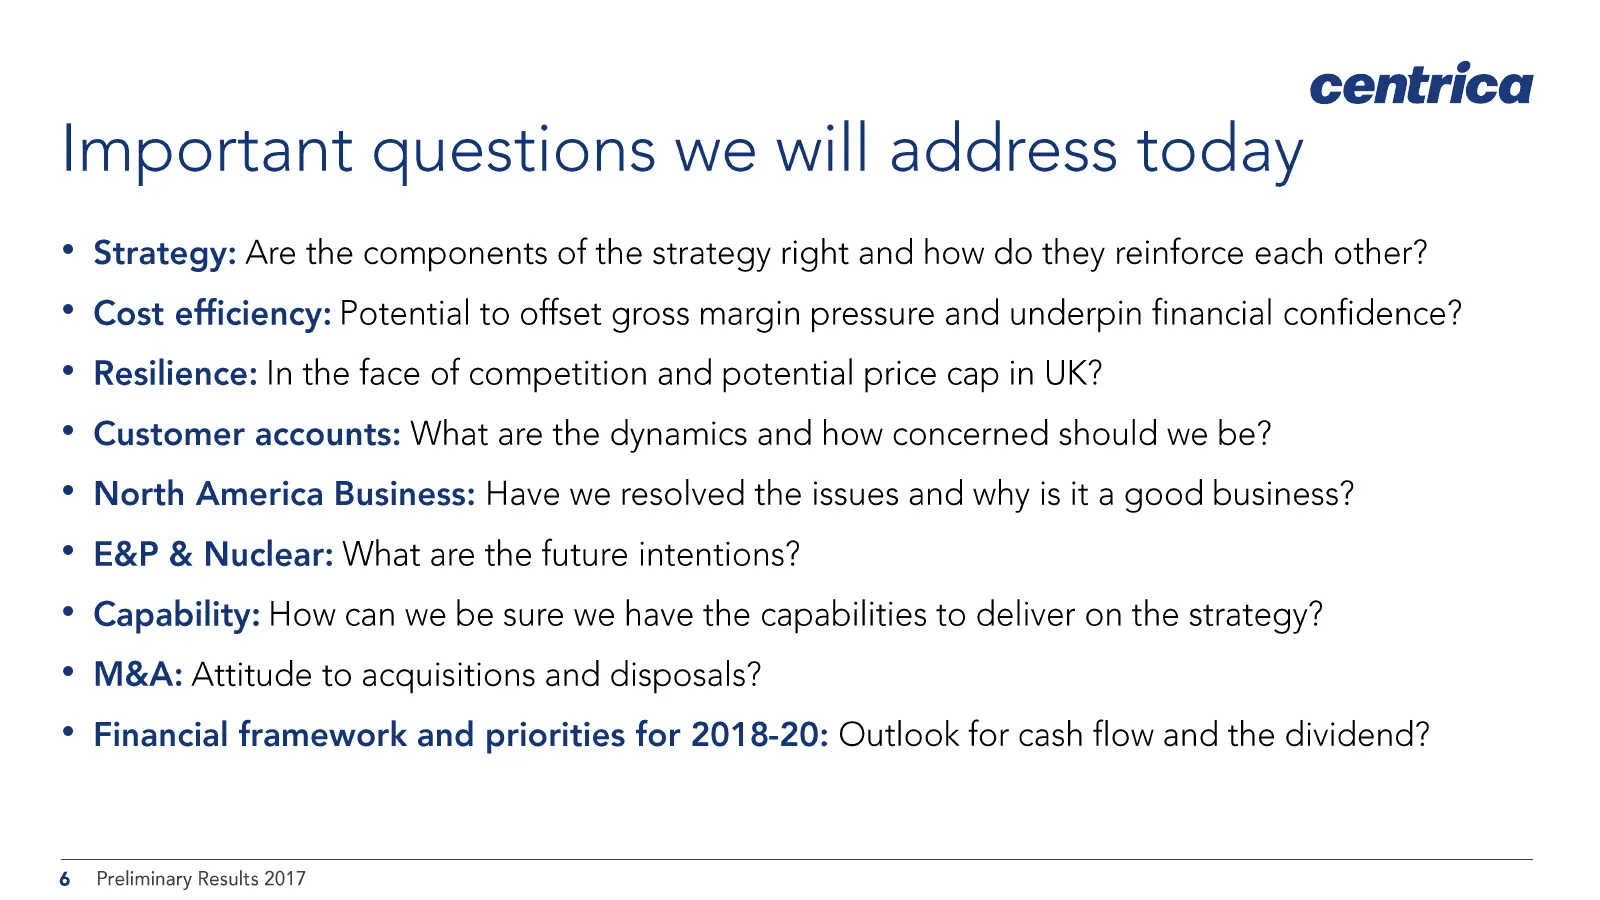
centrica Important questions we will address today * Strategy: Are the components of the strategy right and how do they reinforce each other? * Cost efficiency: Potential to offset gross margin pressure and underpin financial confidence? * Resilience: In the face of competition and potential price c
Slide 7: centrica
centrica
Slide 8: Commodity prices & weather
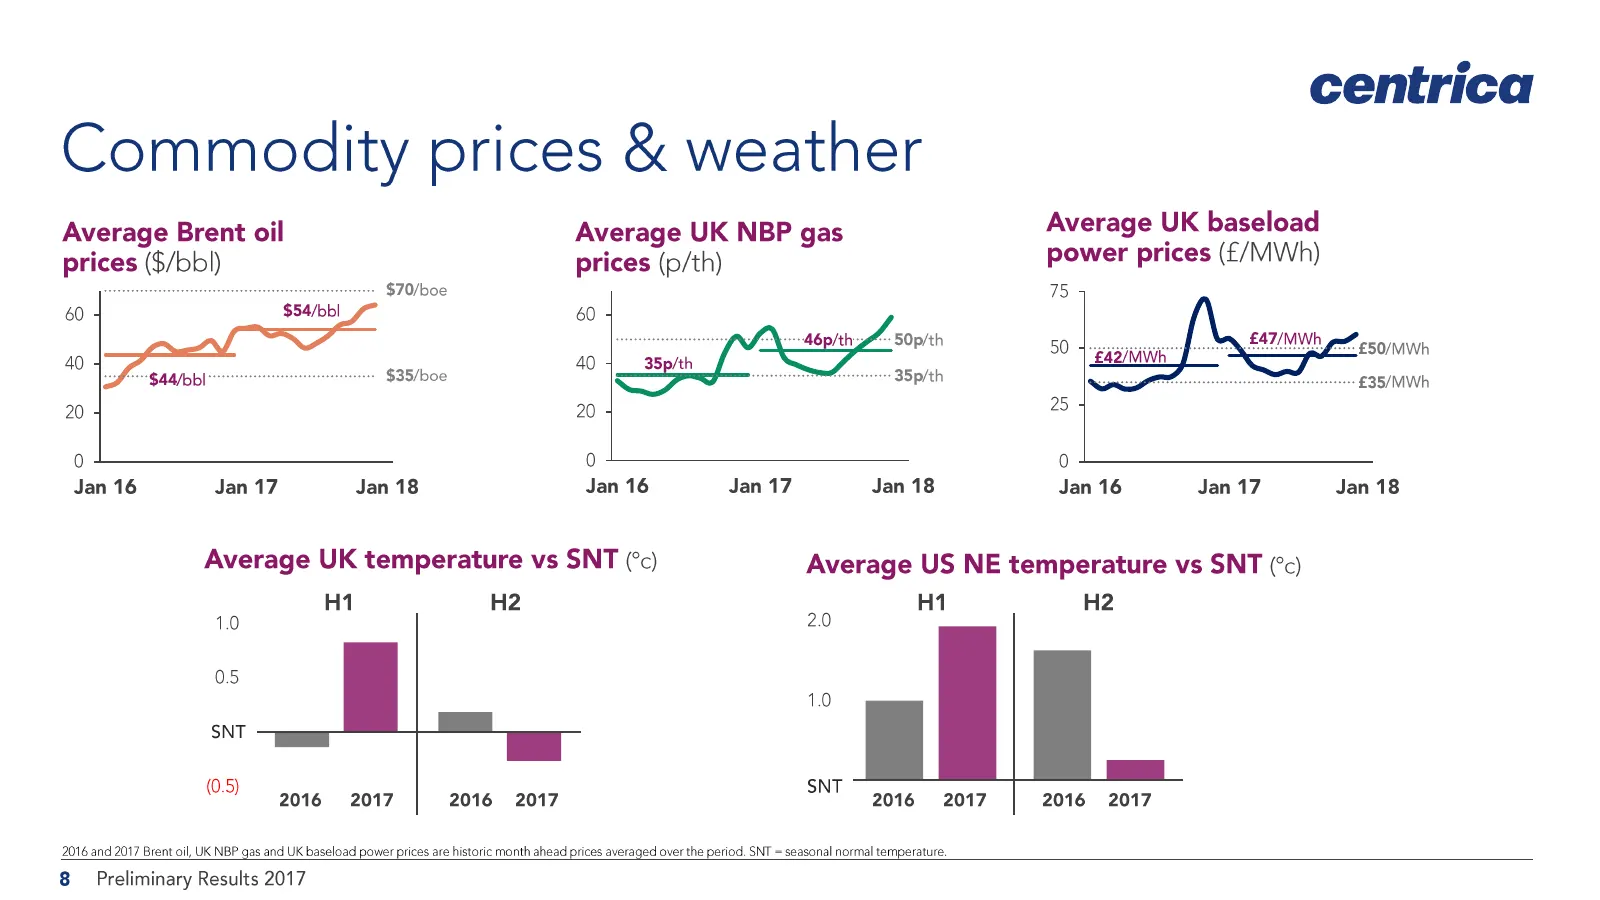
centrica Commodity prices & weather Average Brent oil Average UK NBP gas Average UK baseload prices ($/bbl) prices (p/th) power prices ( ) cooutnnnntnnnnieene v. $70/boe 15 60 $54/bb| 50 f= £50/MWh 40 $35/boe seseseee £35/MWh 20 25 0 0 0 Jan 16 Jan 17 Jan 18 Jan 16 Jan 17 Jan 18 Jan 16 Jan 17 Jan 18
Slide 9: Financial headlines
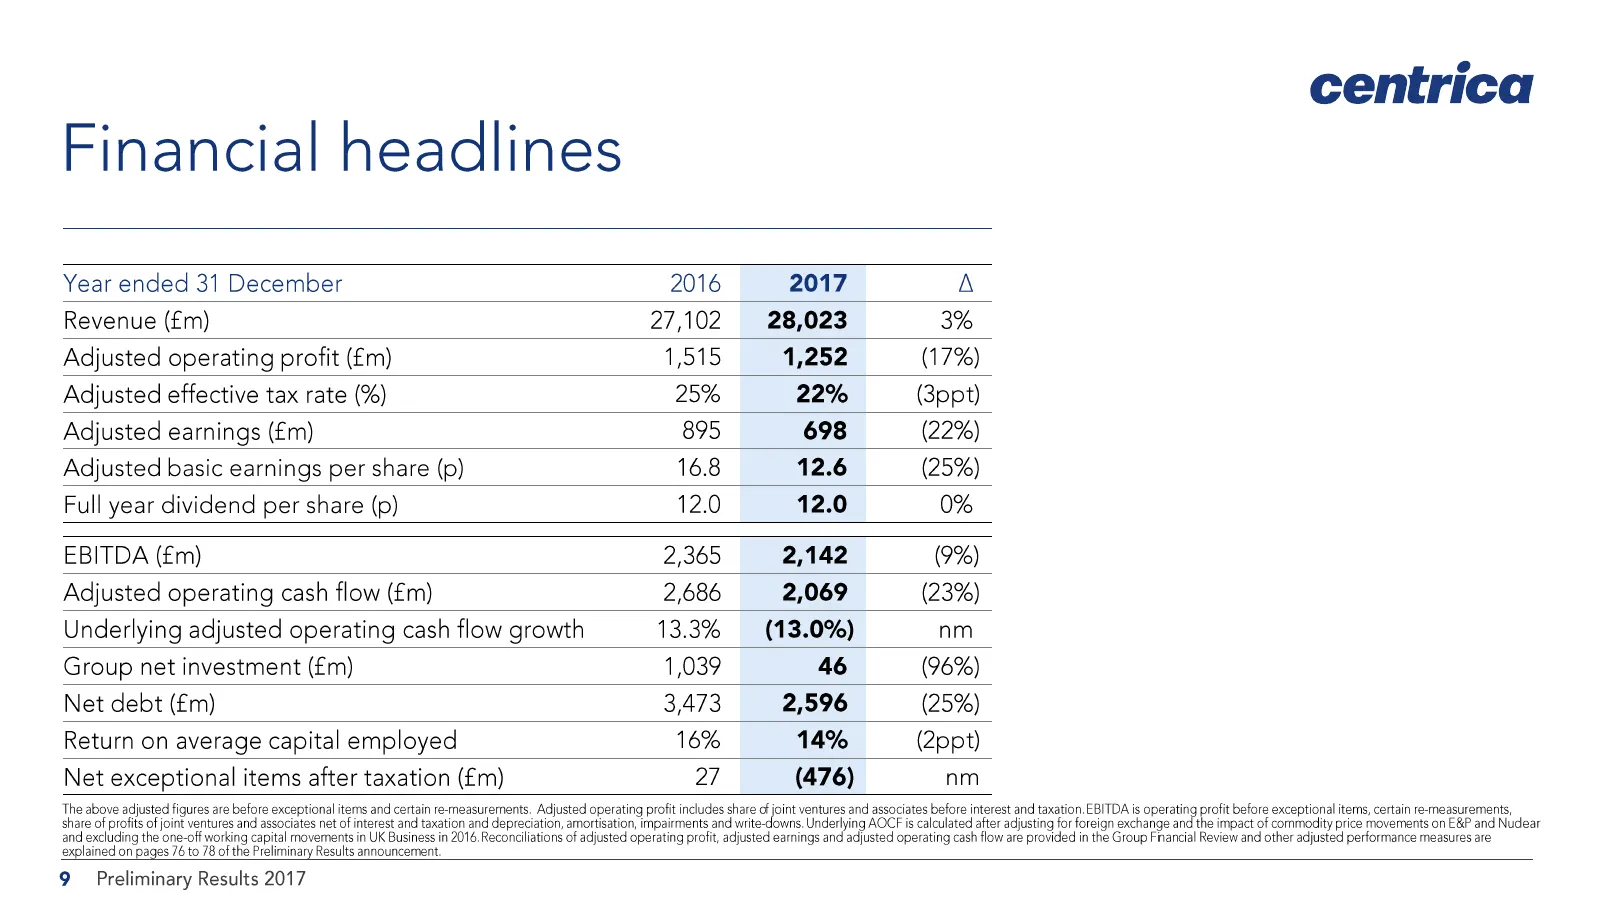
centrica Financial headlines Year ended 31 December 2016 2017 A Revenue (£m) 27,102 28,023 3% Adjusted operating profit (£m) 1,515 1,252 (17%) Adjusted effective tax rate (%) 25% 22% (3ppt) Adjusted earnings (£m) 895 698 (22%) Adjusted basic earnings per share (p) 16.8 12.6 (25%) Full year dividend
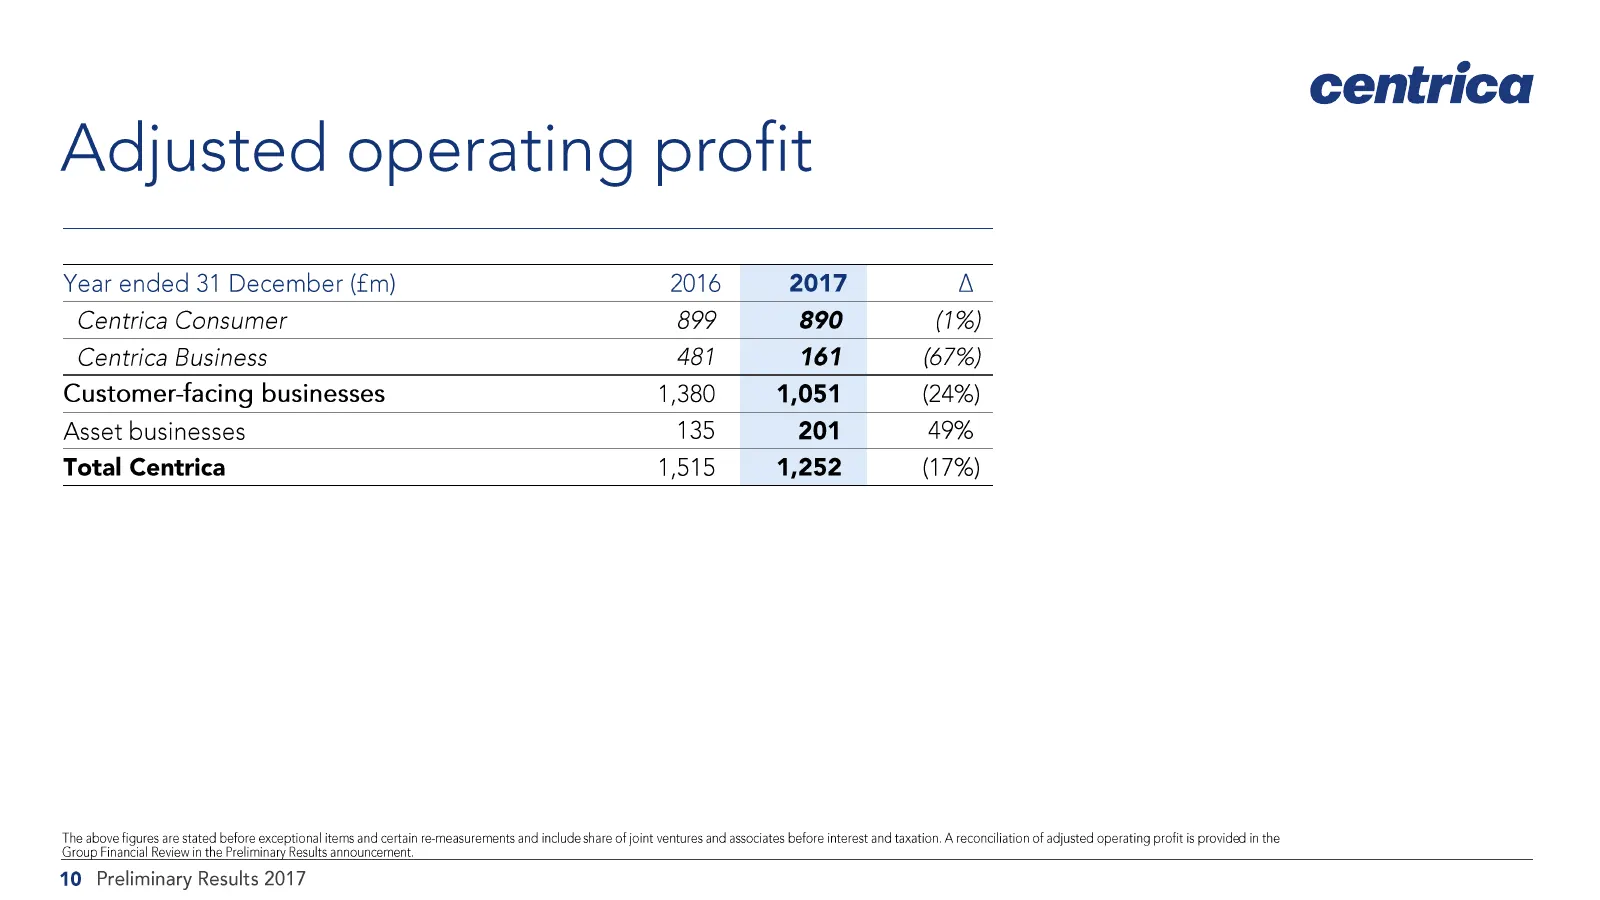
Slide 10: Adjusted operating profit
Adjusted operating profit Year ended 31 December (£m) 2016 2017 A Centrica Consumer 899 890 (1%) Centrica Business 481 161 (67%) Customer-facing businesses 1,380 1,051 (24%) Asset businesses 135 201 49% Total Centrica 1,515 1,252 (17%) ‘The above figures are stated before exceptional items and certa
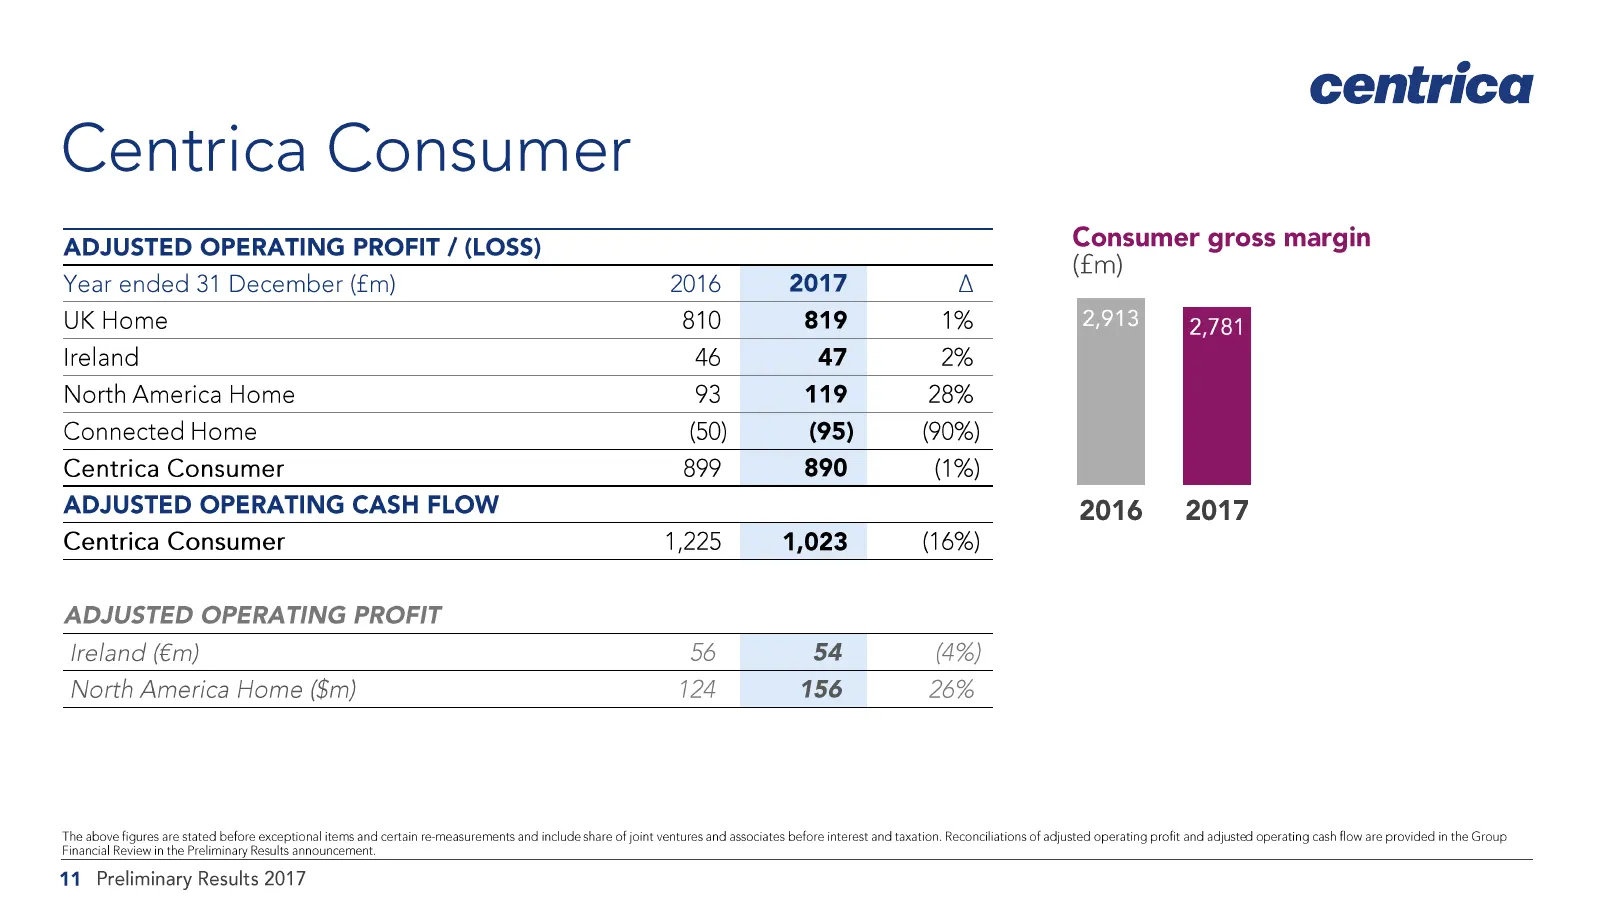
Slide 11: Centrica Consumer
centrica Centrica Consumer ADJUSTED OPERATING PROFIT / (LOSS) ooumer gross margin Year ended 31 December (£m) 2016 2017 A UK Home 810 819 1% 2,913 2,781 Ireland 46 47 2% North America Home 93 119 28% Connected Home (50) (95) (90%) Centrica Consumer 899 890 (1%) ADJUSTED OPERATING CASH FLOW 2016 2017
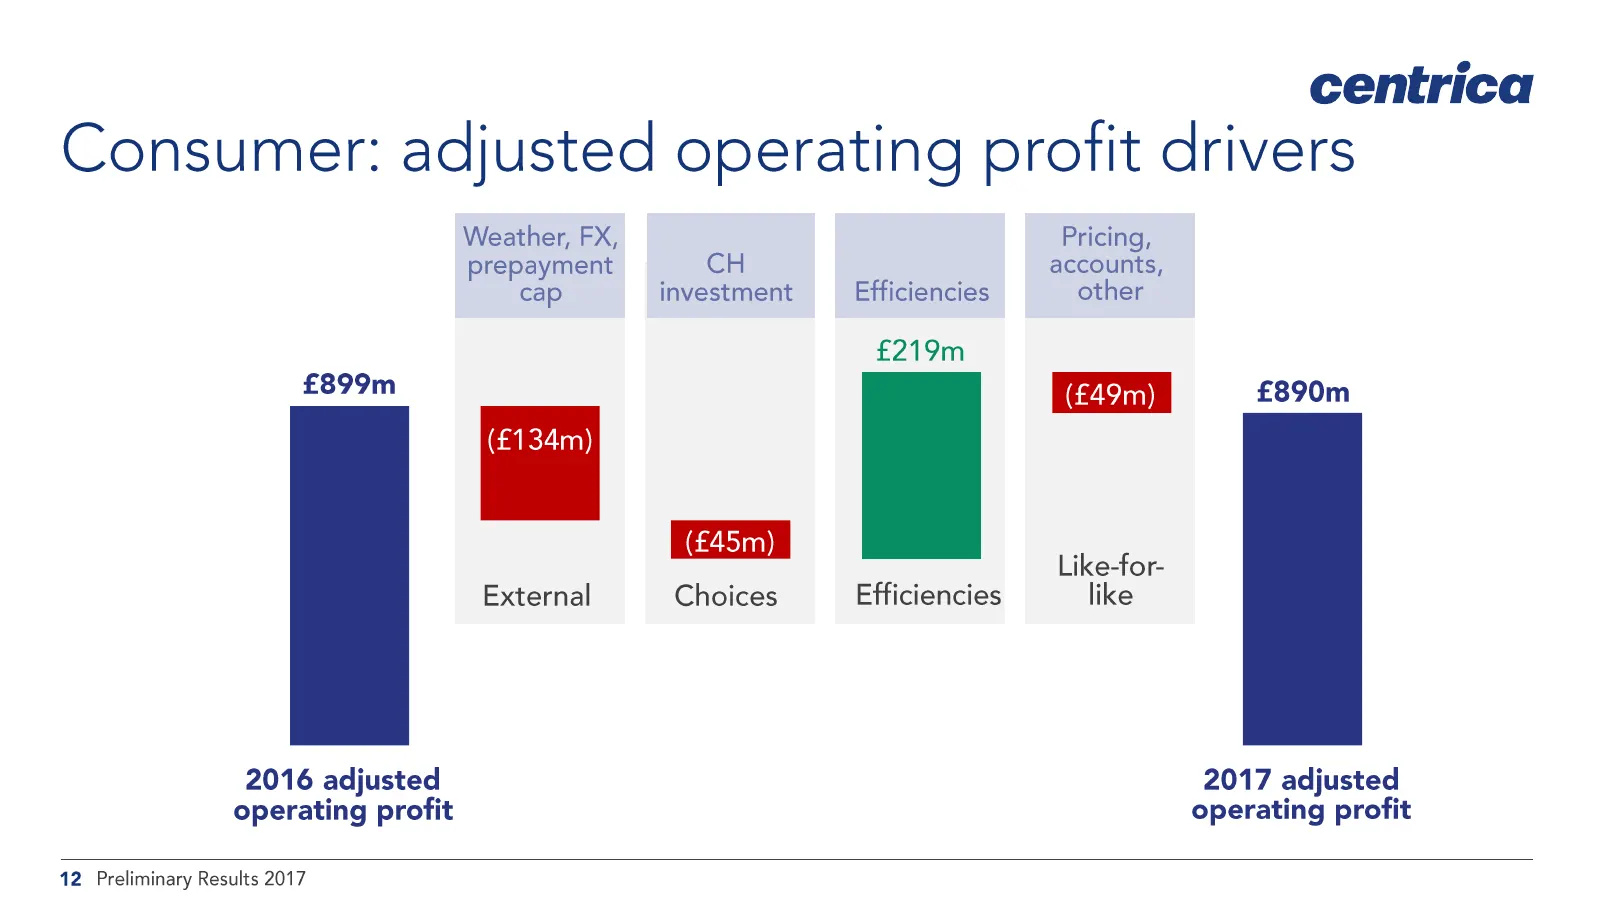
Slide 12: Consumer: adjusted operating profit drivers
centrica Consumer: adjusted operating profit drivers Weather, FX, prepayment CH cap investment Efficiencies £219m £899m (£134m) (£45m) External Choices Efficiencies 2016 adjusted operating profit Pricing, accounts, other (£49m) £890m Like-for- like 2017 adjusted operating profit 12 Preliminary Resul
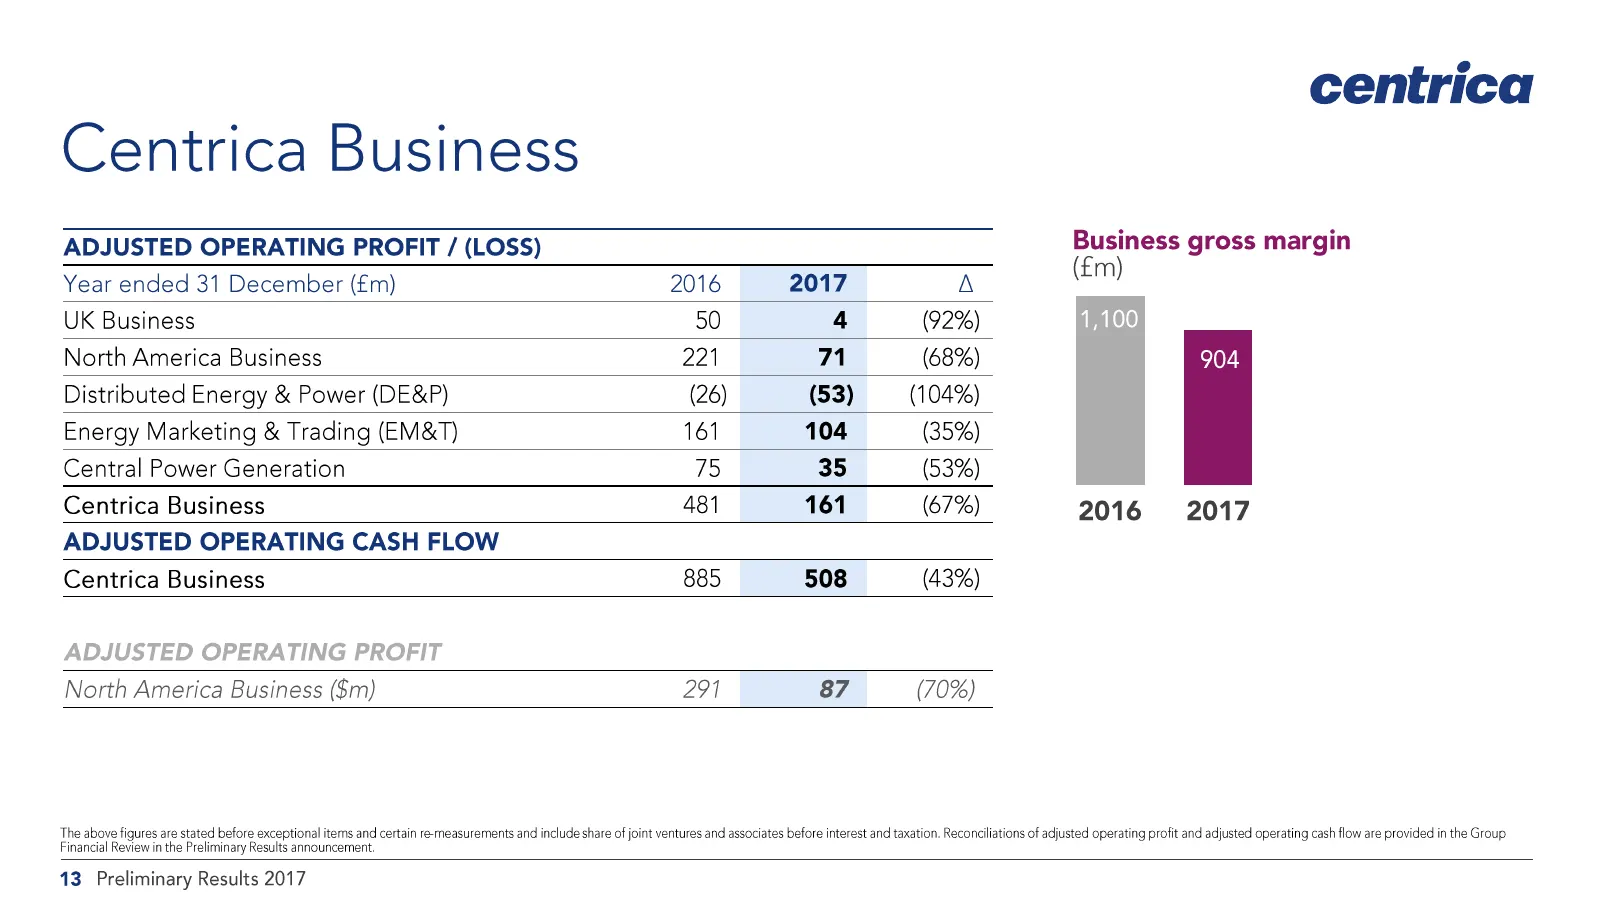
Slide 13: Centrica Business
Centrica Business ADJUSTED OPERATING PROFIT / (LOSS) Year ended 31 December (£m) 2016 2017 A UK Business 50 4 (92%) North America Business 221 71 (68%) Distributed Energy & Power (DE&P) (26) (53) (104%) Energy Marketing & Trading (EM&T) 161 104 (35%) Central Power Generation 75 35 (53%) Centrica Bus
Slide 14: Business: adjusted operating profit drivers
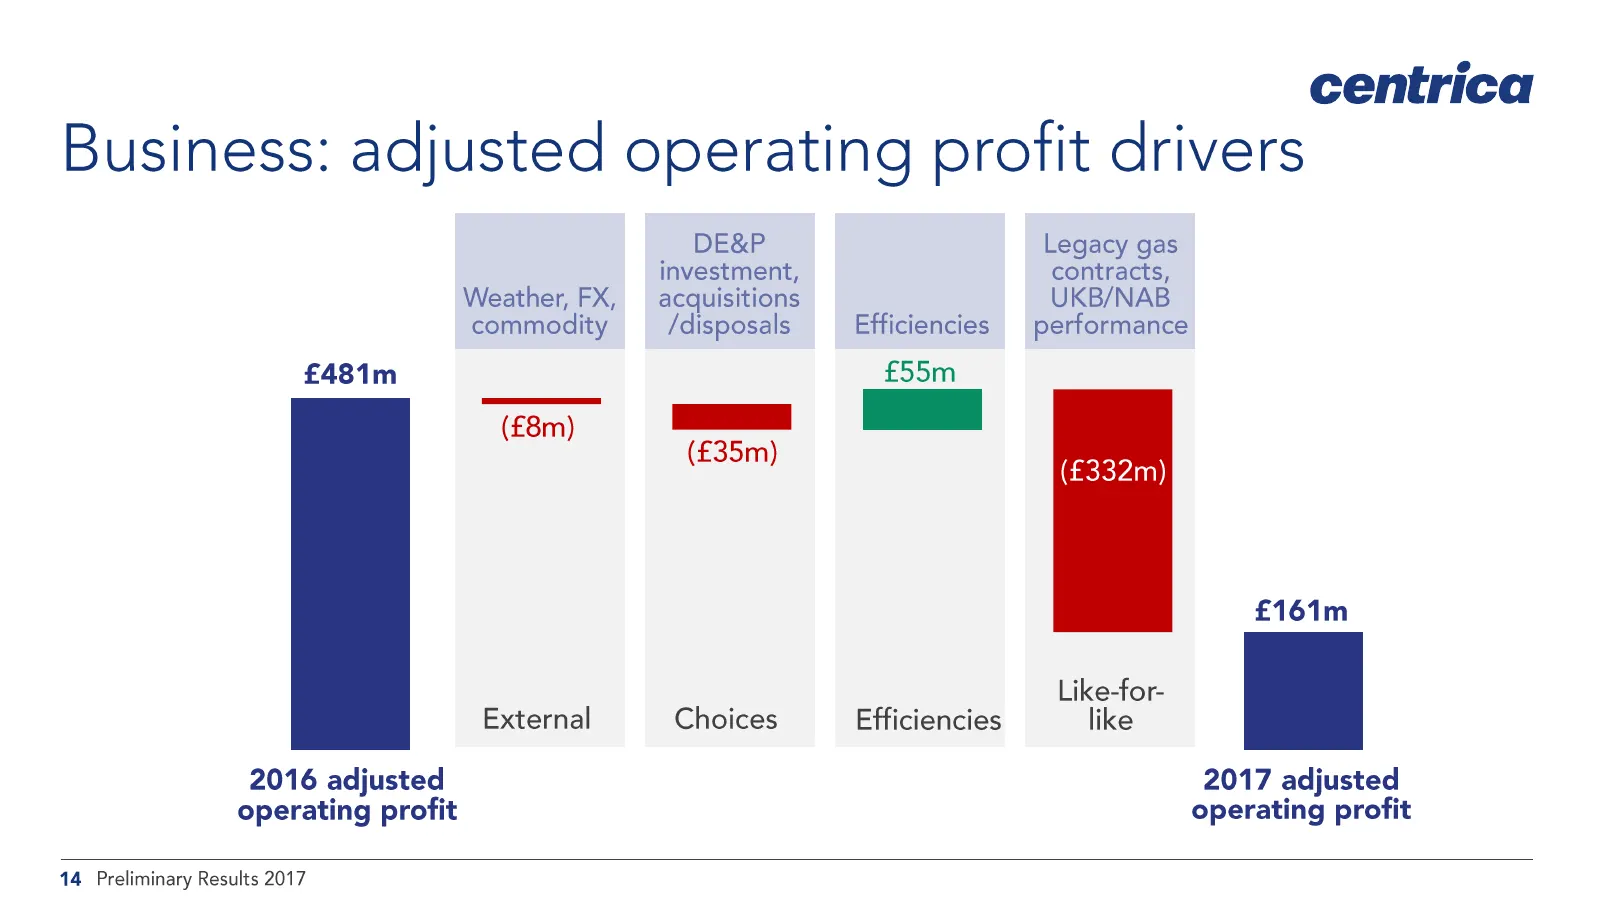
centrica Business: adjusted operating profit drivers Weather, FX, commodity £481m (£8m) External 2016 adjusted operating profit DE&P Legacy gas investment, contracts, acquisitions UKB/NAB /disposals Efficiencies performance £55m , (£35m) (£332m) £161m Like-for- Choices Efficiencies like 2017 adjuste
Slide 15: Business: UK energy supply
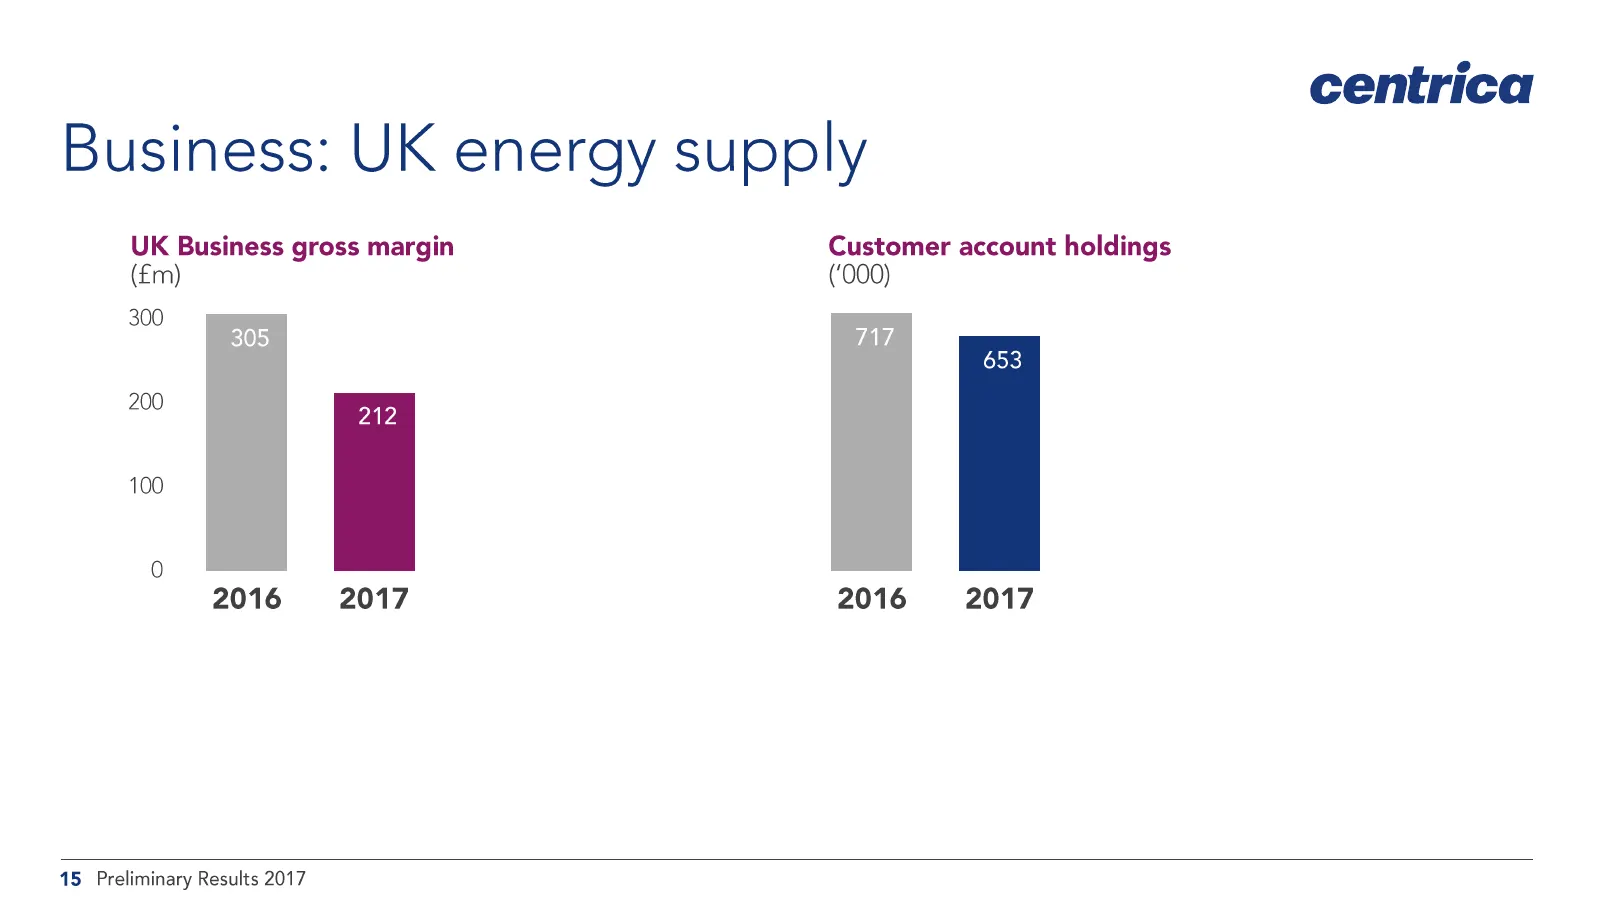
Business: UK energy supply UK Business gross margin Customer account holdings (£m) (‘000) 300 305 717 653 200 Ap 100 0 2016 2017 2016 2017 centrica 15 Preliminary Results 2017
Slide 16: Business: North America energy supply
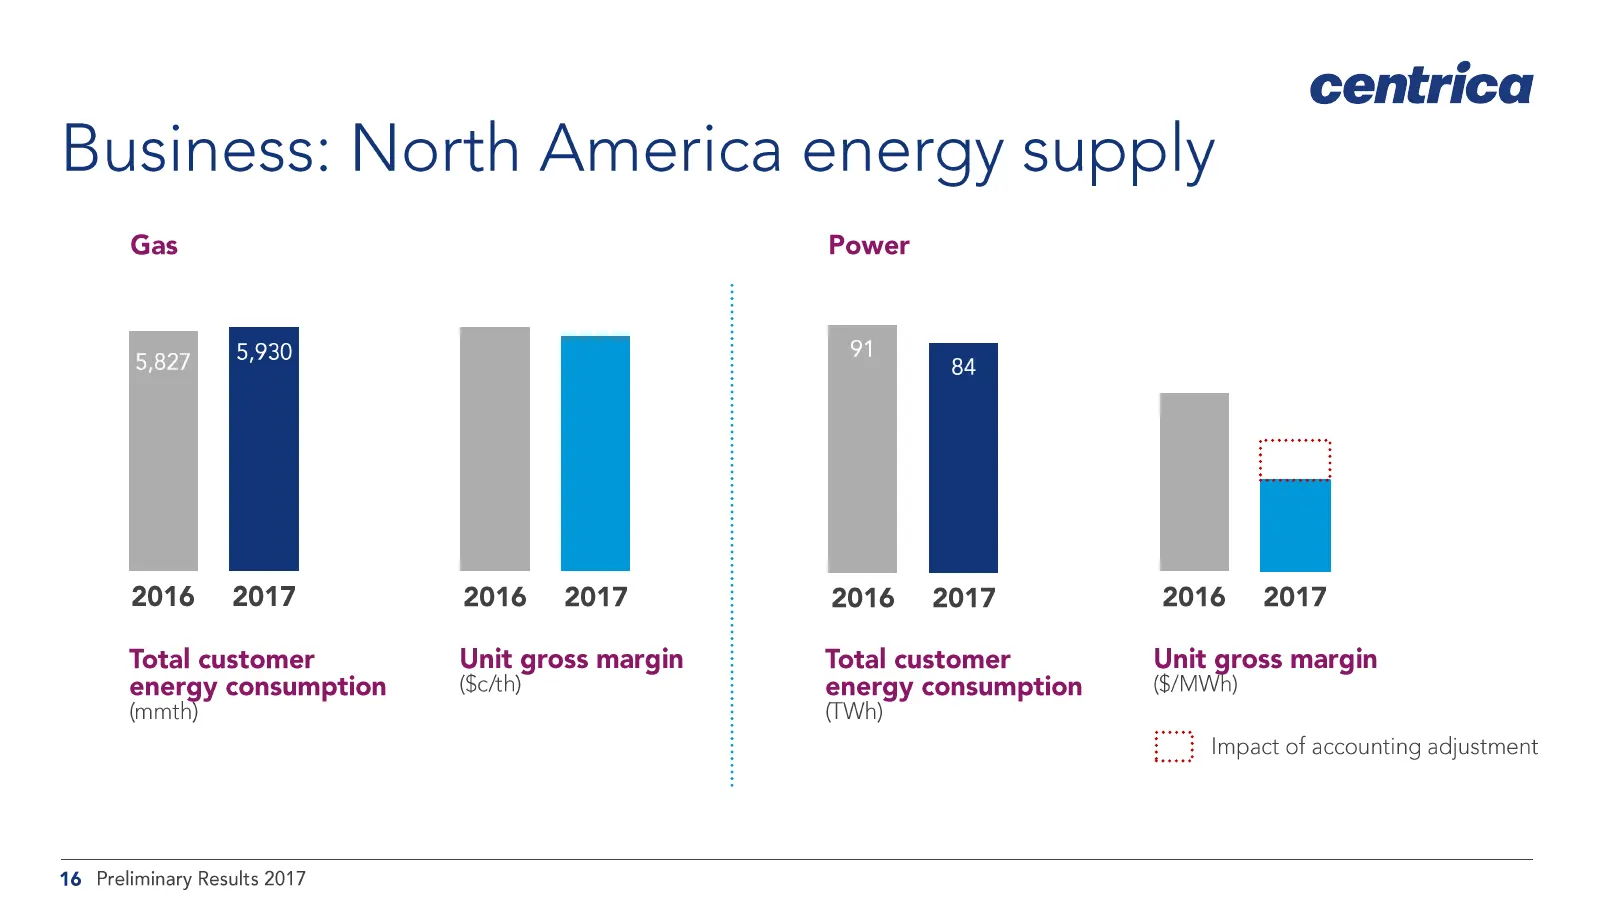
centrica Business: North America energy supply Gas 1 : : 2016 2017 2016 2017 Total customer Unit gross margin energy consumption (Sc/th) rane Power 2016 2017 2016 2017 Total customer Unit gross margin energy consumption ($/MWh) (TWh) i} Impact of accounting adjustment 16 Preliminary Results 2017
Slide 17: Business: NA energy supply gross margin
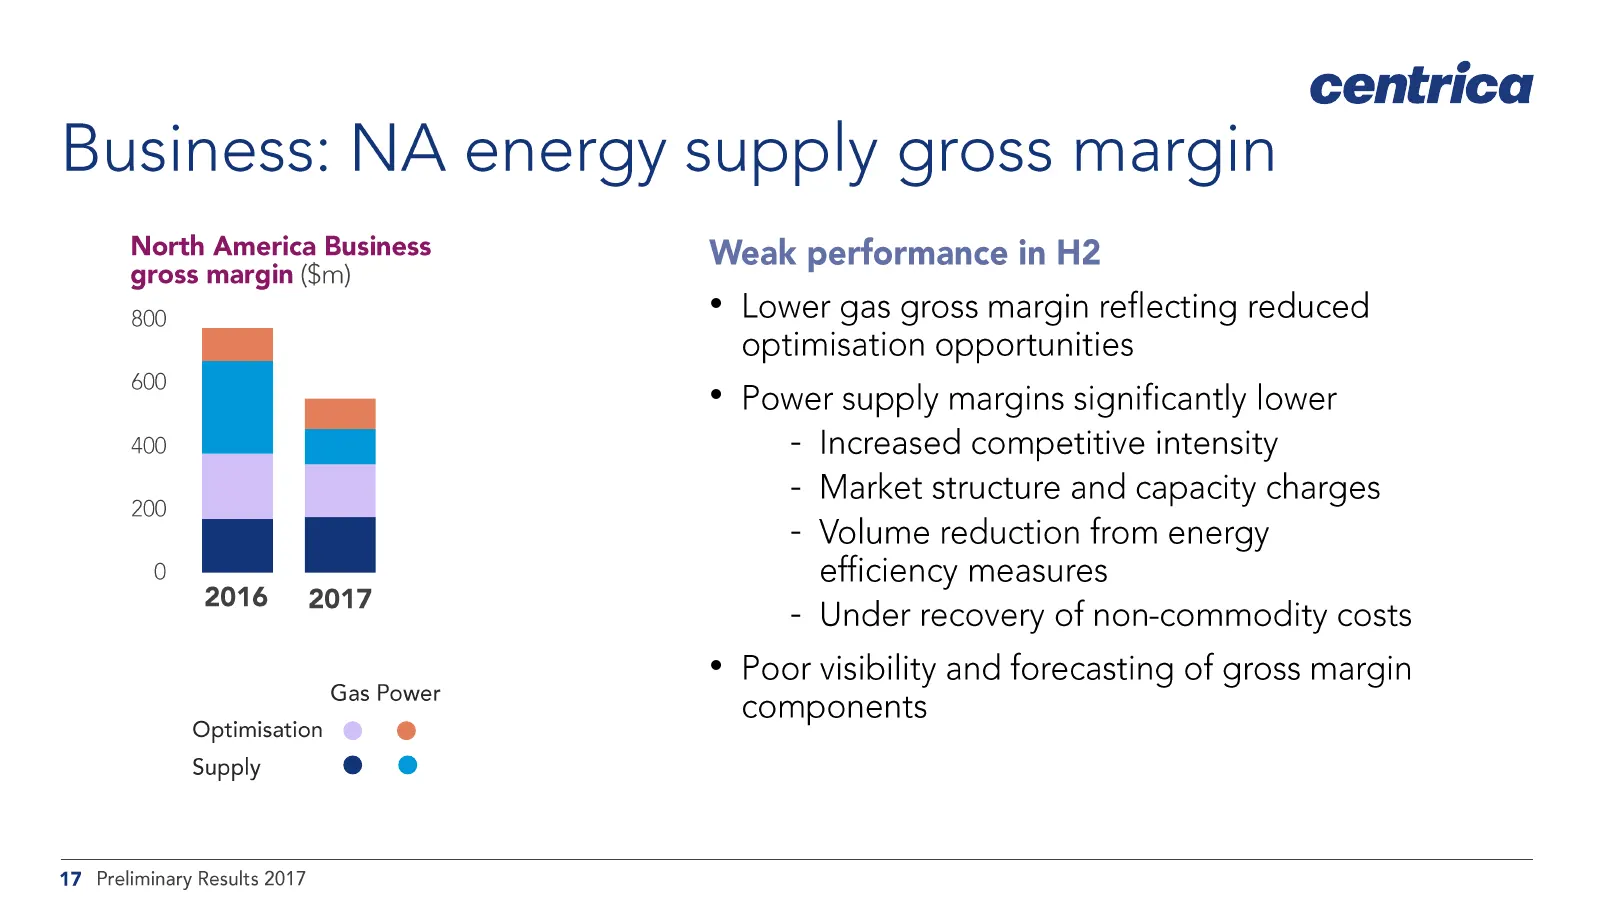
centrica Business: NA energy supply gross margin North America Business Weak performance in H2 gross margin ($m) 800 * Lower gas gross margin reflecting reduced optimisation opportunities 600 eye * Power supply margins significantly lower 400 inom - Increased competitive intensity - Market structure
Slide 18: Business: NA energy supply response
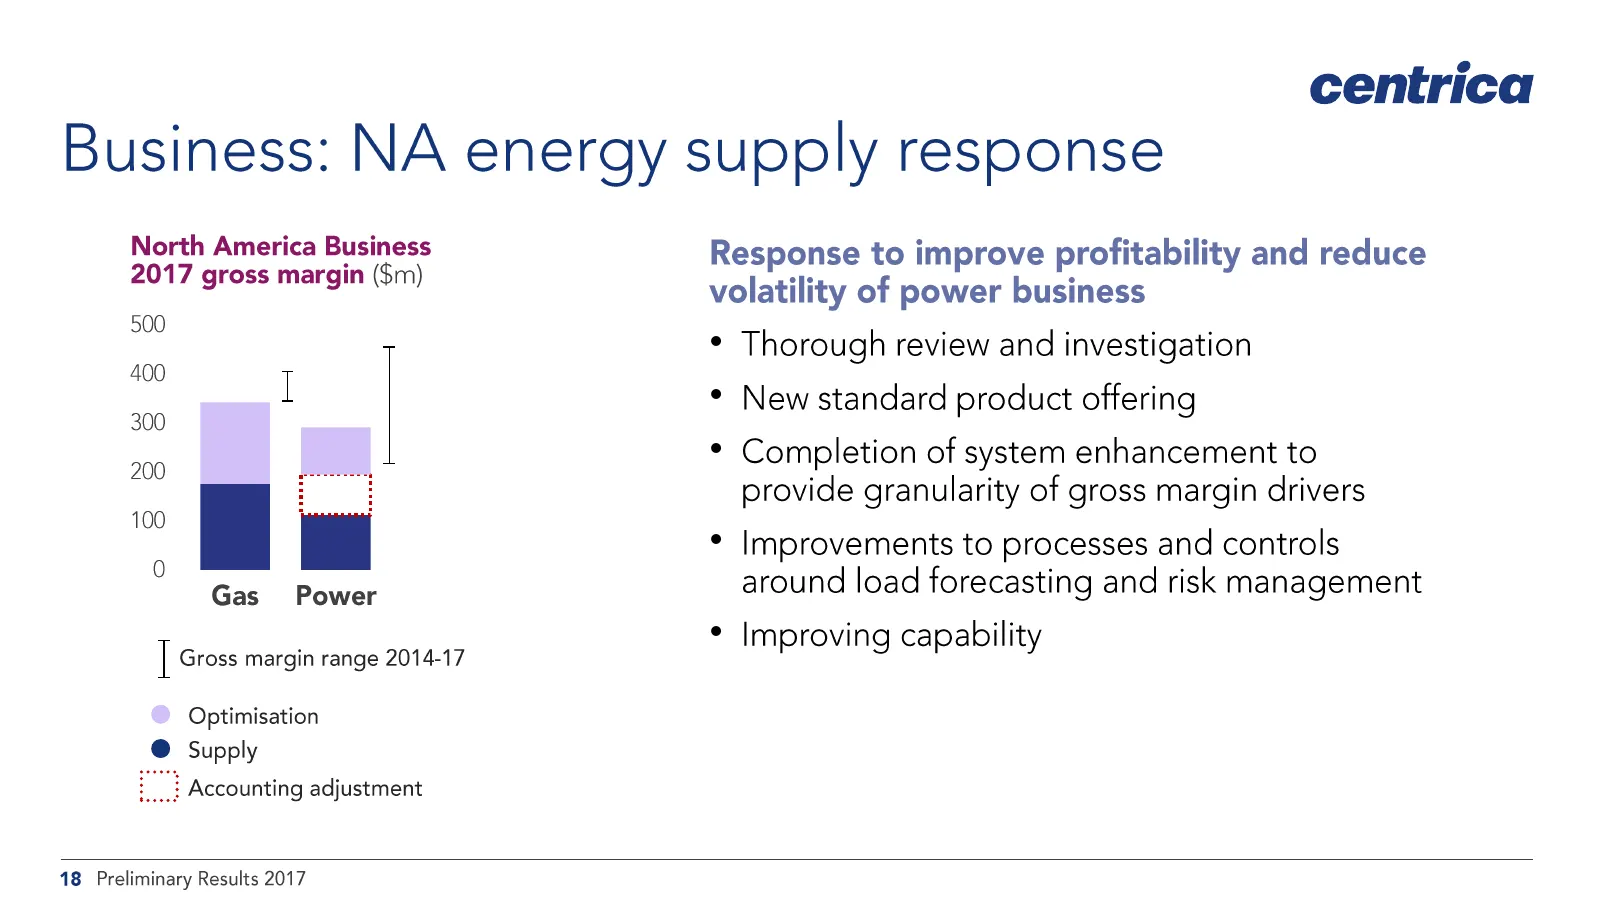
centrica Business: NA energy supply response North America Business 2017 gross margin ($m) 500 400 I Gas Power | Gross margin range 2014-17 Optimisation @ Supply Response to improve profitability and reduce volatility of power business * Thorough review and investigation * New standard product offer
Slide 19: Business: DE&P and EM&T gross margin
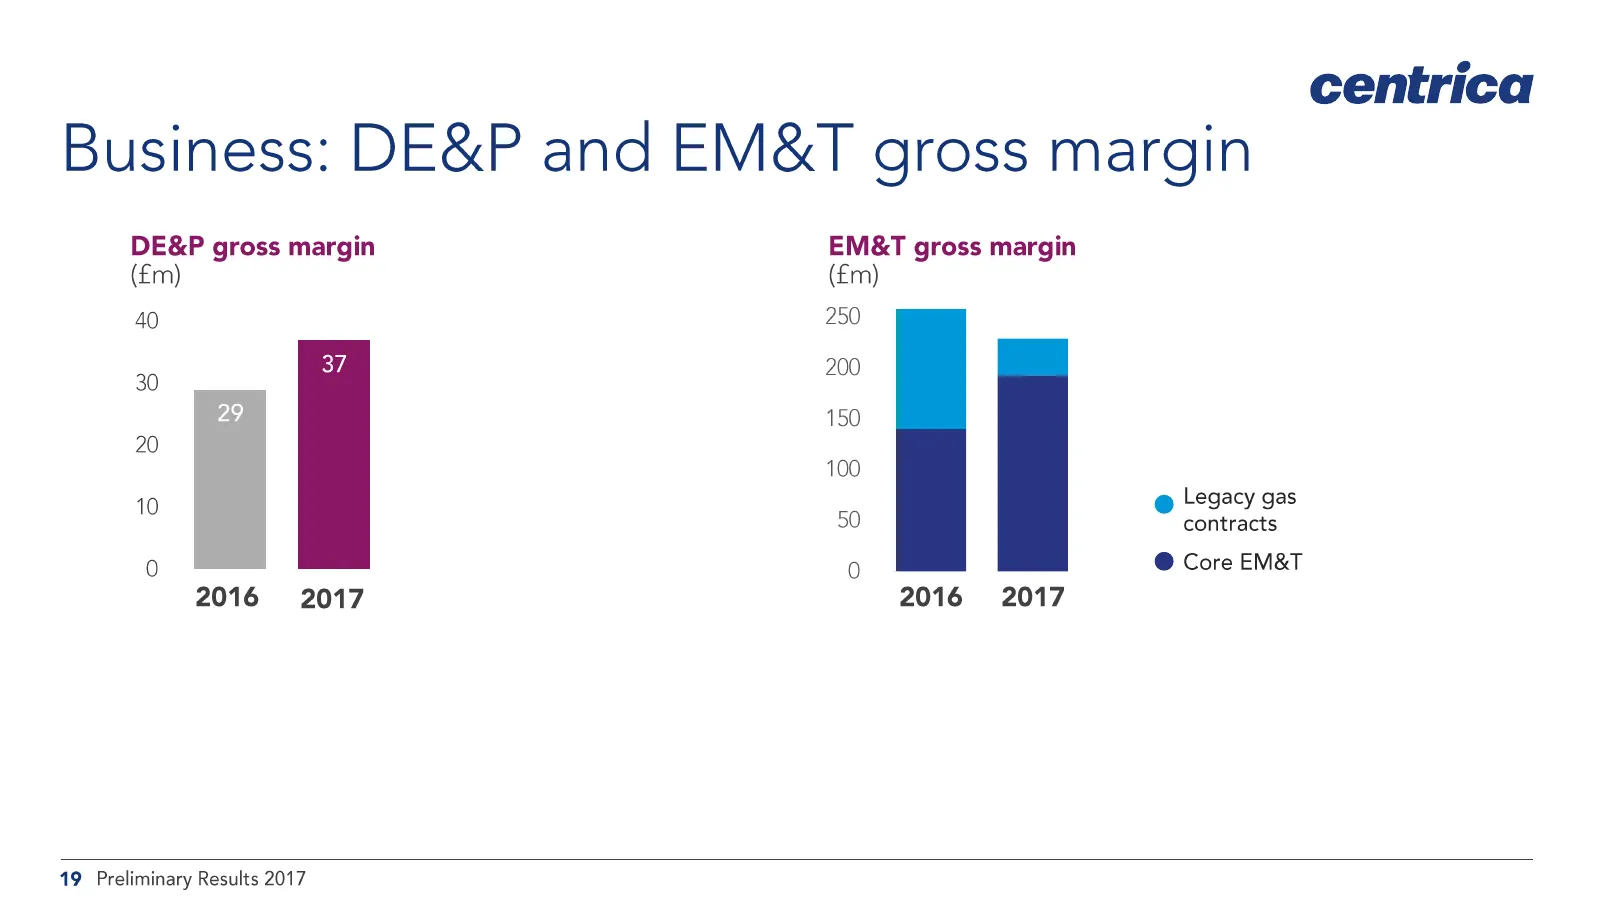
centrica Business: DE&P and EM&T gross margin DE&P gross margin EM&T gross margin (£m) (£m) 40 250 37 30 200 29 150 20 100 Legacy gas 0 50 ° contracts 0 0 @ Core EM&T 2016 2017 2016 2017 19 Preliminary Results 2017
Slide 20: Exploration & Production
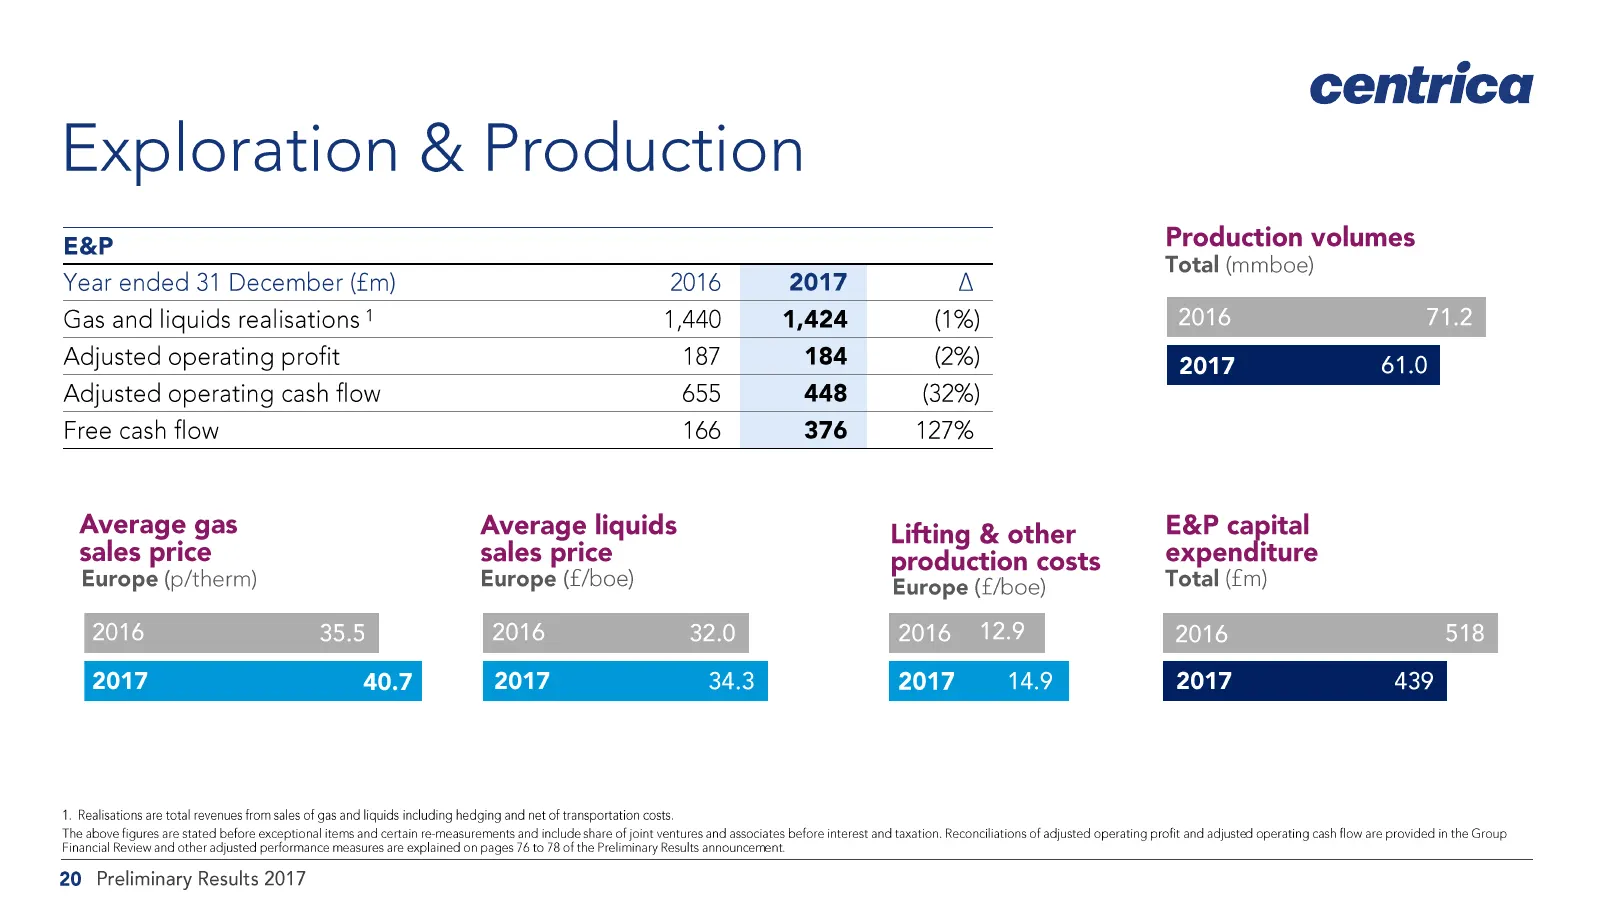
Exploration & Production E&P Year ended 31 December (£m) 2016 2017 A Gas and liquids realisations ' 1,440 1,424 (1%) Adjusted operating profit 187 184 (2%) Adjusted operating cash flow 655 448 (32%) Free cash flow 166 376 127% songs sone we ate, Europe (p/therm) Europe (f/boe) Europe (f/boe) 2016 35
Slide 21: Exploration & Production - CSL
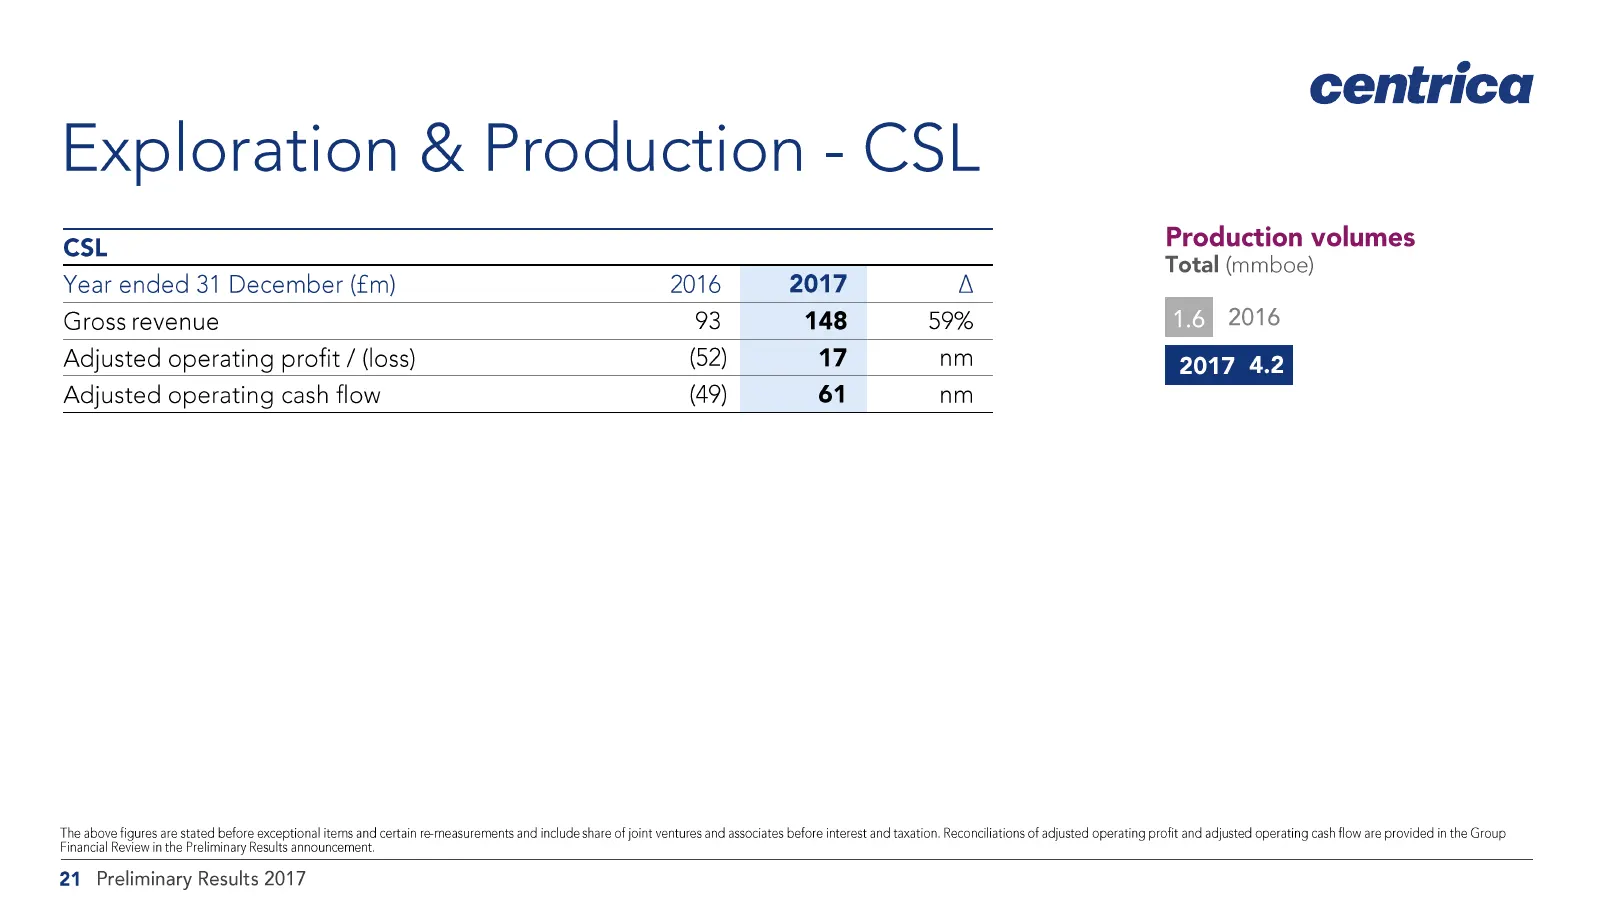
Exploration & Production - CSL CSL Year ended 31 December (£m) 2016 2017 A Gross revenue 93 148 59% Adjusted operating profit / (loss) (52) 17 nm (49) 61 nm Adjusted operating cash flow centrica Production volumes Total (mmboe) BA 2016 The above figures are stated before exceptional terns and certai
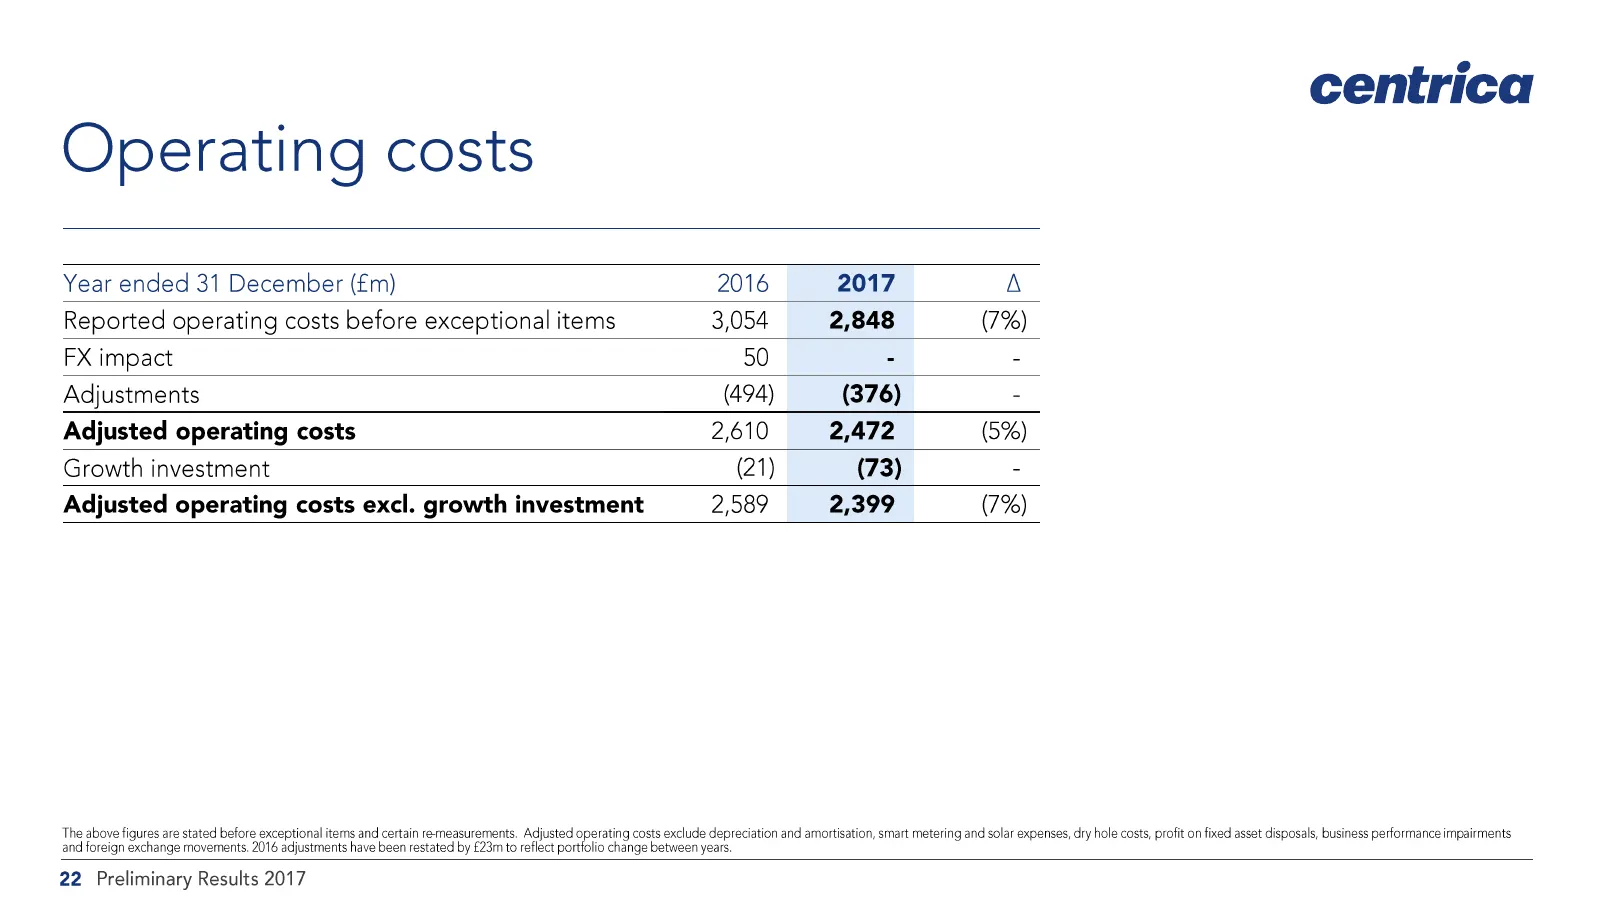
Slide 22: Operating costs
Operating costs Year ended 31 December (£m) 2016 2017 A Reported operating costs before exceptional items 3,054 2,848 (7%) FX impact 50 - - Adjustments (494) (376) - Adjusted operating costs 2,610 2,472 (5%) Growth investment (21) (73) - Adjusted operating costs excl. growth investment 2,589 2,399 (
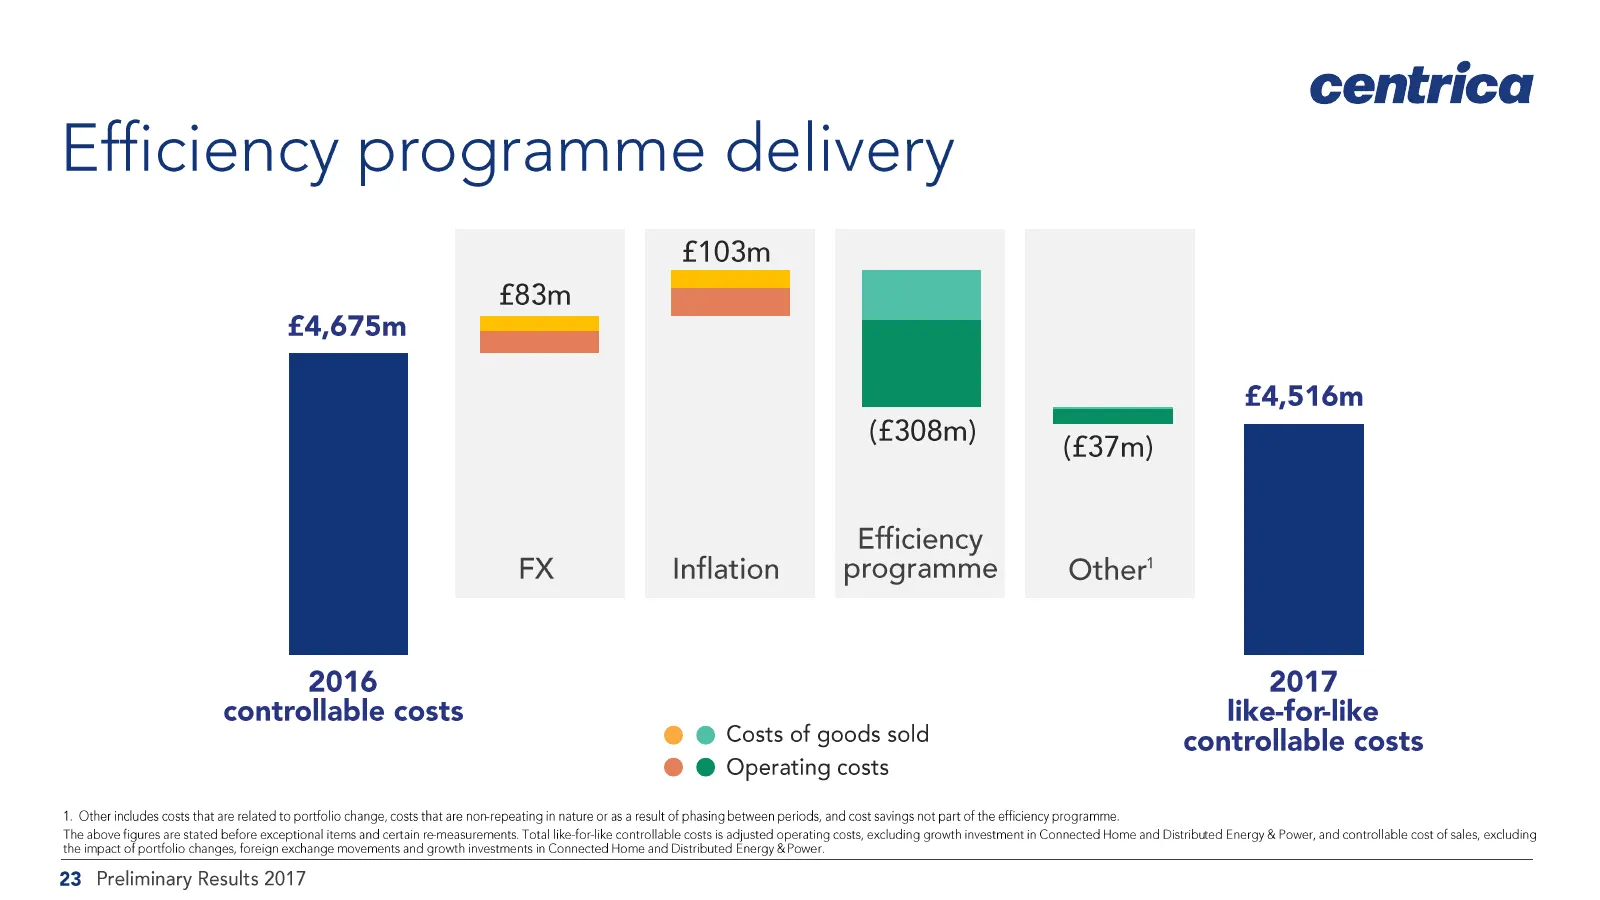
Slide 23: Efficiency programme delivery
Efficiency programme delivery £103m £83m ne in (£308m) Efficiency FX Inflation programme 2016 controllable costs @ @ Costs of goods sold @ @ Operating costs centrica Other' 2017 like-for-like controllable costs 1. Other includes costs that are related to portfolio change, costs that are non-repeatin
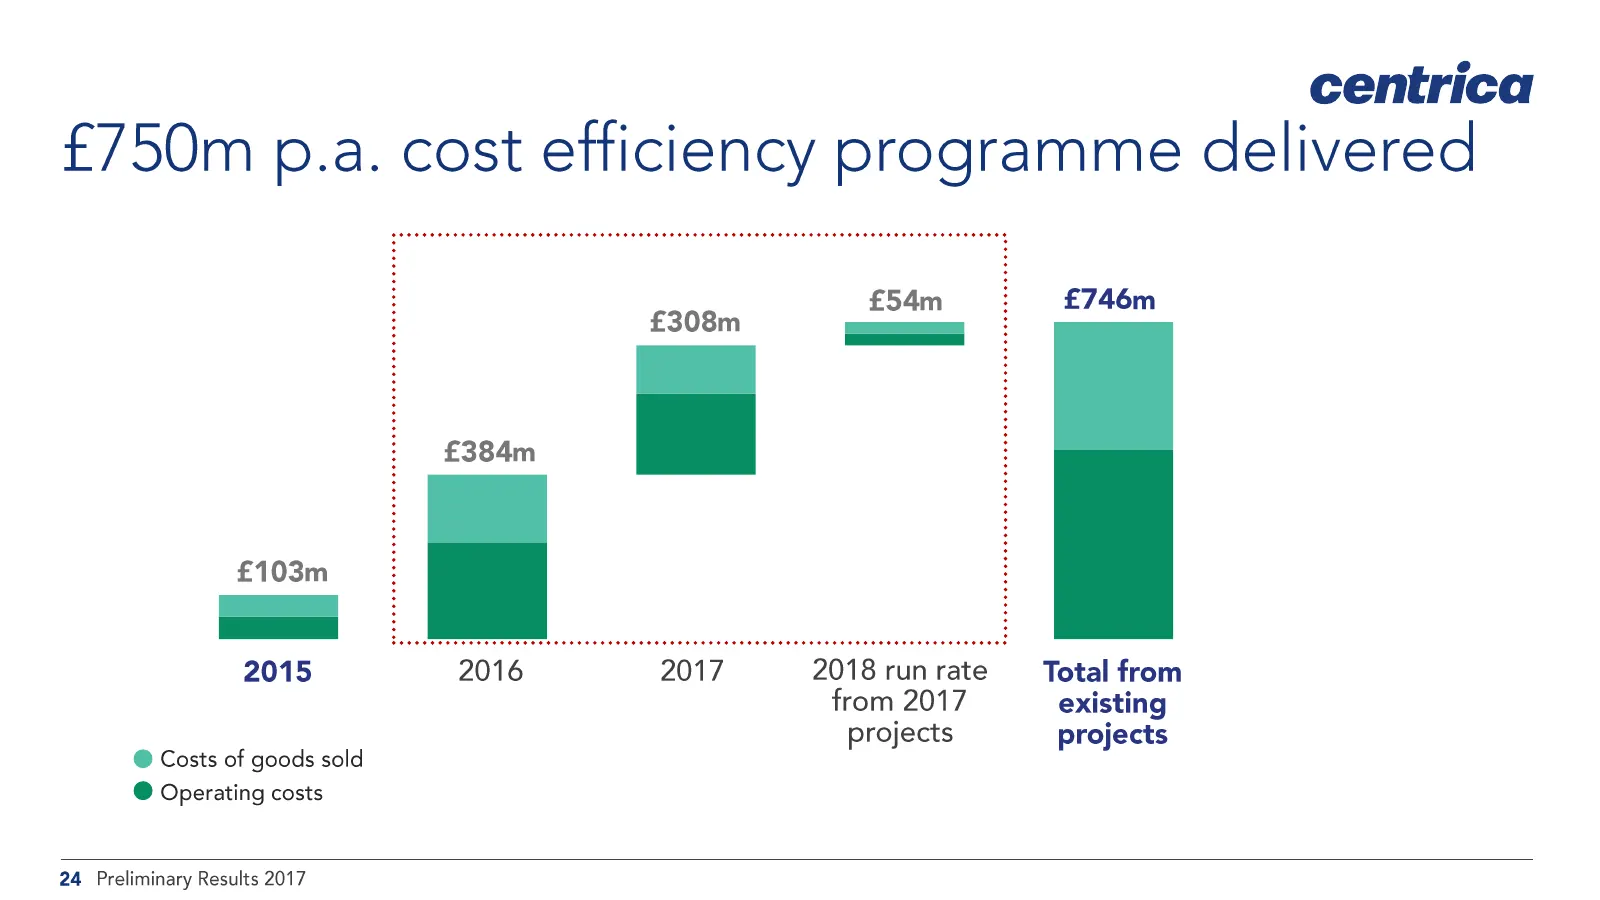
Slide 24: £750m p.a. cost efficiency programme delivered
centrica £750m p.a. cost efficiency programme delivered £103m 2015 @ Costs of goods sold @ Operating costs £384m 2018 run rate from 2017 projects £746m Total from existing projects 24 Preliminary Results 2017
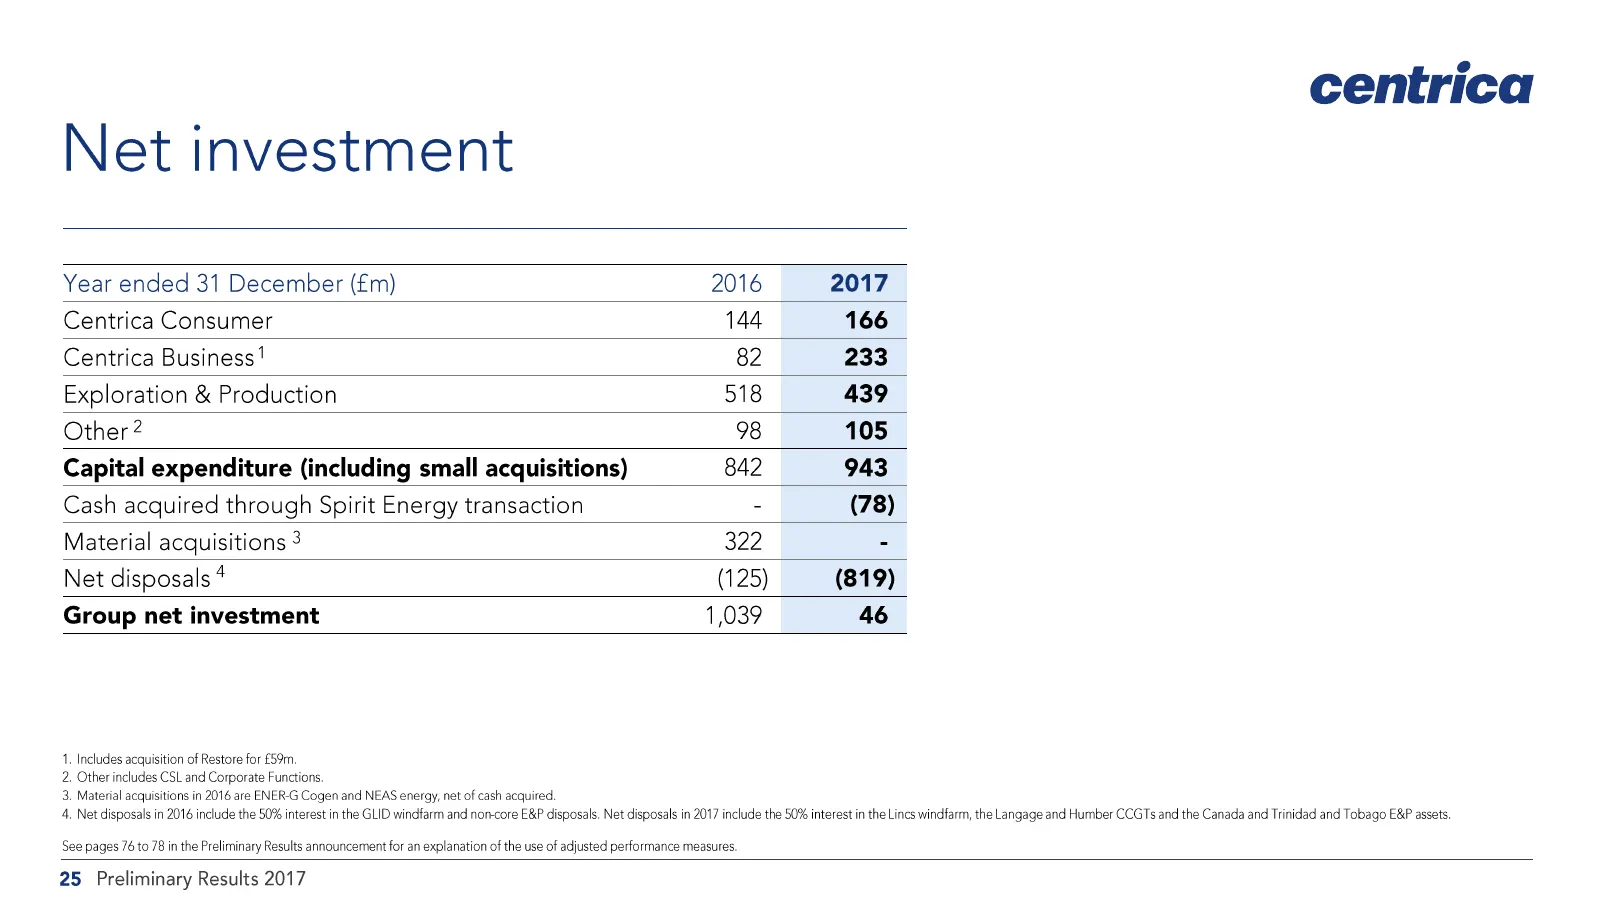
Slide 25: Net investment
Net investment Year ended 31 December (£m) 2016 2017 Centrica Consumer 144 166 Centrica Business! 82 233 Exploration & Production 518 439 Other 2 98 105 Capital expenditure (including small acq ns) 842 943 Cash acquired through Spirit Energy transaction - (78) Material acquisitions ? 322 - Net dispo
Slide 26: Cash flow
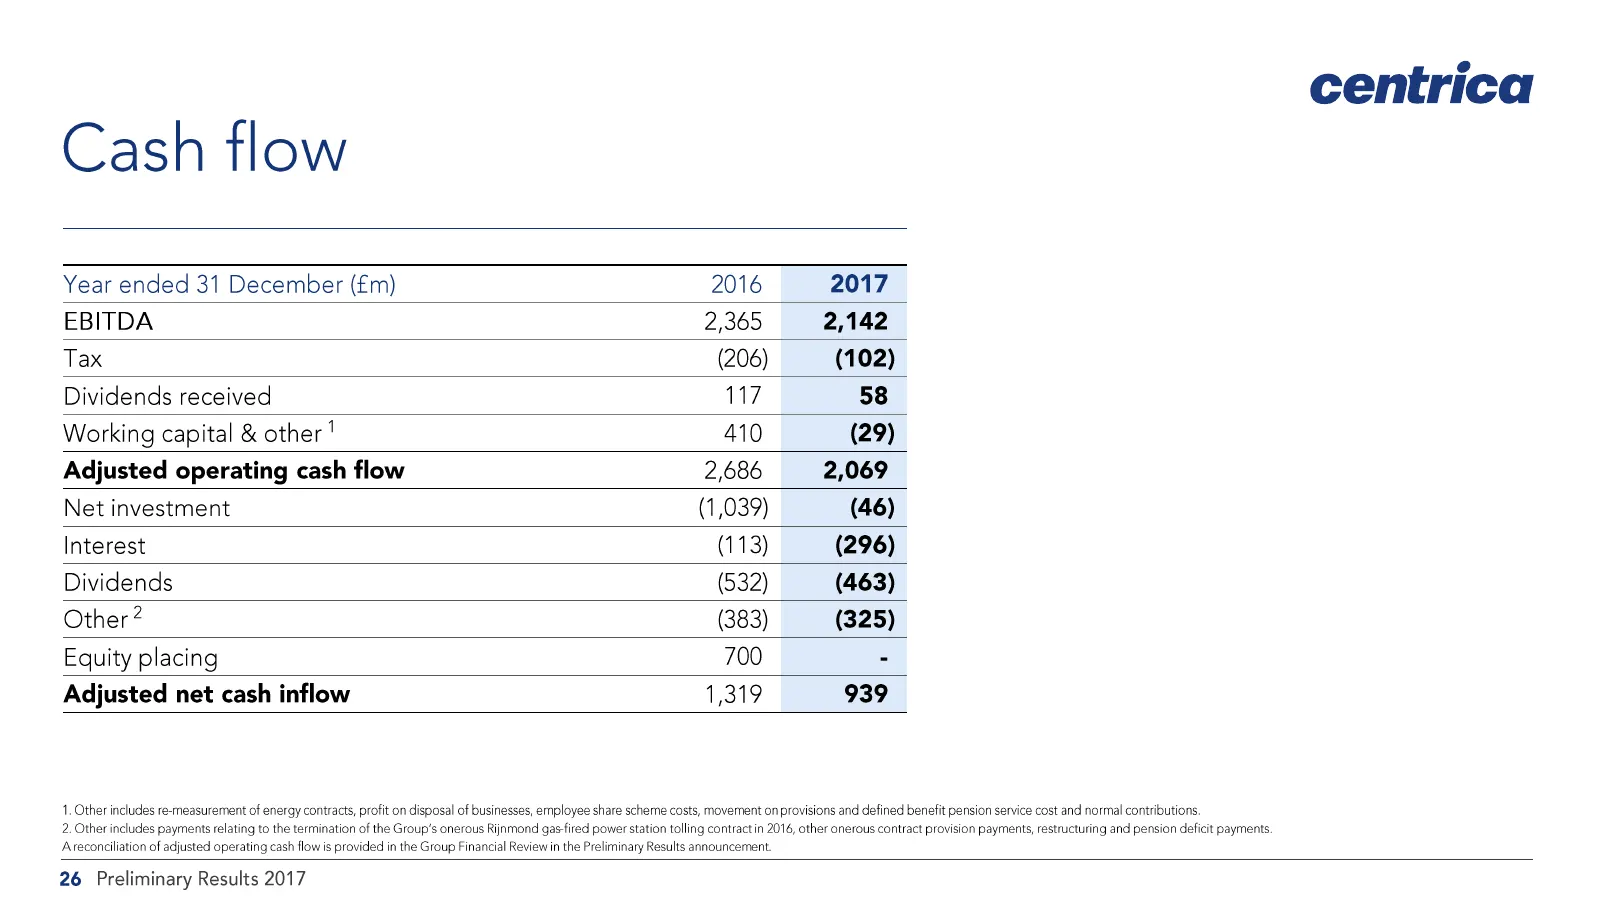
Cash flow Year ended 31 December (£m) 2016 2017 EBITDA 2,365 2,142 Tax (206) (102) Dividends received 117 58 Working capital & other | 410 (29) Adjusted operating cash flow 2,686 2,069 Net investment (1,039) (46) Interest (113) (296) Dividends (532) (463) Other? (383) (325) Equity placing 700 - Adju
Slide 27: Debt repurchase programme
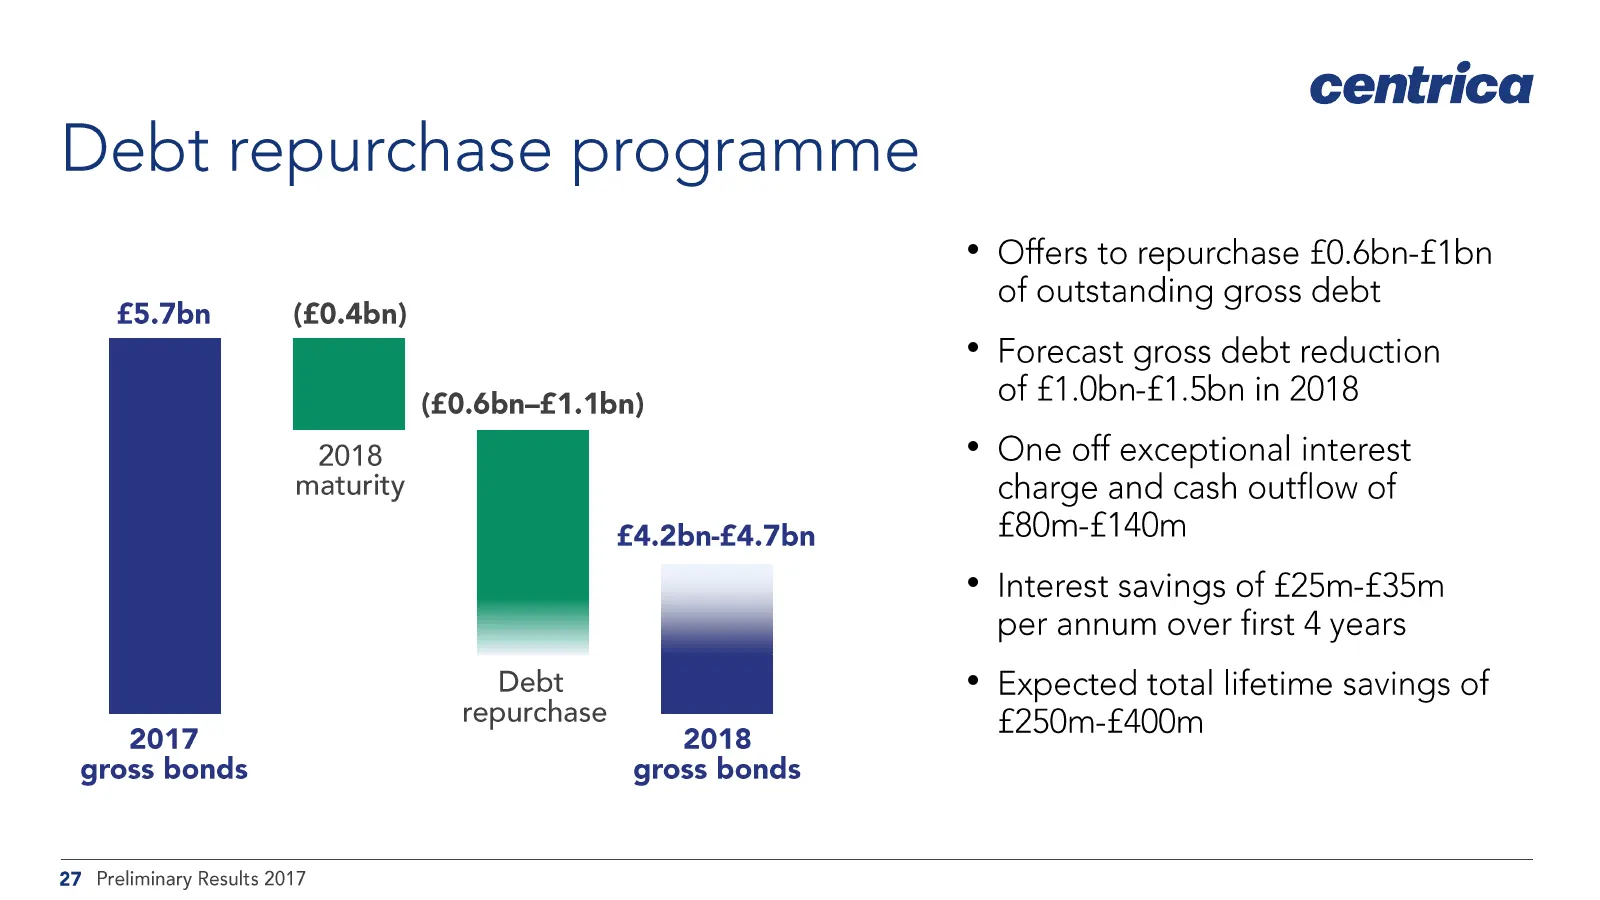
Debt repurchase programme £5.7bn (£0.4bn) |] (£0.6bn-£1.1bn) 2018 maturity £4.2bn-£4.7bn repurchase 2017 2018 gross bonds gross bonds centrica Offers to repurchase £0.6bn-£1bn of outstanding gross debt Forecast gross debt reduction of £1.0bn-£1.5bn in 2018 One off exceptional interest charge and cas
Slide 28: Credit rating metrics
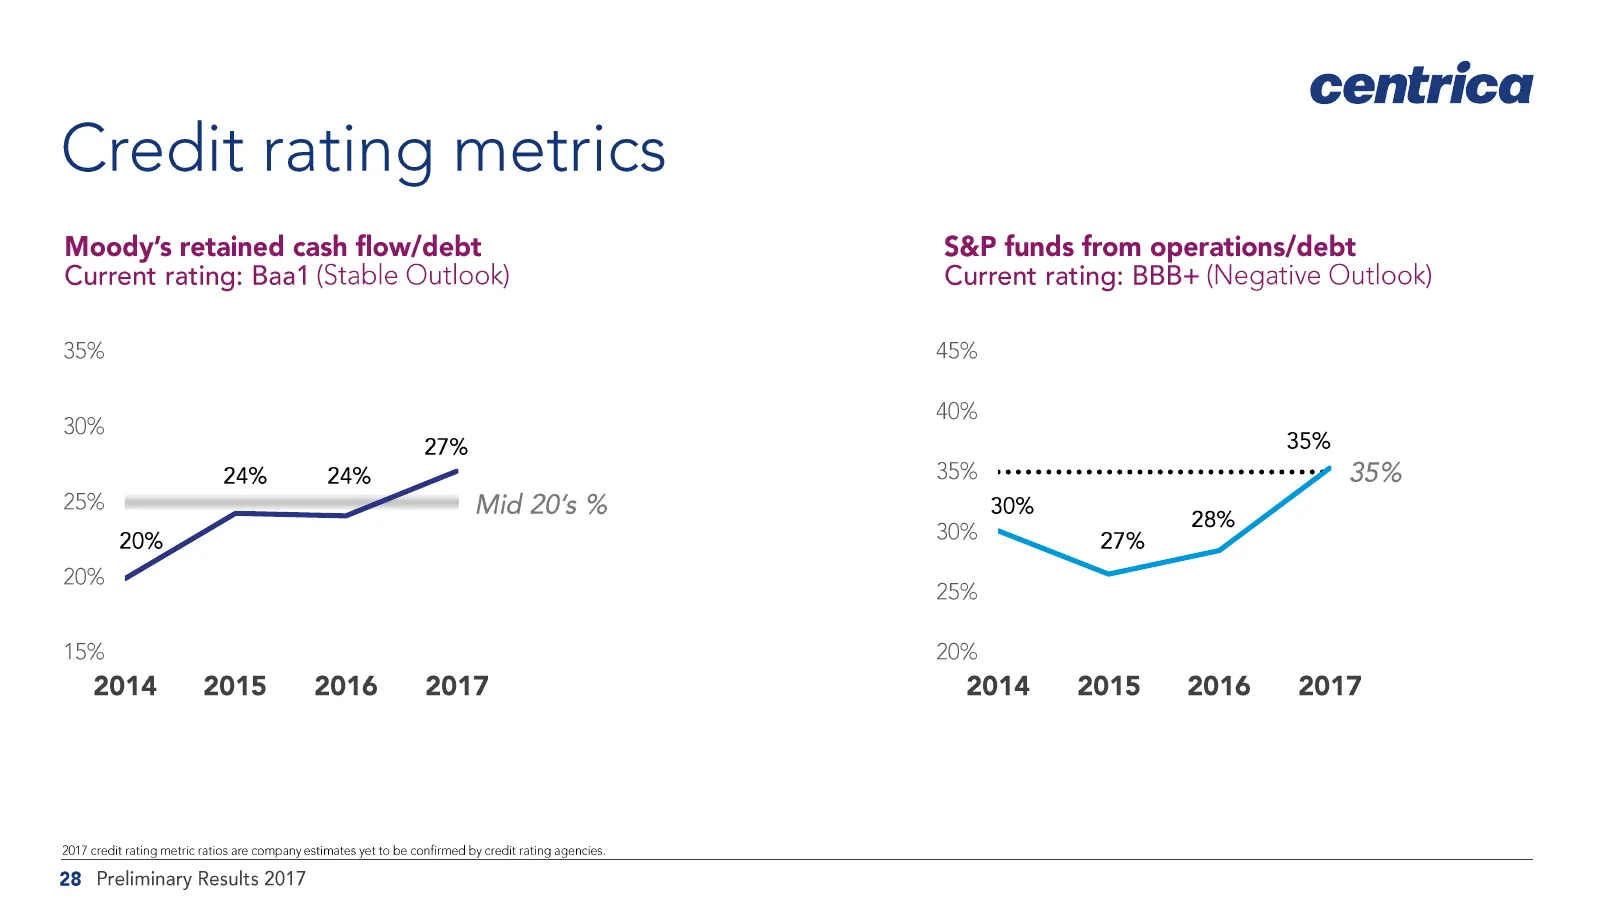
Credit rating metrics Moody's retained cash flow/debt Current rating: Baa1 (Stable Outlook) 35% 30% 27% 24% 24% 25% Mid 20's % 20% 20% 15% 2014 2015 2016 2017 2017 credit rating metric ratios are company estimates yet to be confirmed by credit rating agencies. centrica S&P funds from operations/debt
Slide 29: centrica
centrica
Slide 30: Important questions we will address today
centrica Important questions we will address today * Strategy: Are the components of the strategy right and how do they reinforce each other? * Cost efficiency: Potential to offset gross margin pressure and underpin financial confidence? * Resilience: In the face of competition and potential price c
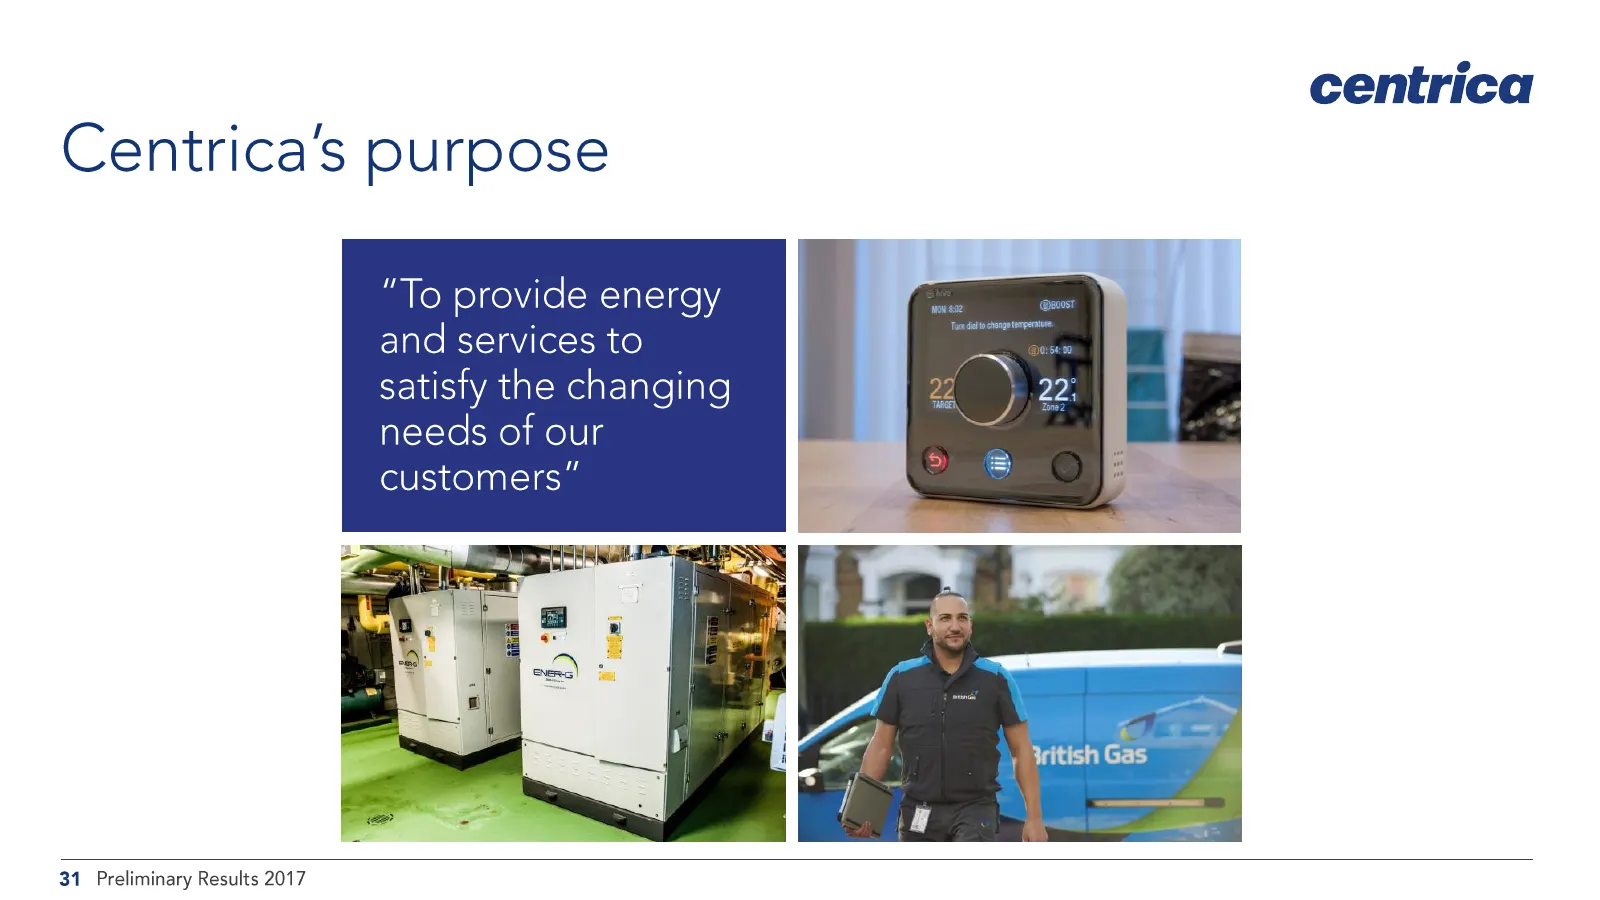
Slide 31: Centrica's purpose
Centrica's purpose “To provide energy and services to satisfy the changing needs of our customers” centrica 31. Preliminary Results 2017
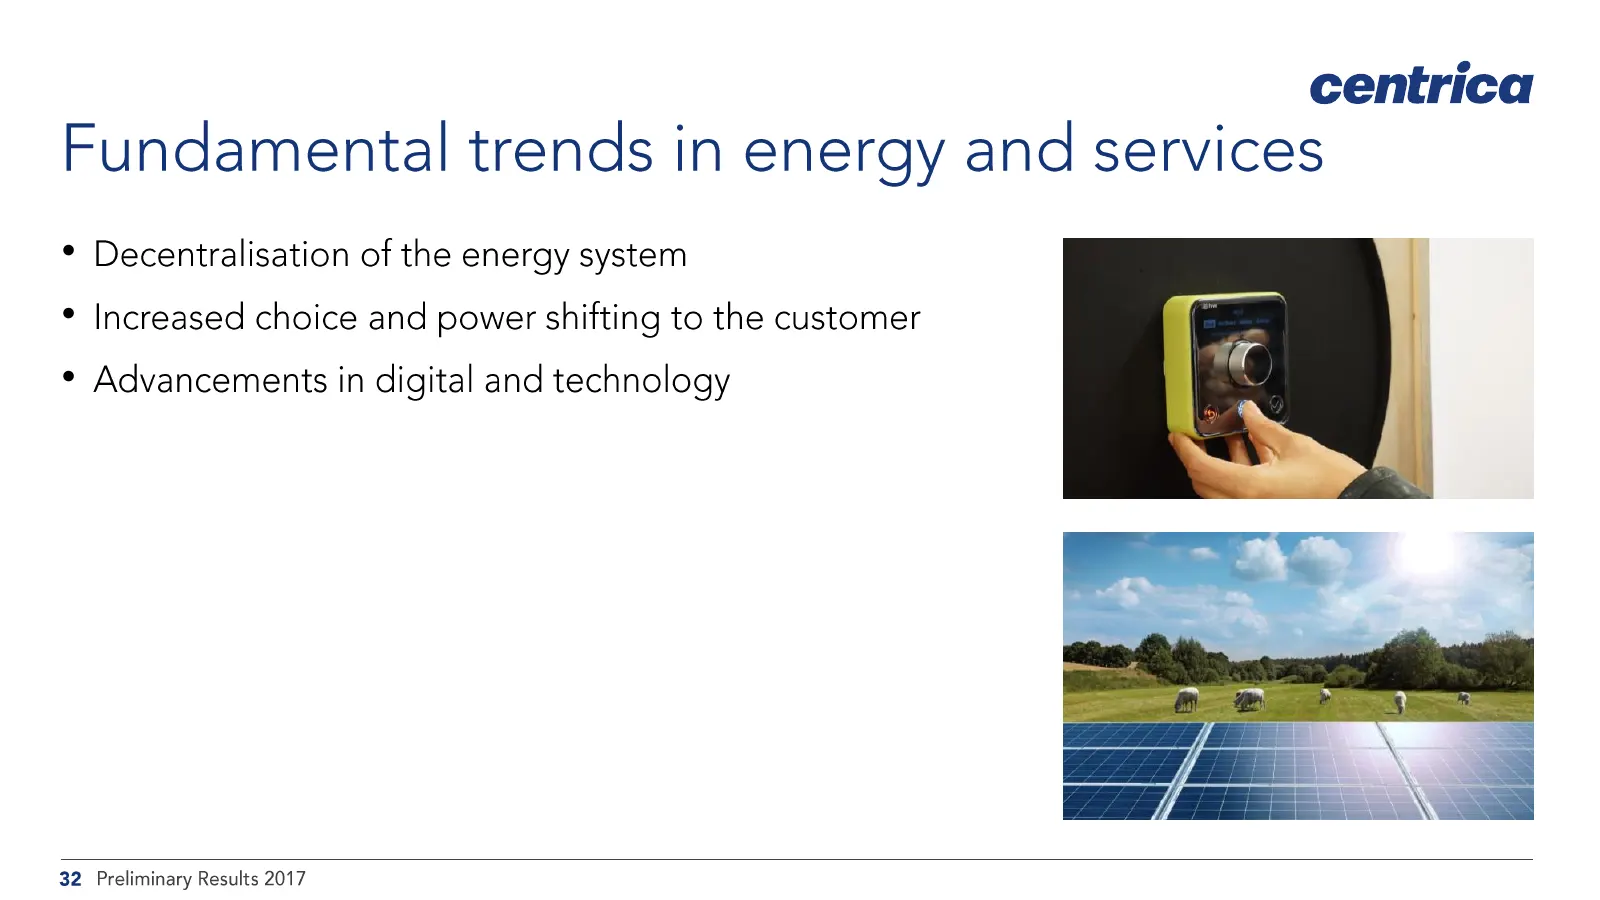
Slide 32: Fundamental trends in energy and services
centrica Fundamental trends in energy and services * Decentralisation of the energy system * Increased choice and power shifting to the customer * Advancements in digital and technology 32. Preliminary Results 2017
Slide 33: Centrica's strategy
centrica Centrica’s strategy * Energy and services company * Deliver for the changing needs of our customers * Delivering long-term shareholder value through returns and growth * Trusted corporate citizen * Employer of choice * ‘21st Century energy and services company’ 33 Preliminary Results 2017
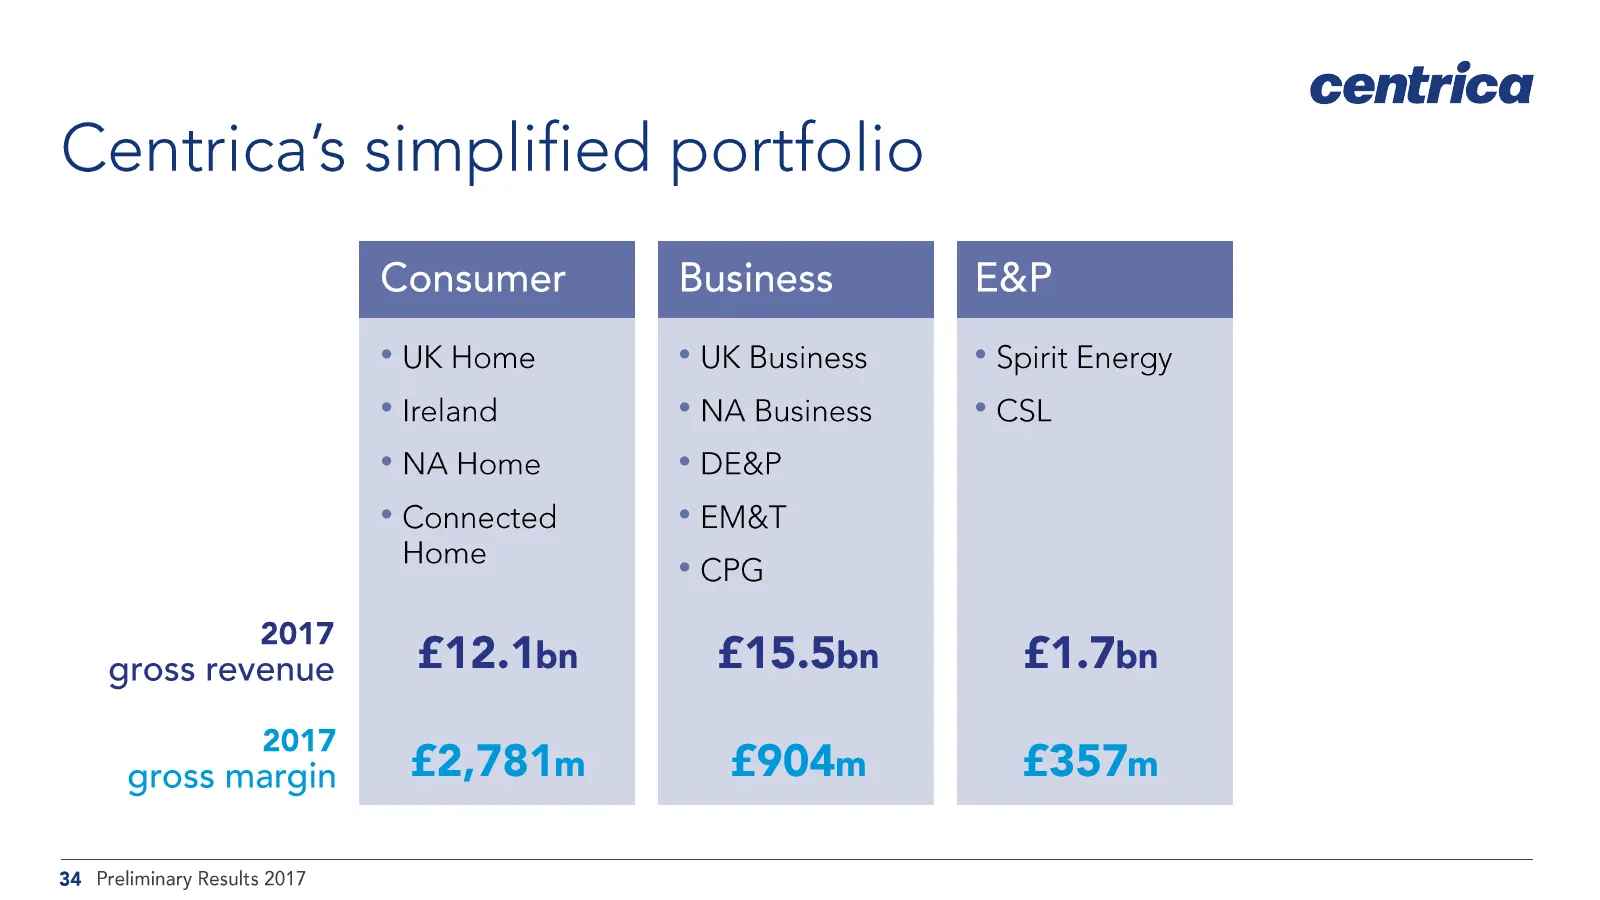
Slide 34: Centrica's simplified portfolio
Centrica’s simplified portfolio ° UK Home * Ireland ° NA Home * Connected Home 2017 -£12.1bn gross revenue 2017 £2,781m gross margin ° UK Business ° Spirit Energy * NA Business ° CSL ° DE&P ° EM&T °* CPG £15.5bn £1.7bn £904m £357m centrica 34 Preliminary Results 2017
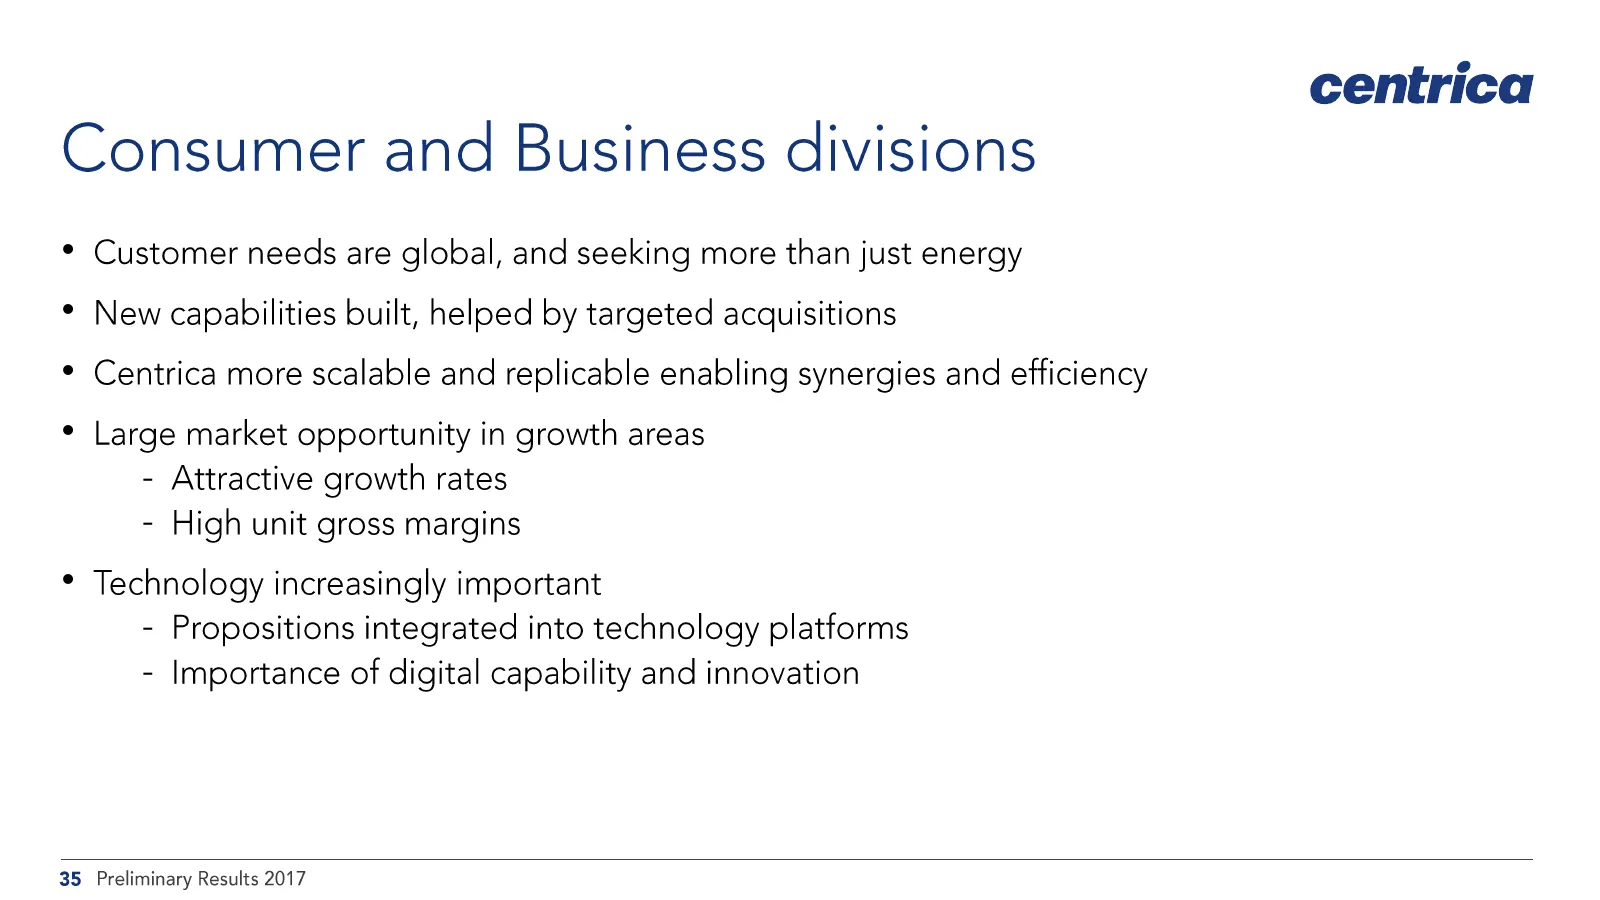
Slide 35: Consumer and Business divisions
Consumer and Business divisions * Customer needs are global, and seeking more than just energy * New capabilities built, helped by targeted acquisitions * Centrica more scalable and replicable enabling synergies and efficiency * Large market opportunity in growth areas - Attractive growth rates - Hi
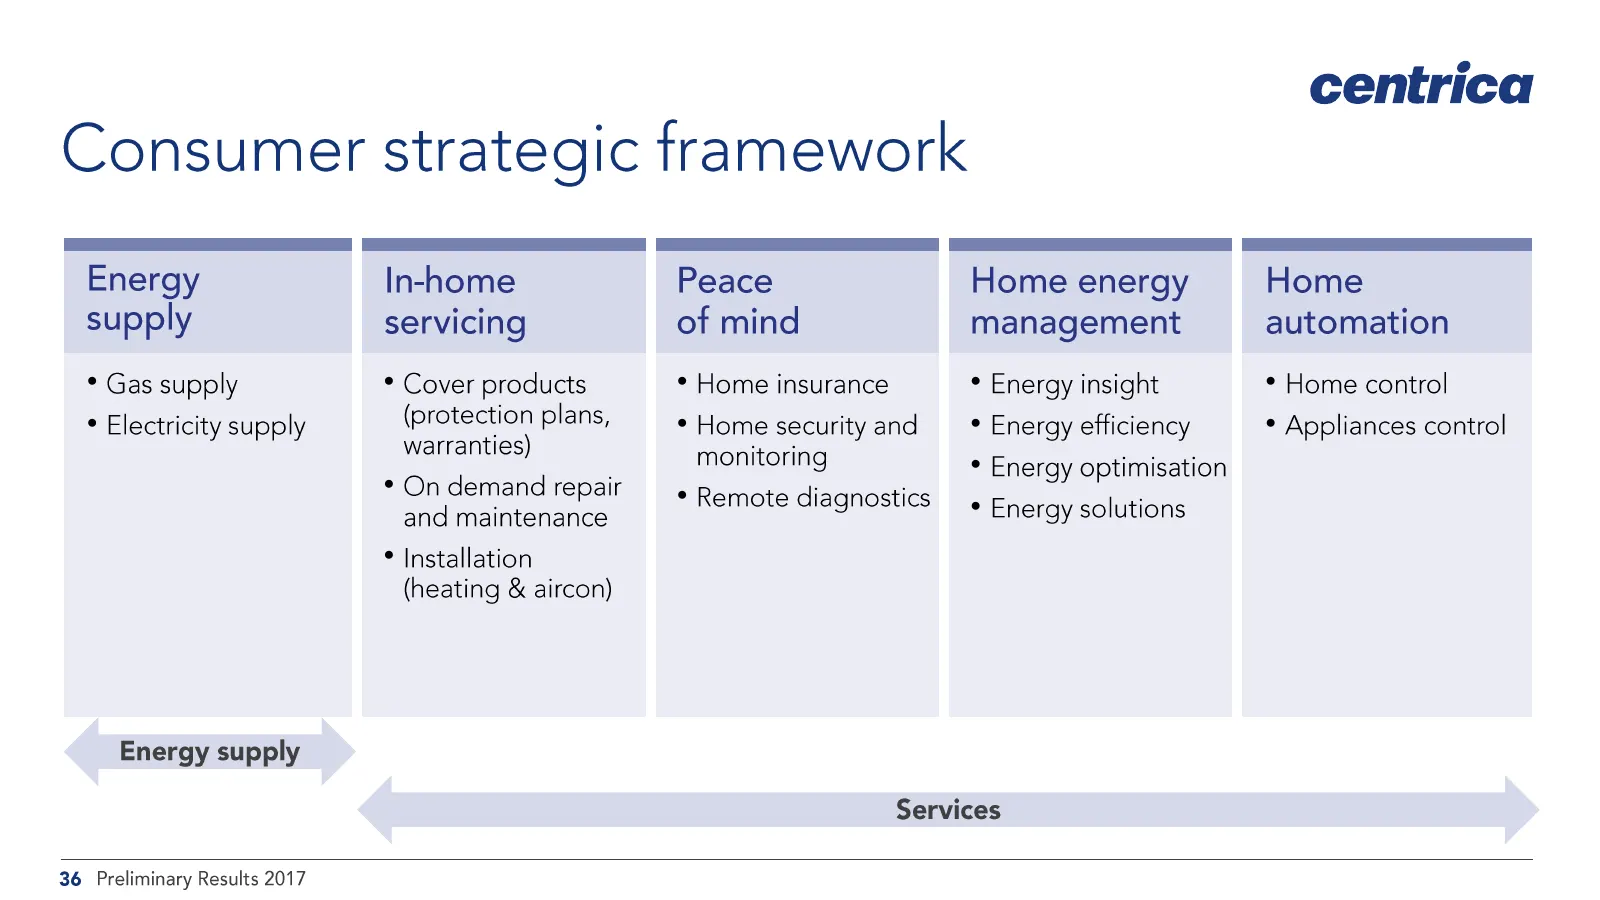
Slide 36: Consumer strategic framework
Consumer strategic framework Energy supply * Gas supply * Electricity supply Energy supply ee In-home Peace Home energy servicing of mind management * Cover products * Home insurance * Energy insight (protection plans, * Home securityand —* Energy efficiency warranties) monitoring ee * Energy optimi
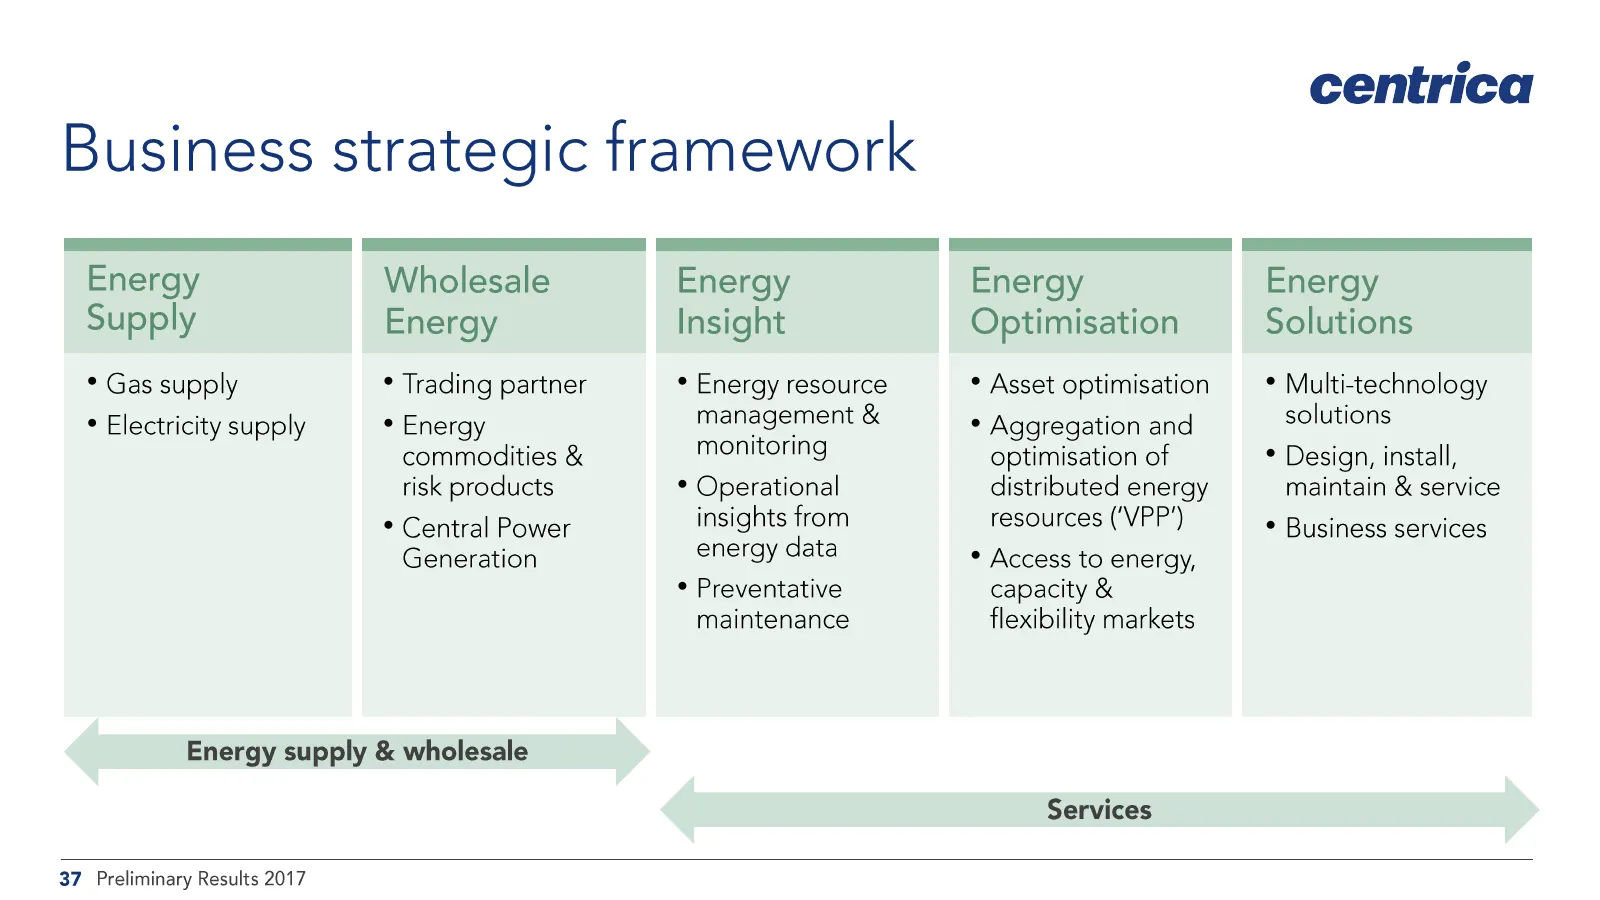
Slide 37: Business strategic framework
centrica Business strategic framework ee Energy Wholesale Energy Energy Energy Supply Energy Insight Optimisation Solutions * Gas supply * Trading partner * Energy resource * Asset optimisation * Multi-technology * Electricity supply * Energy management & * Aggregation and solutions commodities & mo
Slide 38: First phase of strategic repositioning complete
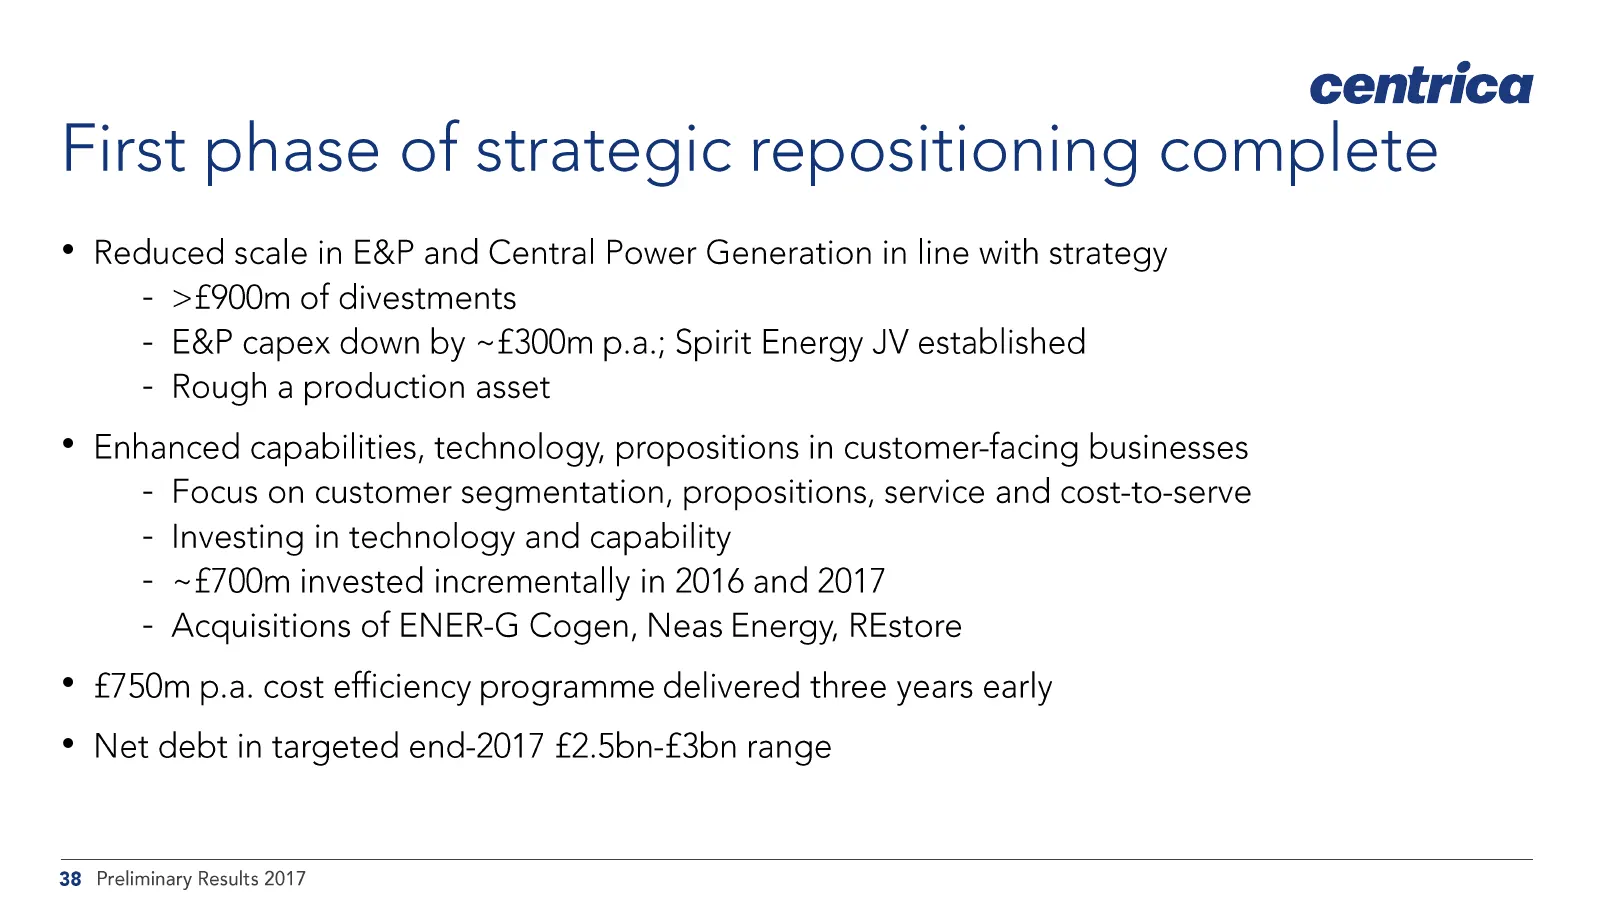
centrica First phase of strategic repositioning complete * Reduced scale in E&P and Central Power Generation in line with strategy - >£900m of divestments - E&P capex down by ~£300m p.a.; Spirit Energy JV established - Rough a production asset * Enhanced capabilities, technology, propositions in cus
Slide 39: Next phase - priorities for performance delivery
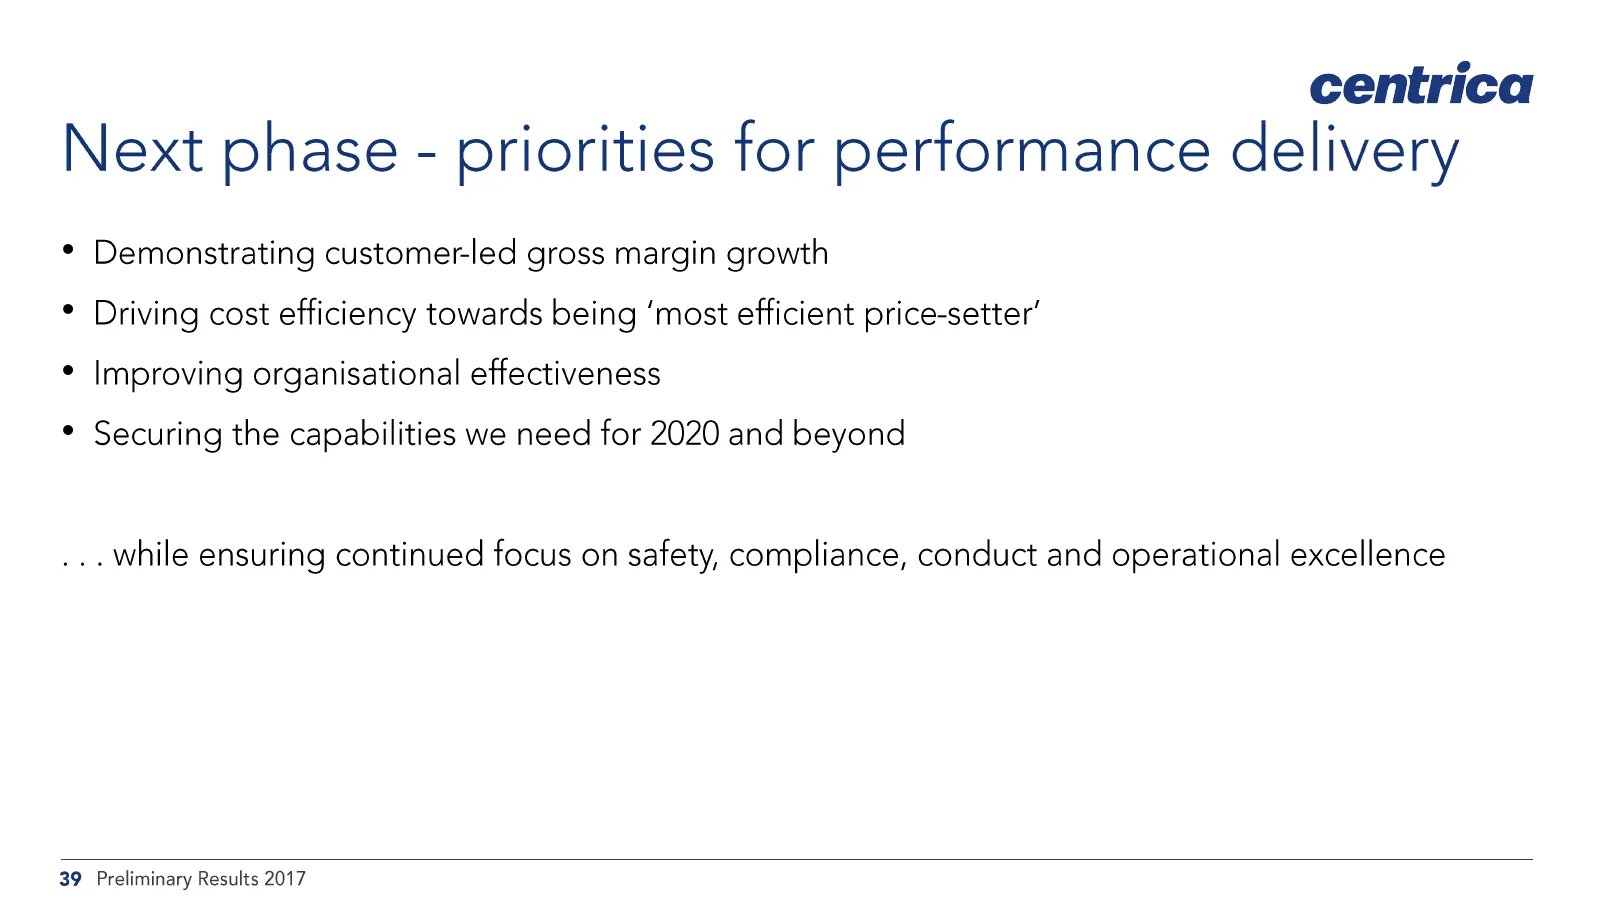
centrica Next phase - priorities for performance delivery * Demonstrating customerled gross margin growth * Driving cost efficiency towards being ‘most efficient price-setter’ * Improving organisational effectiveness * Securing the capabilities we need for 2020 and beyond ... while ensuring continue
Slide 40: £1.25bn per annum of cost efficiency 2015-20
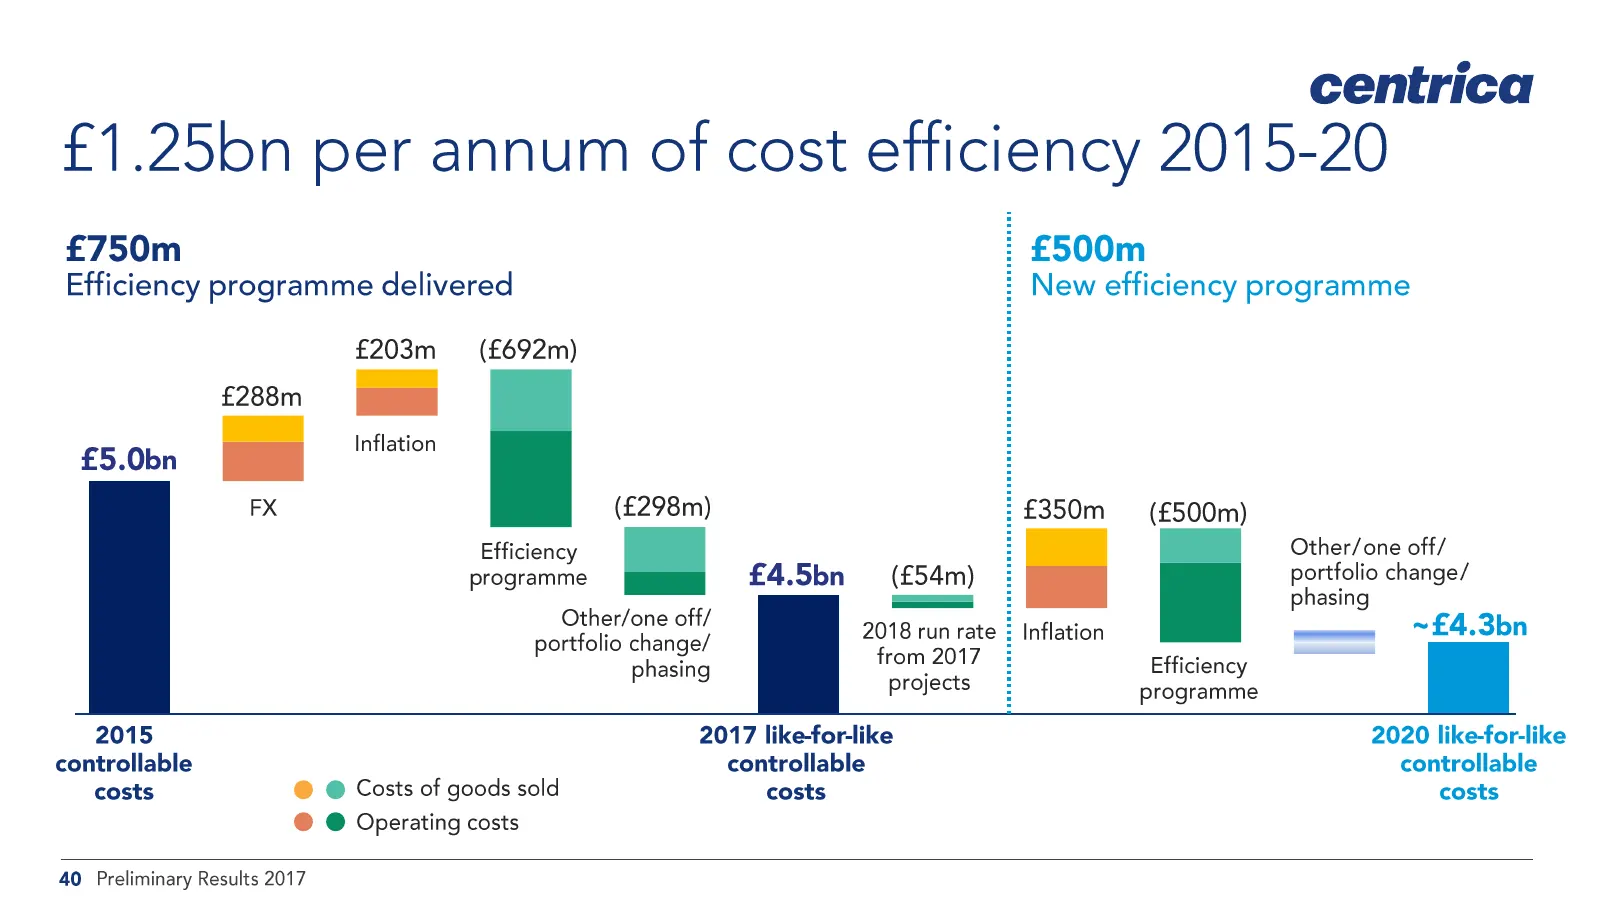
£1.25bn per annum of cost efficiency 2015-20 £750m Efficiency programme delivered £203m = (£692m) | £5.0bn i Inflation : £500m i New efficiency programme centrica FX (£298m) i £350m = (£500m) Efficiency : Other/one off/ programme £4.5bn = (£54m) portfolio change/ —=as—i i phasing oOther/one off) 201
Slide 41: New cost efficiency programme 2018-20
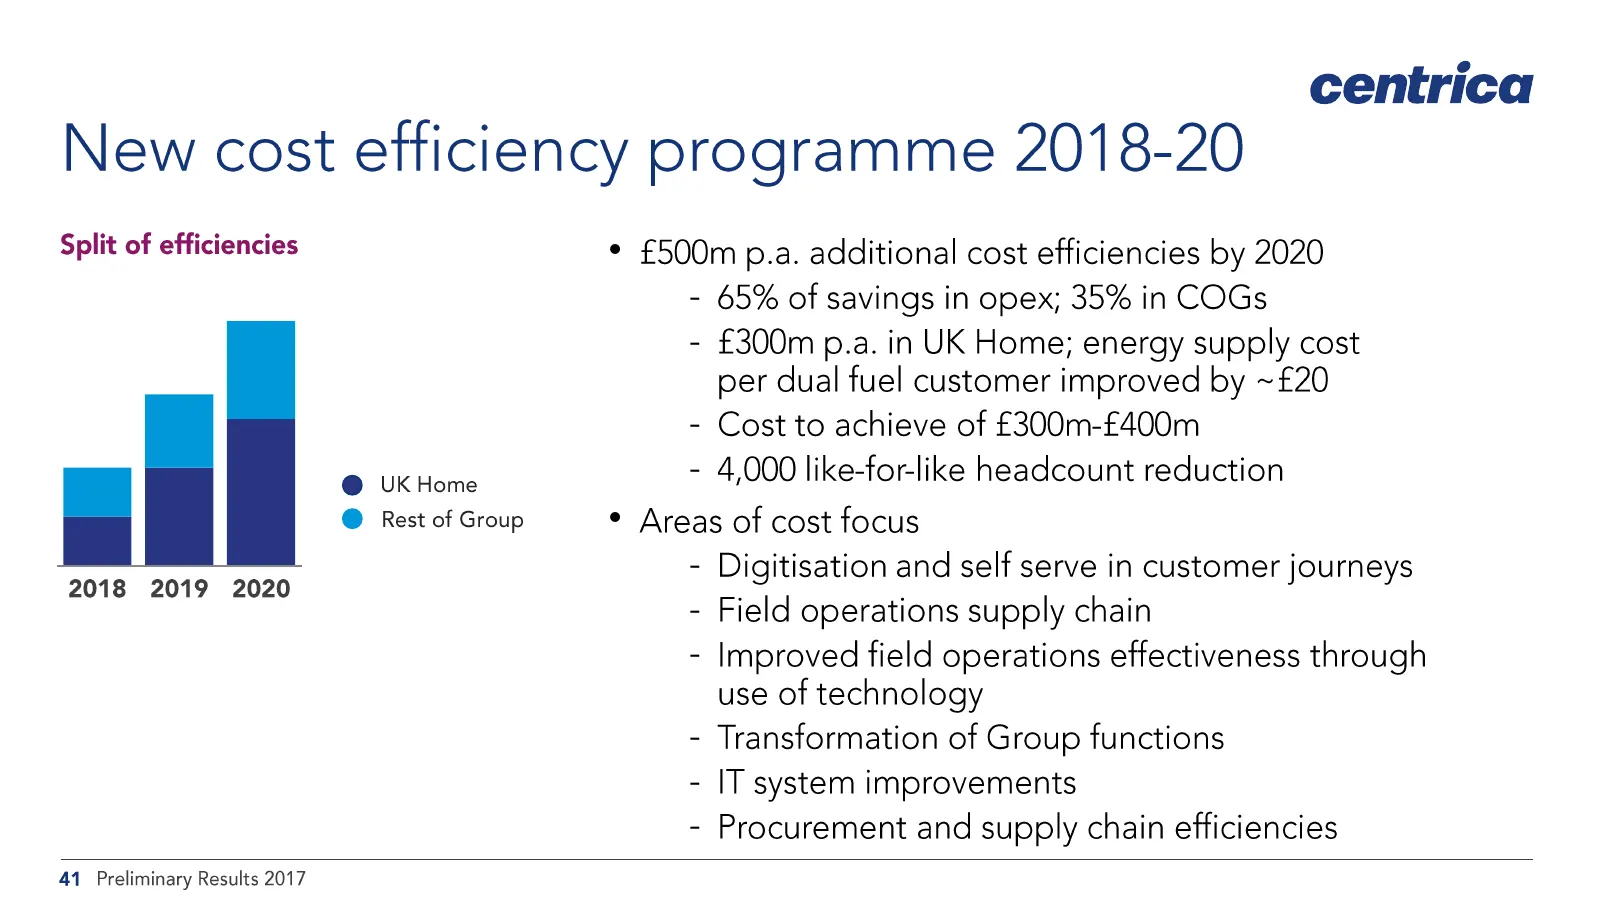
centrica New cost efficiency programme 2018-20 Split of efficiencies * £500m p.a. additional cost efficiencies by 2020 @ UK Home 2018 2019 2020 65% of savings in opex; 35% in COGs £300m p.a. in UK Home; energy supply cost per dual fuel customer improved by ~£20 Cost to achieve of £300m-£400m 4,000 l
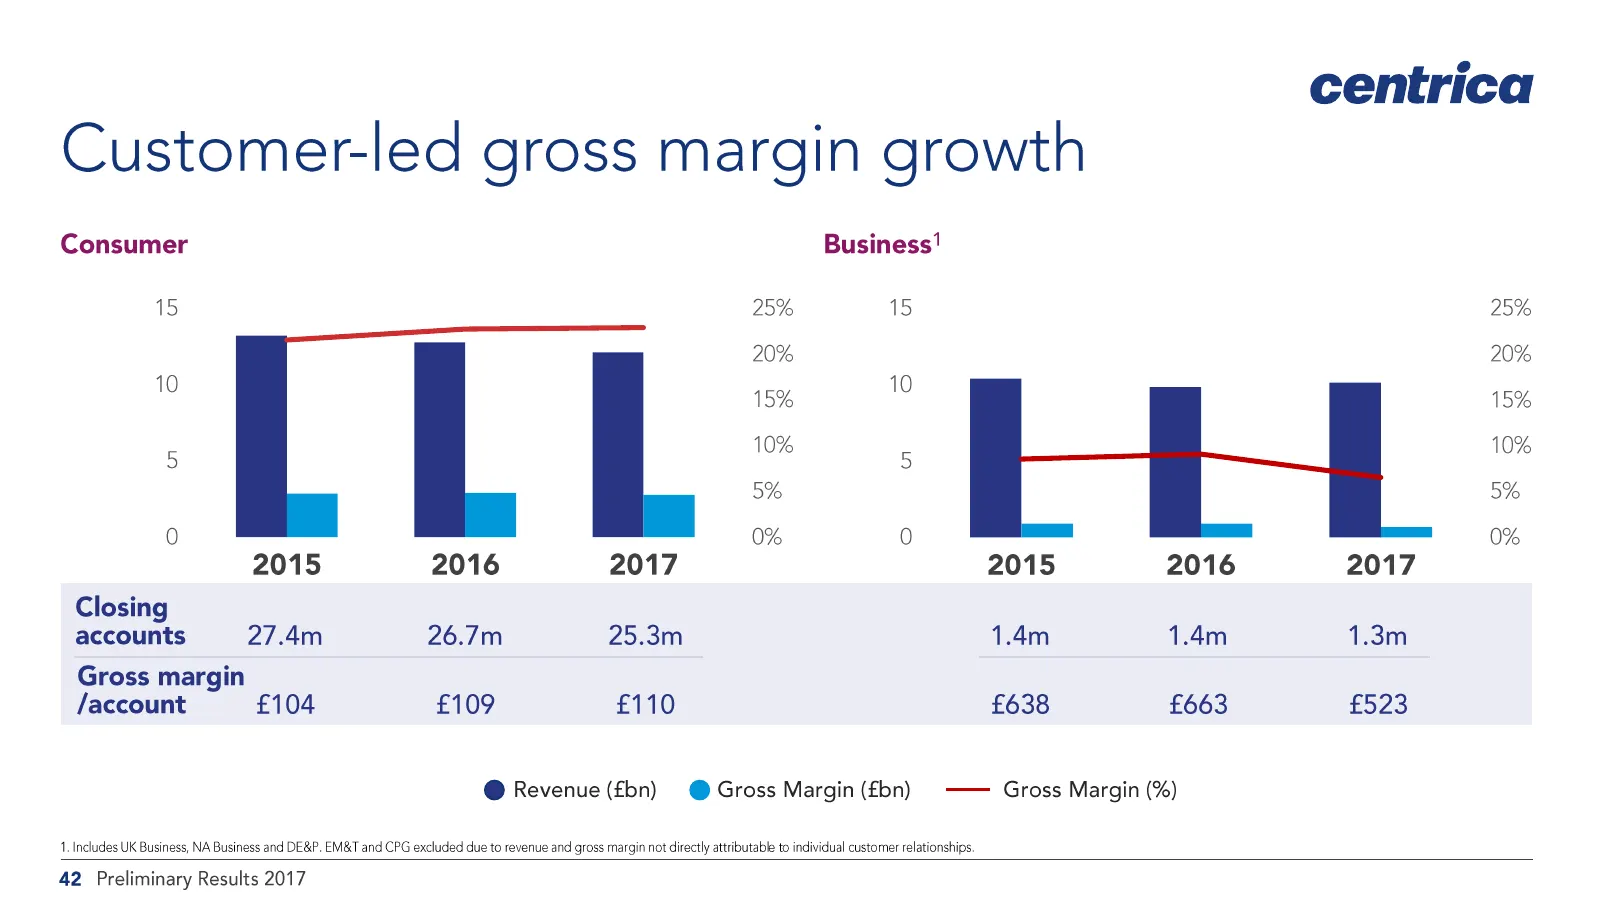
Slide 42: Customer-led gross margin growth
centrica Customer-led gross margin growth Consumer Business’ 15 25% 15 25% 20% 20% 10 15% 10 15% 5 10% 5 10% 5% 5% 0 0% 0 0% 2015 2016 2017 2015 2016 2017 Closing accounts 27.4m 26.7m 25.3m 1.4m 1.4m 1.3m Gross margin /account £104 £109 £110 £638 £663 FSy23} @ Revenue (fbn) @ Gross Margin (fbn) © ——
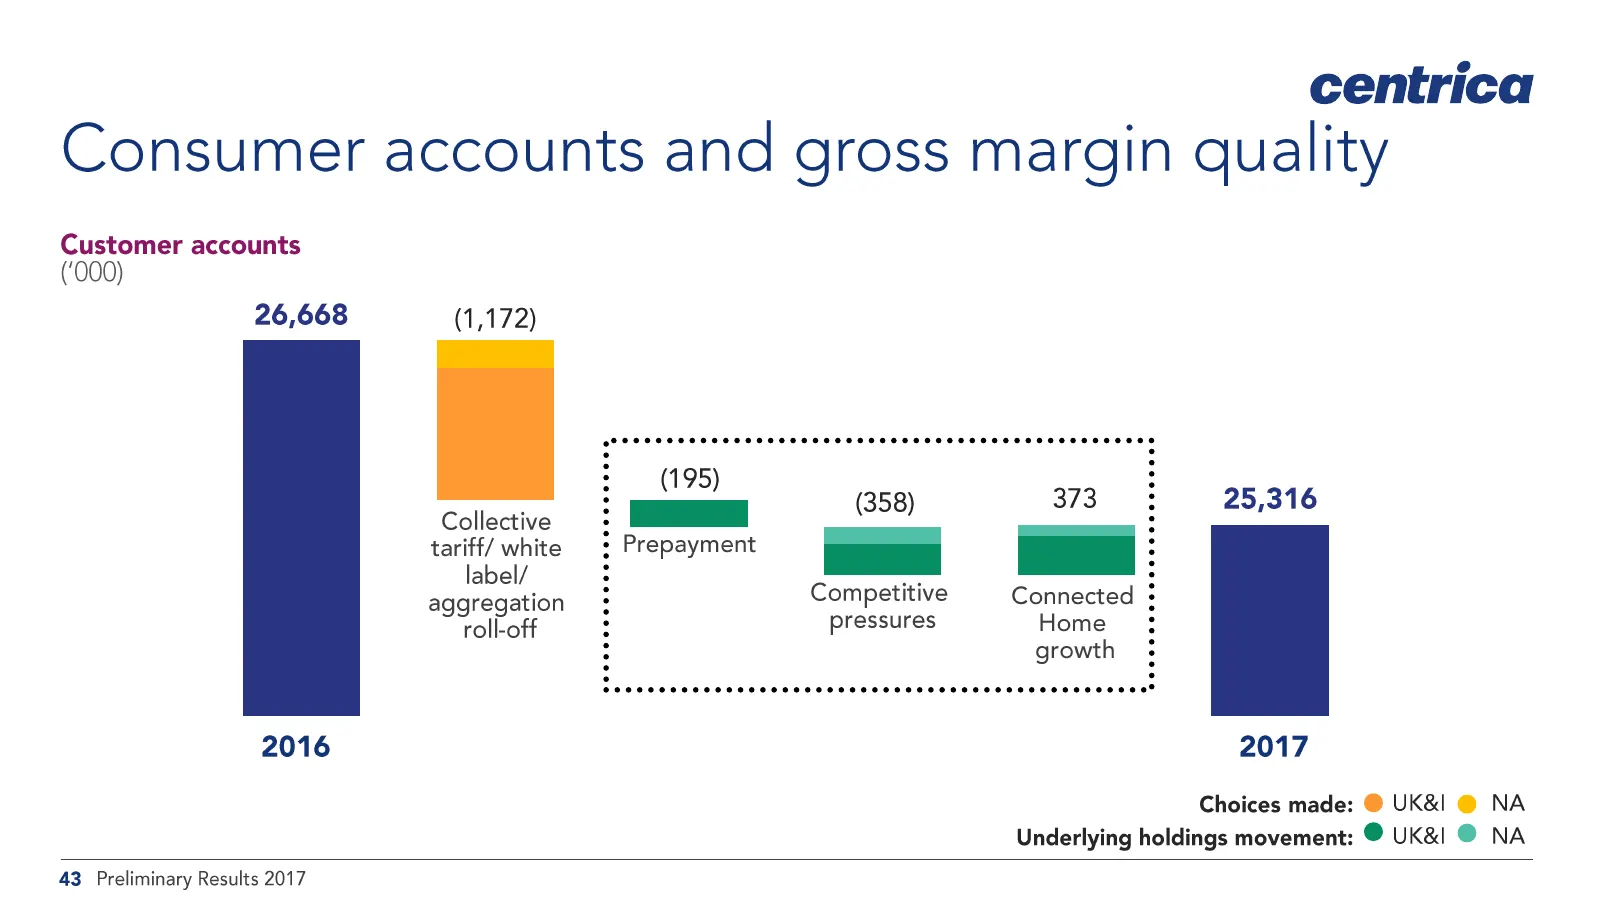
Slide 43: Consumer accounts and gross margin quality
centrica Consumer accounts and gross margin quality Customer accounts ('000) 26,668 (1,172) Collective tariff/ white label/ aggregation roll-off 2016 2 (195) (358) : : Prepayment _ Competitive pressures 373} 25,316 Connected : Home growth 2017 Choices made: ® UK&l @ NA Underlying holdings movement:
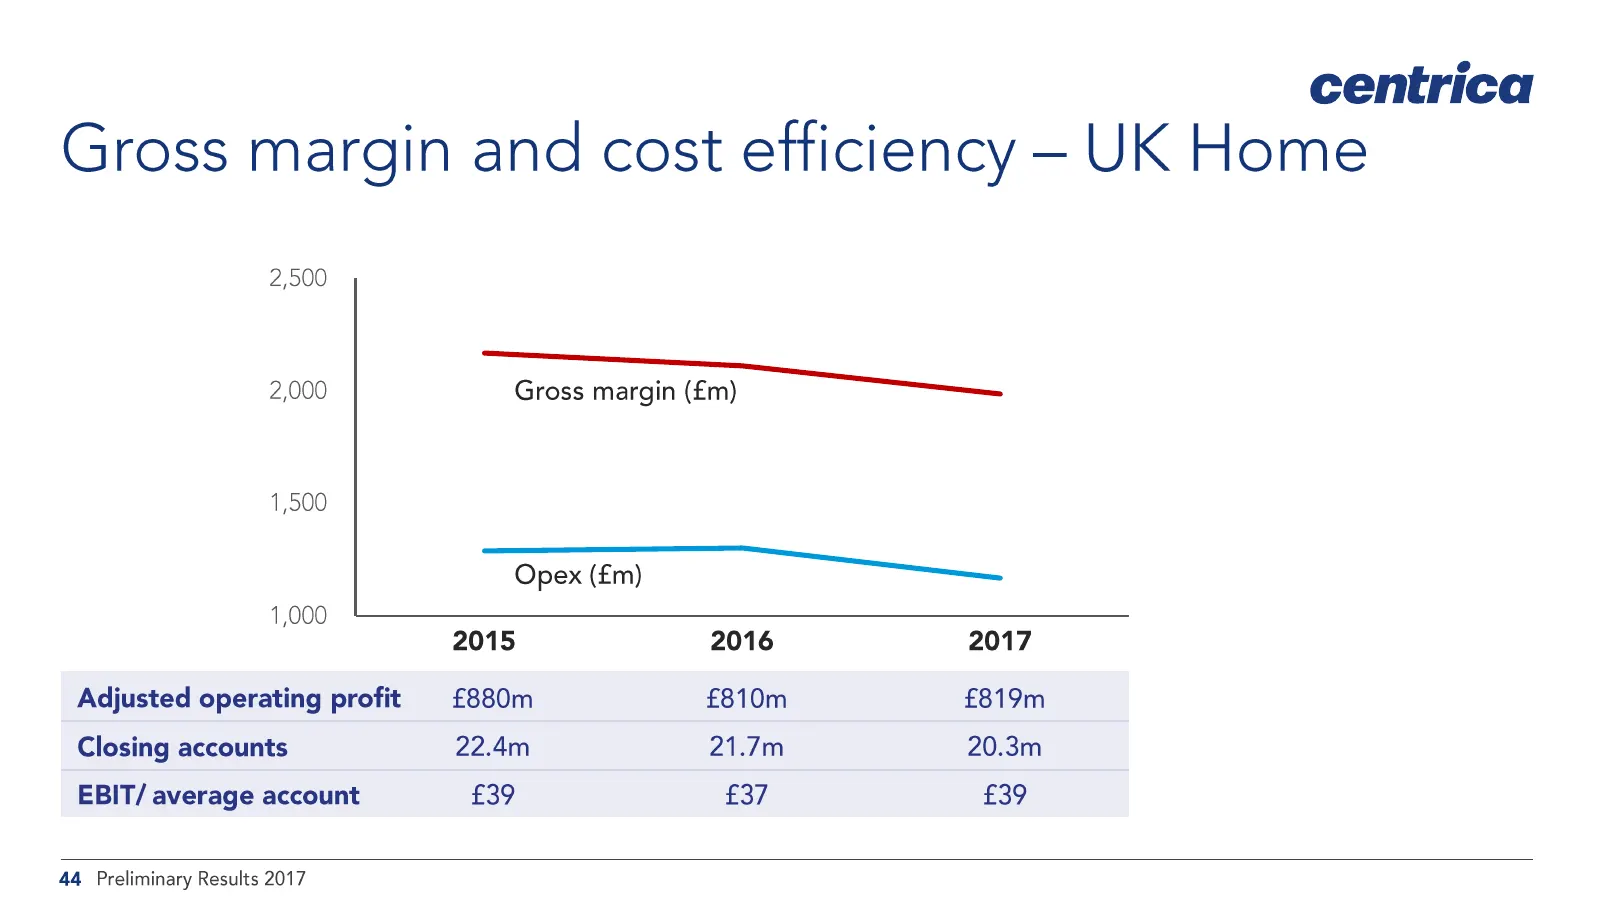
Slide 44: Gross margin and cost efficiency - UK Home
centrica Gross margin and cost efficiency - UK Home 2,500 2,000 Gross margin (£m) 1,500 Opex (£m) 1,000 2015 2016 2017 Adjusted operating profit | £880m £810m £819m Closing accounts 22.4m 21.7m 20.3m EBIT/ average account £39 £37 £39 44 Preliminary Results 2017
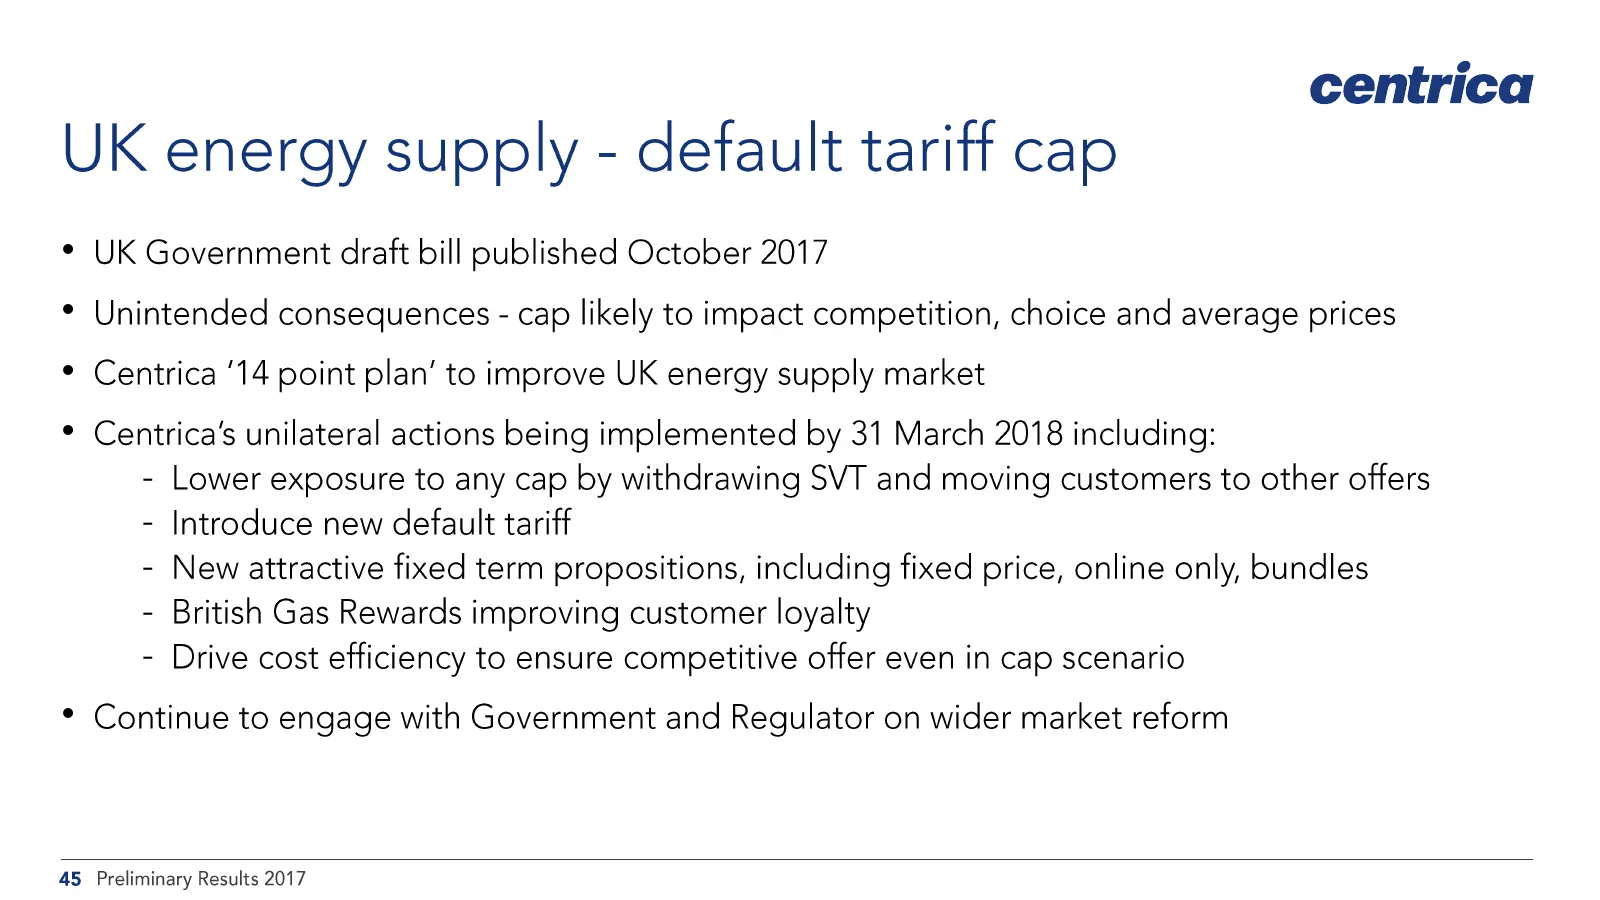
Slide 45: UK energy supply - default tariff cap
centrica UK energy supply - default tariff cap UK Government draft bill published October 2017 Unintended consequences - cap likely to impact competition, choice and average prices * Centrica '14 point plan’ to improve UK energy supply market * Centrica’s unilateral actions being implemented by 31 M
Slide 46: Exposure to UK default tariff cap risk
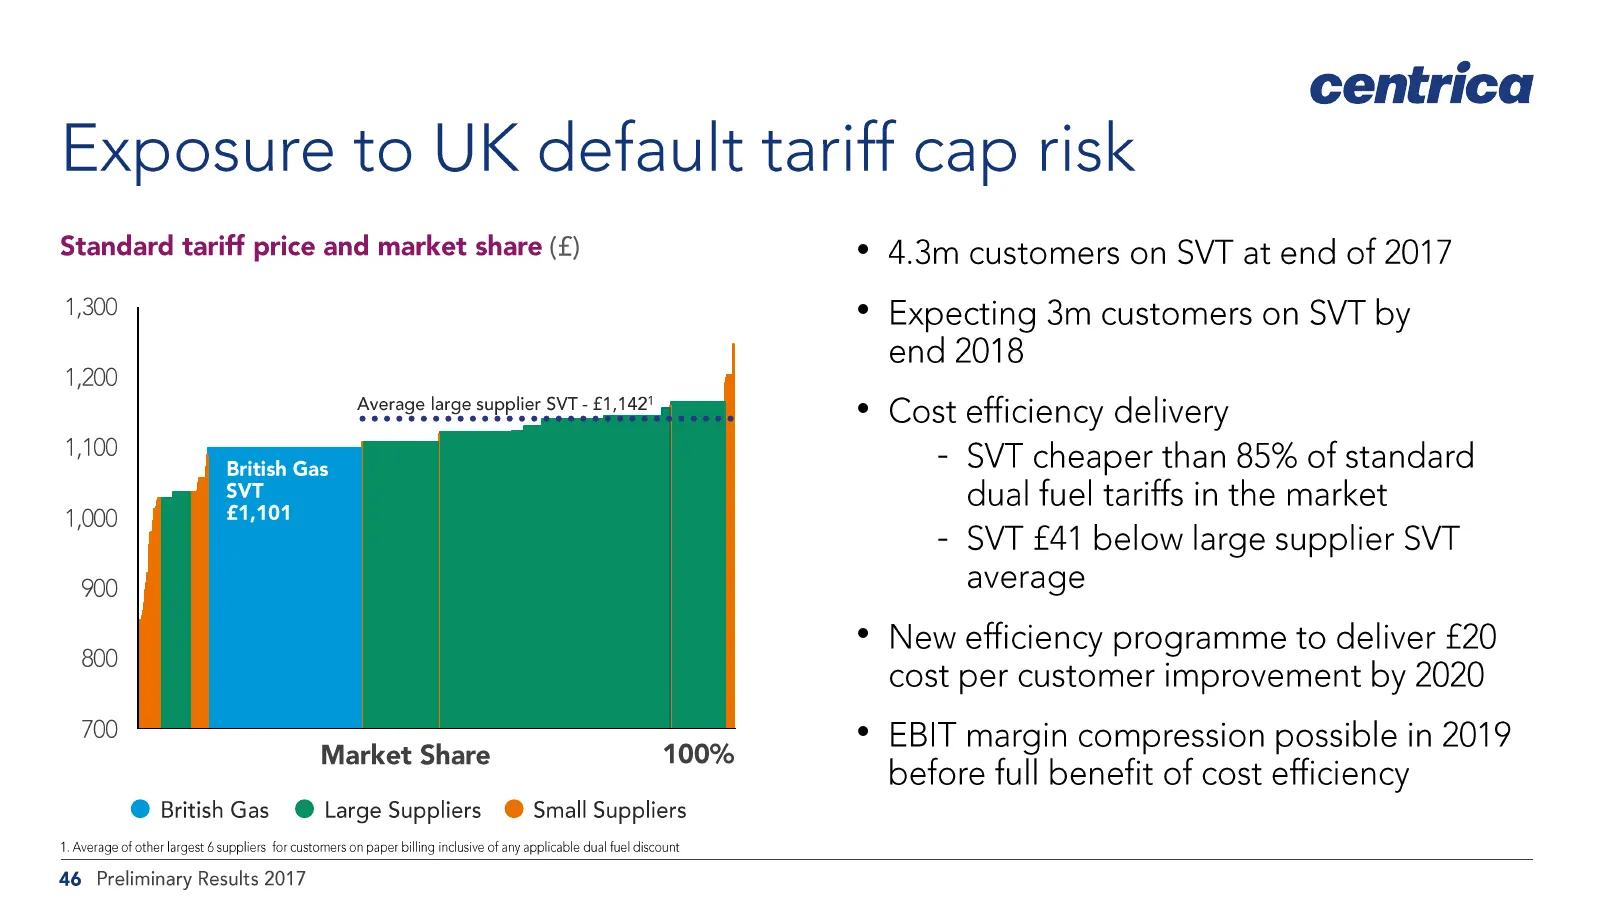
centrica Exposure to UK default tariff cap risk Standard tariff price and market share (£) 4.3m customers on SVT at end of 2017 1,300 * Expecting 3m customers on SVT by end 2018 1,200 Nerage Sige et ee * Cost efficiency delivery 1,100 Times - SVT cheaper than 85% of standard dual fuel tariffs in the
Slide 47: British Gas household bills and profits
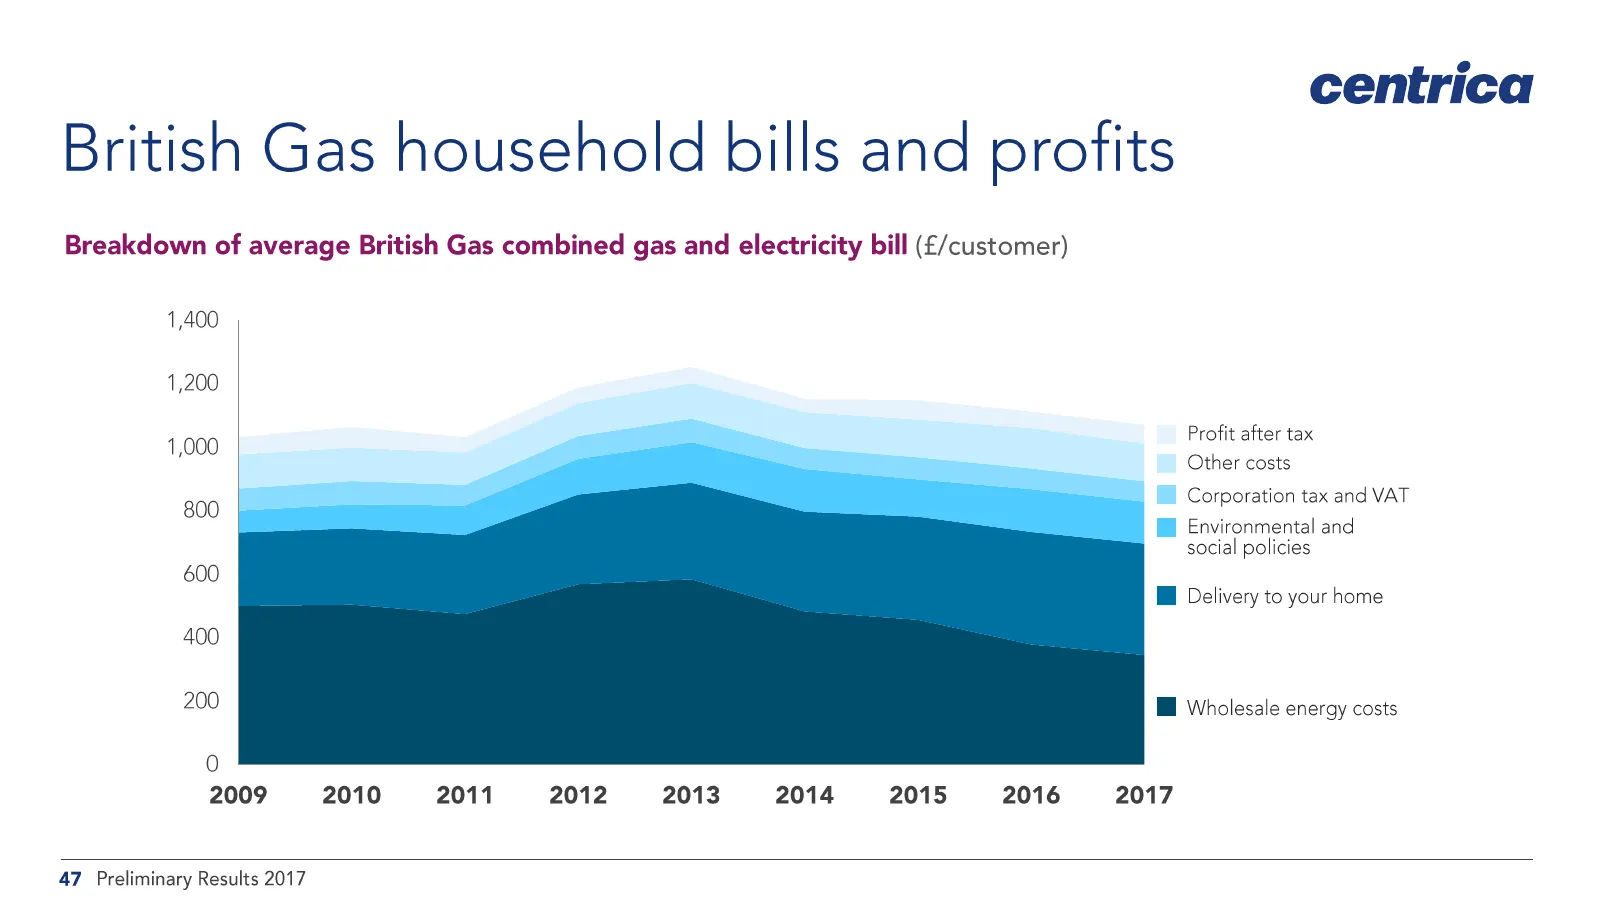
centrica British Gas household bills and profits Breakdown of average British Gas combined gas and electricity bill (£/customer) 1,400 1,200 Profit after tax 1,000 Other costs Corporation tax and VAT Mf Environmental and social policies 800 600 Il Delivery to your home HB Wholesale energy costs 2009
Slide 48: Consumer growth indicators
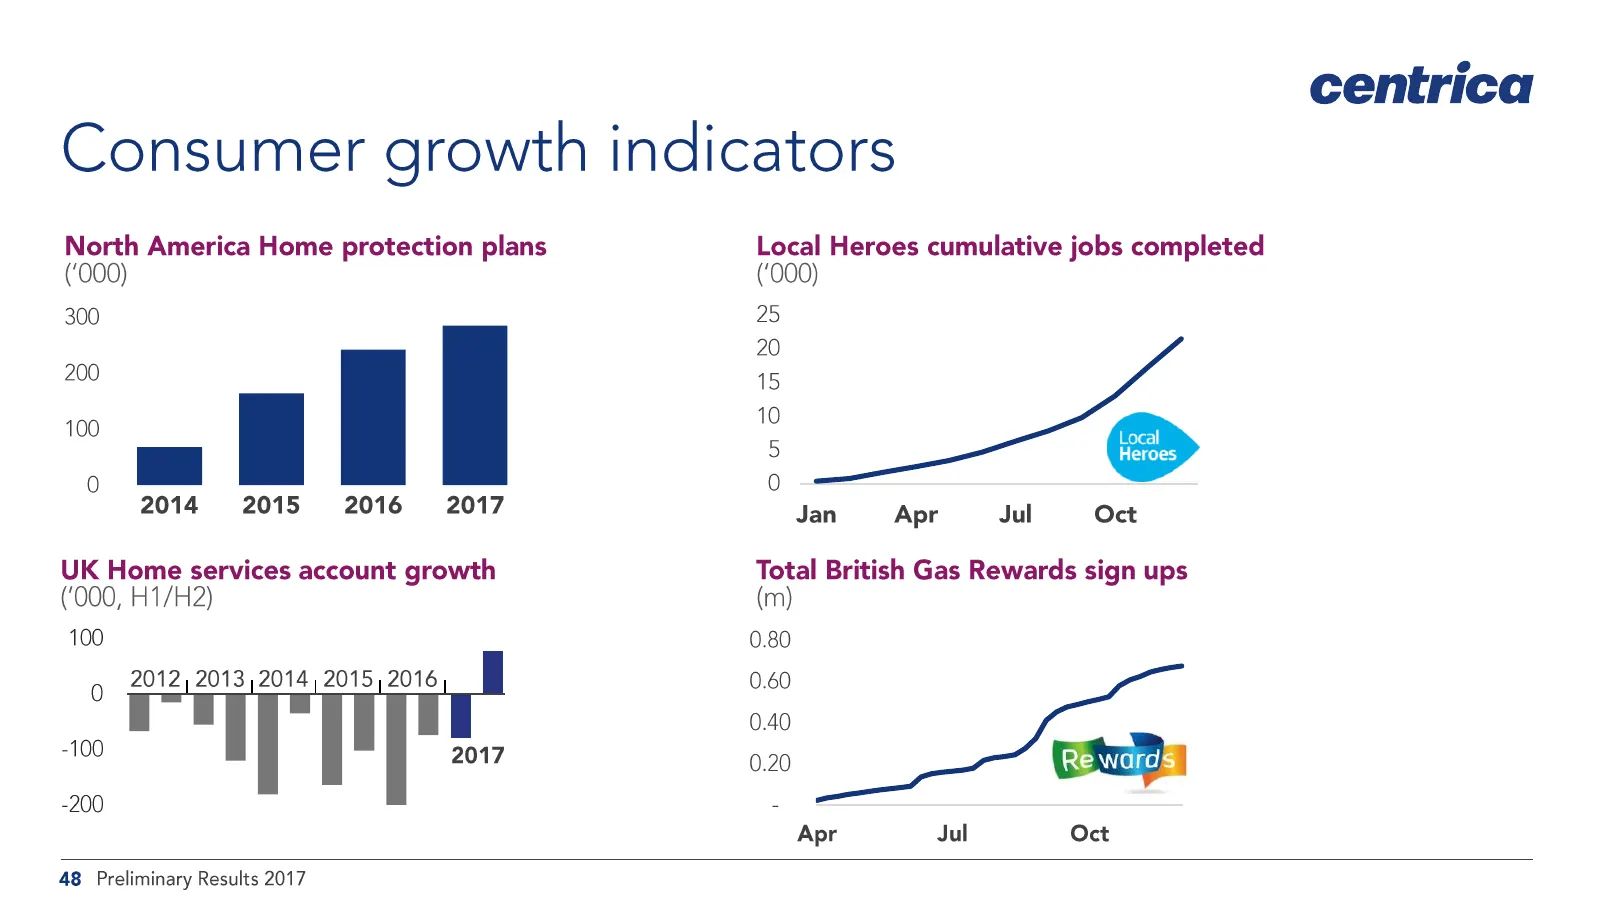
Consumer growth indicators North America Home protection plans ('000) 300 200 , 2014 2015 2016 2017 UK Home services account growth ('000, H1/H2) 100 2012; 2013 , 2014 | 2015, 2016 0 -100 2017 -200 Local Heroes cumulative jobs completed (‘000) 25 10 : o 0 Jan Apr Jul Oct Total British Gas Rewards si
Slide 49: Connected Home growth
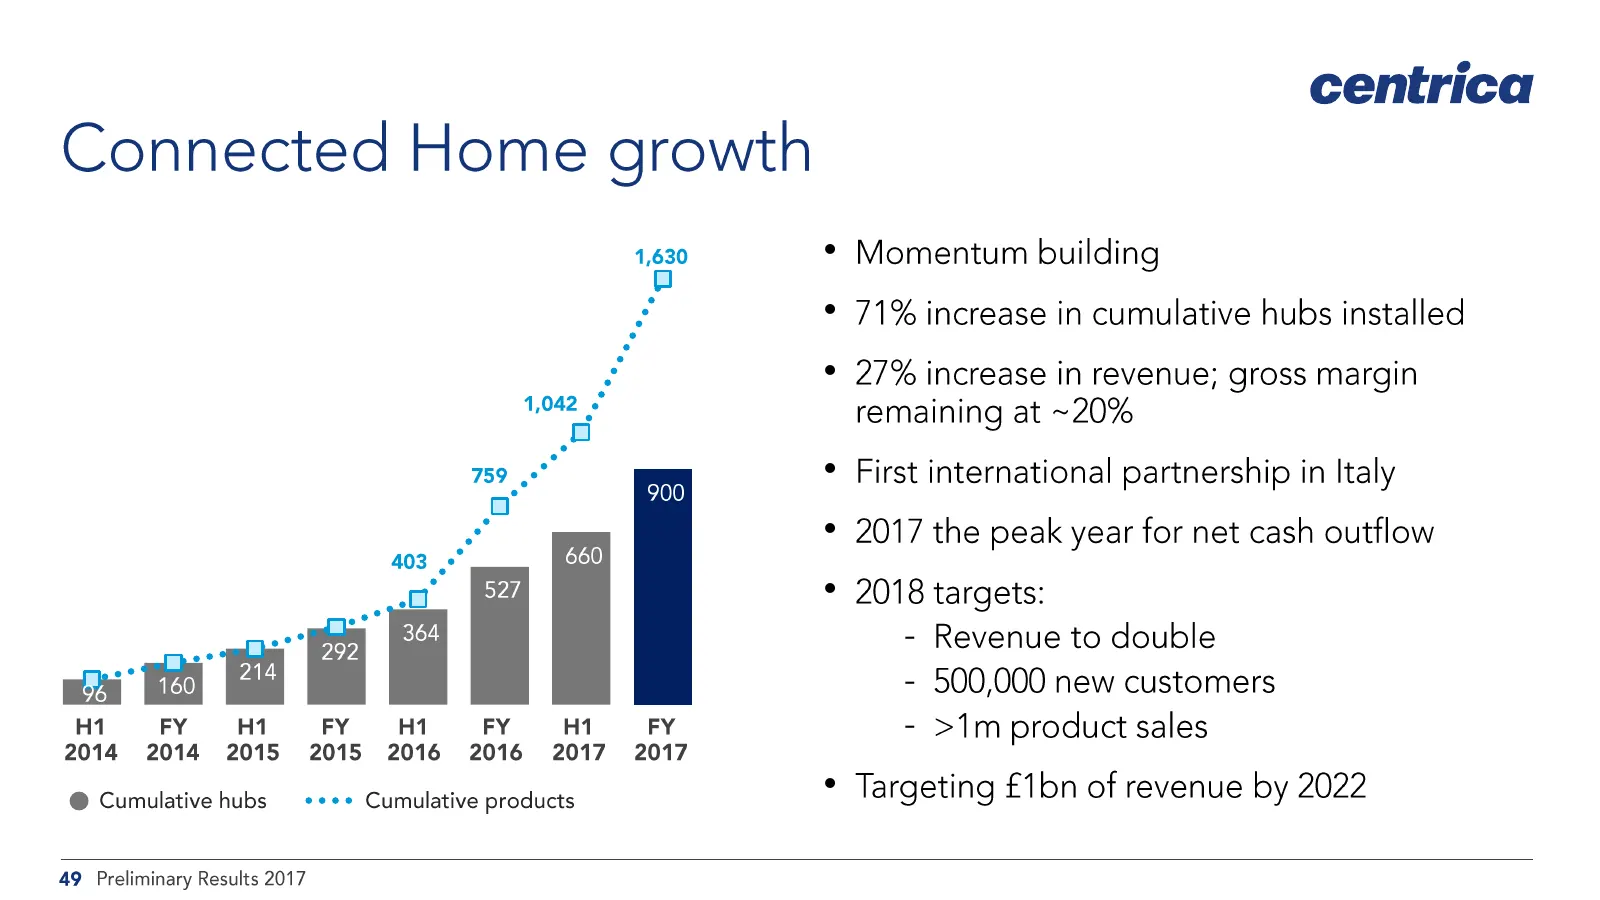
Connected Home growth 759 ,° 403 ,°" ia 64 a 527 FY H1 oe? = wi H1 FY H1 FY H1 2014 2014 2015 2015 2016 2016 2017 2017 @ Cumulative hubs = **** Cumulative products centrica Momentum building 71% increase in cumulative hubs installed 27% increase in revenue; gross margin remaining at ~20% First inter
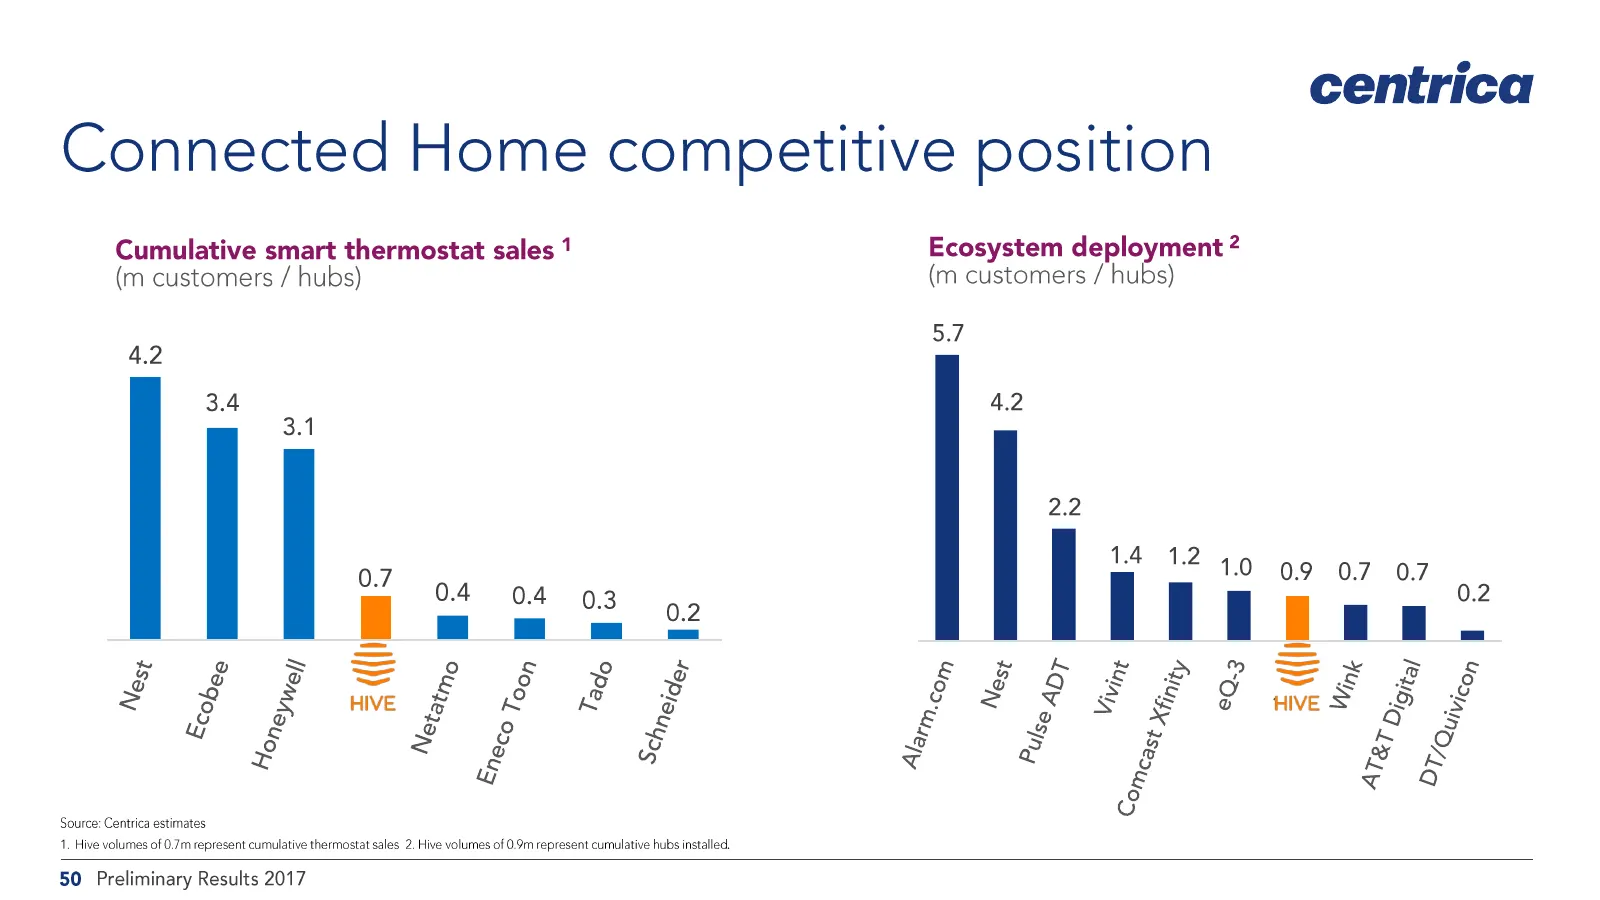
Slide 50: Connected Home competitive position
Connected Home competitive position Cumulative smart thermostat sales 1 (m customers / hubs) Source: Centrica estimates 1, Hive volumes of 0.7m represent cumulative thermostat sales 2, Hive volumes of 0.9m represent cumulative hubs installed, 0.4 | ° £ ed = Ecosystem deployment 2 (m customers / hubs
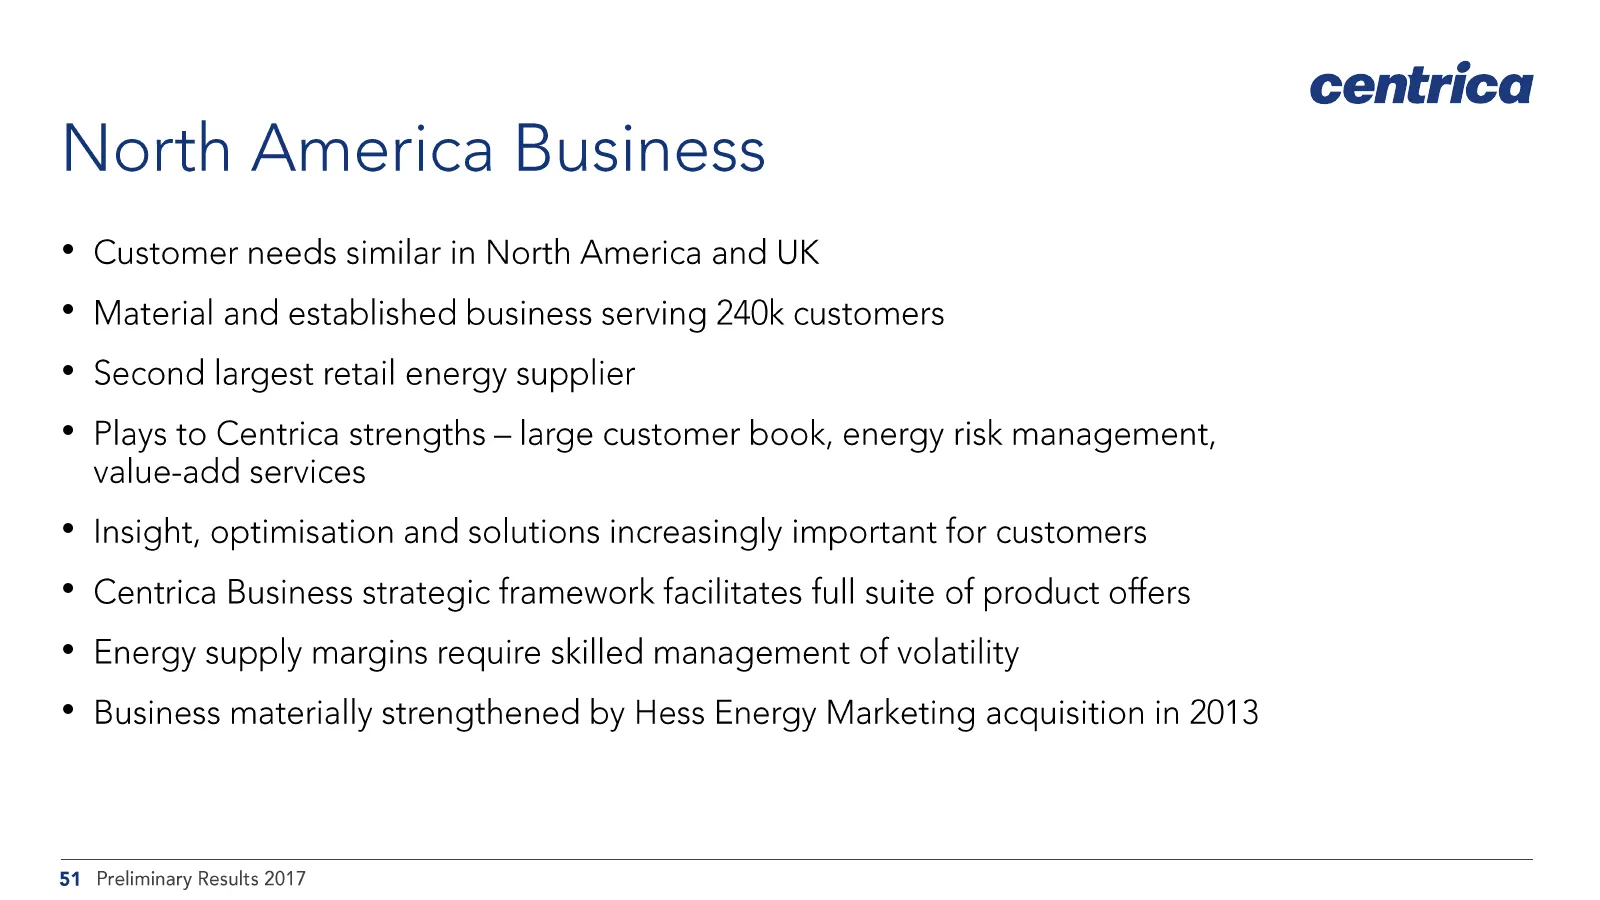
Slide 51: North America Business
centrica North America Business * Customer needs similar in North America and UK * Material and established business serving 240k customers * Second largest retail energy supplier * Plays to Centrica strengths — large customer book, energy risk management, value-add services * Insight, optimisation
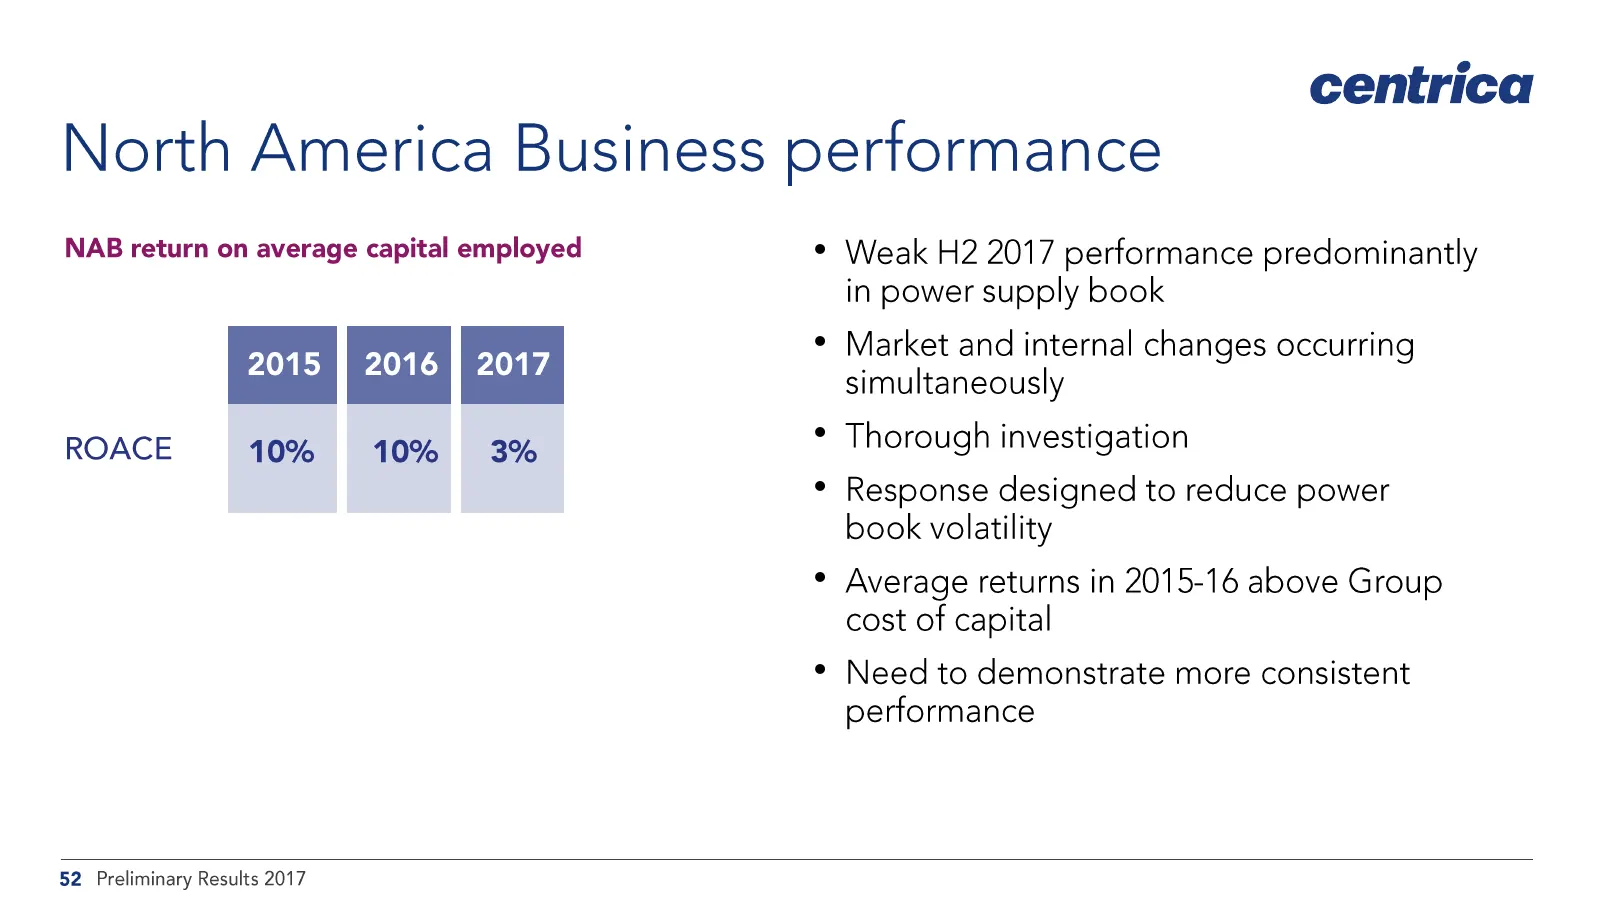
Slide 52: North America Business performance
centrica North America Business performance NAB return on average capital employed * Weak H2 2017 performance predominantly in power supply book 2017 Market and internal changes occurring simultaneously ROACE 10% 10% 3% * Thorough investigation * Response designed to reduce power book volatility * A
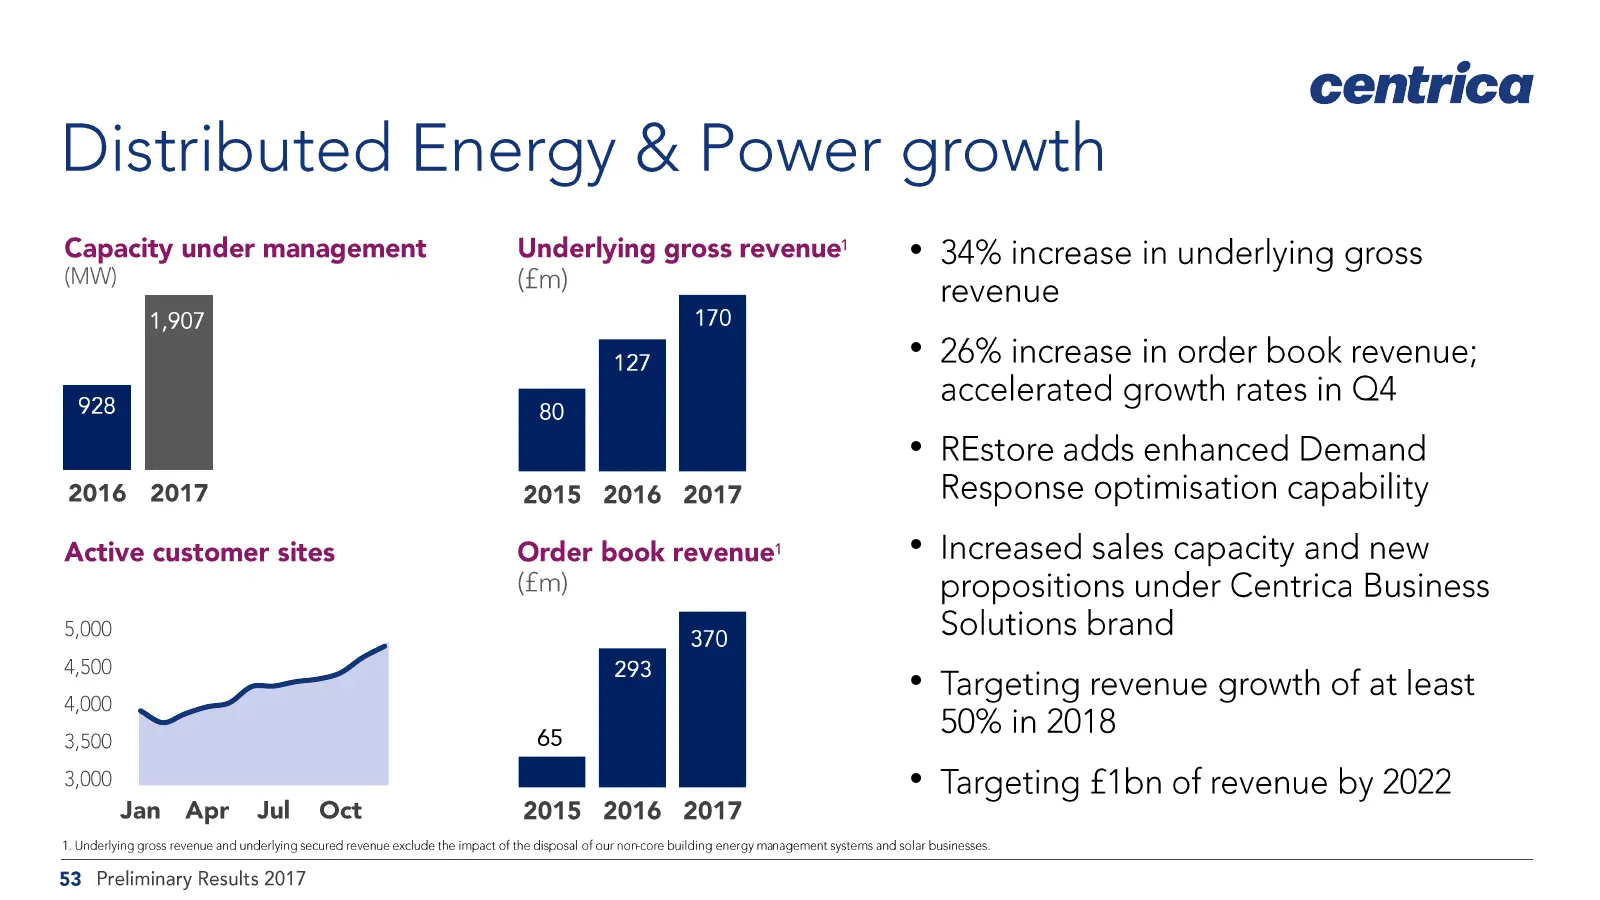
Slide 53: Distributed Energy & Power growth
centrica Distributed Energy & Power growth Capacity under management Underlying gross revenue’ * 34% increase in underlying gross MW, wy) (£m) revenue 1,907 170 197 * 26% increase in order book revenue; on accelerated growth rates in O4 a [| * REstore adds enhanced Demand 2016 2017 2015 2016 2017 Re
Slide 54: Exploration & Production
centrica Exploration & Production * Spirit Energy creates stronger and more sustainable self-financing E&P business SPIRIT * Further consolidation targeted ENERGY - Centrica would dilute - Prepared to reduce shareholding to <50% * Spirit Energy creates optionality for both shareholders * Centrica St
Slide 55: Capability
Capability * Enhanced business capabilities developed since 2015 - Customer service - Customer segmentation and propositions - Digital platforms (Connected Home, Centrica Business Solutions) - Intellectual property and technology (Centrica Innovations) - Device development and integration (Hive) - P
Slide 56: Acquisitions and disposals
Acquisitions and disposals * No major growth M&A - Uncertainty of UK default tariff cap - Desire to maintain balance sheet strength * Bolt-on acquisitions to build capability within limits of financial framework * Spirit Energy — potential for further consolidation, partnership * Nuclear investment
Slide 57: Strategy - conclusions
centrica Strategy - conclusions Phase 1 of repositioning Centrica completed and Group strengthened * Focus remains on the core of ‘energy supply and services’ - Strong positions in core energy supply and in-home servicing - New capabilities and sources of gross margin developed to reinforce the core
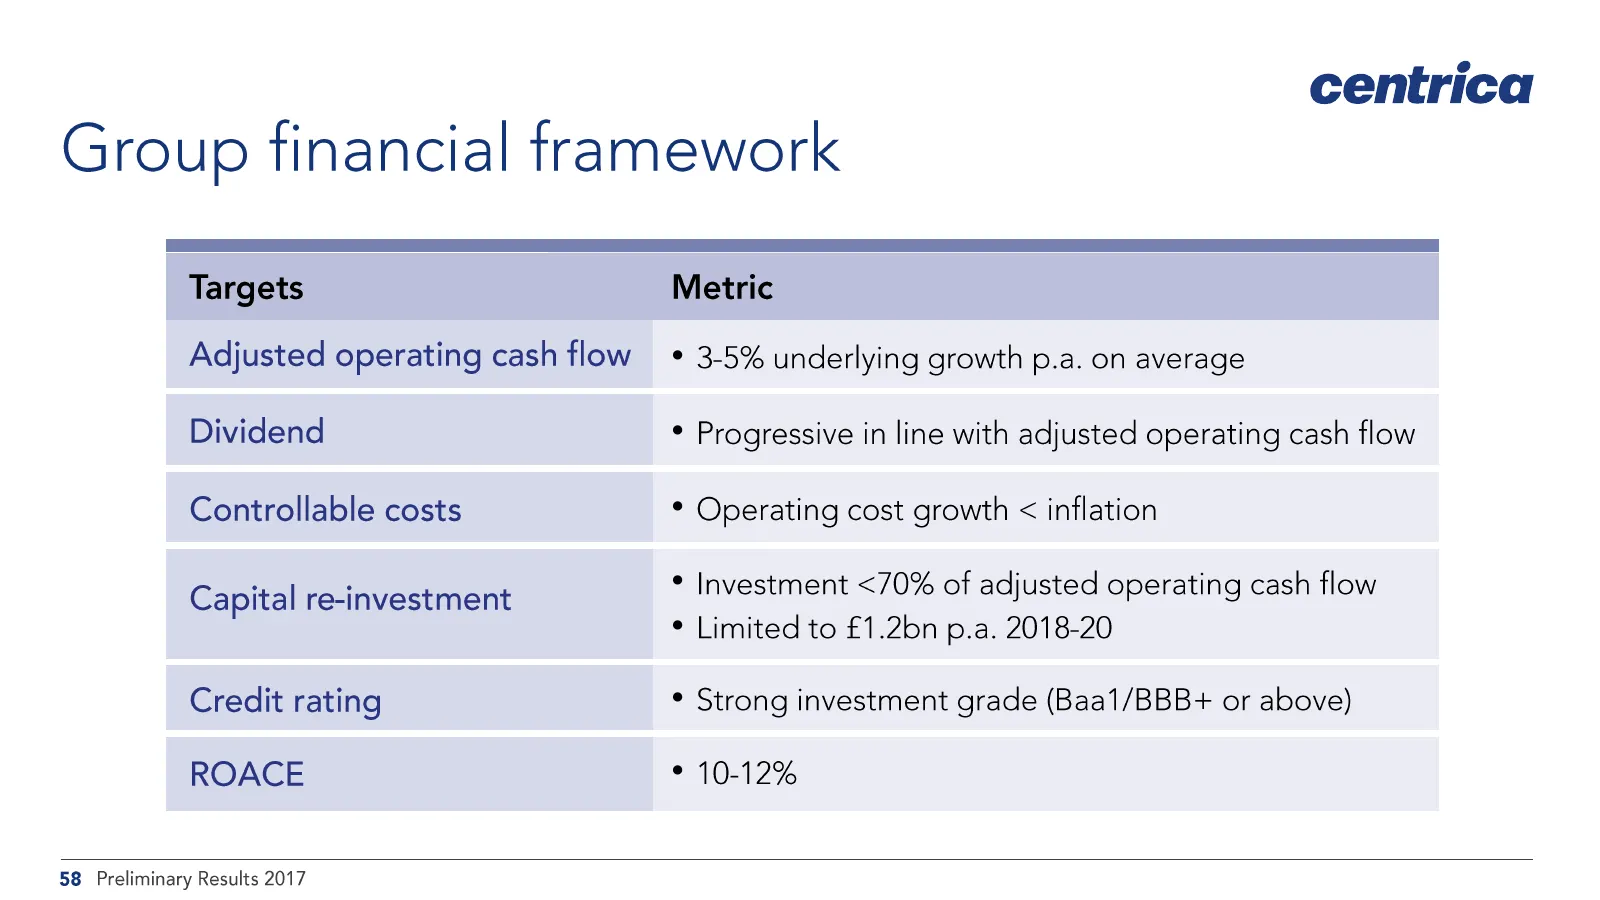
Slide 58: Group financial framework
centrica Group financial framework Targets Metric Adjusted operating cash flow * 3-5% underlying growth p.a. on average Dividend * Progressive in line with adjusted operating cash flow Controllable costs * Operating cost growth < inflation * Investment <70% of adjusted operating cash flow Capital re
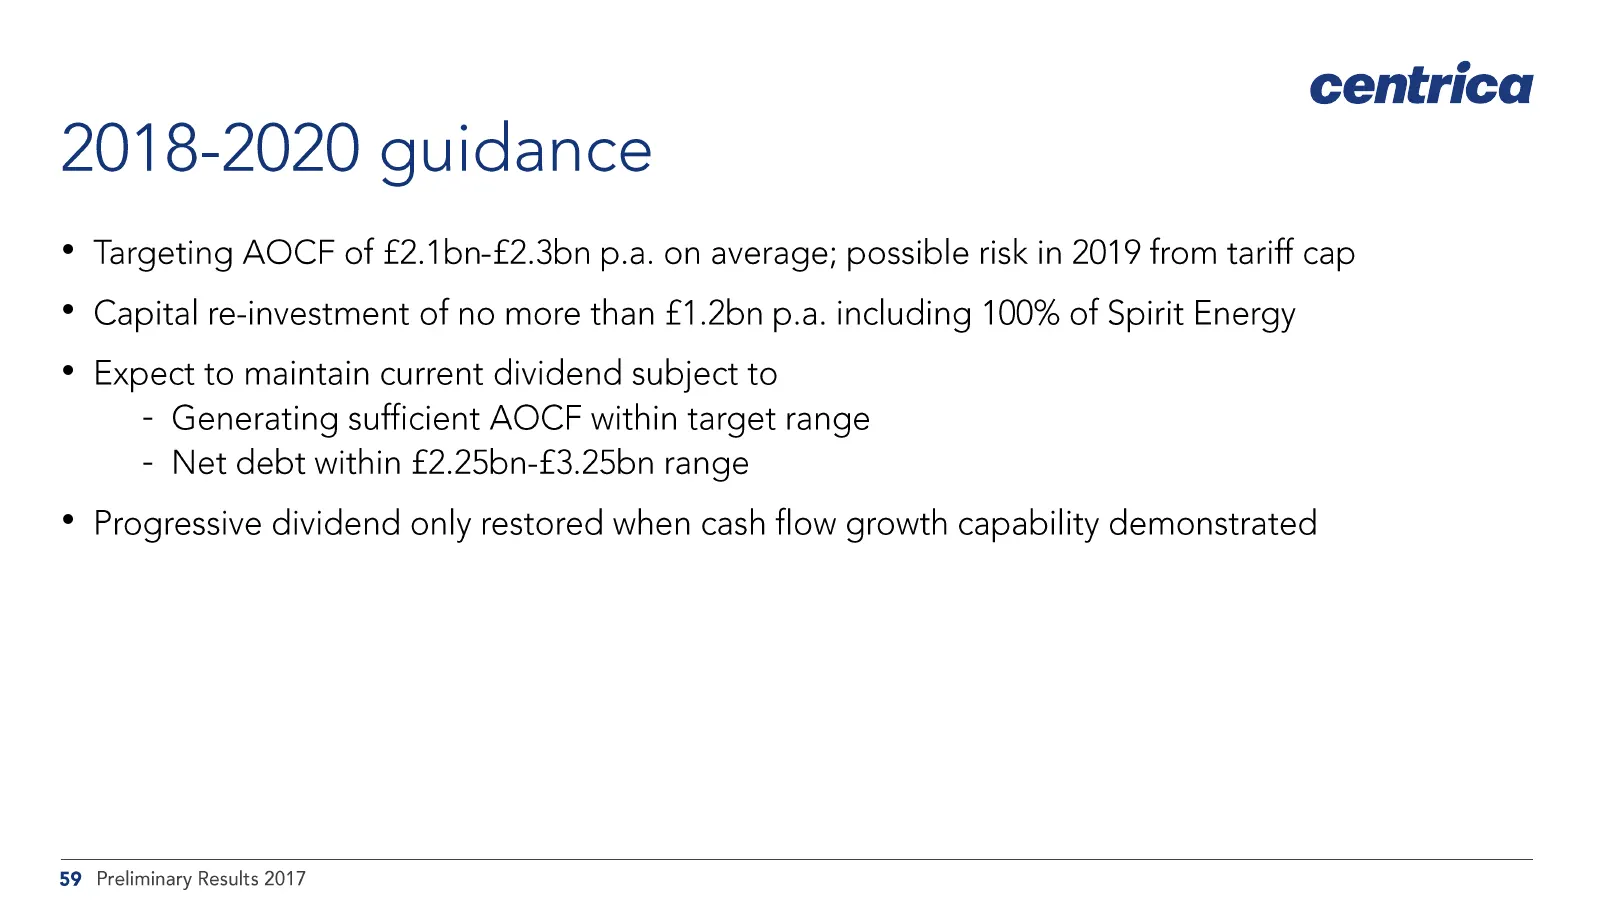
Slide 59: 2018-2020 guidance
centrica 2018-2020 guidance * Targeting AOCF of £2.1bn-£2.3bn p.a. on average; possible risk in 2019 from tariff cap * Capital re-investment of no more than £1.2bn p.a. including 100% of Spirit Energy * Expect to maintain current dividend subject to - Generating sufficient AOCF within target range -
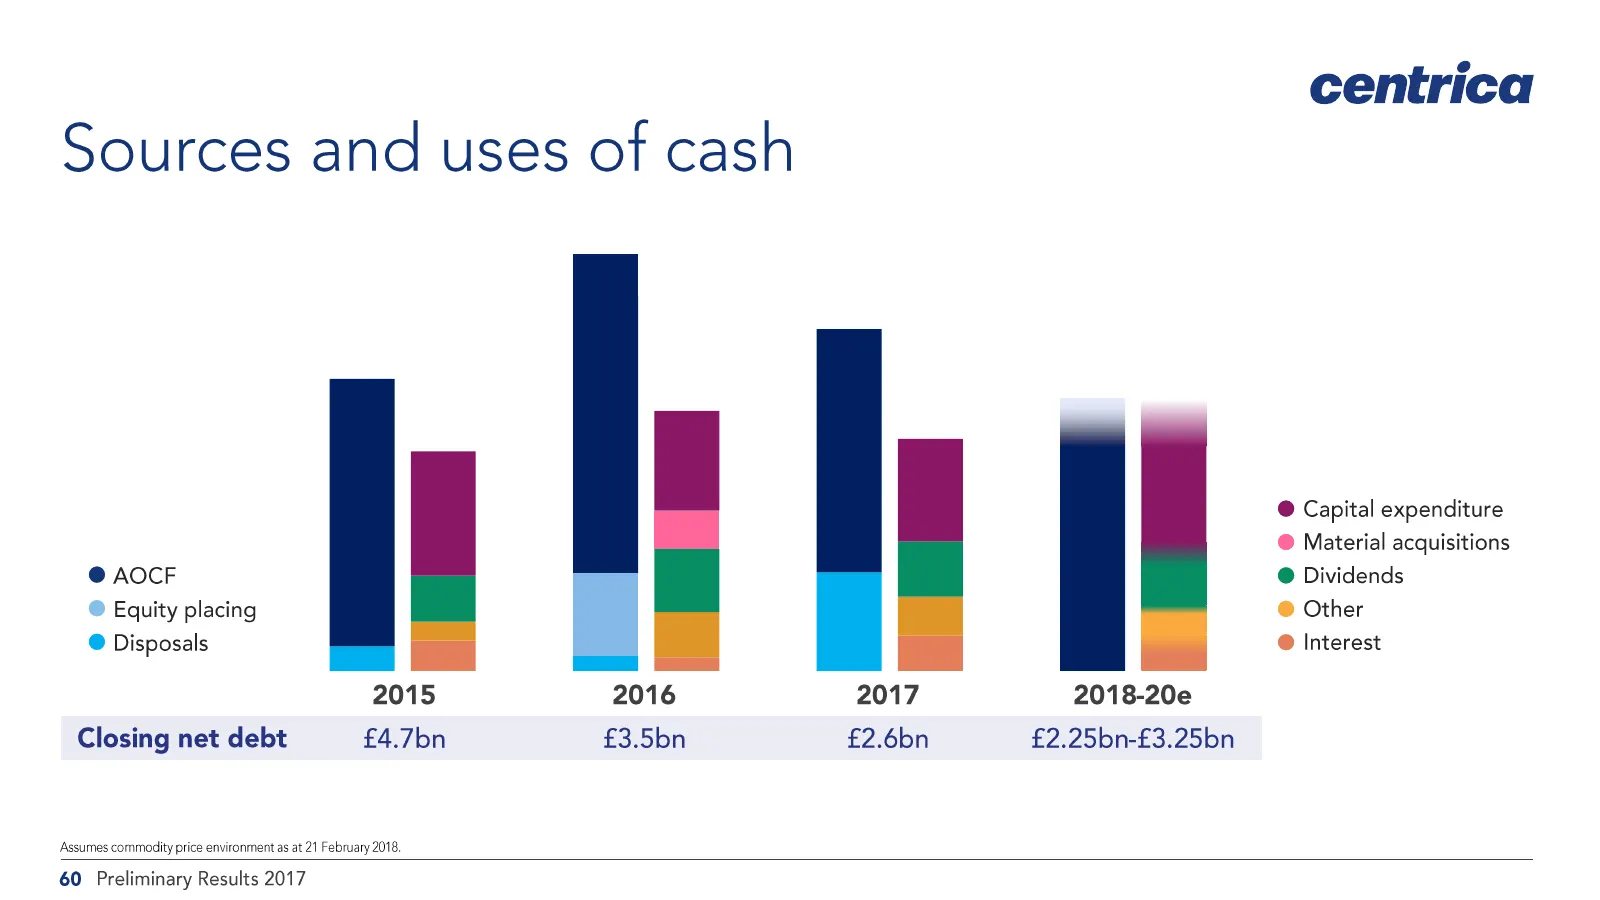
Slide 60: Sources and uses of cash
centrica Sources and uses of cash @ Capital expenditure @ Material acquisitions @ AOCF @ Dividends © Equity placing @ Other @ Disposals @ Interest 2015 2016 2017 2018-20e Closing net debt £4.7bn £3.5bn £2.6bn £2.25bn-£3.25bn ‘Assumes commodity price environment as at 21 February 2018, 60 Preliminary
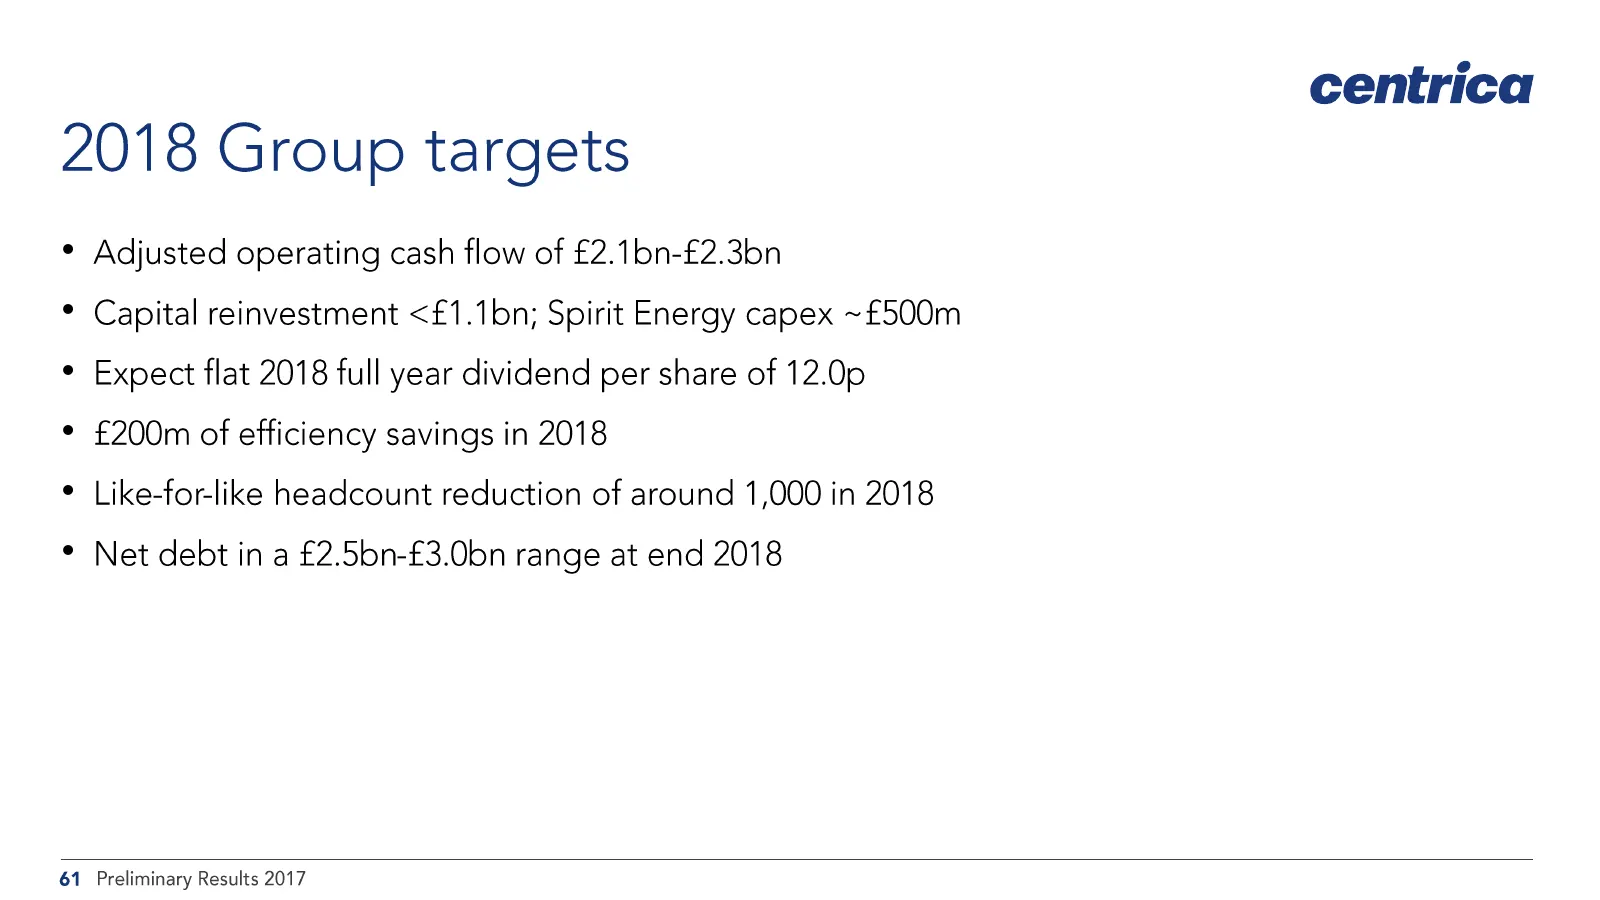
Slide 61: 2018 Group targets
2018 Group targets * Adjusted operating cash flow of £2.1bn-£2.3bn * Capital reinvestment <f£1.1bn; Spirit Energy capex ~£500m Expect flat 2018 full year dividend per share of 12.0p £200m of efficiency savings in 2018 Like-for-like headcount reduction of around 1,000 in 2018 Net debt in a £2.5bn-£3.
Slide 62: Summary
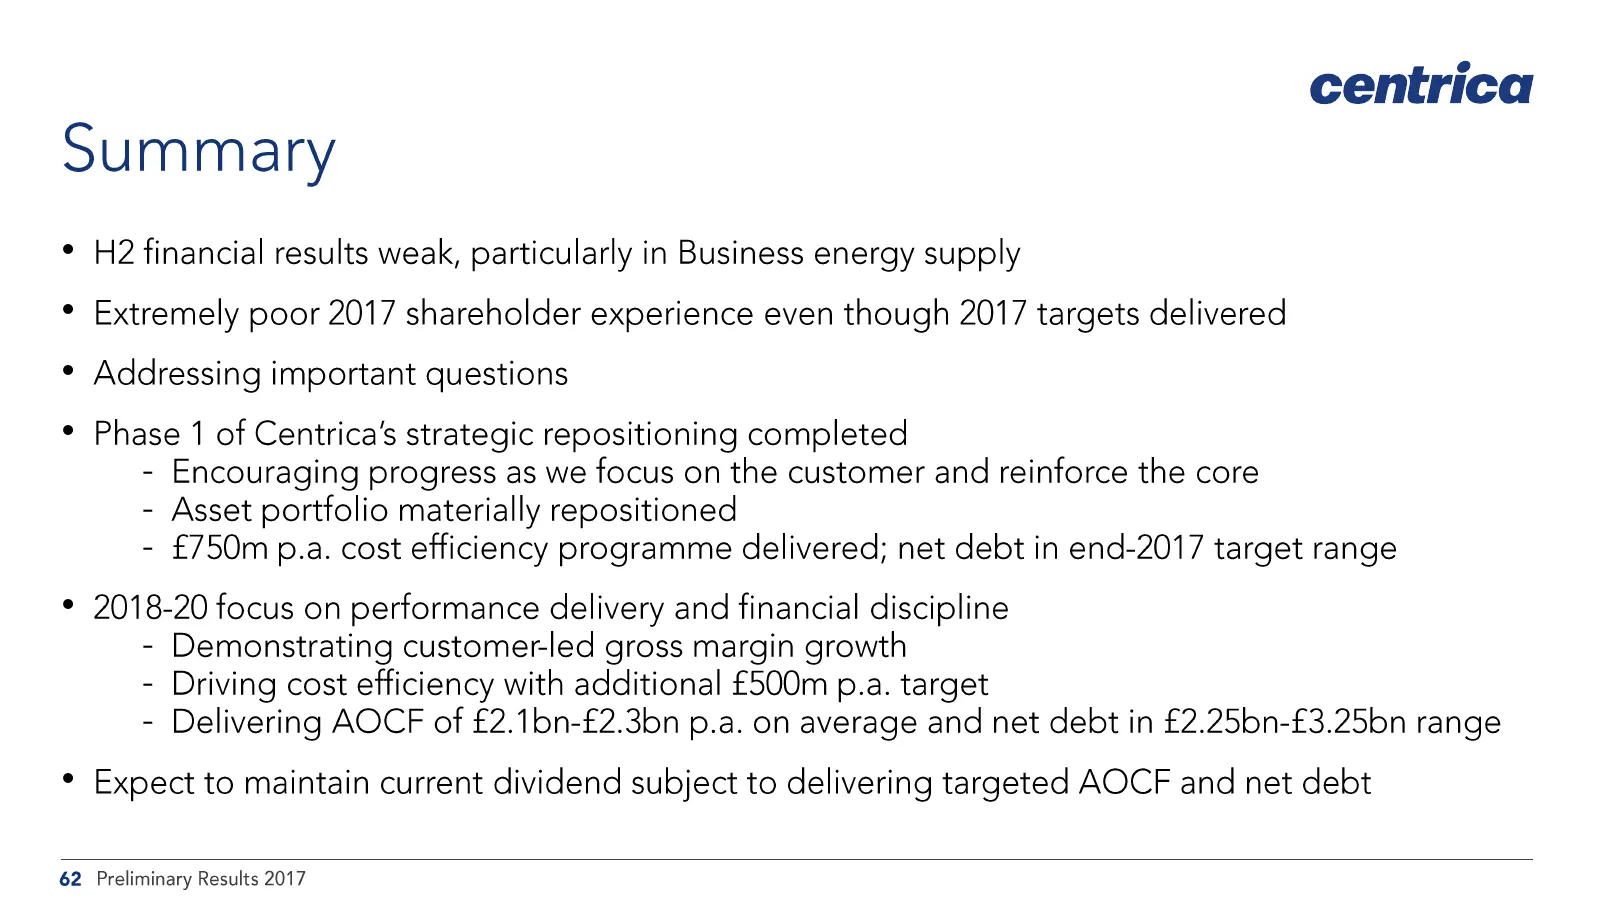
centrica Summary H2 financial results weak, particularly in Business energy supply Extremely poor 2017 shareholder experience even though 2017 targets delivered Addressing important questions Phase 1 of Centrica’s strategic repositioning completed - Encouraging progress as we focus on the customer a
Slide 63: centrica
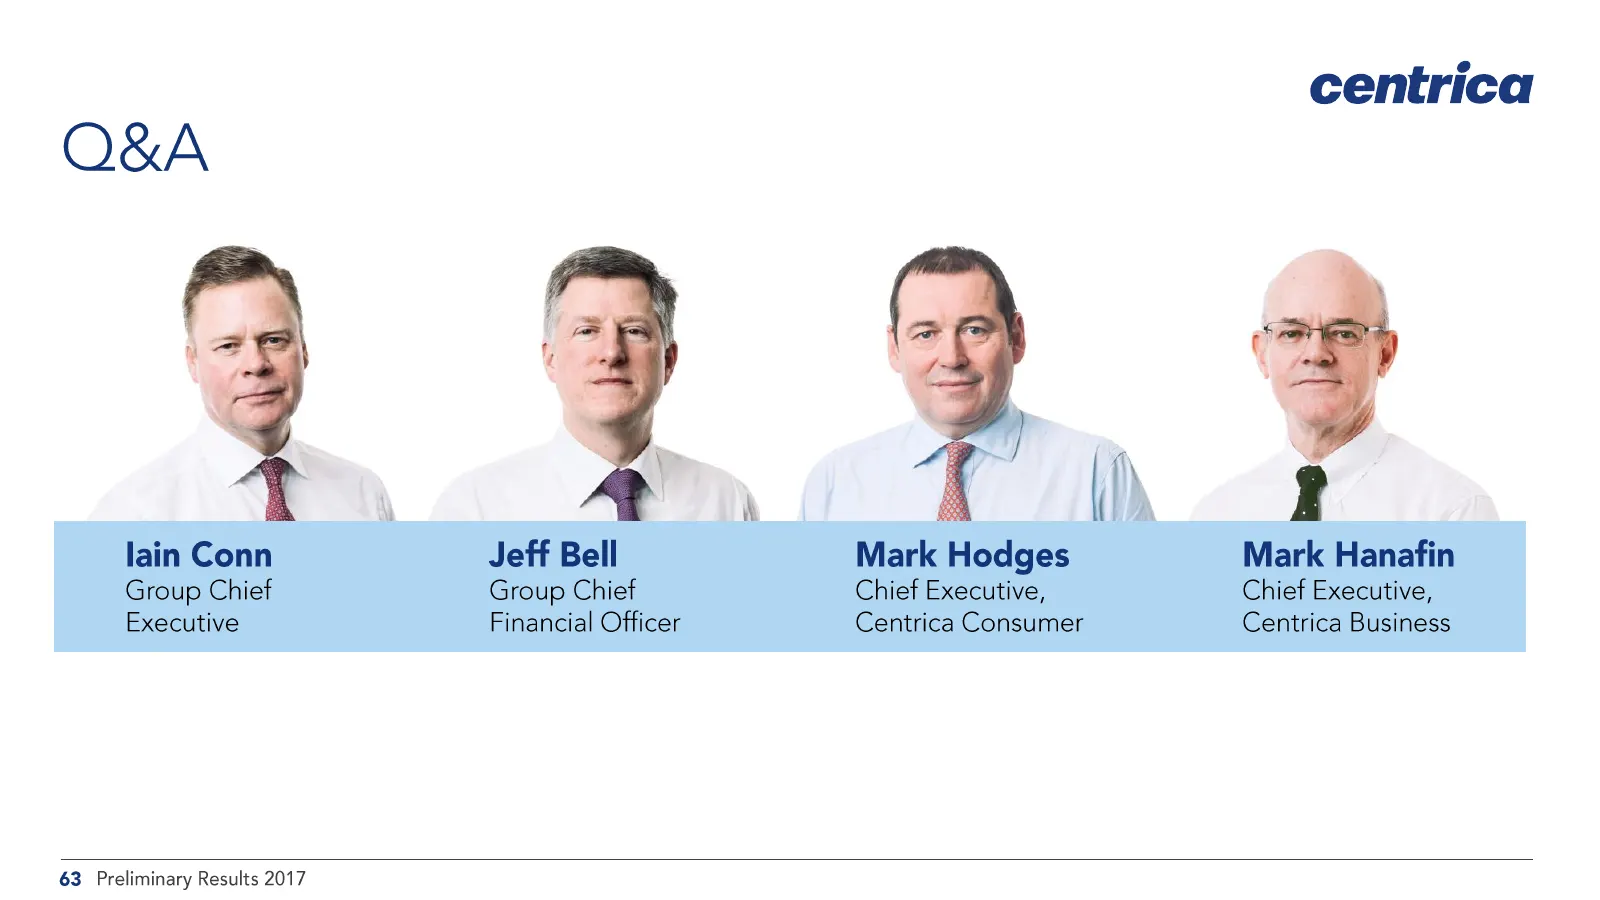
centrica 63 Preliminary Results 2017
Slide 64: Adjusted operating profit
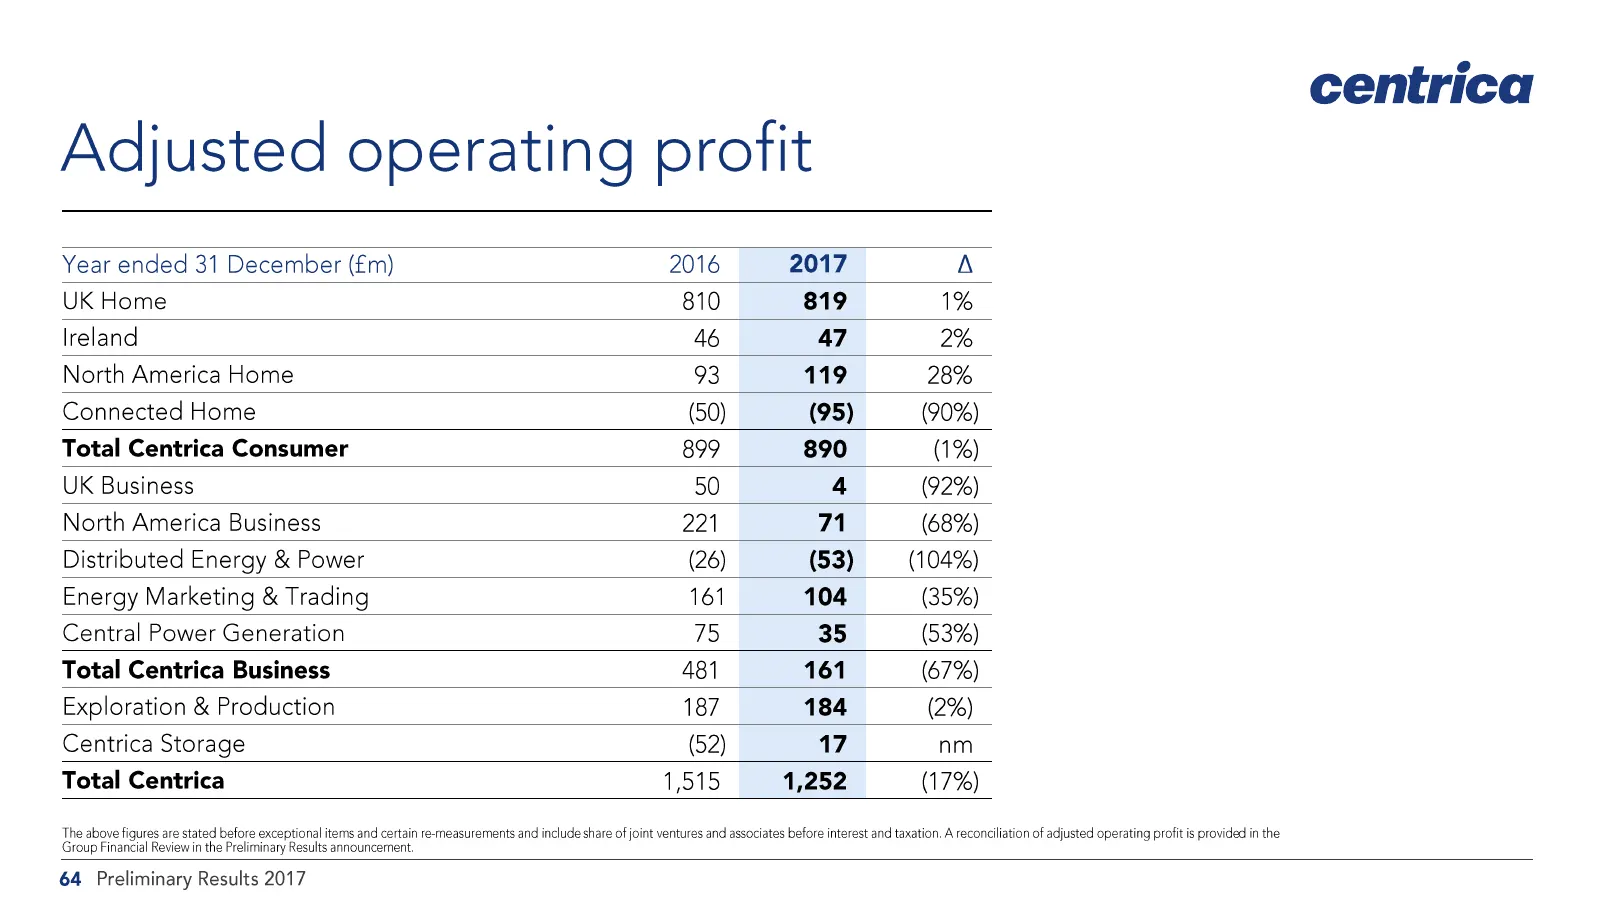
Adjusted operating profit Year ended 31 December (£m) 2016 2017 A UK Home 810 819 1% Ireland 46 47 2% North America Home 93 119 28% Connected Home (50) (95) (90%) Total Centrica Consumer 899 890 (1%) UK Business 50 4 (92%) North America Business 221 71 (68%) Distributed Energy & Power (26) (53) (104
Slide 65: Adjusted operating cash flow
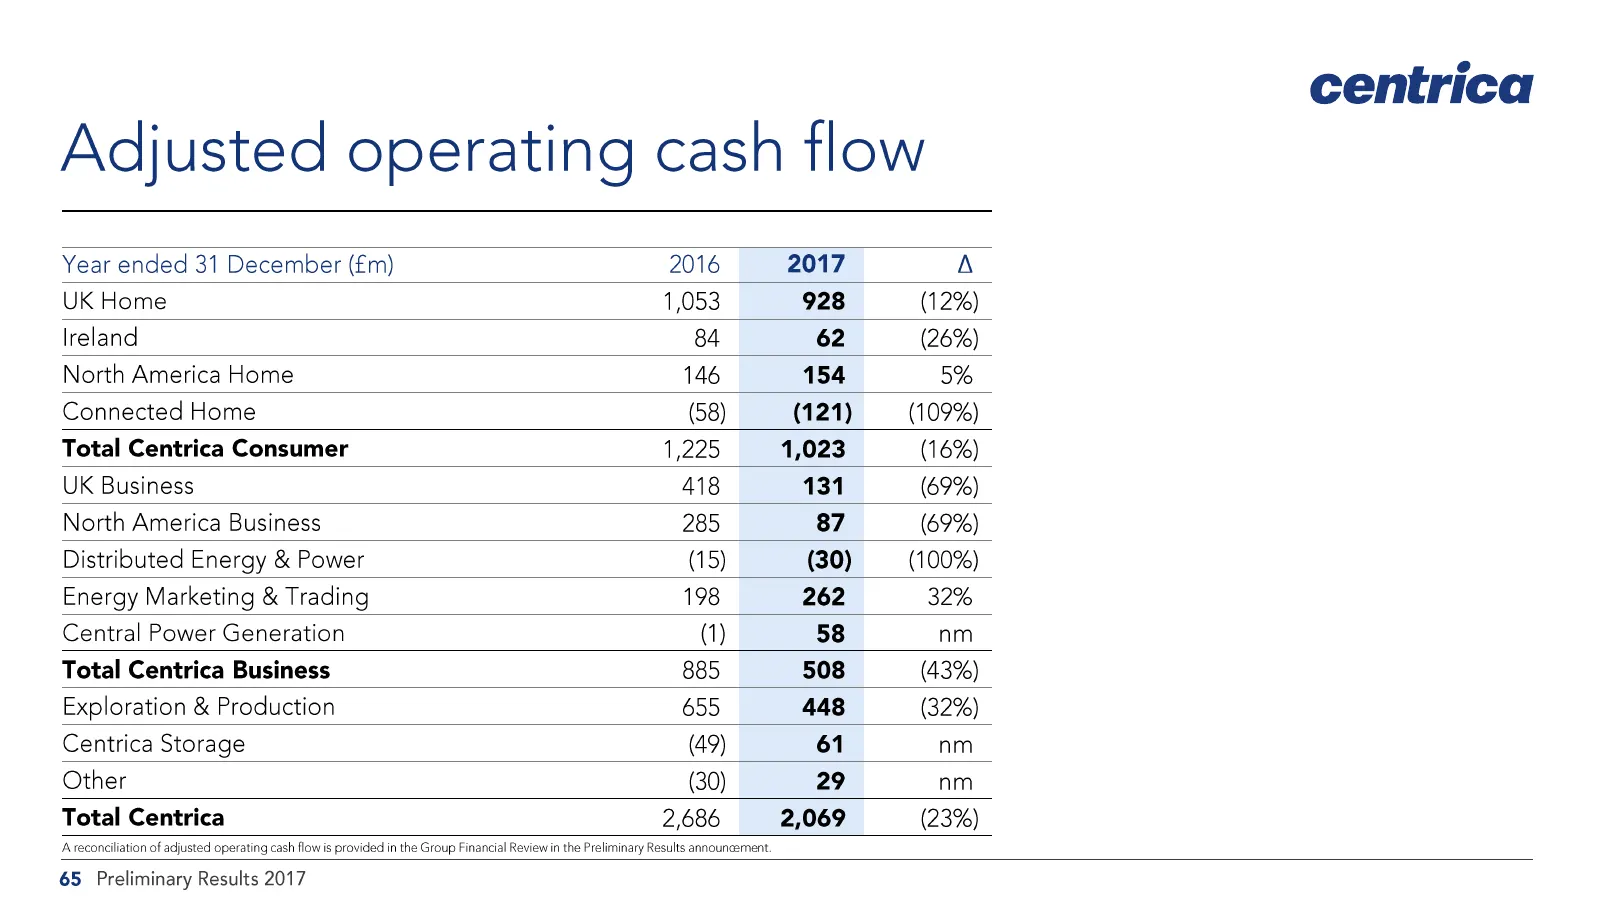
centrica Adjusted operating cash flow Year ended 31 December (£m) 2016 2017 A UK Home 1,053 928 (12%) Ireland 84 62 (26%) North America Home 146 154 5% Connected Home (58) (121) (109%) Total Centrica Consumer 1,225 1,023 (16%) UK Business 418 131 (69%) North America Business 285 87 (69%) Distributed
Slide 66: Disclaimer: Rules of thumb
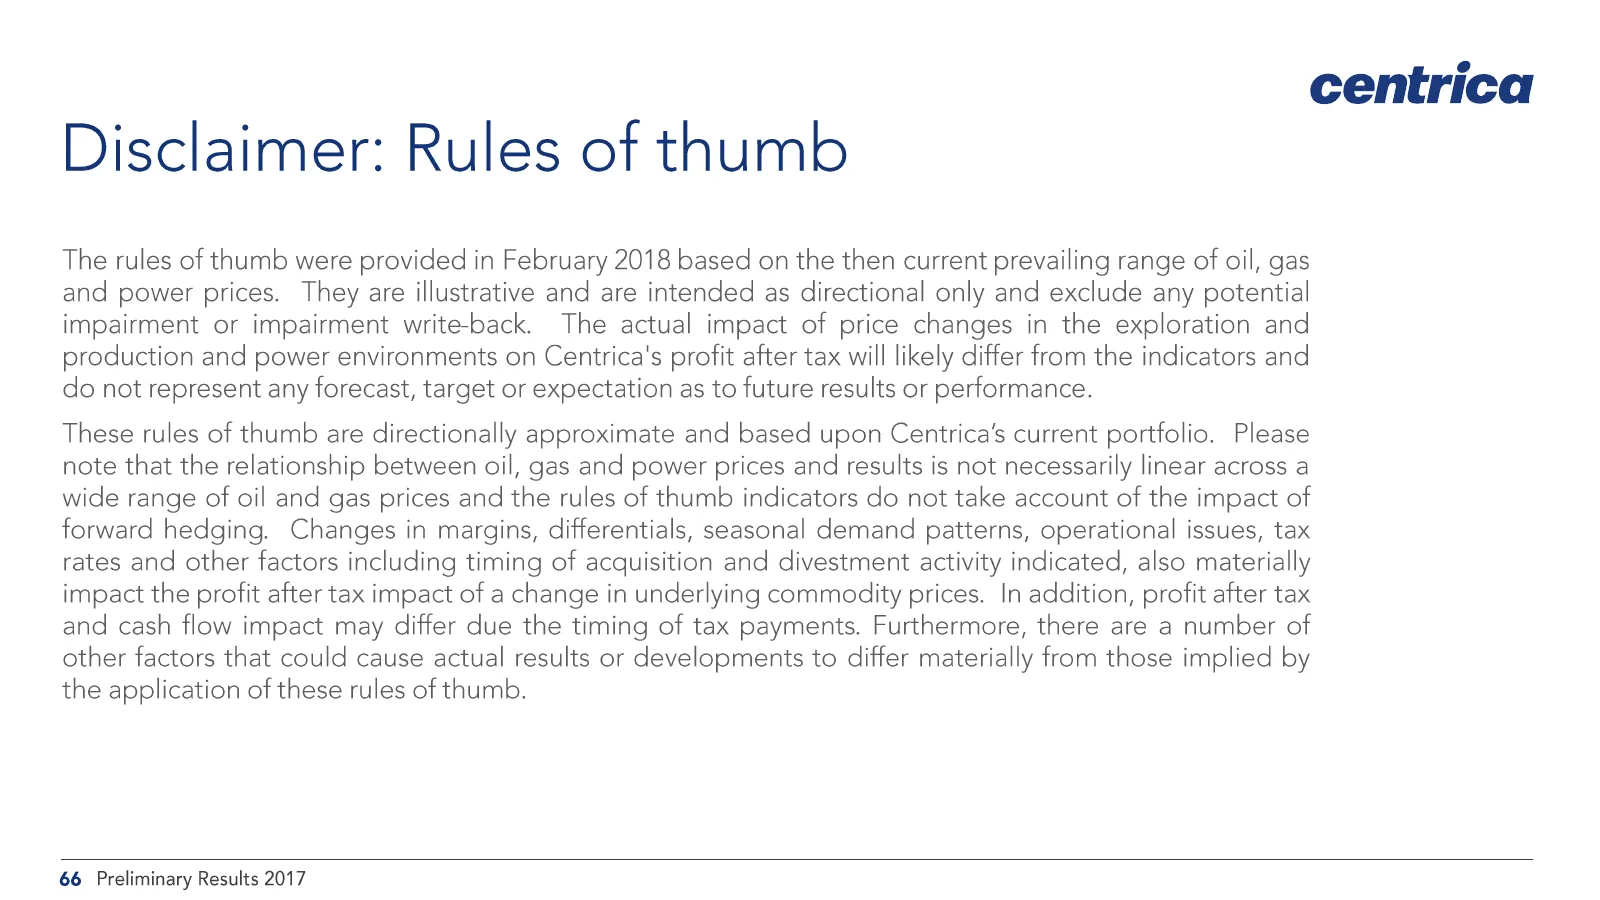
Disclaimer: Rules of thumb The rules of thumb were provided in February 2018 based on the then current prevailing range of oil, gas and power prices. They are illustrative and are intended as directional only and exclude any potential impairment or impairment write-back. The actual impact of price c
Slide 67: Rules of thumb: E&P and Nuclear
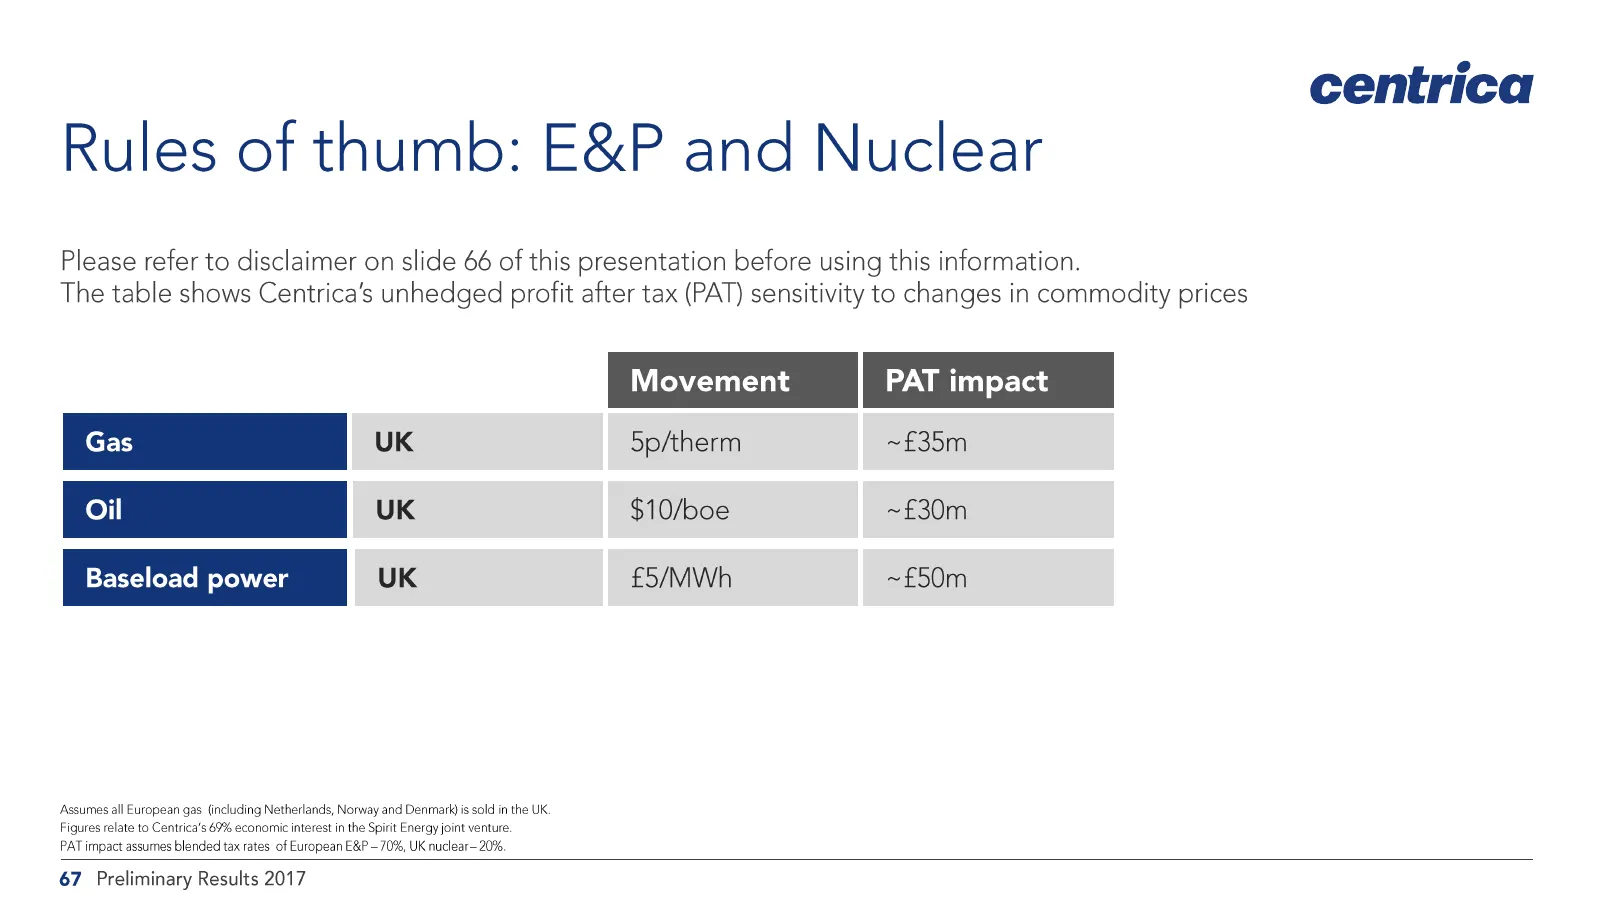
Rules of thumb: E&P and Nuclear Please refer to disclaimer on slide 66 of this presentation before using this information. The table shows Centrica’s unhedged profit after tax (PAT) sensitivity to changes in commodity prices ‘Assumes all European gas (including Netherlands, Norway and Denmart) is so
Source: Internet Archive copy of webcasts.centrica.com
More decks from Centrica plc
 H1 2026 Earnings Presentation31 slides · Jul 23, 2026
 Q2 2026 Earnings Presentation30 slides · Jul 23, 2026
 FY2025 Earnings Presentation39 slides · Feb 19, 2026
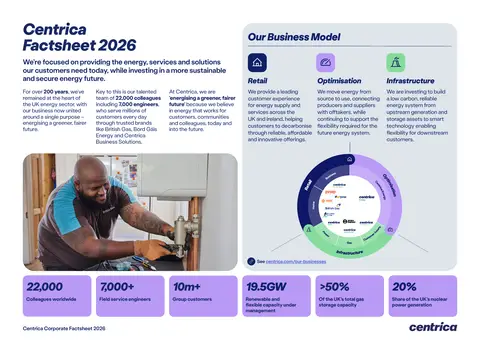 Fact Sheet (2026)2 slides · 2026
 H1 2025 Earnings Presentation32 slides · Jul 24, 2025
 Investor Presentation (July 2025)24 slides · Jul 22, 2025