Emaar Properties (P.J.S.C) · DFM:EMAAR
Emaar Properties (P.J.S.C) — Emaar Properties — 9M 2019 Earnings Presentation
63 slides from Emaar Properties (P.J.S.C)'s earnings presentation, November 2019
Slide 1: Prepared for the Future
EMAAR PROPERTIES Prepared for the Future Built on Strength, Prudence & Resilience. Investor Presentation November 2019 0 | EMAAR PROPERTIES
Slide 2: Disclaimer
Disclaimer Emaar Properties PJSC, for themselves and for Emaar Group, give notice that: The particulars of this presentation do not constitute any part of an offer or a contract. Given that the presentation contains information based on forecasts and roll outs, all statements contained in this prese
Slide 3: Discussion Summary
Discussion Summary Investing In Emaar Expanding Footprint in UAE & International Markets Business Strategy & Outlook 9M 2019 Results Update Annexure 2 | EMAAR PROPERTIES
Slide 4: Investing In Emaar
Investing In Emaar 3 | EMAAR PROPERTIES
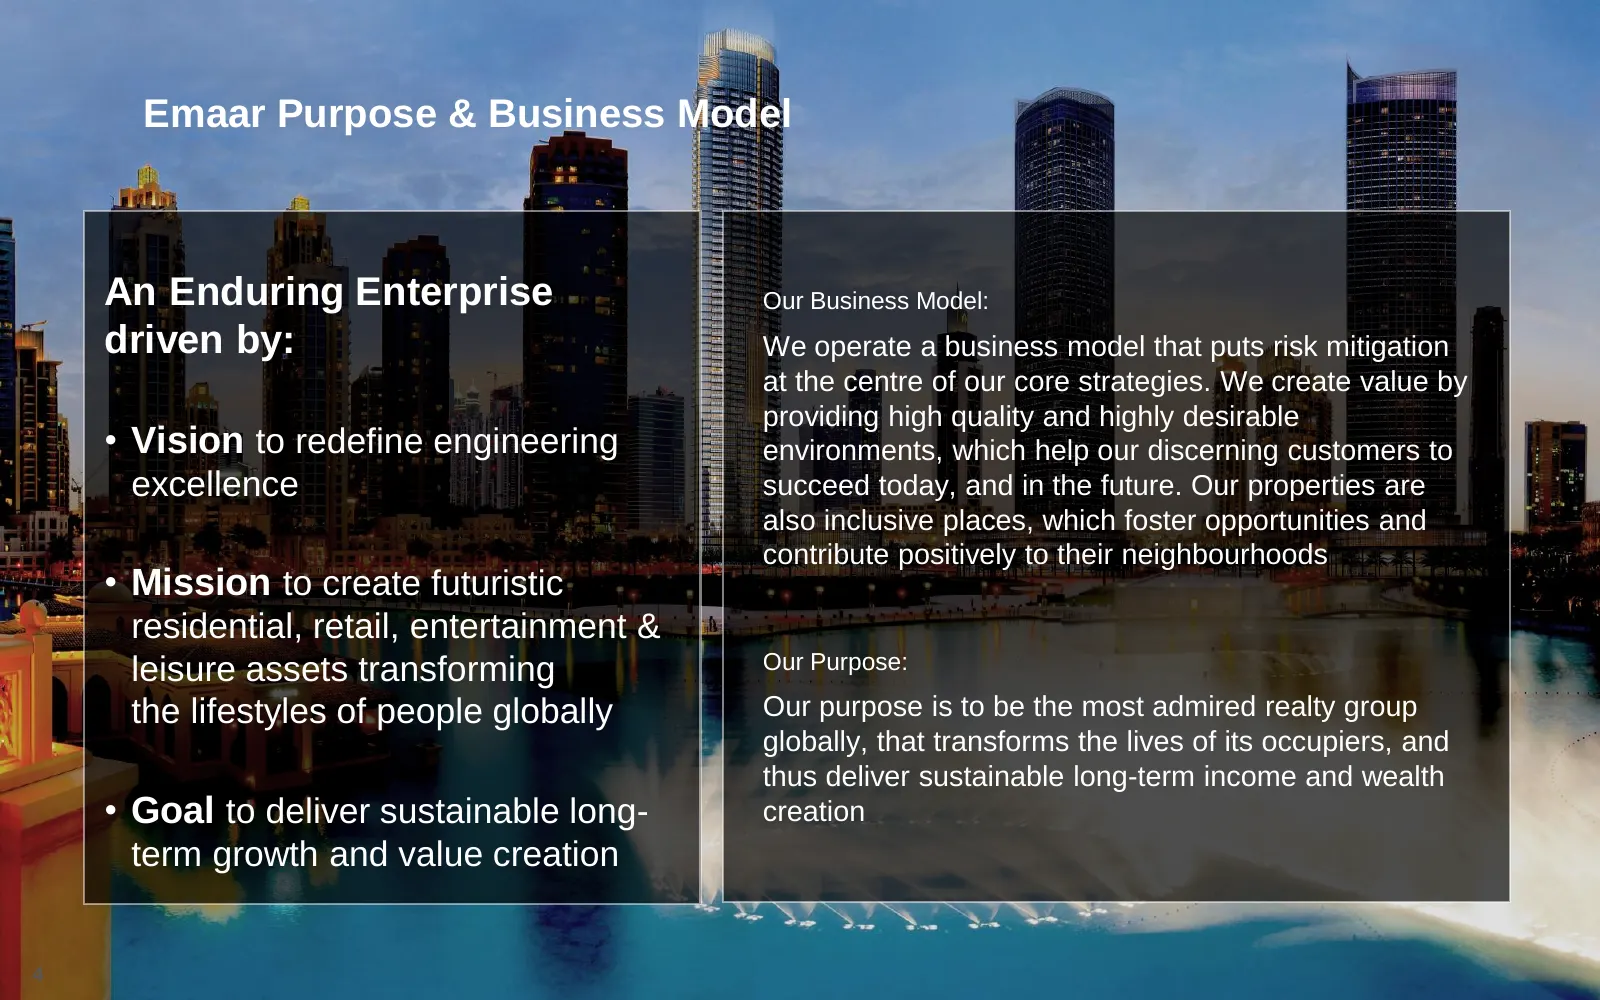
Slide 5: Emaar Purpose & Business Model
Emaar Purpose & Business Model An Enduring Enterprise Our Business Model: driven by: We operate a business model that puts risk mitigation at the centre of our core strategies. We create value by providing high quality and highly desirable • Vision to redefine engineering environments, which help ou
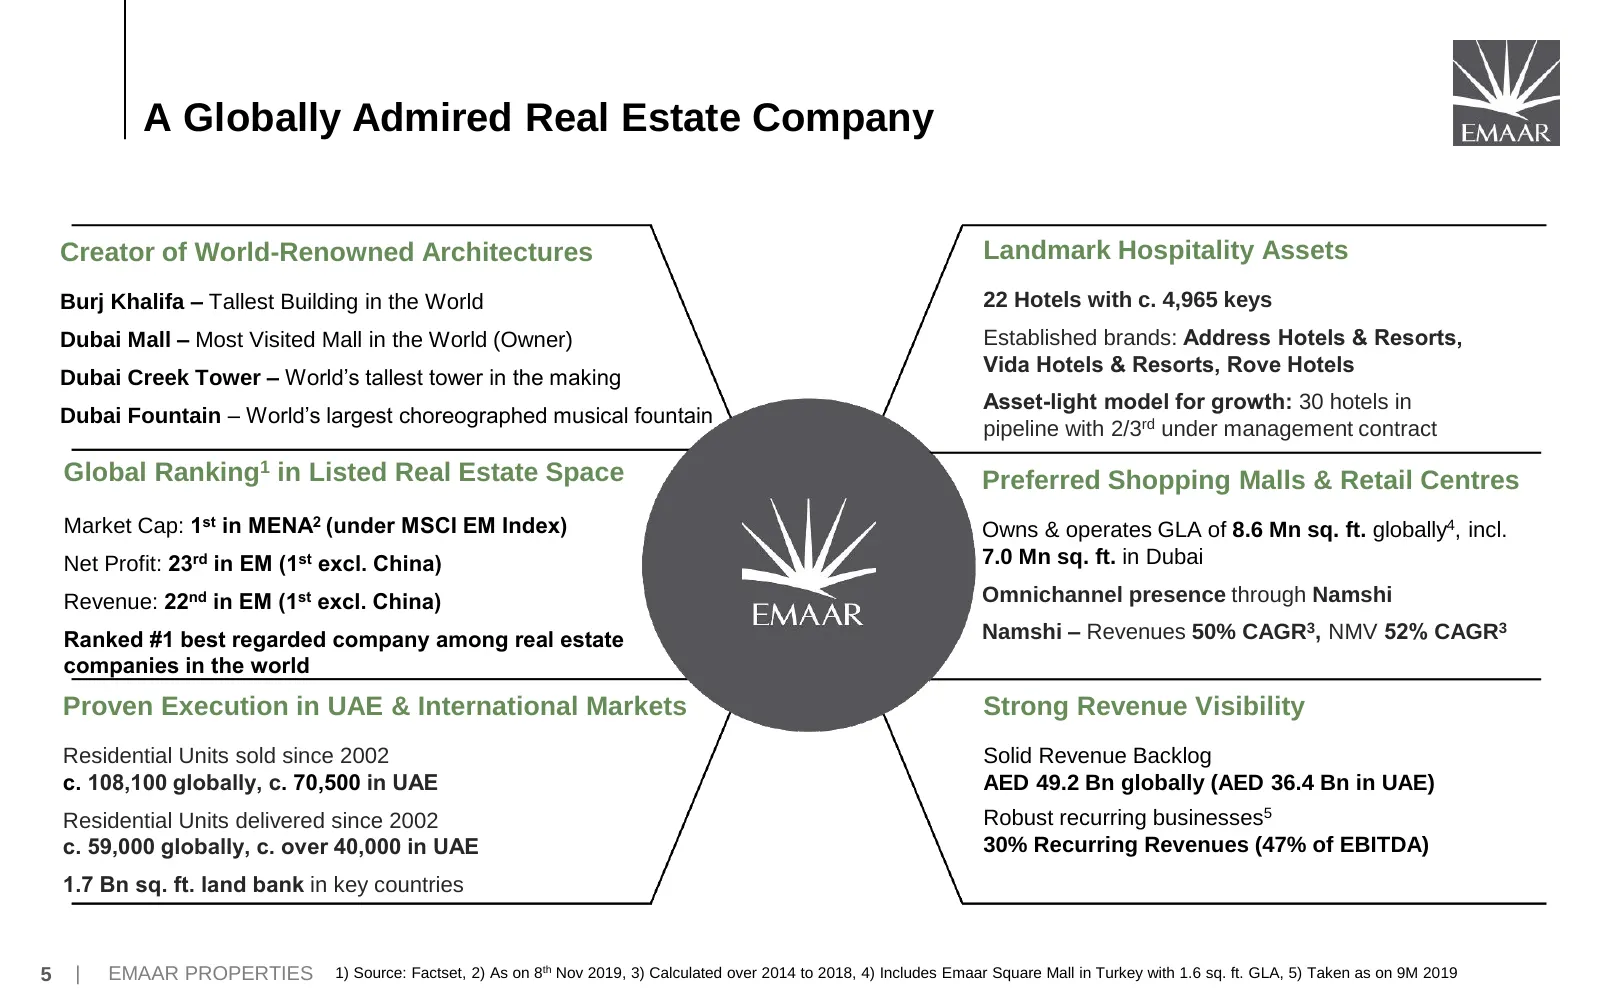
Slide 6: A Globally Admired Real Estate Company
A Globally Admired Real Estate Company Creator of World-Renowned Architectures Landmark Hospitality Assets Burj Khalifa – Tallest Building in the World 22 Hotels with c. 4,965 keys Dubai Mall – Most Visited Mall in the World (Owner) Established brands: Address Hotels & Resorts, Vida Hotels & Resorts
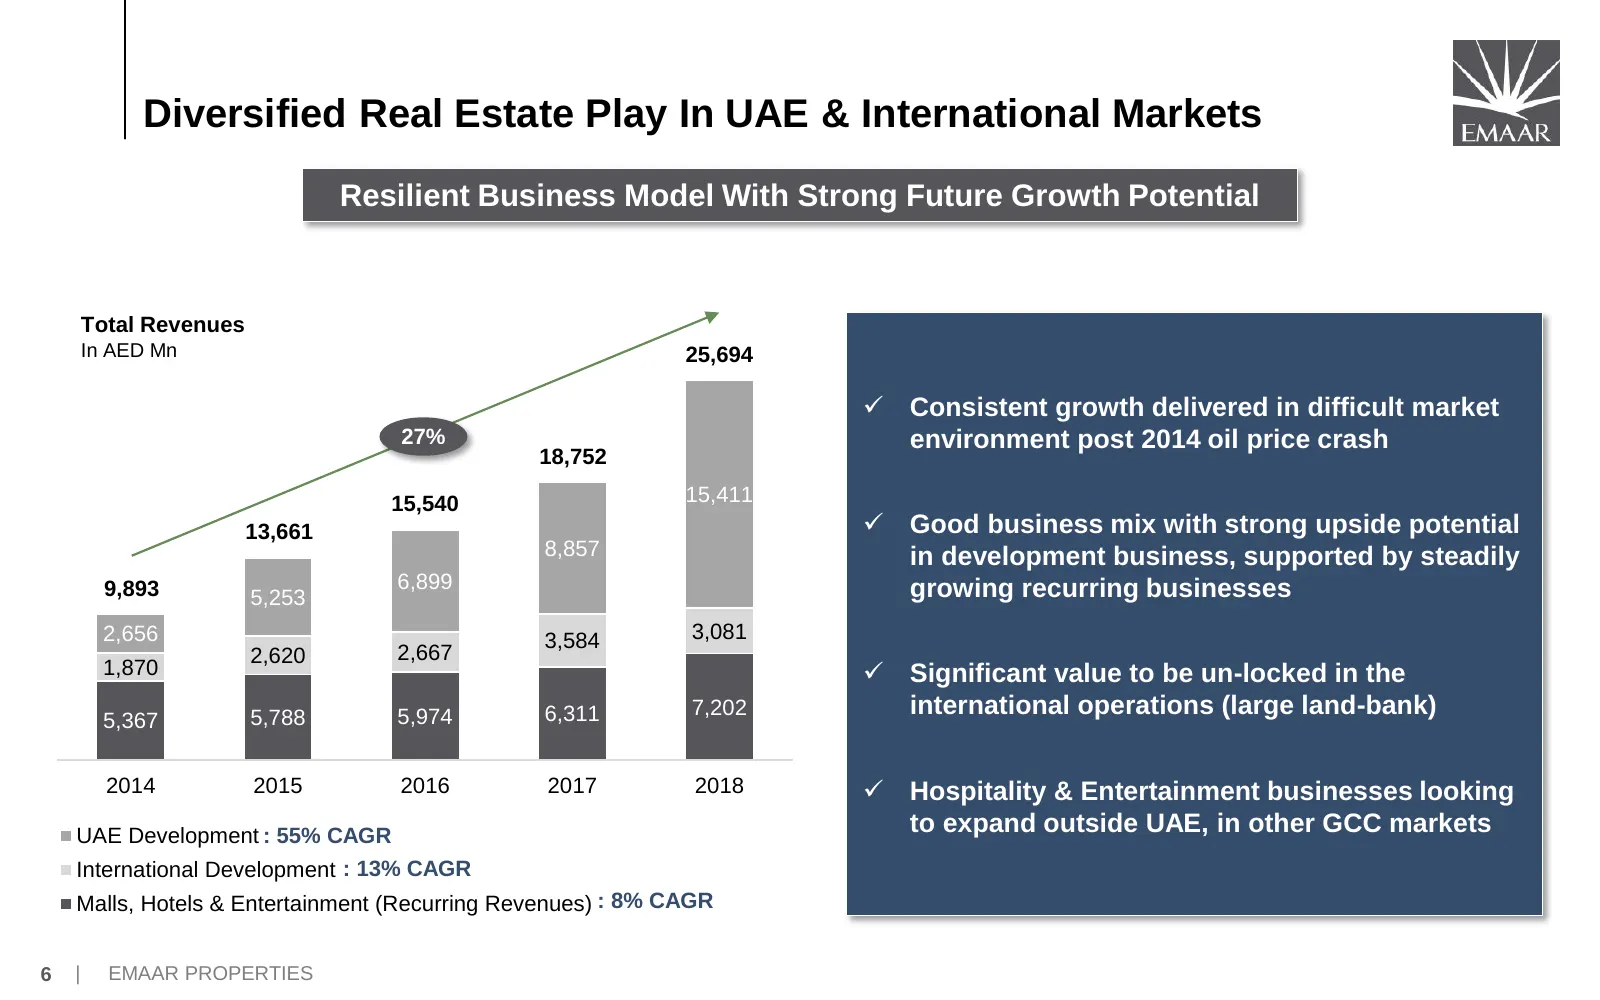
Slide 7: Diversified Real Estate Play In UAE & International Markets
Diversified Real Estate Play In UAE & International Markets Resilient Business Model With Strong Future Growth Potential Total Revenues In AED Mn 25,694 ✓ Consistent growth delivered in difficult market 27% environment post 2014 oil price crash 18,752 15,540 15,411 13,661 ✓ Good business mix with st
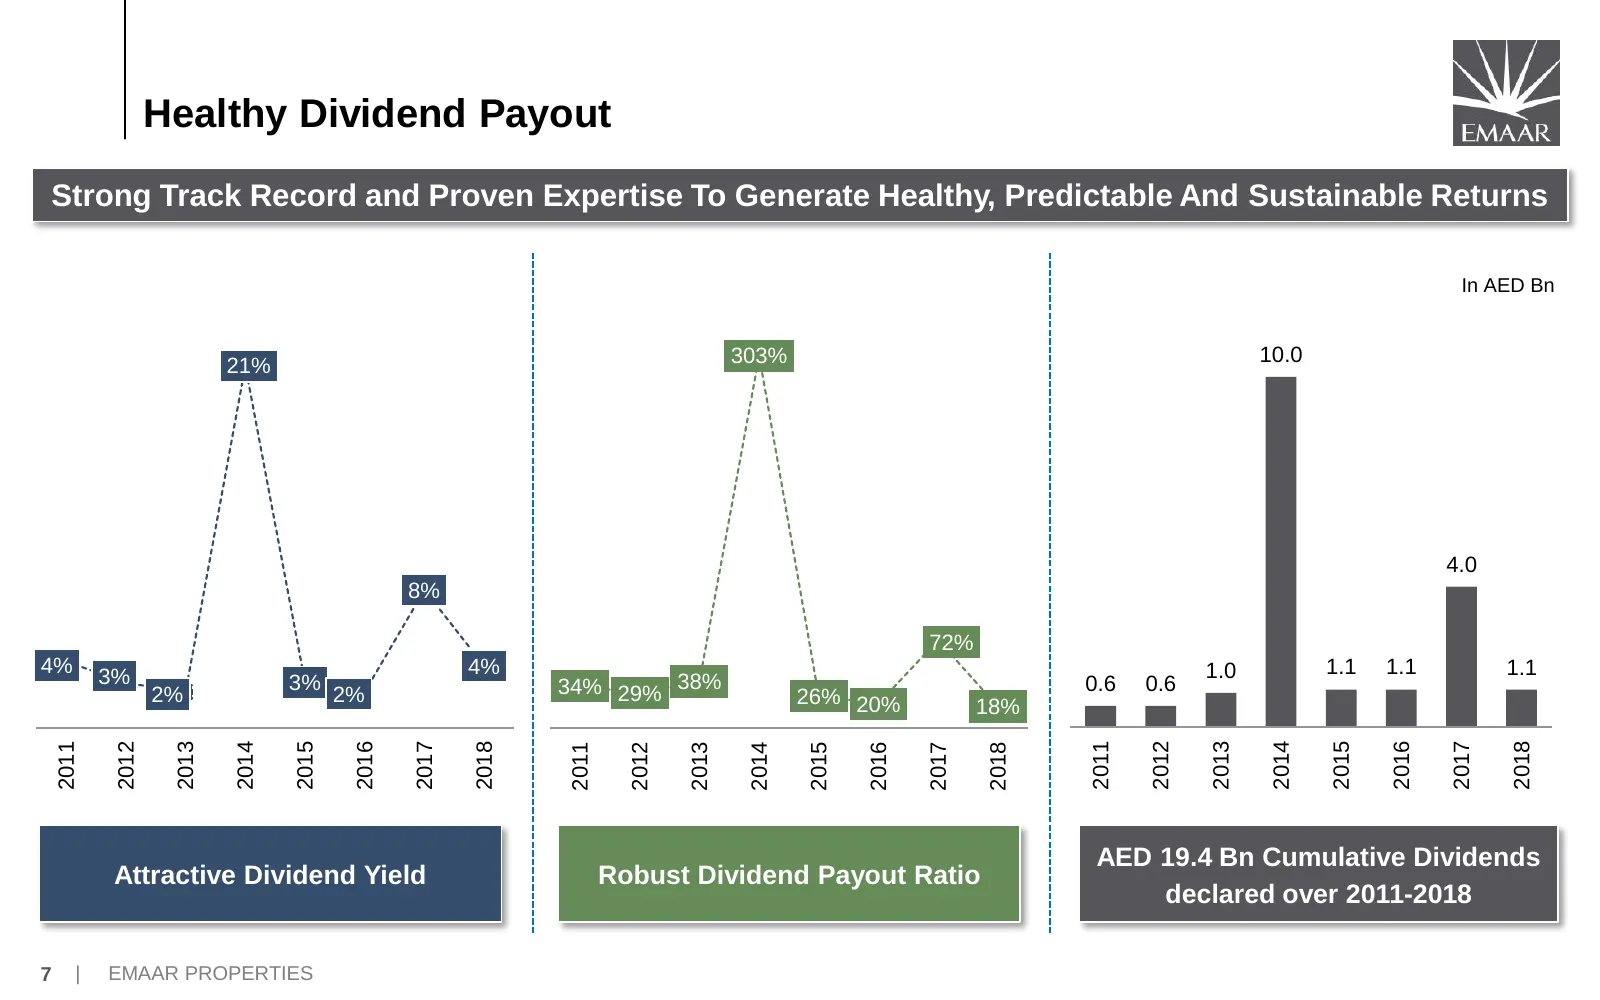
Slide 8: Healthy Dividend Payout
Healthy Dividend Payout Strong Track Record and Proven Expertise To Generate Healthy, Predictable And Sustainable Returns In AED Bn 303% 10.0 21% 4.0 8% 72% 4% 3% 4% 1.0 1.1 1.1 1.1 2% 3% 2% 34% 29% 38% 26% 20% 0.6 0.6 18% 2011 2012 2013 2014 2015 2016 2017 2018 2011 2012 2013 2014 2015 2016 2017 20
Slide 9: Strong Balance Sheet
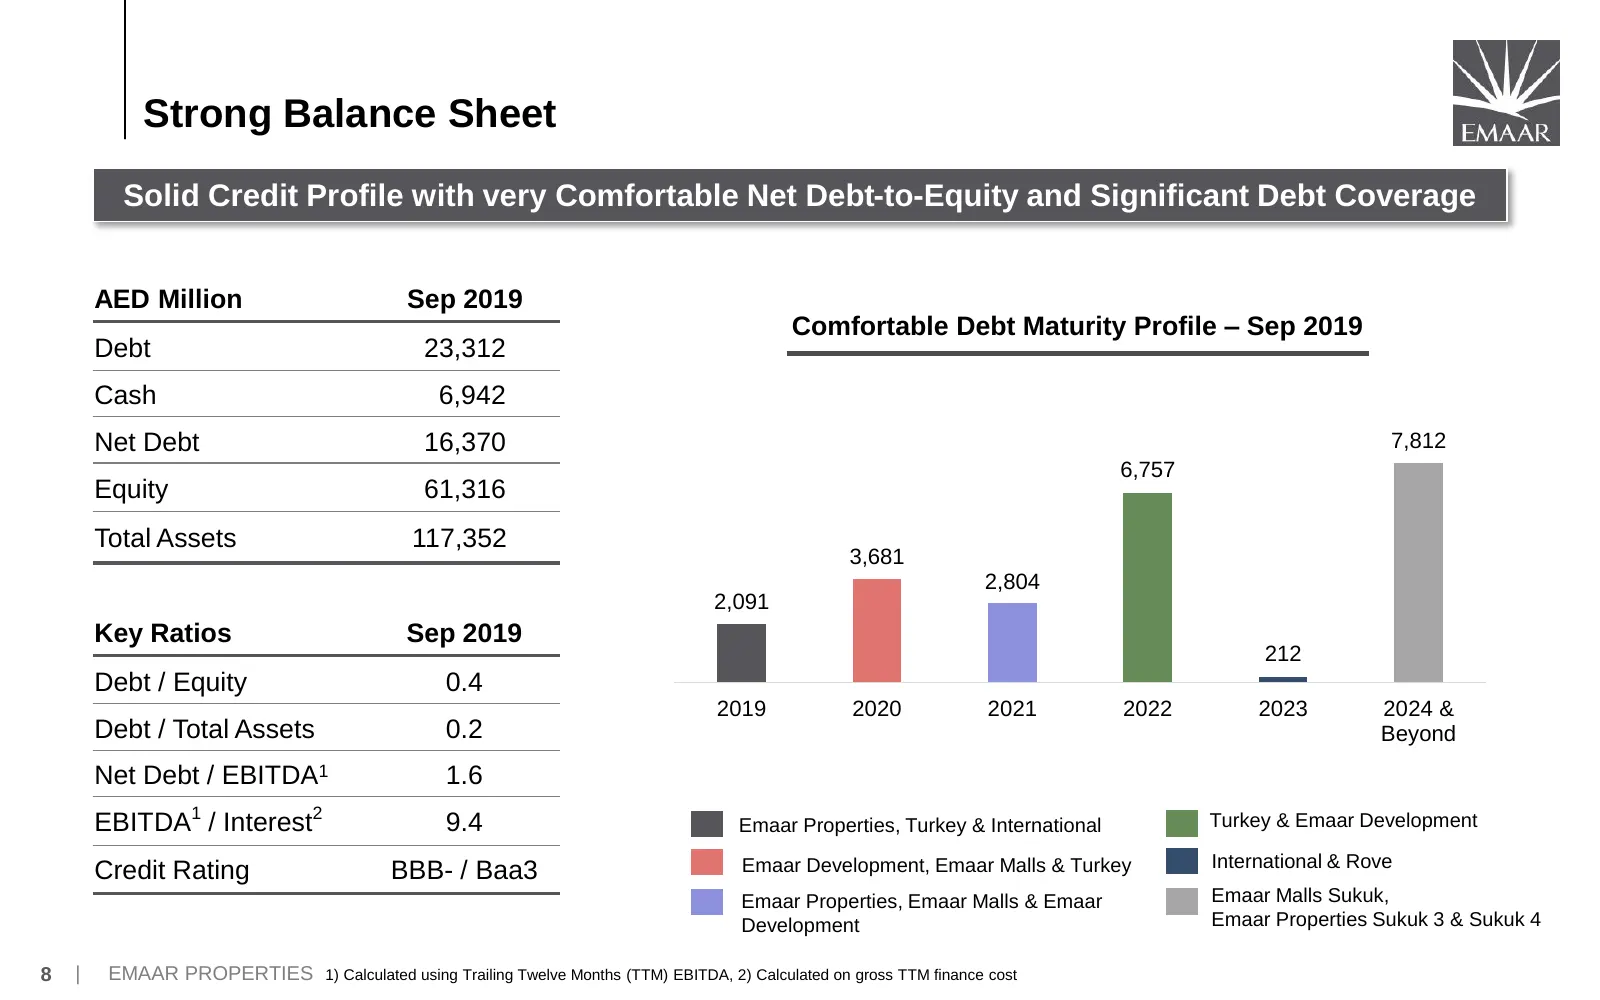
Strong Balance Sheet Solid Credit Profile with very Comfortable Net Debt-to-Equity and Significant Debt Coverage AED Million Sep 2019 Comfortable Debt Maturity Profile – Sep 2019 Debt 23,312 Cash 6,942 Net Debt 16,370 7,812 6,757 Equity 61,316 Total Assets 117,352 3,681 2,804 2,091 Key Ratios Sep 20
Slide 10: Emaar In “The Value Zone”
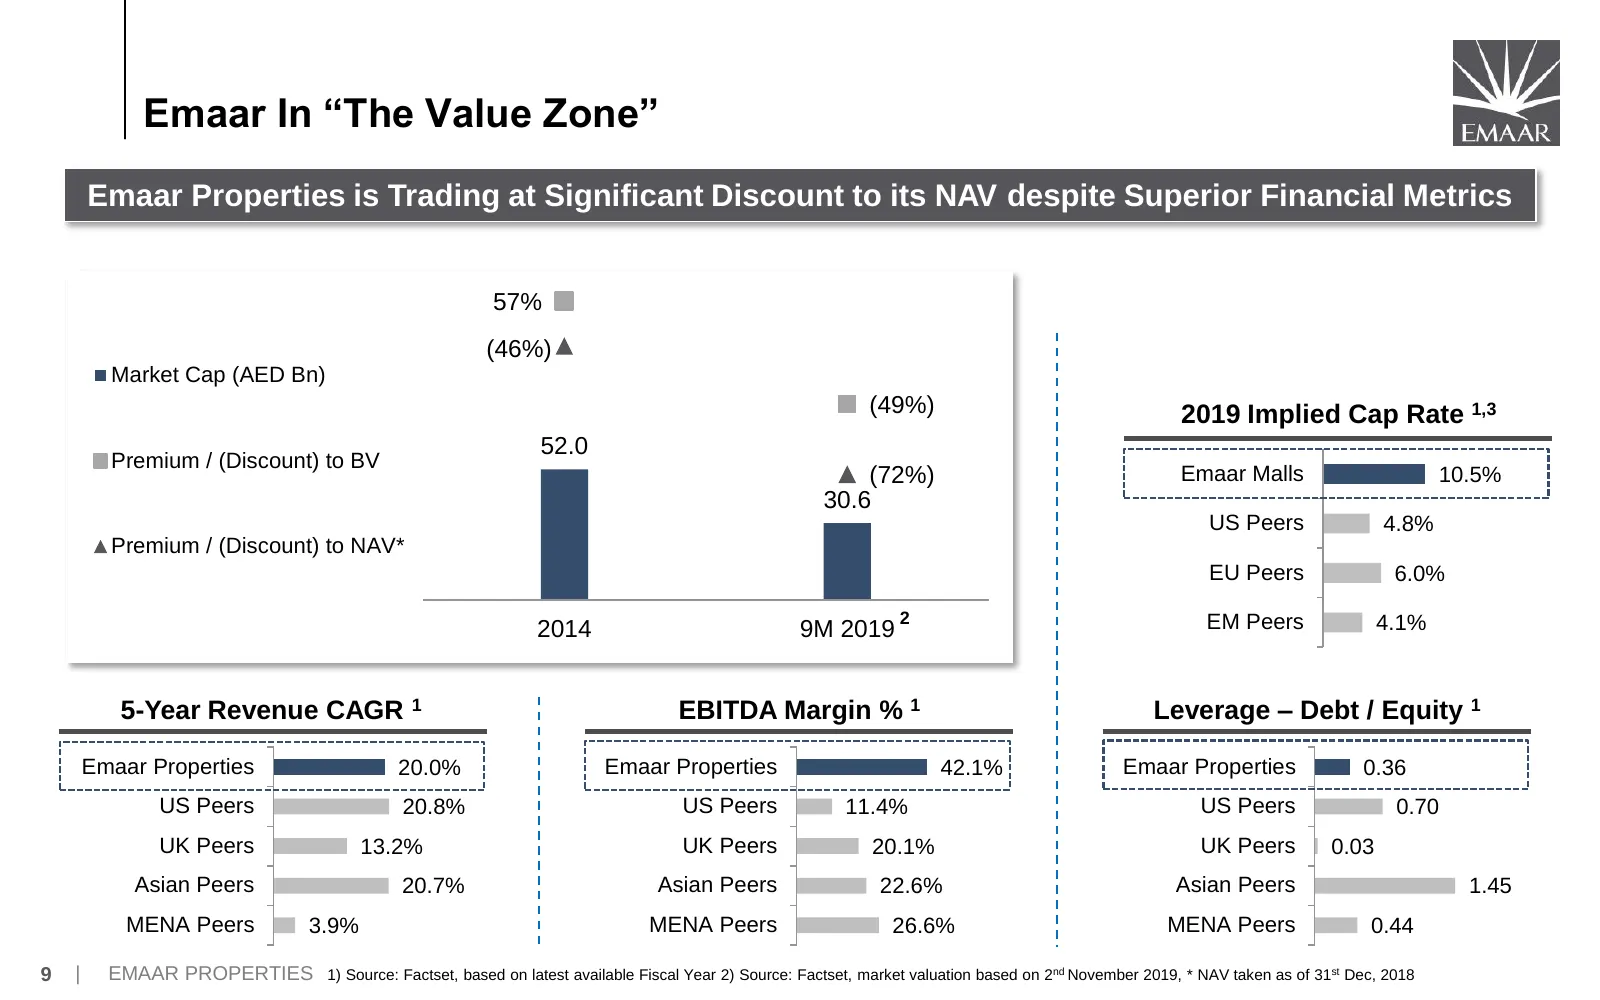
Emaar In “The Value Zone” Emaar Properties is Trading at Significant Discount to its NAV despite Superior Financial Metrics 57% (46%) Market Cap (AED Bn) (49%) 2019 Implied Cap Rate 1,3 52.0 Premium / (Discount) to BV (72%) Emaar Malls 10.5% 30.6 US Peers 4.8% Premium / (Discount) to NAV* EU Peers 6
Slide 11: Expanding Footprint in UAE & International Markets
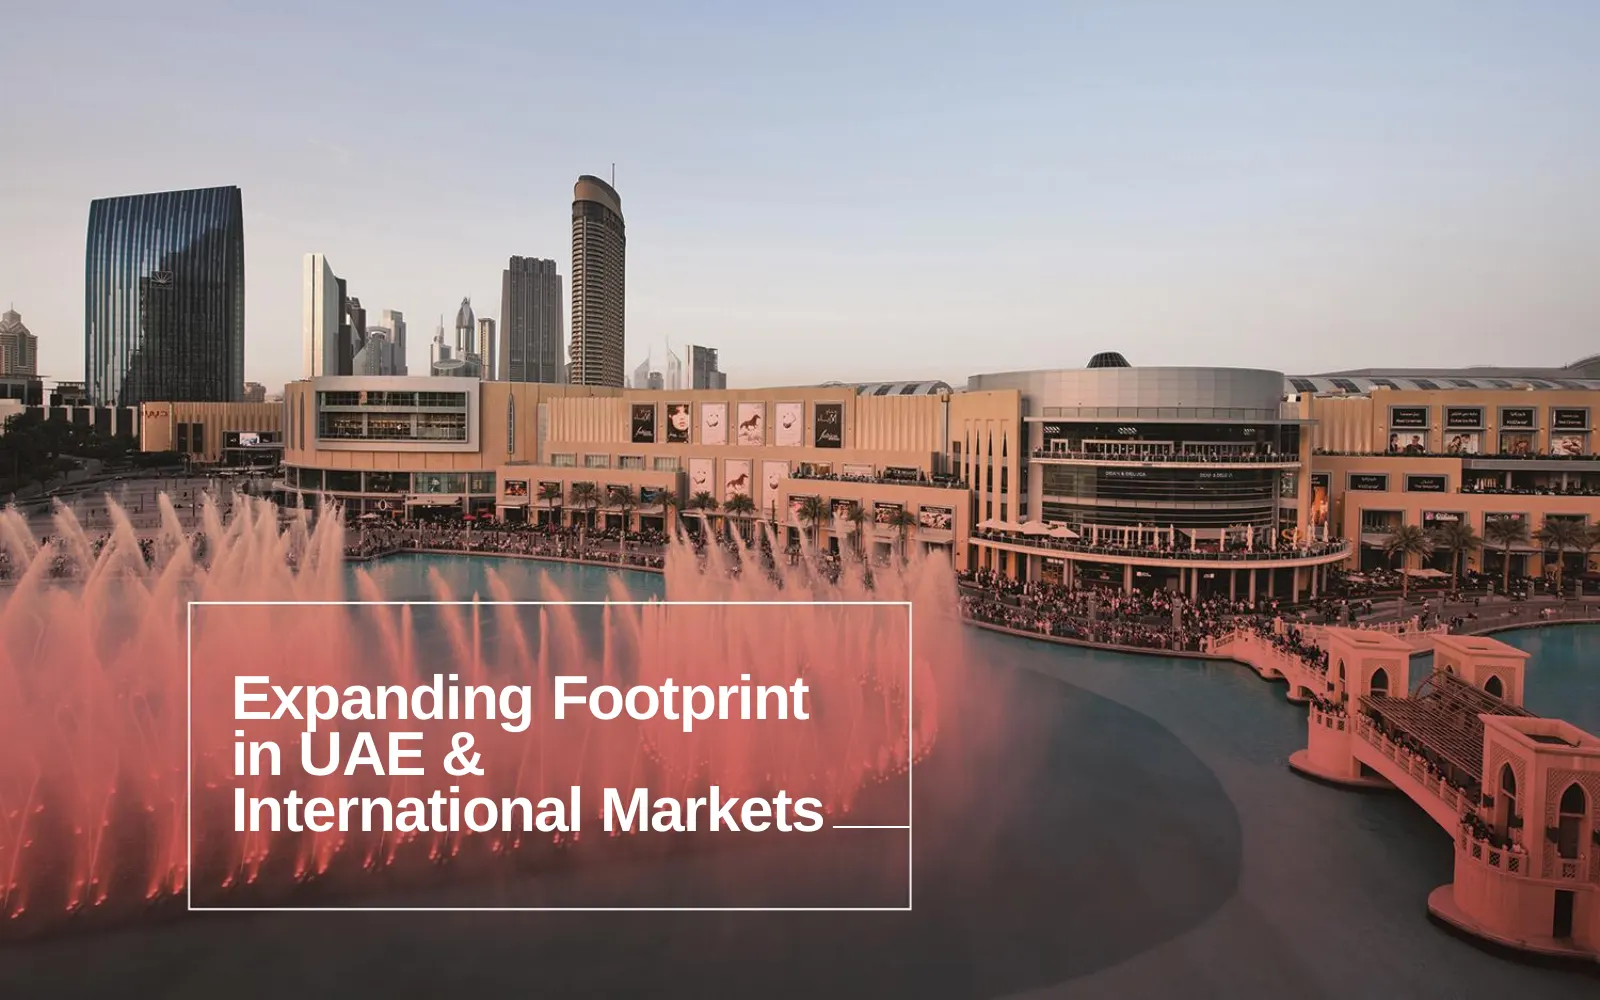
Expanding Footprint in UAE & International Markets 10 | EMAAR PROPERTIES
Slide 12: Developer of Iconic Master Plans Transforming Dubai
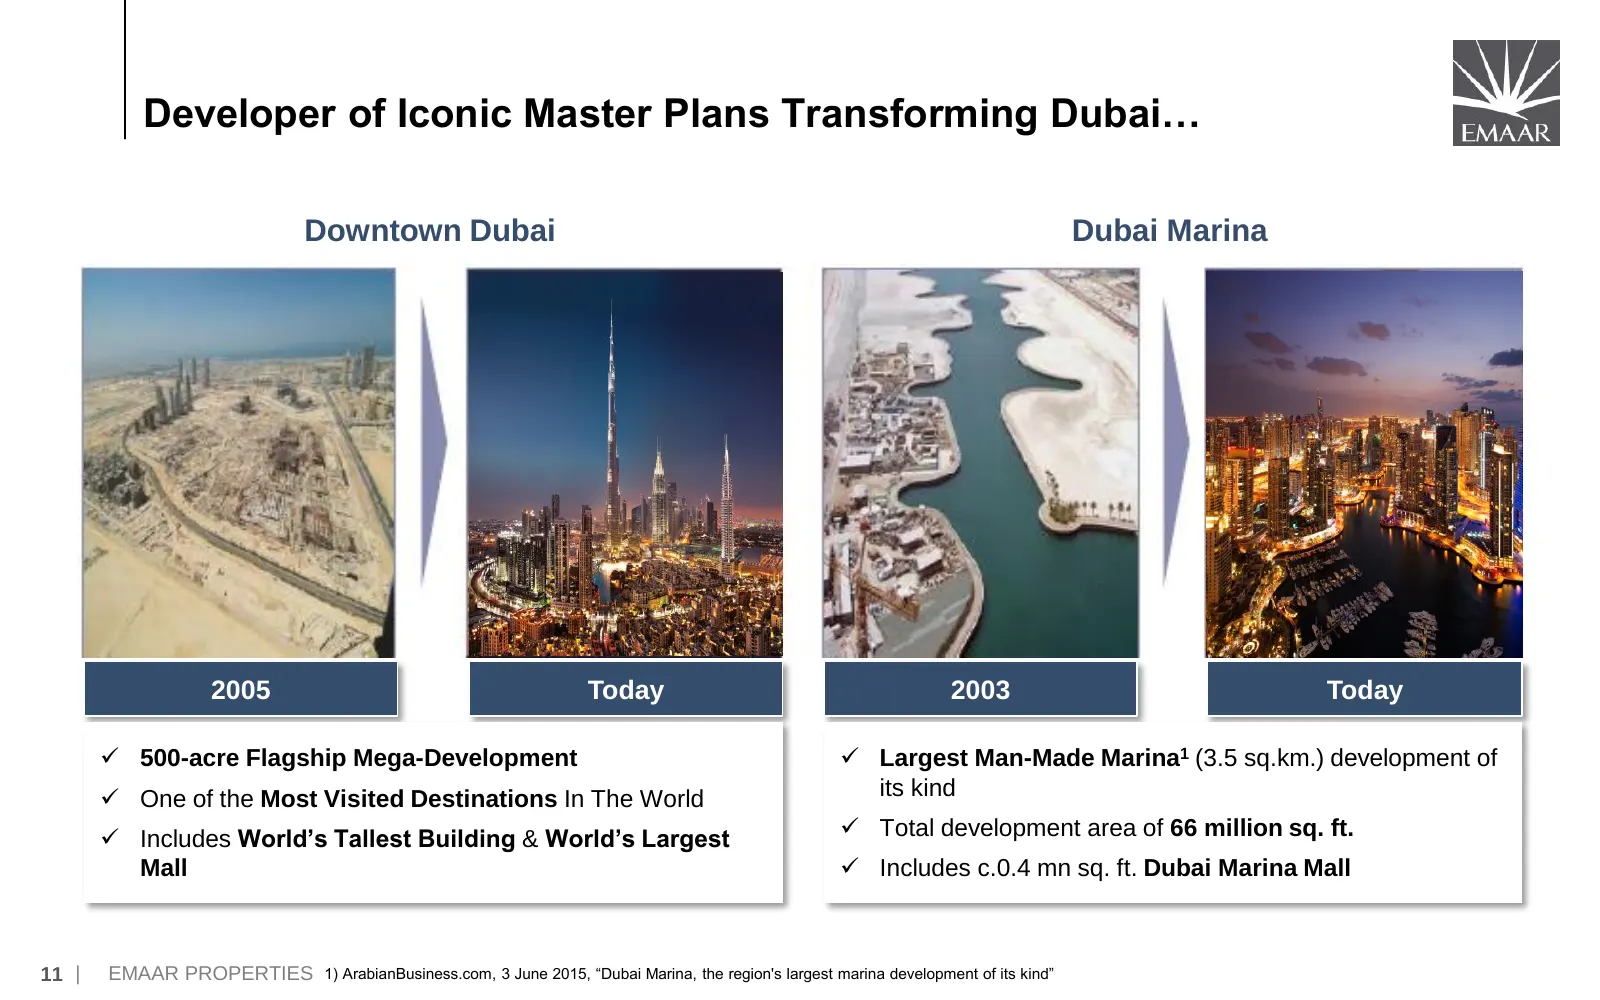
Developer of Iconic Master Plans Transforming Dubai… Downtown Dubai Dubai Marina 2005 Today 2003 Today ✓ 500-acre Flagship Mega-Development ✓ Largest Man-Made Marina1 (3.5 sq.km.) development of ✓ One of the Most Visited Destinations In The World its kind ✓ Includes World’s Tallest Building & World’
Slide 13: …Having Stood Multiple Tests of Time
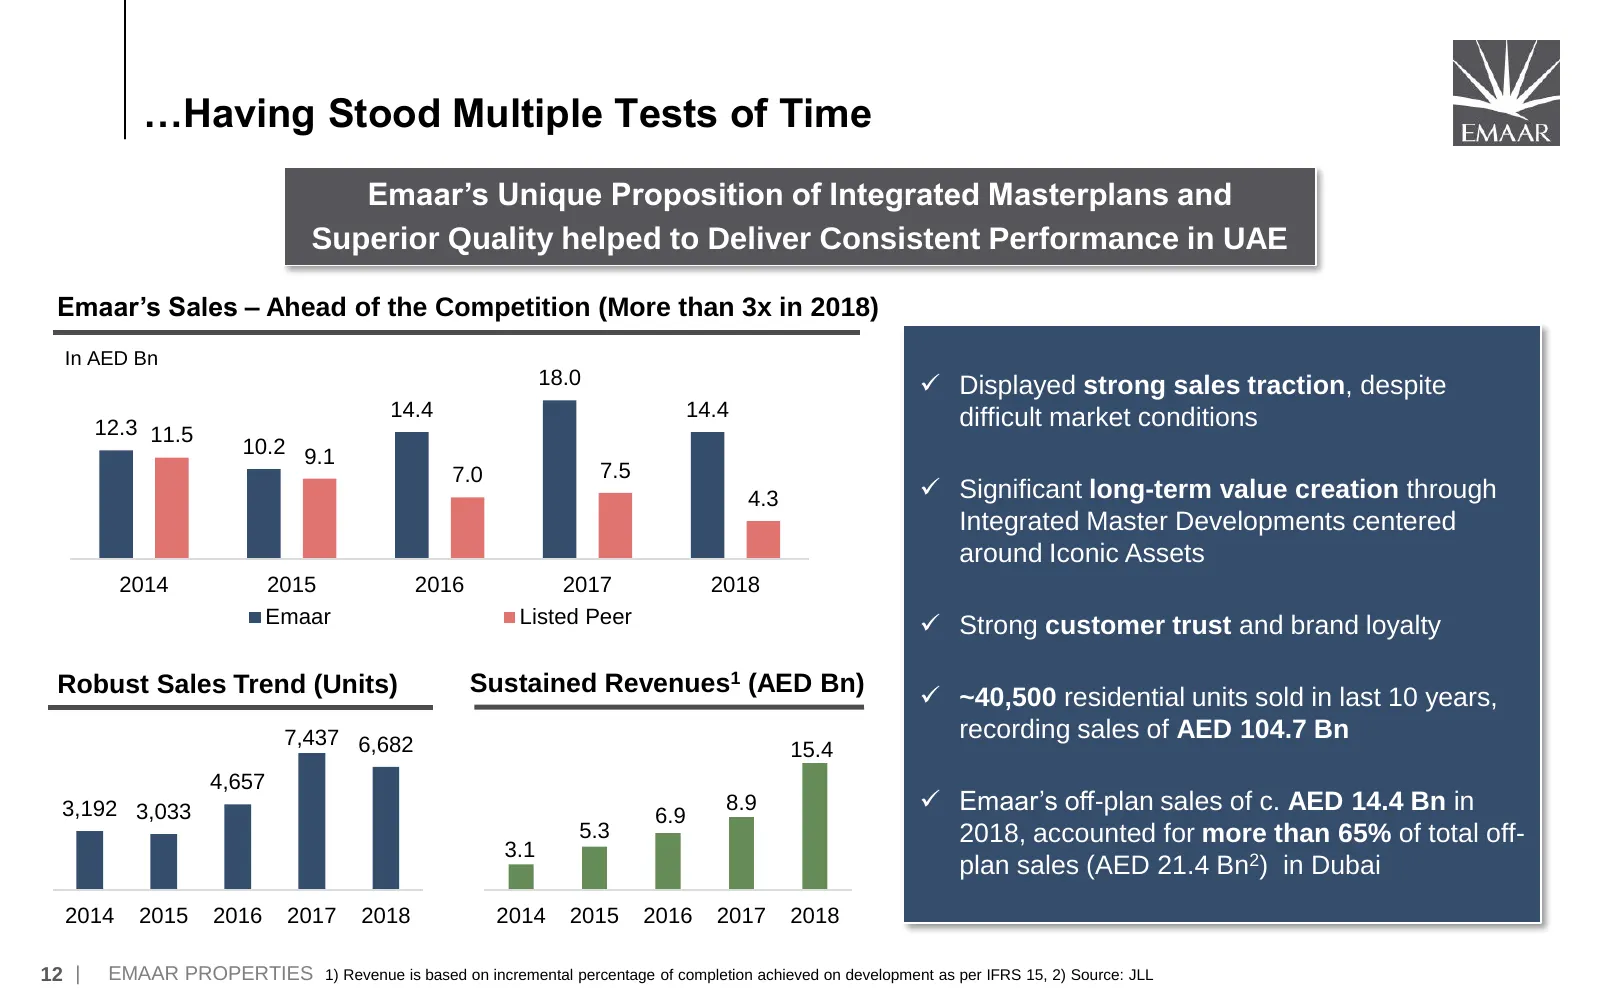
…Having Stood Multiple Tests of Time Emaar’s Unique Proposition of Integrated Masterplans and Superior Quality helped to Deliver Consistent Performance in UAE Emaar’s Sales – Ahead of the Competition (More than 3x in 2018) In AED Bn 18.0 ✓ Displayed strong sales traction, despite 14.4 14.4 difficult
Slide 14: Renowned For Its Iconic Retail Assets
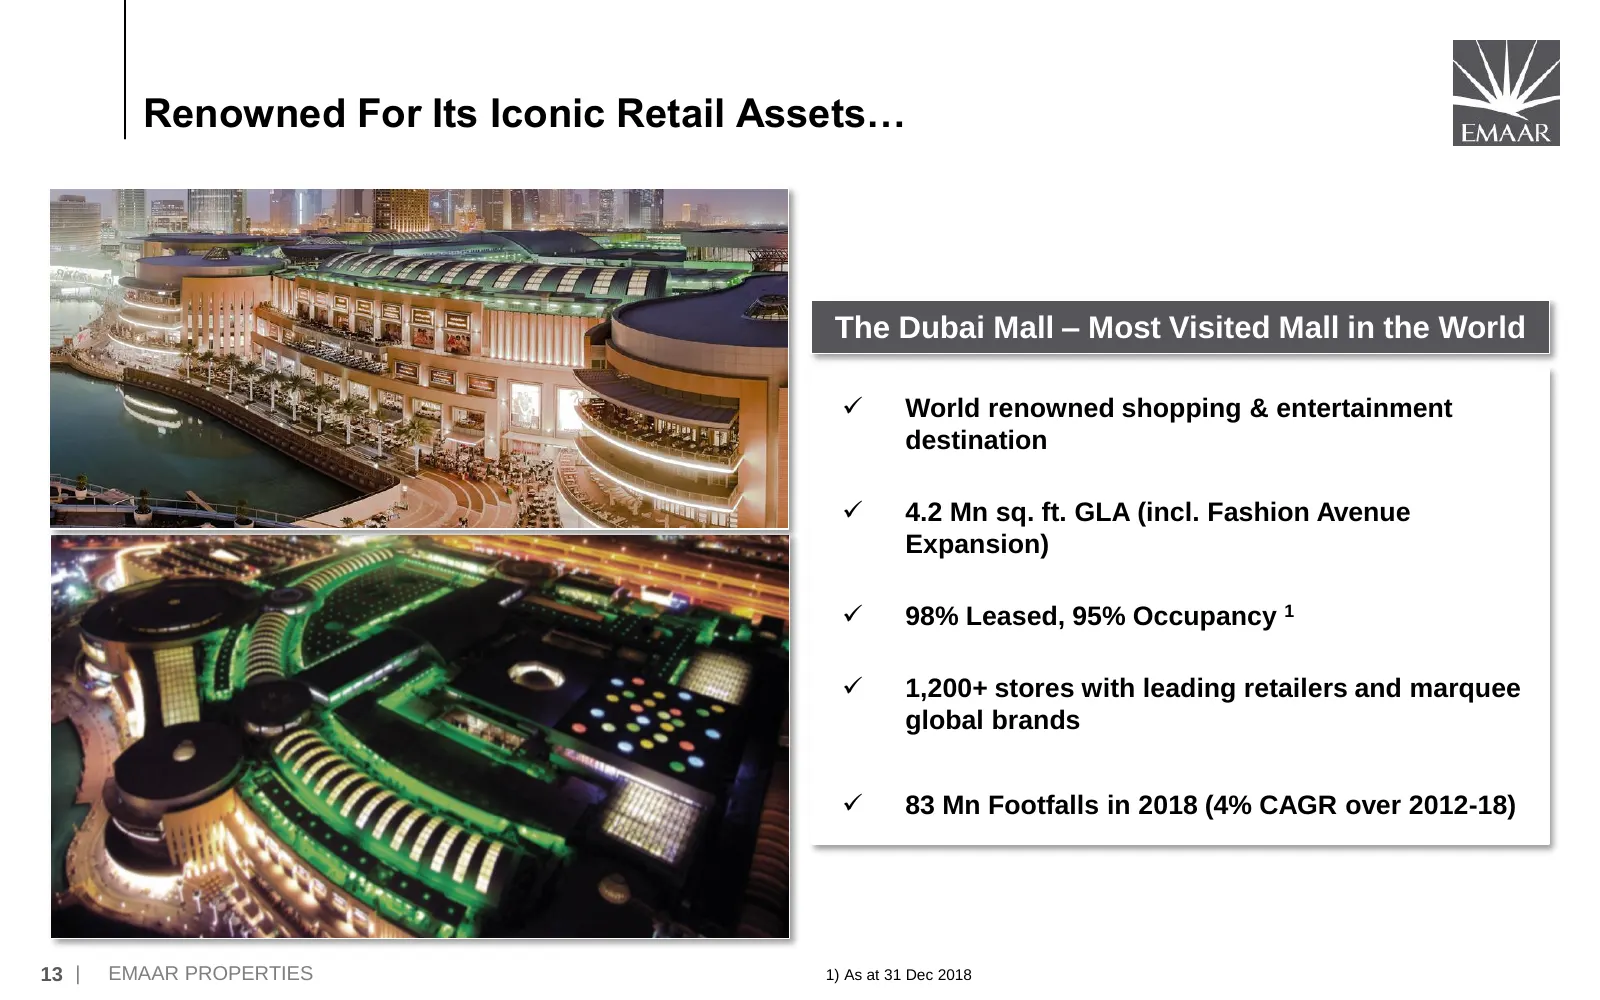
Renowned For Its Iconic Retail Assets… The Dubai Mall – Most Visited Mall in the World ✓ World renowned shopping & entertainment destination ✓ 4.2 Mn sq. ft. GLA (incl. Fashion Avenue Expansion) ✓ 98% Leased, 95% Occupancy 1 ✓ 1,200+ stores with leading retailers and marquee global brands ✓ 83 Mn Fo
Slide 15: …Delivering Robust Growth
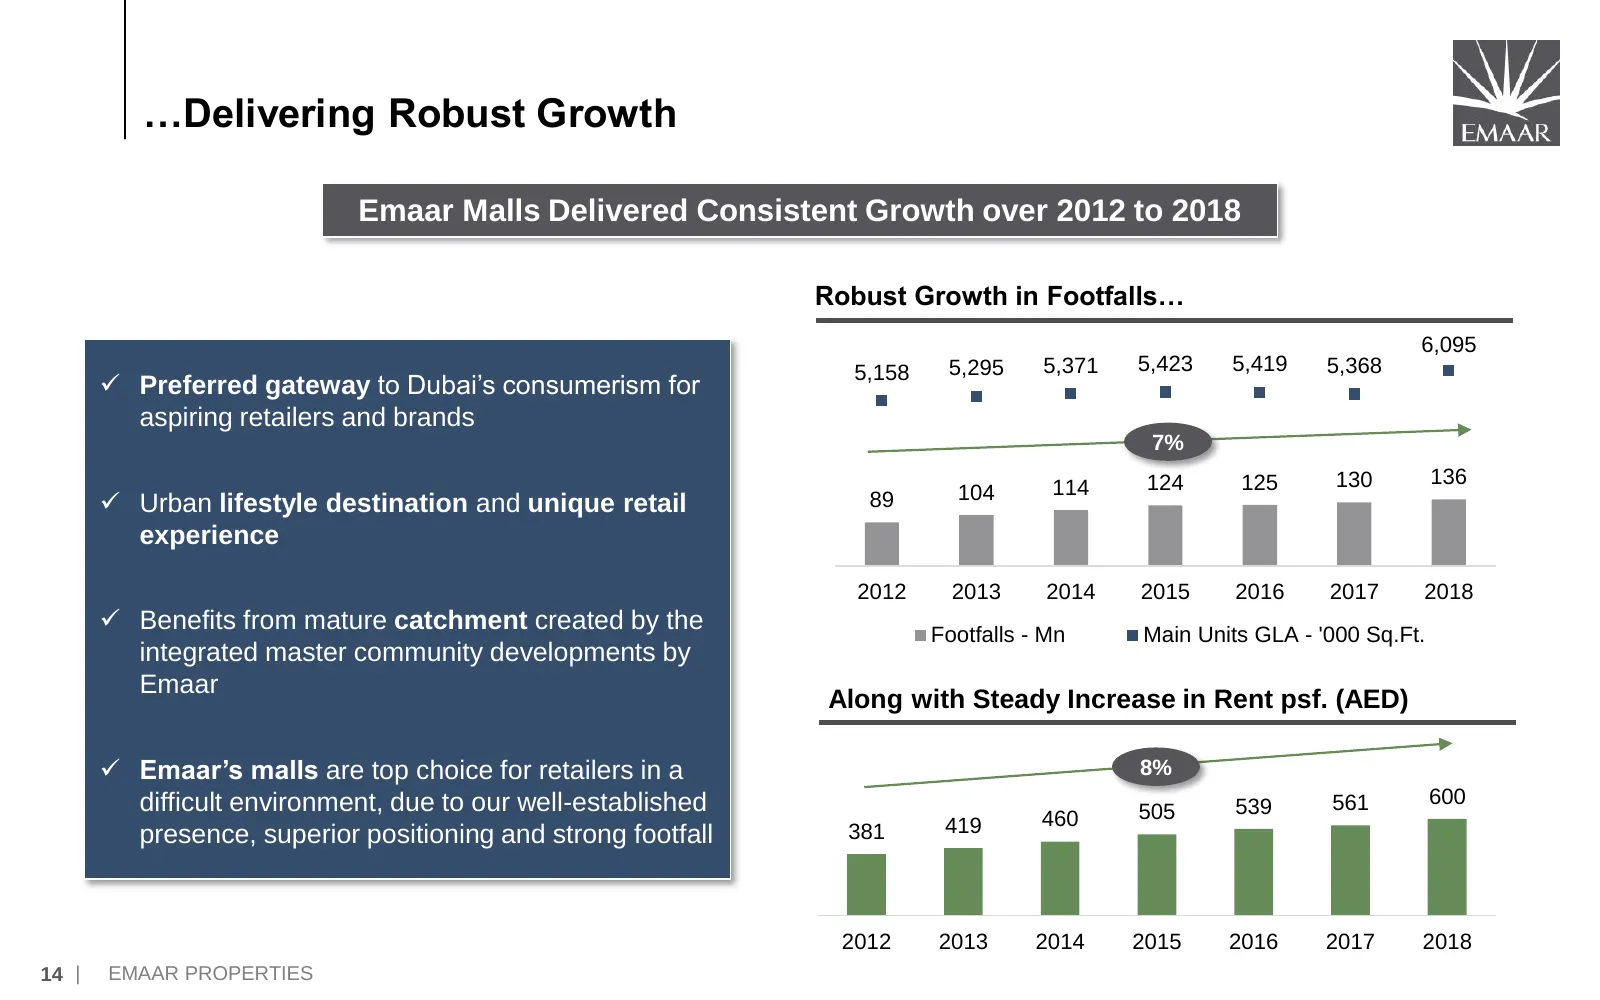
…Delivering Robust Growth Emaar Malls Delivered Consistent Growth over 2012 to 2018 Robust Growth in Footfalls… 6,095 5,158 5,295 5,371 5,423 5,419 5,368 ✓ Preferred gateway to Dubai’s consumerism for aspiring retailers and brands 7% 114 124 125 130 136 104 ✓ Urban lifestyle destination and unique r
Slide 16: …And Consistently Outperforming the Market
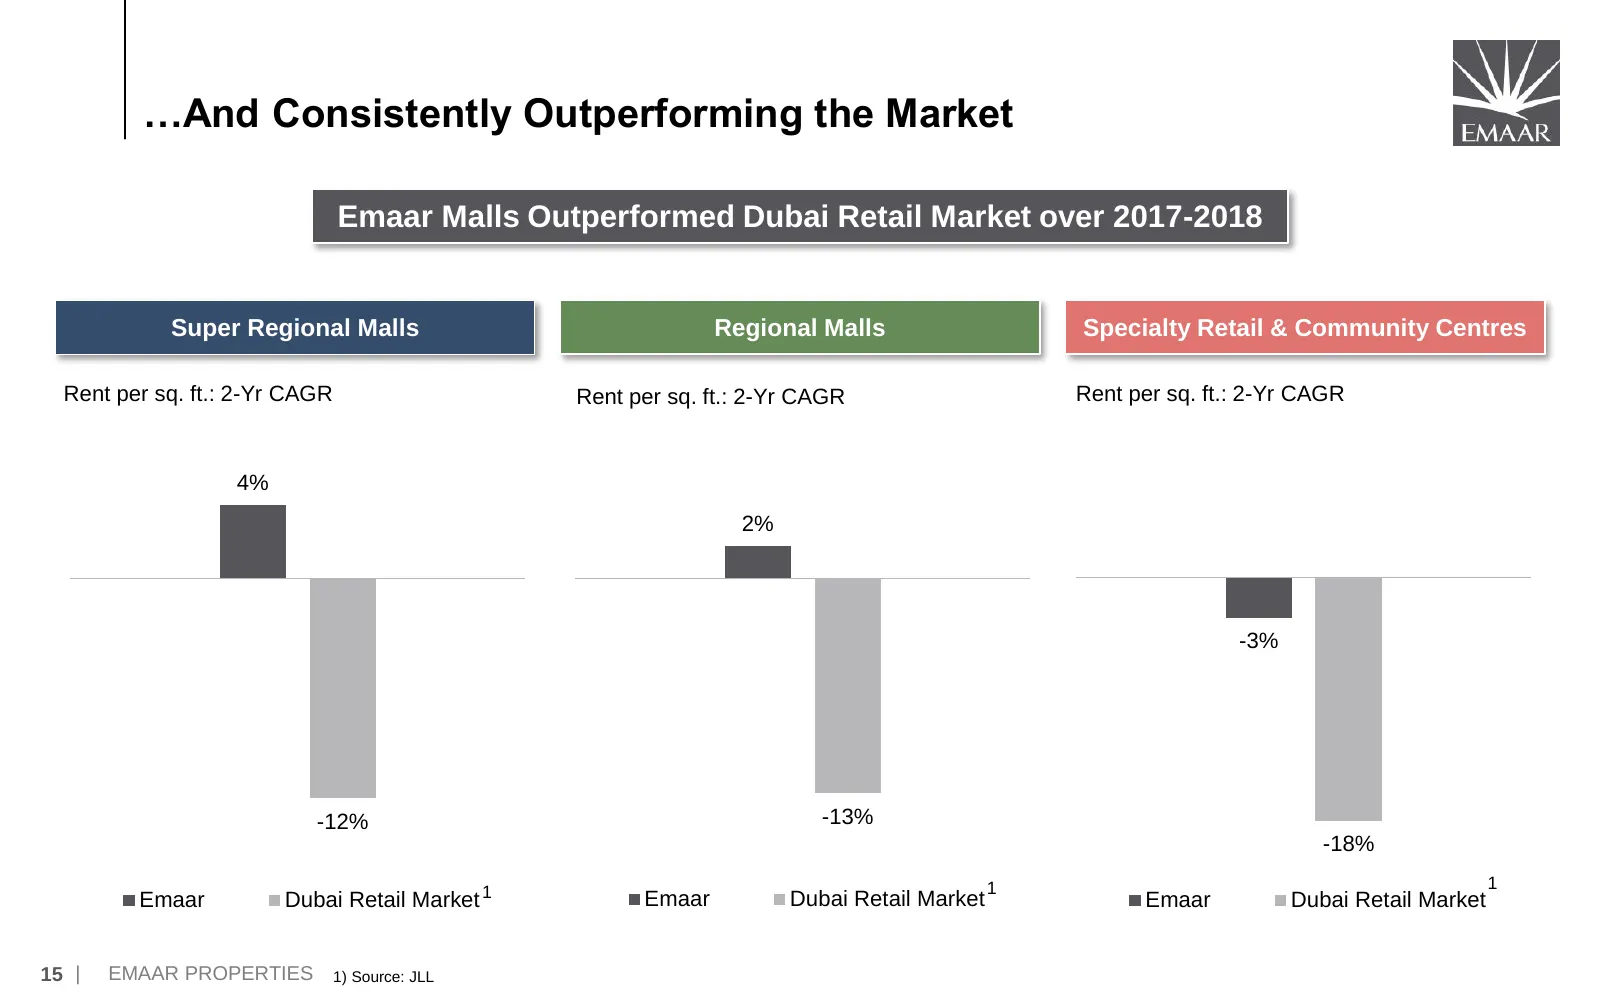
…And Consistently Outperforming the Market Emaar Malls Outperformed Dubai Retail Market over 2017-2018 Super Regional Malls Regional Malls Specialty Retail & Community Centres Rent per sq. ft.: 2-Yr CAGR Rent per sq. ft.: 2-Yr CAGR Rent per sq. ft.: 2-Yr CAGR 4% 2% -3% -12% -13% 2018 -18% 2018 2018
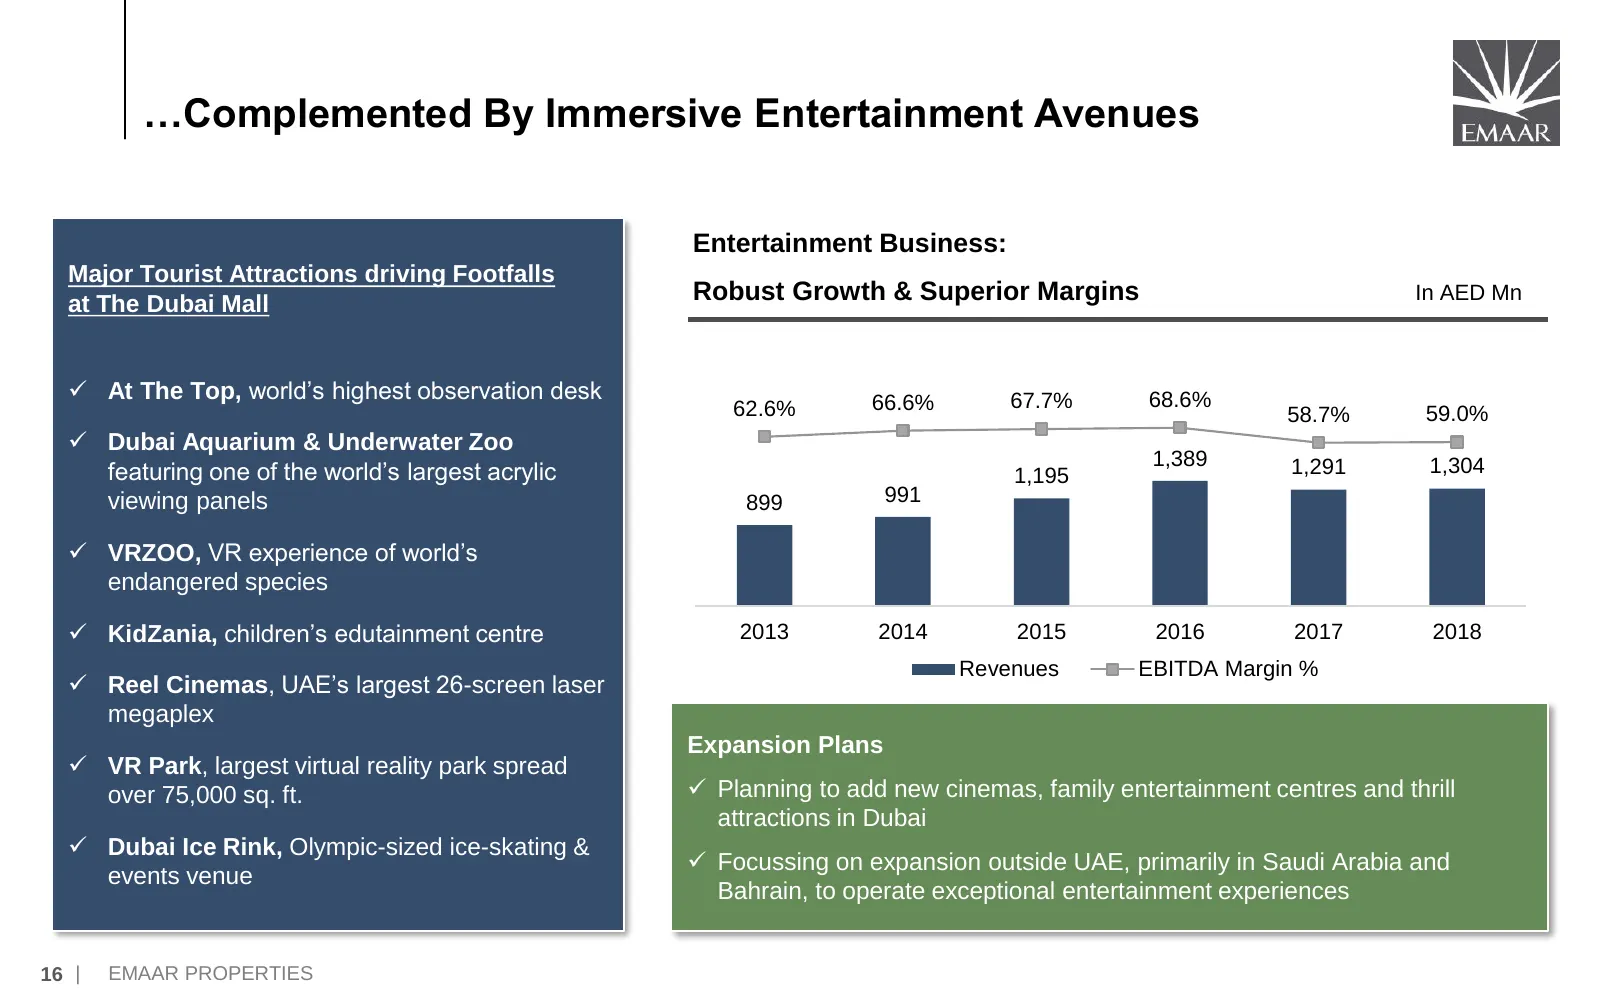
Slide 17: …Complemented By Immersive Entertainment Avenues
…Complemented By Immersive Entertainment Avenues Entertainment Business: Major Tourist Attractions driving Footfalls at The Dubai Mall Robust Growth & Superior Margins In AED Mn ✓ At The Top, world’s highest observation desk 66.6% 67.7% 68.6% 62.6% 58.7% 59.0% ✓ Dubai Aquarium & Underwater Zoo 1,389
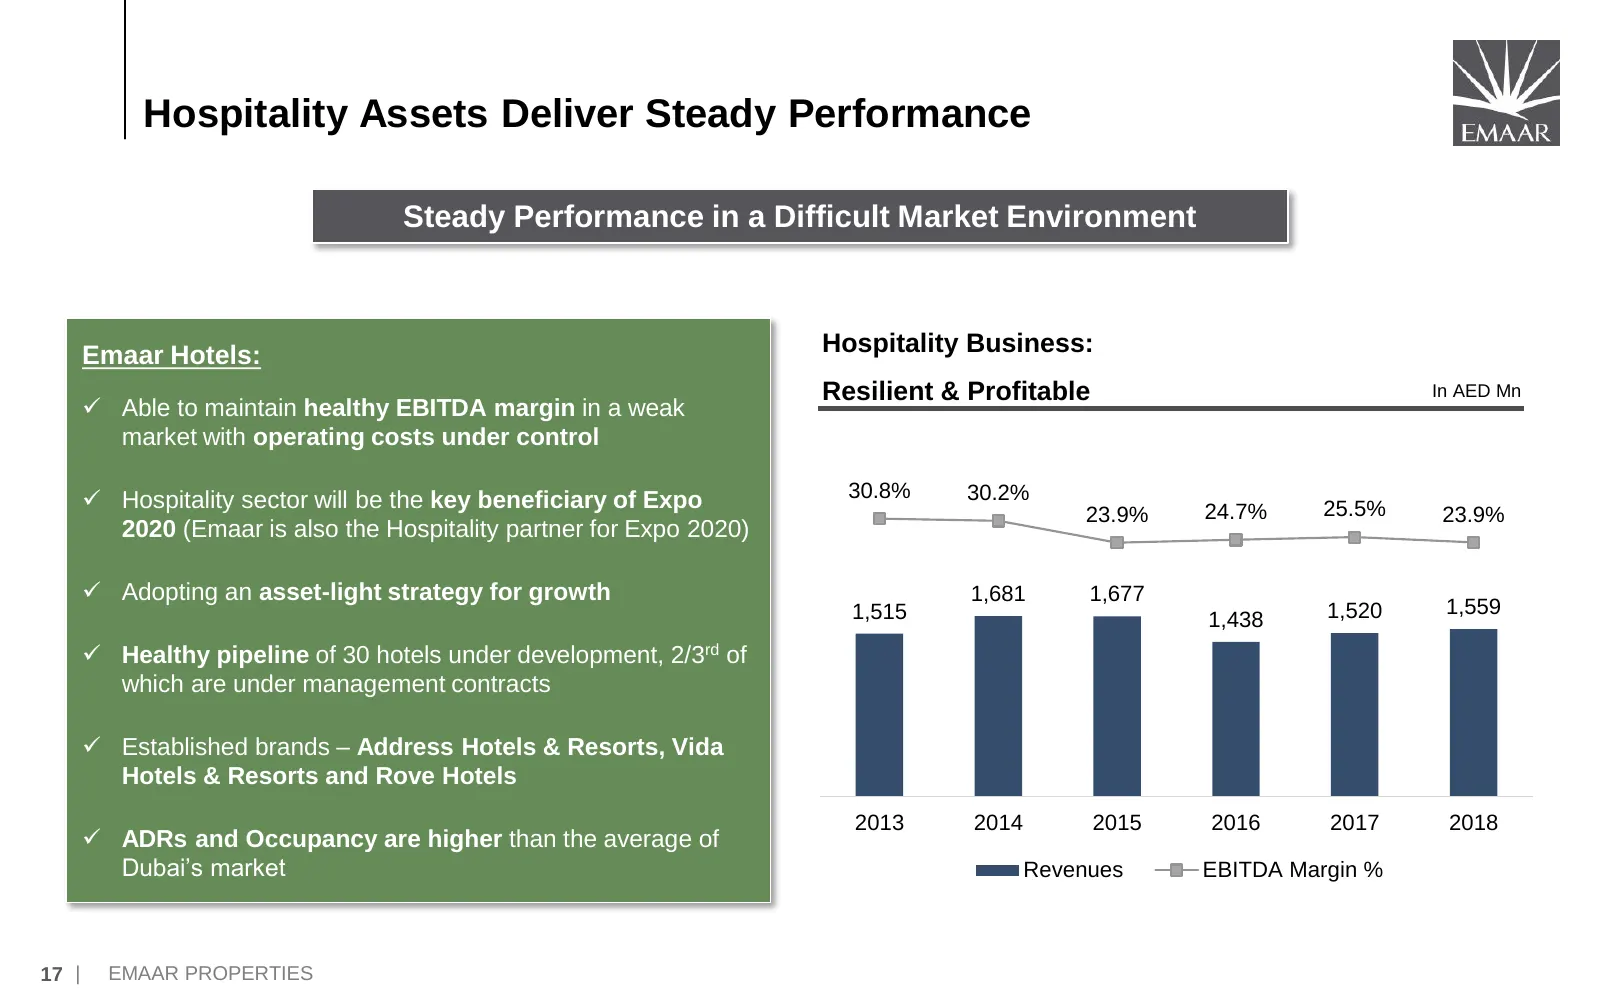
Slide 18: Hospitality Assets Deliver Steady Performance
Hospitality Assets Deliver Steady Performance Steady Performance in a Difficult Market Environment Emaar Hotels: Hospitality Business: Resilient & Profitable In AED Mn ✓ Able to maintain healthy EBITDA margin in a weak market with operating costs under control ✓ Hospitality sector will be the key be
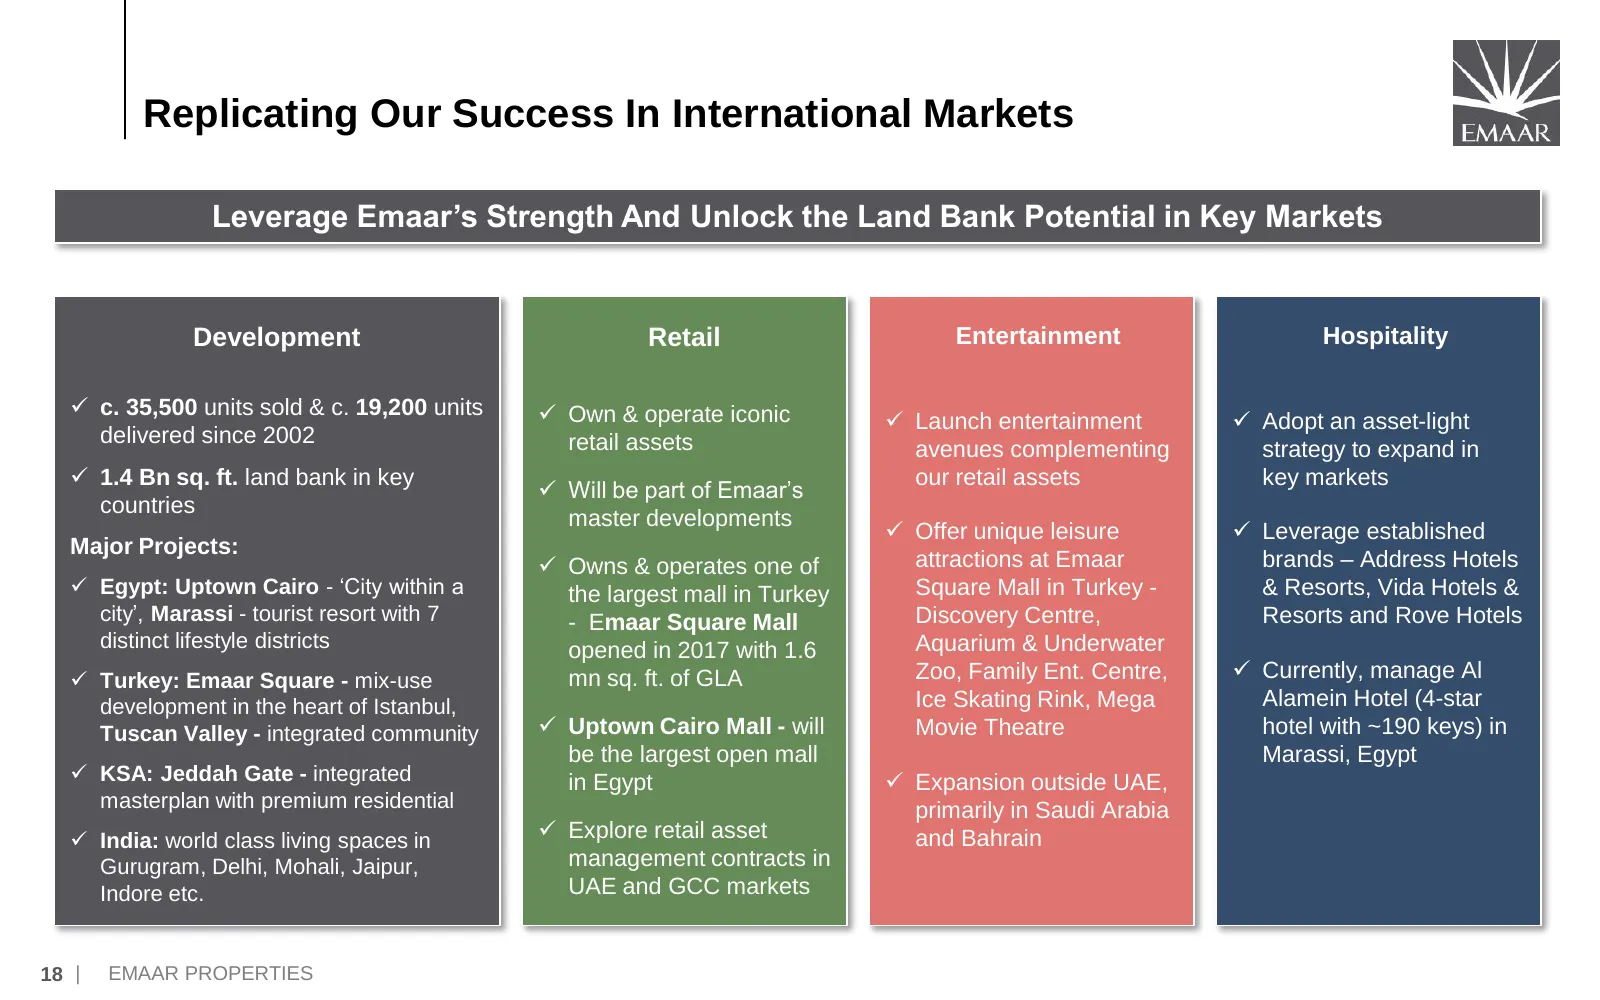
Slide 19: Replicating Our Success In International Markets
Replicating Our Success In International Markets Leverage Emaar’s Strength And Unlock the Land Bank Potential in Key Markets Development Retail Entertainment Hospitality ✓ c. 35,500 units sold & c. 19,200 units ✓ Own & operate iconic ✓ Launch entertainment ✓ Adopt an asset-light delivered since 2002
Slide 20: Business Strategy & Outlook
Business Strategy & Outlook 19 | EMAAR PROPERTIES
Slide 21: Top Priorities
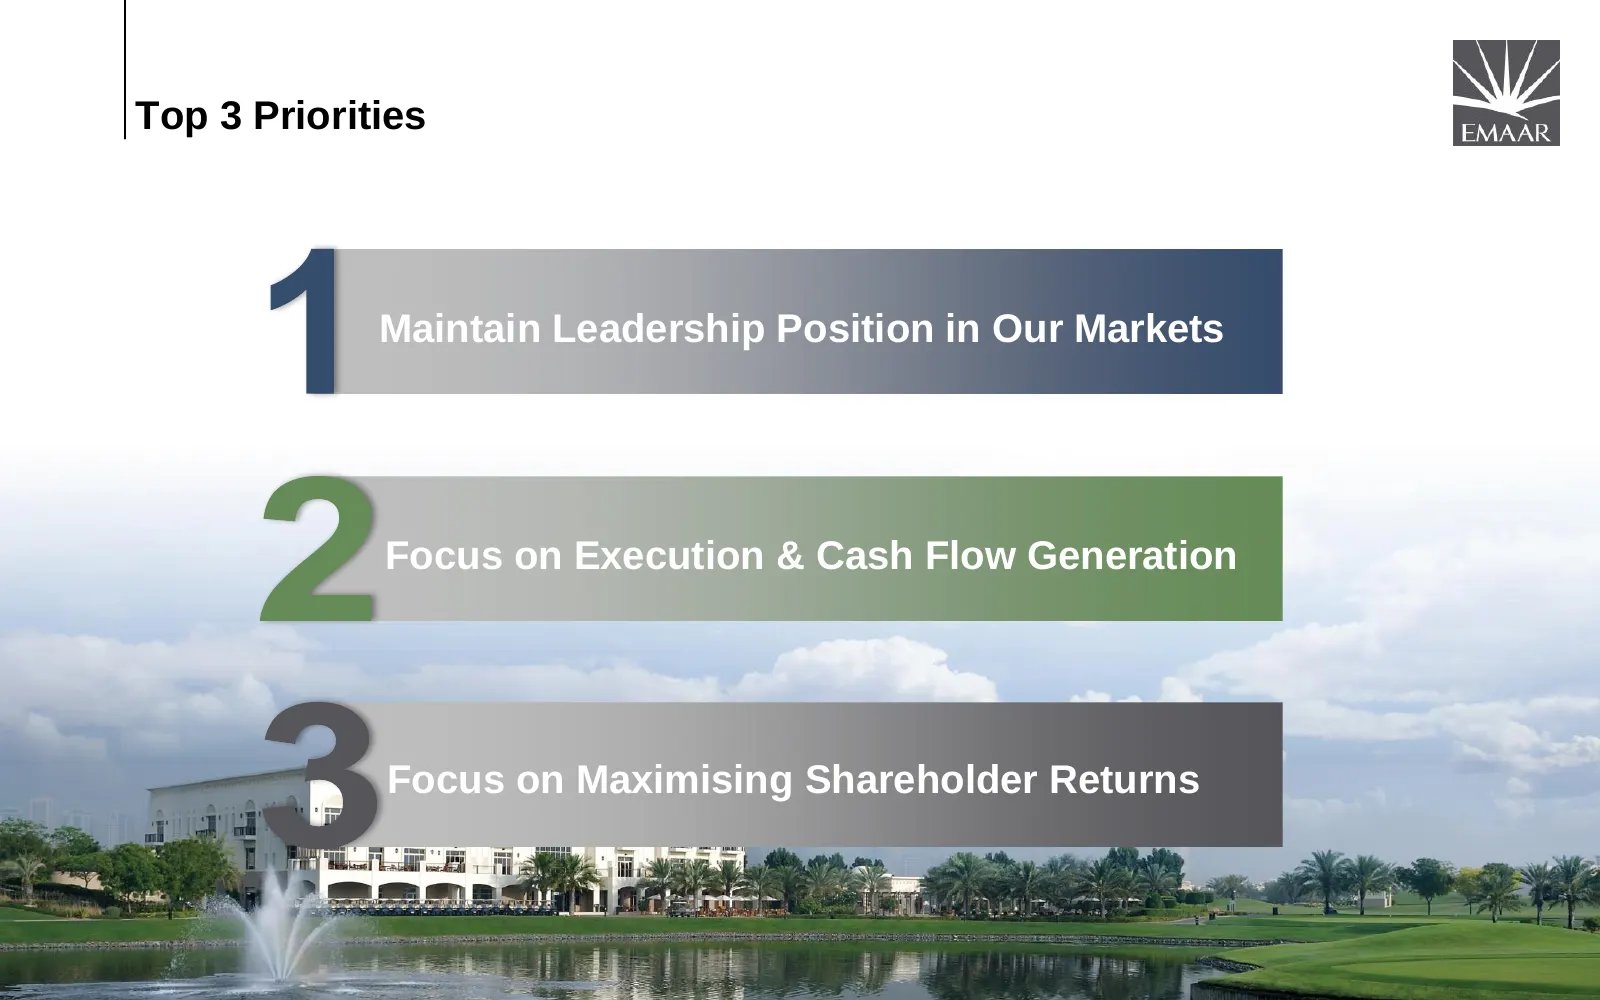
Top 3 Priorities Maintain Leadership Position in Our Markets Focus on Execution & Cash Flow Generation Focus on Maximising Shareholder Returns 20 | EMAAR PROPERTIES
Slide 22: Our Assessment Of The Dubai’s Economy
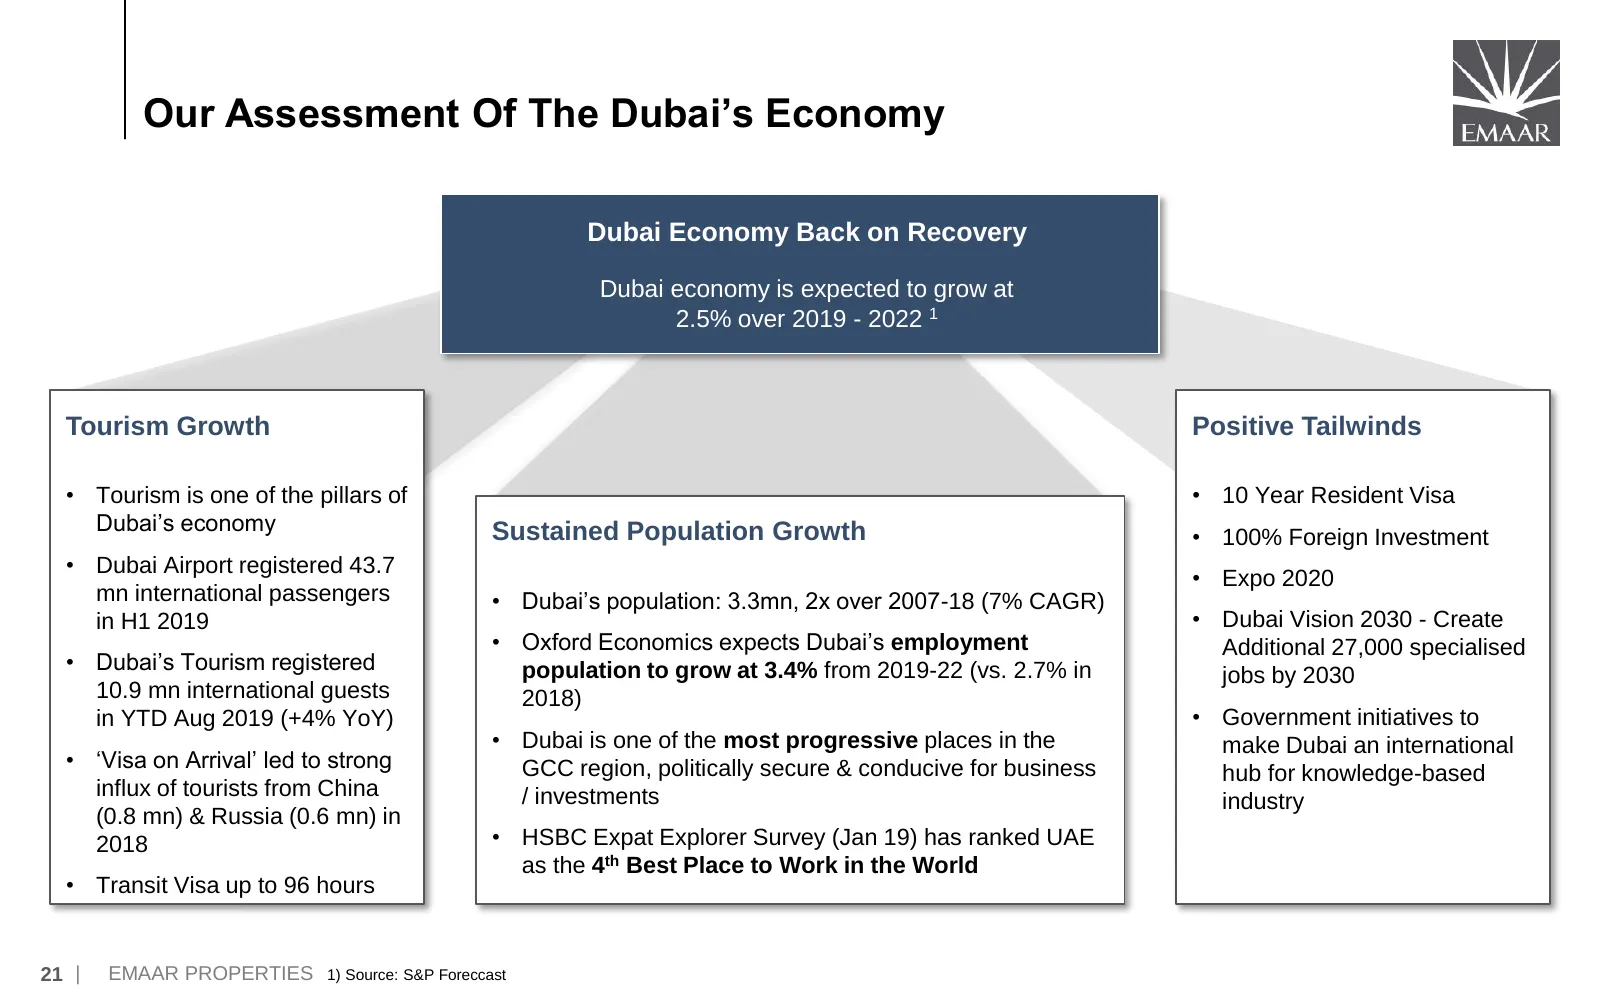
Our Assessment Of The Dubai’s Economy Dubai Economy Back on Recovery Dubai economy is expected to grow at 2.5% over 2019 - 2022 1 Tourism Growth Positive Tailwinds • Tourism is one of the pillars of • 10 Year Resident Visa Dubai’s economy Sustained Population Growth • 100% Foreign Investment • Dubai
Slide 23: Residential Real Estate To Gradually Move Towards Equilibrium
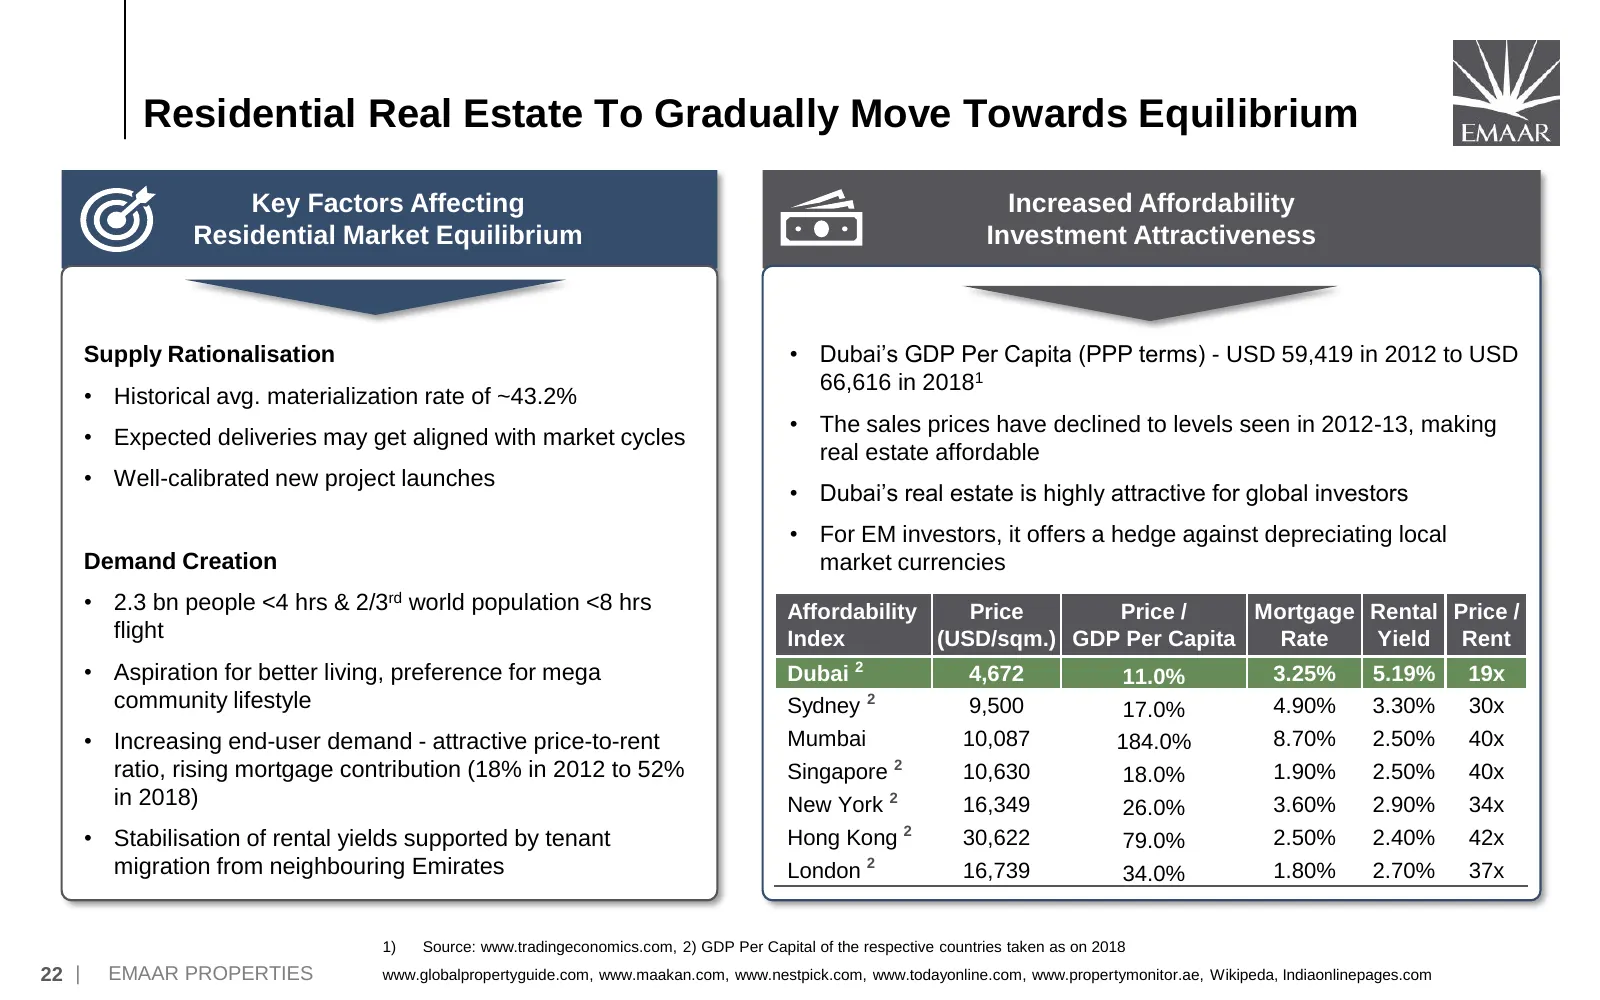
Residential Real Estate To Gradually Move Towards Equilibrium Key Factors Affecting Increased Affordability Residential Market Equilibrium Investment Attractiveness Supply Rationalisation • Dubai’s GDP Per Capita (PPP terms) - USD 59,419 in 2012 to USD 66,616 in 20181 • Historical avg. materializati
Slide 24: UAE Development Strategy: Consolidate and Prepare for the Next Growth Phase
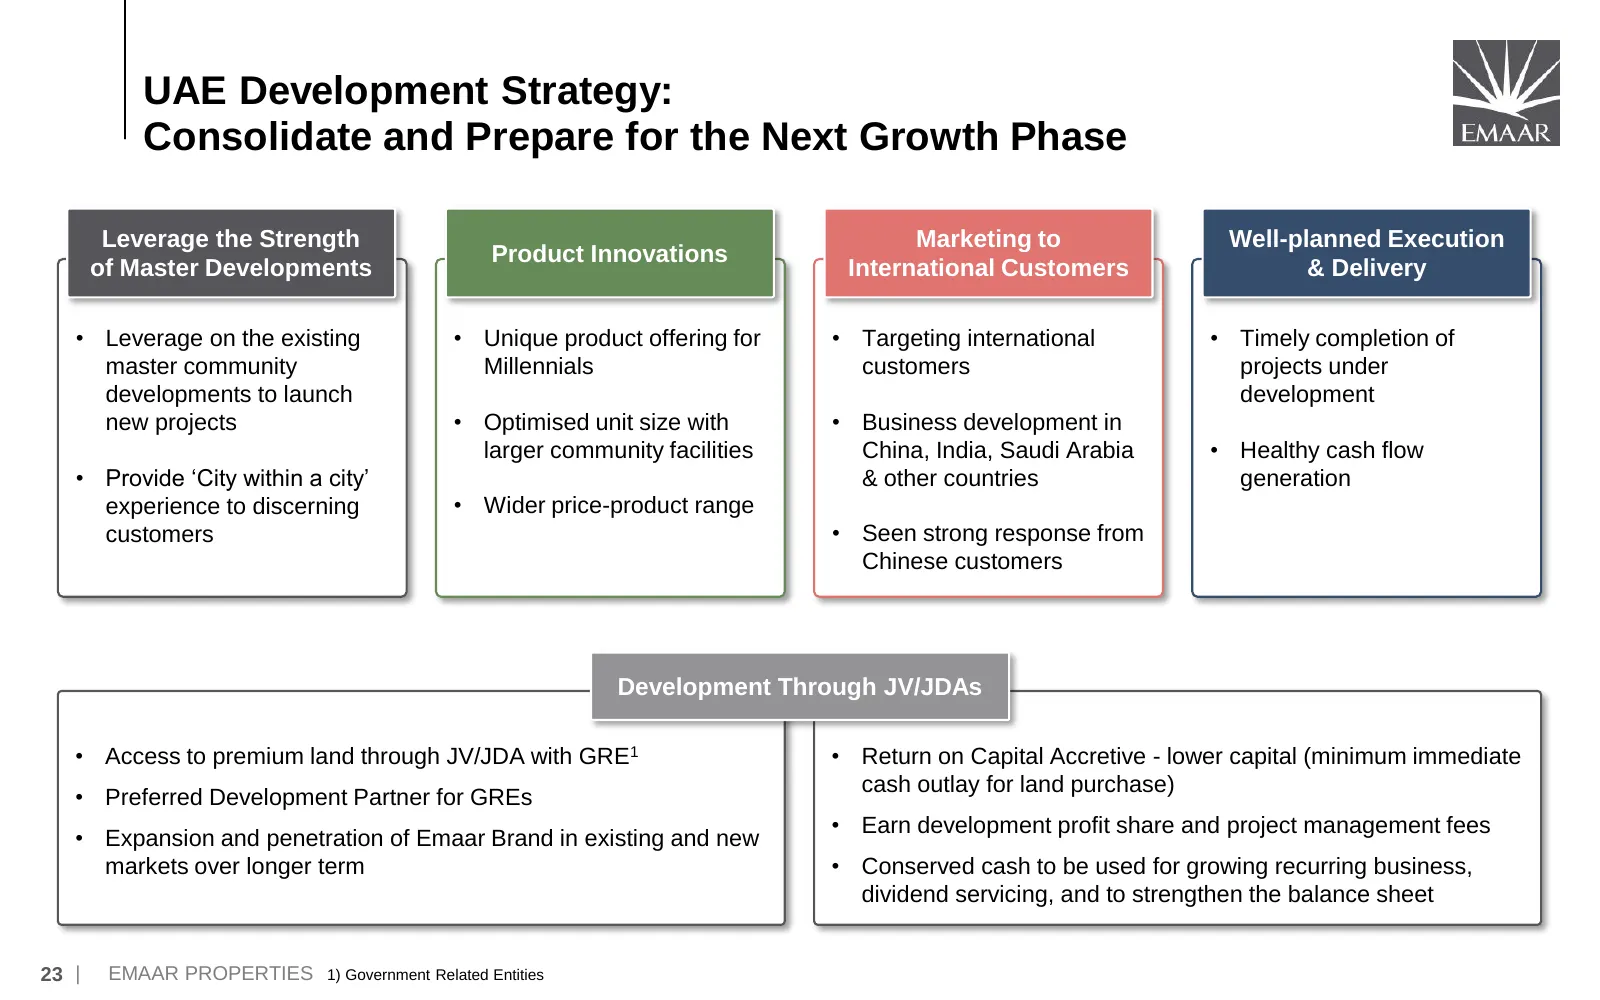
UAE Development Strategy: Consolidate and Prepare for the Next Growth Phase Leverage the Strength Marketing to Well-planned Execution Product Innovations of Master Developments International Customers & Delivery • Leverage on the existing • Unique product offering for • Targeting international • Tim
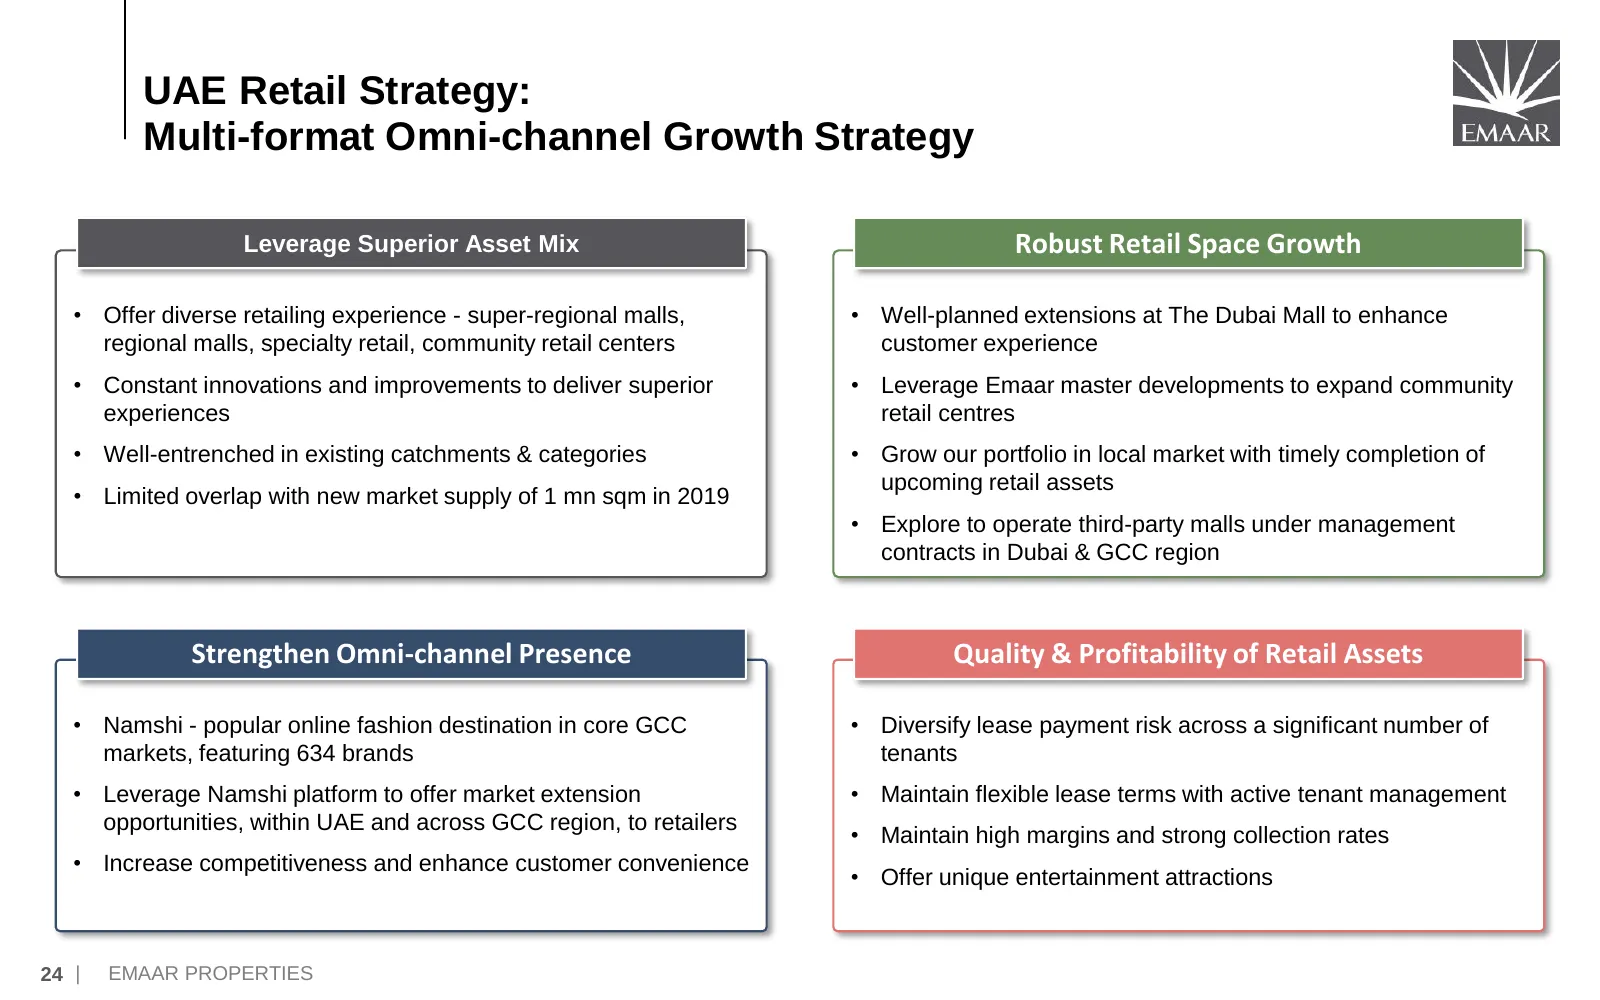
Slide 25: UAE Retail Strategy: Multi-format Omni-channel Growth Strategy
UAE Retail Strategy: Multi-format Omni-channel Growth Strategy Leverage Superior Asset Mix Robust Retail Space Growth • Offer diverse retailing experience - super-regional malls, • Well-planned extensions at The Dubai Mall to enhance regional malls, specialty retail, community retail centers custome
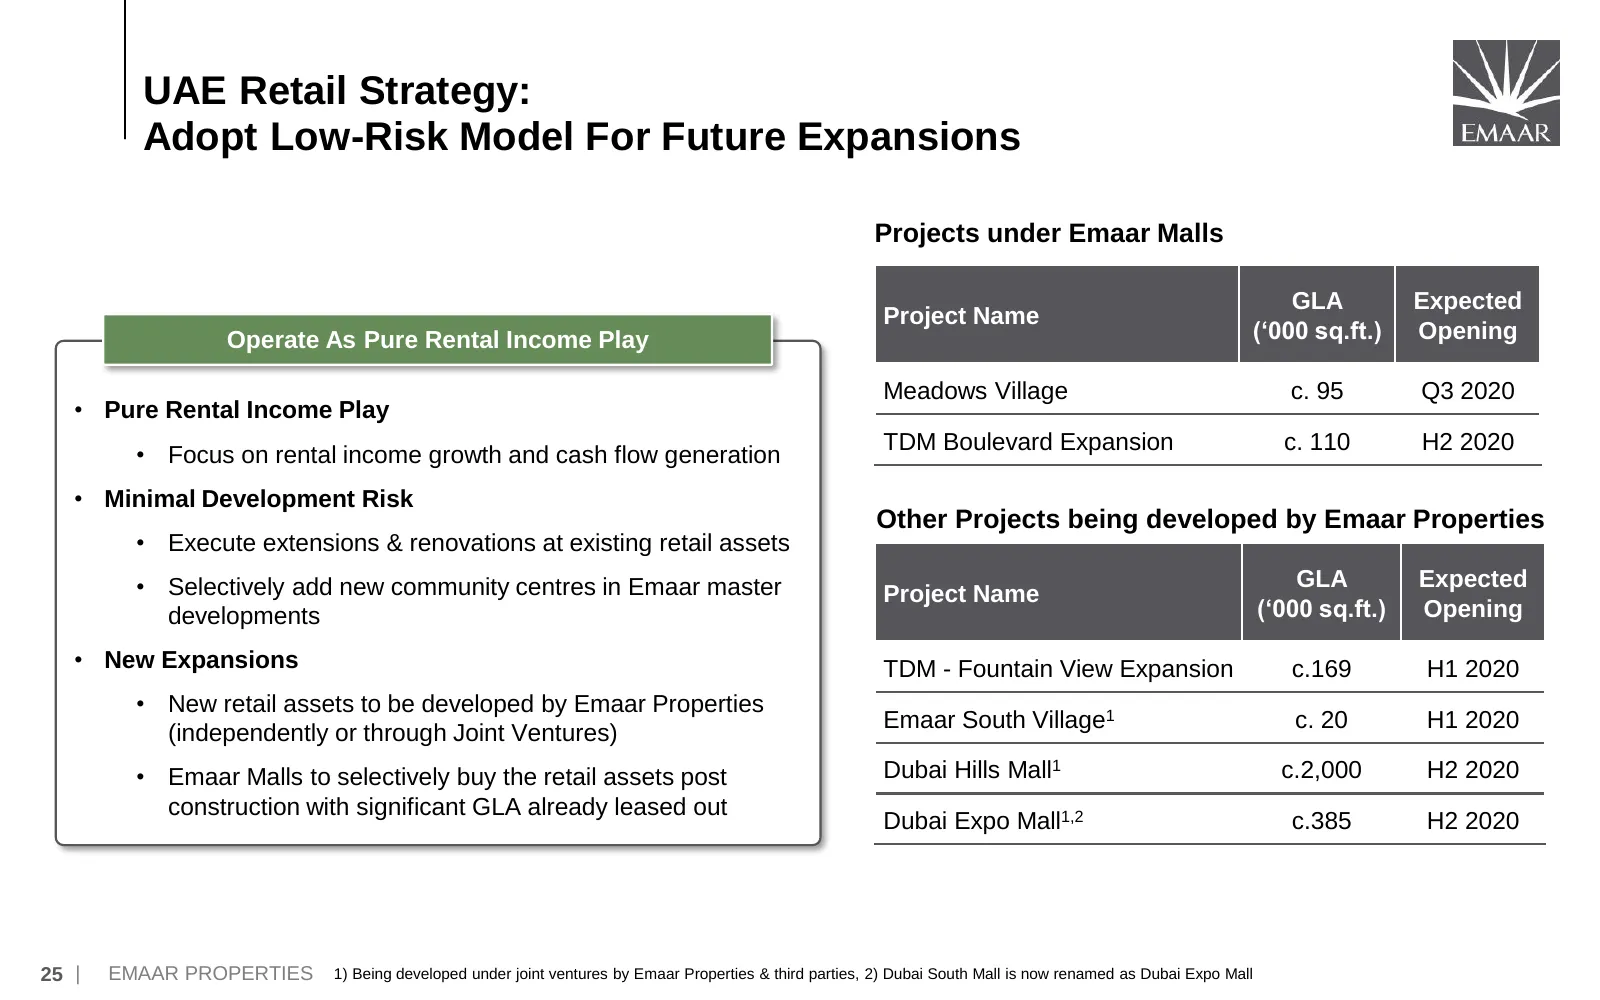
Slide 26: UAE Retail Strategy: Adopt Low-Risk Model For Future Expansions
UAE Retail Strategy: Adopt Low-Risk Model For Future Expansions Projects under Emaar Malls GLA Expected Project Name Operate As Pure Rental Income Play (‘000 sq.ft.) Opening Meadows Village c. 95 Q3 2020 • Pure Rental Income Play TDM Boulevard Expansion c. 110 H2 2020 • Focus on rental income growth
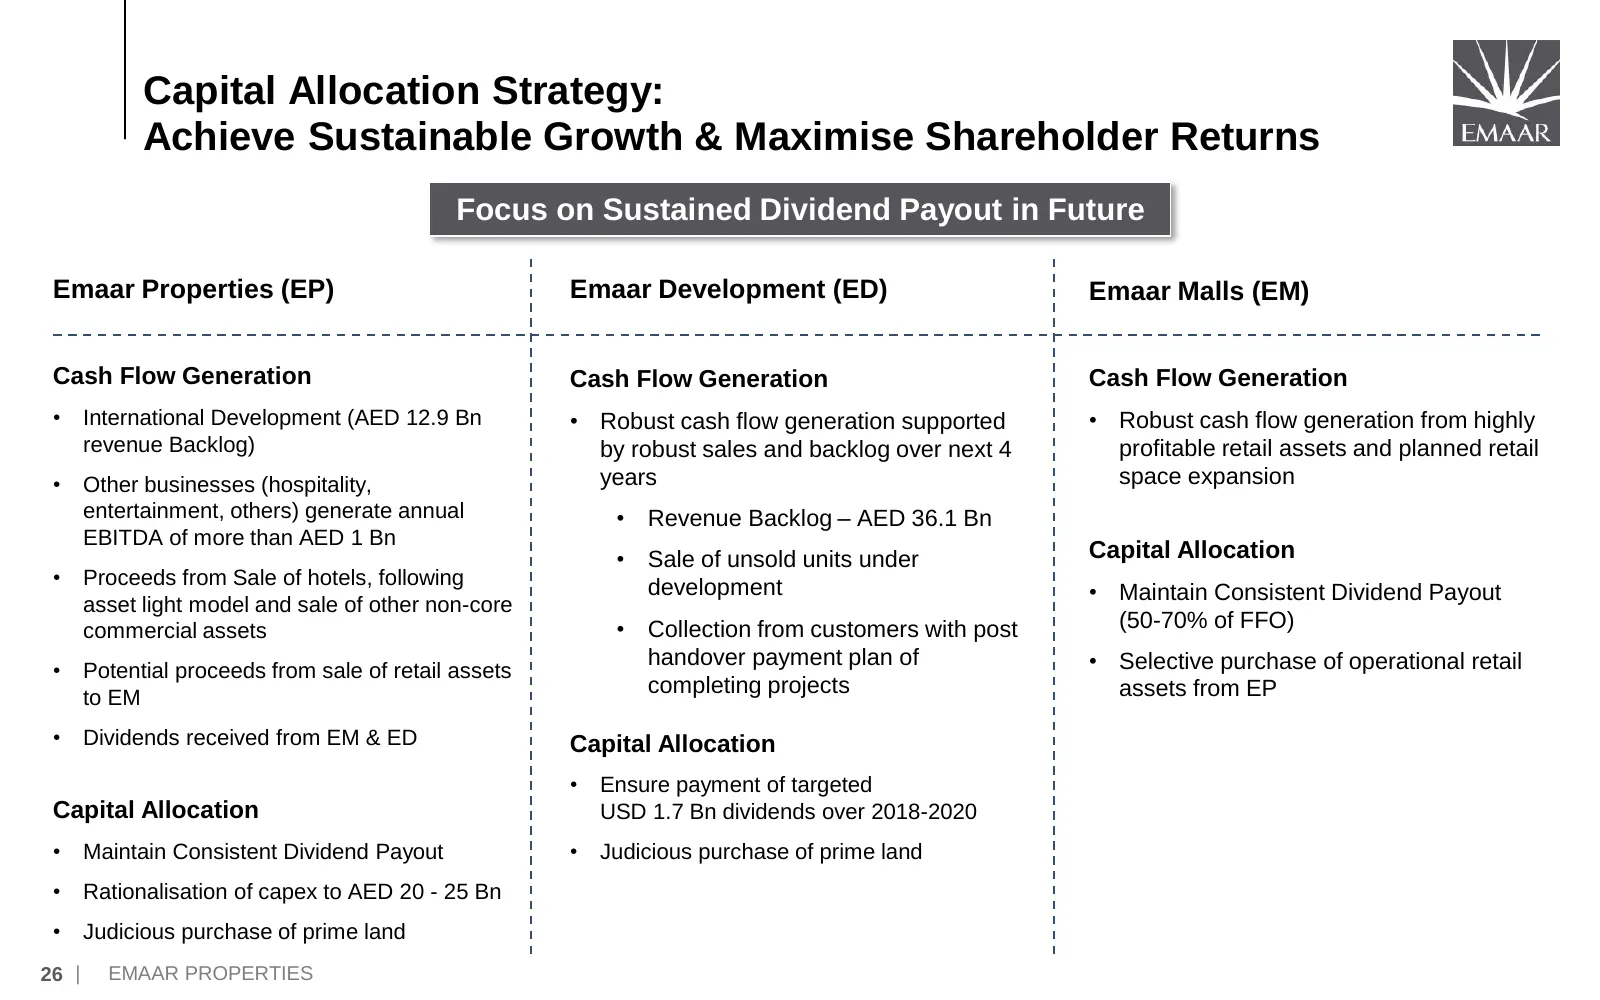
Slide 27: Capital Allocation Strategy: Achieve Sustainable Growth & Maximise Shareholder Returns
Capital Allocation Strategy: Achieve Sustainable Growth & Maximise Shareholder Returns Focus on Sustained Dividend Payout in Future Emaar Properties (EP) Emaar Development (ED) Emaar Malls (EM) Cash Flow Generation Cash Flow Generation Cash Flow Generation • International Development (AED 12.9 Bn •
Slide 28: 9M 2019 Results Update
9M 2019 Results Update 27 | EMAAR PROPERTIES
Slide 29: 9M 2019 Key Highlights
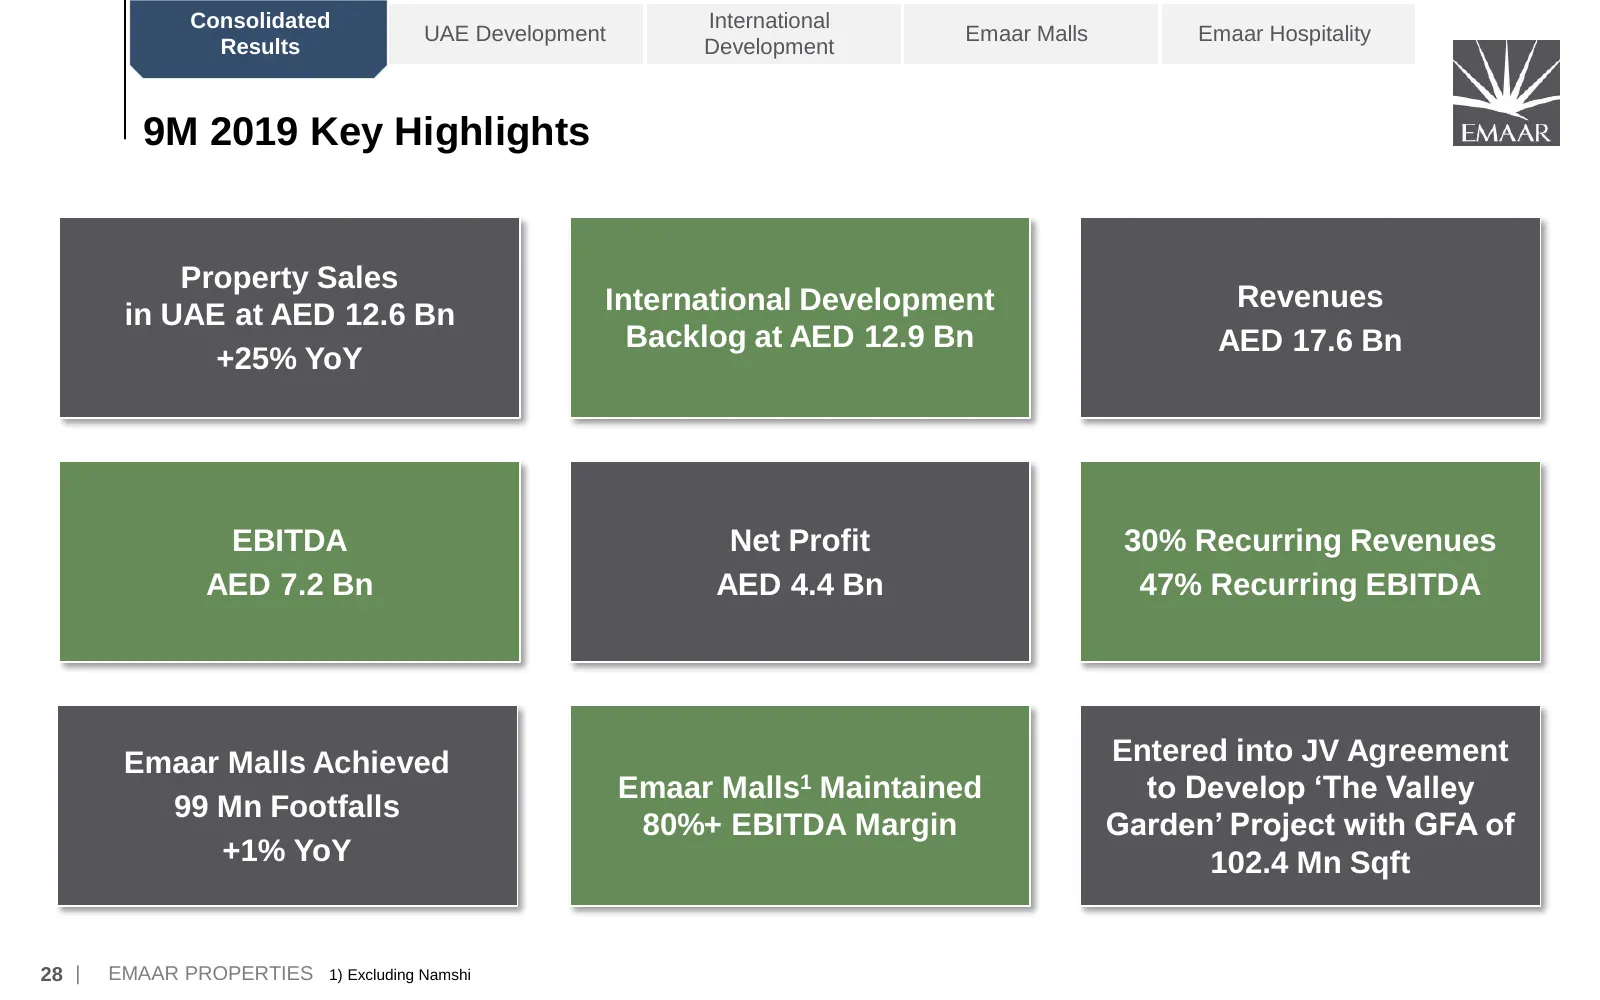
Consolidated International UAE Development Emaar Malls Emaar Hospitality Results Development 9M 2019 Key Highlights Property Sales International Development Revenues in UAE at AED 12.6 Bn Backlog at AED 12.9 Bn AED 17.6 Bn +25% YoY EBITDA Net Profit 30% Recurring Revenues AED 7.2 Bn AED 4.4 Bn 47% R
Slide 30: Key Highlights
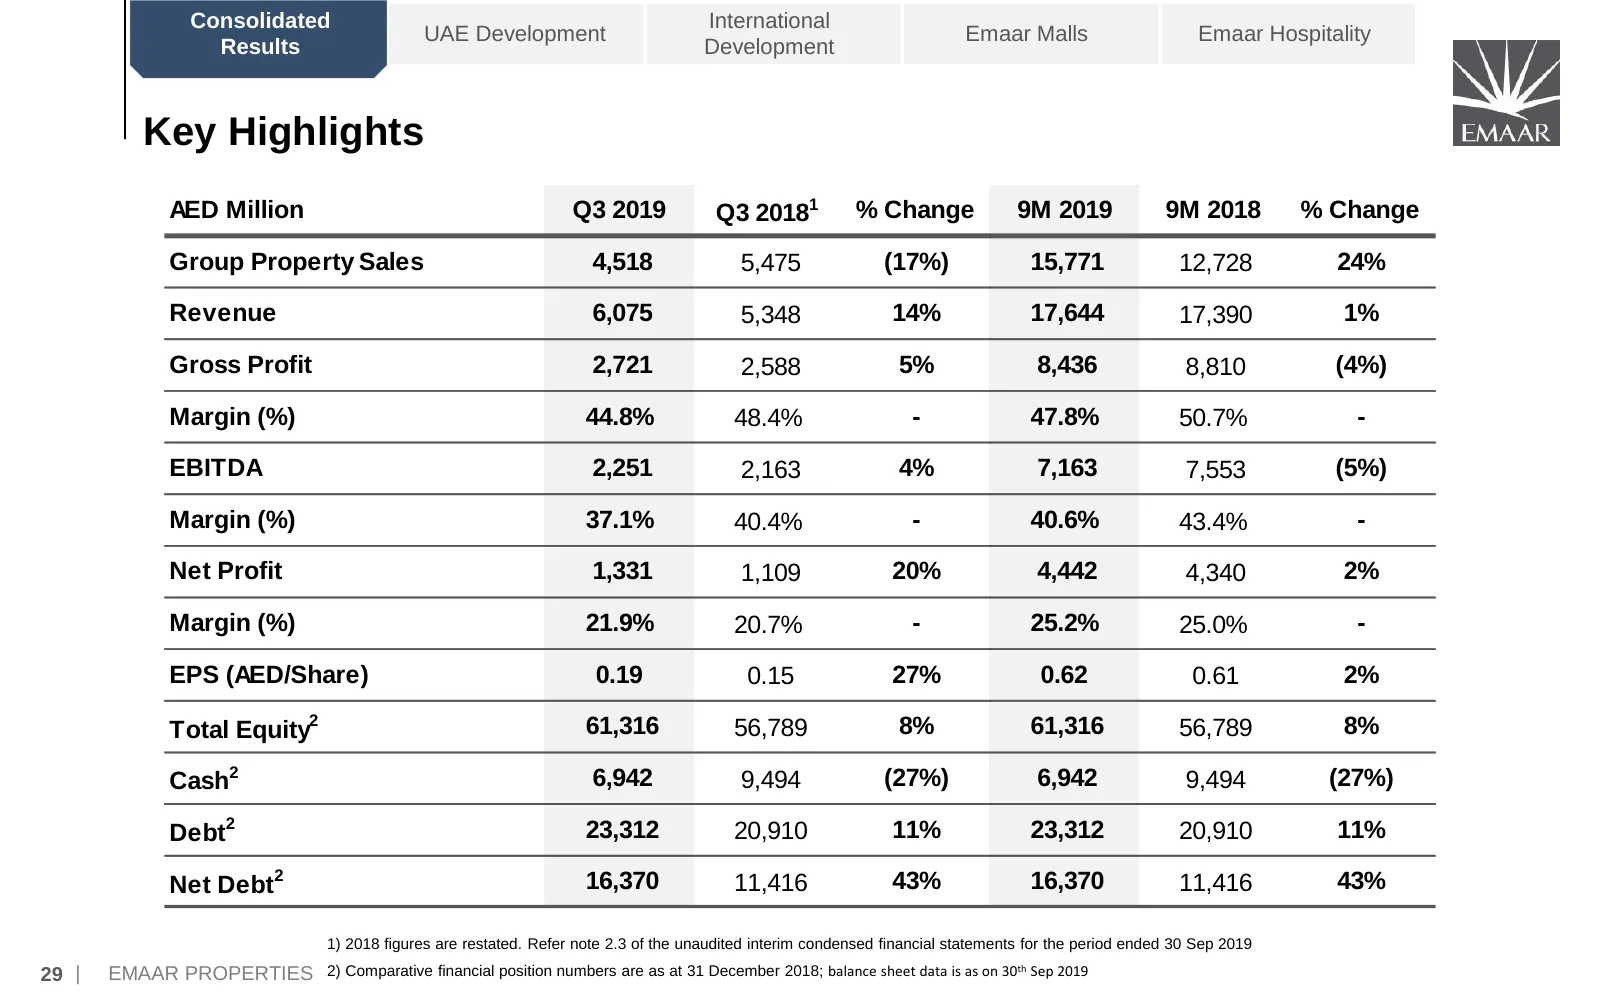
Consolidated International UAE Development Emaar Malls Emaar Hospitality Results Development Key Highlights AED Million Q3 2019 Q3 20181 % Change 9M 2019 9M 2018 % Change Group Property Sales 4,518 5,475 (17%) 15,771 12,728 24% Revenue 6,075 5,348 14% 17,644 17,390 1% Gross Profit 2,721 2,588 5% 8,4
Slide 31: Segment Analysis
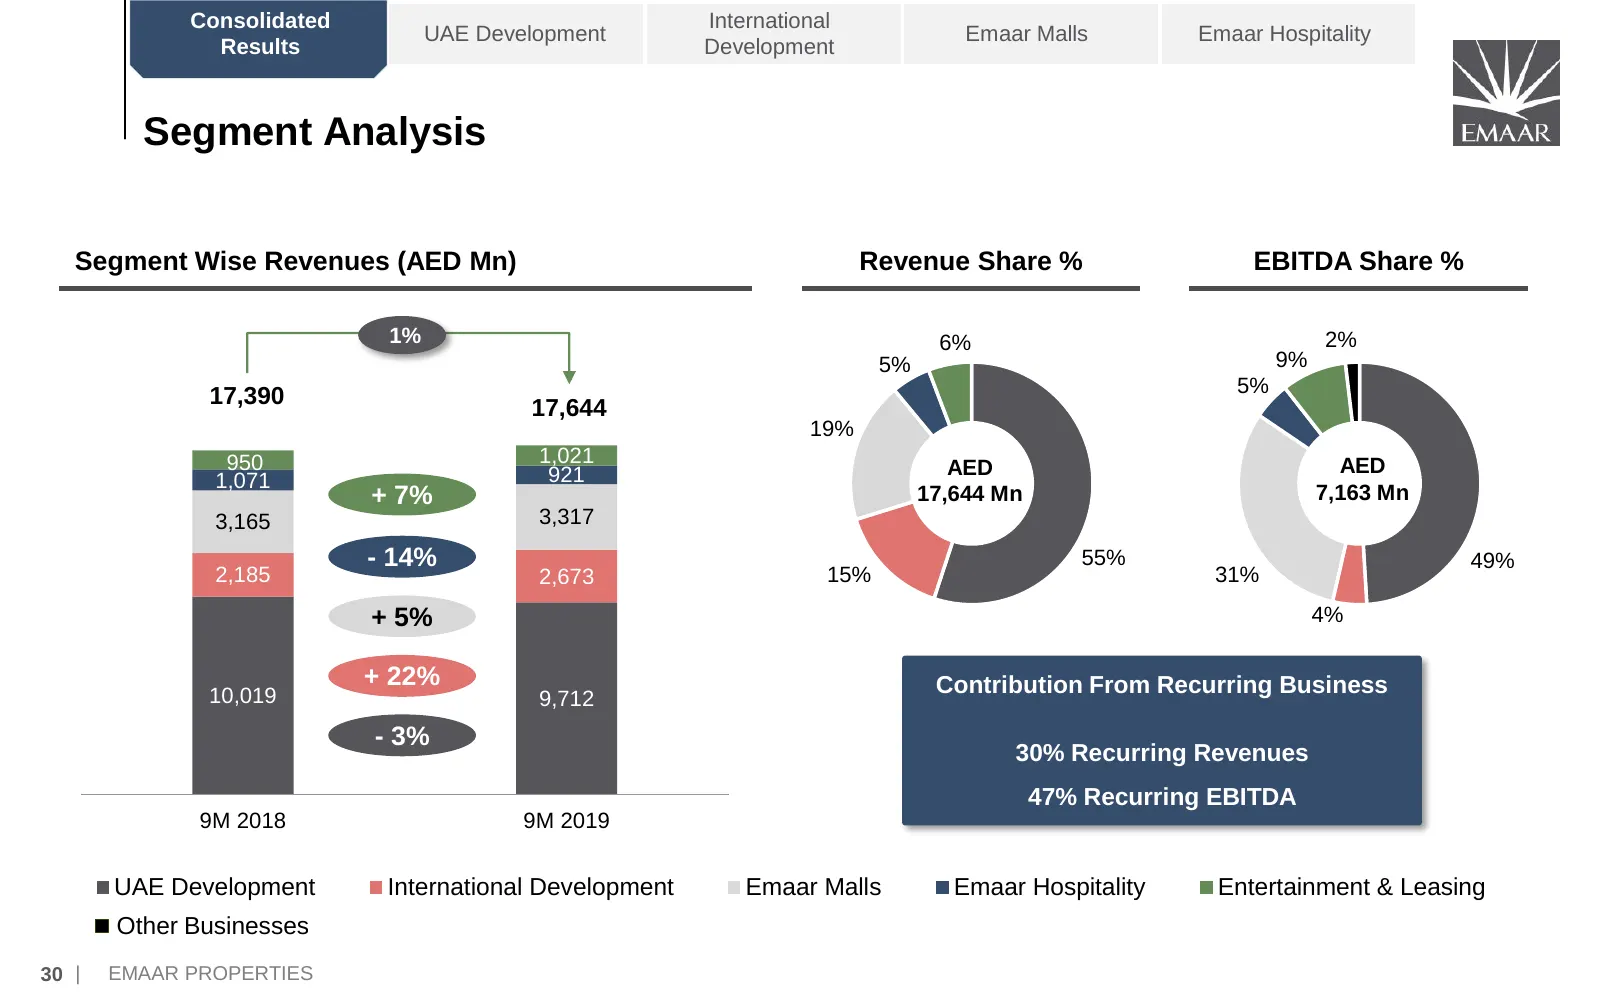
Consolidated International UAE Development Emaar Malls Emaar Hospitality Results Development Segment Analysis Segment Wise Revenues (AED Mn) Revenue Share % EBITDA Share % 1% 6% 2% 5% 9% 17,390 5% 17,644 19% 950 1,021 AED 921 AED 1,071 + 7% 17,644 Mn 7,163 Mn 3,165 3,317 - 14% 55% 49% 2,185 2,673 15
Slide 32: Historical Trend
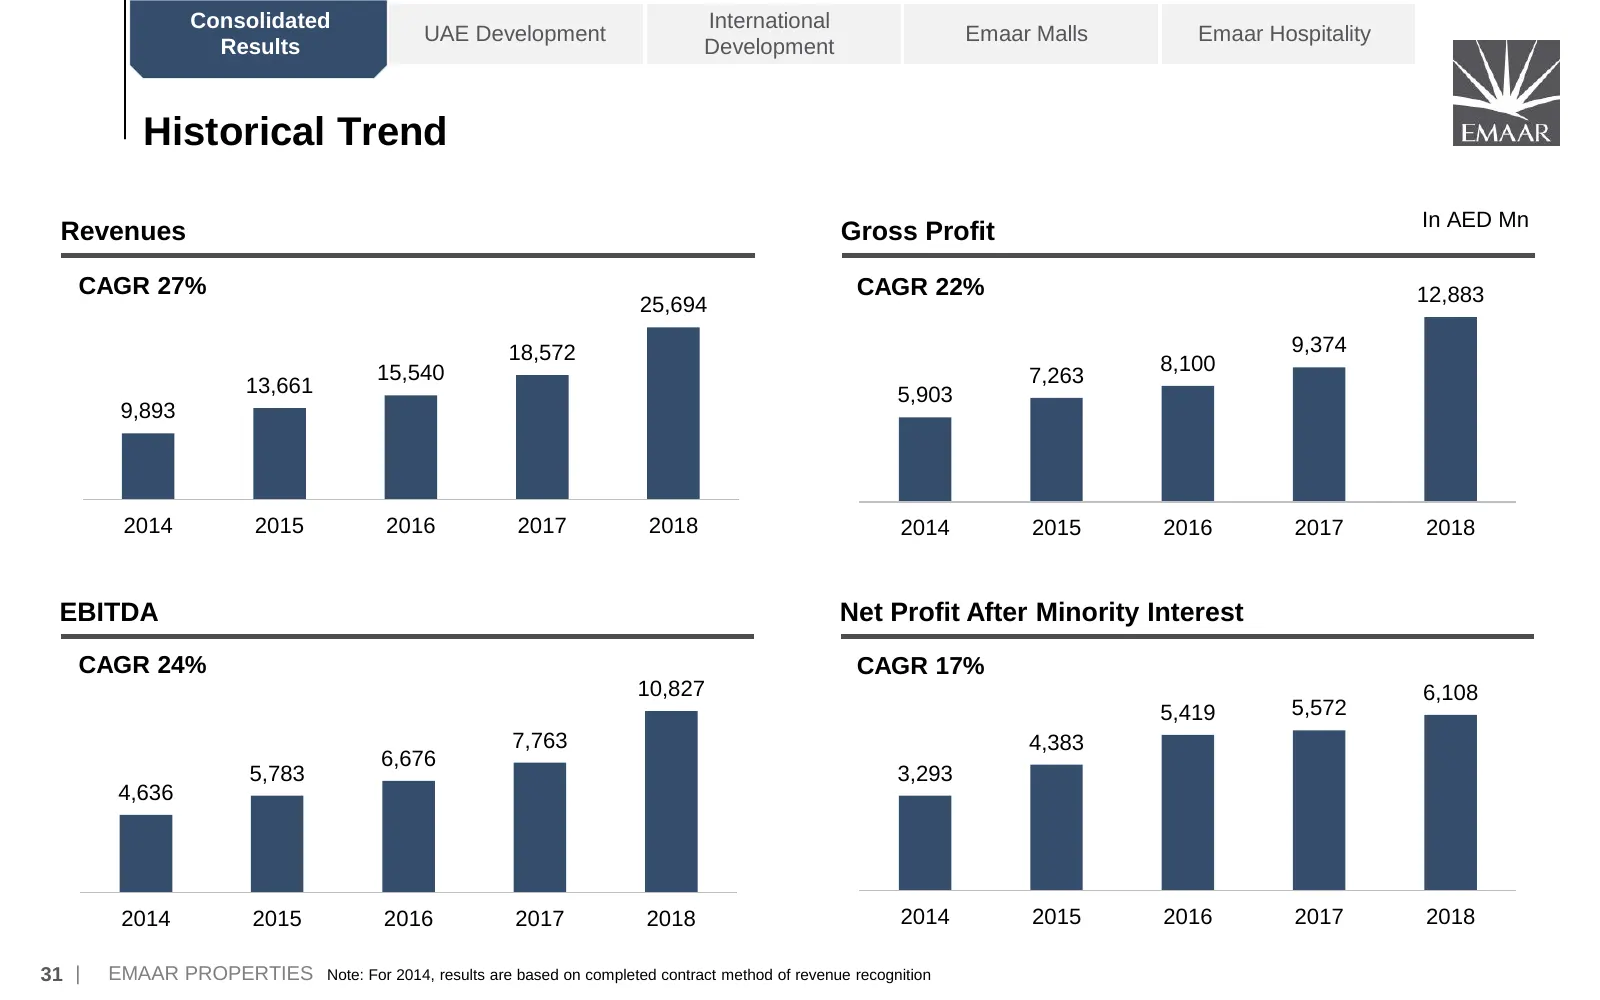
Consolidated International UAE Development Emaar Malls Emaar Hospitality Results Development Historical Trend In AED Mn Revenues Gross Profit CAGR 27% CAGR 22% 12,883 25,694 18,572 9,374 15,540 8,100 13,661 7,263 5,903 9,893 2014 2015 2016 2017 2018 2014 2015 2016 2017 2018 EBITDA Net Profit After M
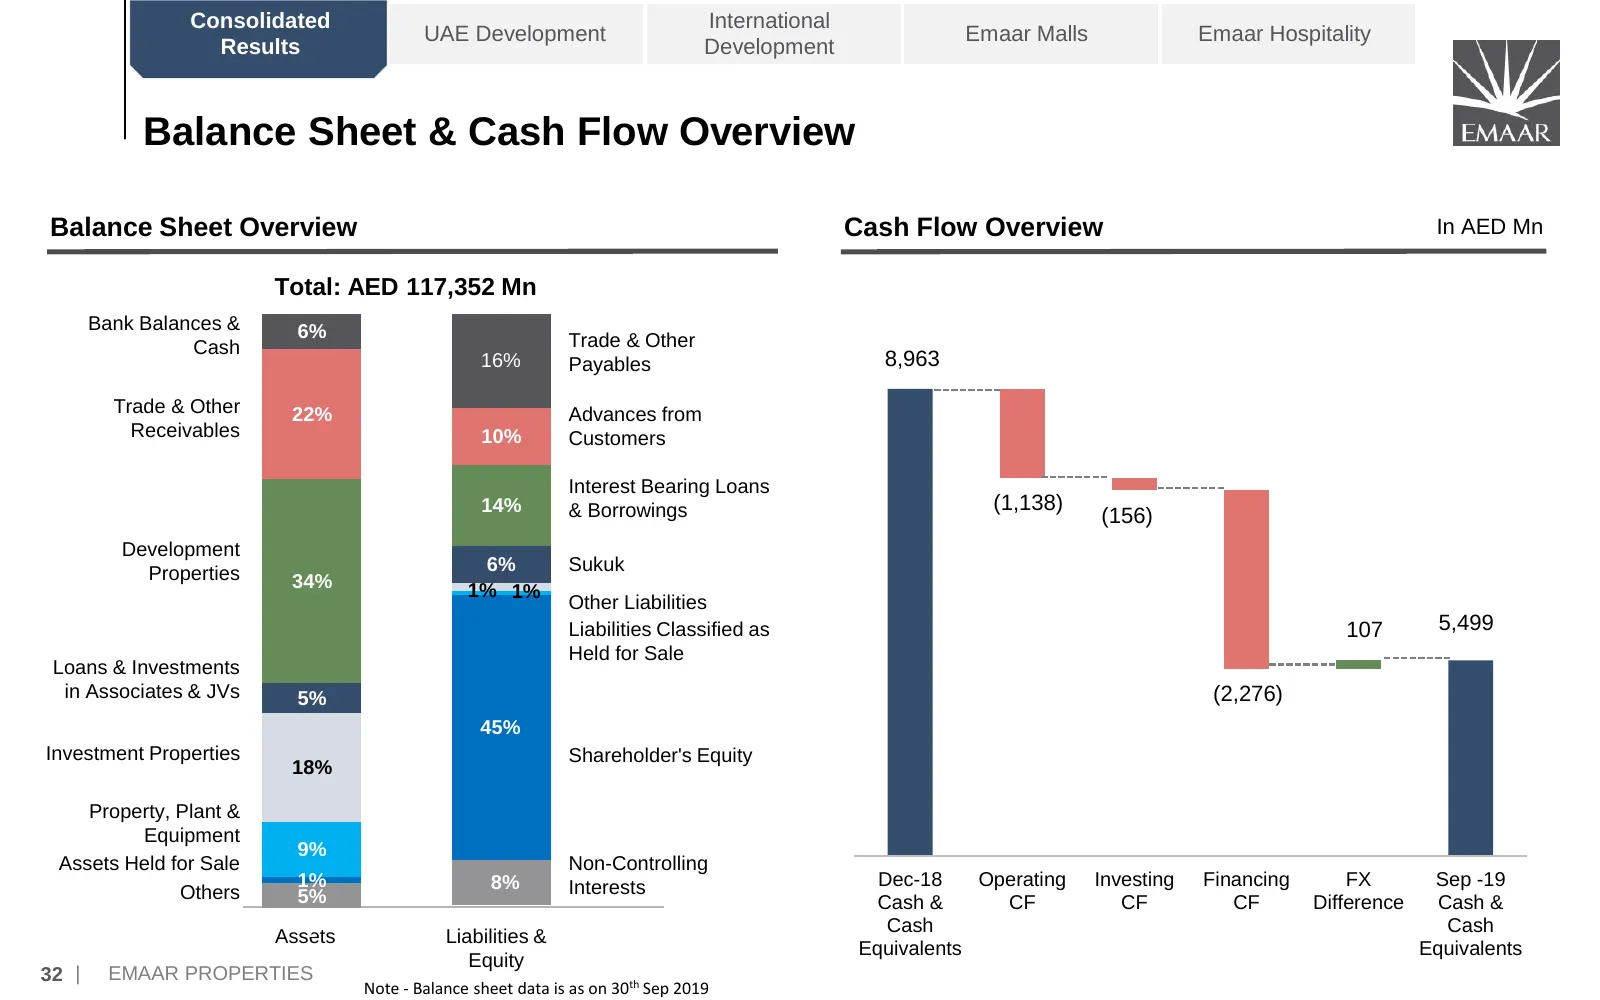
Slide 33: Balance Sheet & Cash Flow Overview
Consolidated International UAE Development Emaar Malls Emaar Hospitality Results Development Balance Sheet & Cash Flow Overview Balance Sheet Overview Cash Flow Overview In AED Mn Total: AED 117,352 Mn Bank Balances & 6% Cash Trade & Other 16% Payables 8,963 Trade & Other 22% Advances from Receivabl
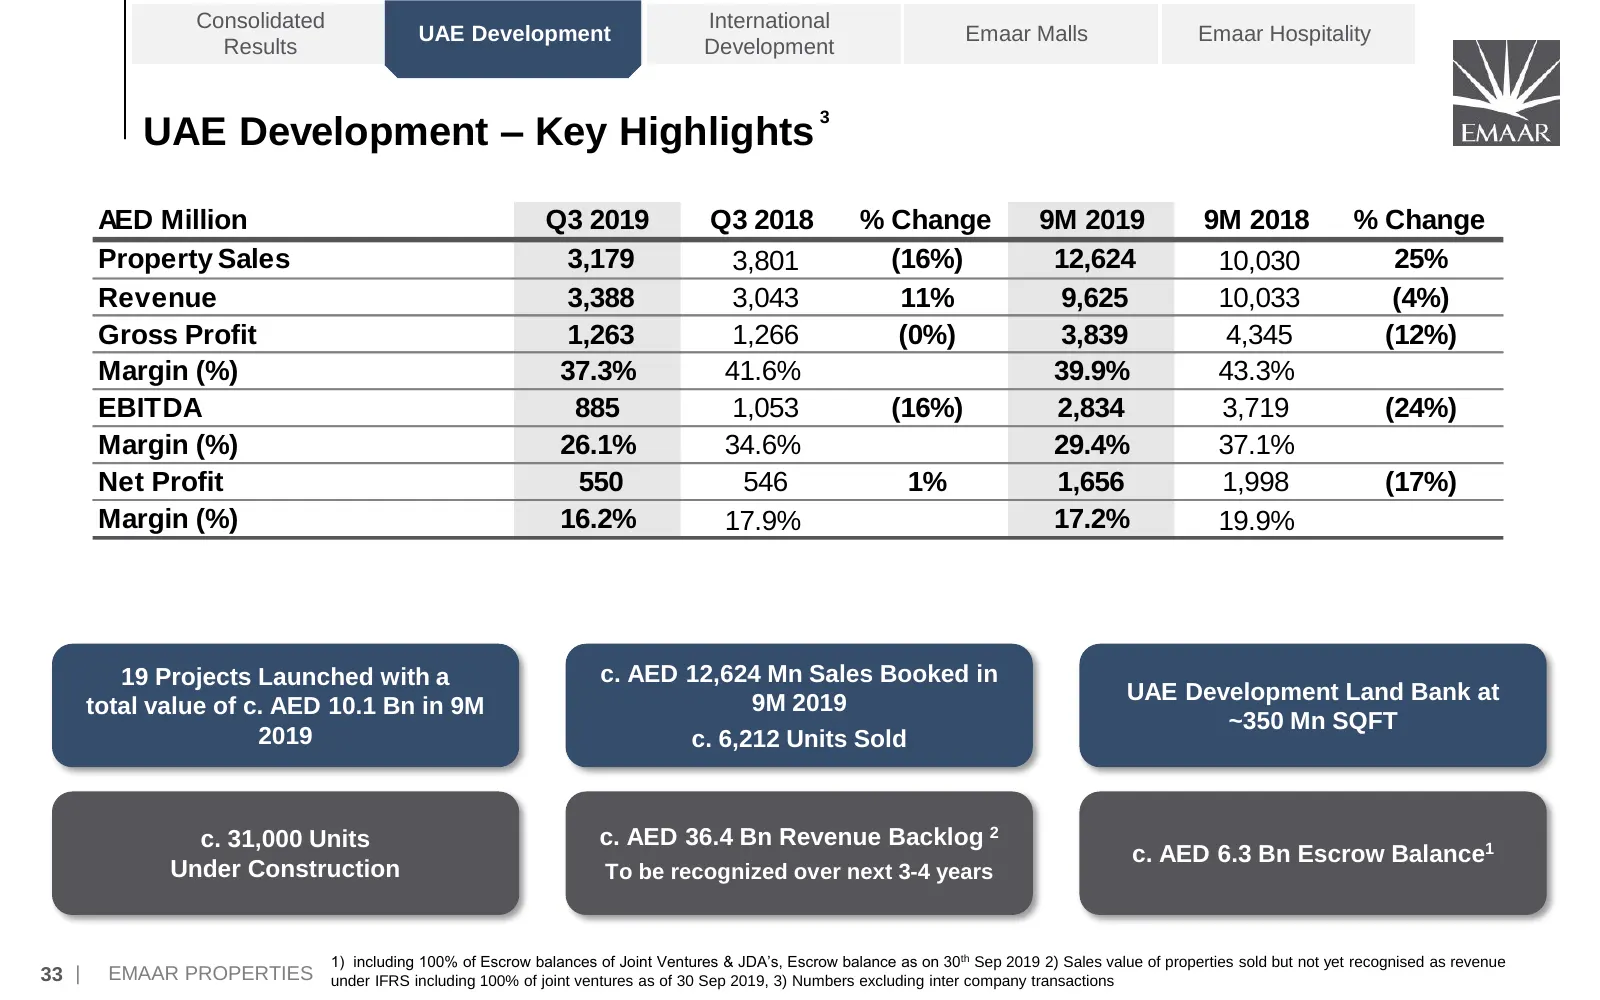
Slide 34: UAE Development – Key Highlights
Consolidated International UAE Development Emaar Malls Emaar Hospitality Results Development UAE Development – Key Highlights 3 AED Million Q3 2019 Q3 2018 % Change 9M 2019 9M 2018 % Change Property Sales 3,179 3,801 (16%) 12,624 10,030 25% Revenue 3,388 3,043 11% 9,625 10,033 (4%) Gross Profit 1,26
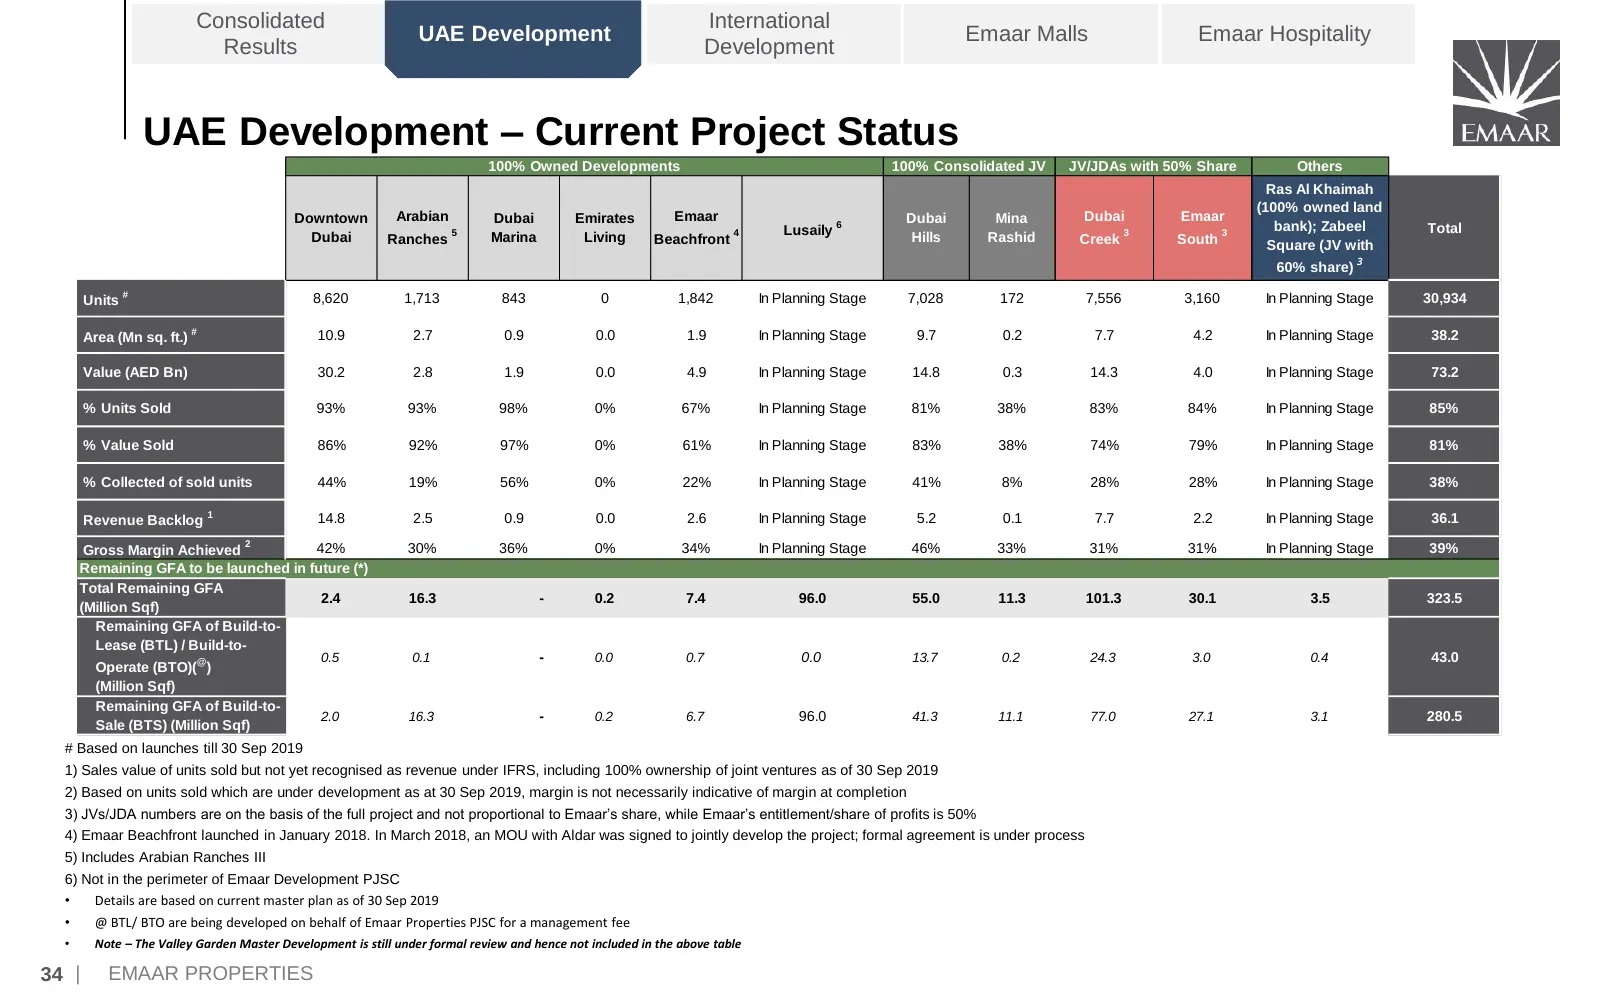
Slide 35: UAE Development – Current Project Status
Consolidated International UAE Development Emaar Malls Emaar Hospitality Results Development UAE Development – Current Project Status 100% Owned Developments 100% Consolidated JV JV/JDAs with 50% Share Others Ras Al Khaimah (100% owned land Downtown Arabian Dubai Emirates Emaar Dubai Mina Dubai Emaa
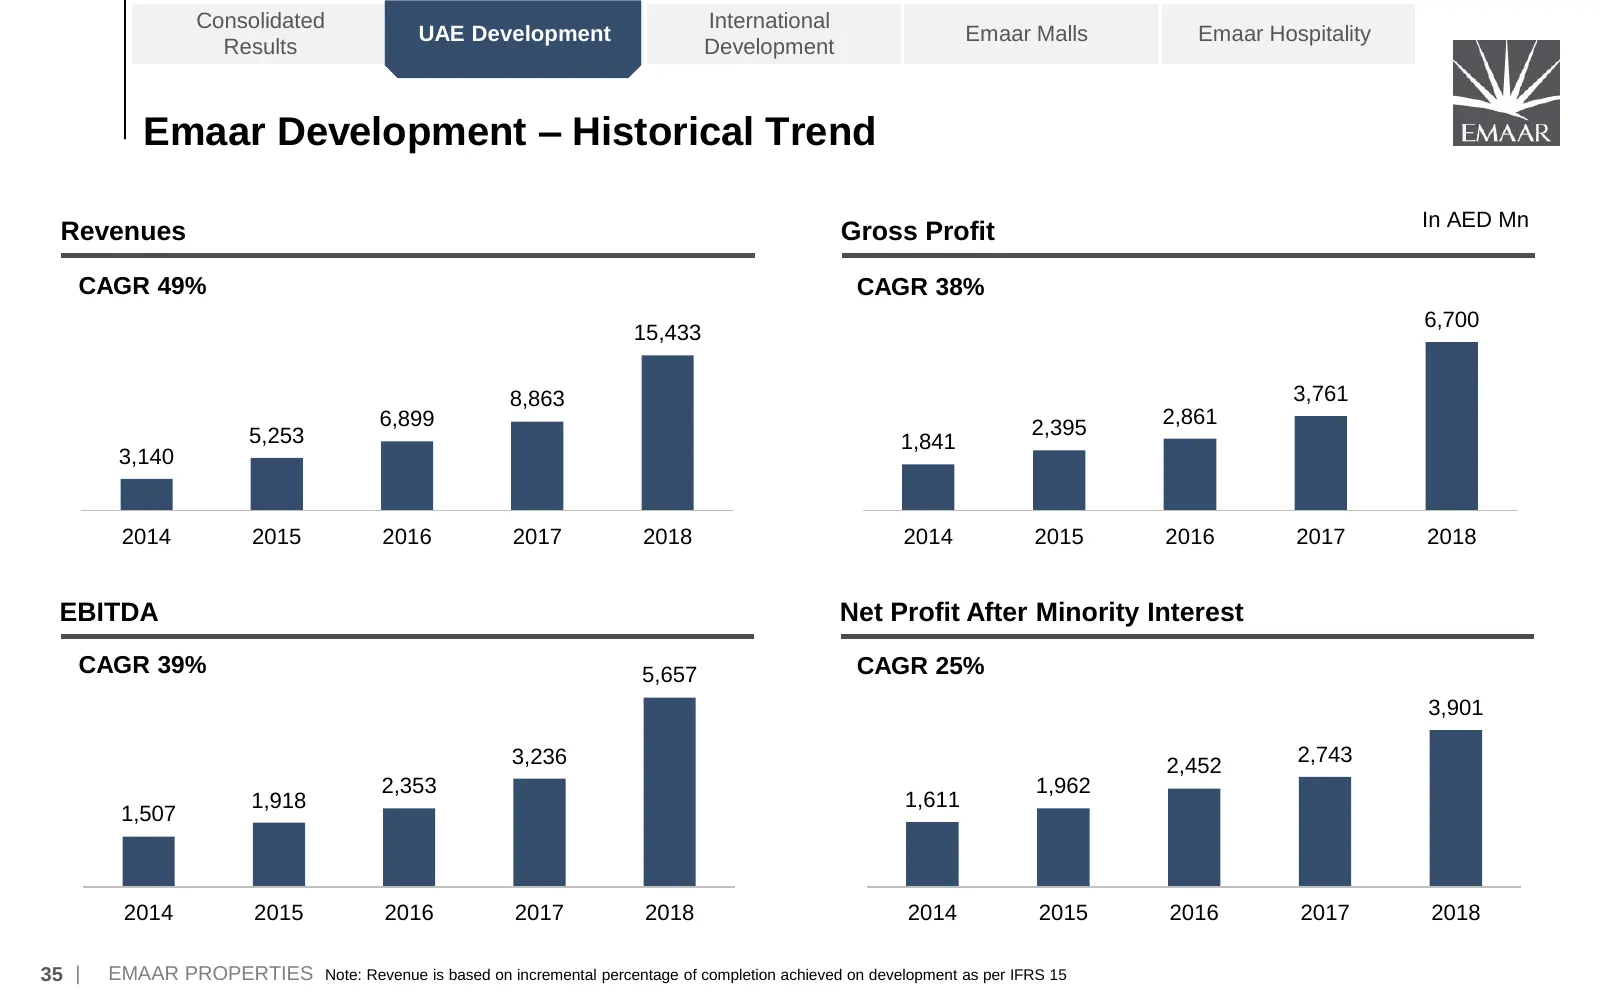
Slide 36: Emaar Development – Historical Trend
Consolidated International UAE Development Emaar Malls Emaar Hospitality Results Development Emaar Development – Historical Trend In AED Mn Revenues Gross Profit CAGR 49% CAGR 38% 6,700 15,433 8,863 3,761 6,899 2,861 5,253 2,395 1,841 3,140 2014 2015 2016 2017 2018 2014 2015 2016 2017 2018 EBITDA Ne
Slide 37: International Development – Key Highlights
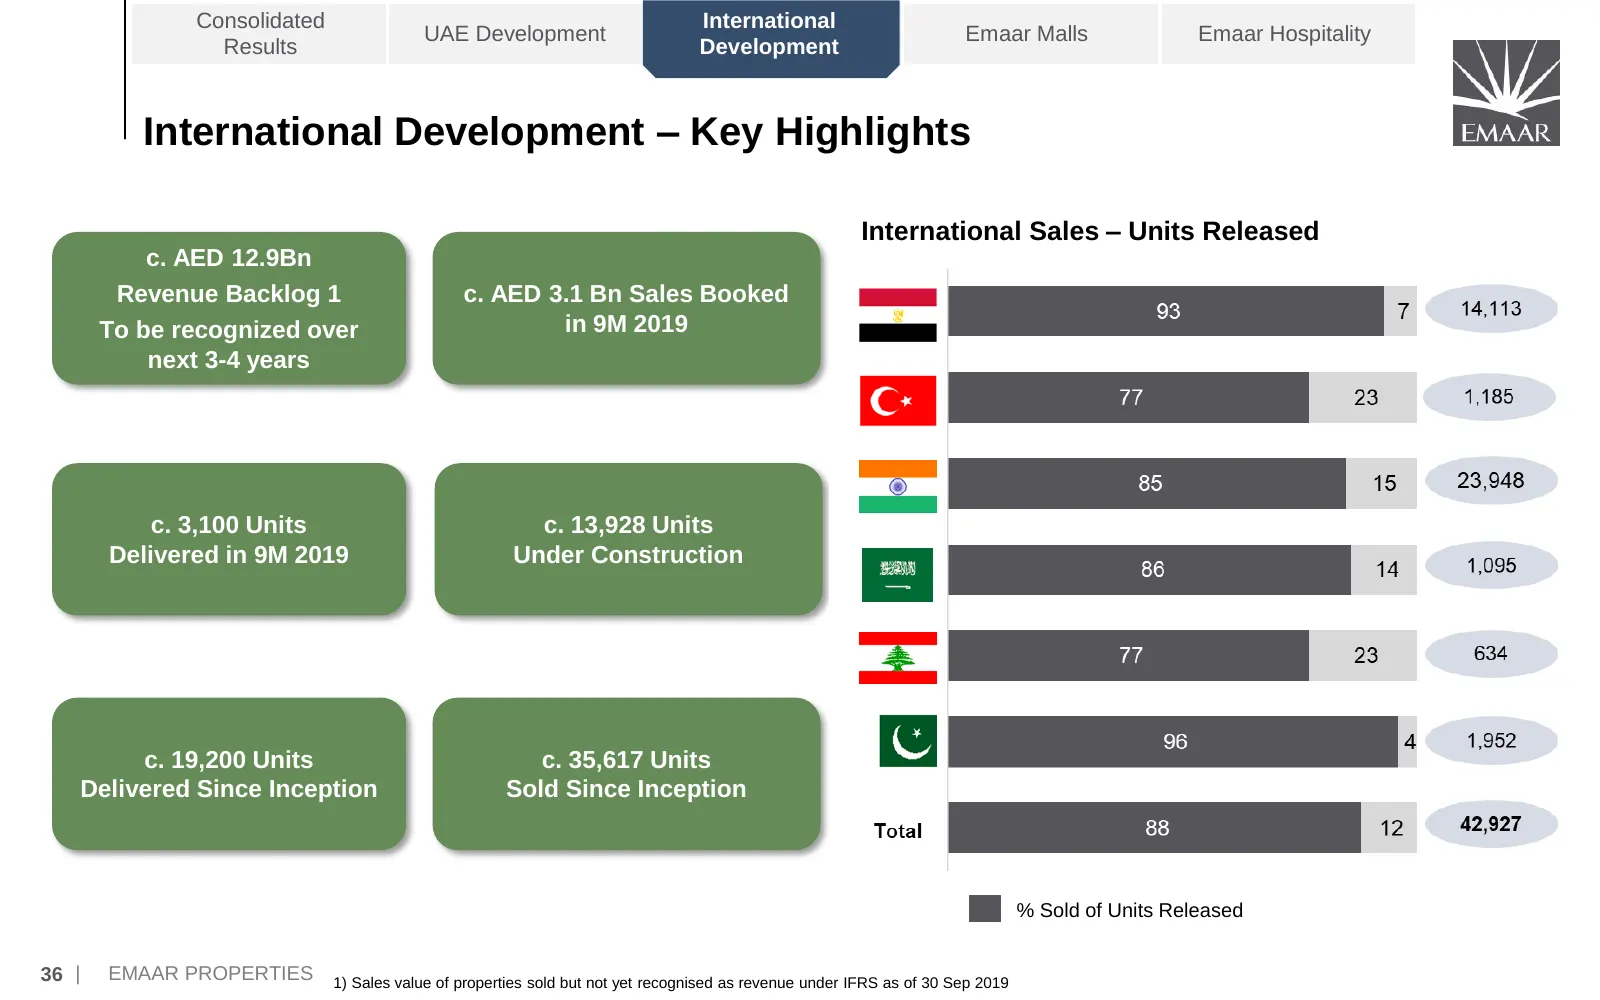
Consolidated International UAE Development Emaar Malls Emaar Hospitality Results Development International Development – Key Highlights International Sales – Units Released c. AED 12.9Bn Revenue Backlog 1 c. AED 3.1 Bn Sales Booked To be recognized over in 9M 2019 next 3-4 years c. 3,100 Units c. 13
Slide 38: International Development – Key Highlights
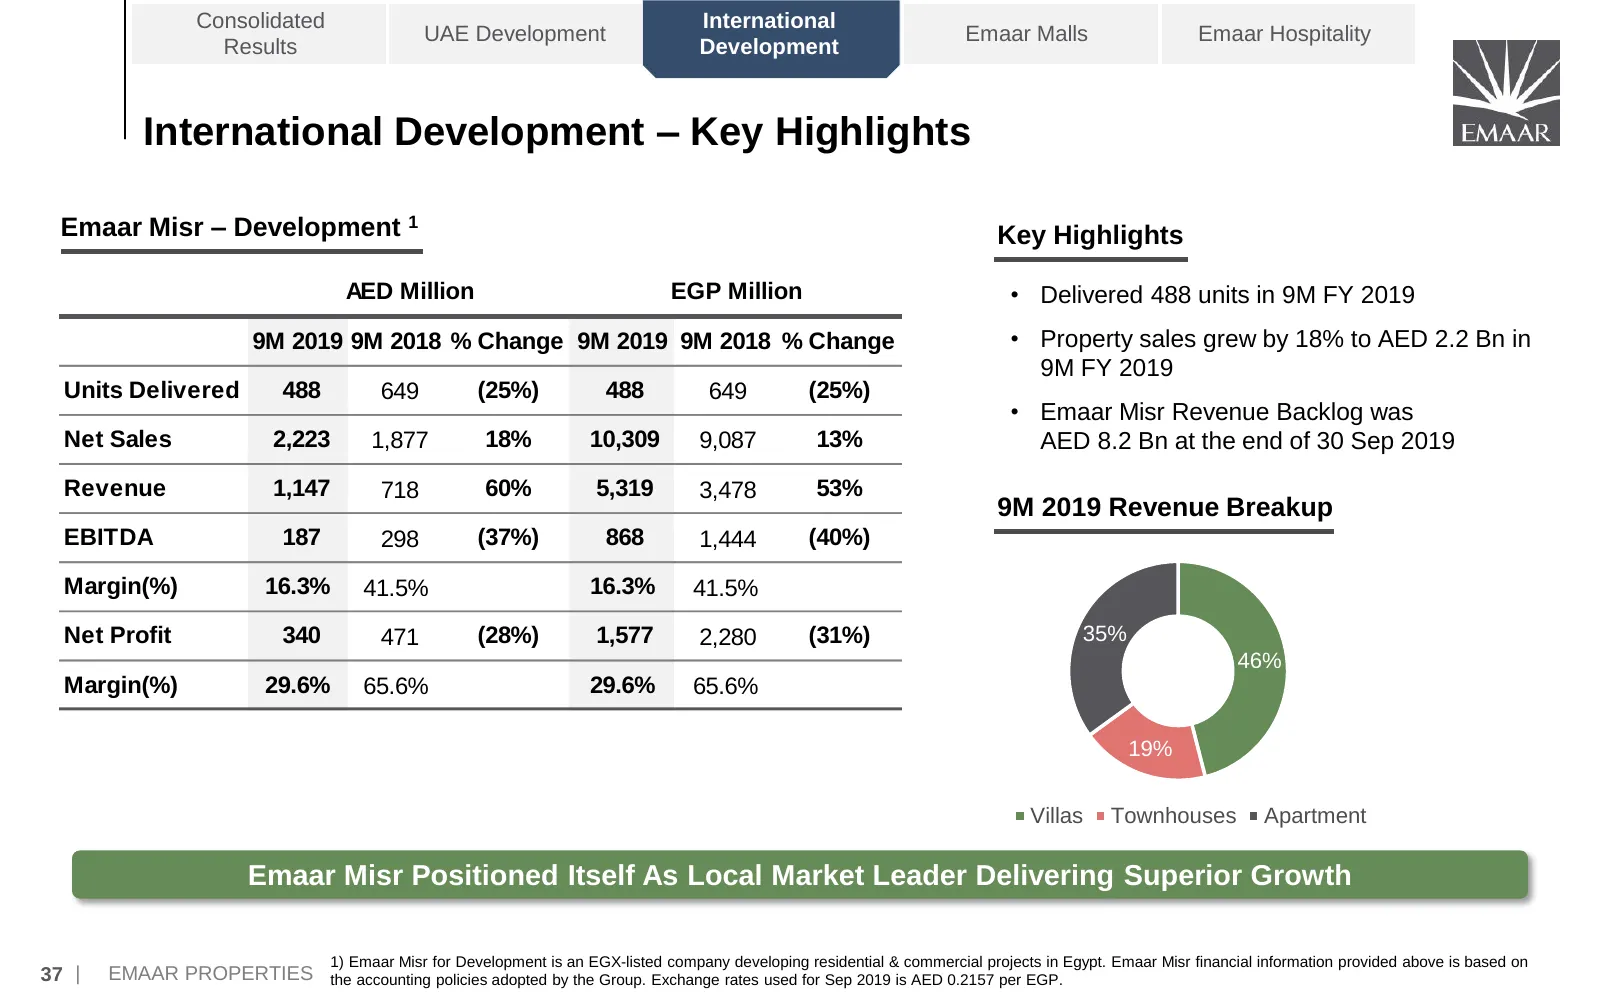
Consolidated International UAE Development Emaar Malls Emaar Hospitality Results Development International Development – Key Highlights Emaar Misr – Development 1 Key Highlights AED Million EGP Million • Delivered 488 units in 9M FY 2019 9M 2019 9M 2018 % Change 9M 2019 9M 2018 % Change • Property s
Slide 39: Emaar Malls – Key Highlights
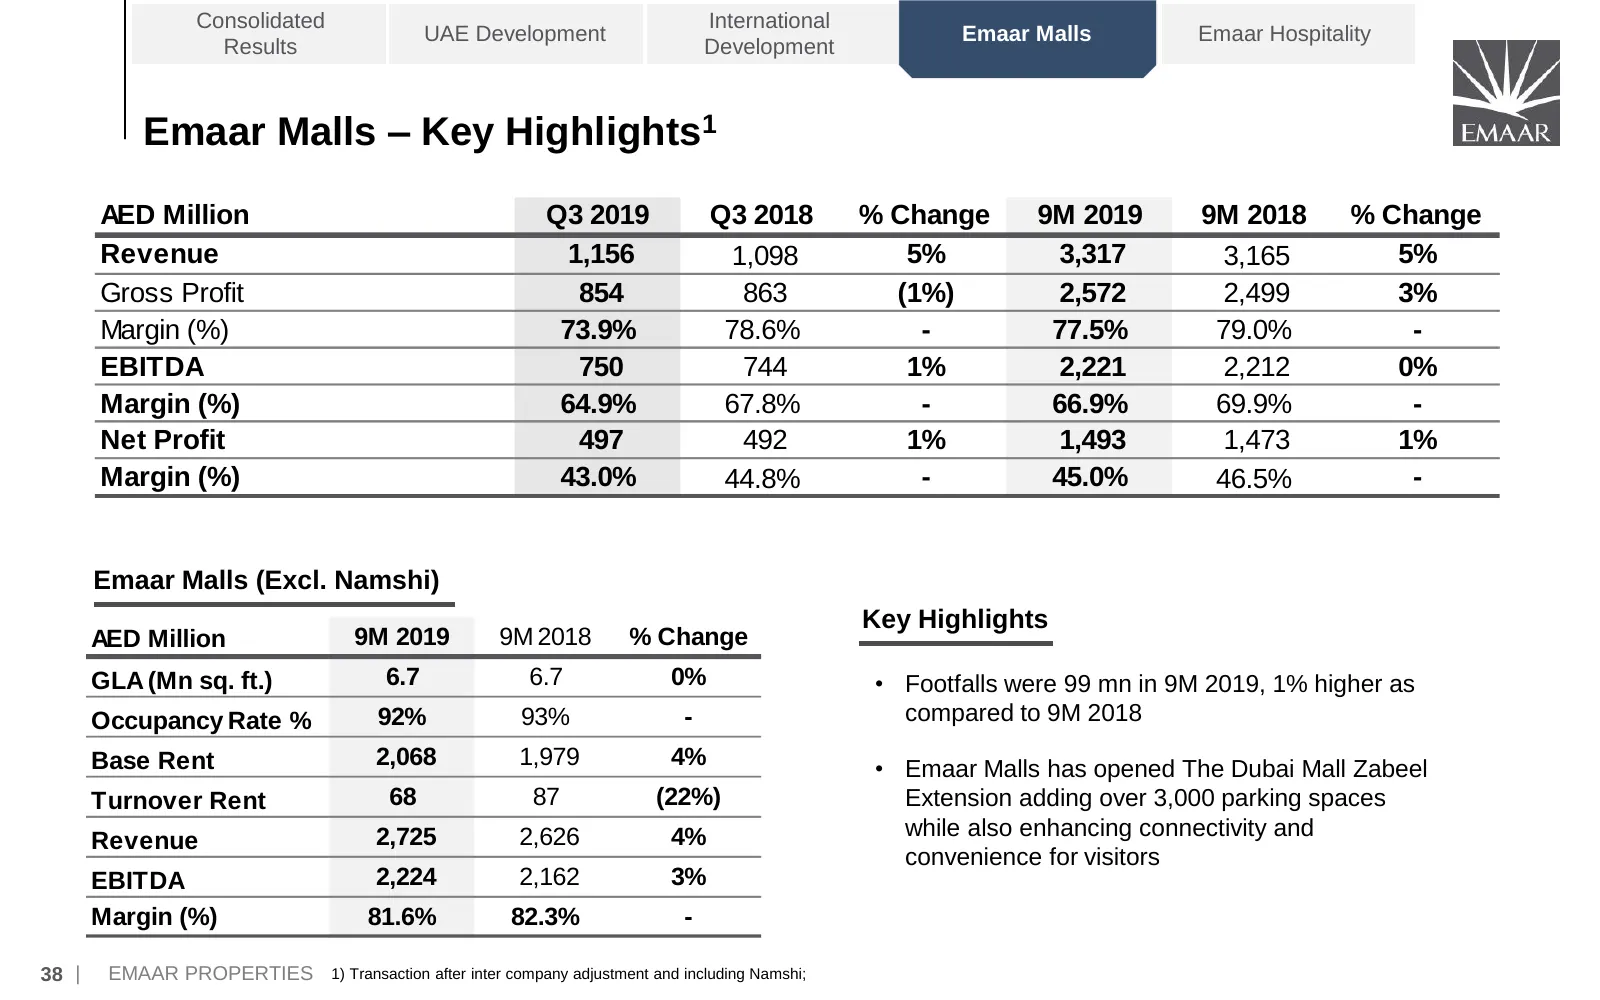
Consolidated International UAE Development Emaar Malls Emaar Hospitality Results Development Emaar Malls – Key Highlights1 AED Million Q3 2019 Q3 2018 % Change 9M 2019 9M 2018 % Change Revenue 1,156 1,098 5% 3,317 3,165 5% Gross Profit 854 863 (1%) 2,572 2,499 3% Margin (%) 73.9% 78.6% - 77.5% 79.0%
Slide 40: Emaar Malls (Excl. Namshi) – Historical Trend
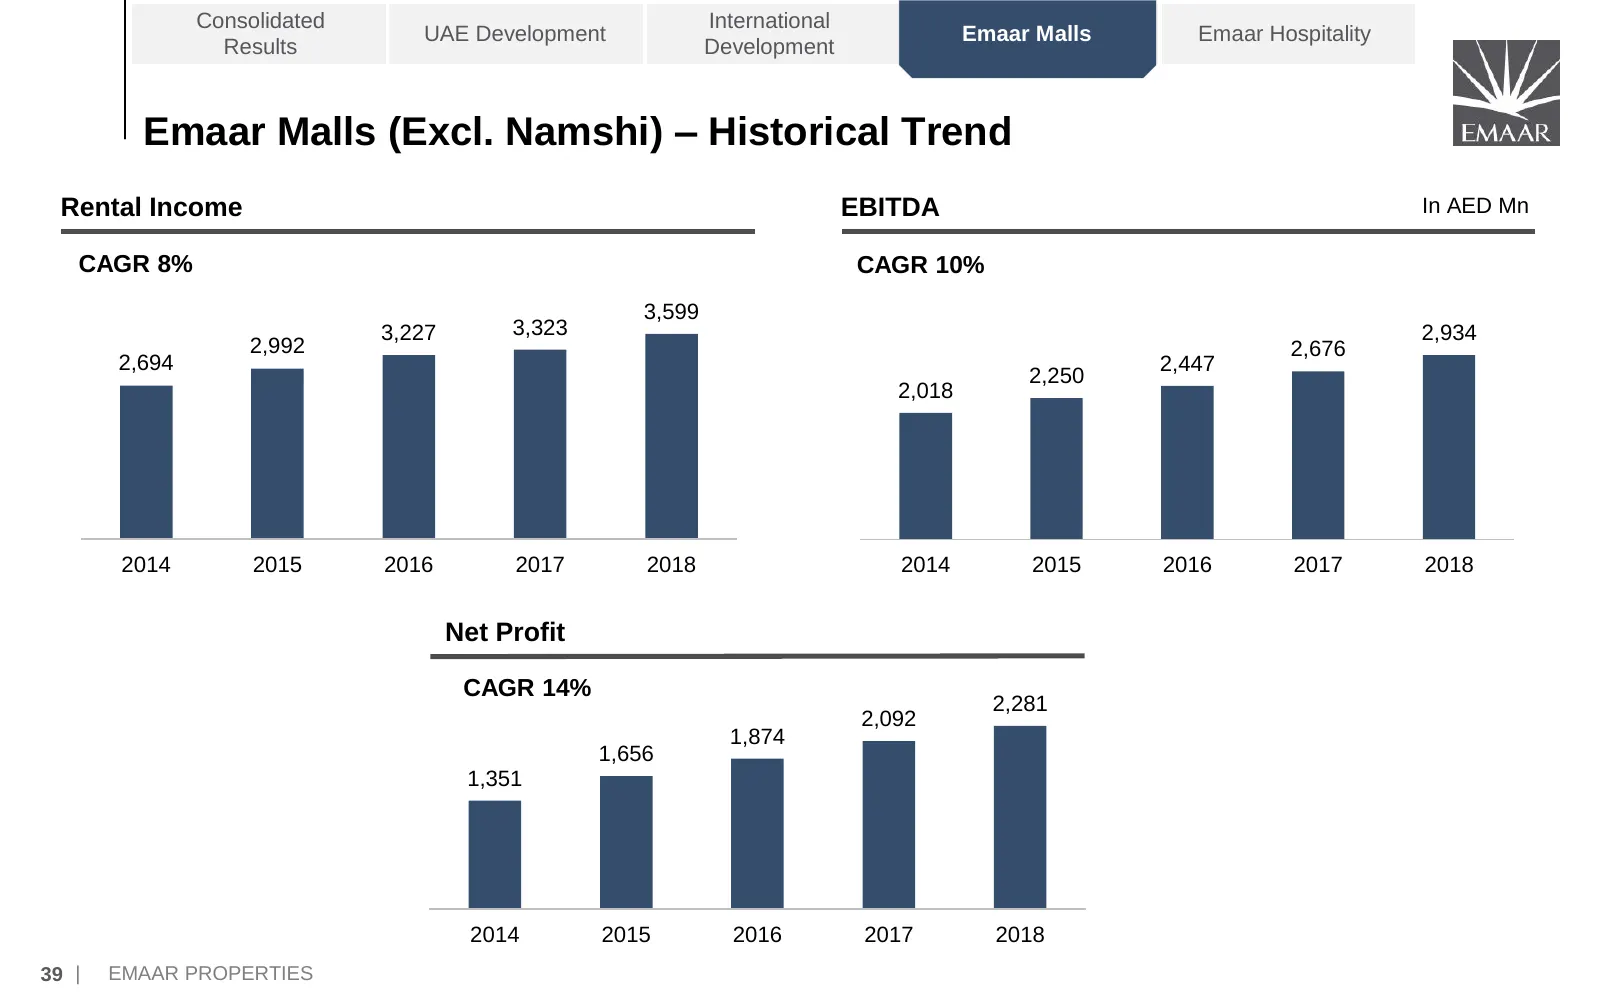
Consolidated International UAE Development Emaar Malls Emaar Hospitality Results Development Emaar Malls (Excl. Namshi) – Historical Trend Rental Income EBITDA In AED Mn CAGR 8% CAGR 10% 3,599 3,227 3,323 2,934 2,992 2,676 2,694 2,447 2,250 2,018 2014 2015 2016 2017 2018 2014 2015 2016 2017 2018 Net
Slide 41: Namshi – Key Highlights
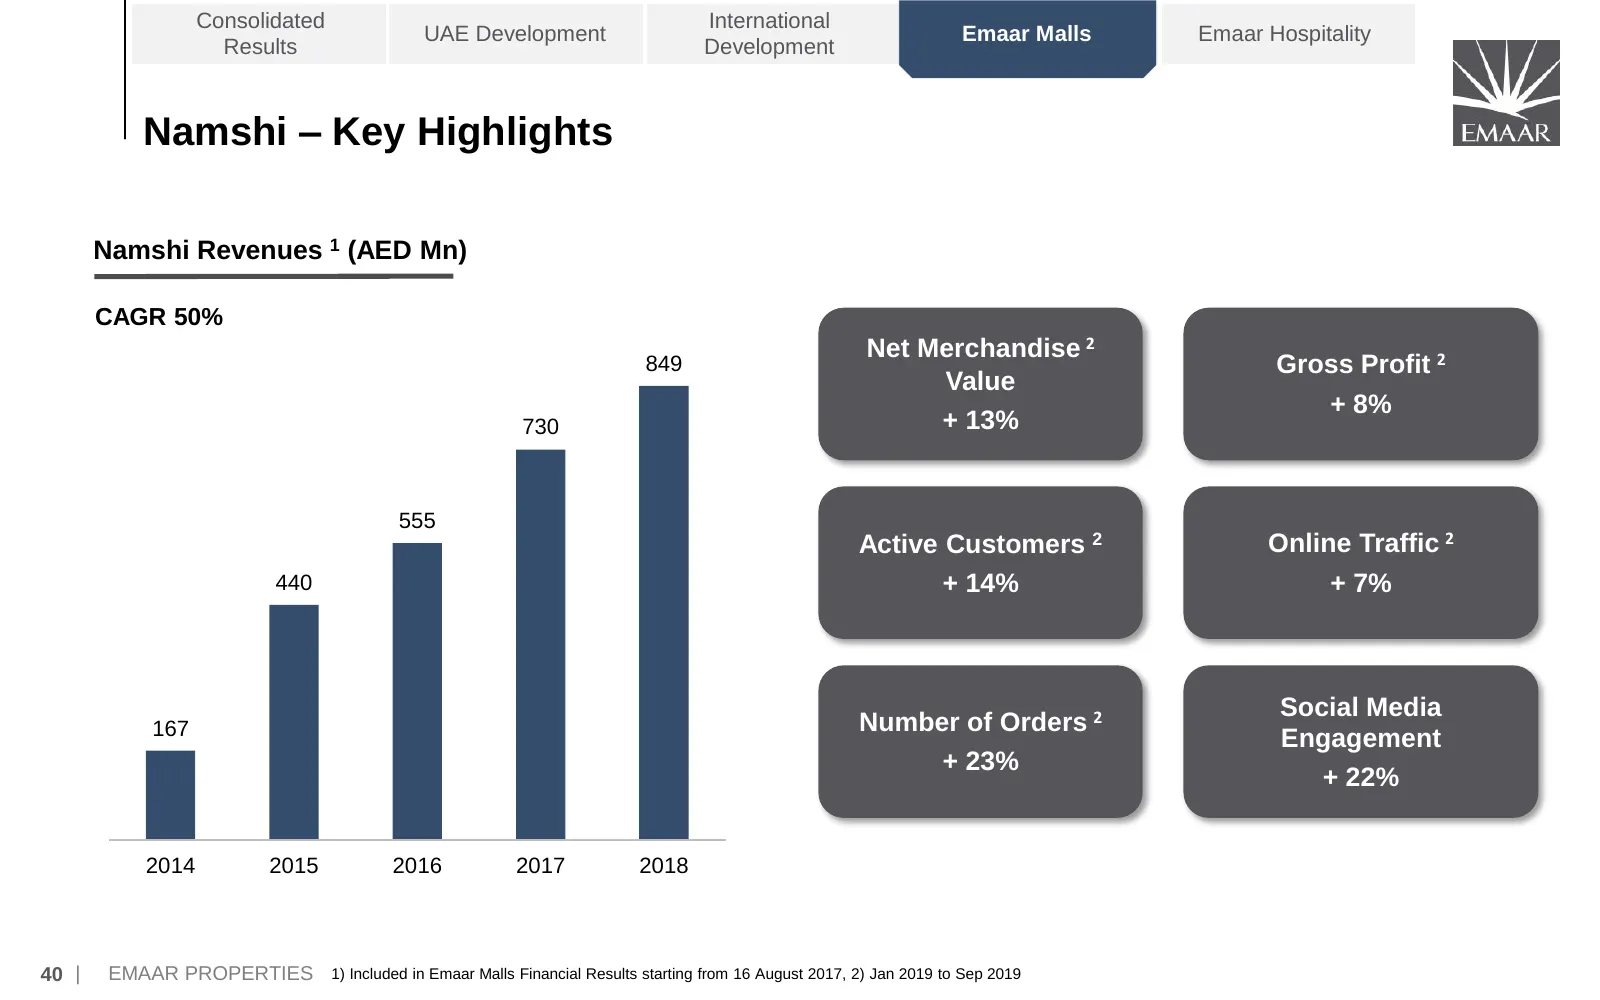
Consolidated International UAE Development Emaar Malls Emaar Hospitality Results Development Namshi – Key Highlights Namshi Revenues 1 (AED Mn) CAGR 50% Net Merchandise 2 849 Gross Profit 2 Value + 8% 730 + 13% 555 Active Customers 2 Online Traffic 2 440 + 14% + 7% Social Media 167 Number of Orders
Slide 42: Emaar Hospitality – Key Highlights
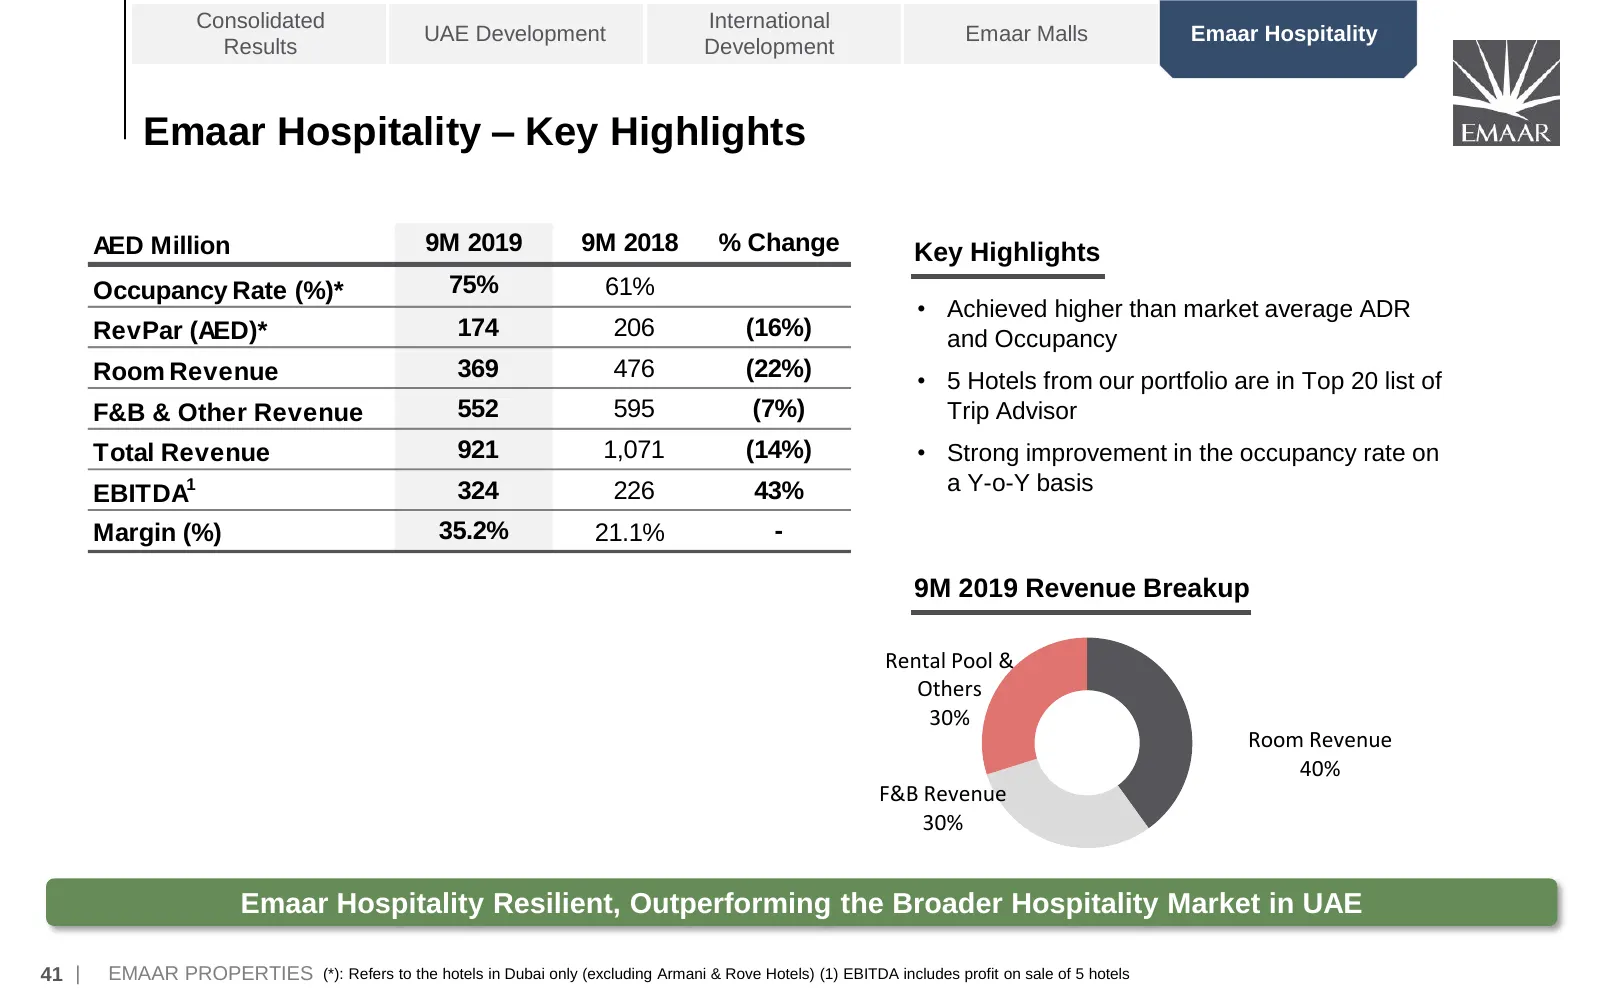
Consolidated International UAE Development Emaar Malls Emaar Hospitality Results Development Emaar Hospitality – Key Highlights AED Million 9M 2019 9M 2018 % Change Key Highlights Occupancy Rate (%)* 75% 61% • Achieved higher than market average ADR RevPar (AED)* 174 206 (16%) and Occupancy Room Rev
Slide 43: Emaar Hospitality – Asset Performance
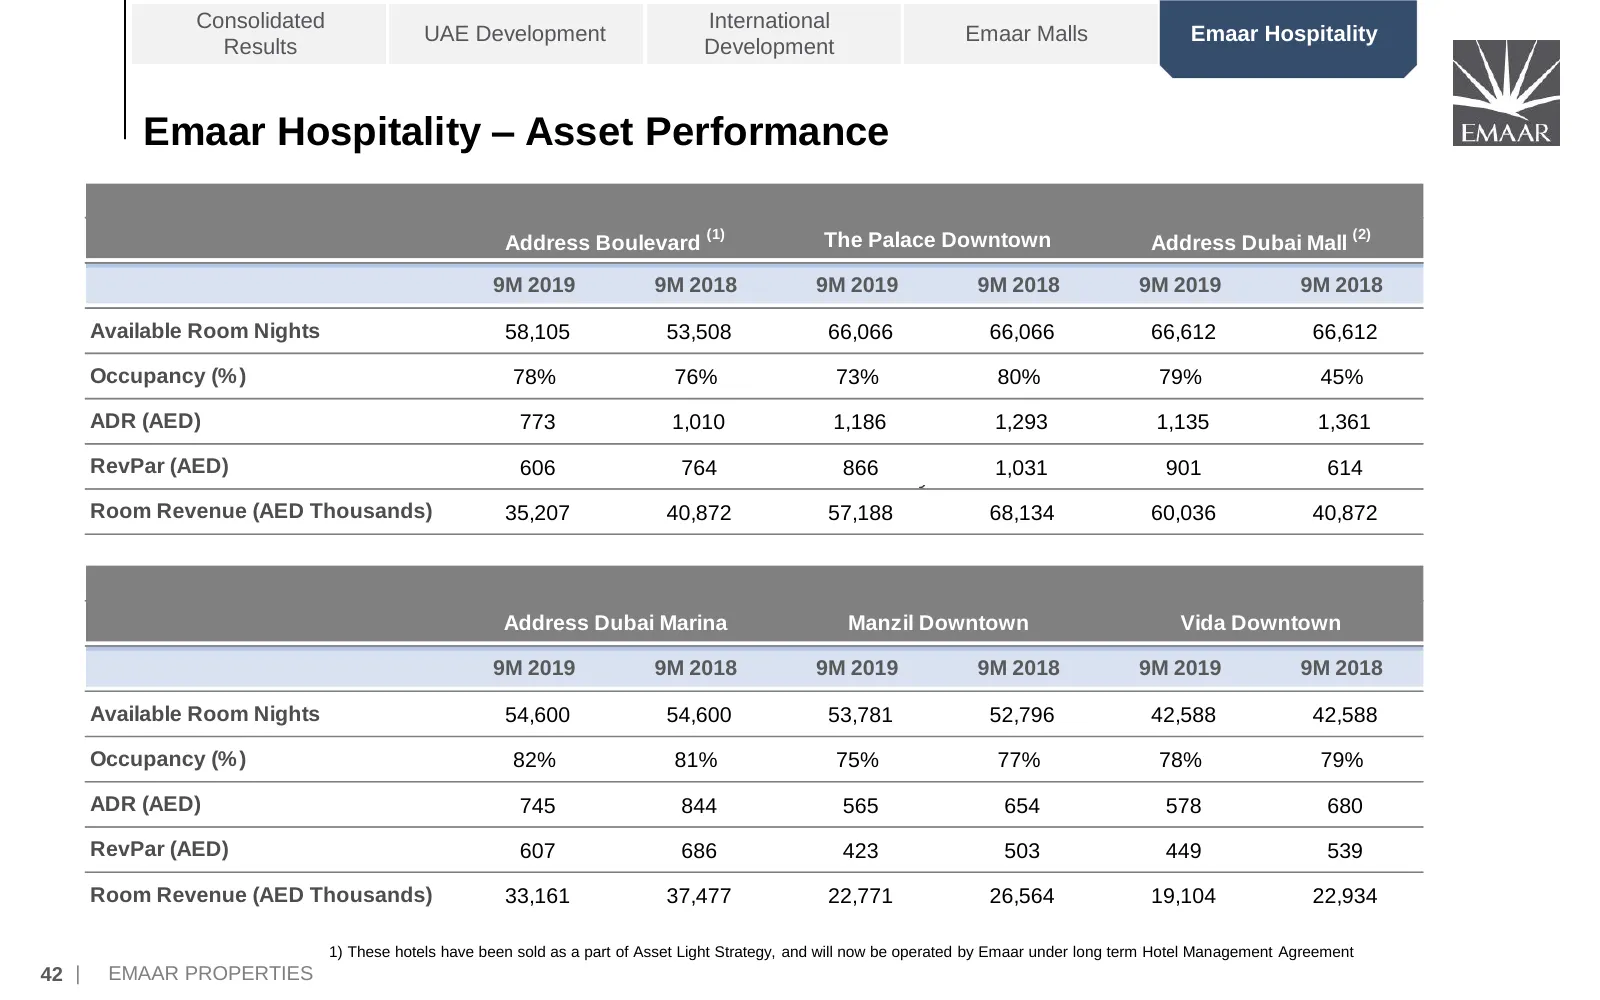
Consolidated International UAE Development Emaar Malls Emaar Hospitality Results Development Emaar Hospitality – Asset Performance (1) (2) Address Boulevard The Palace Downtown Address Dubai Mall 9M 2019 9M 2018 9M 2019 9M 2018 9M 2019 9M 2018 Available Room Nights 58,105 53,508 66,066 66,066 66,612
Slide 44: Annexure
Annexure 43 | EMAAR PROPERTIES
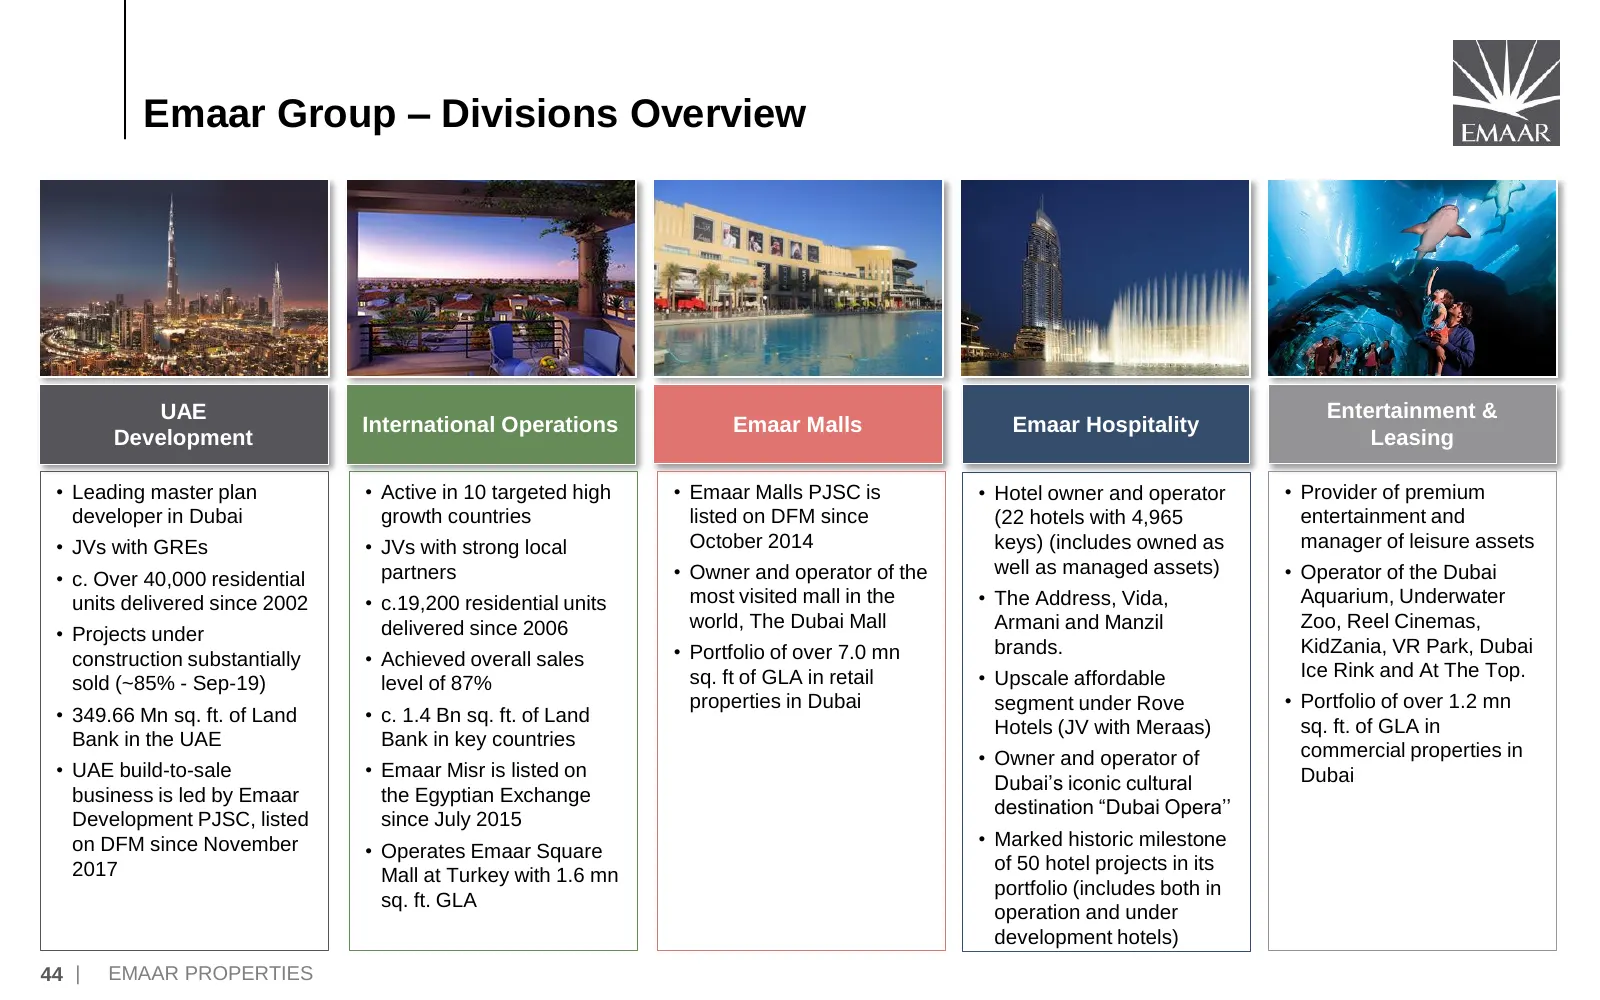
Slide 45: Emaar Group – Divisions Overview
Emaar Group – Divisions Overview UAE Entertainment & International Operations Emaar Malls Emaar Hospitality Development Leasing • Leading master plan • Active in 10 targeted high • Emaar Malls PJSC is • Hotel owner and operator • Provider of premium developer in Dubai growth countries listed on DFM
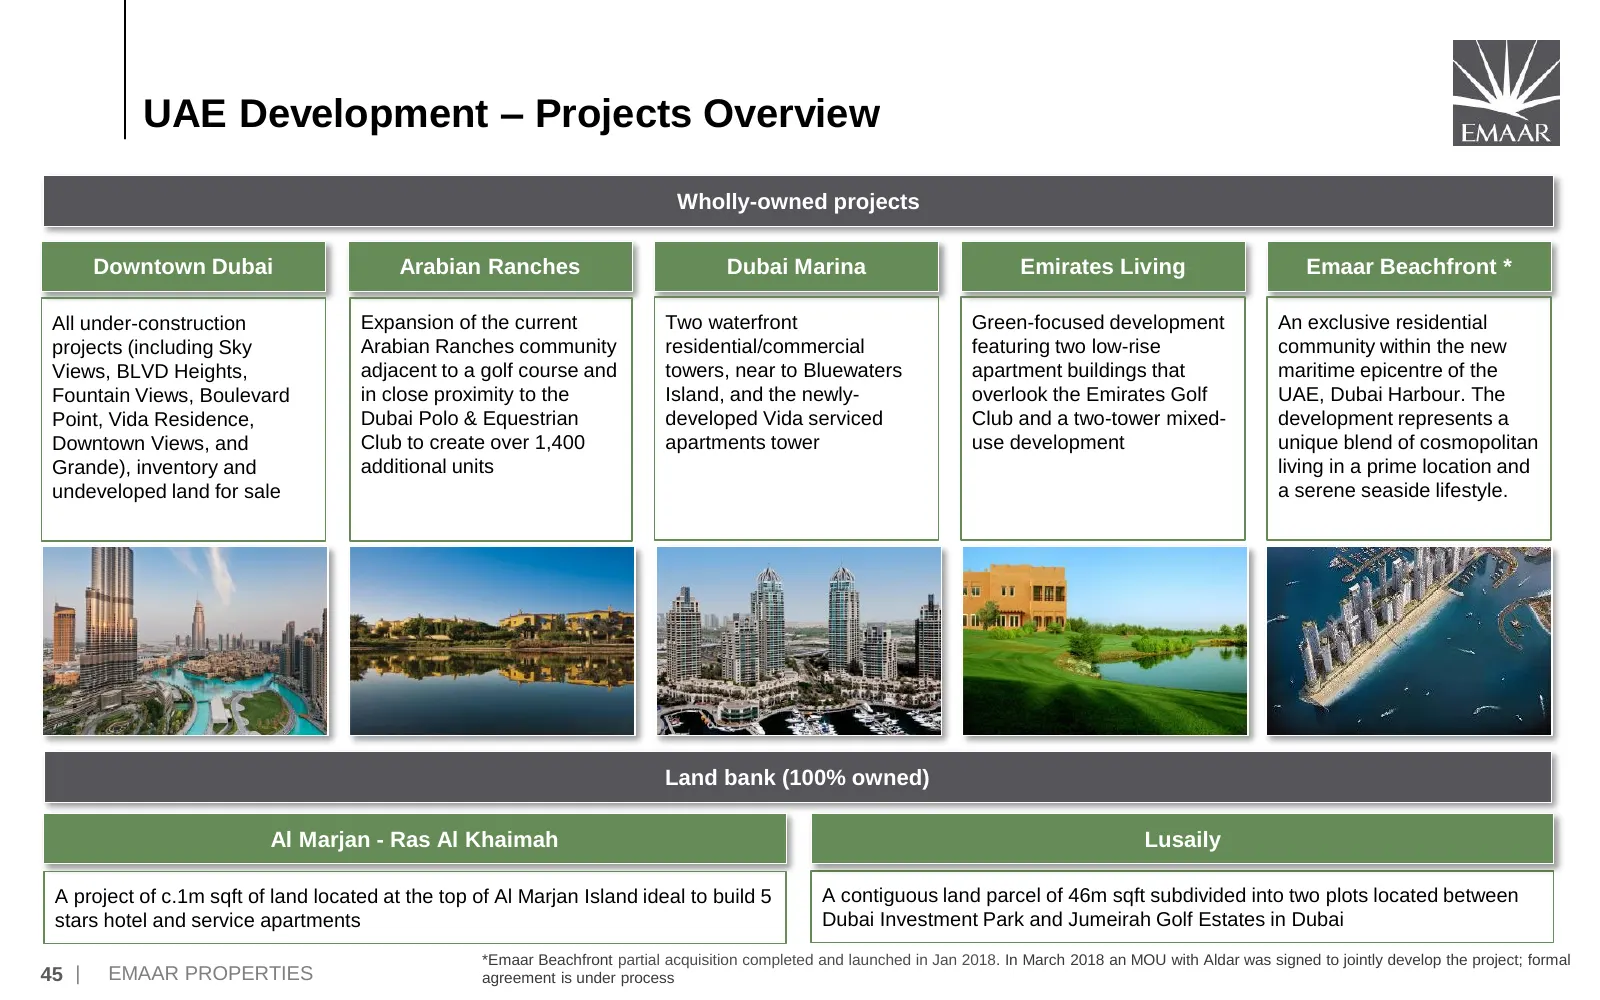
Slide 46: UAE Development – Projects Overview
UAE Development – Projects Overview Wholly-owned projects Downtown Dubai Arabian Ranches Dubai Marina Emirates Living Emaar Beachfront * All under-construction Expansion of the current Two waterfront Green-focused development An exclusive residential projects (including Sky Arabian Ranches community
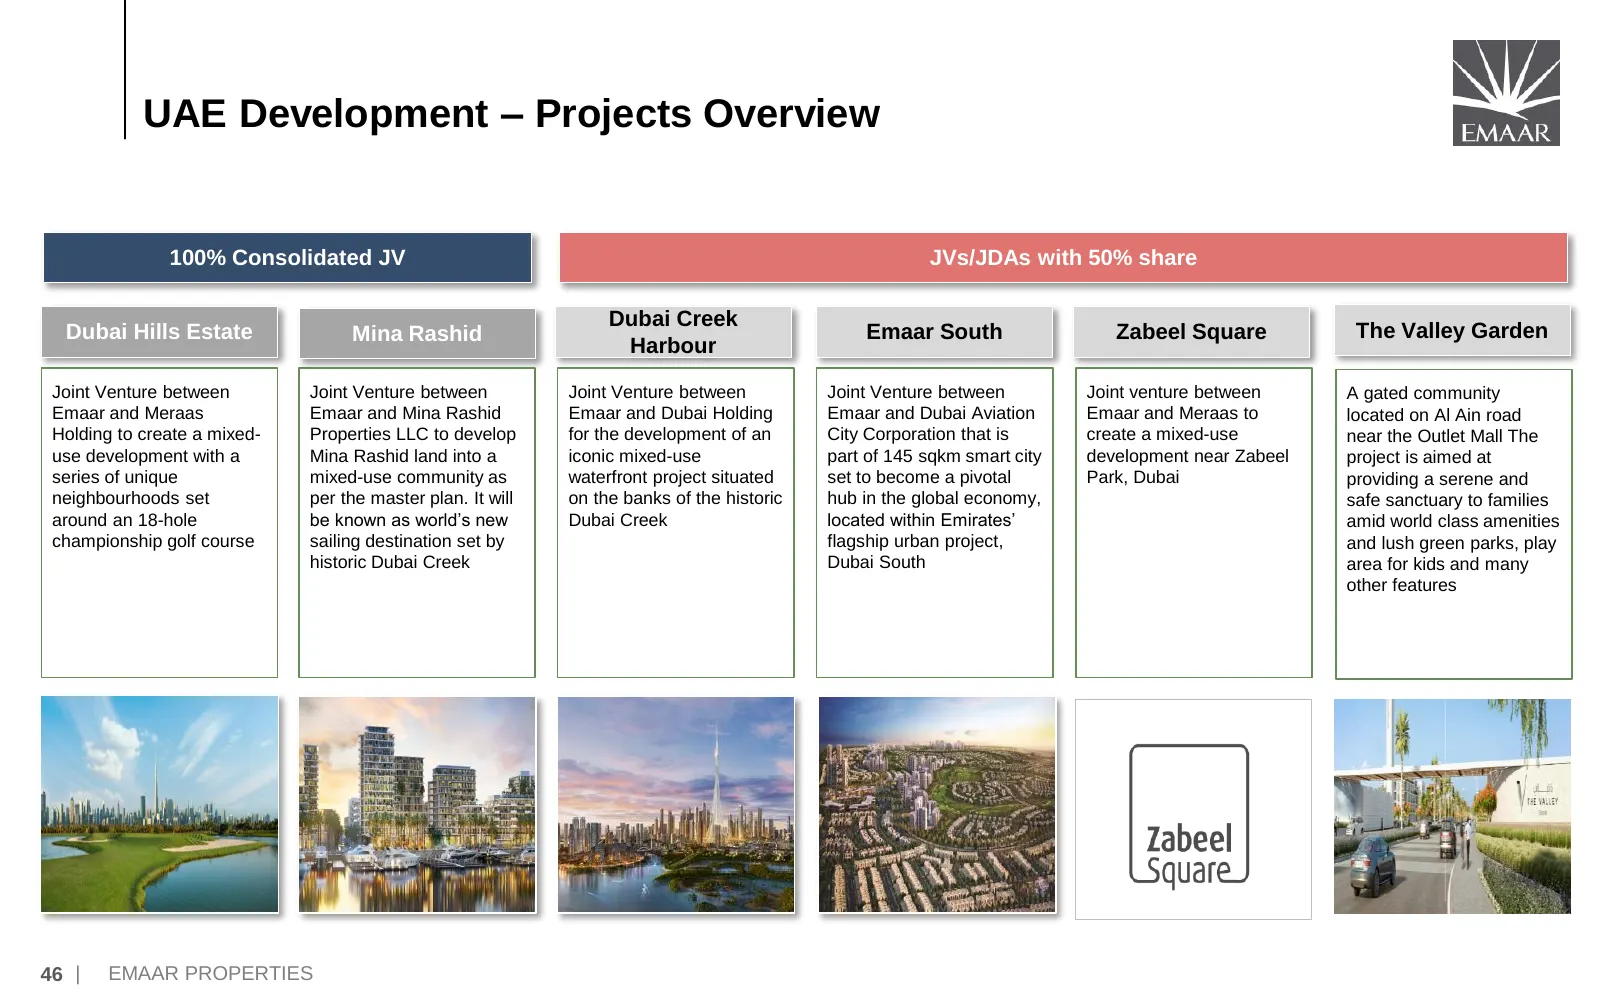
Slide 47: UAE Development – Projects Overview
UAE Development – Projects Overview 100% Consolidated JV JVs/JDAs with 50% share Dubai Creek Dubai Hills Estate Mina Rashid Emaar South Zabeel Square The Valley Garden Harbour Joint Venture between Joint Venture between Joint Venture between Joint Venture between Joint venture between A gated commun
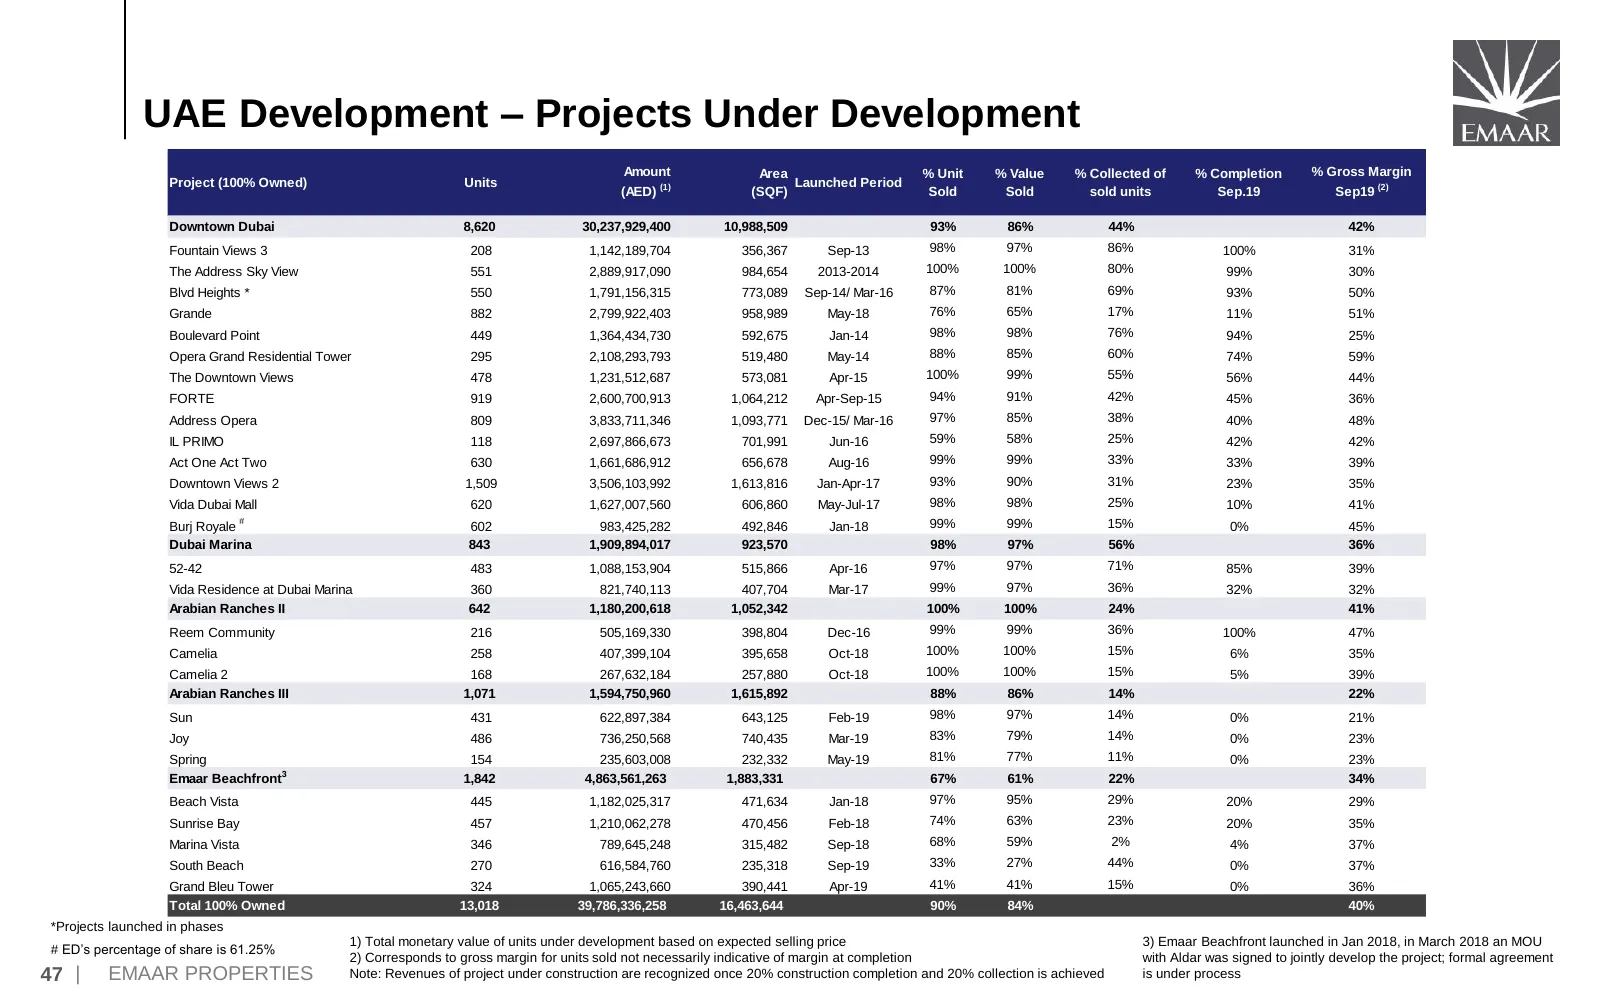
Slide 48: UAE Development – Projects Under Development
UAE Development – Projects Under Development Amount Area % Unit % Value % Collected of % Completion % Gross Margin Project (100% Owned) Units Launched Period (AED) (1) (SQF) Sold Sold sold units Sep.19 Sep19 (2) Downtown Dubai 8,620 30,237,929,400 10,988,509 93% 86% 44% 42% Fountain Views 3 208 1,14
Slide 49: UAE Development – Projects Under Development
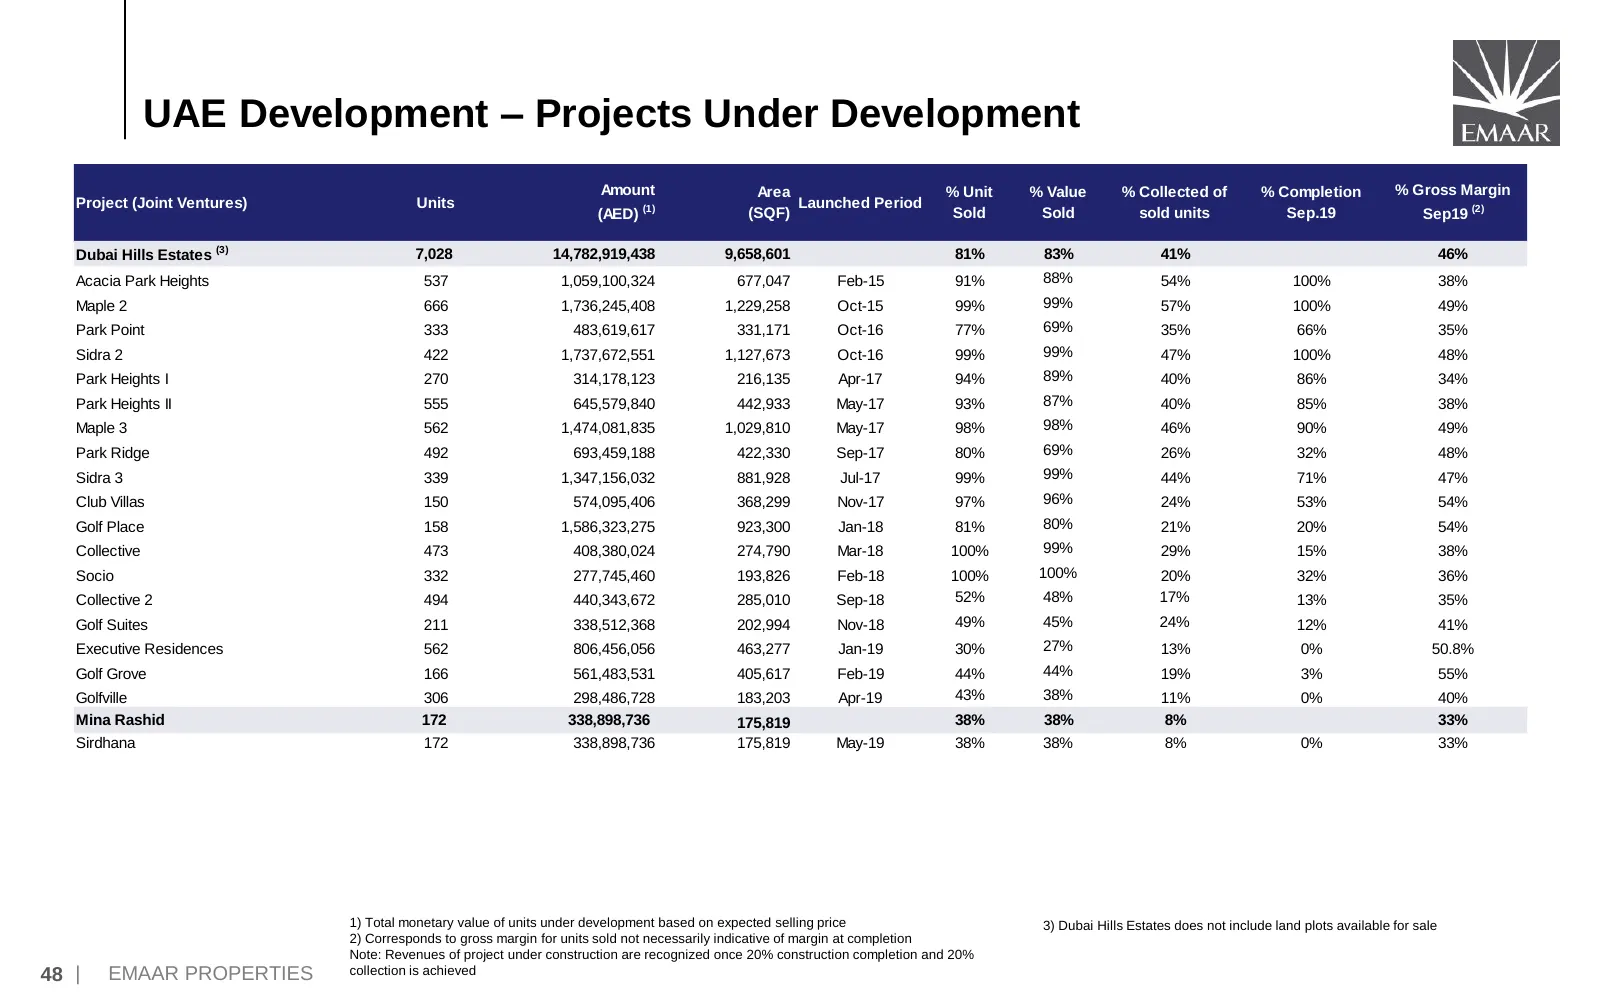
UAE Development – Projects Under Development Amount Area % Unit % Value % Collected of % Completion % Gross Margin Project (Joint Ventures) Units Launched Period (AED) (1) (SQF) Sold Sold sold units Sep.19 Sep19 (2) Dubai Hills Estates (3) 7,028 14,782,919,438 9,658,601 81% 83% 41% 46% Acacia Park H
Slide 50: UAE Development – Projects Under Development
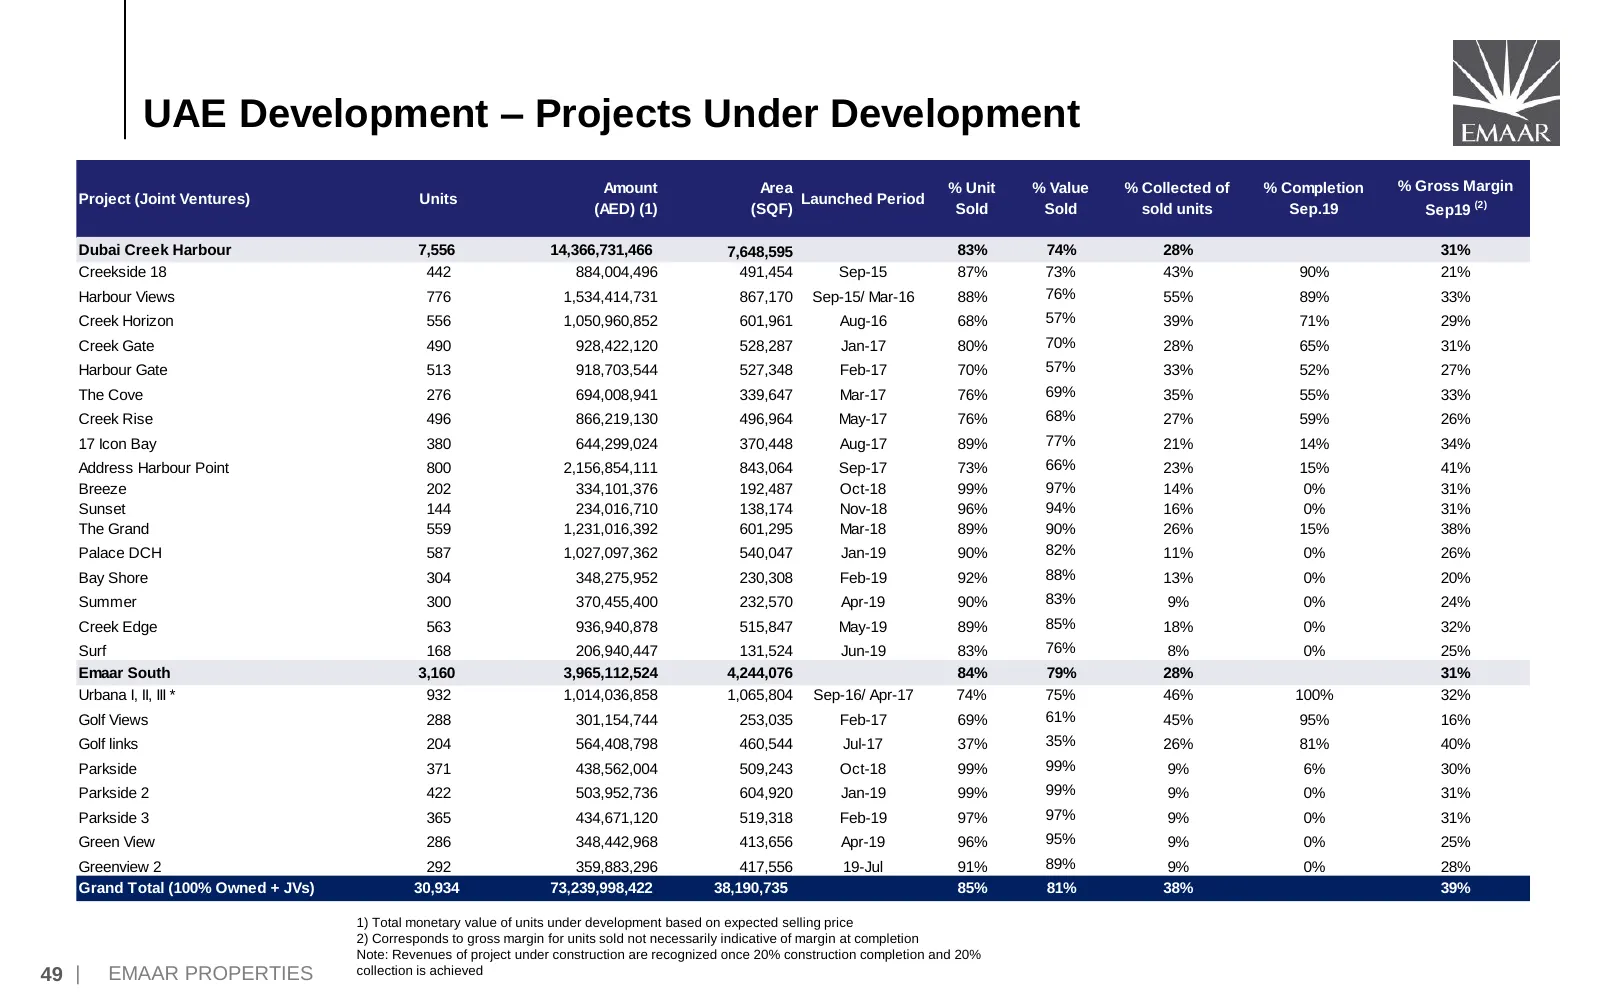
UAE Development – Projects Under Development Amount Area % Unit % Value % Collected of % Completion % Gross Margin Project (Joint Ventures) Units Launched Period (AED) (1) (SQF) Sold Sold sold units Sep.19 Sep19 (2) Dubai Creek Harbour 7,556 14,366,731,466 7,648,595 83% 74% 28% 31% Creekside 18 442
Slide 51: UAE Development – Location of Development Projects
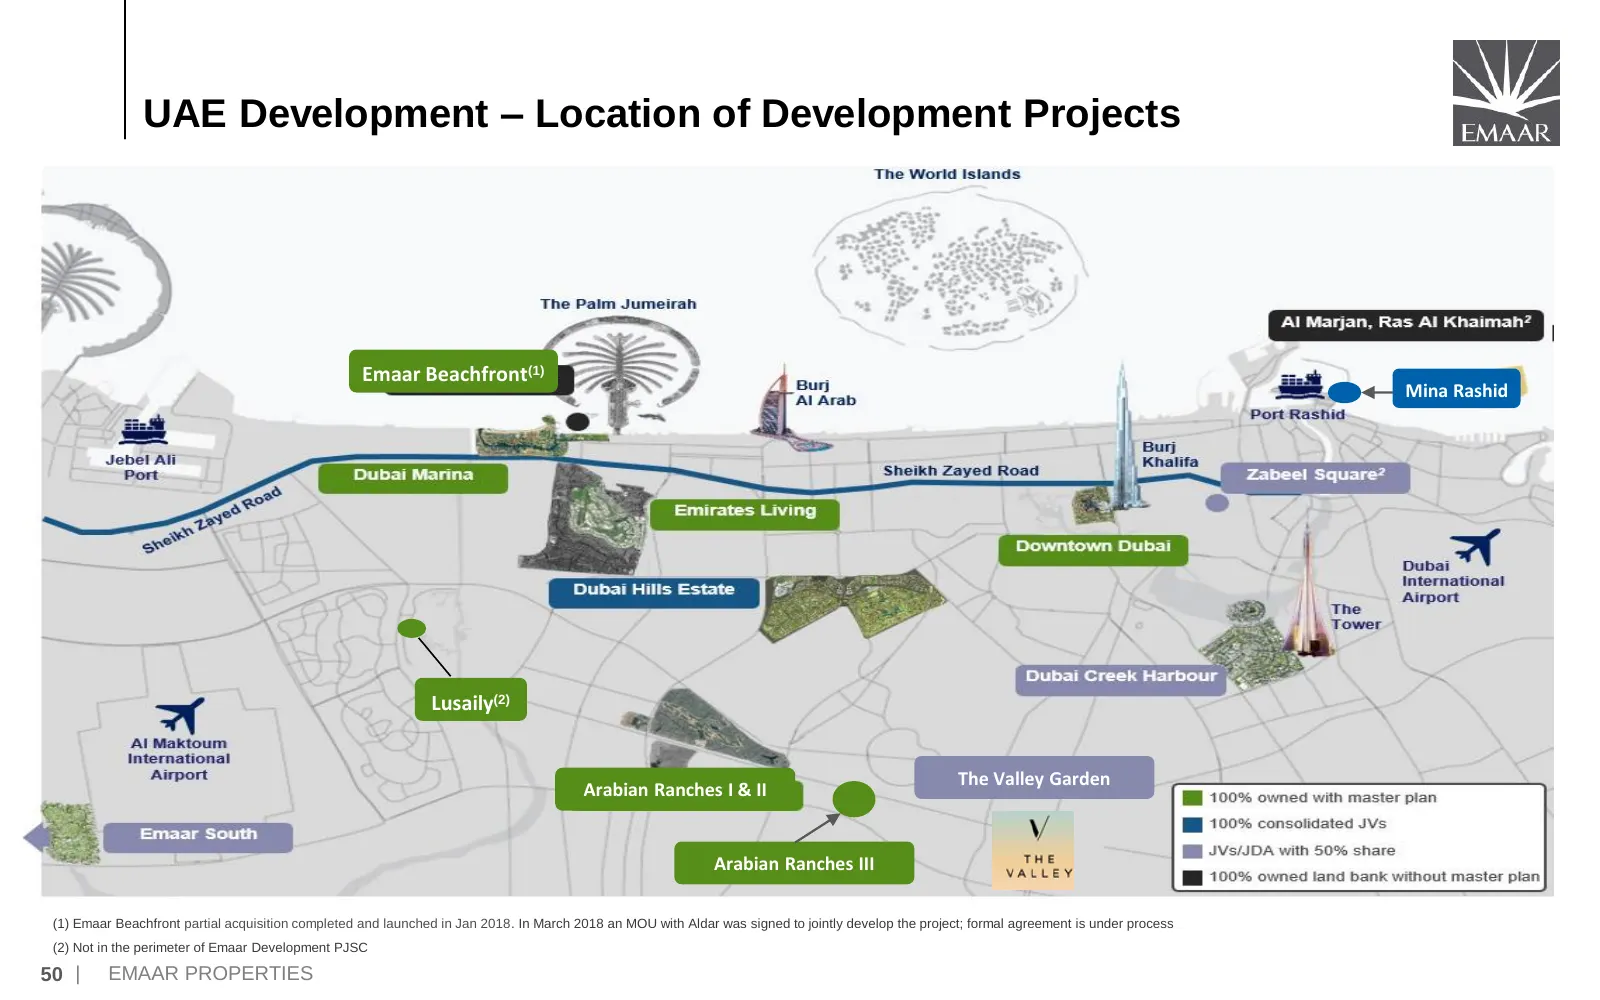
UAE Development – Location of Development Projects Emaar Beachfront(1) Mina Rashid Lusaily(2) The Valley Garden Arabian Ranches I & II Arabian Ranches III (1) Emaar Beachfront partial acquisition completed and launched in Jan 2018. In March 2018 an MOU with Aldar was signed to jointly develop the pr
Slide 52: UAE Development – Expected Delivery Schedule (Units)
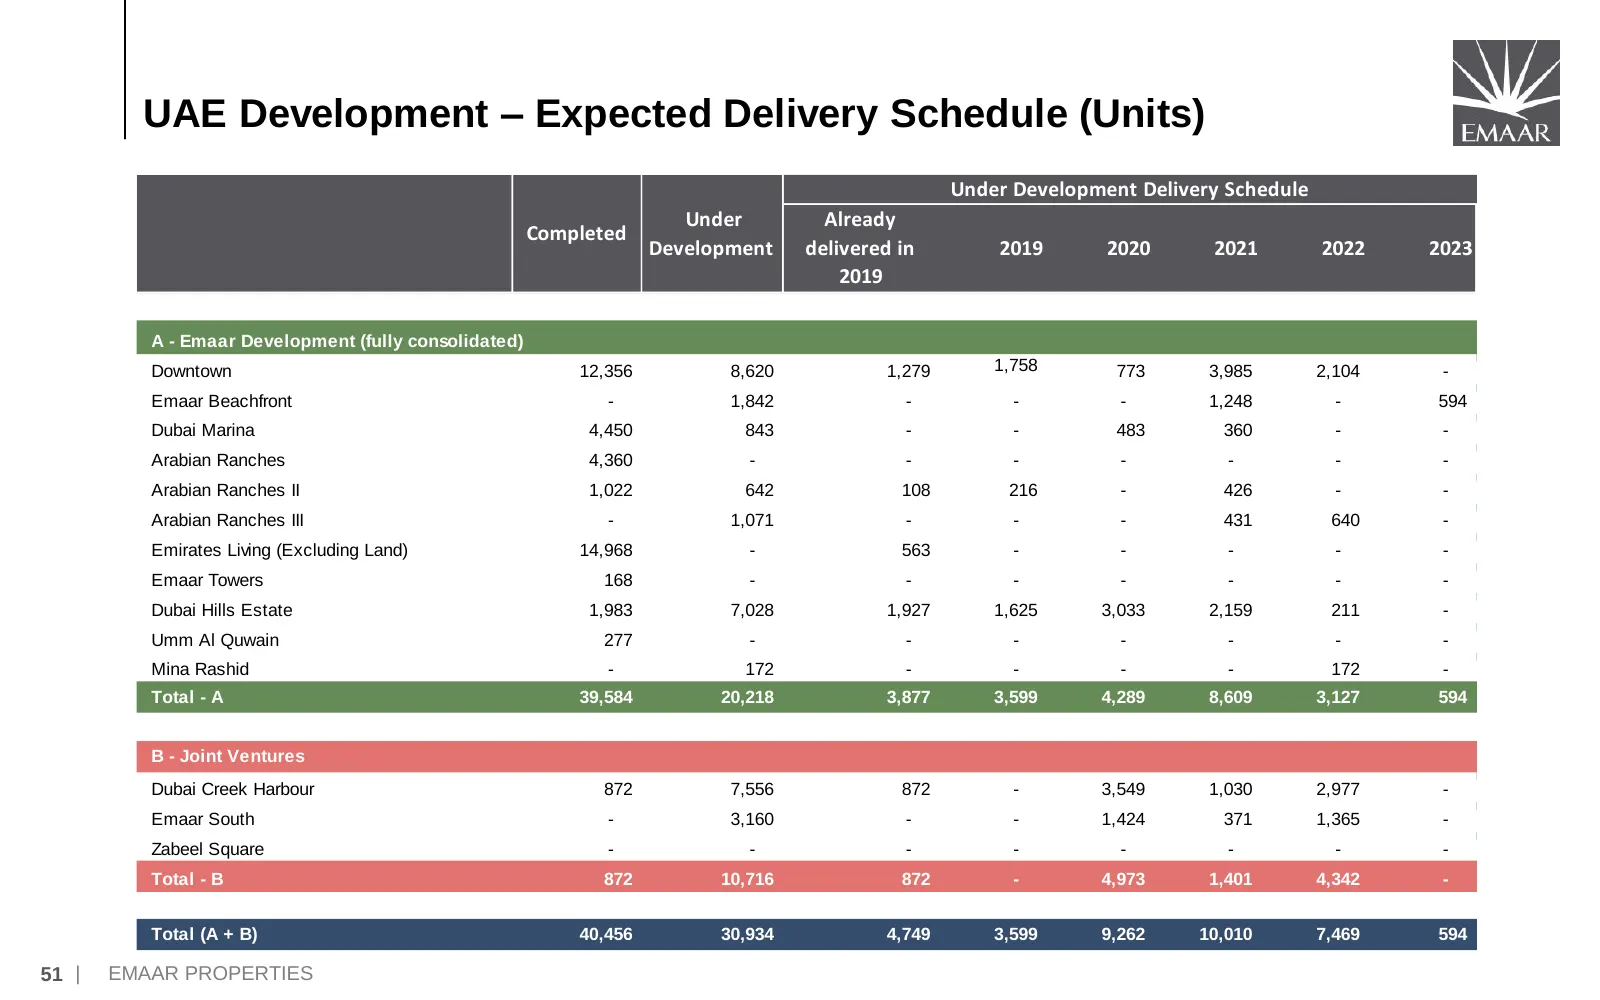
UAE Development – Expected Delivery Schedule (Units) Under Development Delivery Schedule Under Already Completed Development delivered in 2019 2020 2021 2022 2023 2019 - A - Emaar Development (fully consolidated) Downtown 12,356 8,620 1,279 1,758 773 3,985 2,104 - Emaar Beachfront - 1,842 - - - 1,24
Slide 53: UAE Development – Land Bank Details
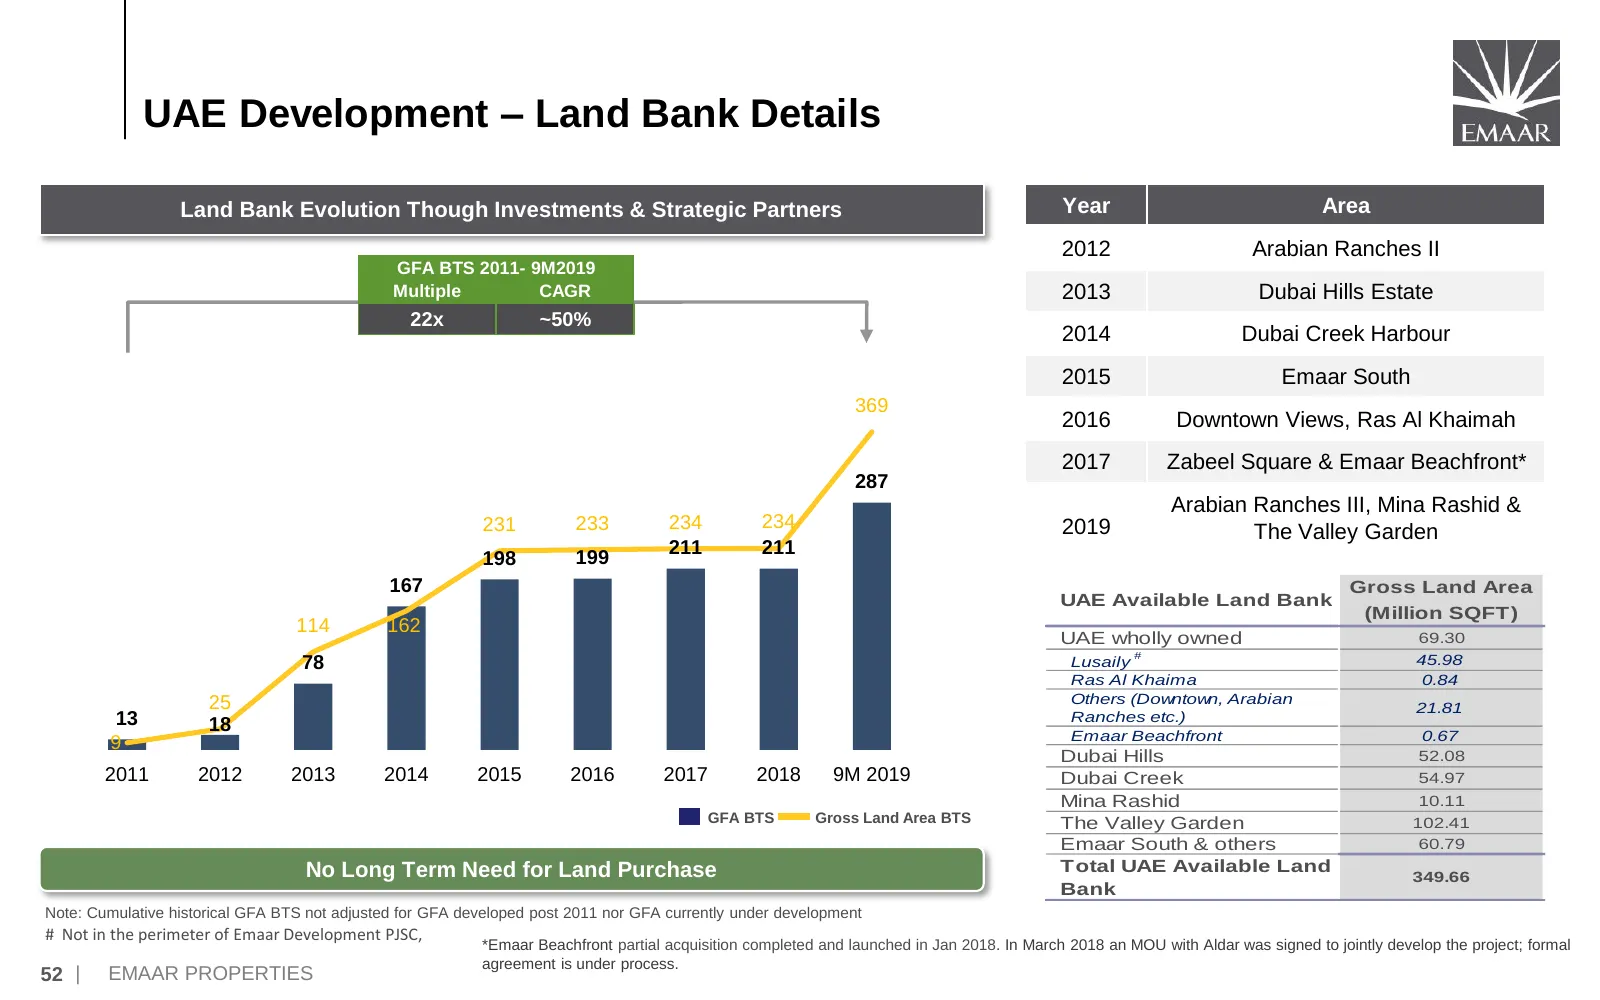
UAE Development – Land Bank Details Land Bank Evolution Though Investments & Strategic Partners Year Area 2012 Arabian Ranches II (million sq ft) GFA BTS 2011- 9M2019 Multiple CAGR 2013 Dubai Hills Estate 22x ~50% 2014 Dubai Creek Harbour 2015 Emaar South 369 2016 Downtown Views, Ras Al Khaimah 2017
Slide 54: International Development – Expected Delivery Schedule
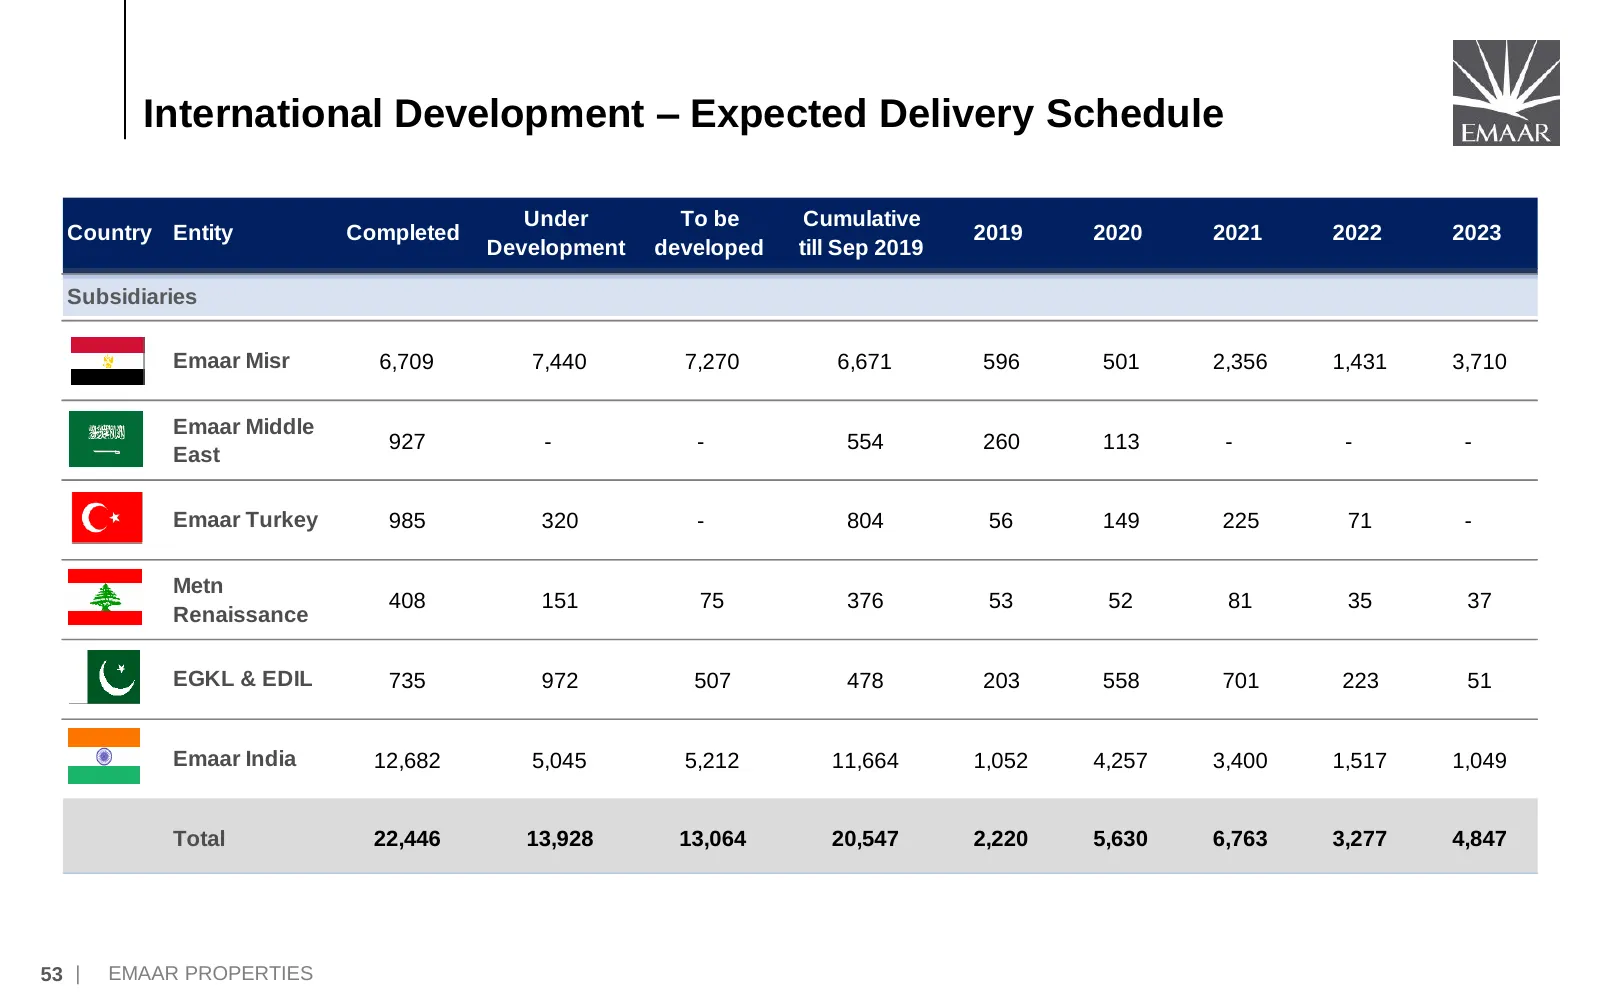
International Development – Expected Delivery Schedule Under To be Cumulative Country Entity Completed 2019 2020 2021 2022 2023 Development developed till Sep 2019 Subsidiaries Emaar Misr 6,709 7,440 7,270 6,671 596 501 2,356 1,431 3,710 Emaar Middle 927 - - 554 260 113 - - - East Emaar Turkey 985 3
Slide 55: International Development – Land Bank Details
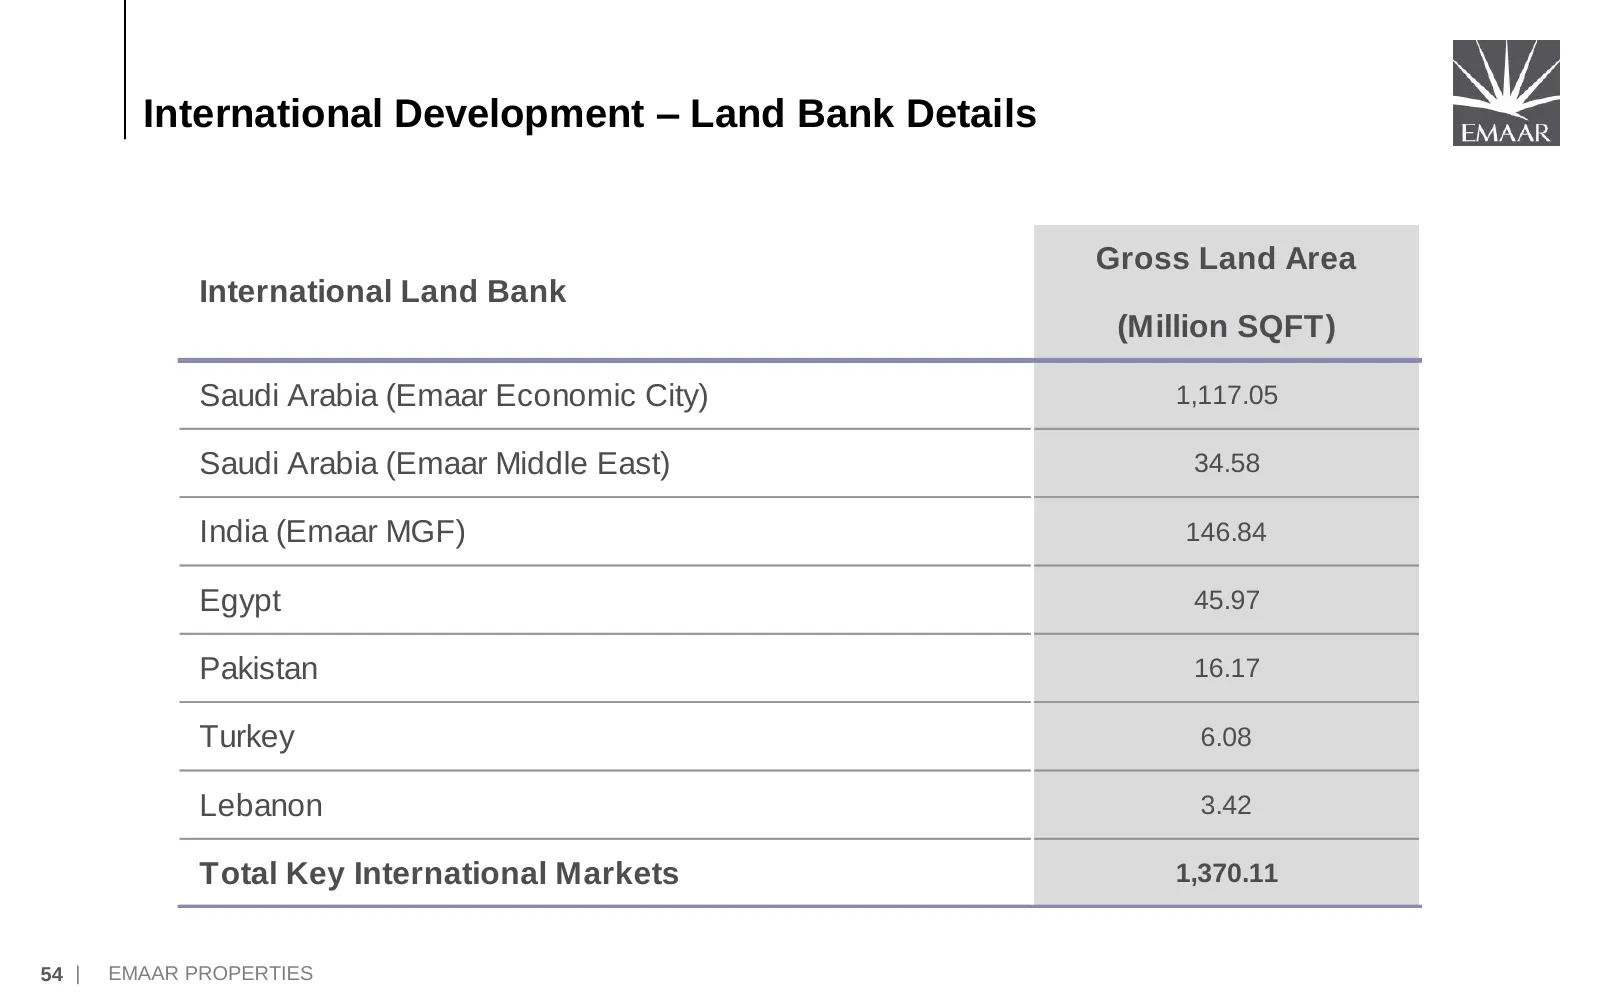
International Development – Land Bank Details Gross Land Area International Land Bank (Million SQFT) Saudi Arabia (Emaar Economic City) 1,117.05 Saudi Arabia (Emaar Middle East) 34.58 India (Emaar MGF) 146.84 Egypt 45.97 Pakistan 16.17 Turkey 6.08 Lebanon 3.42 Total Key International Markets 1,370.1
Slide 56: JV / JDA Accounting Treatment
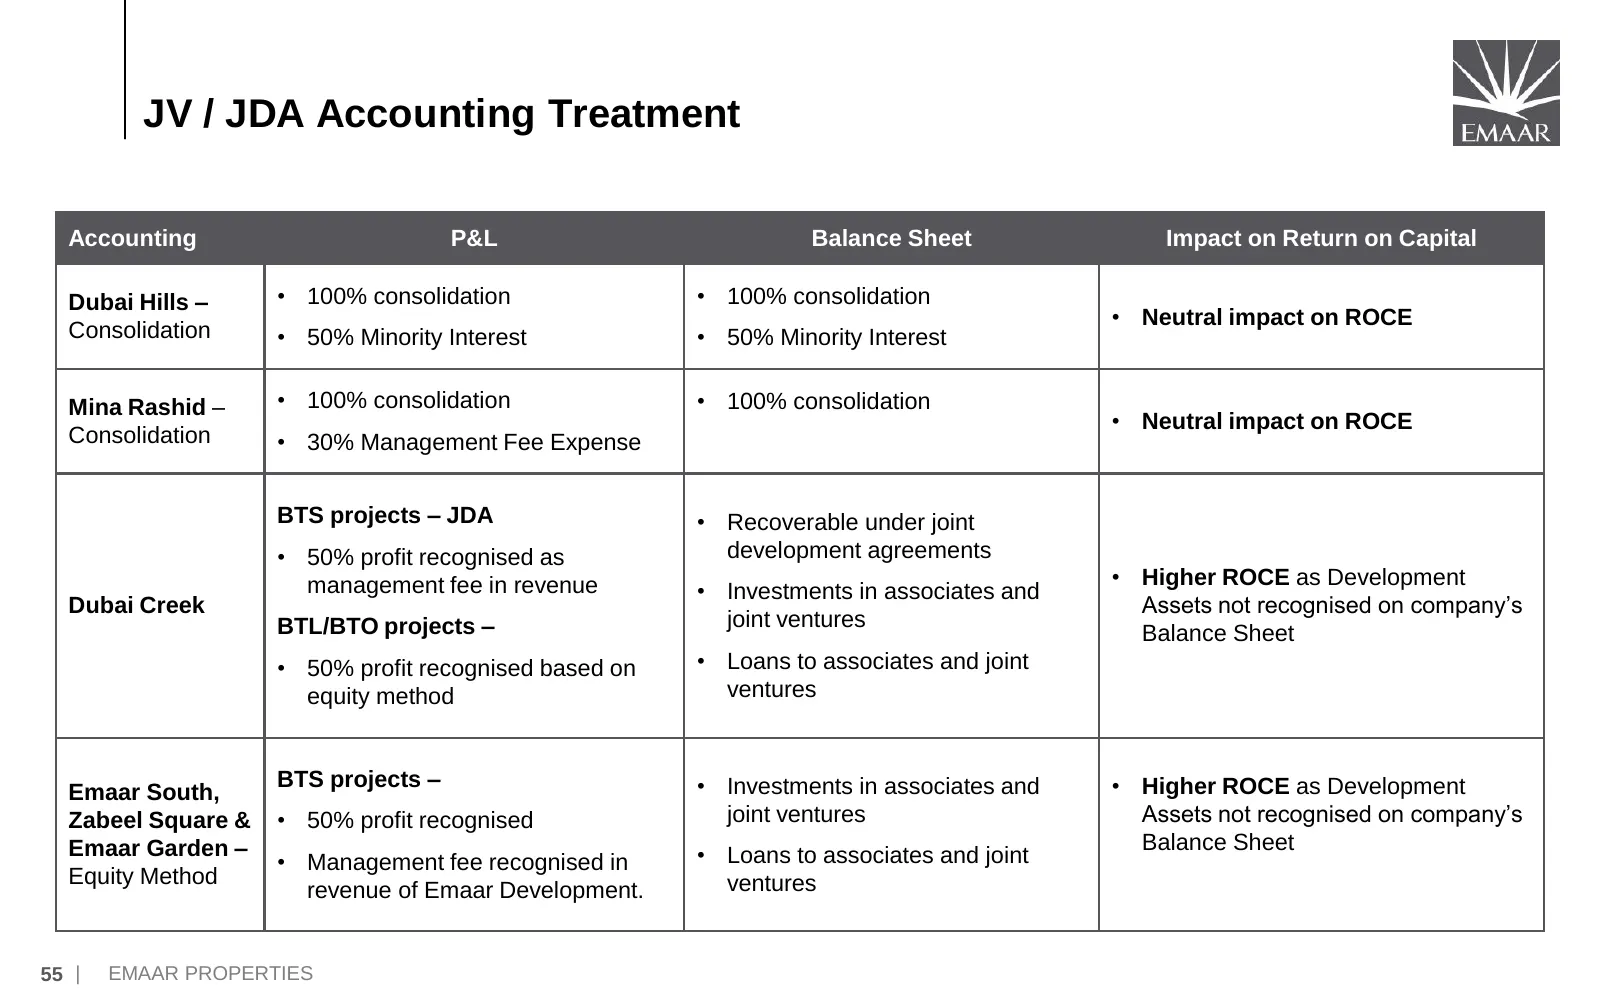
JV / JDA Accounting Treatment Accounting P&L Balance Sheet Impact on Return on Capital Dubai Hills – • 100% consolidation • 100% consolidation • Neutral impact on ROCE Consolidation • 50% Minority Interest • 50% Minority Interest Mina Rashid – • 100% consolidation • 100% consolidation • Neutral impa
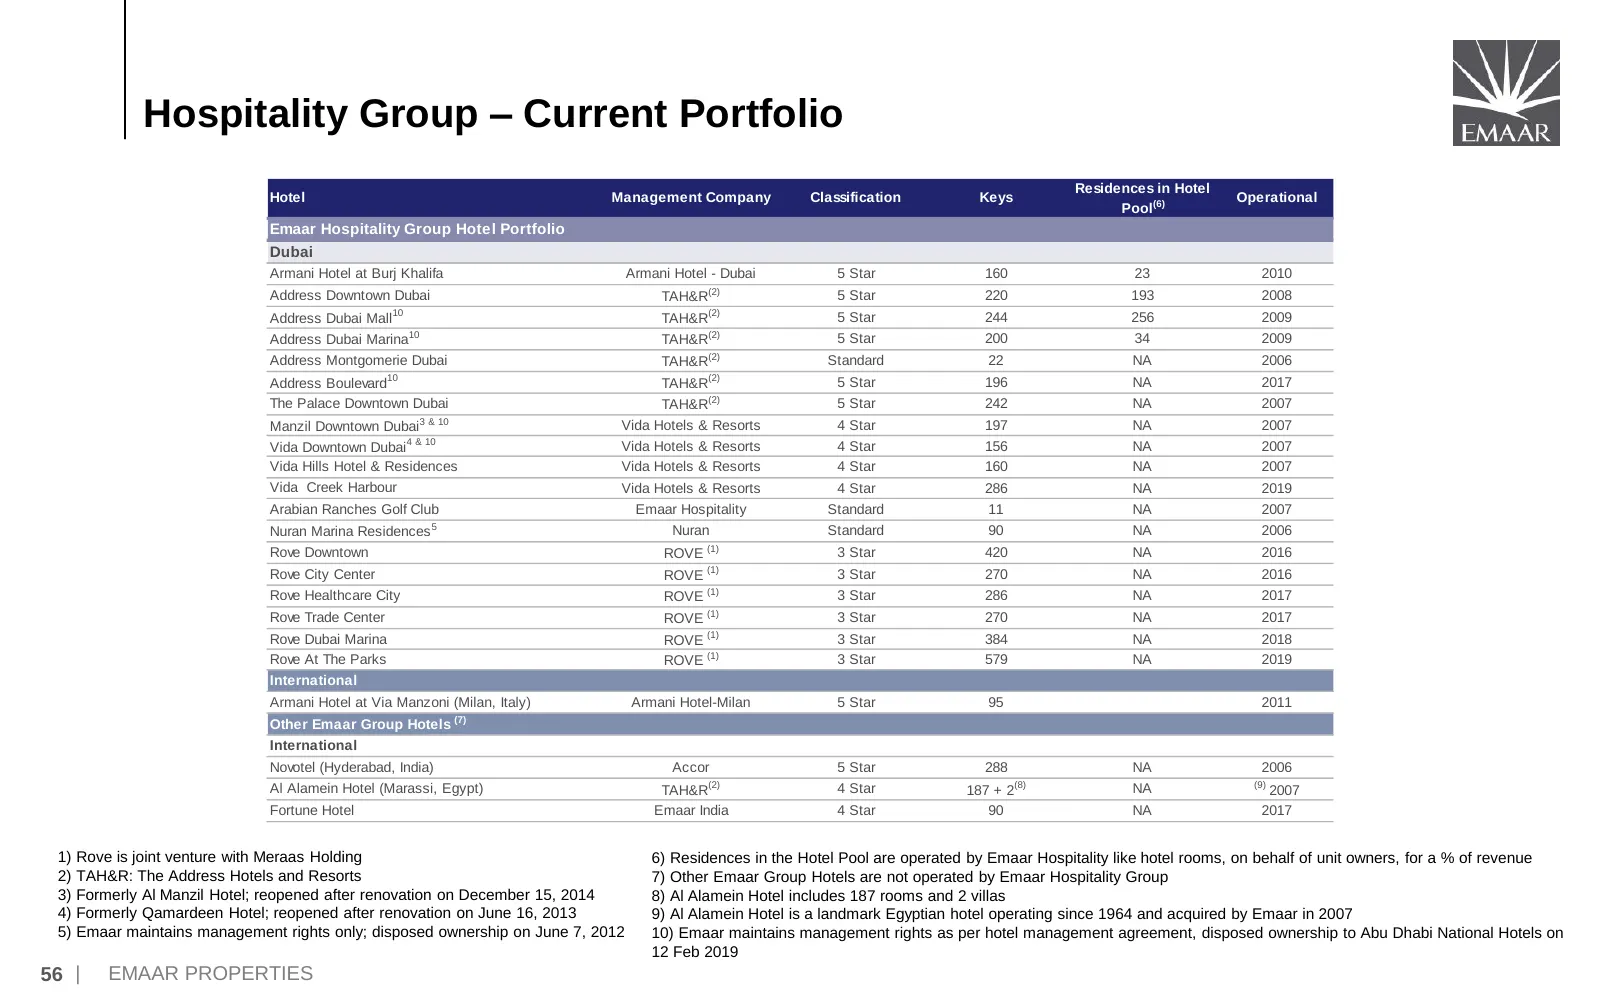
Slide 57: Hospitality Group – Current Portfolio
Hospitality Group – Current Portfolio Residences in Hotel Hotel Management Company Classification Keys Operational Pool (6) Emaar Hospitality Group Hotel Portfolio Dubai Armani Hotel at Burj Khalifa Armani Hotel - Dubai 5 Star 160 23 2010 Address Downtown Dubai TAH&R(2) 5 Star 220 193 2008 Address D
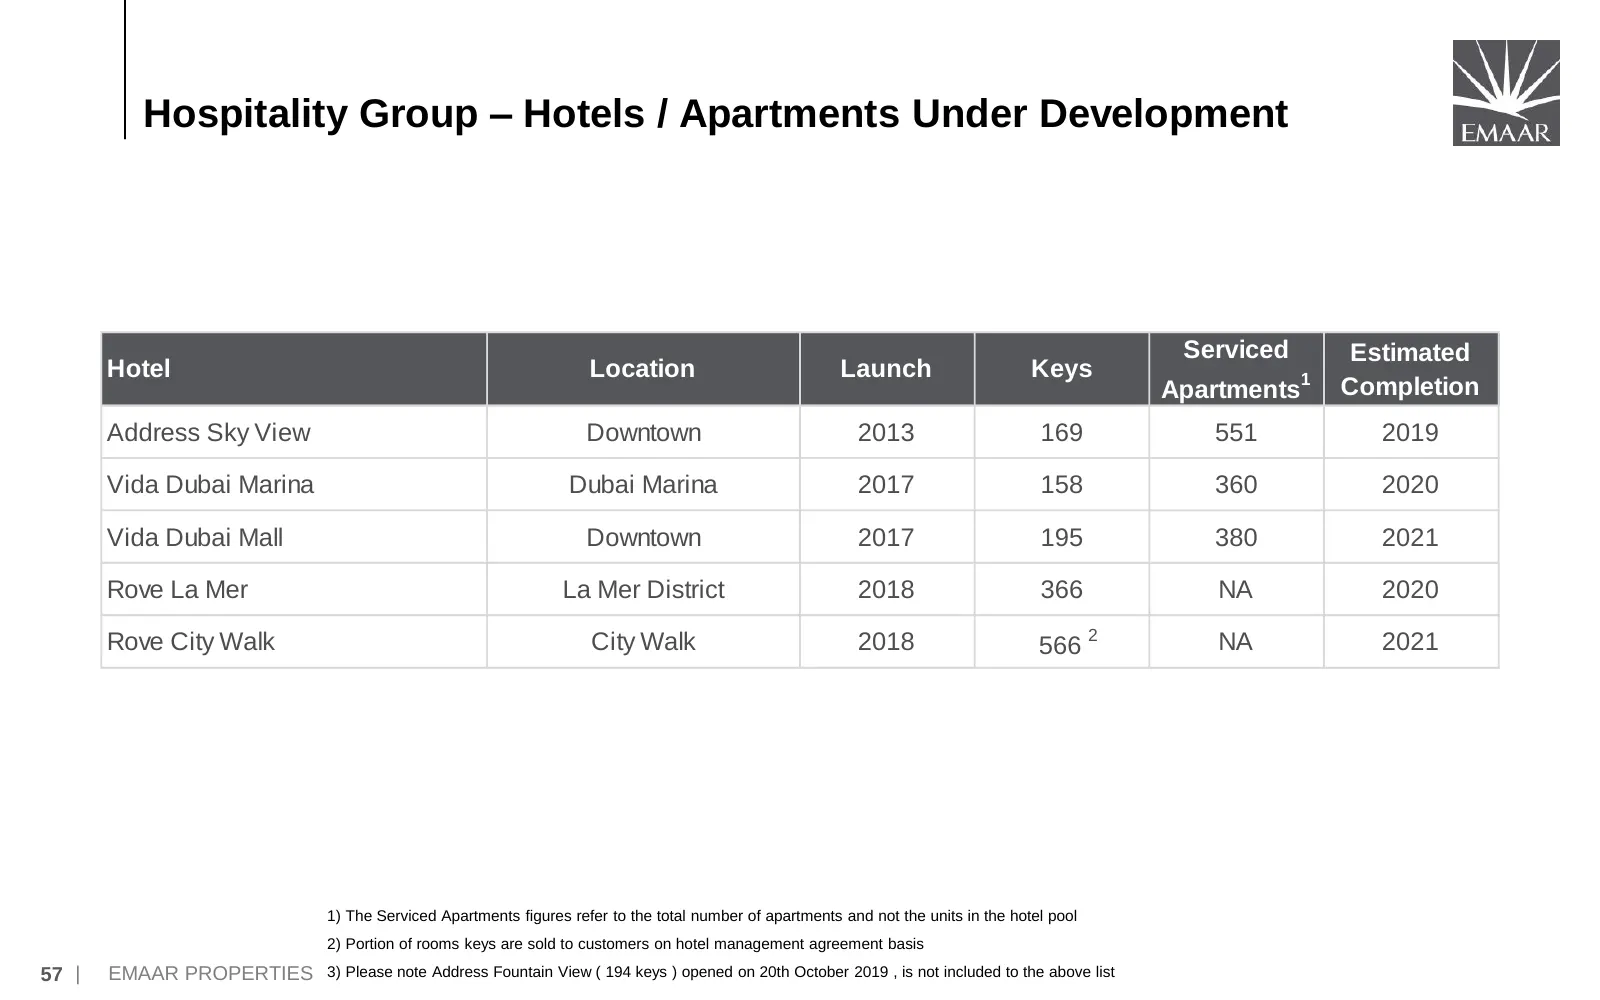
Slide 58: Hospitality Group – Hotels / Apartments Under Development
Hospitality Group – Hotels / Apartments Under Development Serviced Estimated Hotel Location Launch Keys 1 Apartments Completion Address Sky View Downtown 2013 169 551 2019 Vida Dubai Marina Dubai Marina 2017 158 360 2020 Vida Dubai Mall Downtown 2017 195 380 2021 Rove La Mer La Mer District 2018 366
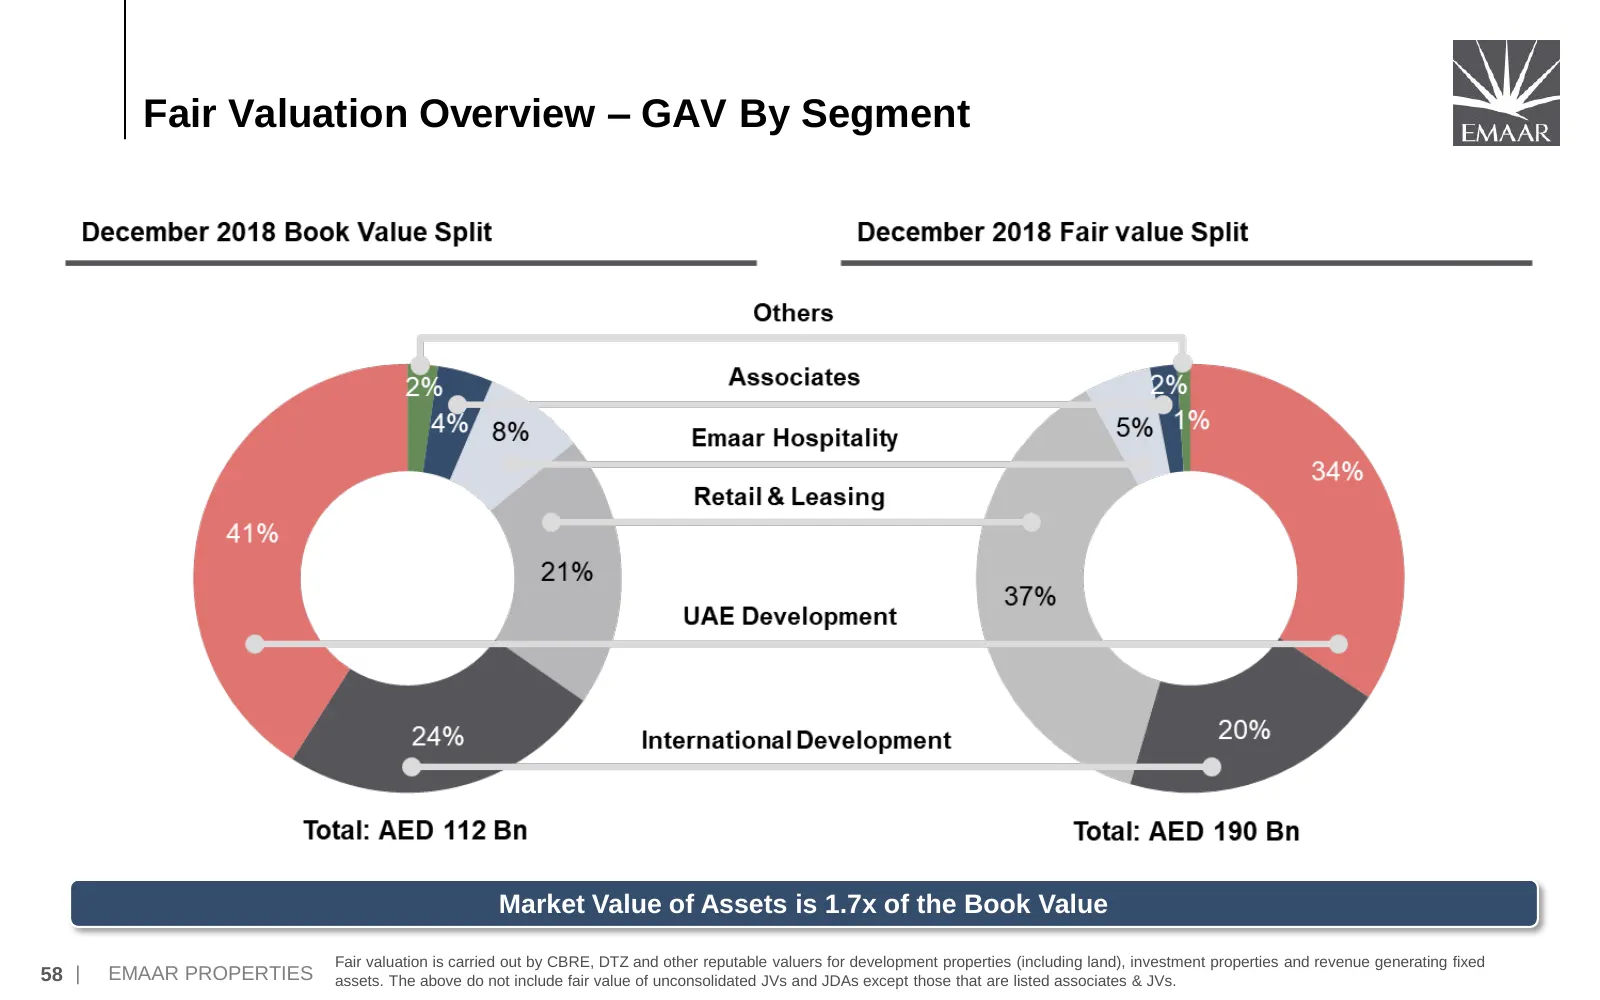
Slide 59: Fair Valuation Overview – GAV By Segment
Fair Valuation Overview – GAV By Segment Market Value of Assets is 1.7x of the Book Value Fair valuation is carried out by CBRE, DTZ and other reputable valuers for development properties (including land), investment properties and revenue generating fixed 58 | EMAAR PROPERTIES assets. The above do
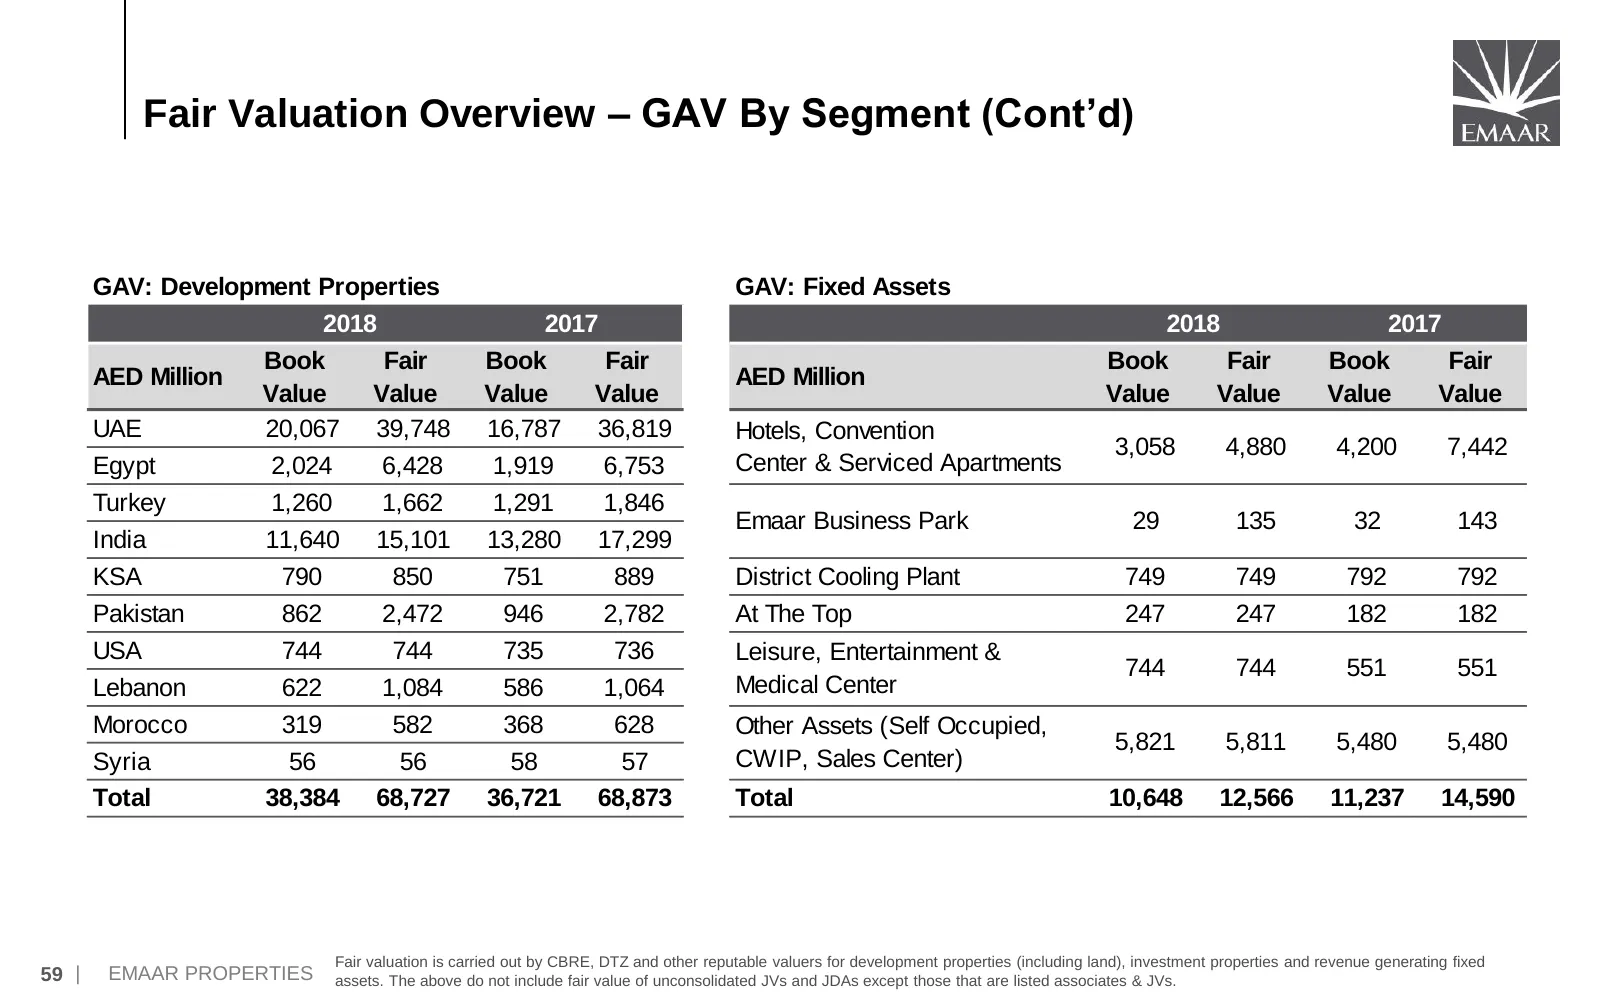
Slide 60: Fair Valuation Overview – GAV By Segment (Cont’d)
Fair Valuation Overview – GAV By Segment (Cont’d) GAV: Development Properties GAV: Fixed Assets 2018 2017 2018 2017 Book Fair Book Fair Book Fair Book Fair AED Million AED Million Value Value Value Value Value Value Value Value UAE 20,067 39,748 16,787 36,819 Hotels, Convention 3,058 4,880 4,200 7,4
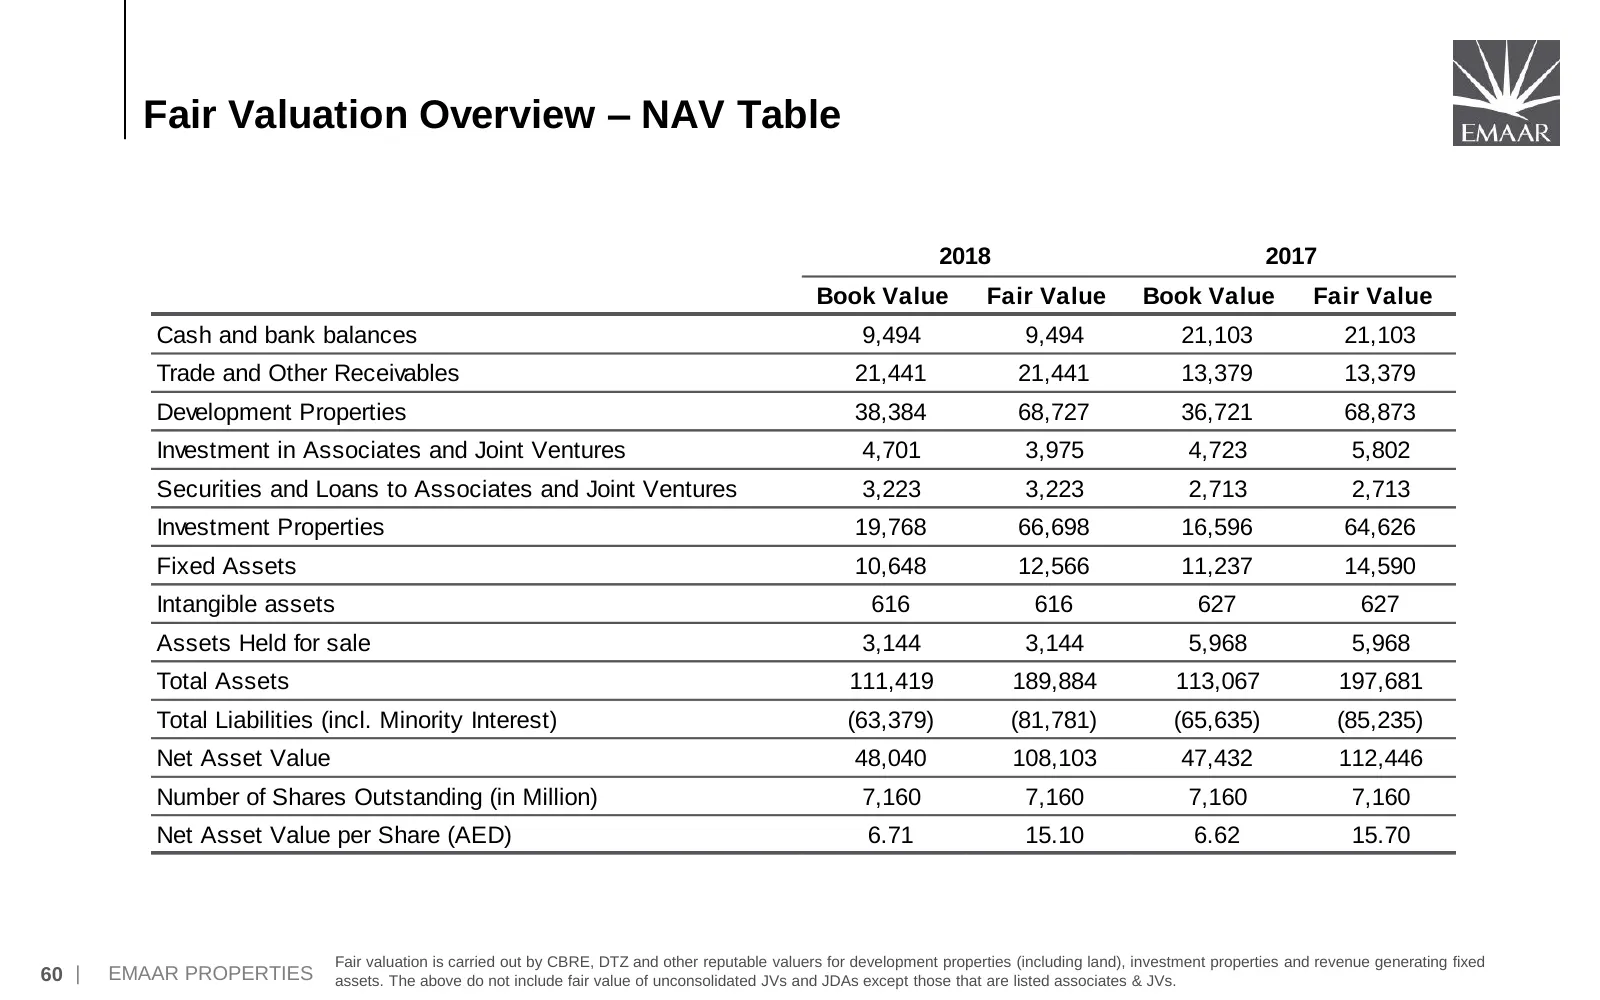
Slide 61: Fair Valuation Overview – NAV Table
Fair Valuation Overview – NAV Table 2018 2017 Book Value Fair Value Book Value Fair Value Cash and bank balances 9,494 9,494 21,103 21,103 Trade and Other Receivables 21,441 21,441 13,379 13,379 Development Properties 38,384 68,727 36,721 68,873 Investment in Associates and Joint Ventures 4,701 3,97
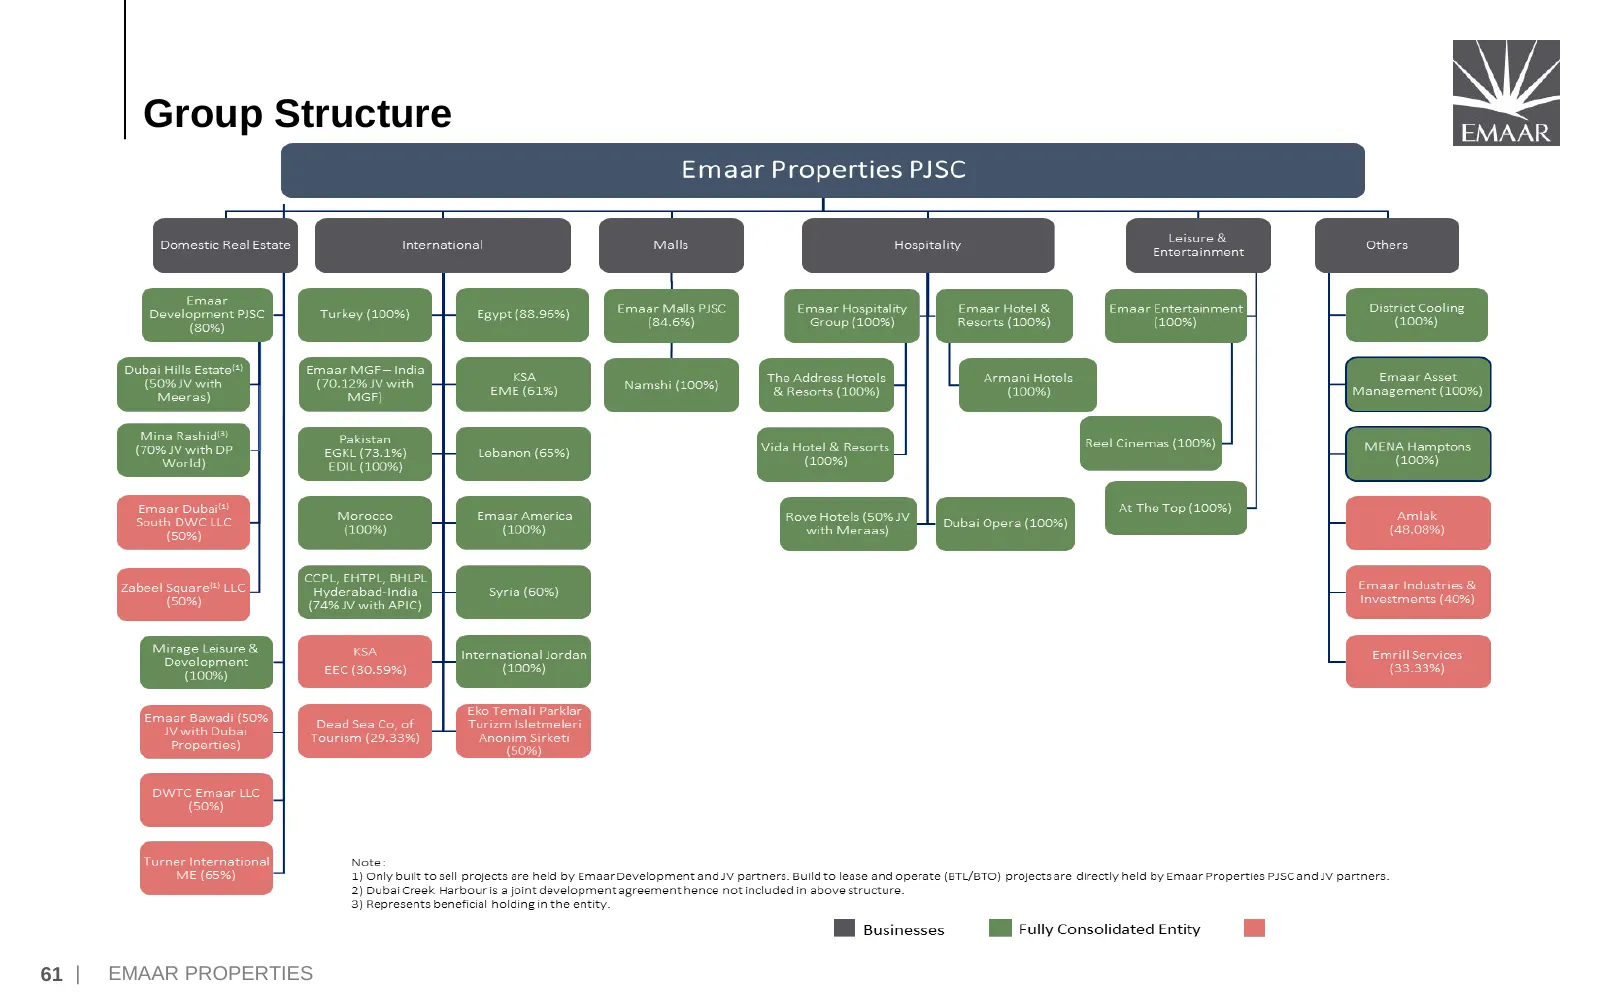
Slide 62: Group Structure
Group Structure (3) (3) 61 | EMAAR PROPERTIES
Slide 63: Thank You
Thank You EMAAR PROPERTIES DICKENSON IR Name – Abhay Singhvi Name – Mehul Mehta / Aakash Mehta Email id - ASinghvi@emaar.ae Email id – emaar@dickensonworld.com 62 | EMAAR PROPERTIES
Source: Internet Archive copy of properties.emaar.com
More decks from Emaar Properties (P.J.S.C)
 H1 2026 Earnings Presentation78 slides · 2026
 Emaar Properties — 9M 2025 Earnings Presentation69 slides · November 2025
 H1 2025 Earnings Presentation69 slides · August 2025
 Emaar Properties — Q1 2025 Earnings Presentation68 slides · May 2025
 Emaar Properties — FY2025 Earnings Presentation71 slides · May 2025
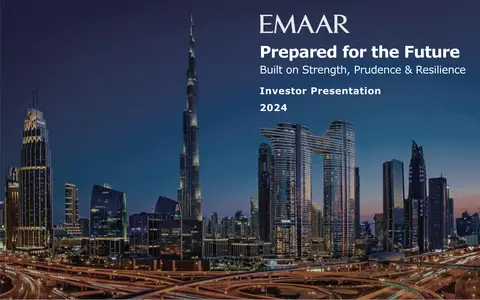 FY2024 Earnings Presentation70 slides · Feb 24, 2025