Russel Metals Inc. · TSX:RUS
Russel Metals — Investor Presentation (November 2026)
44 slides from Russel Metals's investor presentation, November 2026
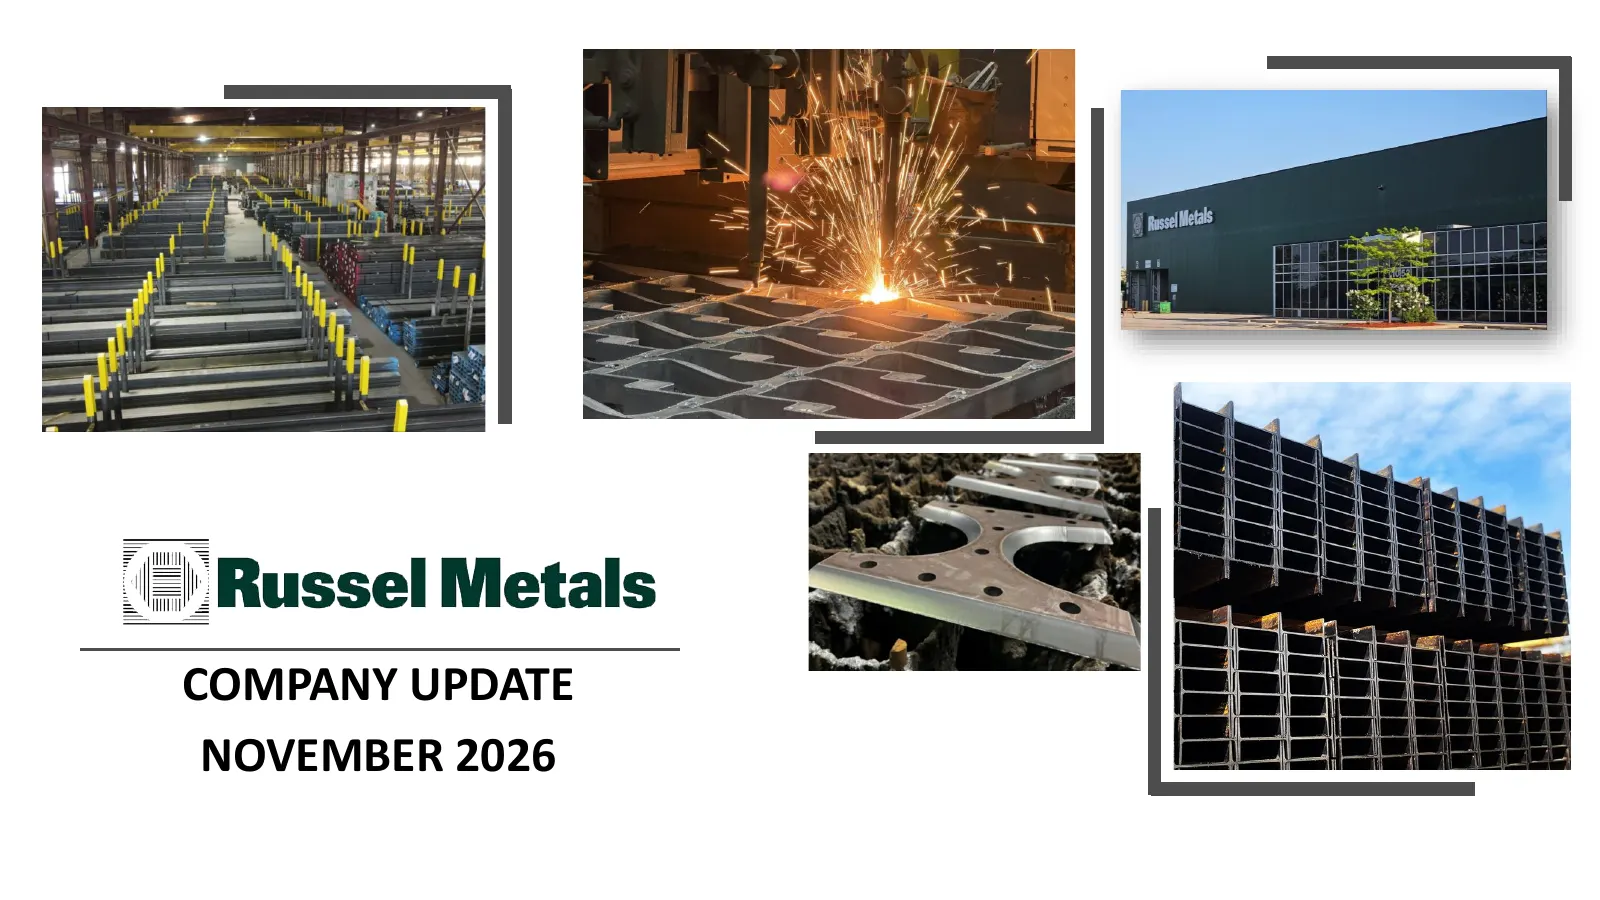
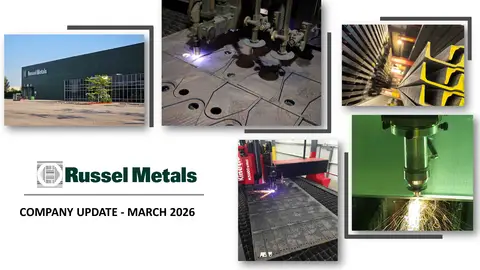
Slide 1: Company Update November 2026
COMPANY UPDATE NOVEMBER 2026
Slide 2: Cautionary Statement on Forward-Looking Information
CAUTIONARY STATEMENT ON FORWARD-LOOKING INFORMATION Certain statements contained in this presentation constitute forward-looking statements or information within the meaning of applicable securities laws, including statements as to our future capital expenditures, our outlook, the availability of fu
Slide 3: Notes (Non-GAAP Measures)
NOTES (NON-GAAP MEASURES) In this Information Package we use certain financial measures that do not comply with IFRS Accounting Standards (IFRS or GAAP) or have standardized meanings, and thus, may not be comparable to similar measures presented by other issuers, for example EBIT, EBITDA, adjusted E
Slide 4: Table of Contents
TABLE OF CONTENTS I. Overview II. Market Trends III. Capital Allocation Priorities IV. Financial Overview V. Recent Acquisitions 4
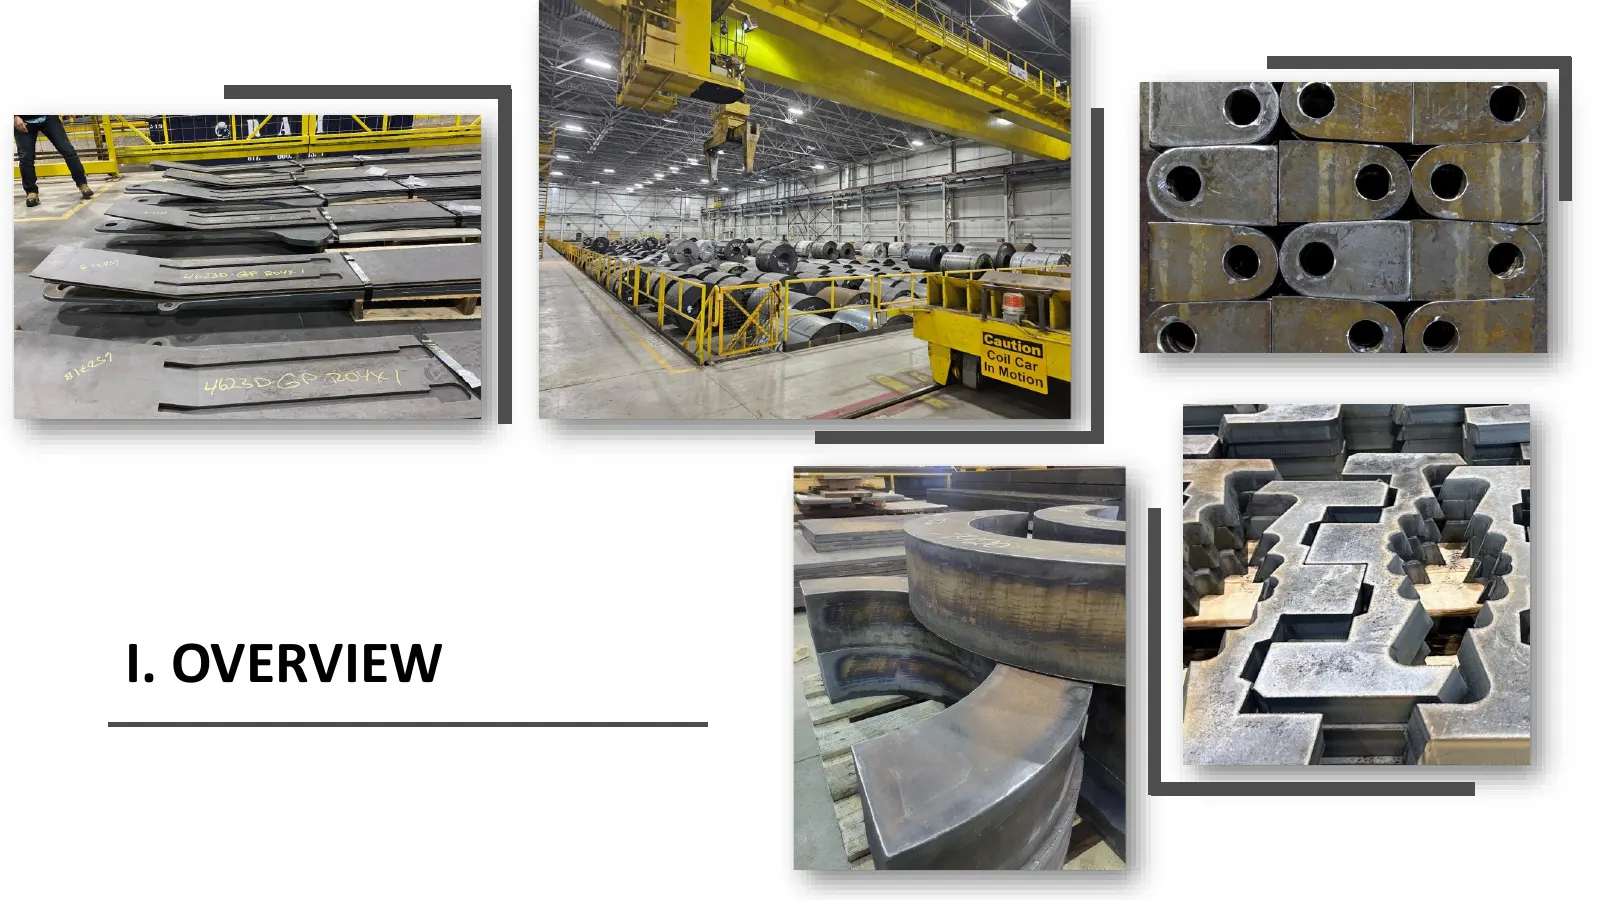
Slide 5: I. Overview
Il. OVERVIEW
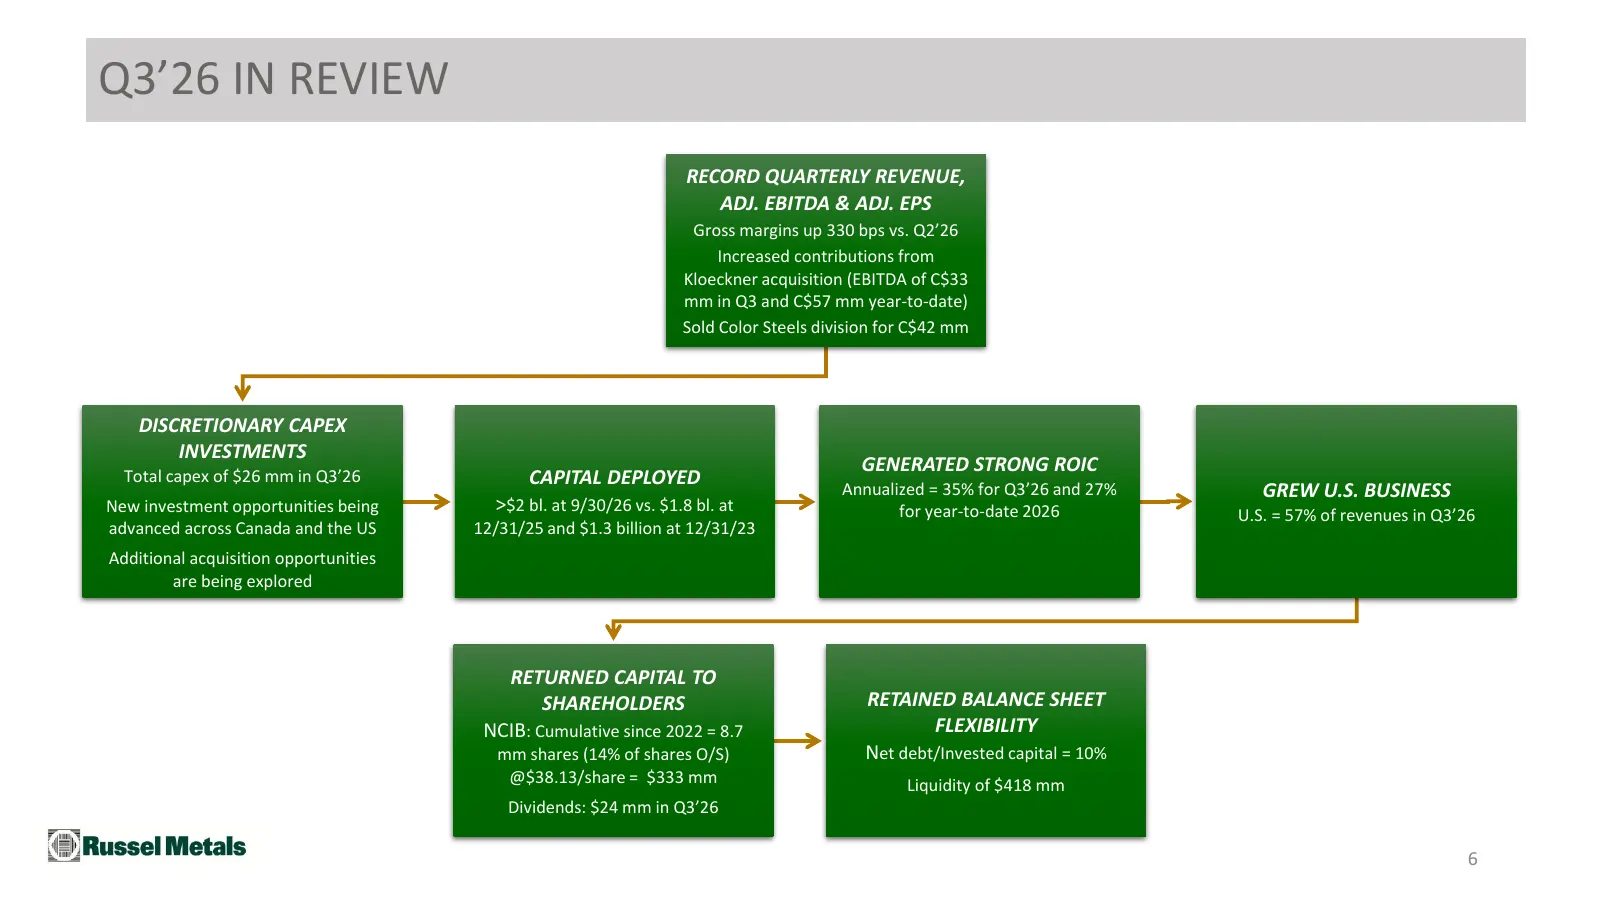
Slide 6: Q3'26 in Review
Q3’26 IN REVIEW RECORD QUARTERLY REVENUE, ADJ. EBITDA & ADJ. EPS Gross margins up 330 bps vs. Q2’26 Increased contributions from Kloeckner acquisition (EBITDA of C$33 mm in Q3 and C$57 mm year-to-date) Sold Color Steels division for C$42 mm DISCRETIONARY CAPEX INVESTMENTS Total capex of $26 mm in Q3
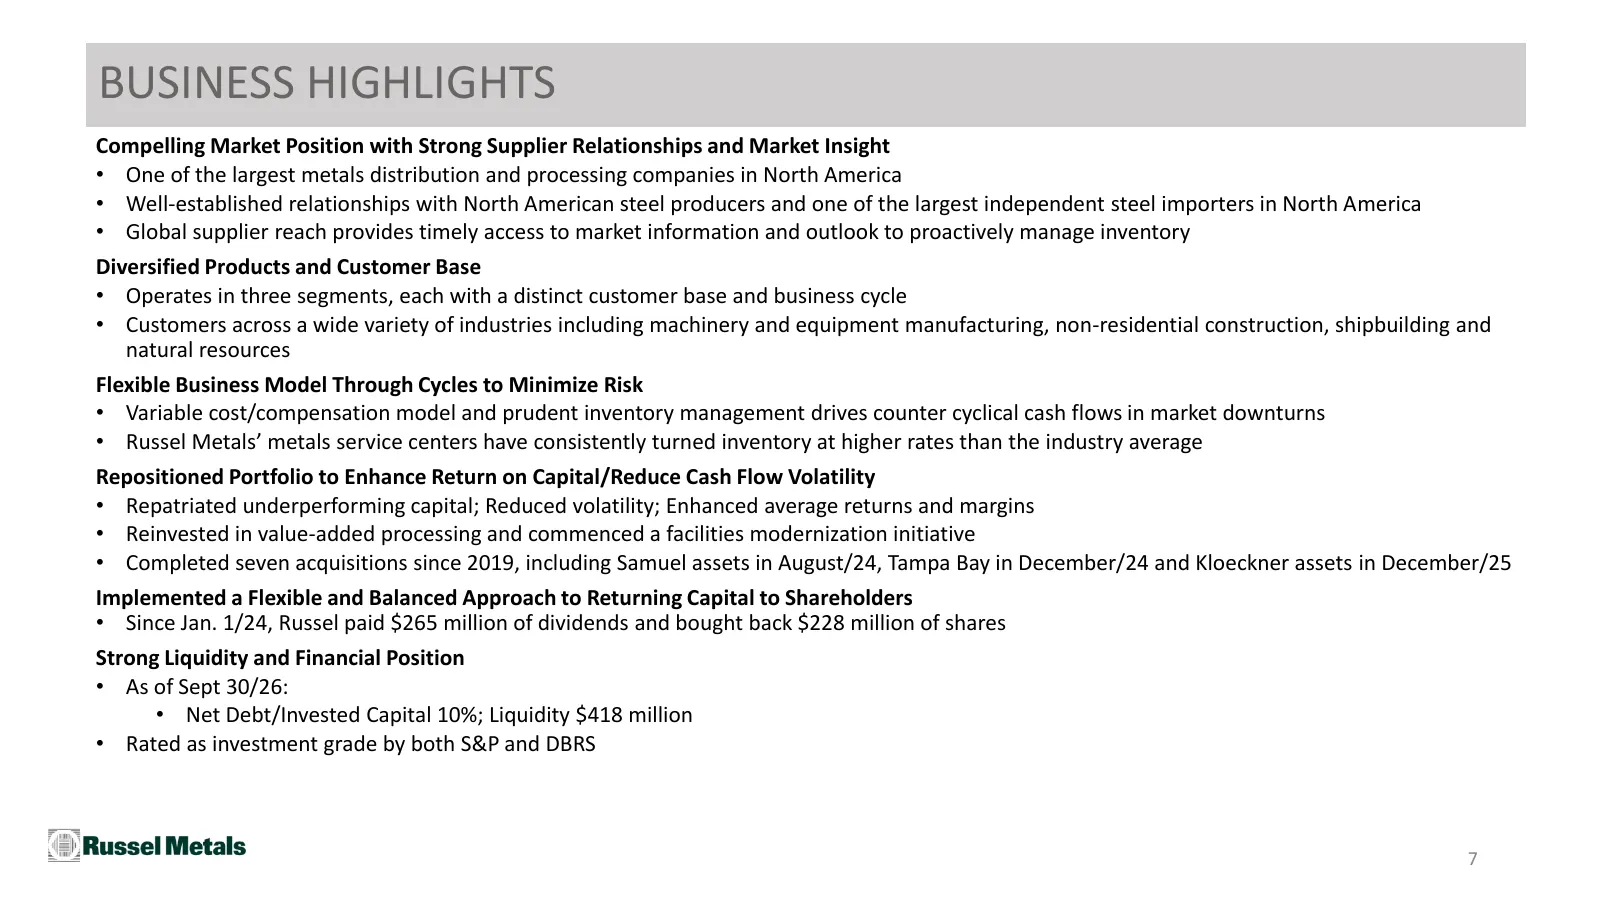
Slide 7: Business Highlights
BUSINESS HIGHLIGHTS Compelling Market Position with Strong Supplier Relationships and Market Insight • One of the largest metals distribution and processing companies in North America • Well-established relationships with North American steel producers and one of the largest independent steel import
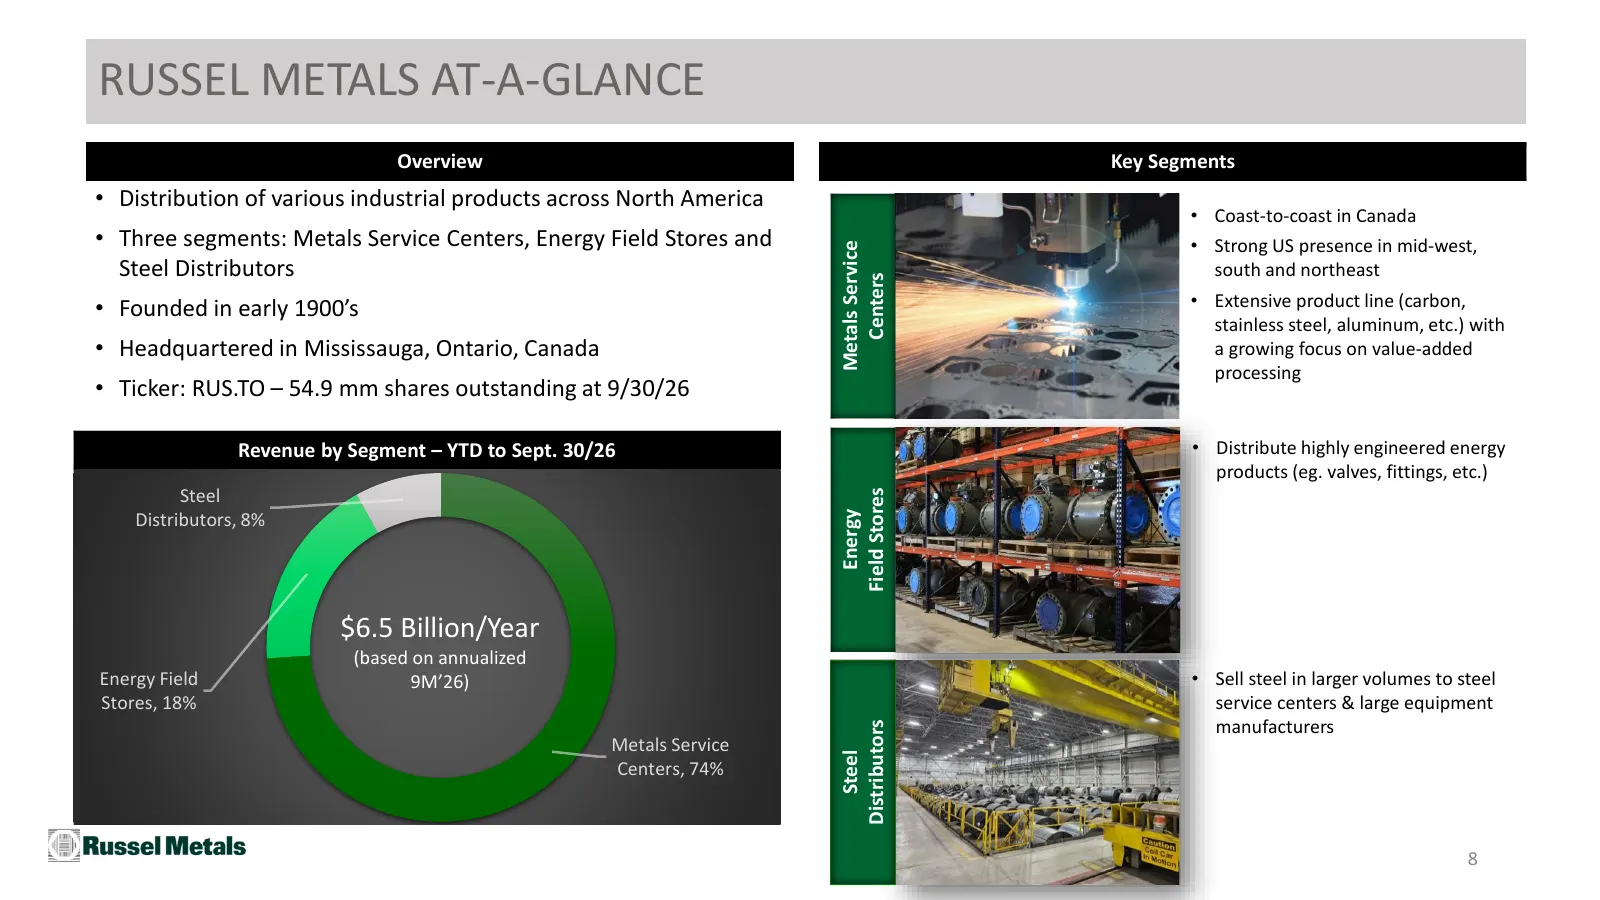
Slide 8: Russel Metals At-a-Glance
RUSSEL METALS AT-A-GLANCE Overview Key Segments • Distribution of various industrial products across North America • Coast-to-coast in Canada • Three segments: Metals Service Centers, Energy Field Stores and • Strong US presence in mid-west, Metals Service Steel Distributors south and northeast Cent
Slide 9: Market Position
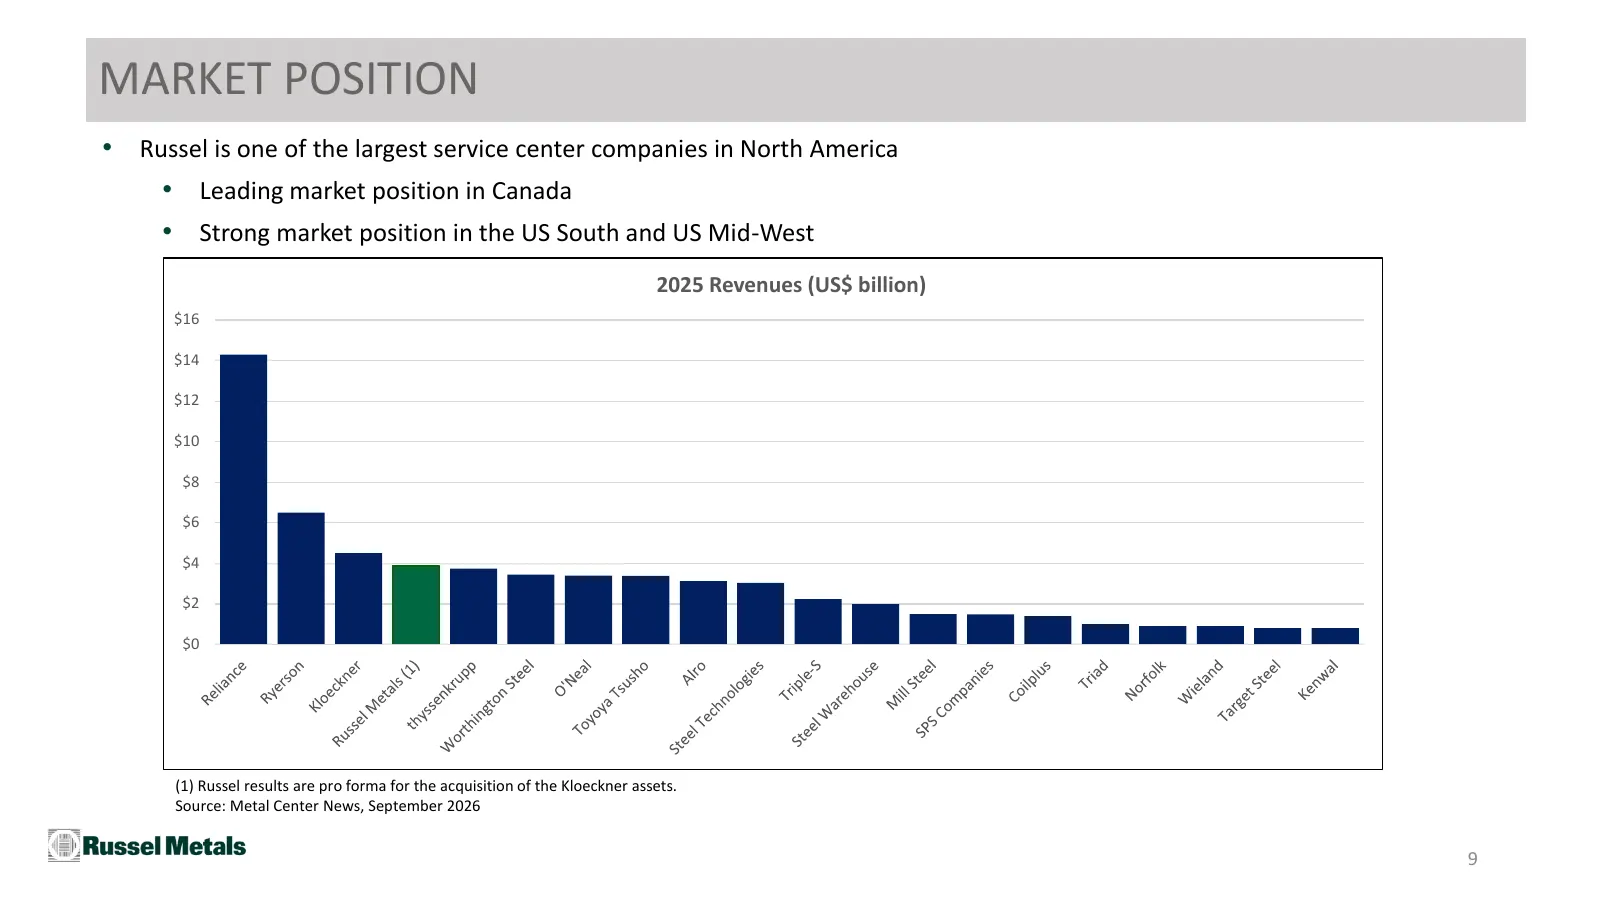
MARKET POSITION • Russel is one of the largest service center companies in North America • Leading market position in Canada • Strong market position in the US South and US Mid-West 2025 Revenues (US$ billion) $16 $14 $12 $10 $8 $6 $4 $2 $0 (1) Russel results are pro forma for the acquisition of the
Slide 10: Diversified Business
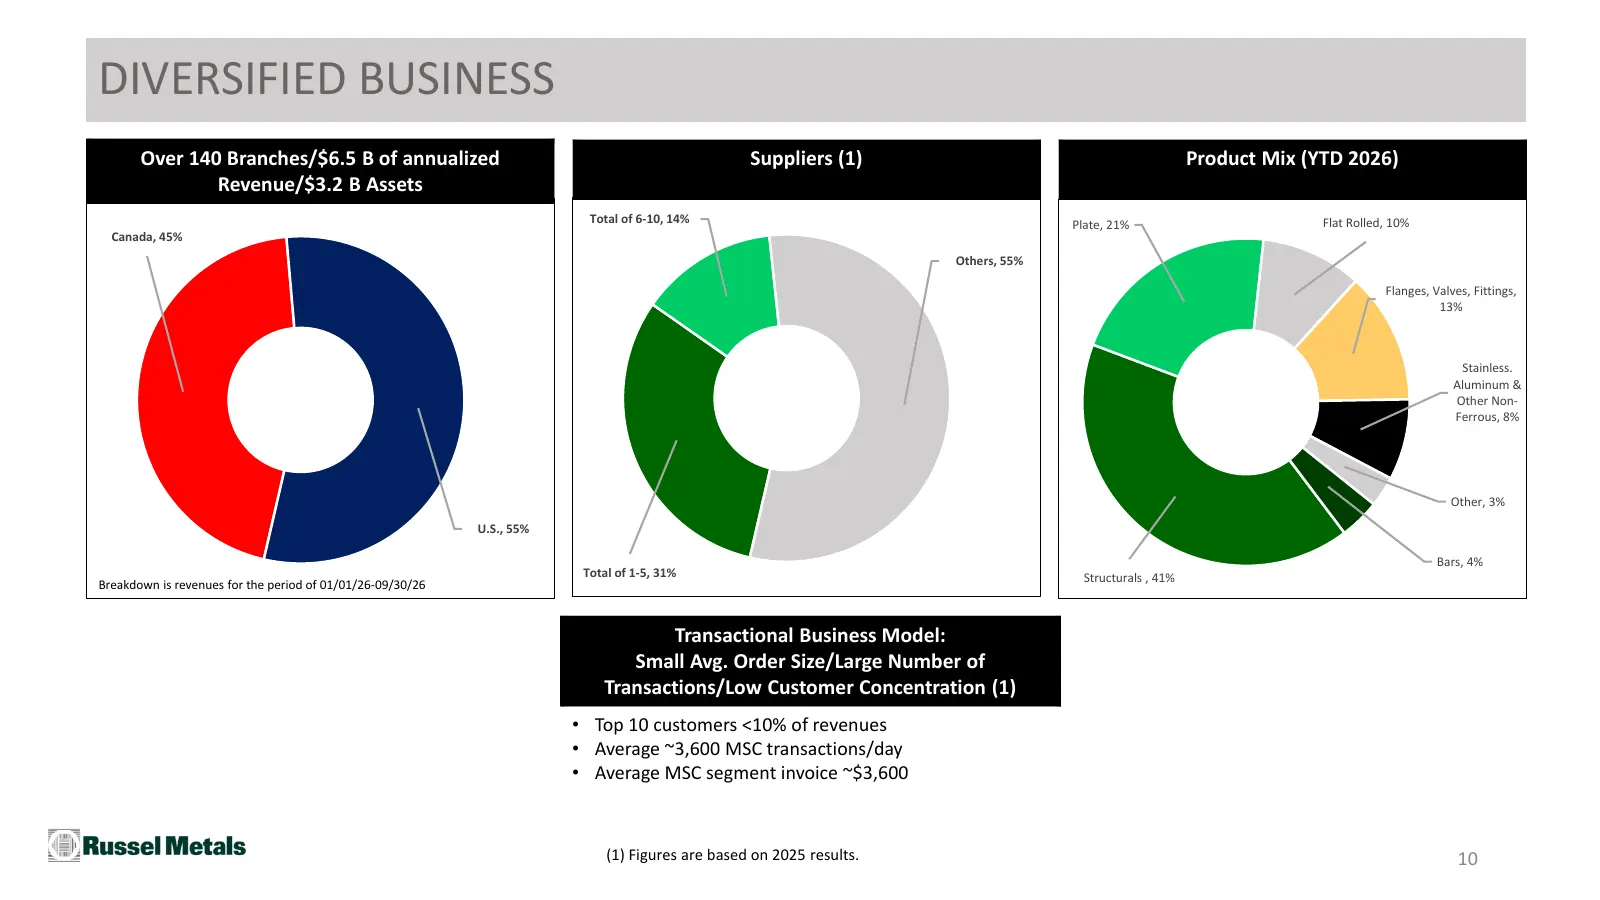
DIVERSIFIED BUSINESS Over 140 Branches/$6.5 B of annualized Suppliers (1) Product Mix (YTD 2026) Revenue/$3.2 B Assets Total of 6-10, 14% Plate, 21% Flat Rolled, 10% Canada, 45% Others, 55% Flanges, Valves, Fittings, 13% Stainless. Aluminum & Other Non- Ferrous, 8% Other, 3% U.S., 55% Bars, 4% Total
Slide 11: Incentive Compensation Tied to Return on Capital
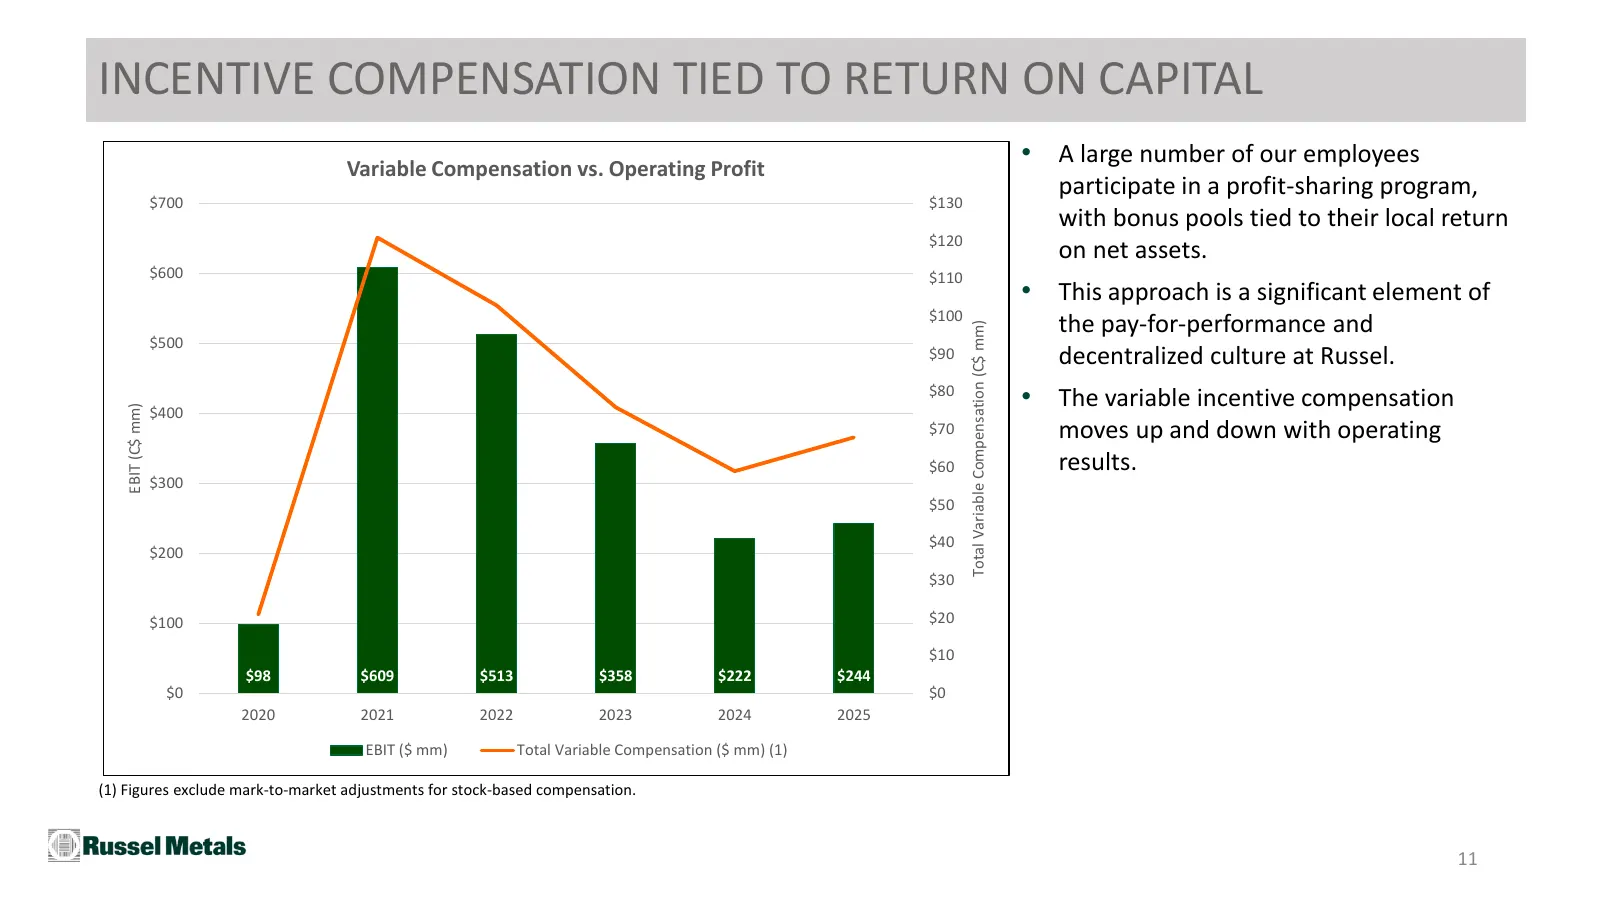
INCENTIVE COMPENSATION TIED TO RETURN ON CAPITAL Variable Compensation vs. Operating Profit • A large number of our employees participate in a profit-sharing program, $700 $130 with bonus pools tied to their local return $120 on net assets. $600 $110 • This approach is a significant element of $100
Slide 12: Business Transformation
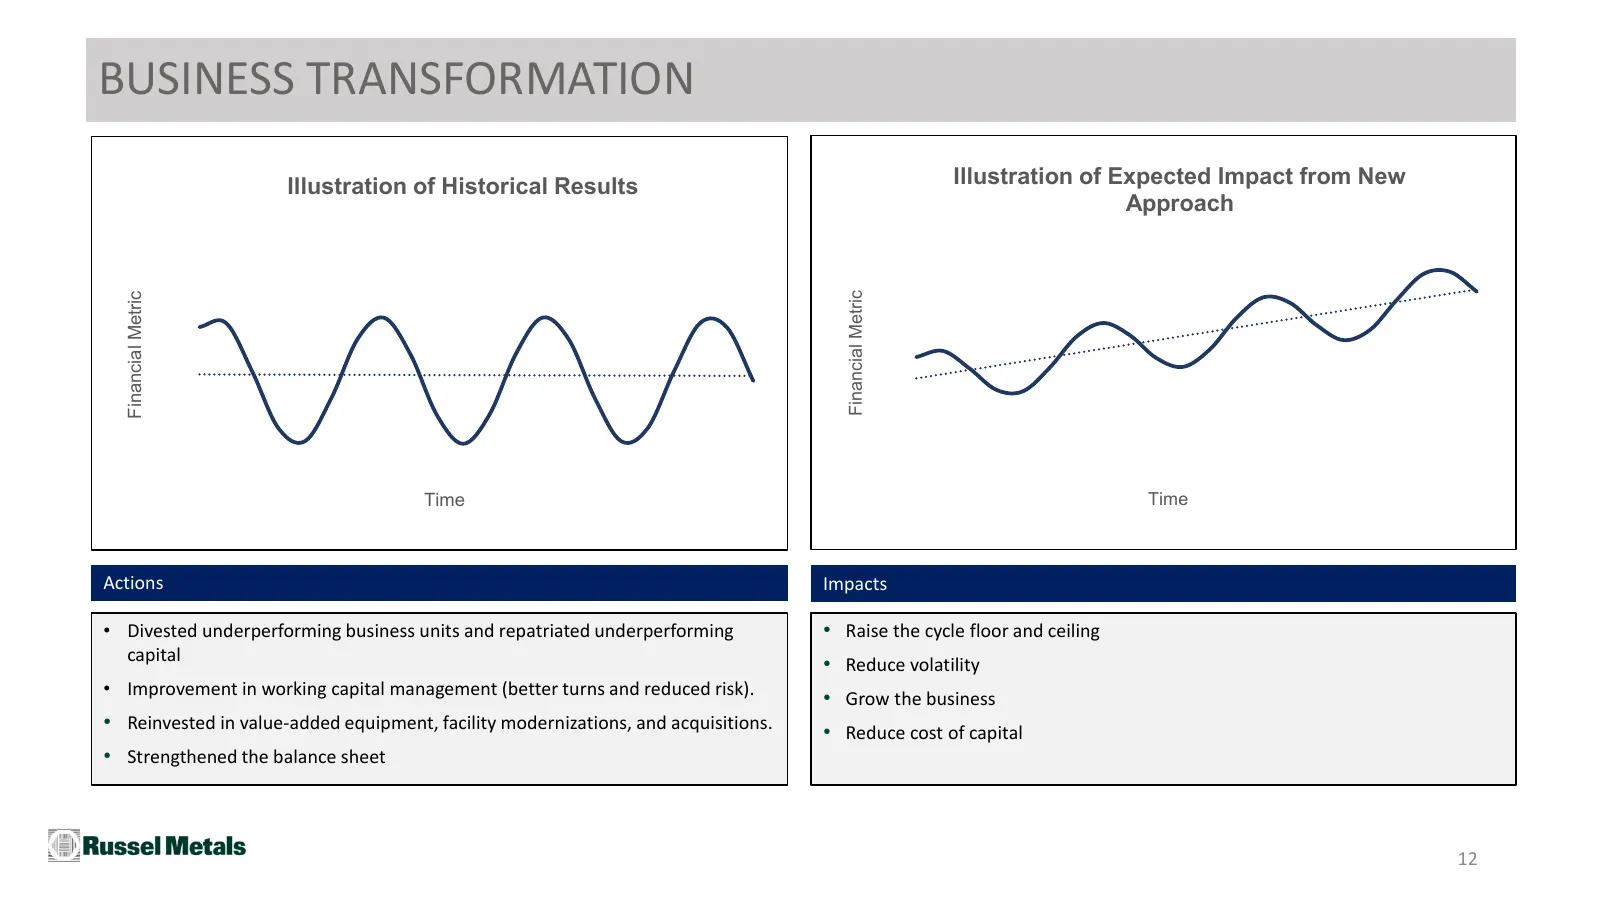
BUSINESS TRANSFORMATION Illustration of Historical Results Illustration of Expected Impact from New Approach Financial Metric Financial Metric Time Time Actions Impacts • Divested underperforming business units and repatriated underperforming • Raise the cycle floor and ceiling capital • Reduce vola
Slide 13: Capital Reallocation Evolution
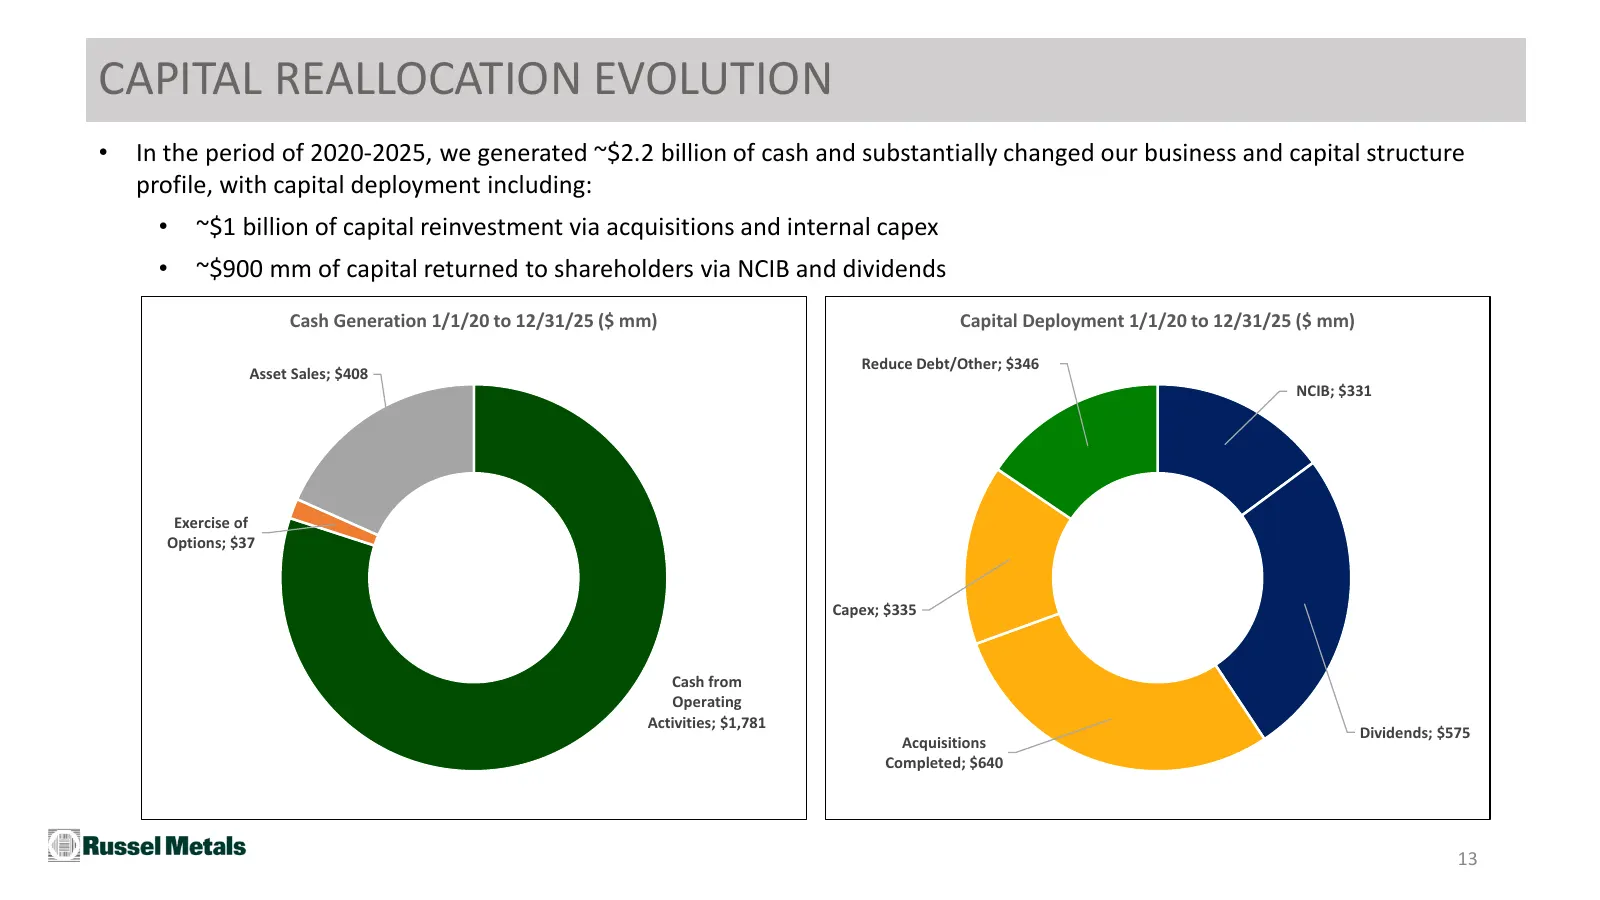
CAPITAL REALLOCATION EVOLUTION • In the period of 2020-2025, we generated ~$2.2 billion of cash and substantially changed our business and capital structure profile, with capital deployment including: • ~$1 billion of capital reinvestment via acquisitions and internal capex • ~$900 mm of capital ret
Slide 14: EBITDA Trends
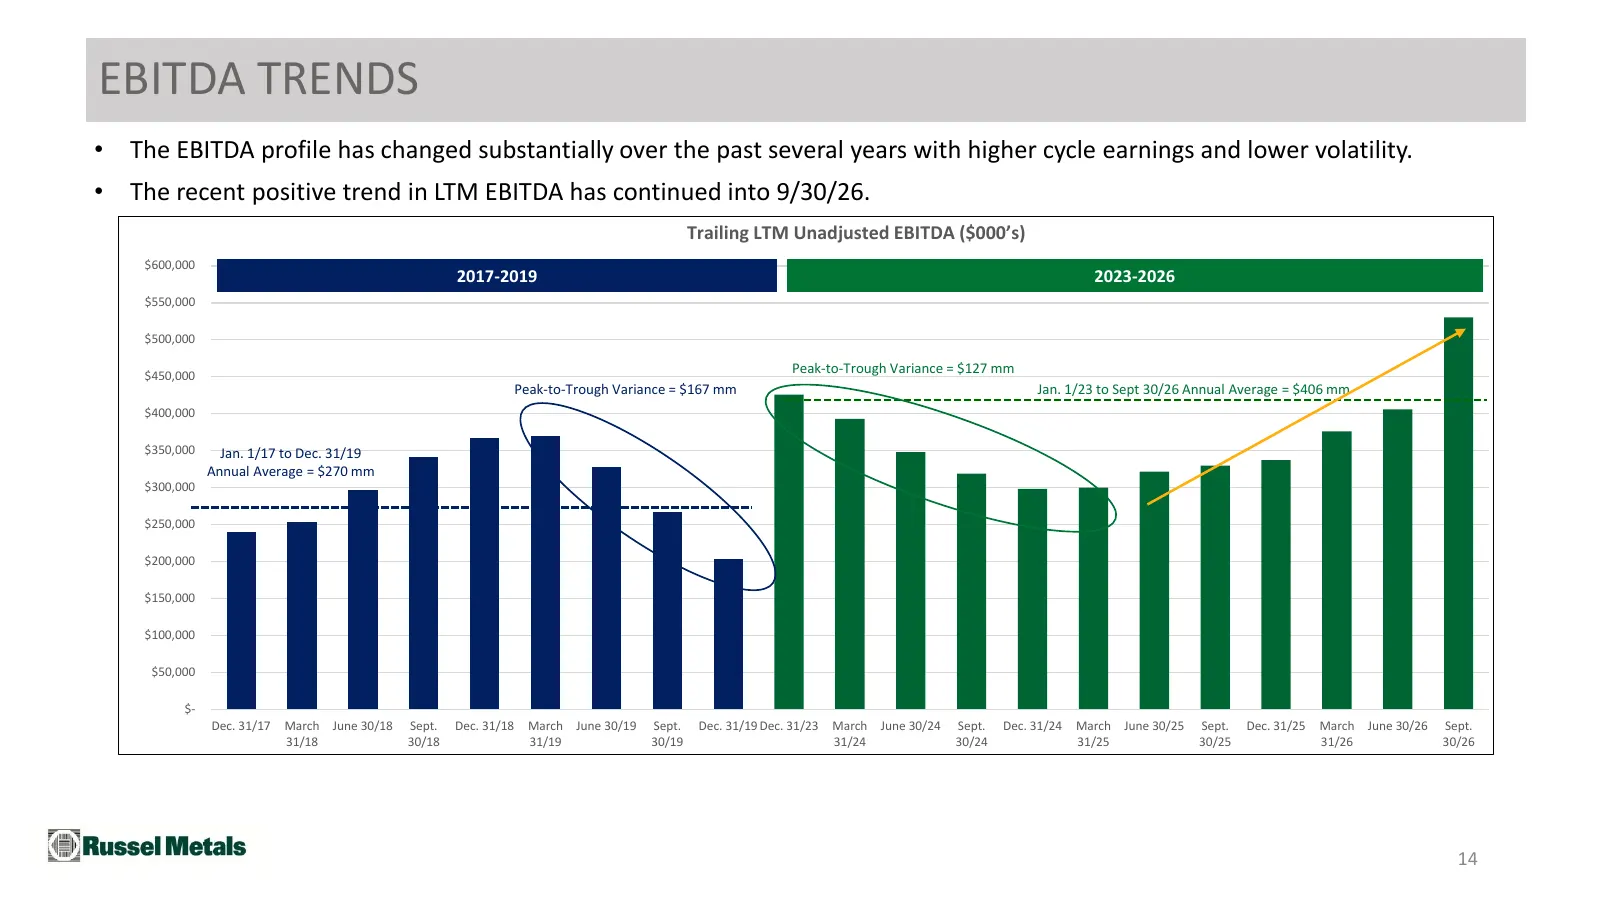
EBITDA TRENDS • The EBITDA profile has changed substantially over the past several years with higher cycle earnings and lower volatility. • The recent positive trend in LTM EBITDA has continued into 9/30/26. Trailing LTM Unadjusted EBITDA ($000’s) $600,000 2017-2019 2023-2026 $550,000 $500,000 $450,
Slide 15: ESG Focus
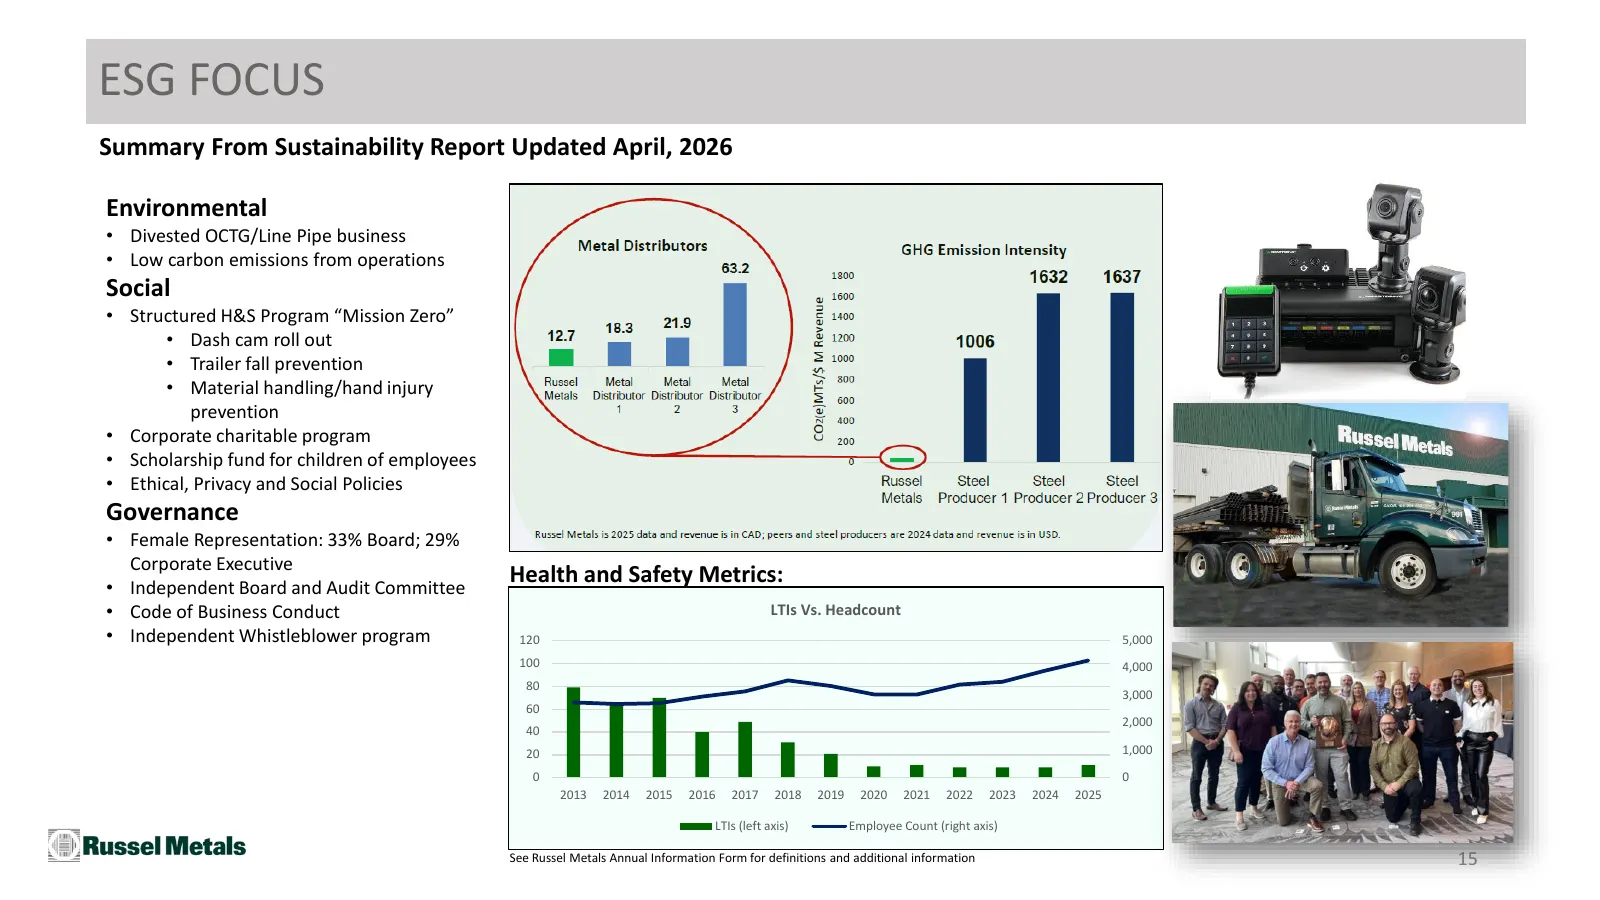
ESG FOCUS Summary From Sustainability Report Updated April, 2026 Environmental • Divested OCTG/Line Pipe business • Low carbon emissions from operations Social • Structured H&S Program “Mission Zero” • Dash cam roll out • Trailer fall prevention • Material handling/hand injury prevention • Corporate
Slide 16: II. Market Trends
II. MARKET TRENDS
Slide 17: Revenue Volatility vs. Indexes
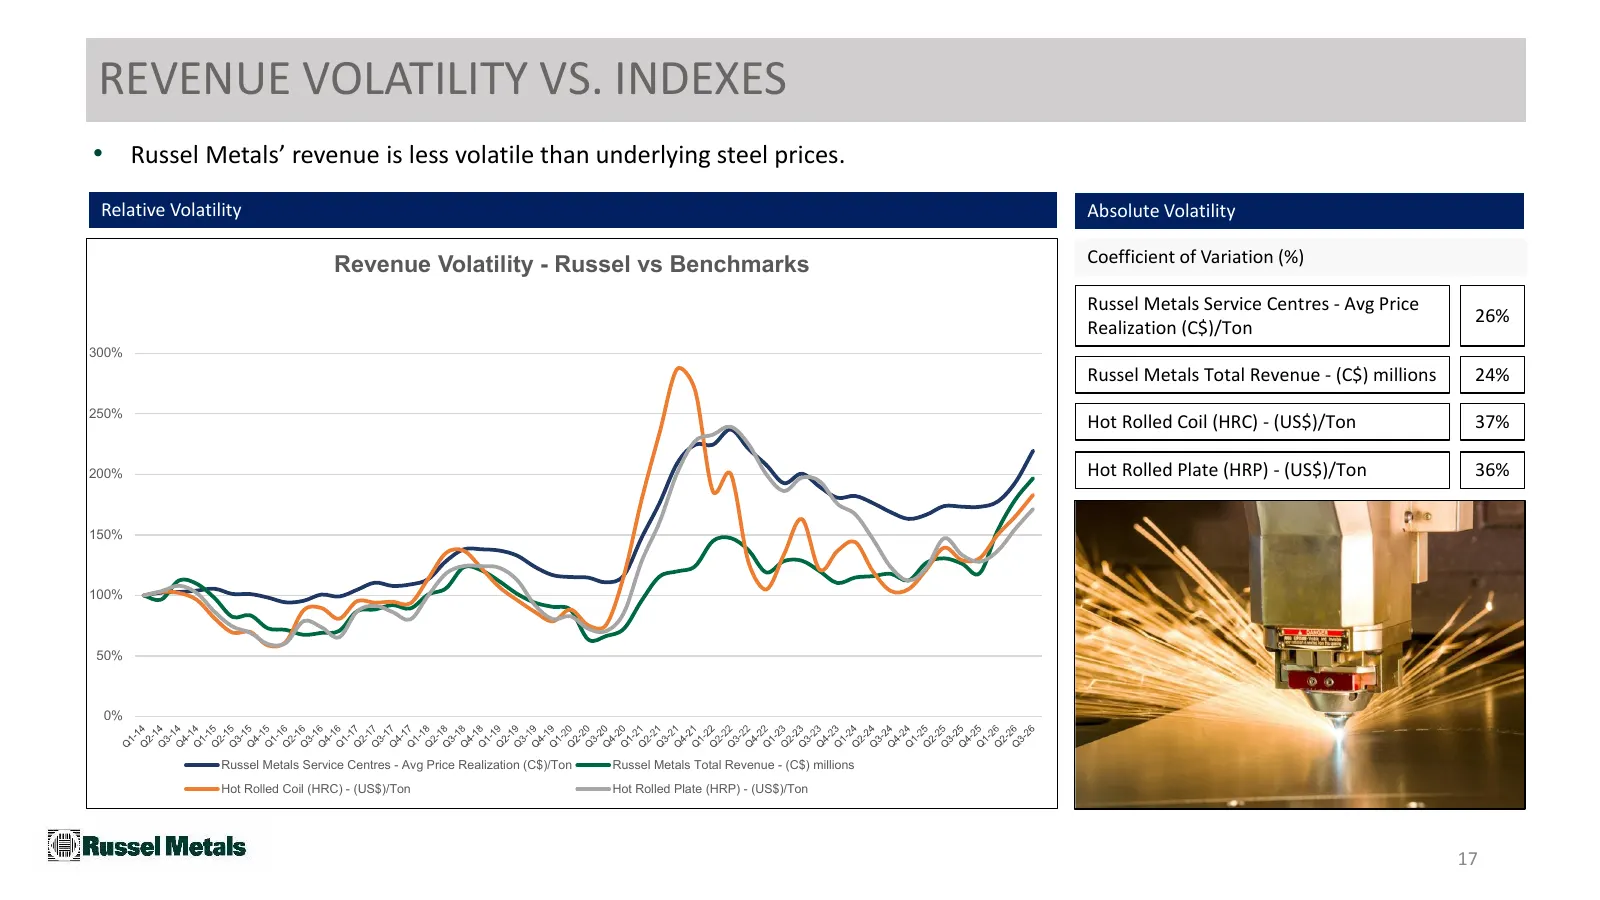
REVENUE VOLATILITY VS. INDEXES • Russel Metals’ revenue is less volatile than underlying steel prices. Relative Volatility Absolute Volatility Revenue Volatility - Russel vs Benchmarks Coefficient of Variation (%) Russel Metals Service Centres - Avg Price 26% Realization (C$)/Ton 300% Russel Metals
Slide 18: Business Conditions: Metal Pricing Trends
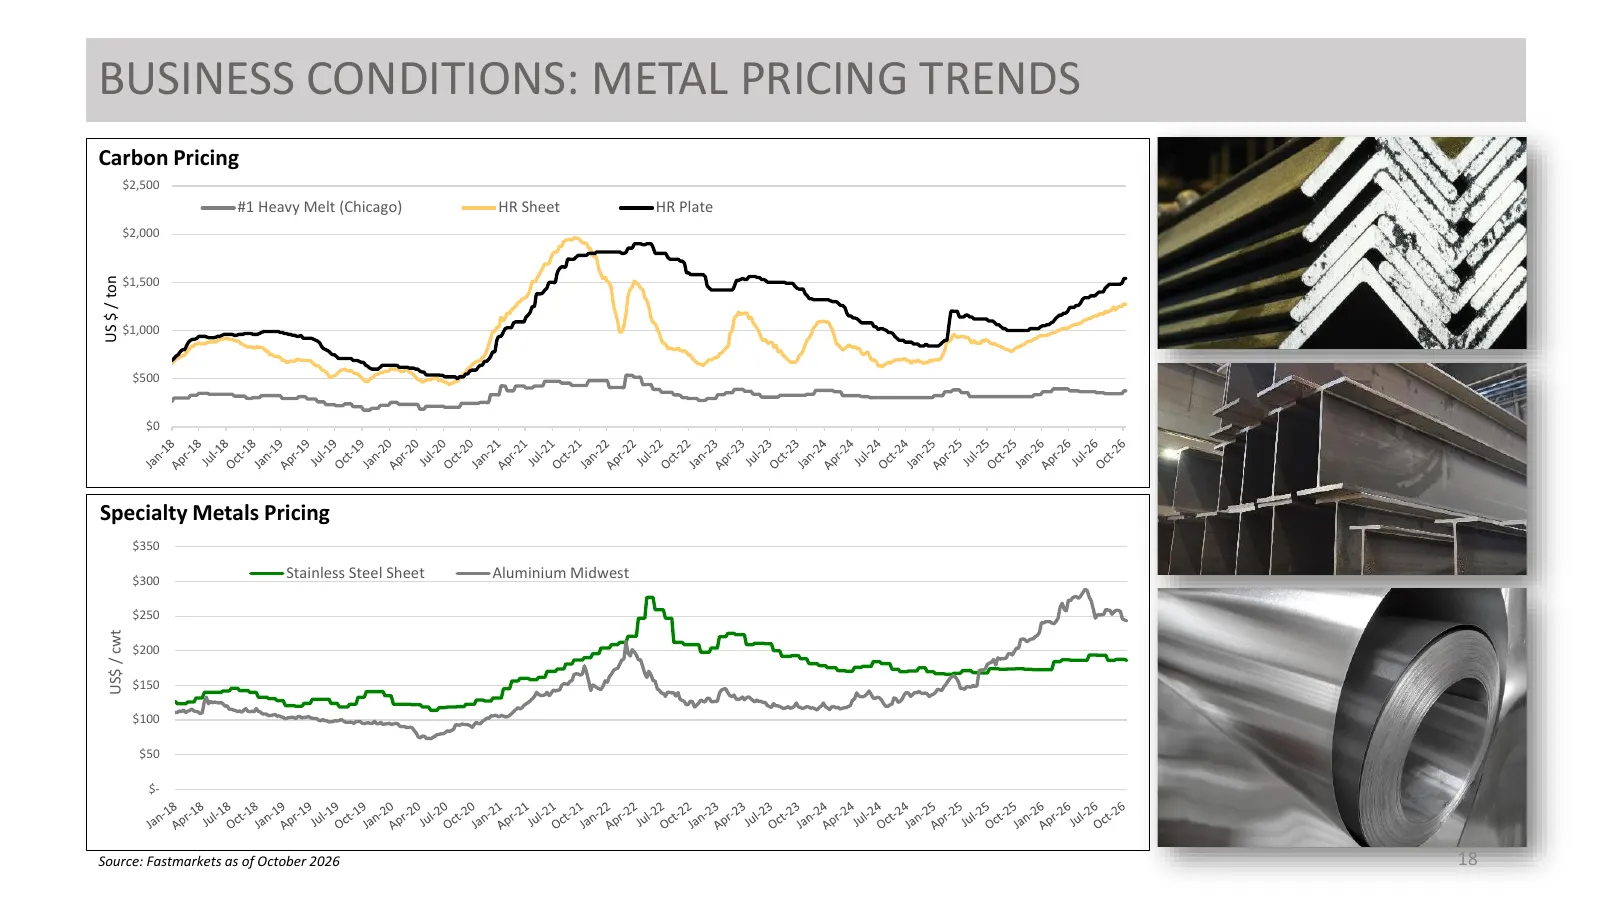
BUSINESS CONDITIONS: METAL PRICING TRENDS Carbon Pricing $2,500 #1 Heavy Melt (Chicago) HR Sheet HR Plate $2,000 US $ / ton $1,500 $1,000 $500 $0 Specialty Metals Pricing $350 $300 Stainless Steel Sheet Aluminium Midwest $250 US$ / cwt $200 $150 $100 $50 $- Source: Fastmarkets as of October 2026 18
Slide 19: Business Conditions: Supply Chain Dynamics
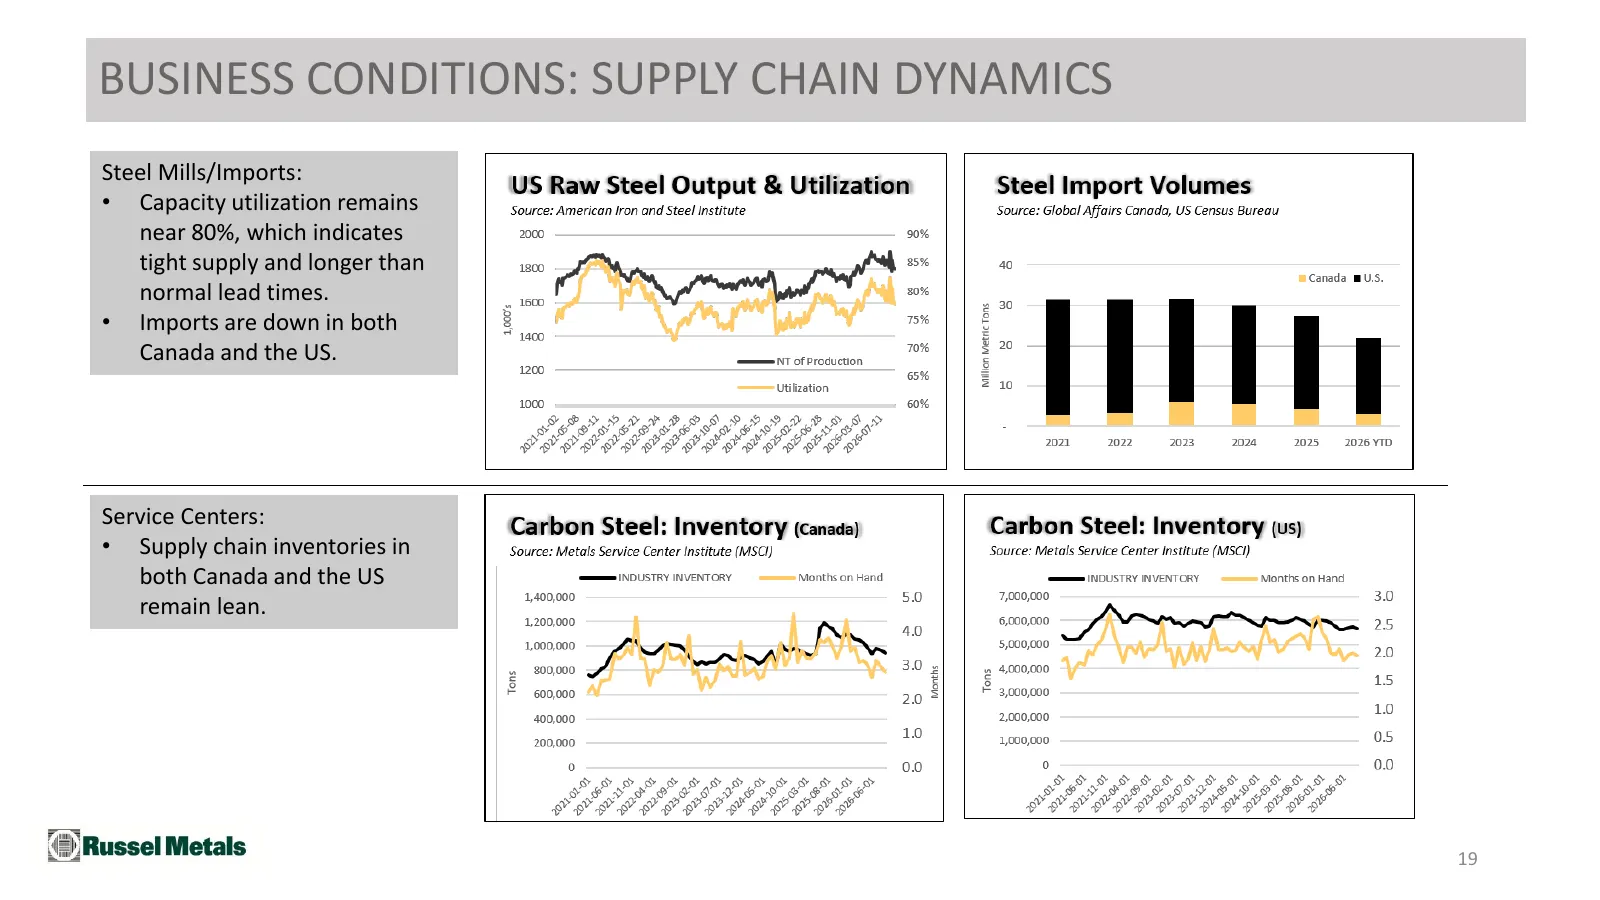
BUSINESS CONDITIONS: SUPPLY CHAIN DYNAMICS Steel Mills/Imports: • Capacity utilization remains near 80%, which indicates tight supply and longer than normal lead times. • Imports are down in both Canada and the US. Service Centers: • Supply chain inventories in both Canada and the US remain lean. 19
Slide 20: III. Capital Allocation Priorities
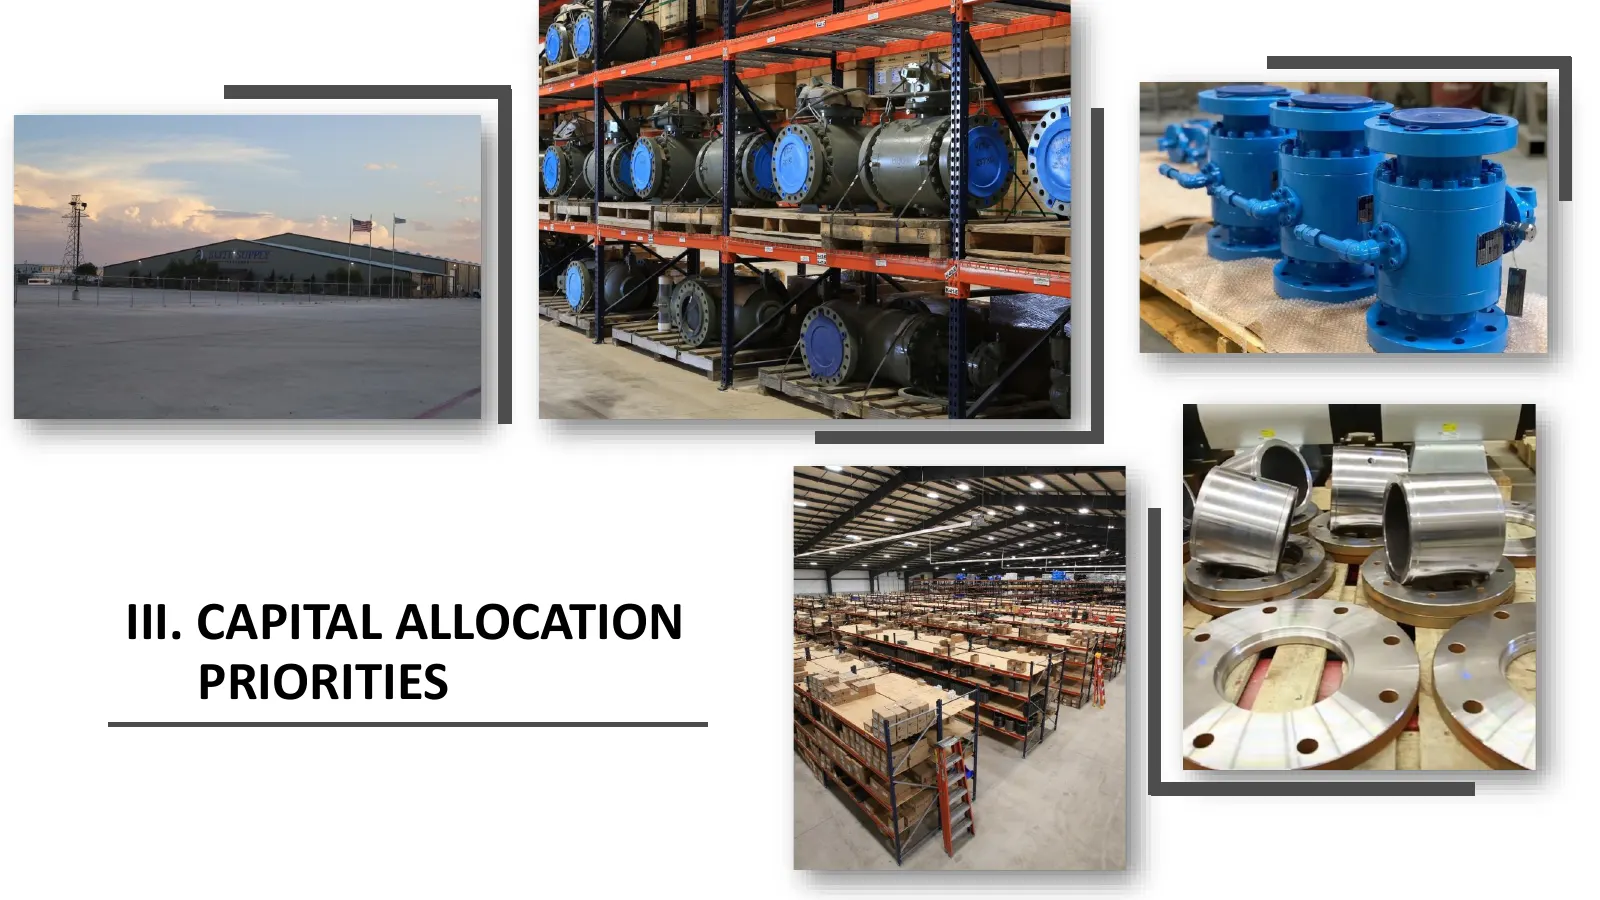
III. CAPITAL ALLOCATION PRIORITIES
Slide 21: Capital Allocation Priorities
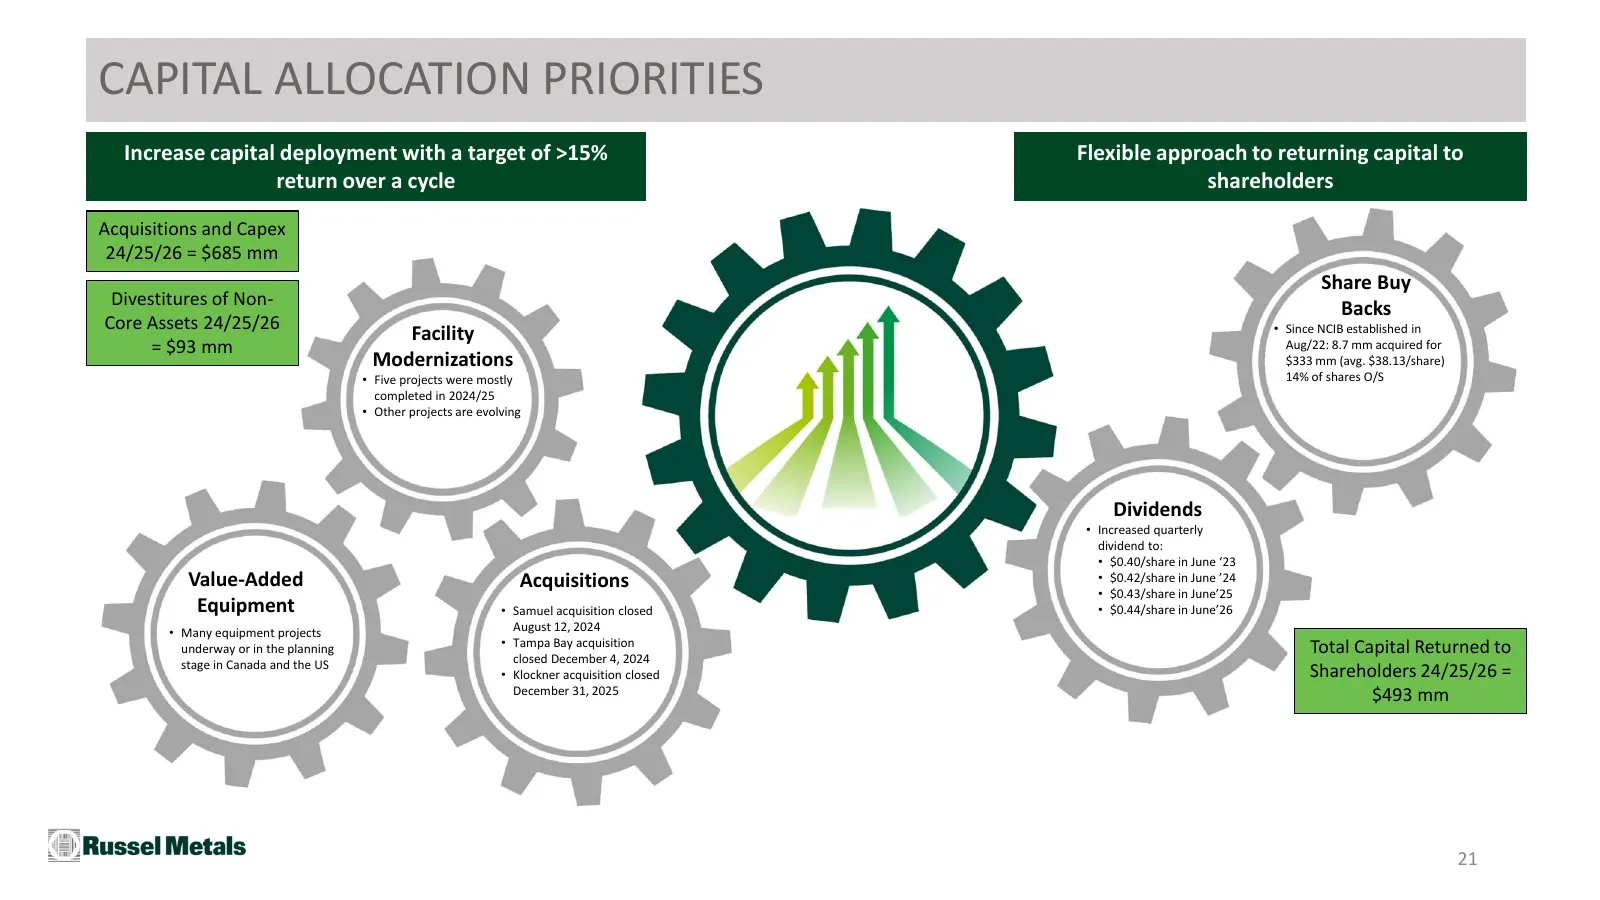
CAPITAL ALLOCATION PRIORITIES Increase capital deployment with a target of >15% Flexible approach to returning capital to return over a cycle shareholders Acquisitions and Capex 24/25/26 = $685 mm Share Buy Divestitures of Non- Backs Core Assets 24/25/26 • Since NCIB established in Facility = $93 mm
Slide 22: Dividend and Share Buy Back Summary
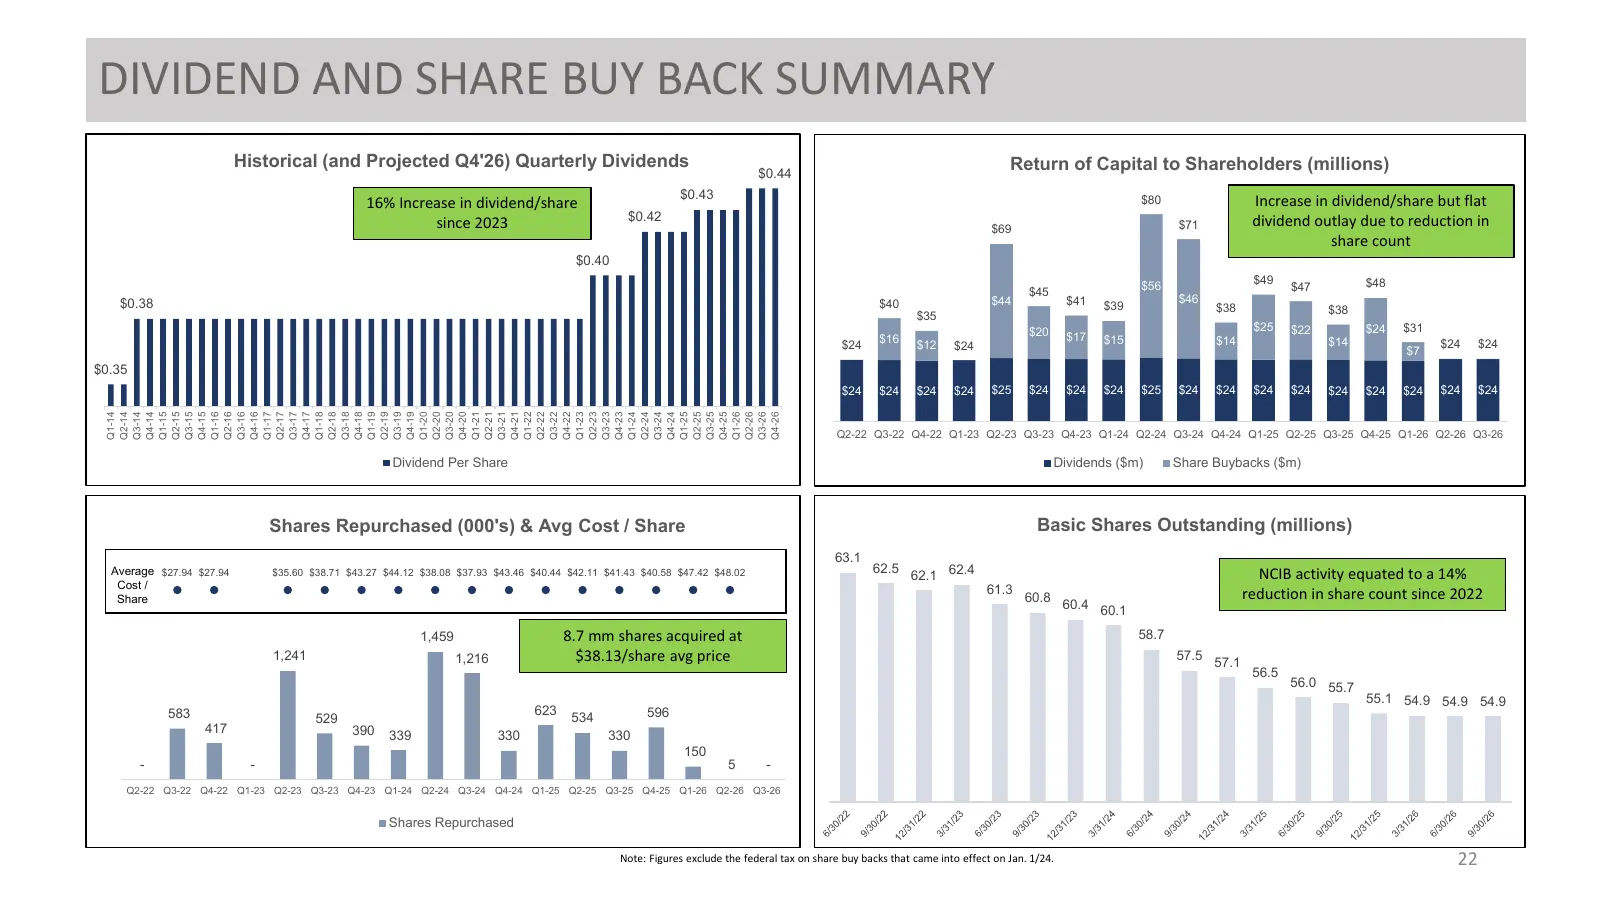
DIVIDEND AND SHARE BUY BACK SUMMARY Historical (and Projected Q4'26) Quarterly Dividends Return of Capital to Shareholders (millions) $0.44 $0.43 $80 Increase in dividend/share but flat 16% Increase in dividend/share $0.42 dividend outlay due to reduction in since 2023 $69 $71 share count $0.40 $49
Slide 23: Capex Program
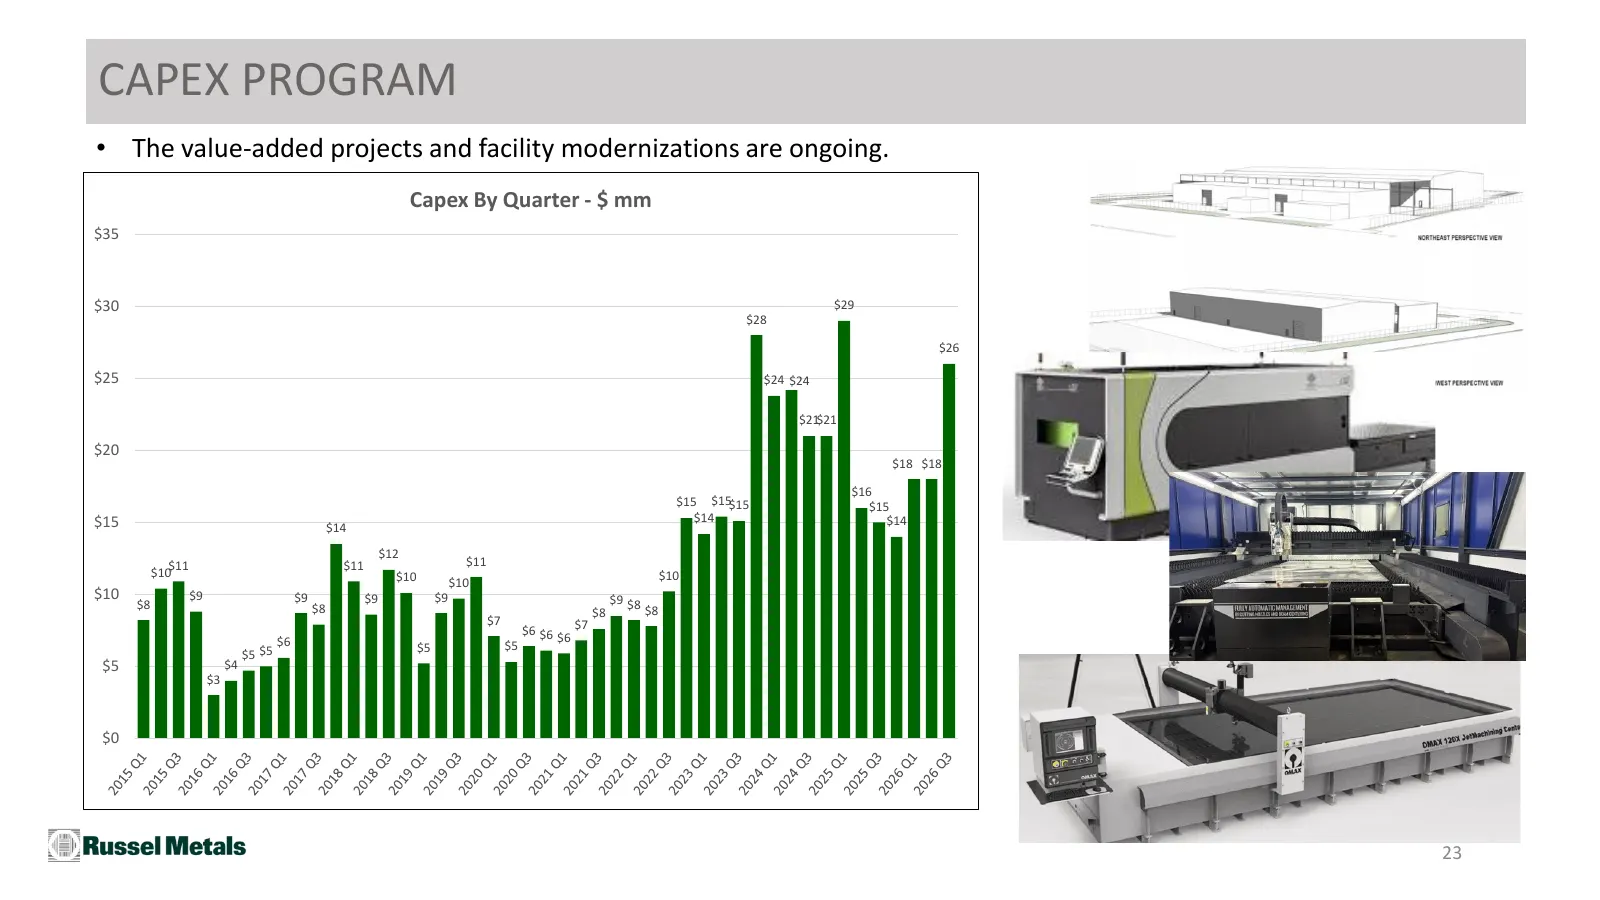
CAPEX PROGRAM • The value-added projects and facility modernizations are ongoing. Capex By Quarter - $ mm $35 $30 $29 $28 $26 $25 $24 $24 $21$21 $20 $18 $18 $16 $15 $15$15 $15 $15 $14 $14 $14 $12 $11 $11 $11 $10 $10 $10 $10 $10 $9 $9 $9 $9 $9 $8 $8 $8 $8 $8 $7 $7 $6 $6 $6 $6 $5 $5 $5 $5 $5 $4 $3 $0
Slide 24: Growth via Acquisitions: Today vs. 2024
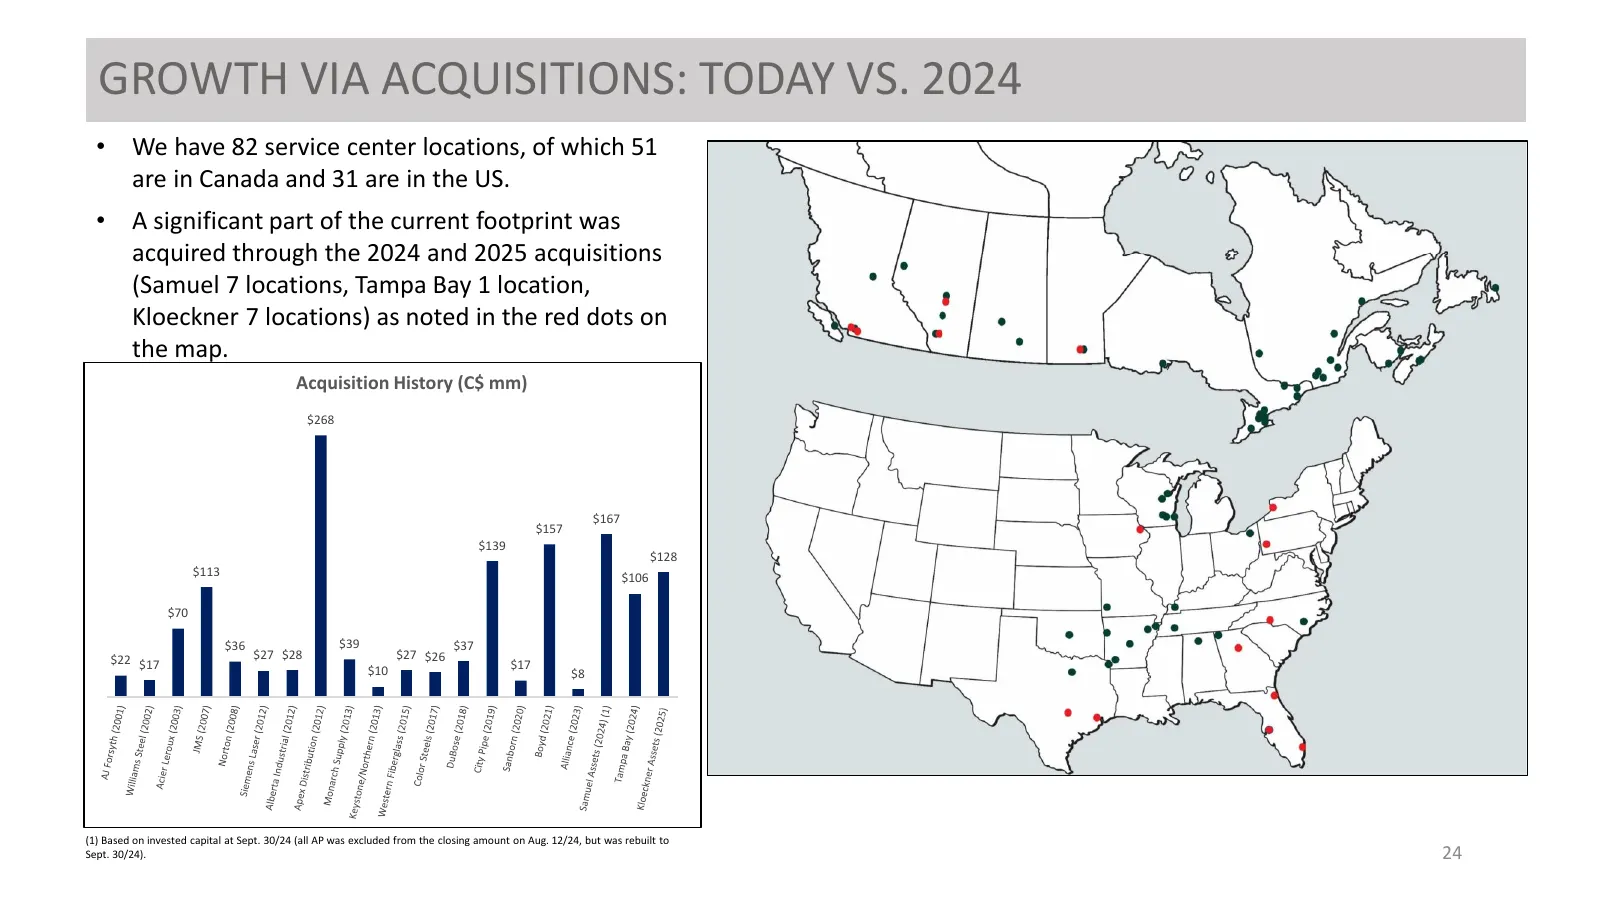
GROWTH VIA ACQUISITIONS: TODAY VS. 2024 • We have 82 service center locations, of which 51 are in Canada and 31 are in the US. • A significant part of the current footprint was acquired through the 2024 and 2025 acquisitions (Samuel 7 locations, Tampa Bay 1 location, Kloeckner 7 locations) as noted
Slide 25: IV. Financial Overview
IV. FINANCIAL OVERVIEW
Slide 26: Annual and Quarterly Results
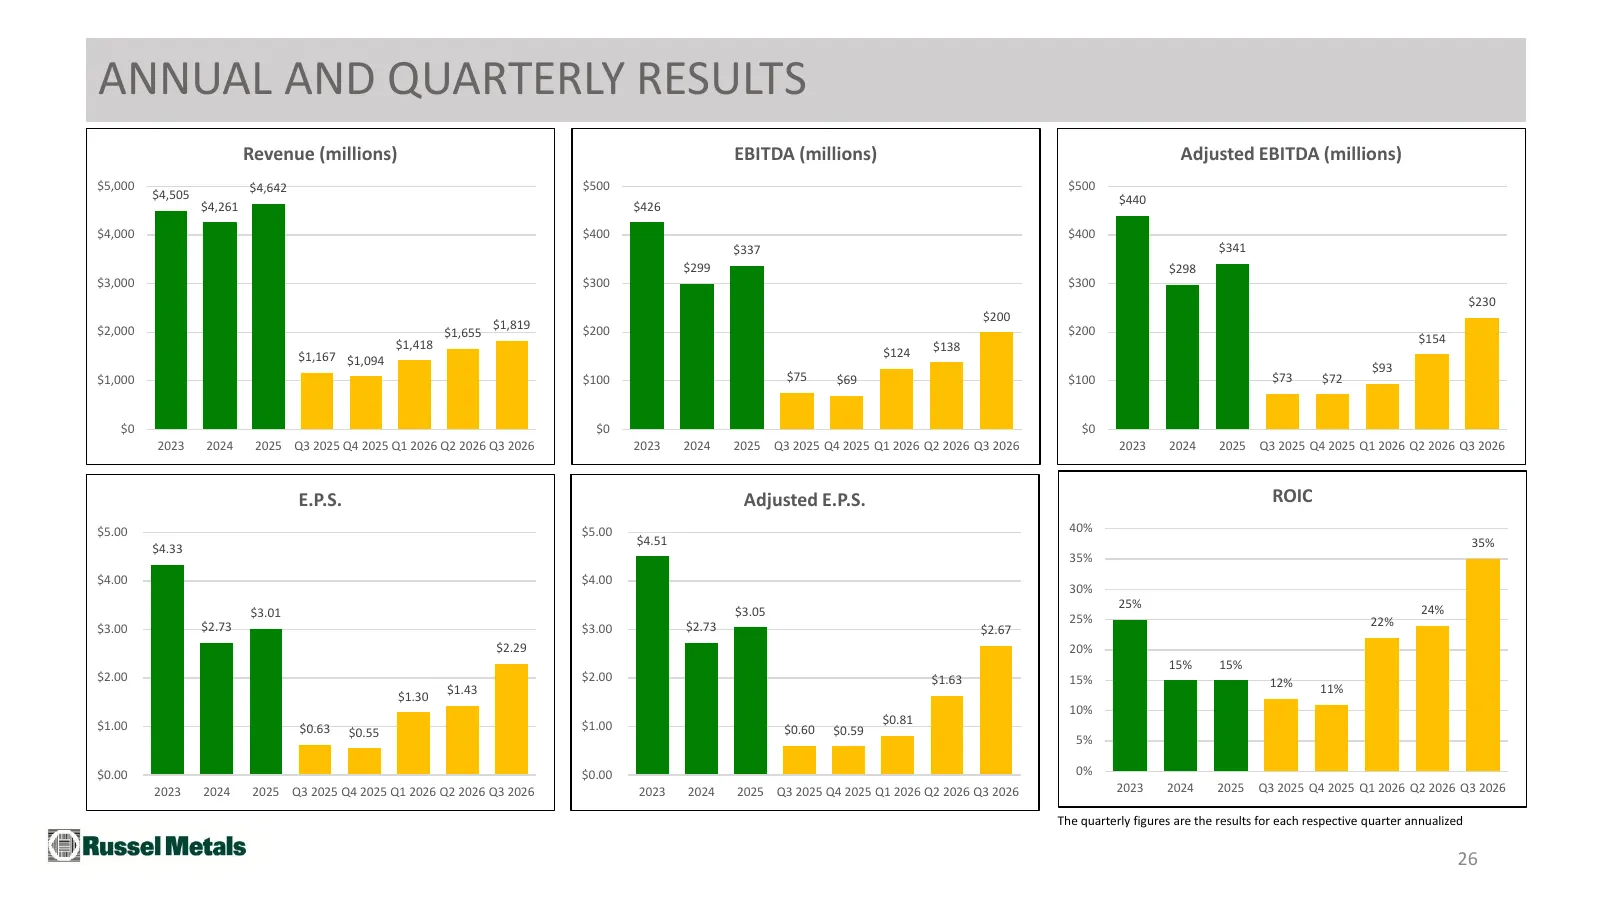
ANNUAL AND QUARTERLY RESULTS Revenue (millions) EBITDA (millions) Adjusted EBITDA (millions) $5,000 $4,642 $500 $500 $4,505 $440 $4,261 $426 $4,000 $400 $400 $337 $341 $299 $298 $3,000 $300 $300 $230 $200 $2,000 $1,819 $200 $200 $1,655 $154 $1,418 $138 $1,167 $1,094 $124 $93 $1,000 $100 $75 $69 $100
Slide 27: Financial Results
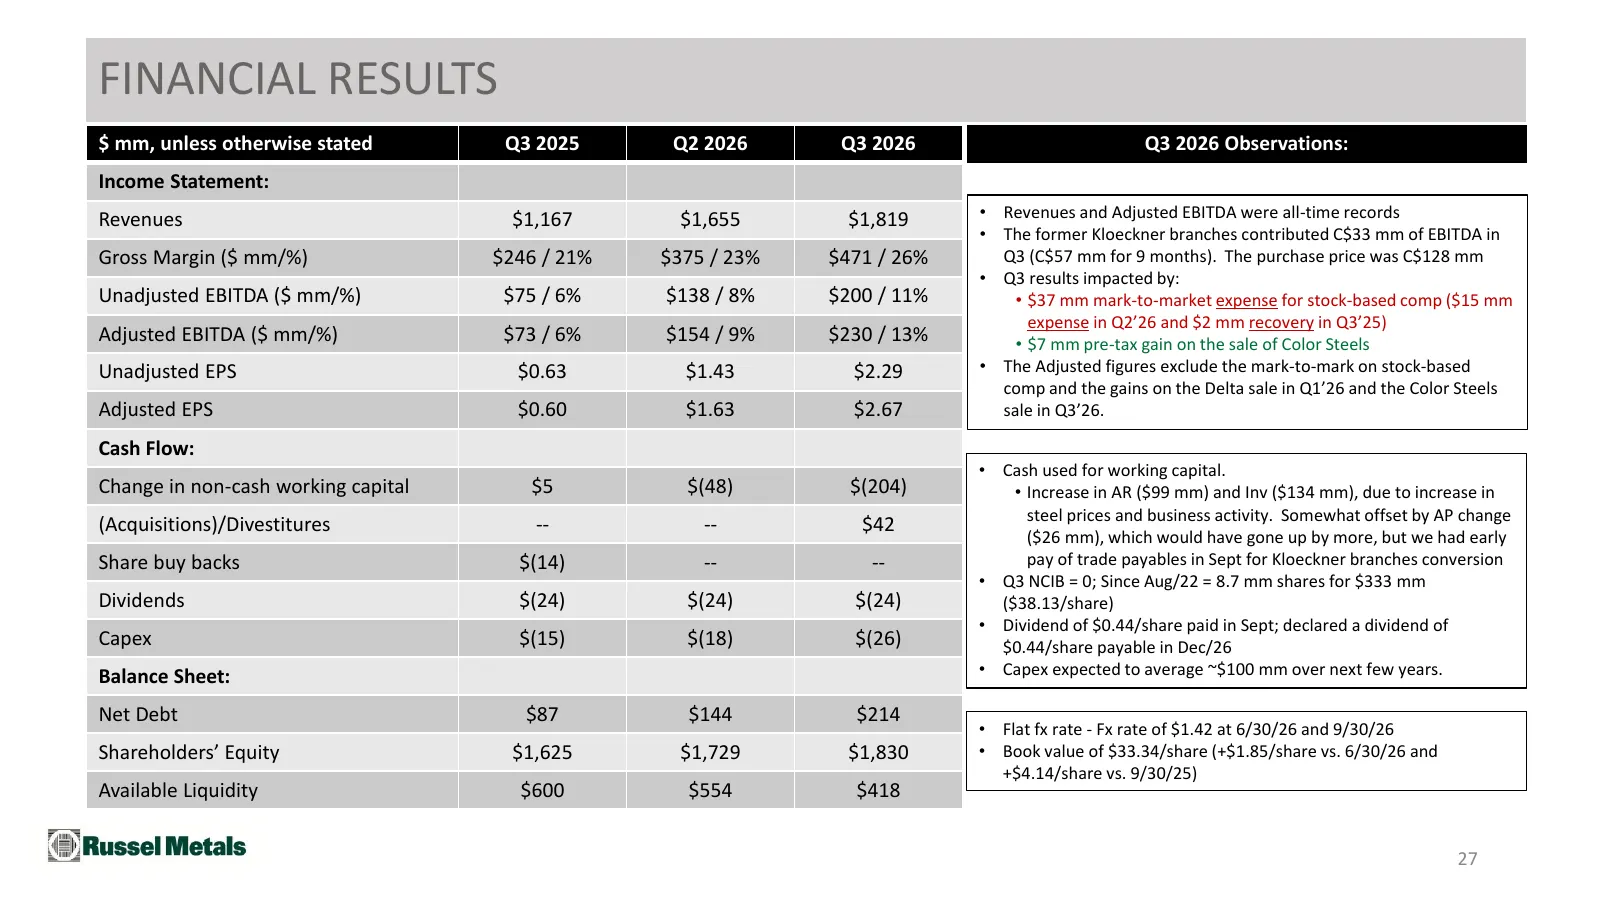
FINANCIAL RESULTS $ mm, unless otherwise stated Q3 2025 Q2 2026 Q3 2026 Q3 2026 Observations: Income Statement: Revenues $1,167 $1,655 $1,819 • Revenues and Adjusted EBITDA were all-time records • The former Kloeckner branches contributed C$33 mm of EBITDA in Gross Margin ($ mm/%) $246 / 21% $375 /
Slide 28: Comparison of Quarterly Results
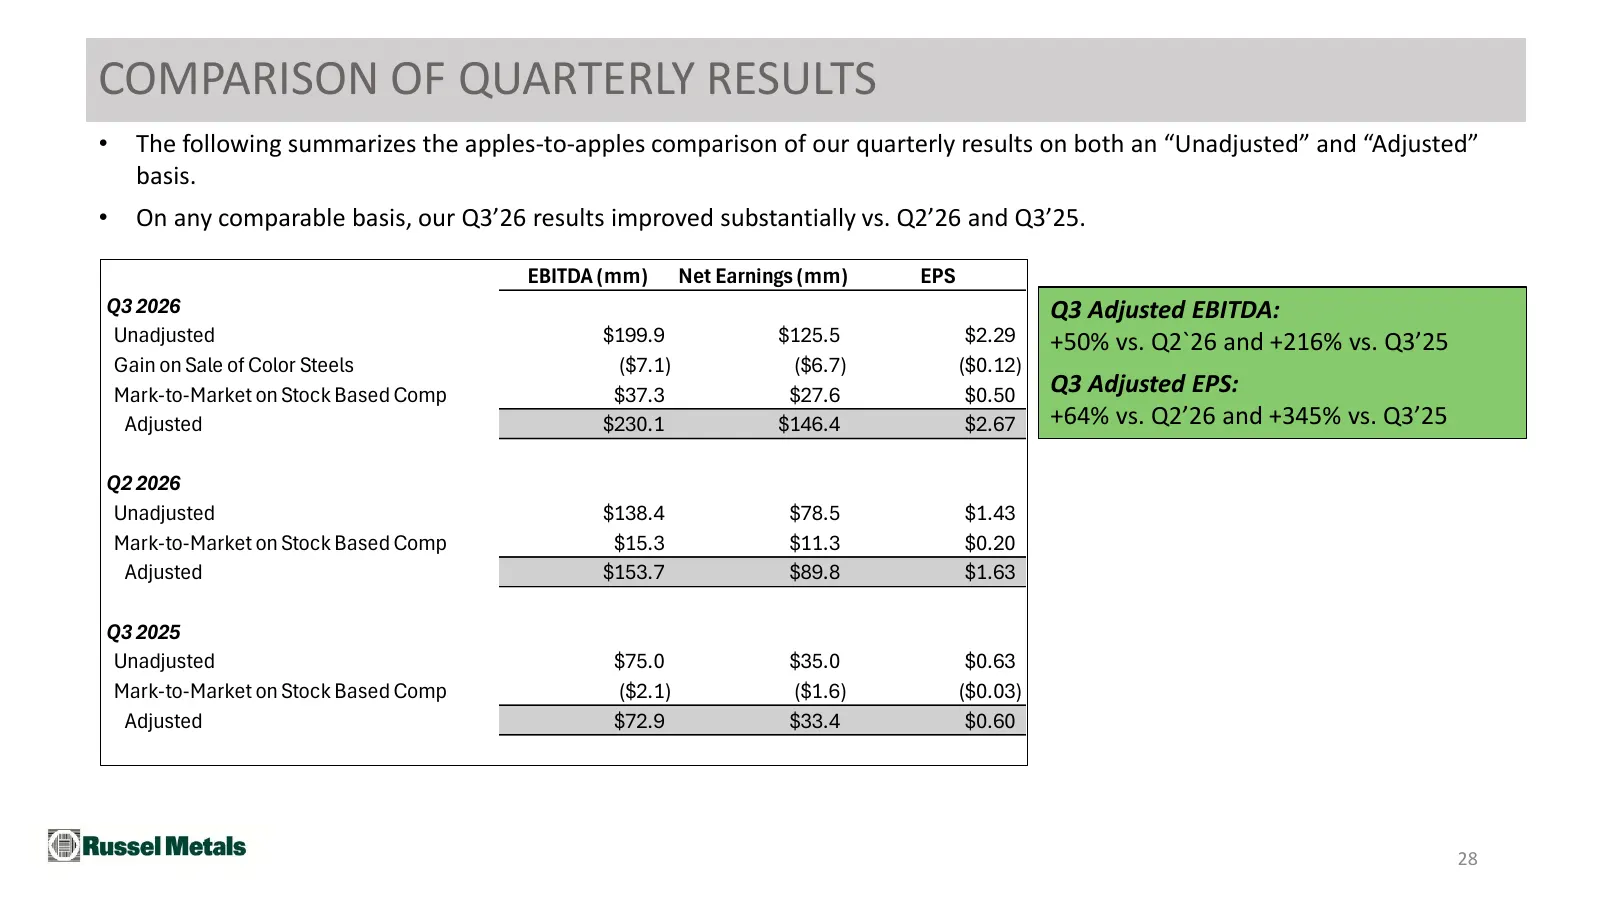
COMPARISON OF QUARTERLY RESULTS • The following summarizes the apples-to-apples comparison of our quarterly results on both an “Unadjusted” and “Adjusted” basis. • On any comparable basis, our Q3’26 results improved substantially vs. Q2’26 and Q3’25. EBITDA (mm) Net Earnings (mm) EPS Q3 2026 Q3 Adju
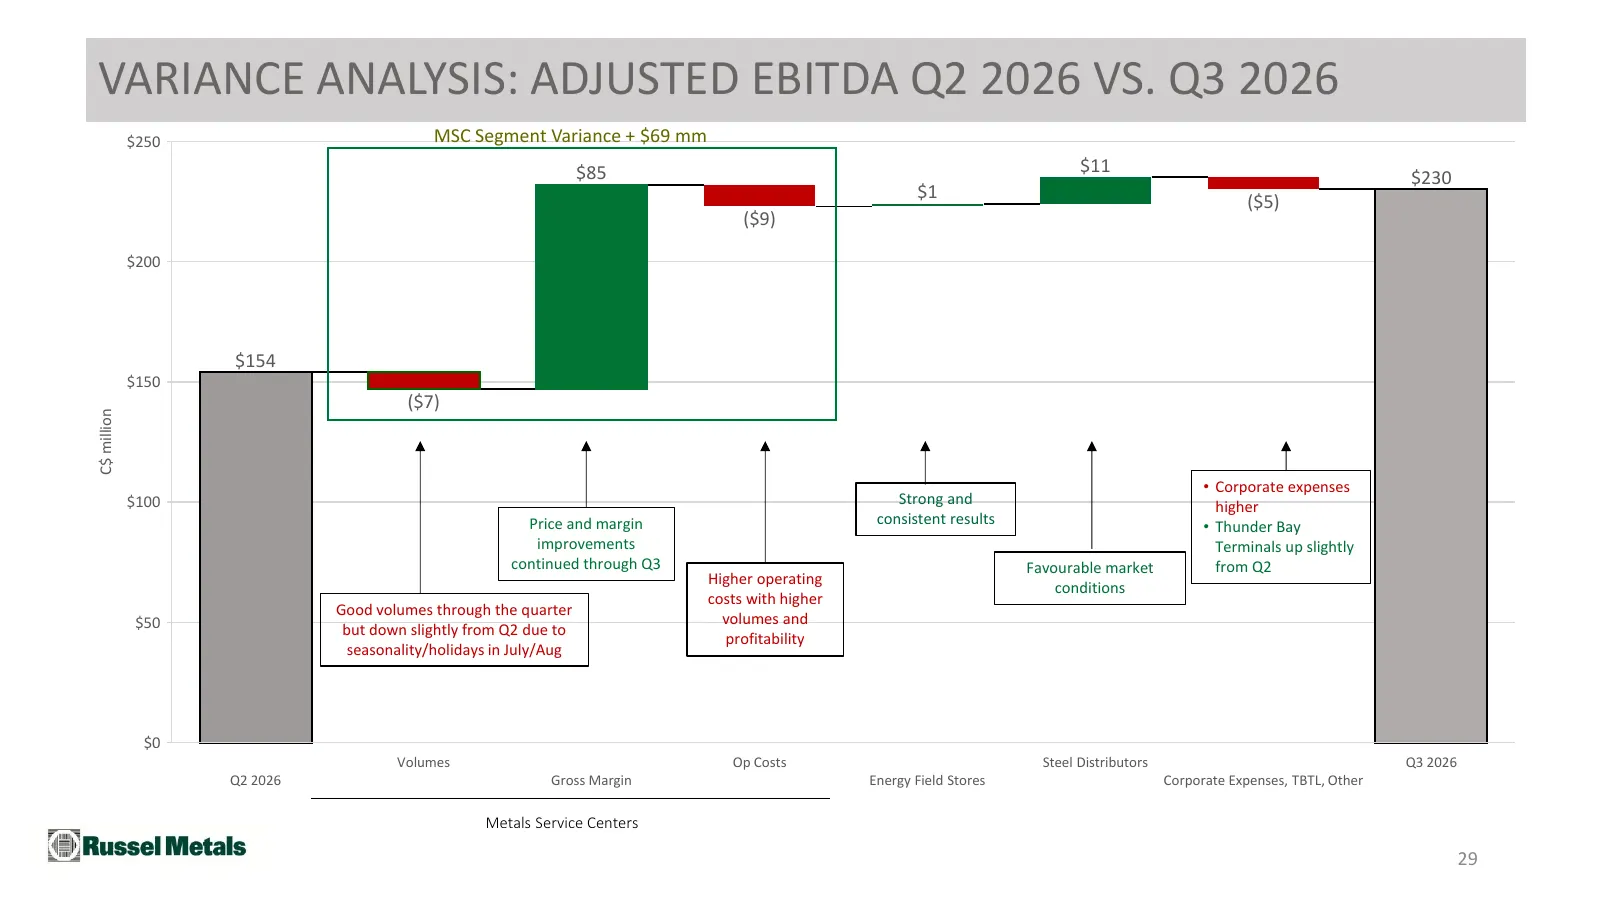
Slide 29: Variance Analysis: Adjusted EBITDA Q2 2026 vs. Q3 2026
VARIANCE ANALYSIS: ADJUSTED EBITDA Q2 2026 VS. Q3 2026 $250 MSC Segment Variance + $69 mm $85 $11 $230 $1 ($5) ($9) $200 $154 $150 ($7) C$ million • Corporate expenses $100 Strong and higher Price and margin consistent results • Thunder Bay improvements Terminals up slightly continued through Q3 Fav
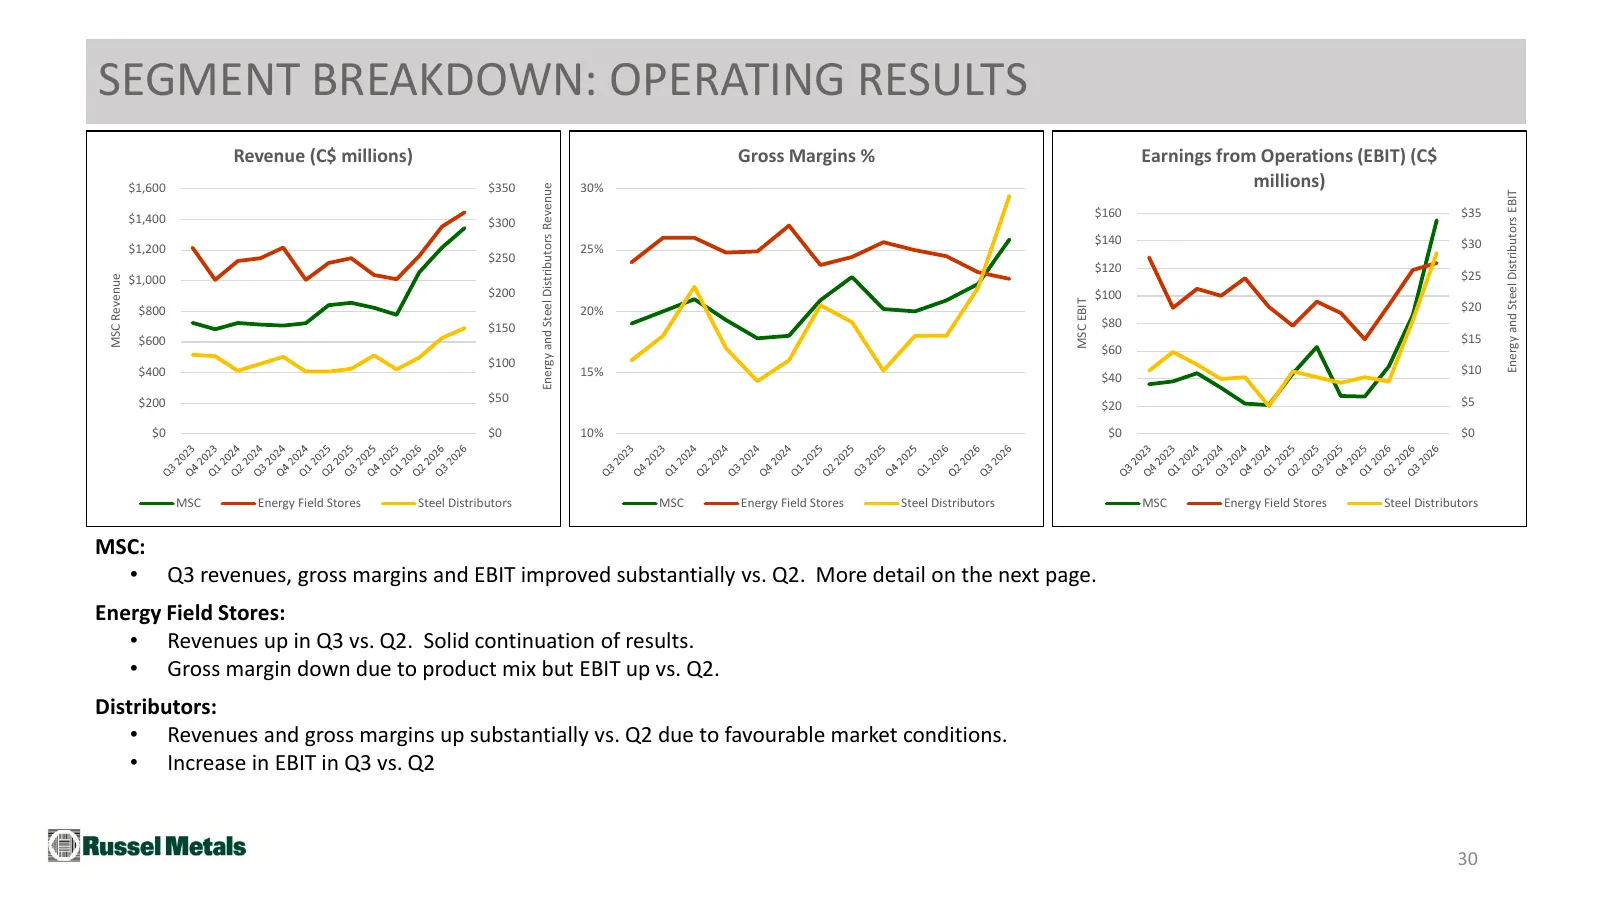
Slide 30: Segment Breakdown: Operating Results
SEGMENT BREAKDOWN: OPERATING RESULTS Revenue (C$ millions) Gross Margins % Earnings from Operations (EBIT) (C$ $1,600 $350 30% millions) Energy and Steel Distributors Revenue Energy and Steel Distributors EBIT $1,400 $160 $35 $300 $140 $30 $1,200 25% $250 $120 $25 MSC Revenue $1,000 $200 $100 MSC EB
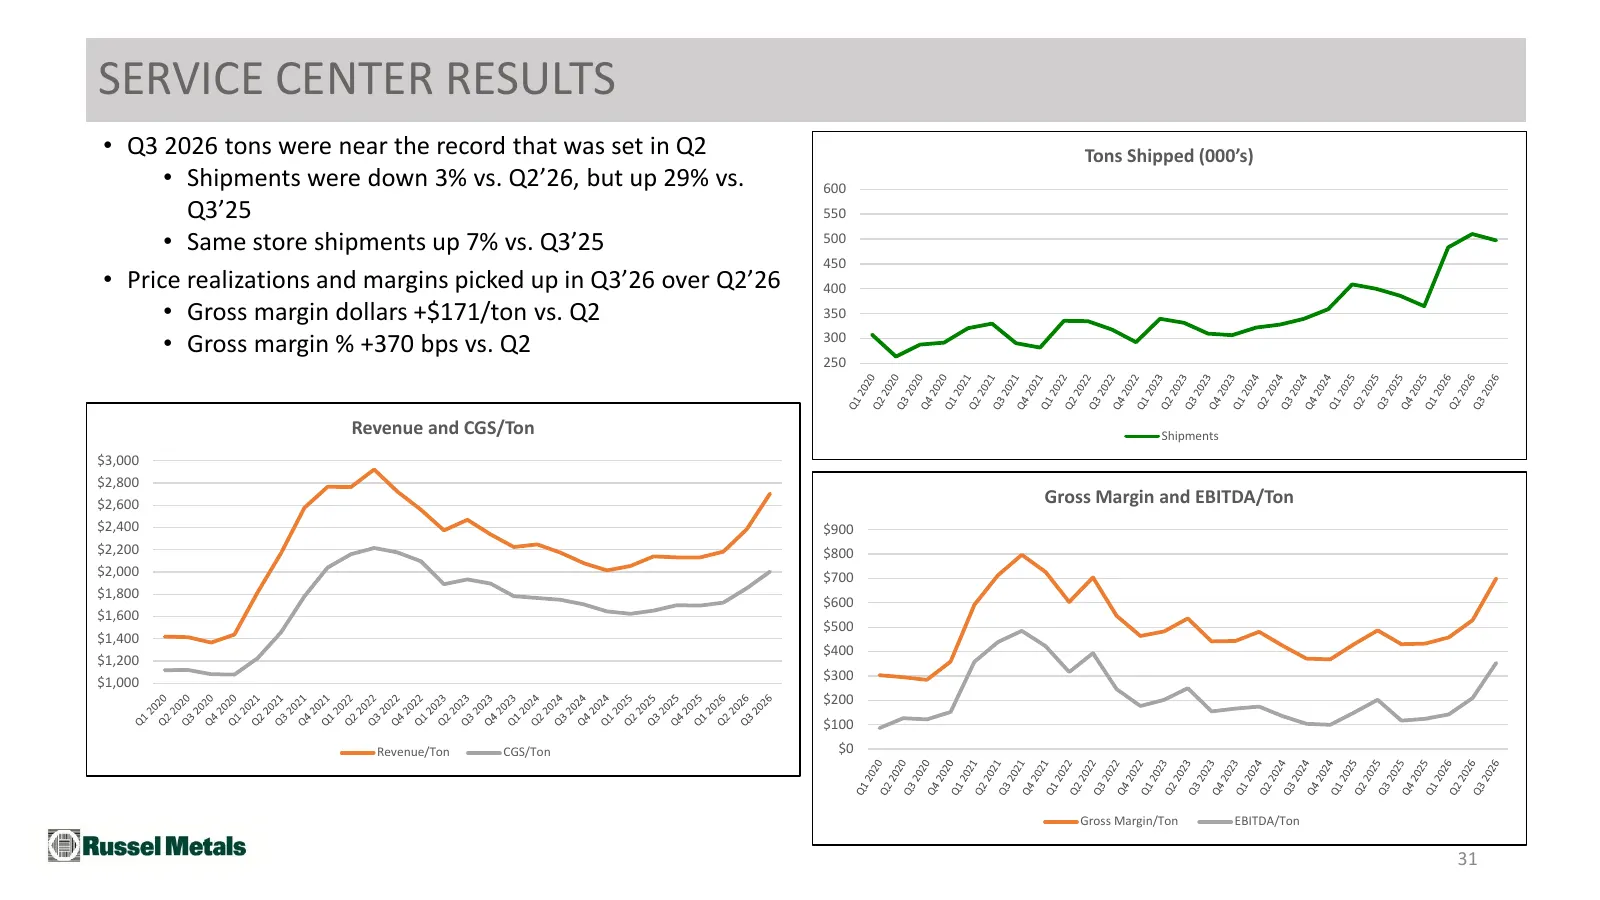
Slide 31: Service Center Results
SERVICE CENTER RESULTS • Q3 2026 tons were near the record that was set in Q2 Tons Shipped (000’s) • Shipments were down 3% vs. Q2’26, but up 29% vs. 600 Q3’25 550 • Same store shipments up 7% vs. Q3’25 500 450 • Price realizations and margins picked up in Q3’26 over Q2’26 400 • Gross margin dollars
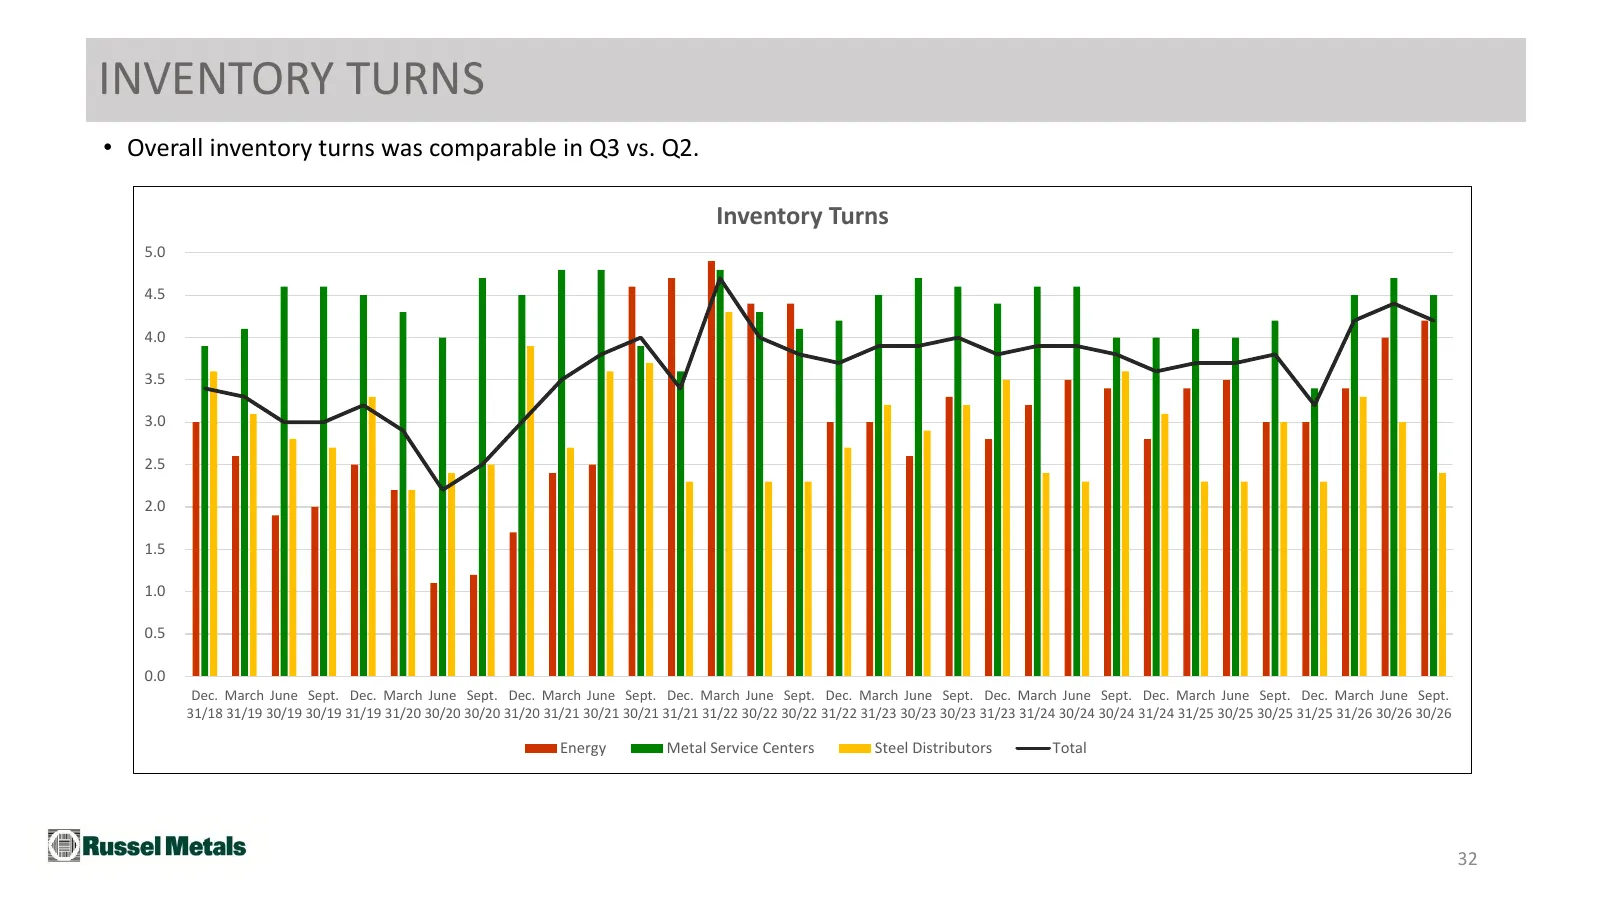
Slide 32: Inventory Turns
INVENTORY TURNS • Overall inventory turns was comparable in Q3 vs. Q2. Inventory Turns 5.0 4.5 4.0 3.5 3.0 2.5 2.0 1.5 1.0 0.5 0.0 Dec. March June Sept. Dec. March June Sept. Dec. March June Sept. Dec. March June Sept. Dec. March June Sept. Dec. March June Sept. Dec. March June Sept. Dec. March June
Slide 33: Inventory Trends
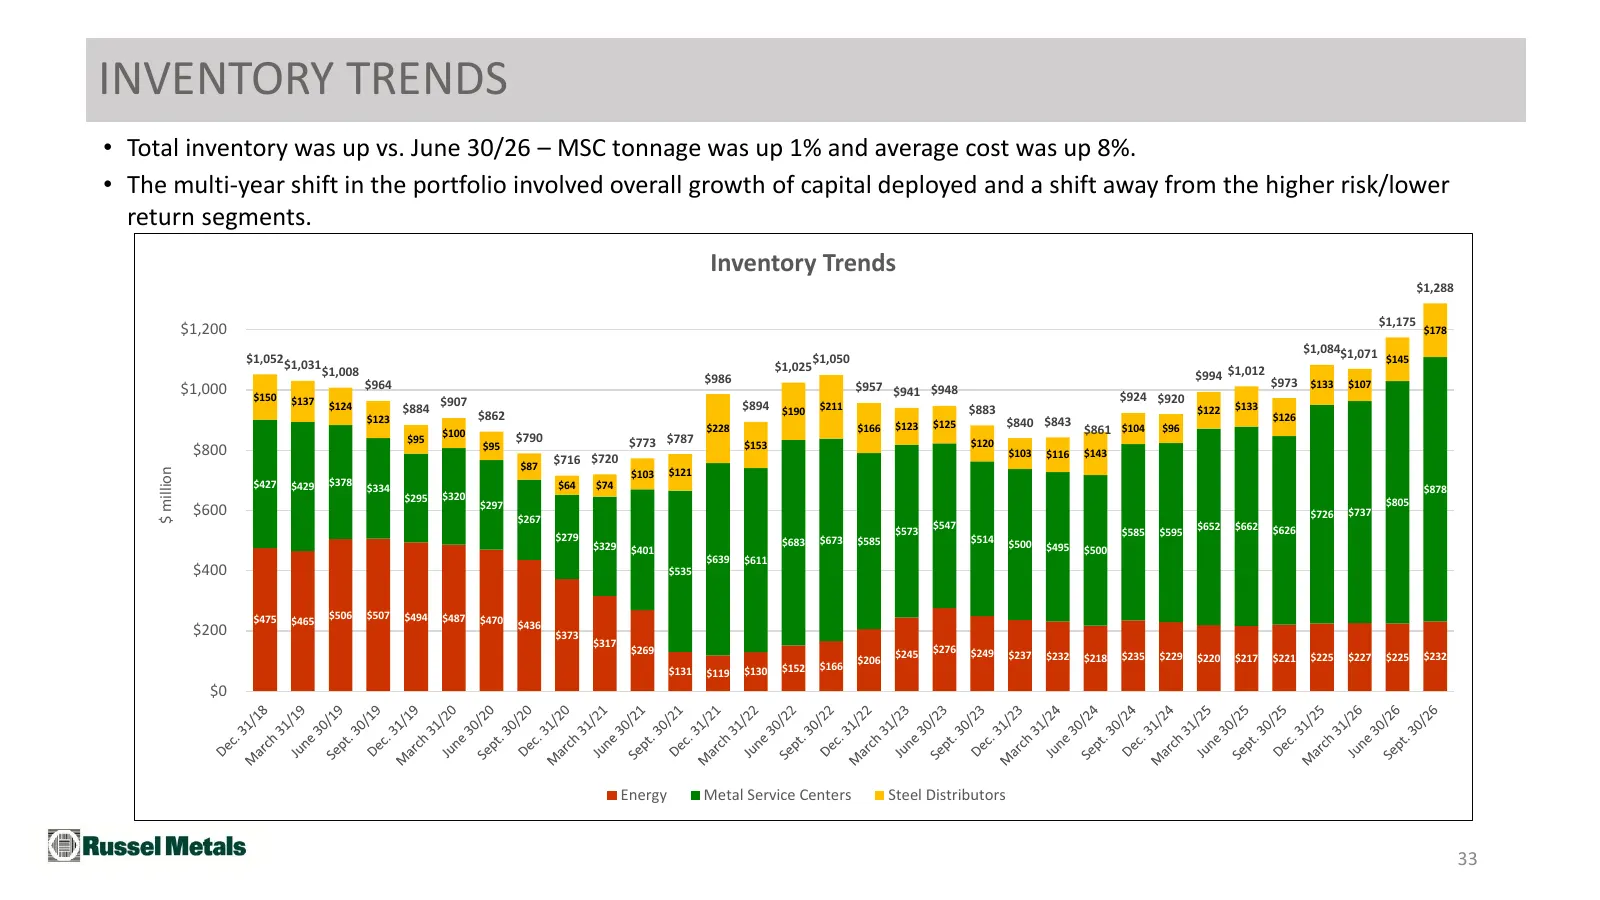
INVENTORY TRENDS • Total inventory was up vs. June 30/26 – MSC tonnage was up 1% and average cost was up 8%. • The multi-year shift in the portfolio involved overall growth of capital deployed and a shift away from the higher risk/lower return segments. Inventory Trends $1,288 $1,175 $1,200 $178 $1,
Slide 34: Longer Term EBITDA and Working Capital Trends
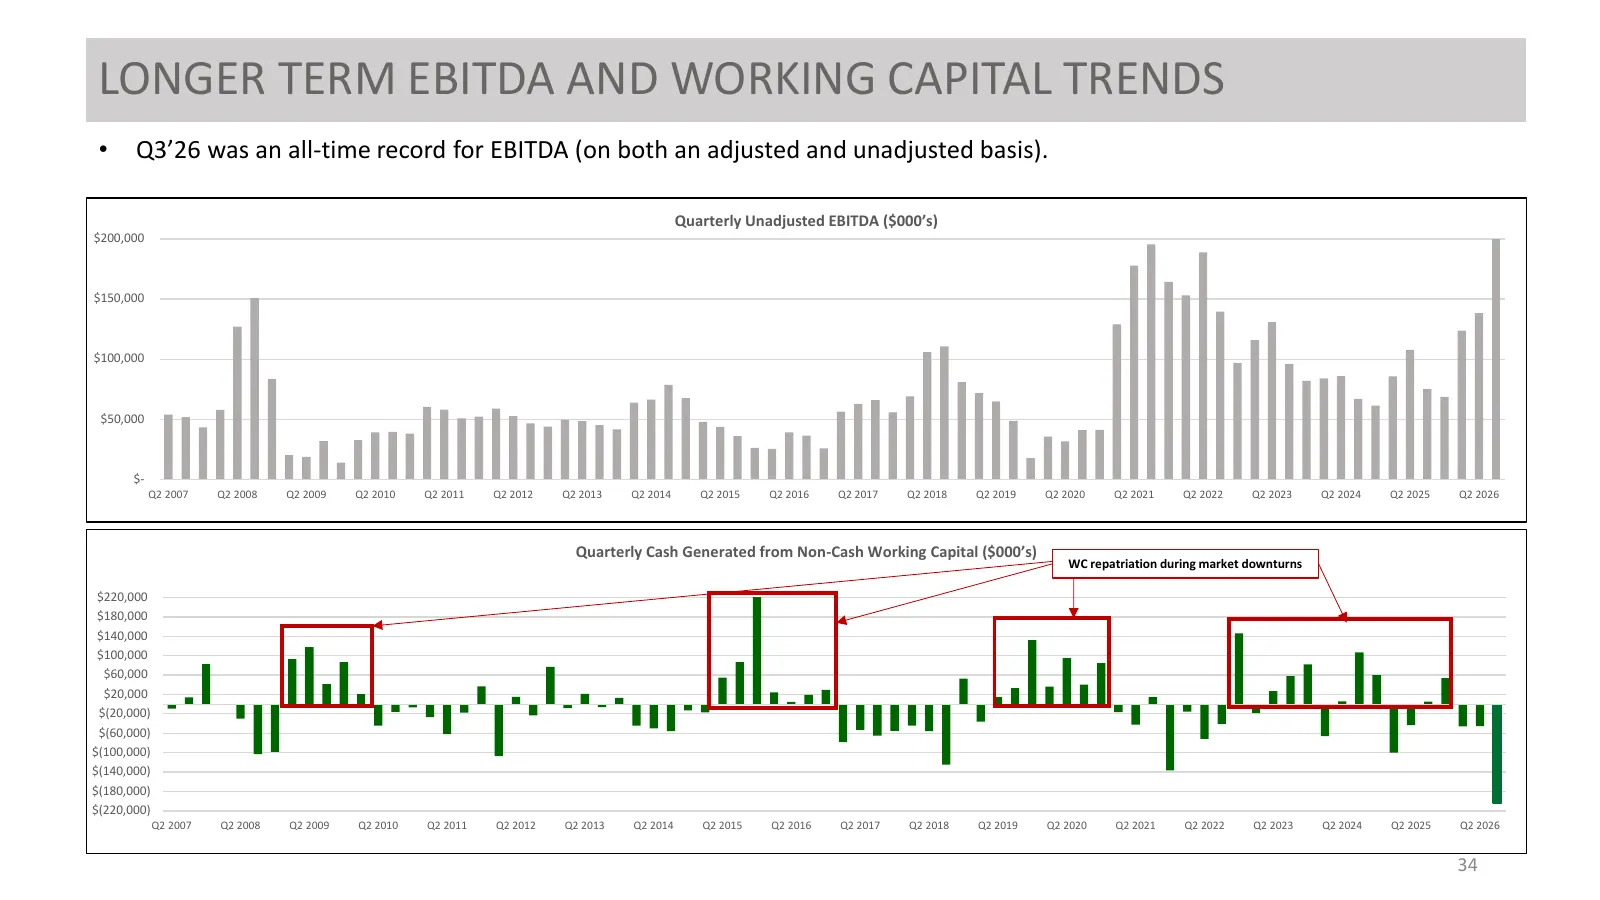
LONGER TERM EBITDA AND WORKING CAPITAL TRENDS • Q3’26 was an all-time record for EBITDA (on both an adjusted and unadjusted basis). Quarterly Unadjusted EBITDA ($000’s) $200,000 $150,000 $100,000 $50,000 $- Q2 2007 Q2 2008 Q2 2009 Q2 2010 Q2 2011 Q2 2012 Q2 2013 Q2 2014 Q2 2015 Q2 2016 Q2 2017 Q2 20
Slide 35: Liquidity and Capital Structure Summary
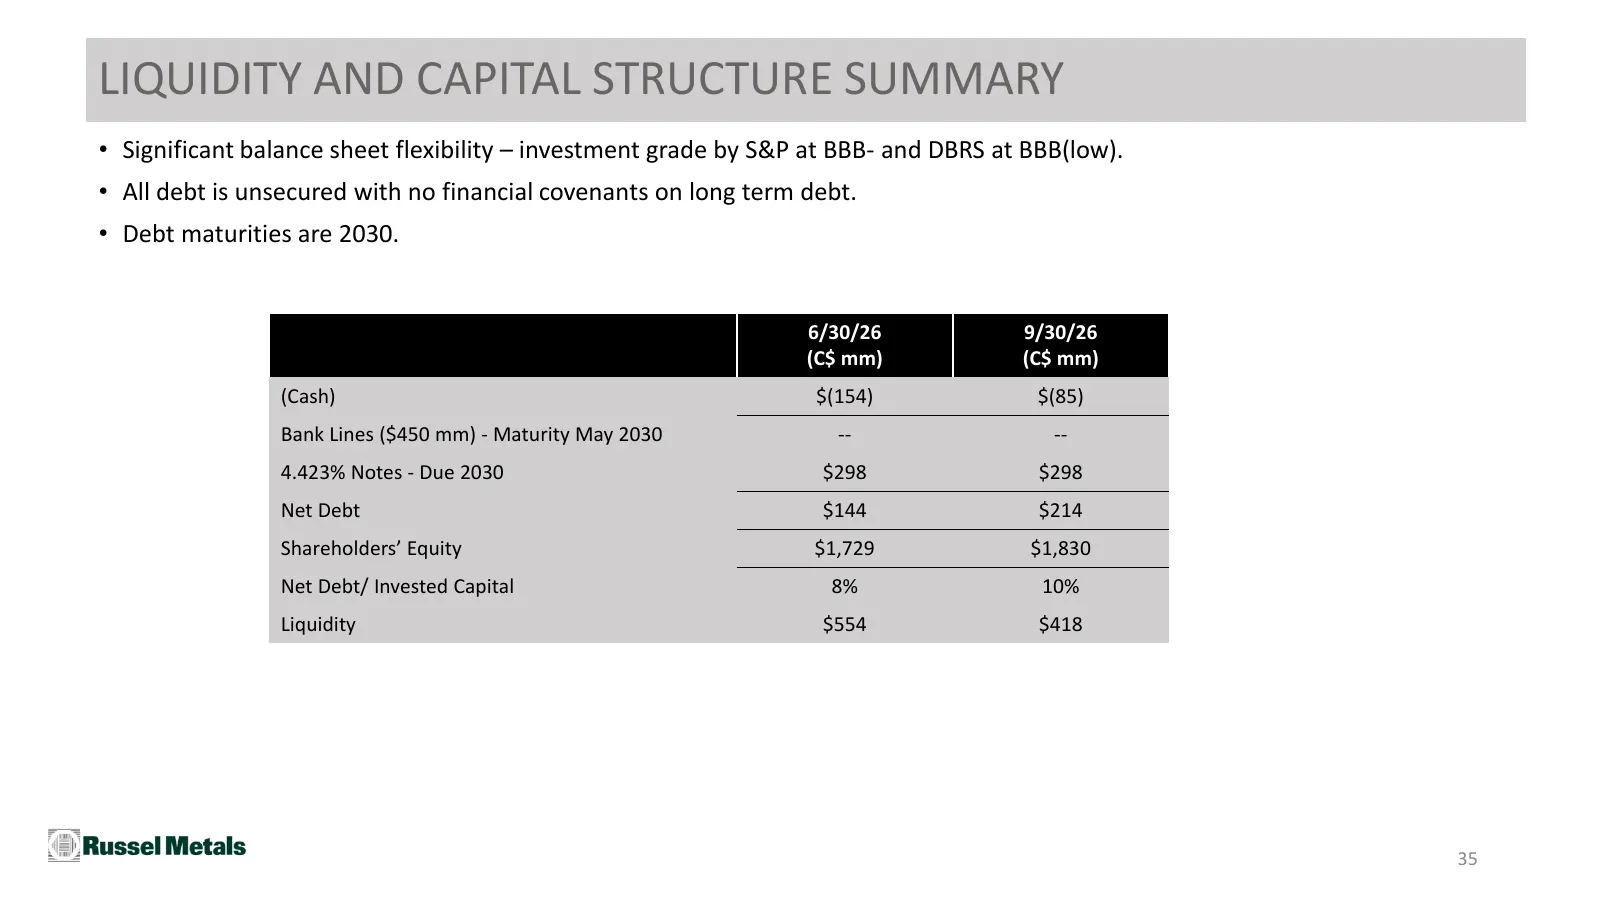
LIQUIDITY AND CAPITAL STRUCTURE SUMMARY • Significant balance sheet flexibility – investment grade by S&P at BBB- and DBRS at BBB(low). • All debt is unsecured with no financial covenants on long term debt. • Debt maturities are 2030. 6/30/26 9/30/26 (C$ mm) (C$ mm) (Cash) $(154) $(85) Bank Lines ($
Slide 36: Relative Return on Capital
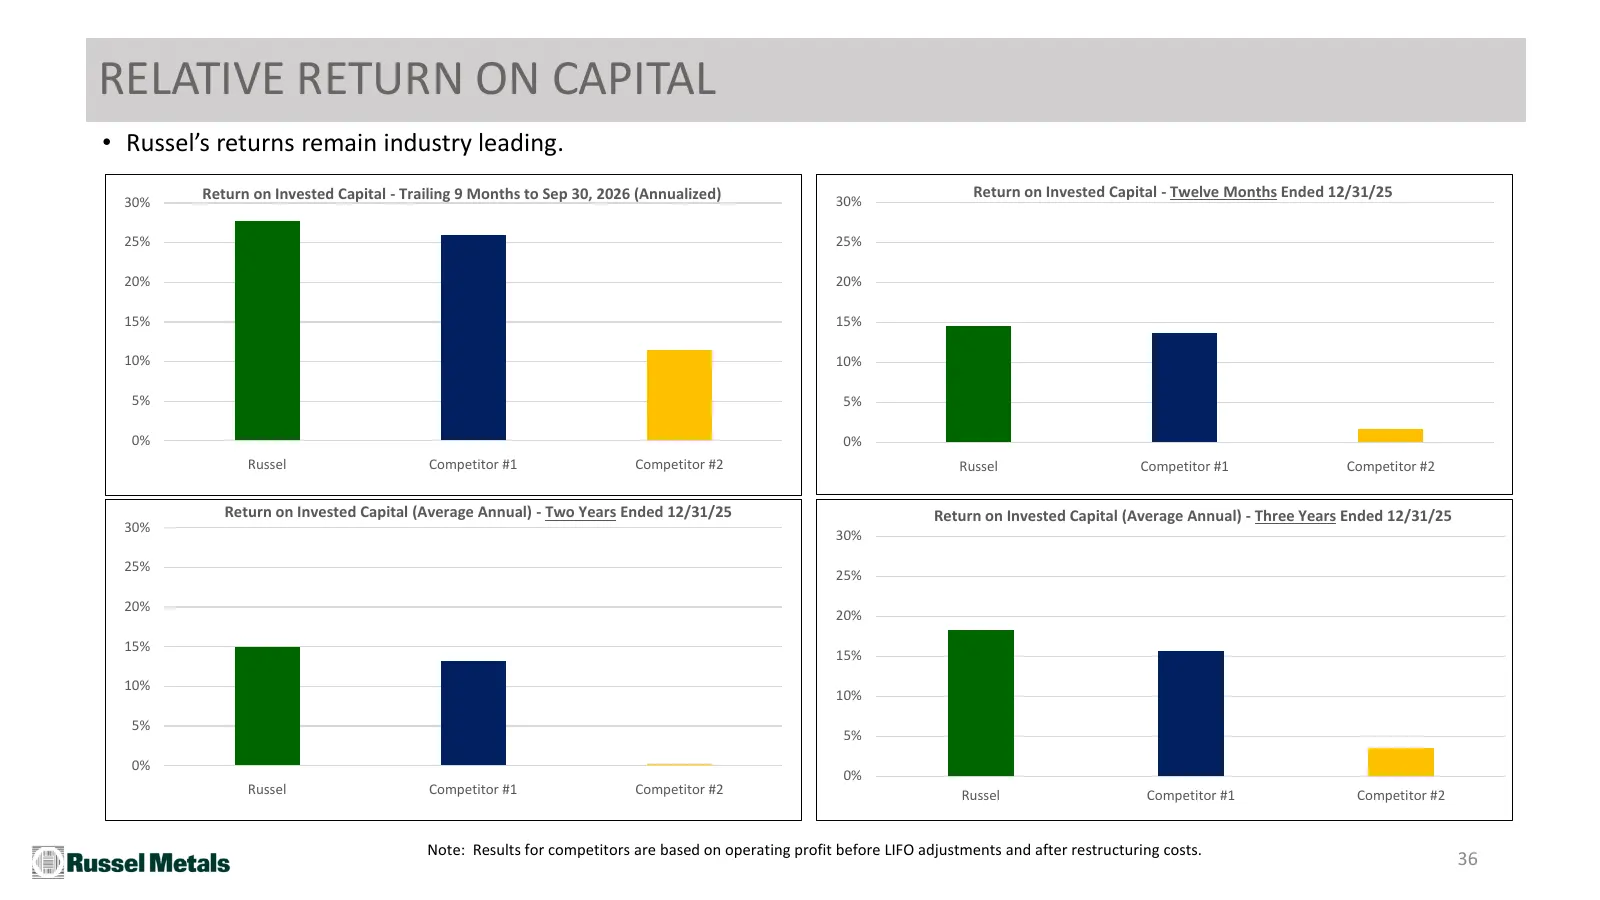
RELATIVE RETURN ON CAPITAL • Russel’s returns remain industry leading. Return on Invested Capital - Trailing 9 Months to Sep 30, 2026 (Annualized) Return on Invested Capital - Twelve Months Ended 12/31/25 30% 30% 25% 25% 20% 20% 15% 15% 10% 10% 5% 5% 0% 0% Russel Competitor #1 Competitor #2 Russel C
Slide 37: V. Recent Acquisitions
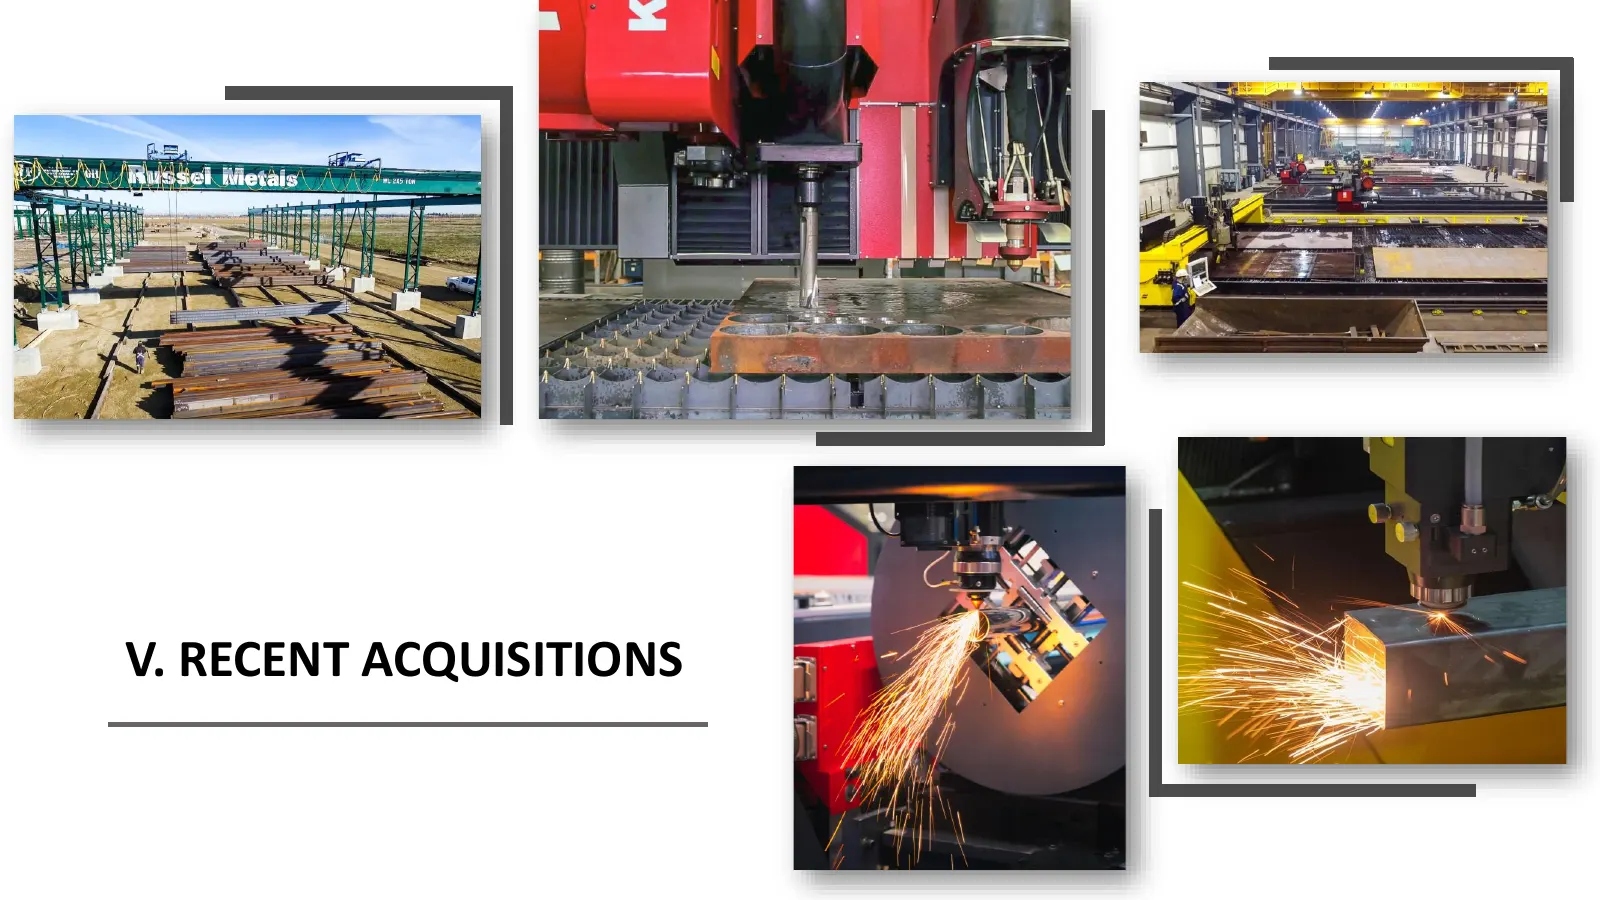
V. RECENT ACQUISITIONS
Slide 38: Samuel Acquisition: Fit in W. Canada
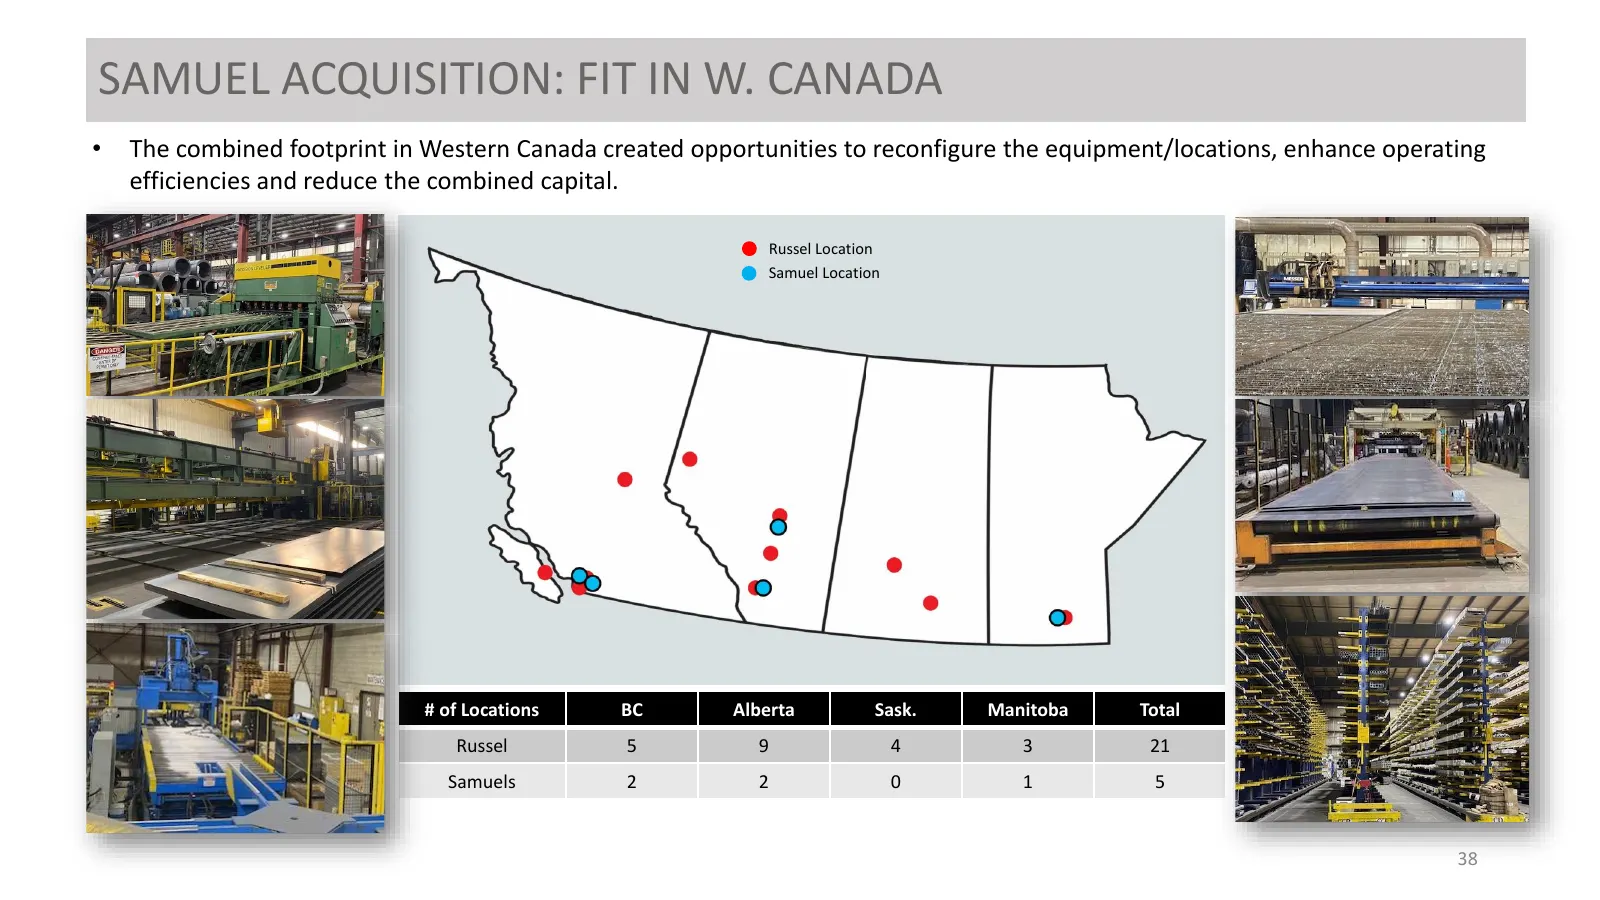
SAMUEL ACQUISITION: FIT IN W. CANADA • The combined footprint in Western Canada created opportunities to reconfigure the equipment/locations, enhance operating efficiencies and reduce the combined capital. Russel Location Samuel Location # of Locations BC Alberta Sask. Manitoba Total Russel 5 9 4 3
Slide 39: Samuel Acquisition: Extension into US Northeast
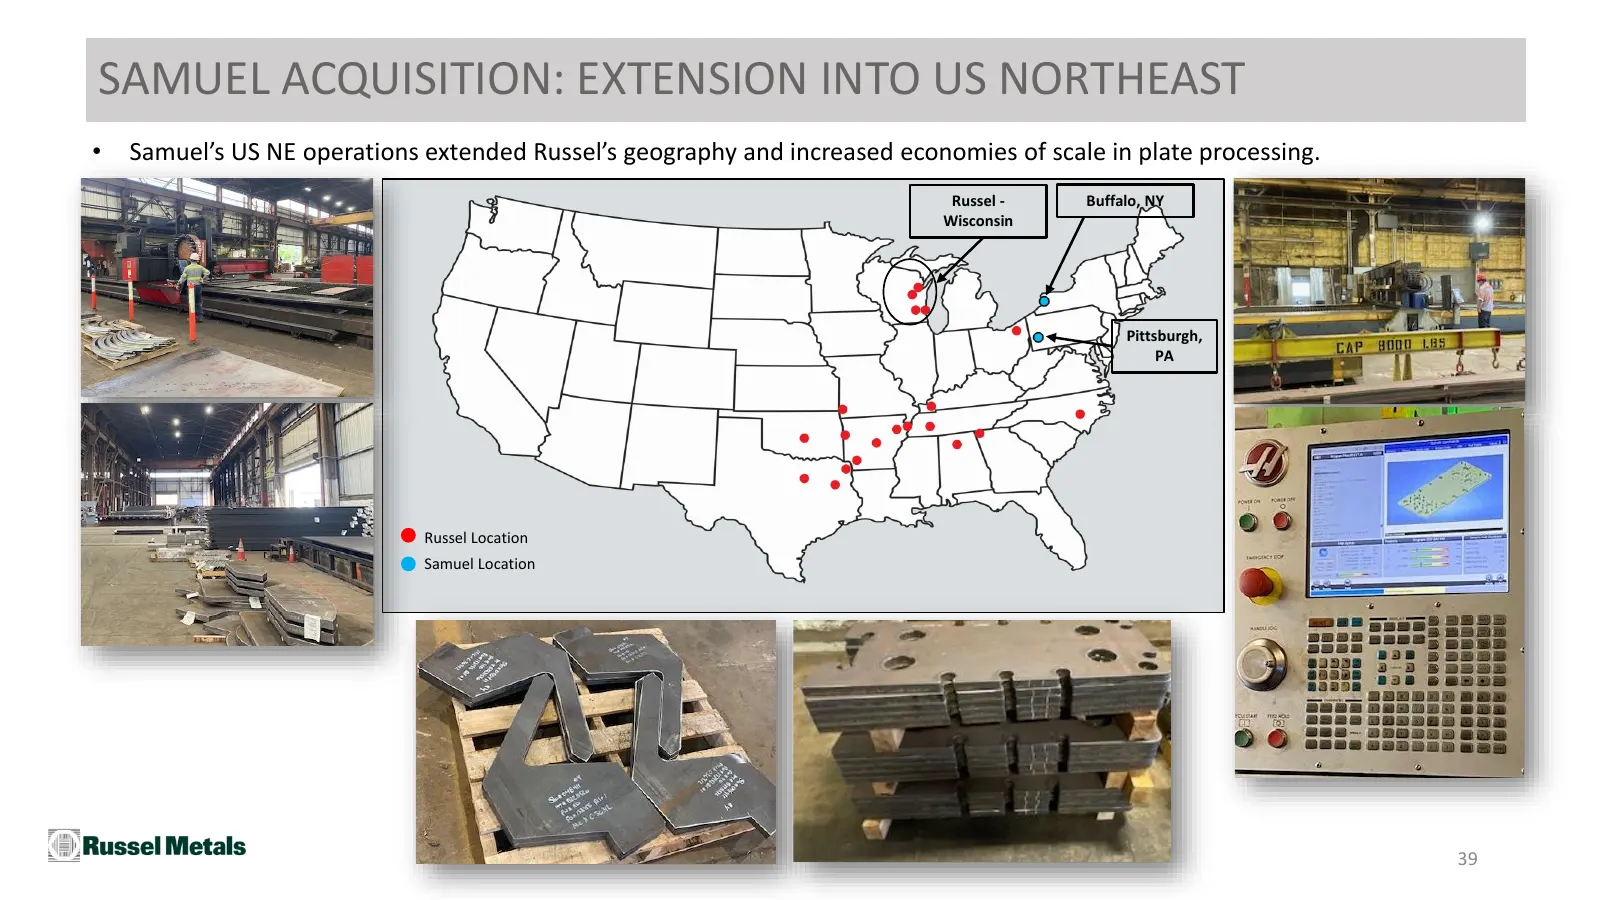
SAMUEL ACQUISITION: EXTENSION INTO US NORTHEAST • Samuel’s US NE operations extended Russel’s geography and increased economies of scale in plate processing. Russel - Buffalo, NY Wisconsin Pittsburgh, PA Russel Location Samuel Location 39
Slide 40: Samuel Acquisition: Invested Capital Update
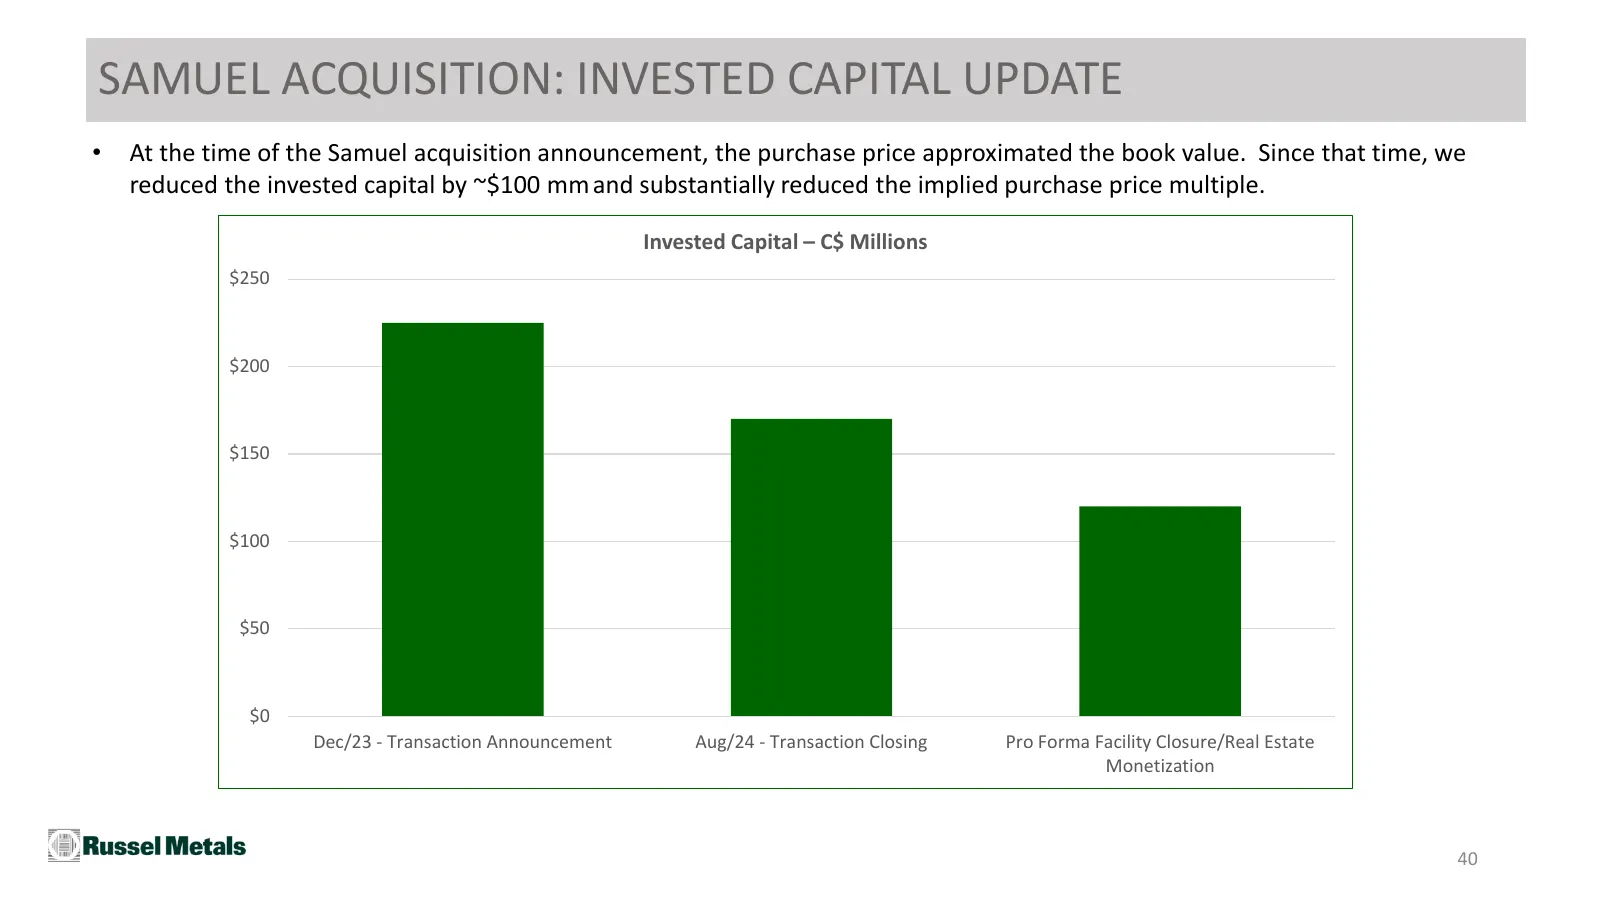
SAMUEL ACQUISITION: INVESTED CAPITAL UPDATE • At the time of the Samuel acquisition announcement, the purchase price approximated the book value. Since that time, we reduced the invested capital by ~$100 mm and substantially reduced the implied purchase price multiple. Invested Capital – C$ Millions
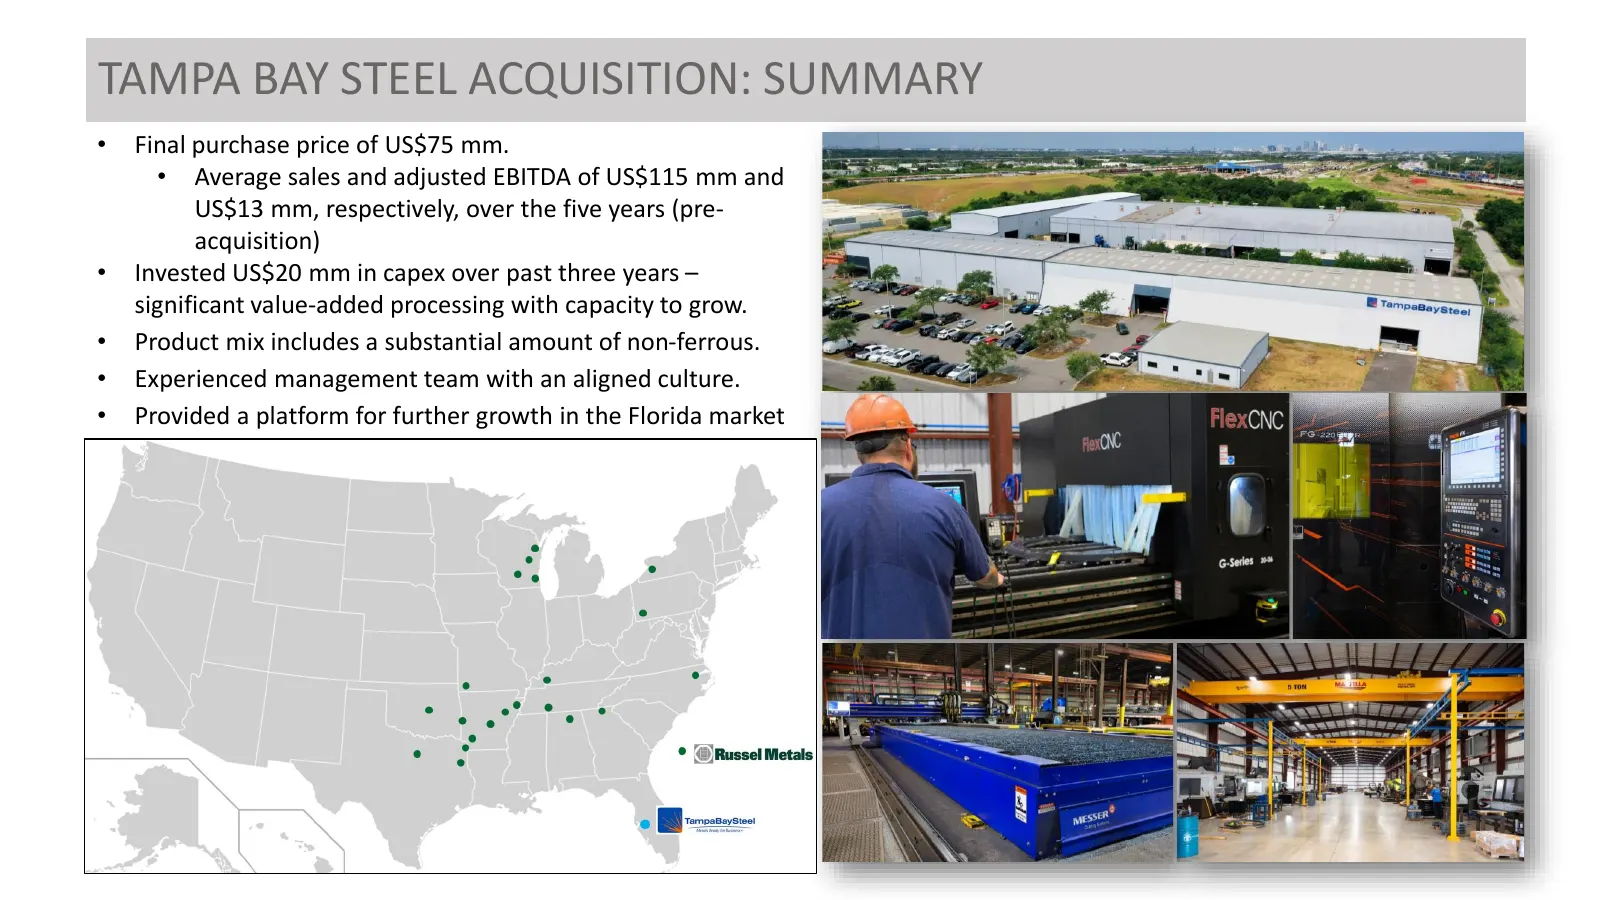
Slide 41: Tampa Bay Steel Acquisition: Summary
TAMPA BAY STEEL ACQUISITION: SUMMARY • Final purchase price of US$75 mm. • Average sales and adjusted EBITDA of US$115 mm and US$13 mm, respectively, over the five years (pre- acquisition) • Invested US$20 mm in capex over past three years – significant value-added processing with capacity to grow.
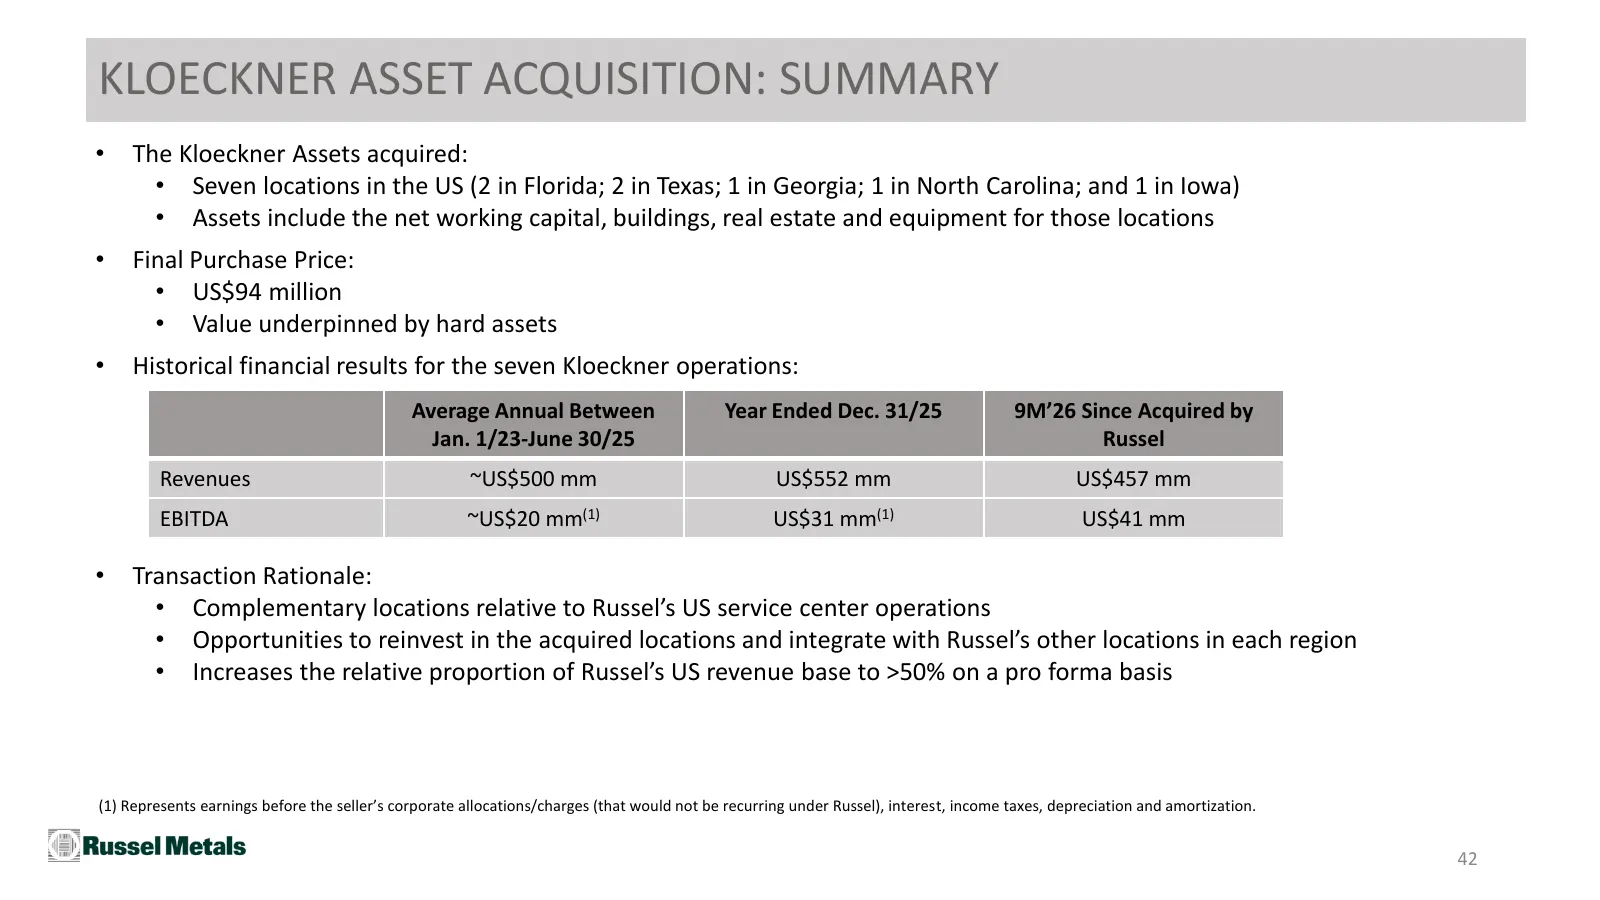
Slide 42: Kloeckner Asset Acquisition: Summary
KLOECKNER ASSET ACQUISITION: SUMMARY • The Kloeckner Assets acquired: • Seven locations in the US (2 in Florida; 2 in Texas; 1 in Georgia; 1 in North Carolina; and 1 in Iowa) • Assets include the net working capital, buildings, real estate and equipment for those locations • Final Purchase Price: •
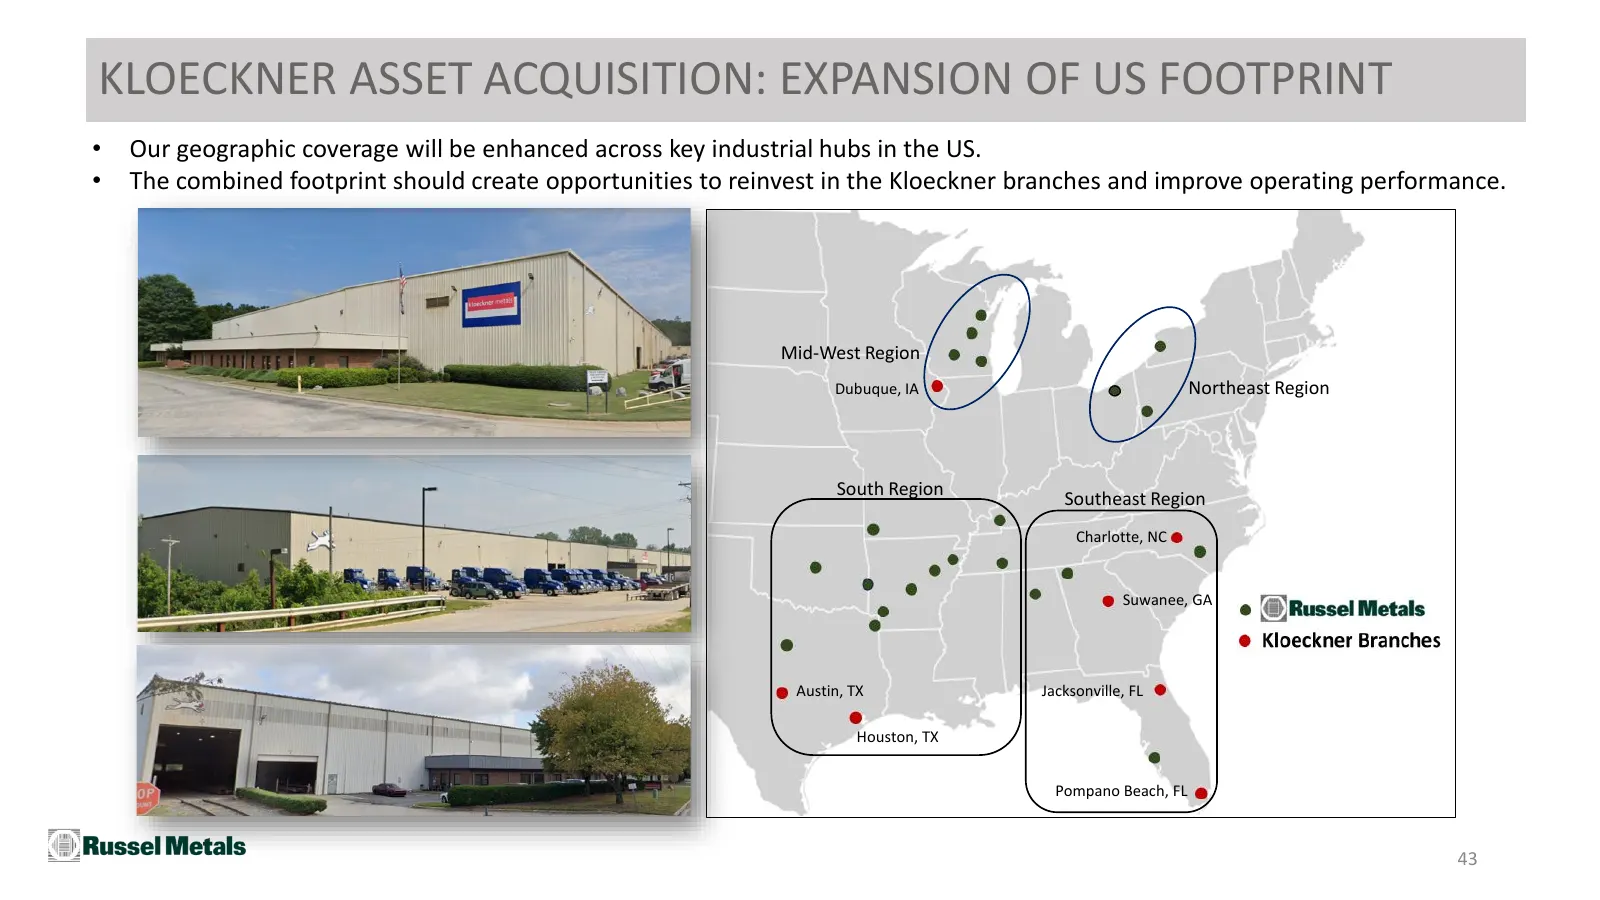
Slide 43: Kloeckner Asset Acquisition: Expansion of US Footprint
KLOECKNER ASSET ACQUISITION: EXPANSION OF US FOOTPRINT • Our geographic coverage will be enhanced across key industrial hubs in the US. • The combined footprint should create opportunities to reinvest in the Kloeckner branches and improve operating performance. Mid-West Region Dubuque, IA Northeast
Slide 44: Russel Metals Contact Details
6600 Financial Drive, Mississauga, Ontario L5N 7J6 Email: info@russelmetals.com Visit us at: www.russelmetals.com Investor Relations Line: 905.816.5178
Source: company website
More decks from Russel Metals Inc.
 Q2 2026 Earnings Presentation22 slides · Aug 7, 2026
 Investor Presentation (August 2026)44 slides · August 2026
 Q1 2026 Earnings Presentation22 slides · May 6, 2026
 Investor Presentation (May 2026)44 slides · May 2026
 Investor Presentation (March 2026)43 slides · Mar 19, 2026
 Q3 2025 Earnings Presentation21 slides · Nov 6, 2025