PT Bank Negara Indonesia (Persero) Tbk Class B · IDX:BBNI
PT Bank Negara Indonesia (Persero) Tbk Class B — Q3 2010 Earnings Presentation
9 slides from PT Bank Negara Indonesia (Persero) Tbk Class B's earnings presentation, October 2010
Slide 1: Continuously and Sustainably Achieving Growth
Continuously and Sustainably Achieving Growth Corporate Presentation 3Q 2010 PT Bank Negara Indonesia (Persero) Tbk Disclaimer: This report has been prepared by PT Bank Negara Indonesia (Persero) Tbk (BNI) independently and is circulated for the purpose of general information only, It is not intende
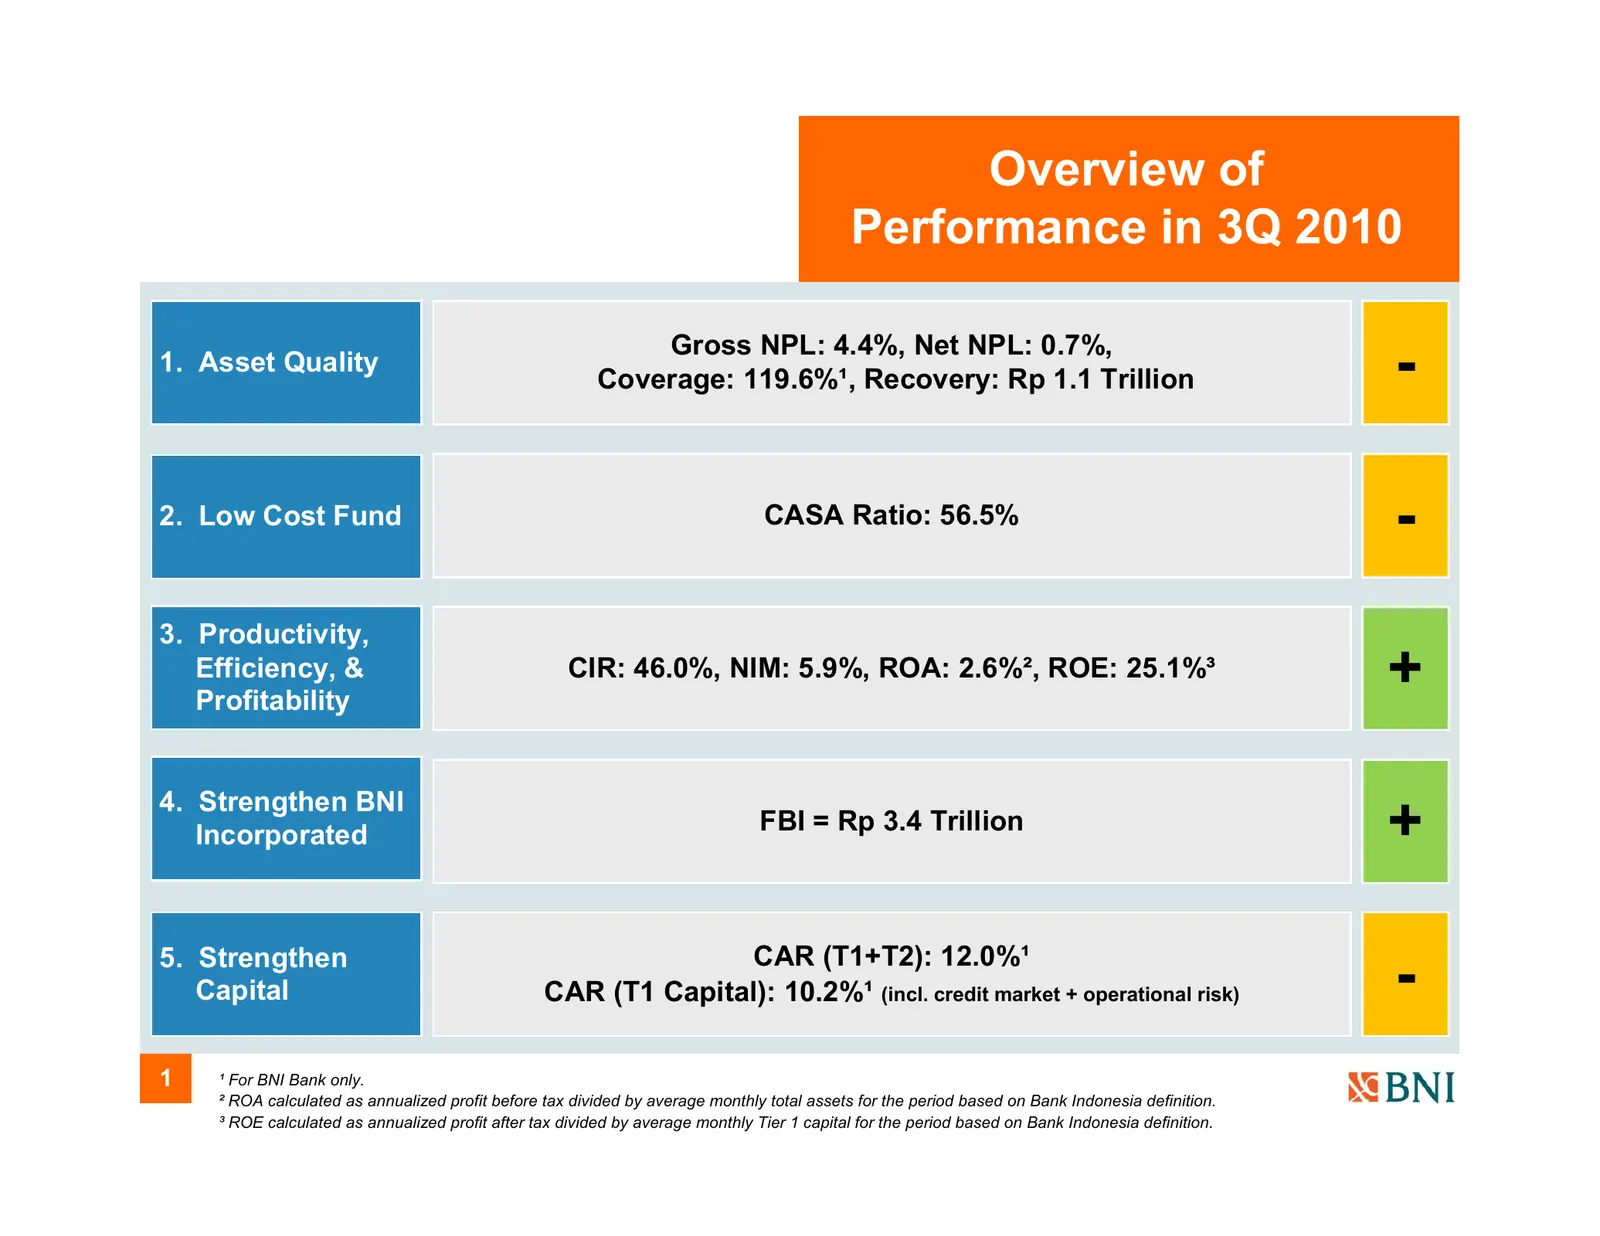
Slide 2: Overview of Performance in 3Q 2010
Overview of Performance in 3Q 2010 1. Asset Quality Gross NPL: 4.4%, Net NPL: 0.7%, Coverage: 119.6%¹, Recovery: Rp 1.1 Trillion - 2. Low Cost Fund CASA Ratio: 56.5% - 3. Productivity, Efficiency, & Profitability CIR: 46.0%, NIM: 5.9%, ROA: 2.6%², ROE: 25.1%³ + 4. Strengthen BNI Incorporated FBI = R
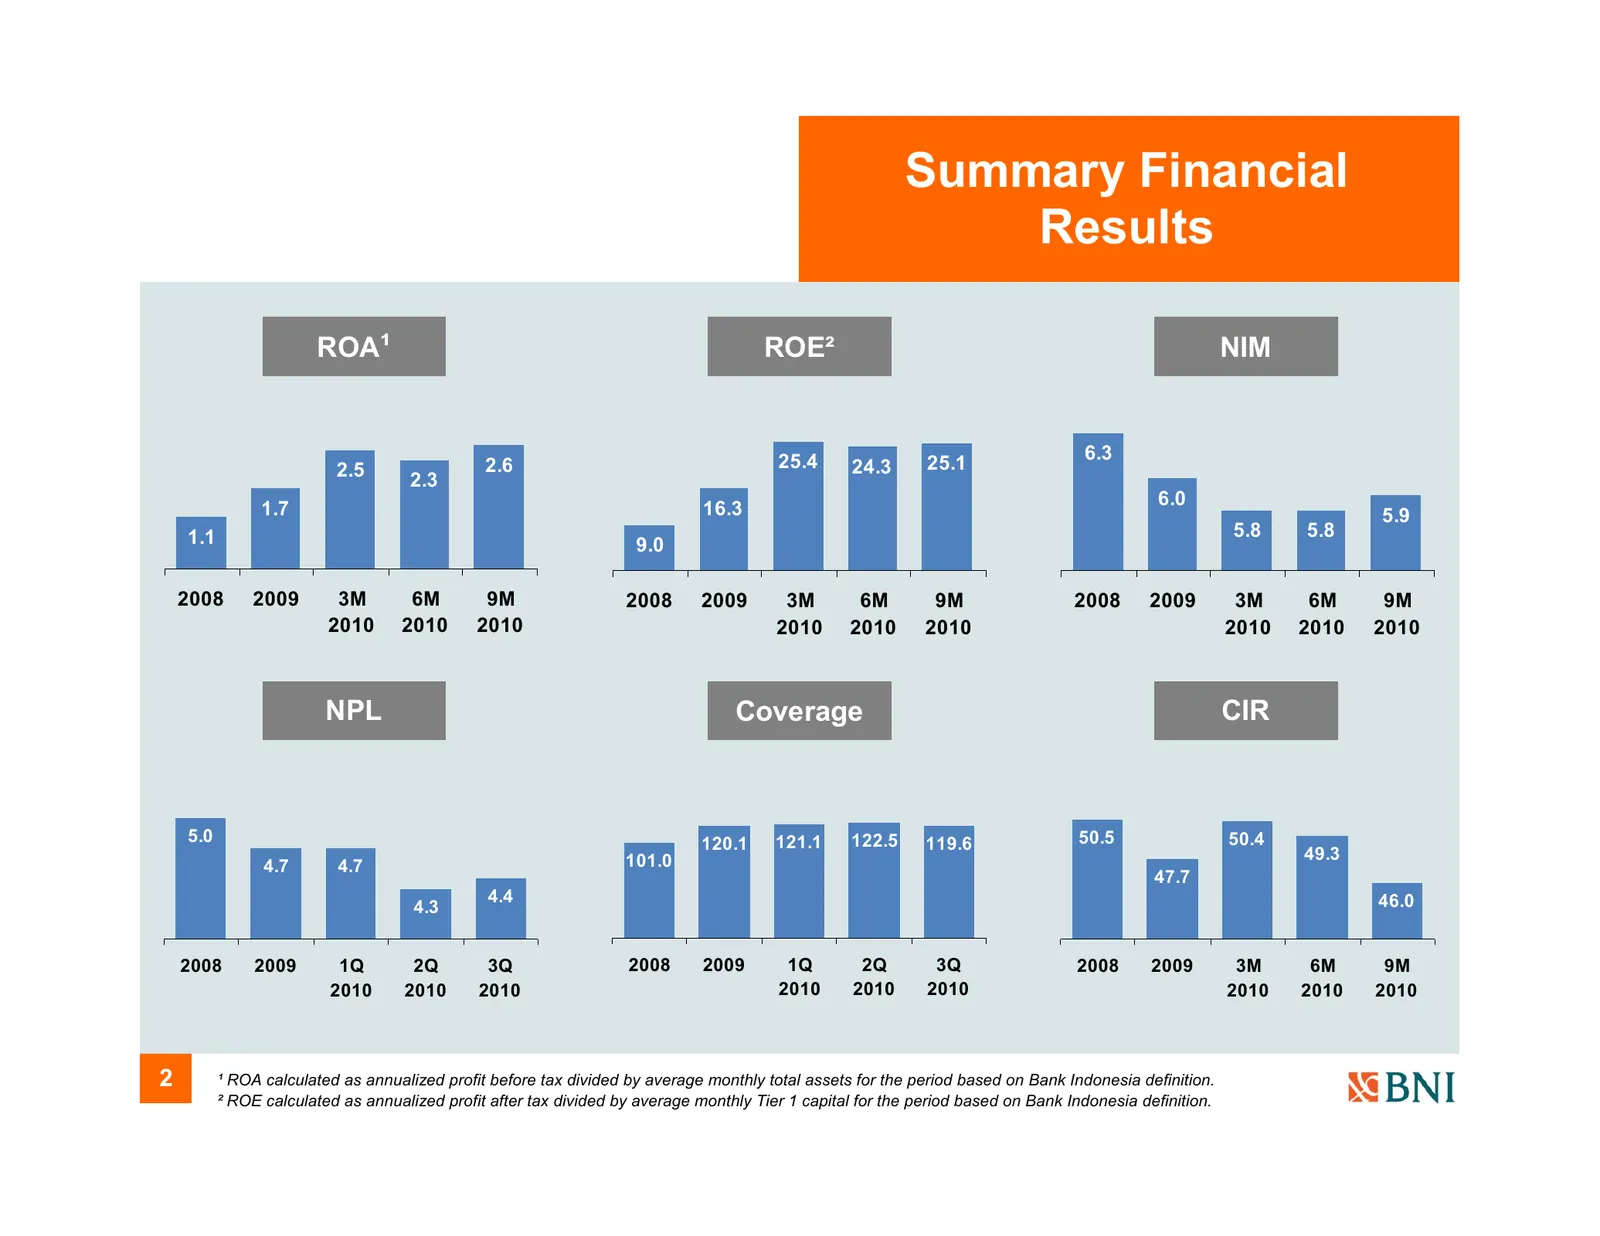
Slide 3: Summary Financial Results
Summary Financial Results ROA¹ ROE² NIM 25.4 6.3 2.5 2.6 24.3 25.1 2.3 16.3 6.0 1.7 5.9 1.1 5.8 5.8 9.0 2008 2009 3M 6M 9M 2008 2009 3M 6M 9M 2008 2009 3M 6M 9M 2010 2010 2010 2010 2010 2010 2010 2010 2010 NPL Coverage CIR 5.0 120.1 121.1 122.5 119.6 50.5 50.4 101.0 49.3 4.7 4.7 47.7 4.4 46.0 4.3 20
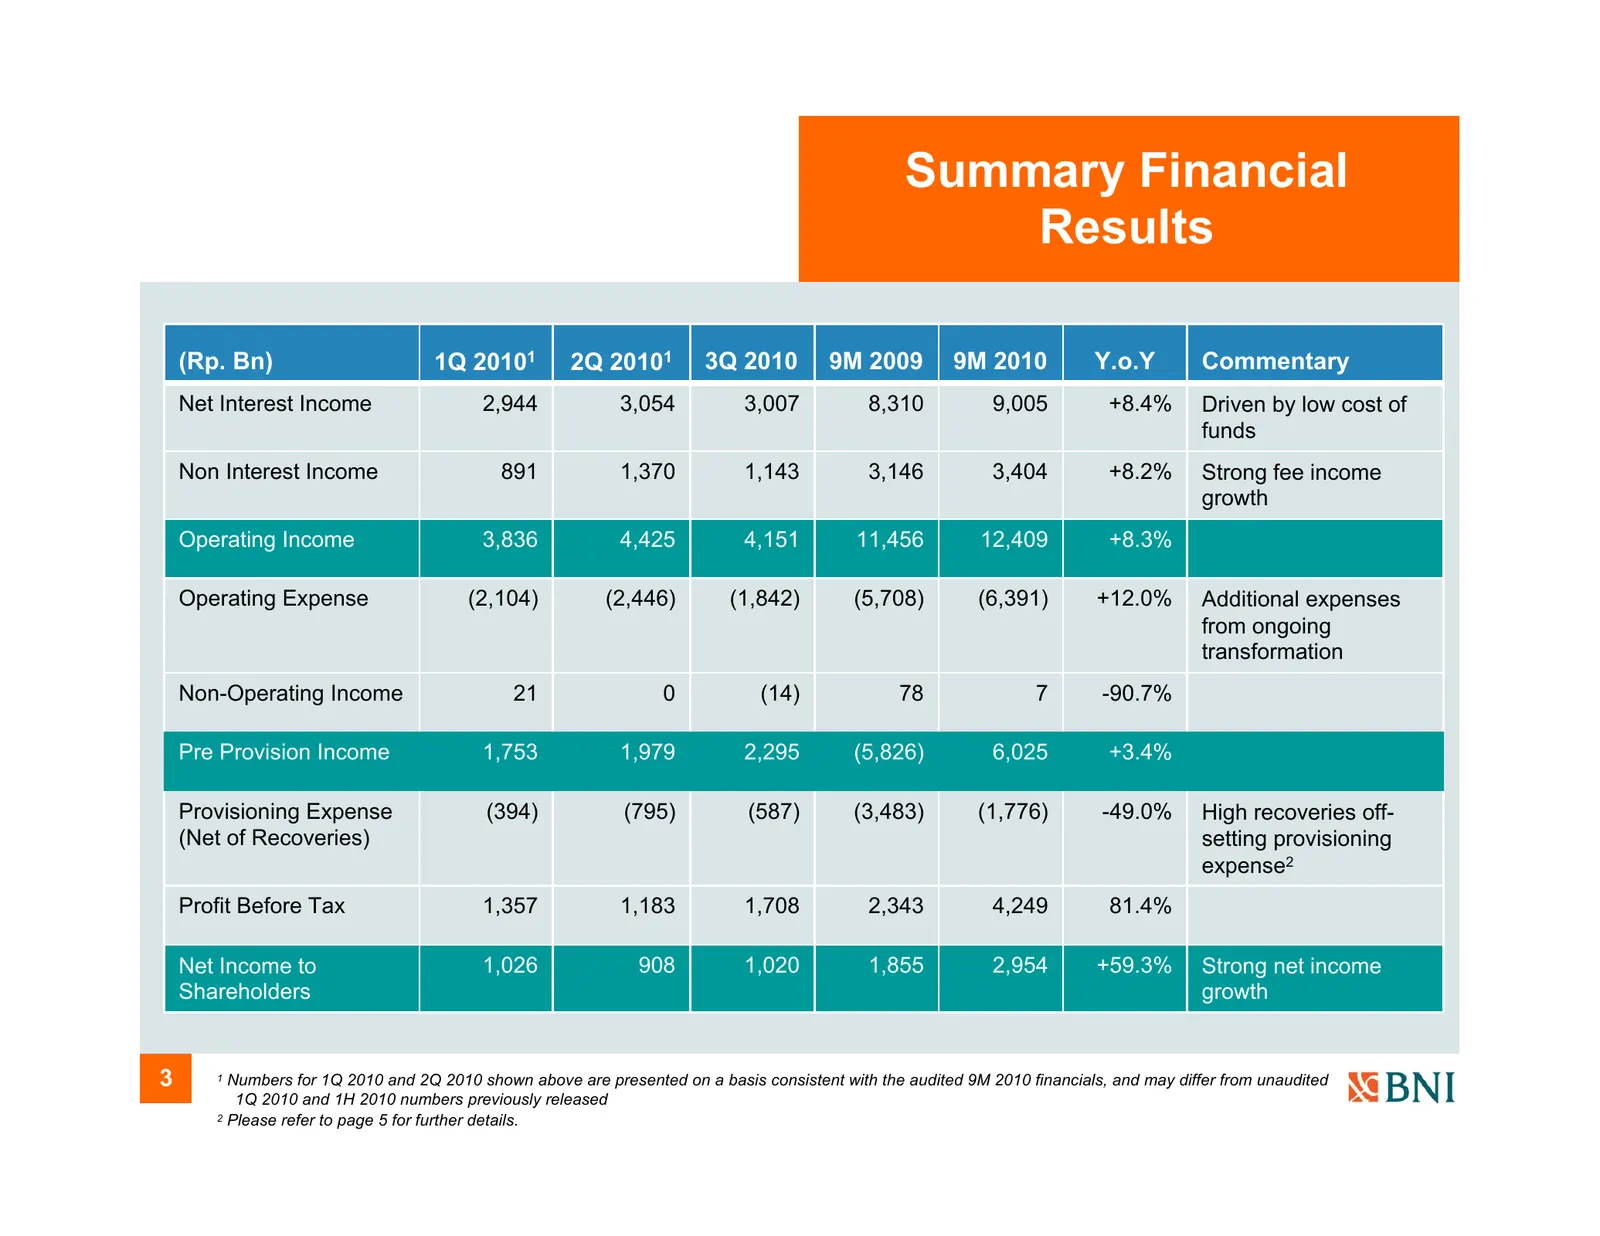
Slide 4: Summary Financial Results
Summary Financial Results (Rp. Bn) 1Q 20101 2Q 20101 3Q 2010 9M 2009 9M 2010 Y.o.Y Commentary Net Interest Income 2,944 3,054 3,007 8,310 9,005 +8.4% Driven by low cost of funds Non Interest Income 891 1,370 1,143 3,146 3,404 +8.2% Strong fee income growth Operating Income 3,836 4,425 4,151 11,456 1
Slide 5: NPL by Segment
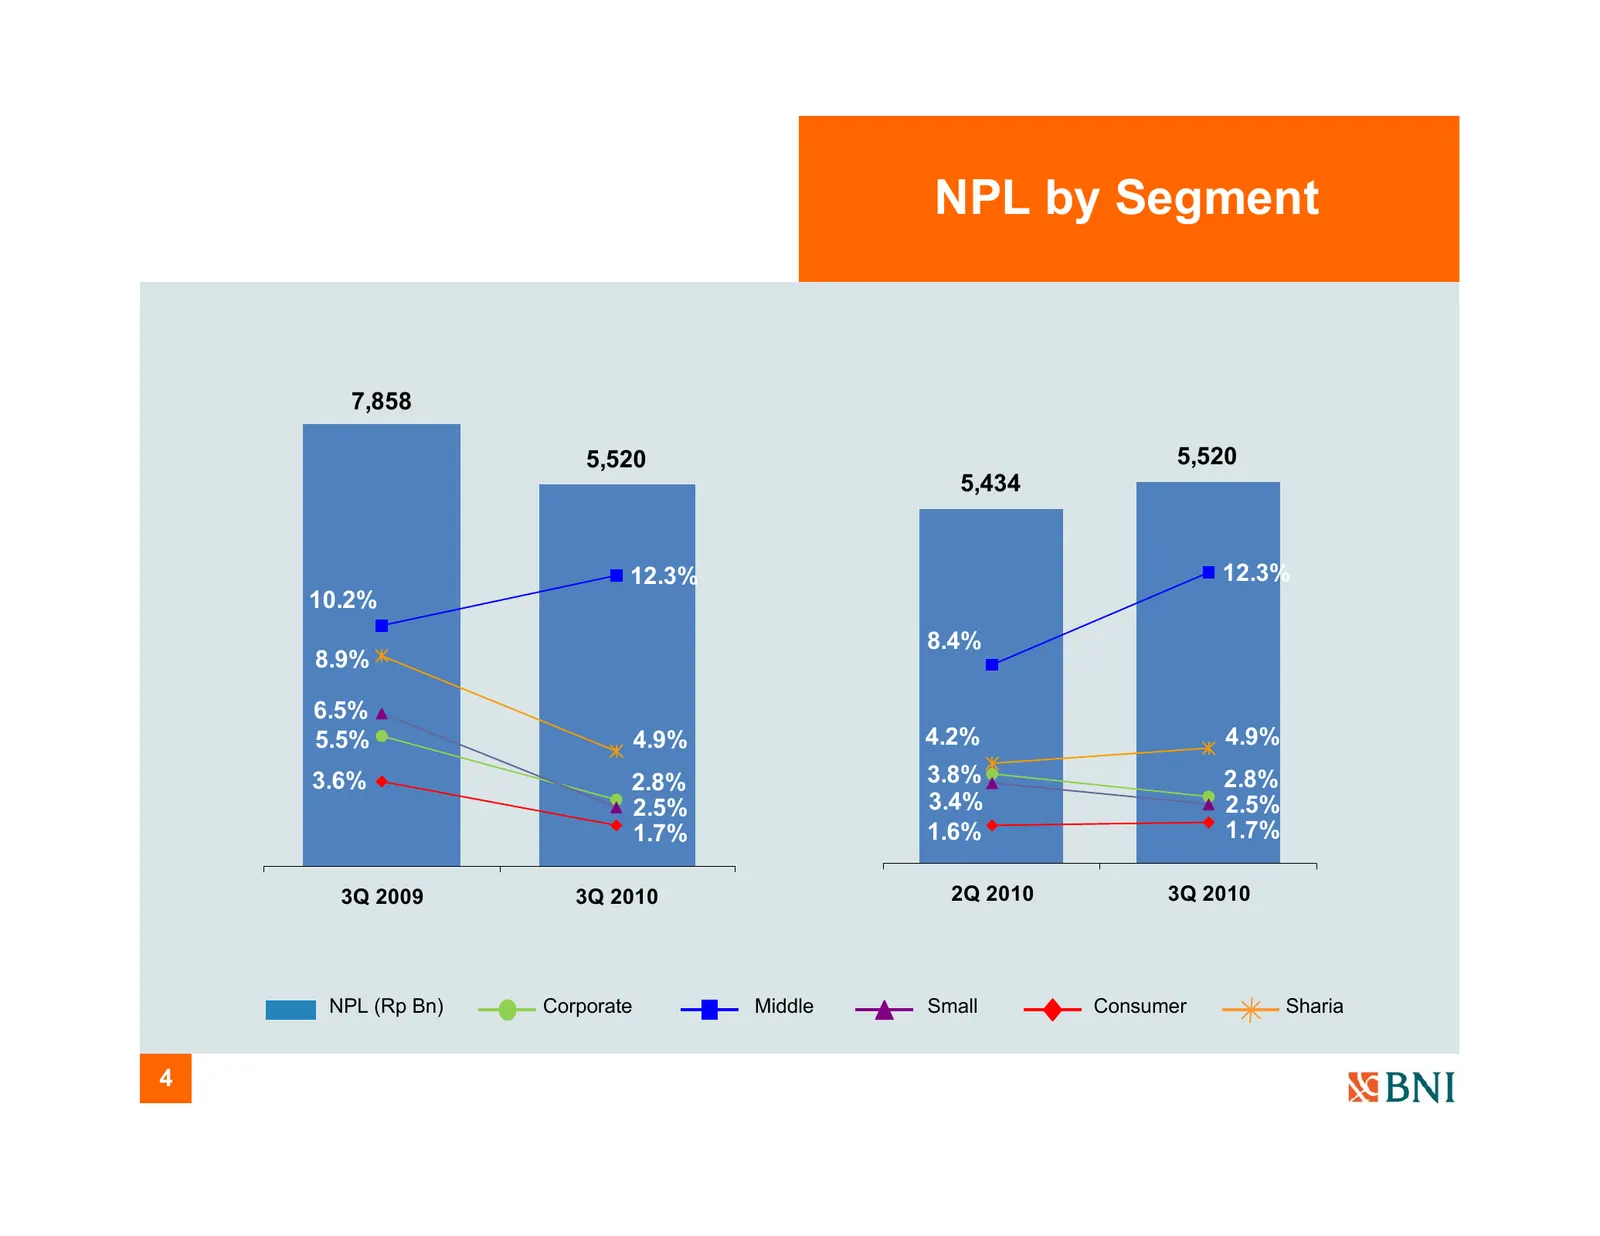
NPL by Segment 7,858 5,520 5,520 5,434 12.3% 12.3% 10.2% 8.4% 8.9% 6.5% 5.5% 4.9% 4.2% 4.9% 3.6% 2.8% 3.8% 2.8% 2.5% 3.4% 2.5% 1.7% 1.6% 1.7% 3Q 2009 3Q 2010 2Q 2010 3Q 2010 NPL (Rp Bn) Corporate Middle Small Consumer Sharia 4
Slide 6: Overview of Provisioning and NPL Trends
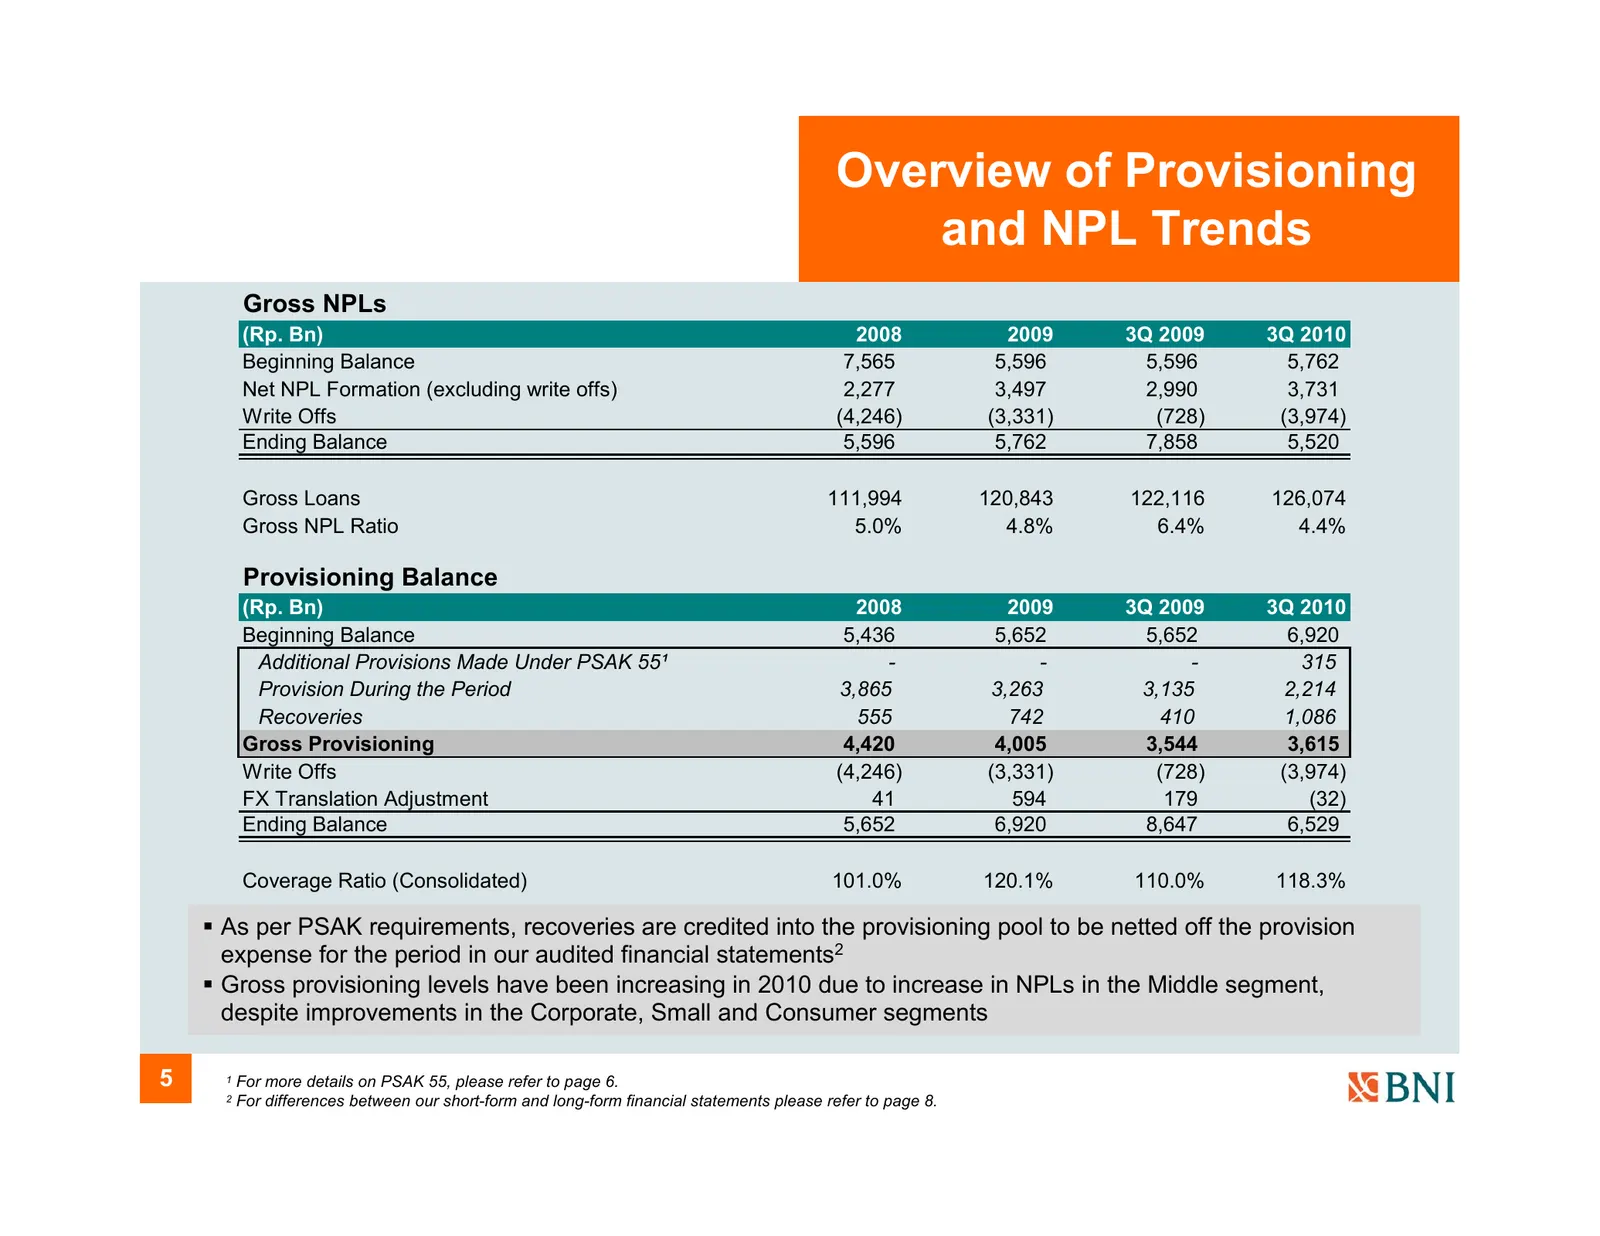
Overview of Provisioning and NPL Trends Gross NPLs (Rp. Bn) 2008 2009 3Q 2009 3Q 2010 Beginning Balance 7,565 5,596 5,596 5,762 Net NPL Formation (excluding write offs) 2,277 3,497 2,990 3,731 Write Offs (4,246) (3,331) (728) (3,974) Ending Balance 5,596 5,762 7,858 5,520 Gross Loans 111,994 120,843
Slide 7: Loan Assessment under PSAK 55
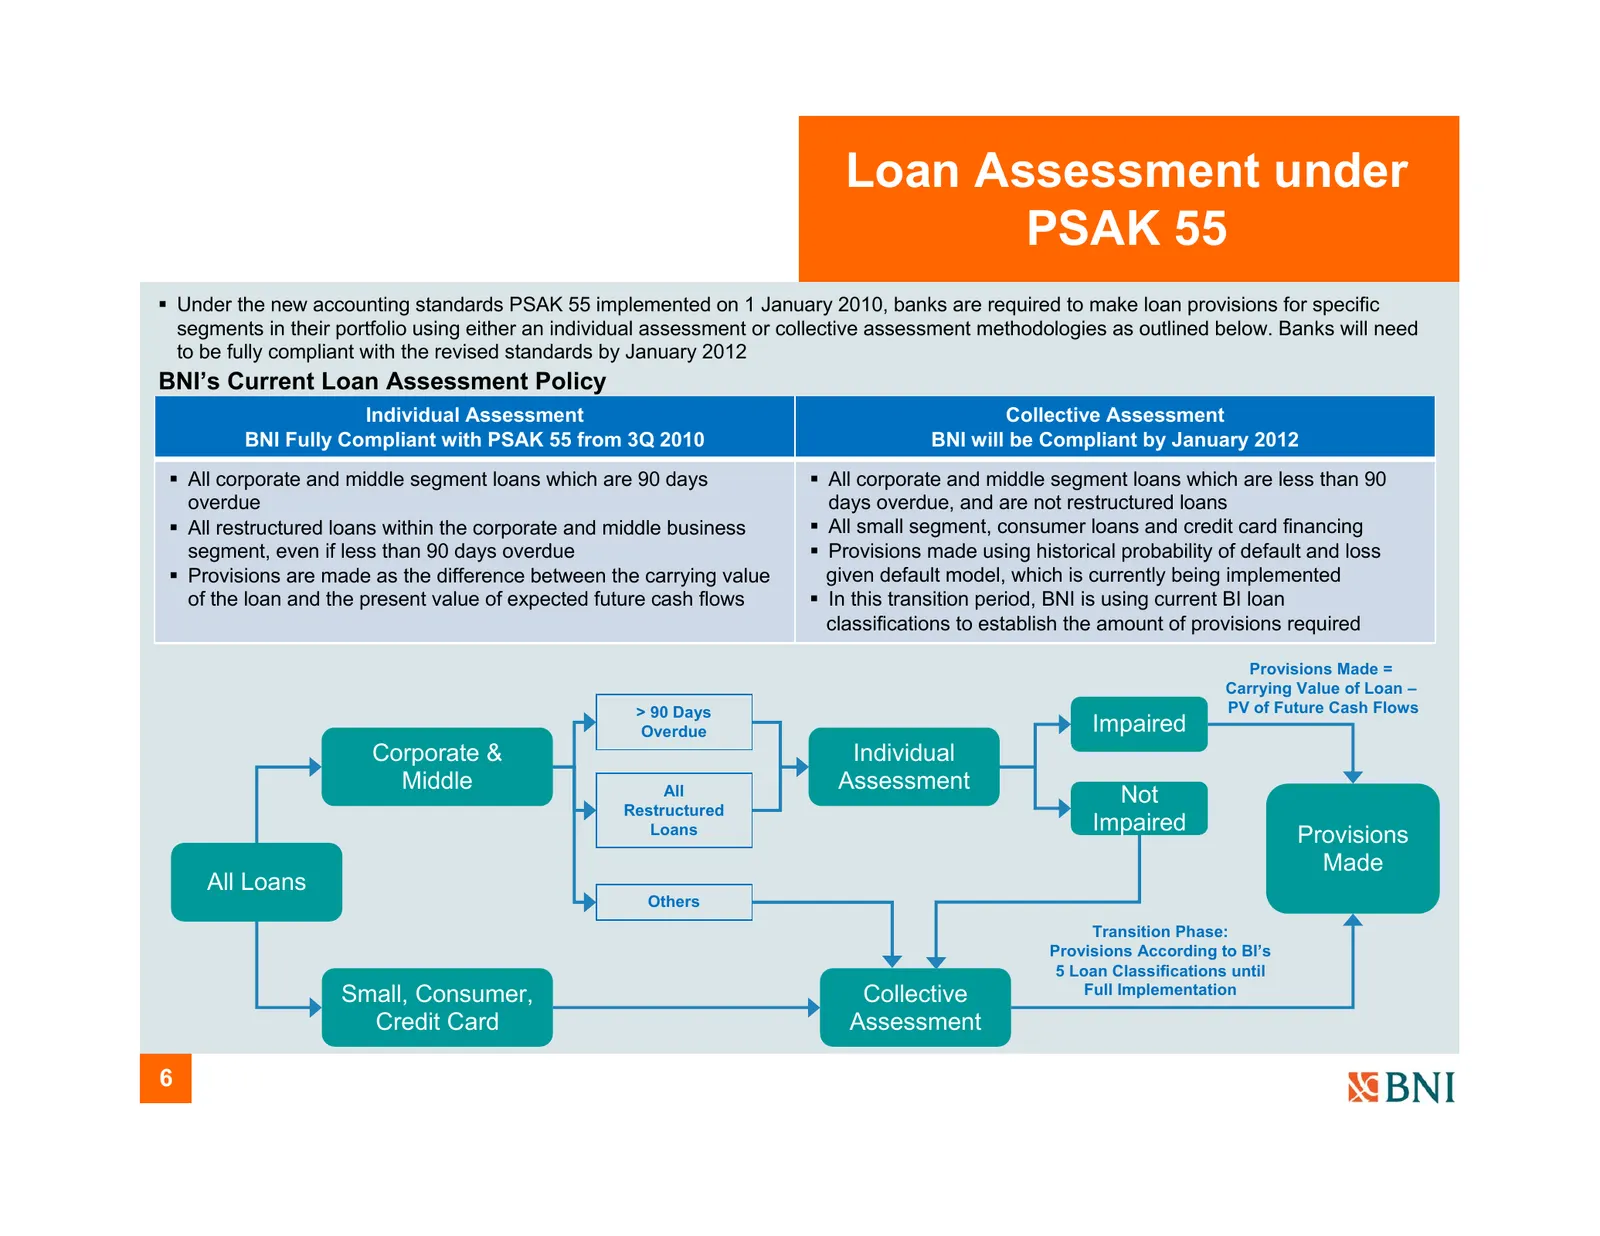
Loan Assessment under PSAK 55 Under the new accounting standards PSAK 55 implemented on 1 January 2010, banks are required to make loan provisions for specific segments in their portfolio using either an individual assessment or collective assessment methodologies as outlined below. Banks will nee
Slide 8: Loan Assessment under PSAK 55
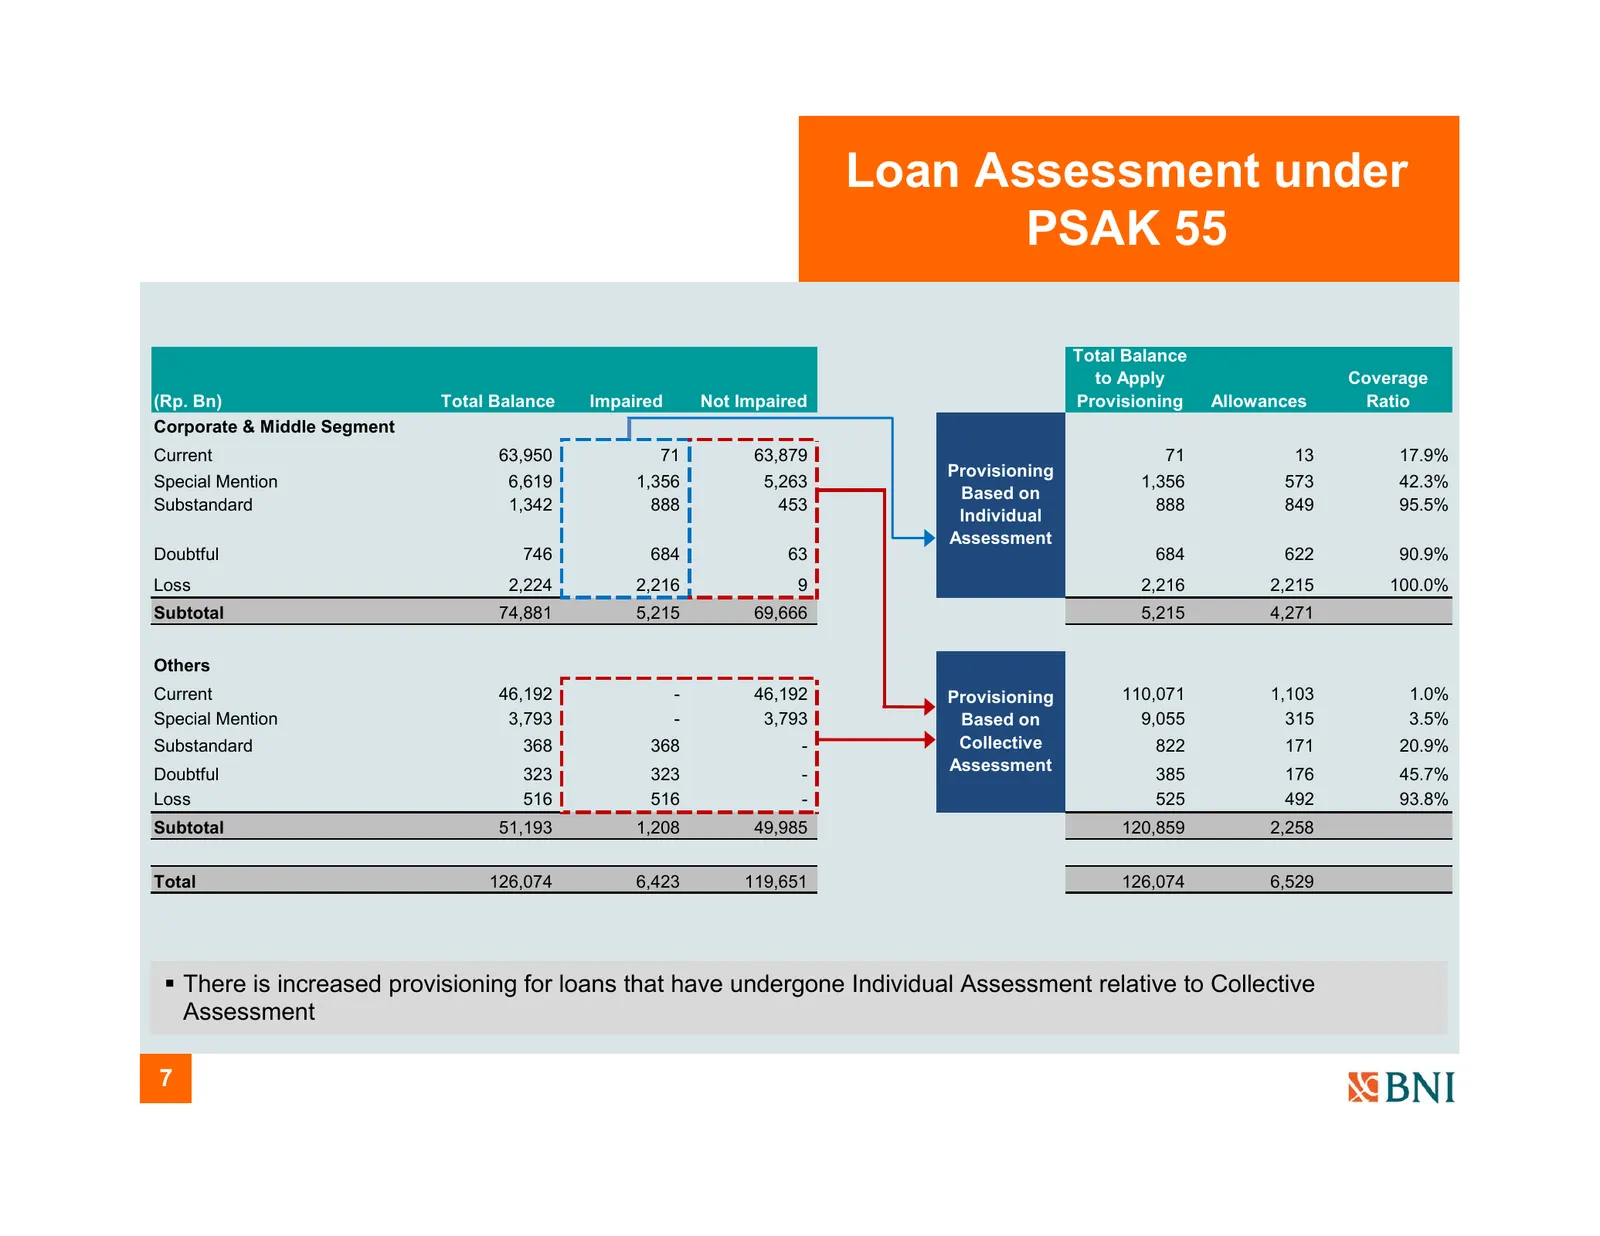
Loan Assessment under PSAK 55 Total Balance to Apply Coverage (Rp. Bn) Total Balance Impaired Not Impaired Provisioning Allowances Ratio Corporate & Middle Segment Current 63,950 71 63,879 71 13 17.9% Provisioning Special Mention 6,619 1,356 5,263 1,356 573 42.3% Based on Substandard 1,342 888 453 8
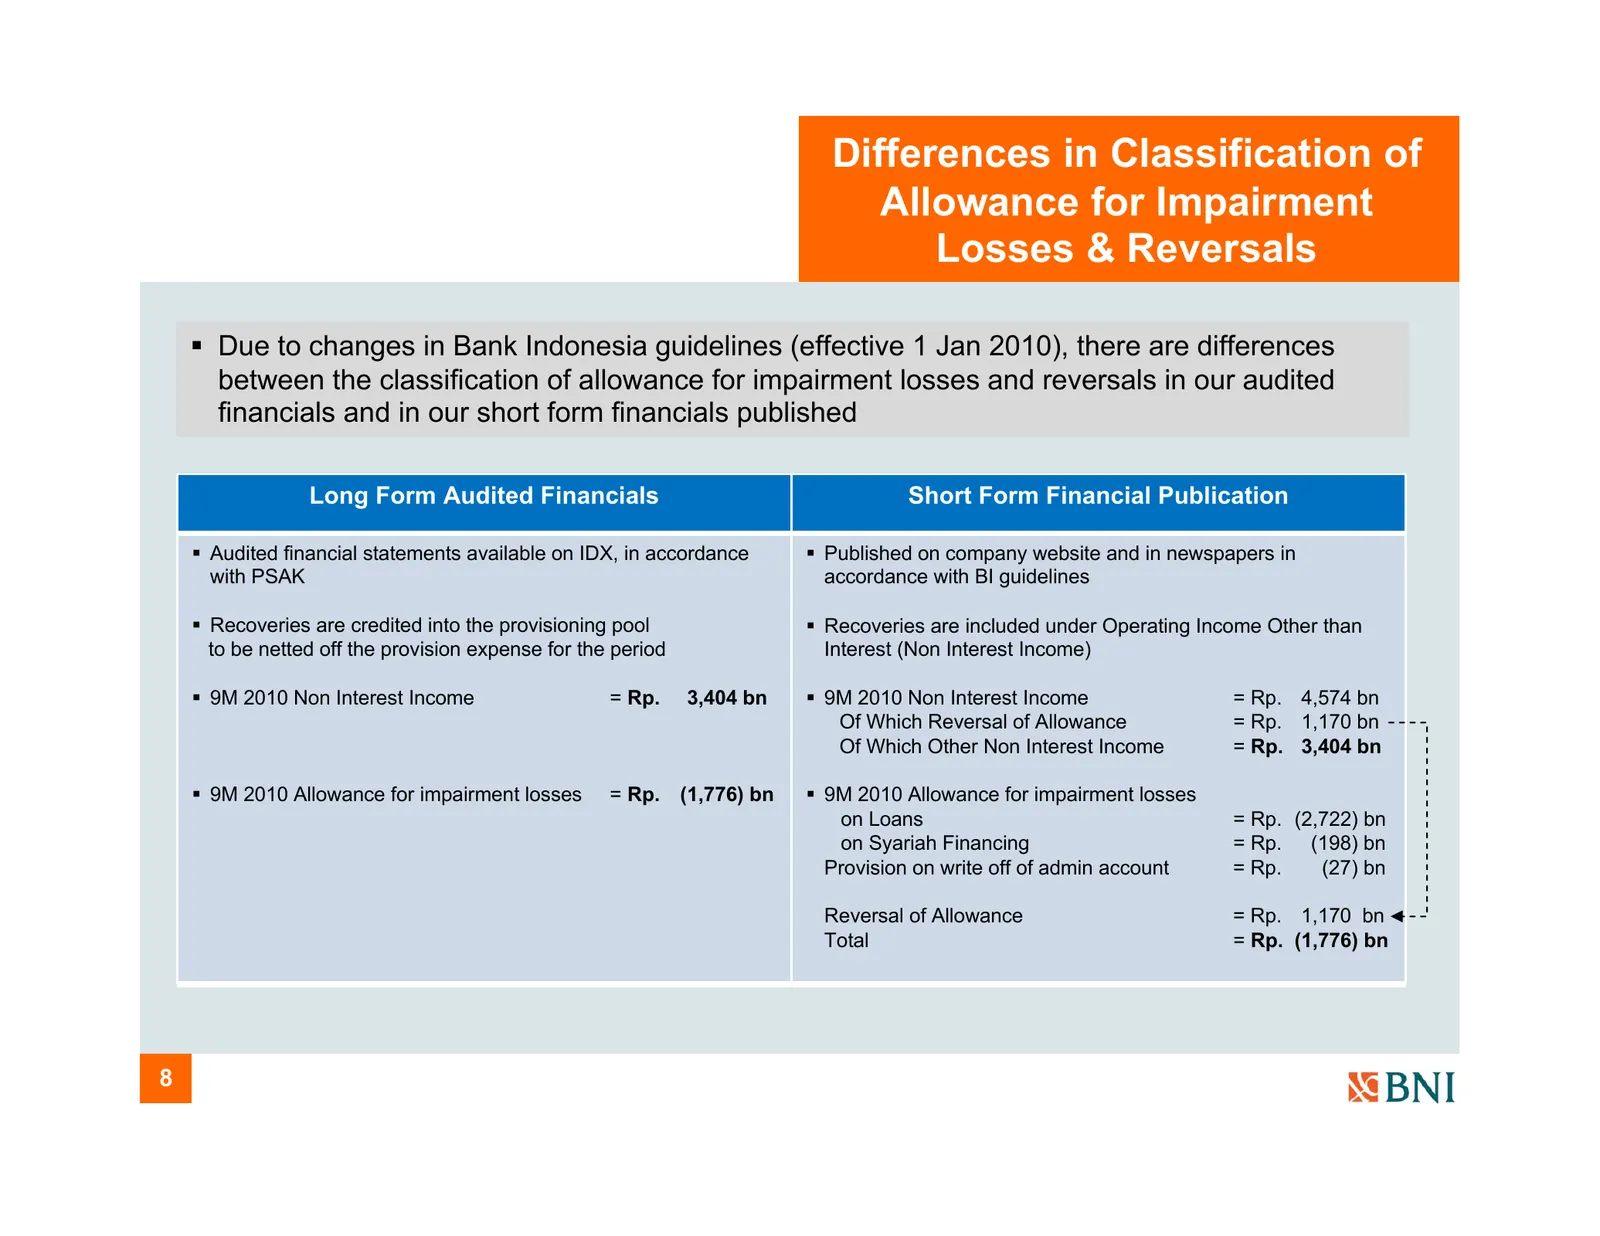
Slide 9: Differences in Classification of Allowance for Impairment Losses & Reversals
Differences in Classification of Allowance for Impairment Losses & Reversals Due to changes in Bank Indonesia guidelines (effective 1 Jan 2010), there are differences between the classification of allowance for impairment losses and reversals in our audited financials and in our short form financi
Source: Internet Archive copy of bni.co.id
More decks from PT Bank Negara Indonesia (Persero) Tbk Class B
 Q1 2025 Earnings Presentation68 slides · Apr 28, 2025
 FY2024 Earnings Presentation71 slides · Jan 22, 2025
 Q1 2024 Earnings Presentation72 slides · Apr 29, 2024
 Q3 2023 Earnings Presentation74 slides · Oct 31, 2023
 Q1 2023 Earnings Presentation69 slides · May 18, 2023
 FY2022 Earnings Presentation69 slides · Jan 24, 2023