Royalty Pharma plc · NASDAQ:RPRX
Royalty Pharma — Investor Presentation (January 2024)
60 slides from Royalty Pharma's investor presentation, January 2024
Slide 1: Royalty Pharma
ROYALTY PHARMA
Slide 2: Corporate Presentation January 2024
Corporate Presentation January 2024
Slide 3: Forward looking statements & non-GAAP financial information
Forward looking statements & non-GAAP financial information This presentation has been prepared by Royalty Pharma plc (the “Company”), is made for informational purposes only and does not constitute an offer to sell or a solicitation of an offer to buy securities. The information set forth herein do
Slide 4: Our vision Our mission
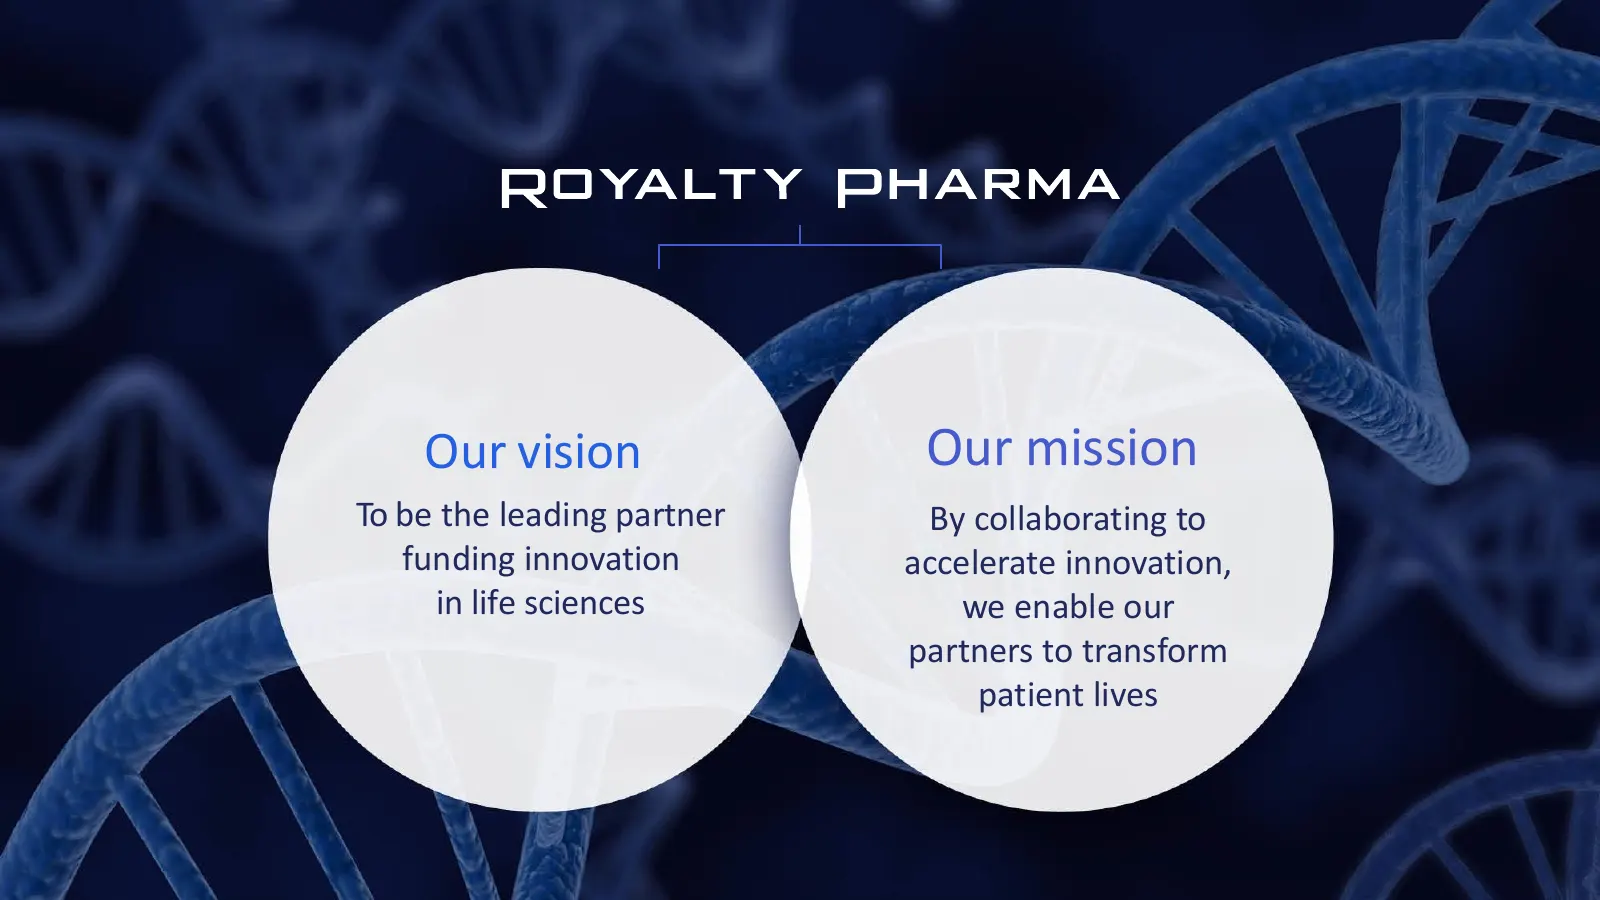
Our vision Our mission To be the leading partner By collaborating to funding innovation accelerate innovation, in life sciences we enable our partners to transform patient lives 4
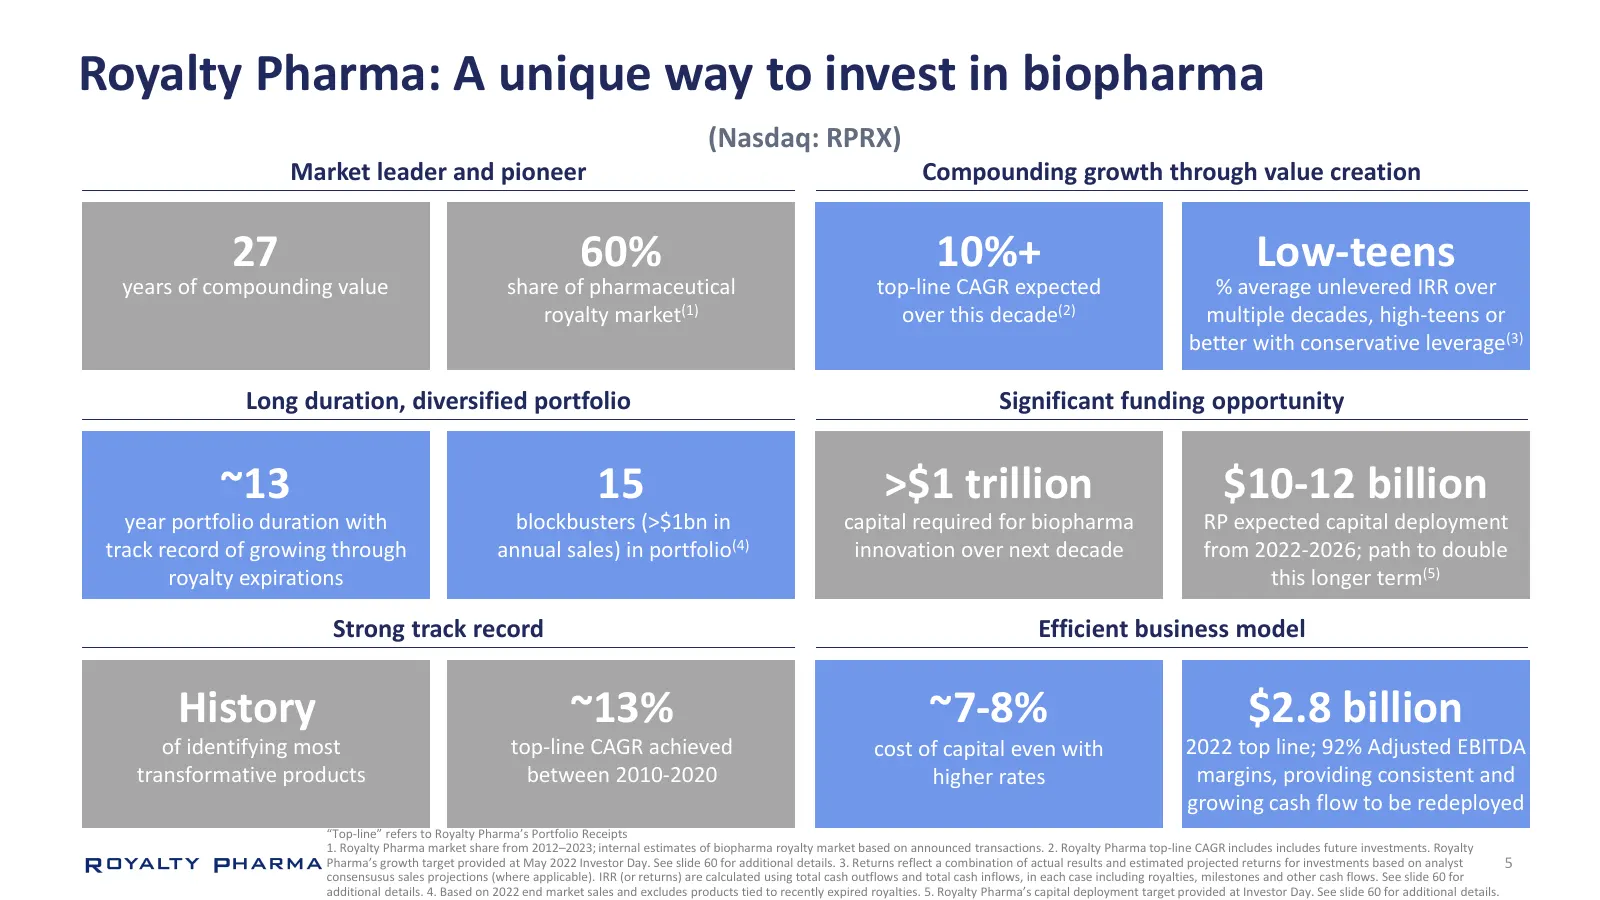
Slide 5: Royalty Pharma: A unique way to invest in biopharma
Royalty Pharma: A unique way to invest in biopharma (Nasdaq: RPRX) Market leader and pioneer Compounding growth through value creation 27 60% 10%+ Low-teens years of compounding value share of pharmaceutical top-line CAGR expected % average unlevered IRR over royalty market(1) over this decade(2) mu
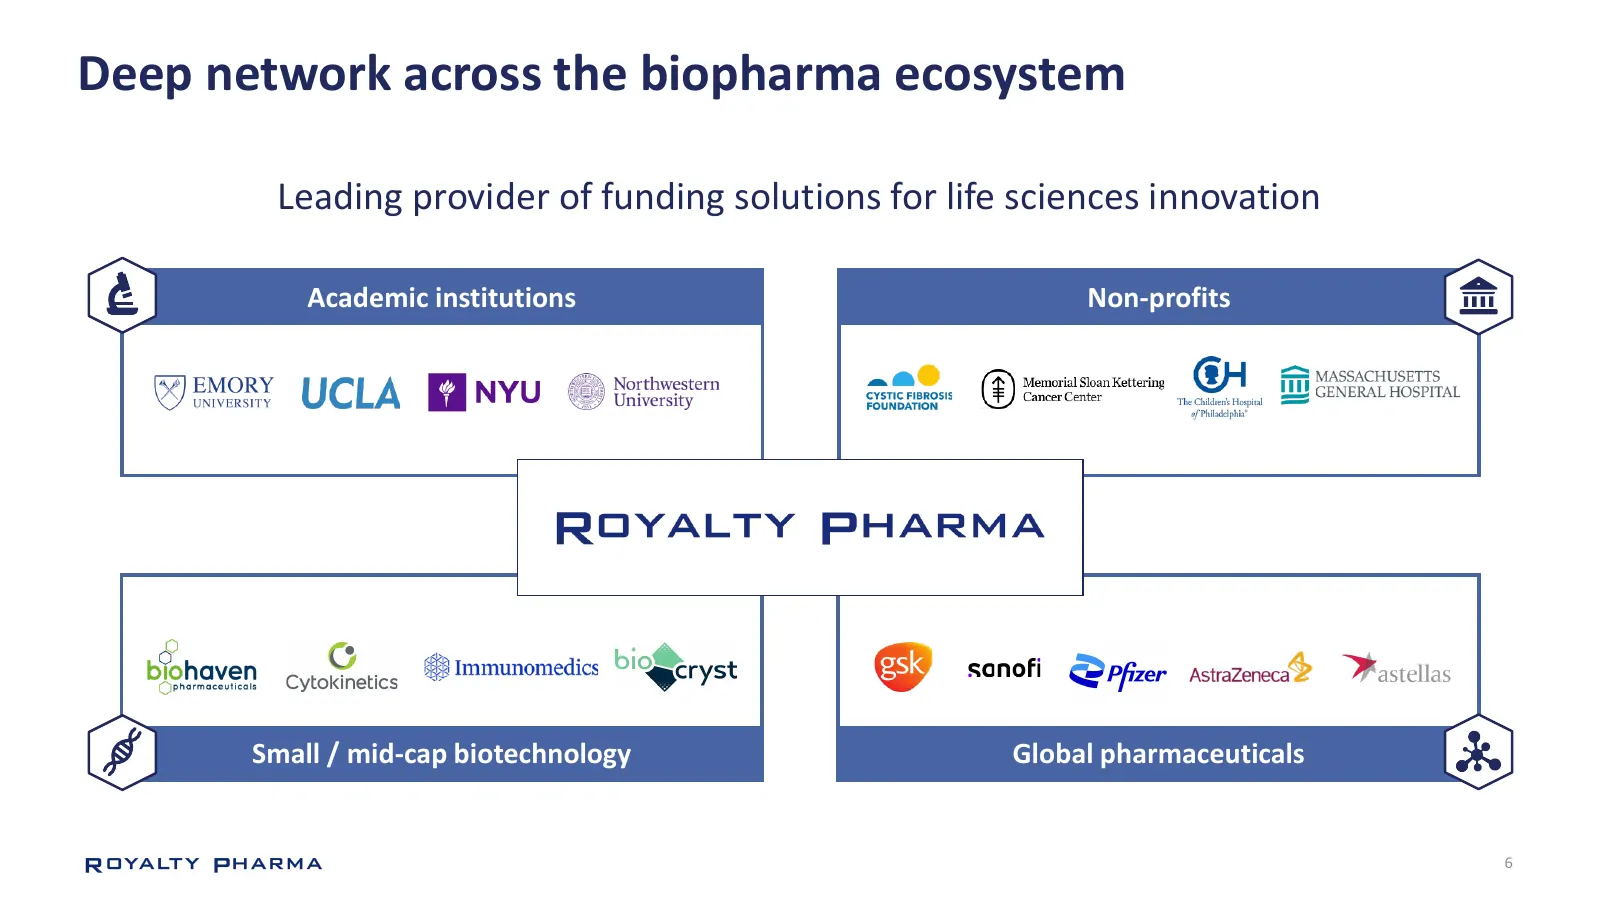
Slide 6: Deep network across the biopharma ecosystem
Deep network across the biopharma ecosystem Leading provider of funding solutions for life sciences innovation Academic institutions Non-profits Small / mid-cap biotechnology Global pharmaceuticals 6
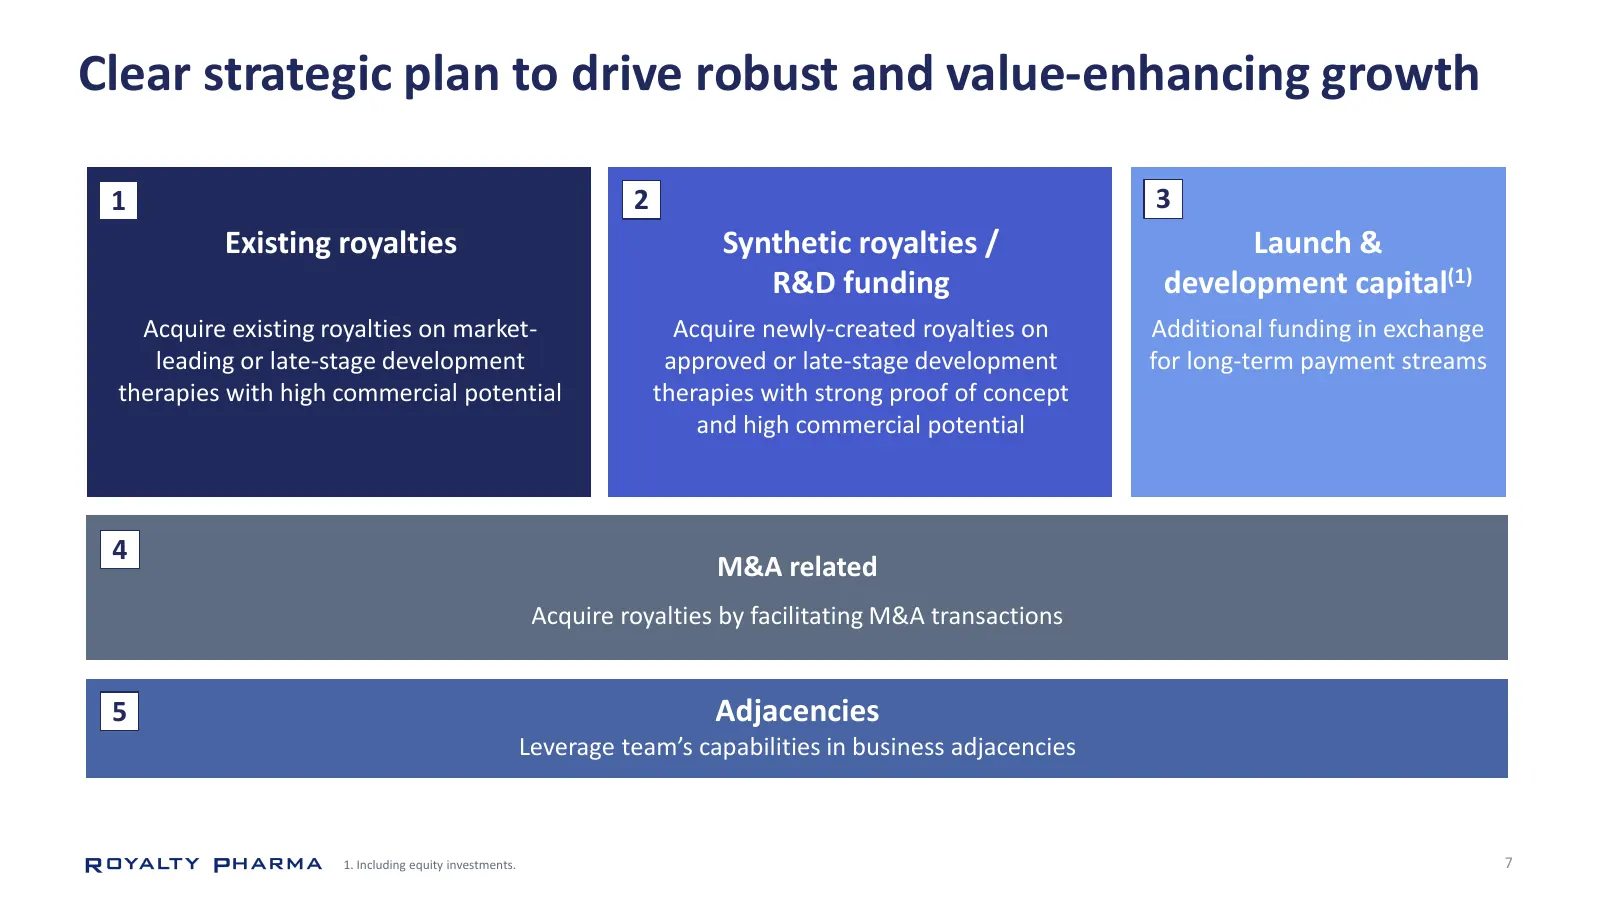
Slide 7: Clear strategic plan to drive robust and value-enhancing growth
Clear strategic plan to drive robust and value-enhancing growth 1 2 3 Existing royalties Synthetic royalties / Launch & R&D funding development capital(1) Acquire existing royalties on market- Acquire newly-created royalties on Additional funding in exchange leading or late-stage development approve
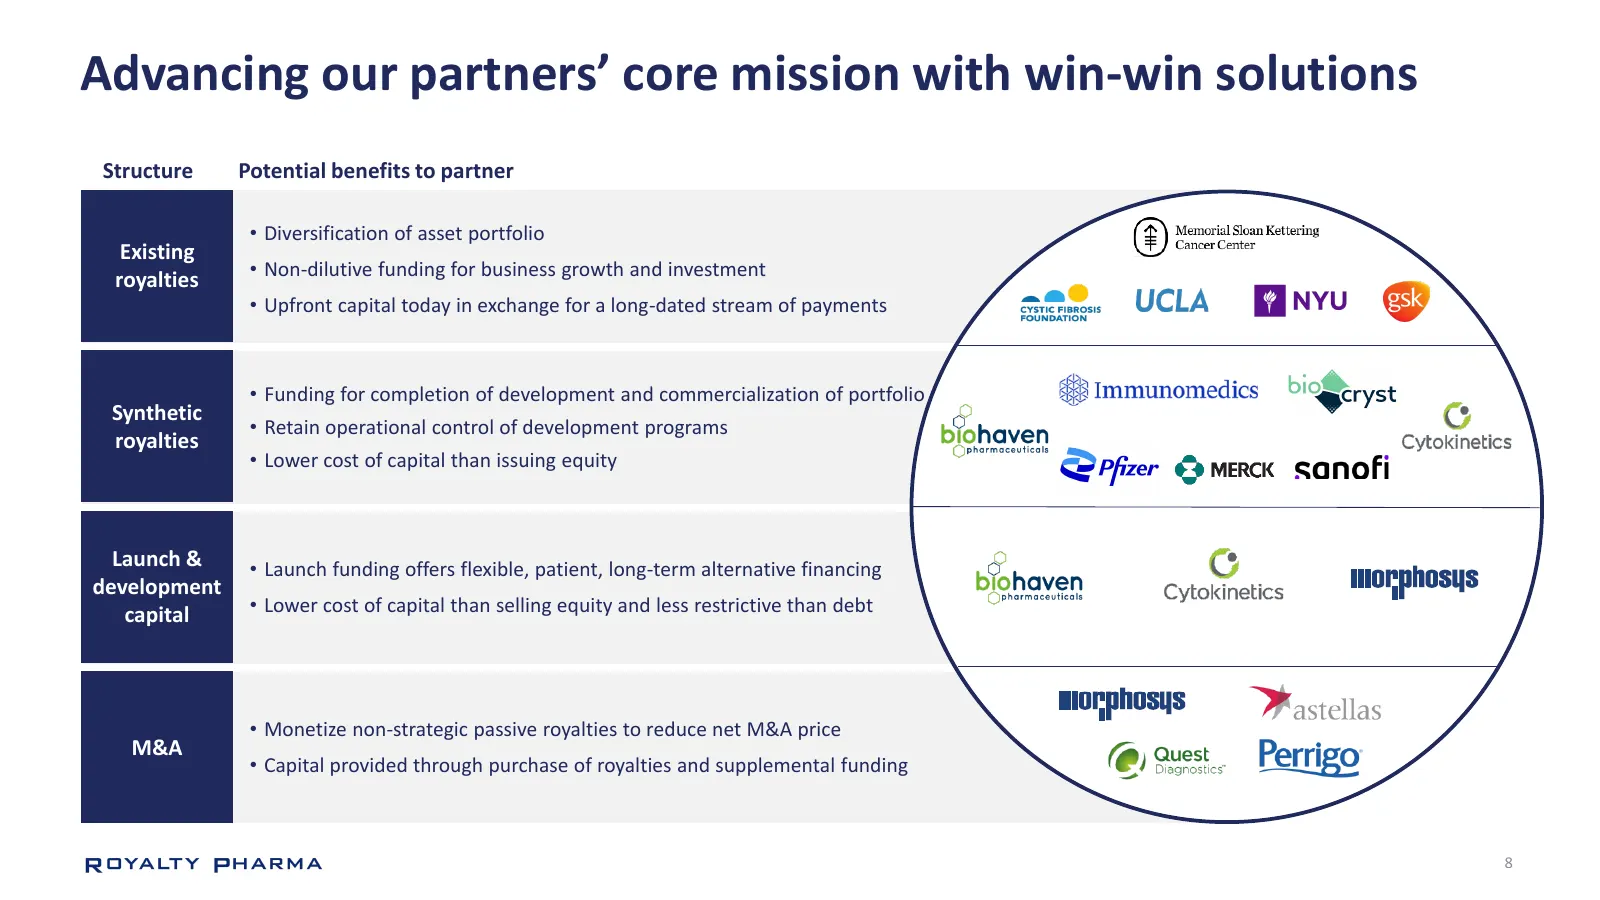
Slide 8: Advancing our partners' core mission with win-win solutions
Advancing our partners’ core mission with win-win solutions Structure Potential benefits to partner • Diversification of asset portfolio Existing • Non-dilutive funding for business growth and investment royalties • Upfront capital today in exchange for a long-dated stream of payments • Funding for
Slide 9: Simple and efficient business model focused on cash flow
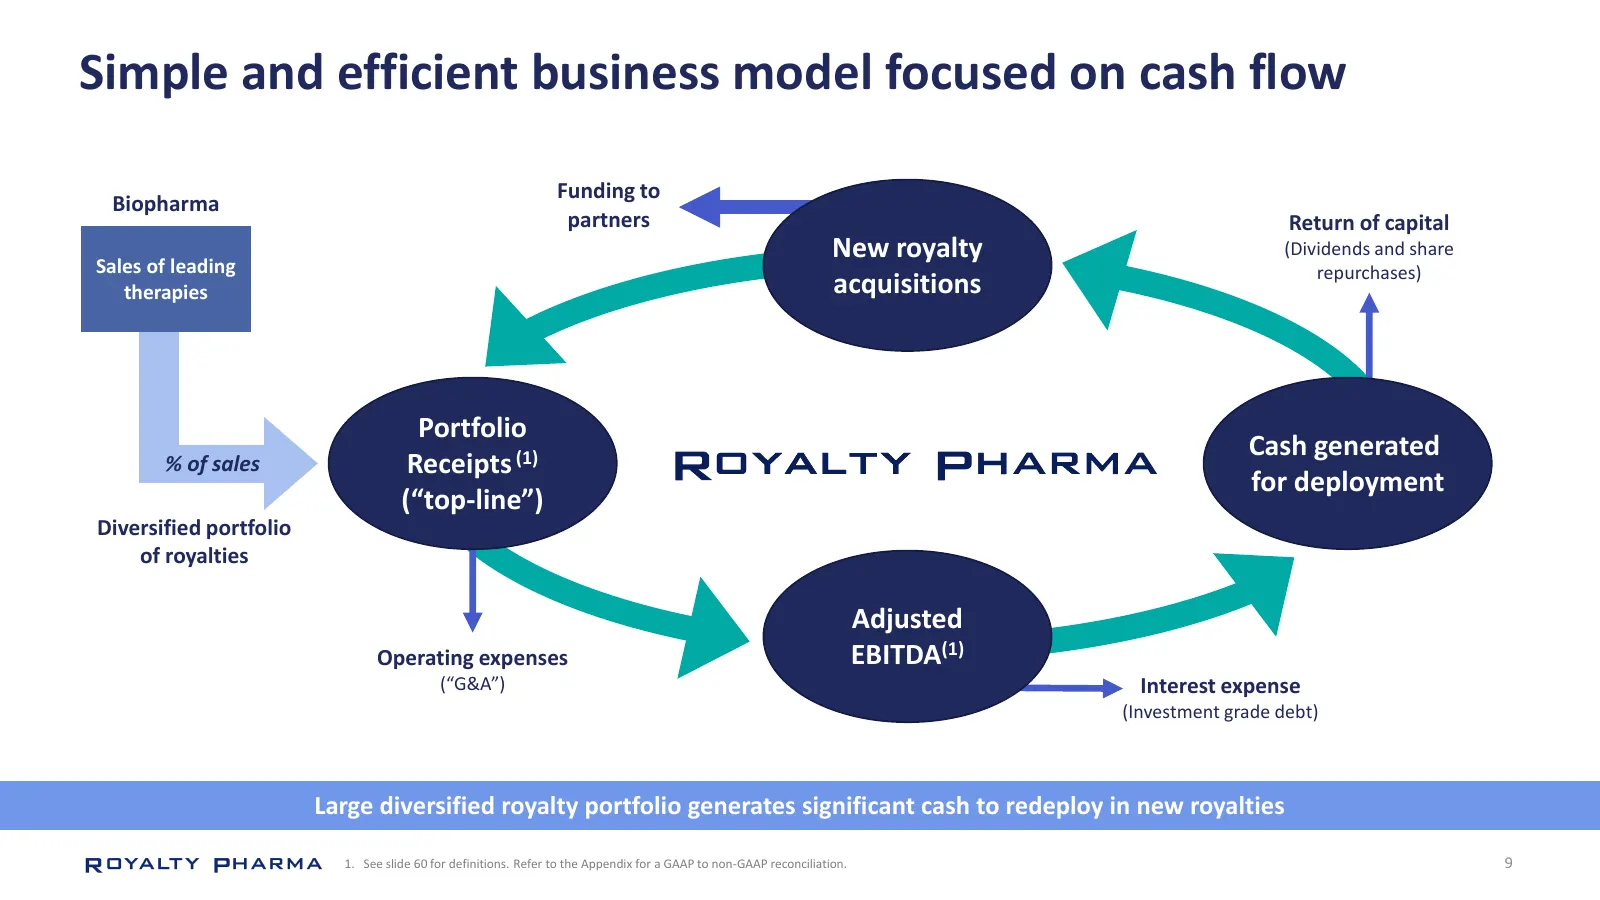
Simple and efficient business model focused on cash flow Funding to Biopharma partners Return of capital New royalty (Dividends and share Sales of leading repurchases) therapies acquisitions Portfolio Cash generated % of sales Receipts (1) for deployment (“top-line”) Diversified portfolio of royalti
Slide 10: Track record of delivering strong growth
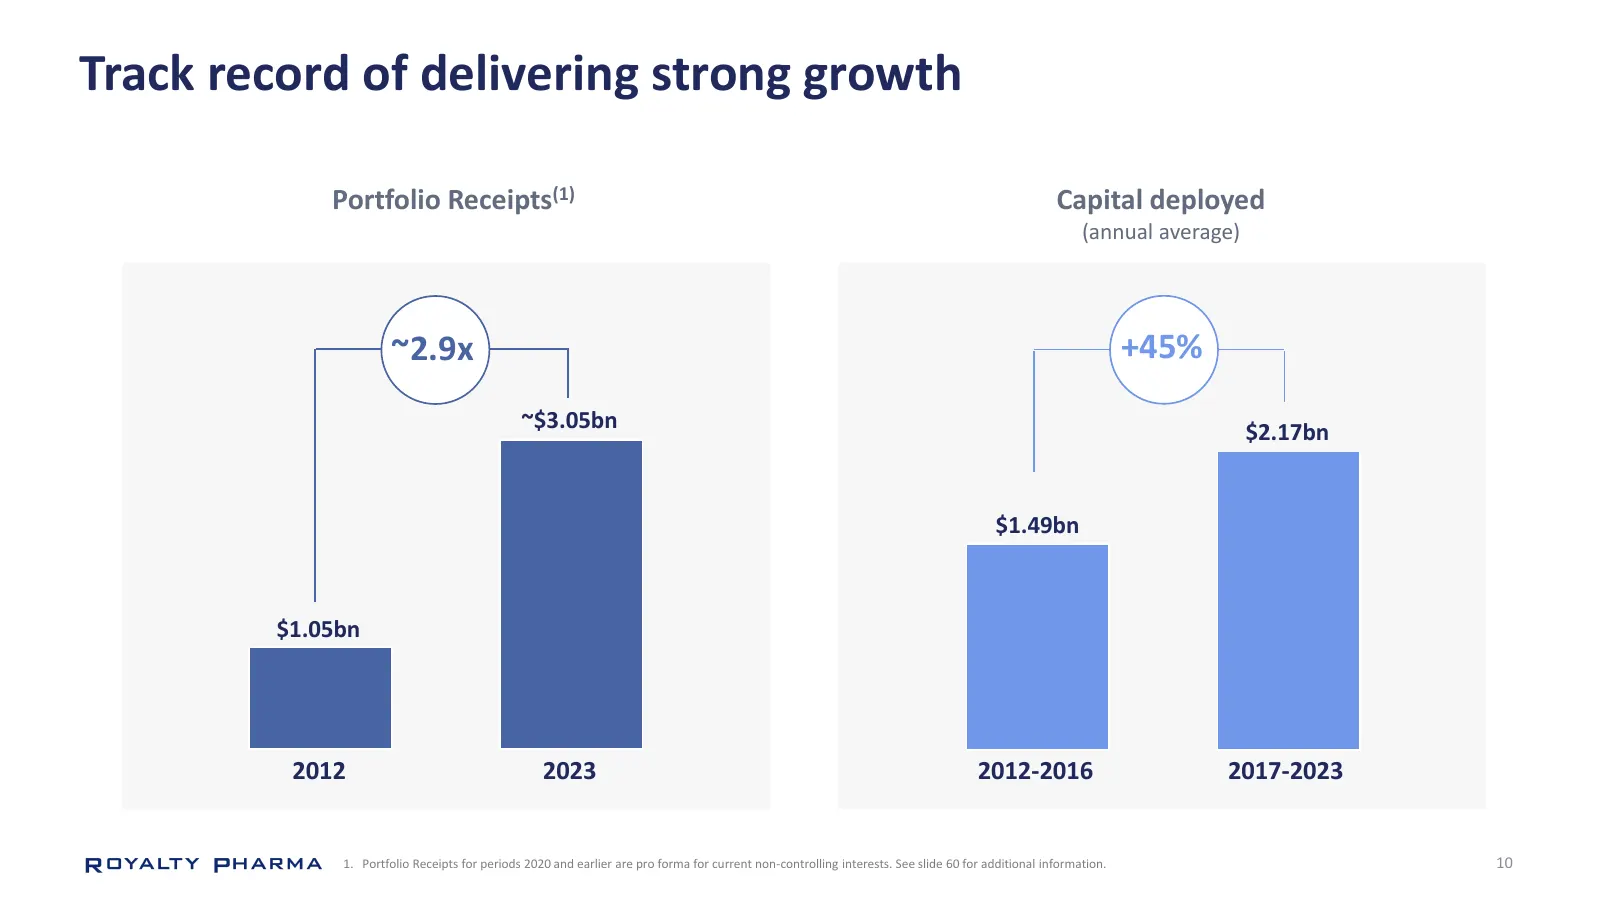
Track record of delivering strong growth Portfolio Receipts(1) Capital deployed (annual average) ~2.9x +45% ~$3.05bn $2.17bn $1.49bn $1.05bn 2012 2023 2012-2016 2017-2023 1. Portfolio Receipts for periods 2020 and earlier are pro forma for current non-controlling interests. See slide 60 for addition
Slide 11: Innovative business model supports biopharma ecosystem
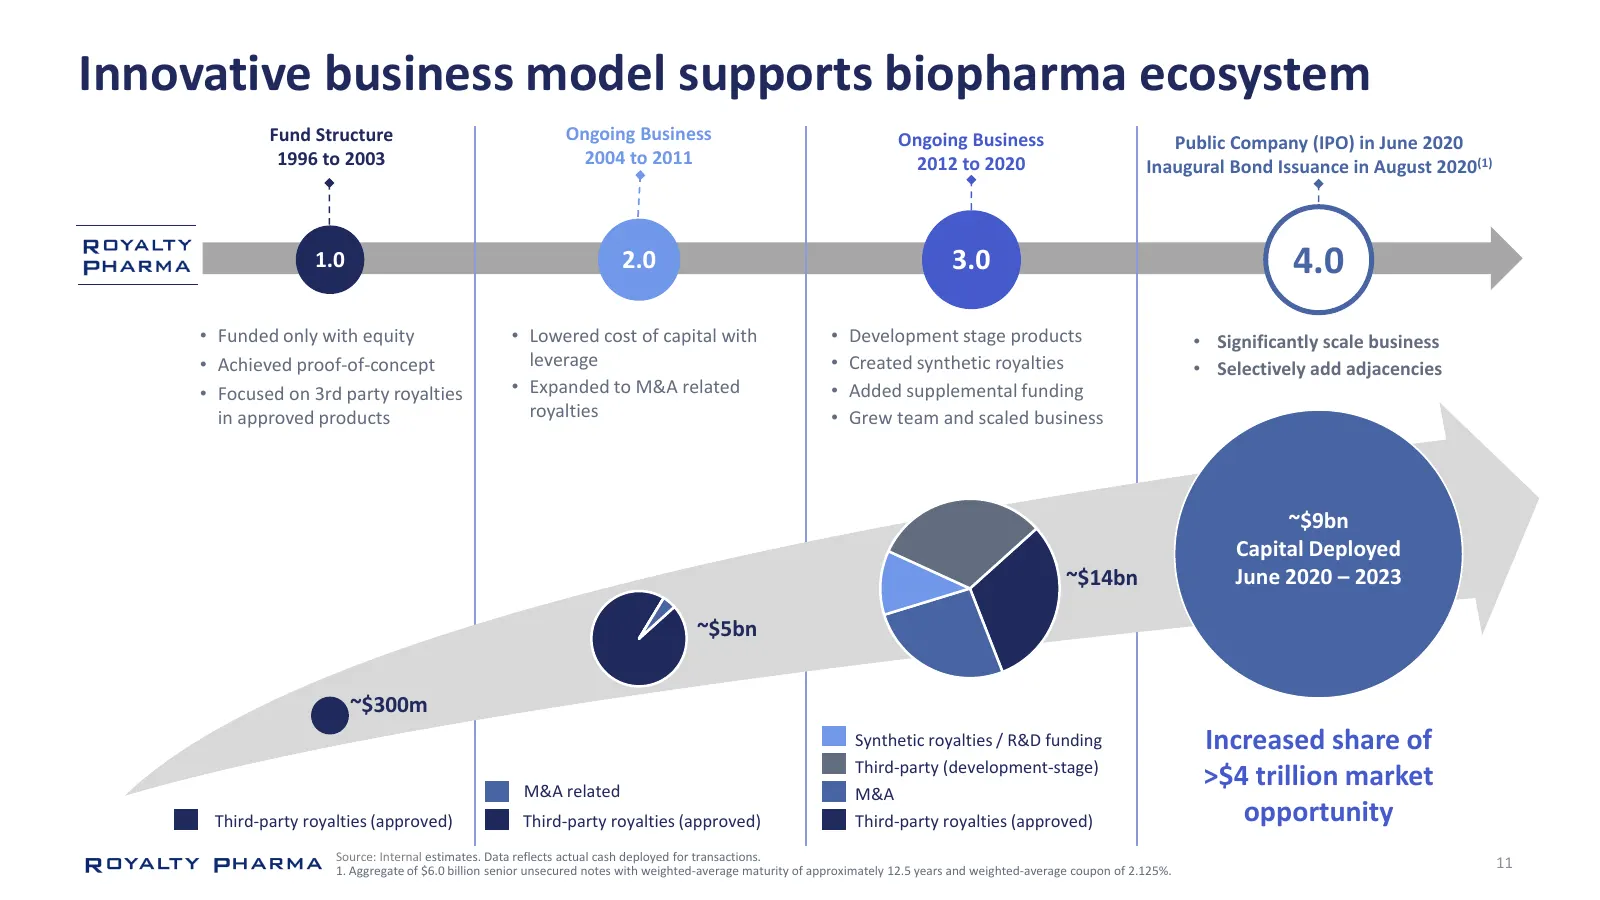
Innovative business model supports biopharma ecosystem Fund Structure Ongoing Business Ongoing Business Public Company (IPO) in June 2020 1996 to 2003 2004 to 2011 2012 to 2020 Inaugural Bond Issuance in August 2020(1) 1.0 2.0 3.0 4.0 • Funded only with equity • Lowered cost of capital with • Develo
Slide 12: Strong competitive moat in biopharma royalty funding
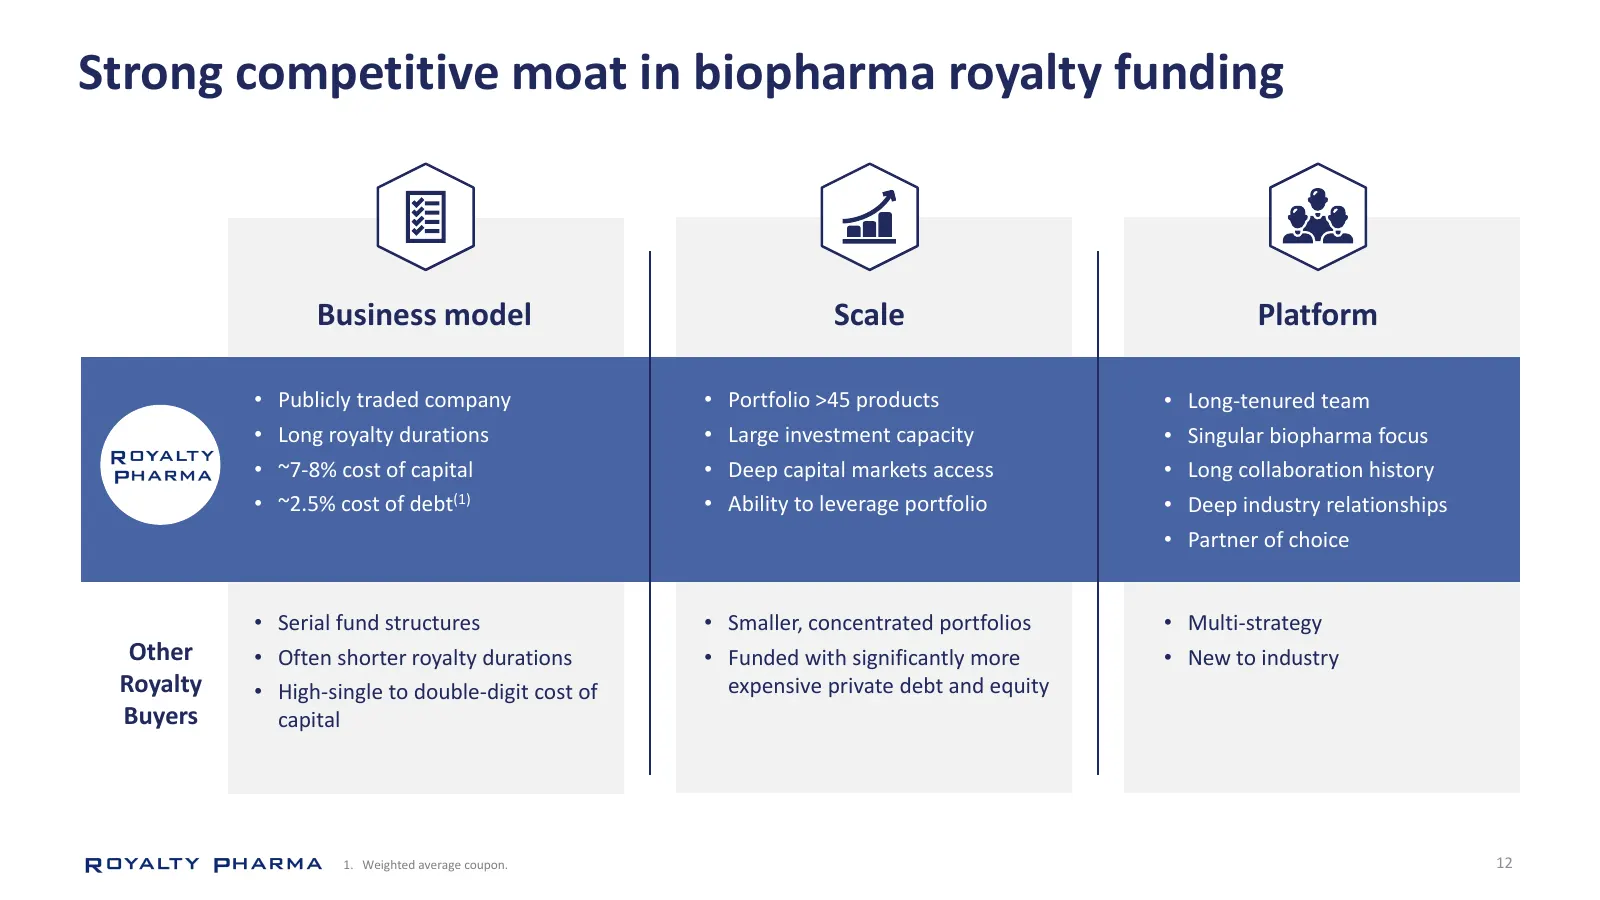
Strong competitive moat in biopharma royalty funding Business model Scale Platform • Publicly traded company • Portfolio >45 products • Long-tenured team • Long royalty durations • Large investment capacity • Singular biopharma focus • ~7-8% cost of capital • Deep capital markets access • Long colla
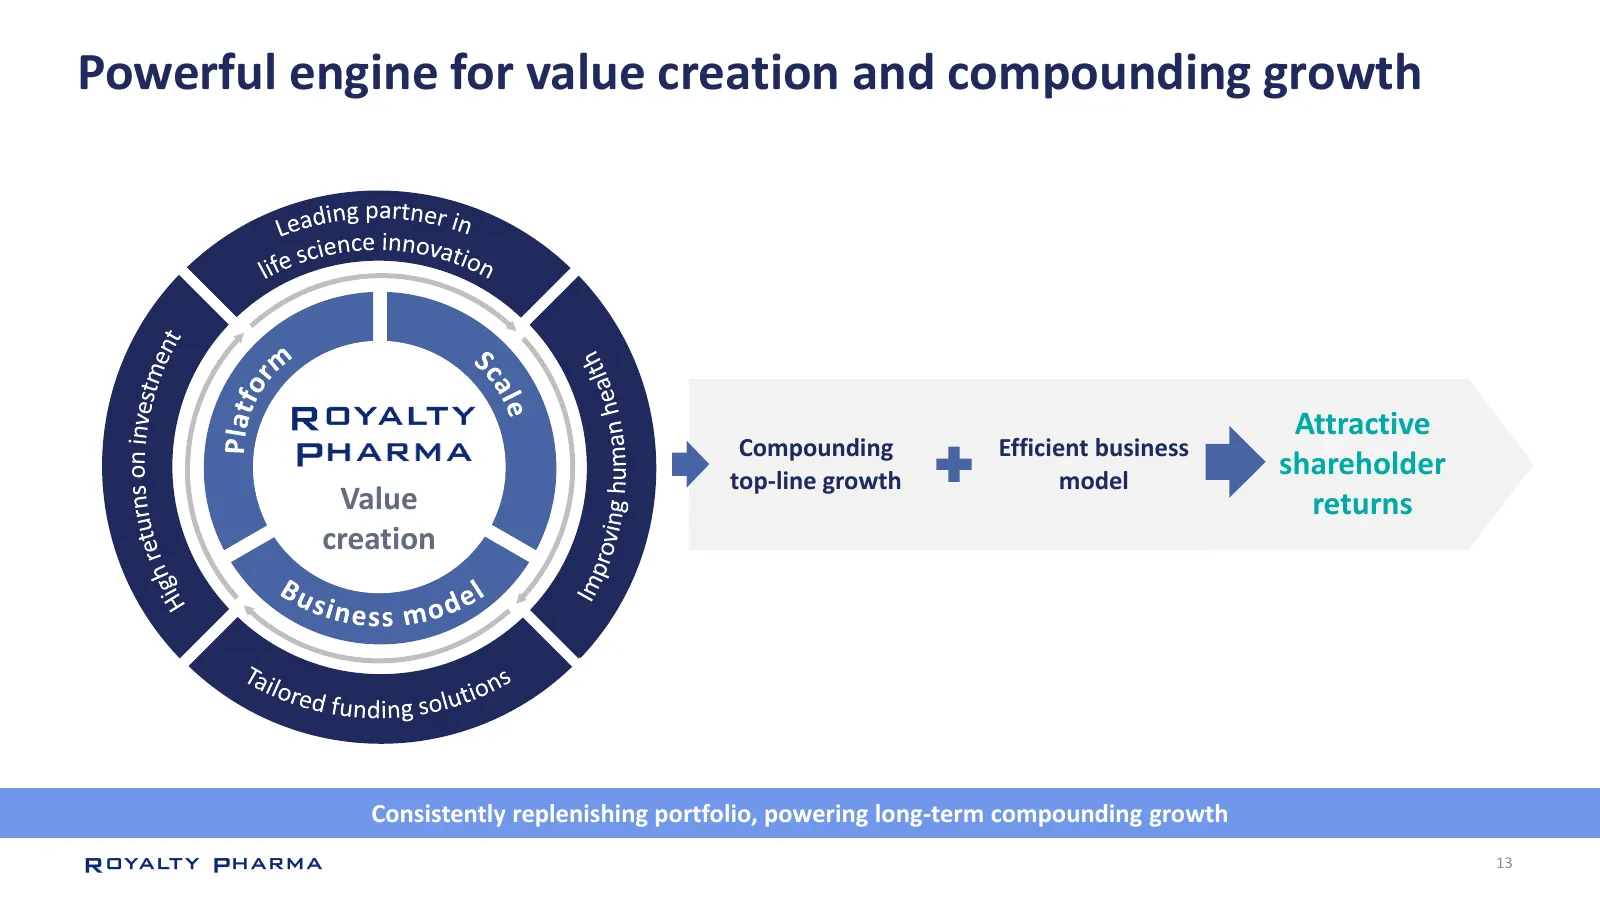
Slide 13: Powerful engine for value creation and compounding growth
Powerful engine for value creation and compounding growth ing partne Lead e in r in e scienc novation lif nt S lt h m turns on investme ca r g human hea P l at fo le Attractive Compounding Efficient business top-line growth model shareholder Value returns rovin creation h re Bu Imp Hig siness model
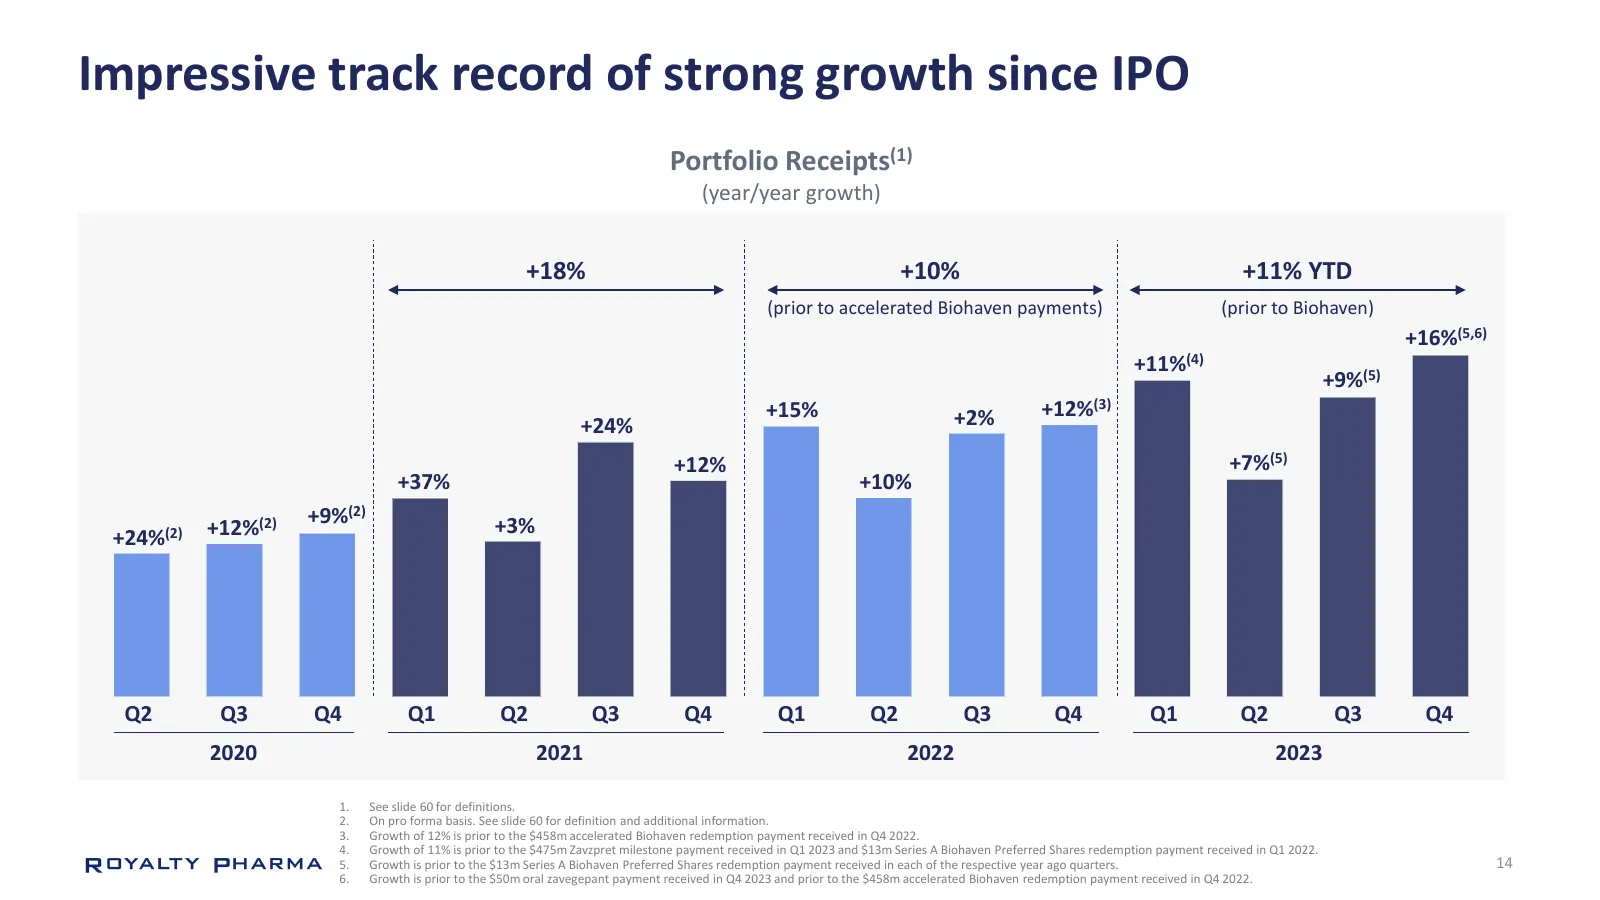
Slide 14: Impressive track record of strong growth since IPO
Impressive track record of strong growth since IPO Portfolio Receipts(1) (year/year growth) +18% +10% +11% YTD (prior to accelerated Biohaven payments) (prior to Biohaven) +16%(5,6) +11%(4) +9%(5) +15% +2% +12%(3) +24% +12% +7%(5) +37% +10% +9%(2) +3% +24%(2) +12%(2) Q2 Q3 Q4 Q1 Q2 Q3 Q4 Q1 Q2 Q3 Q4
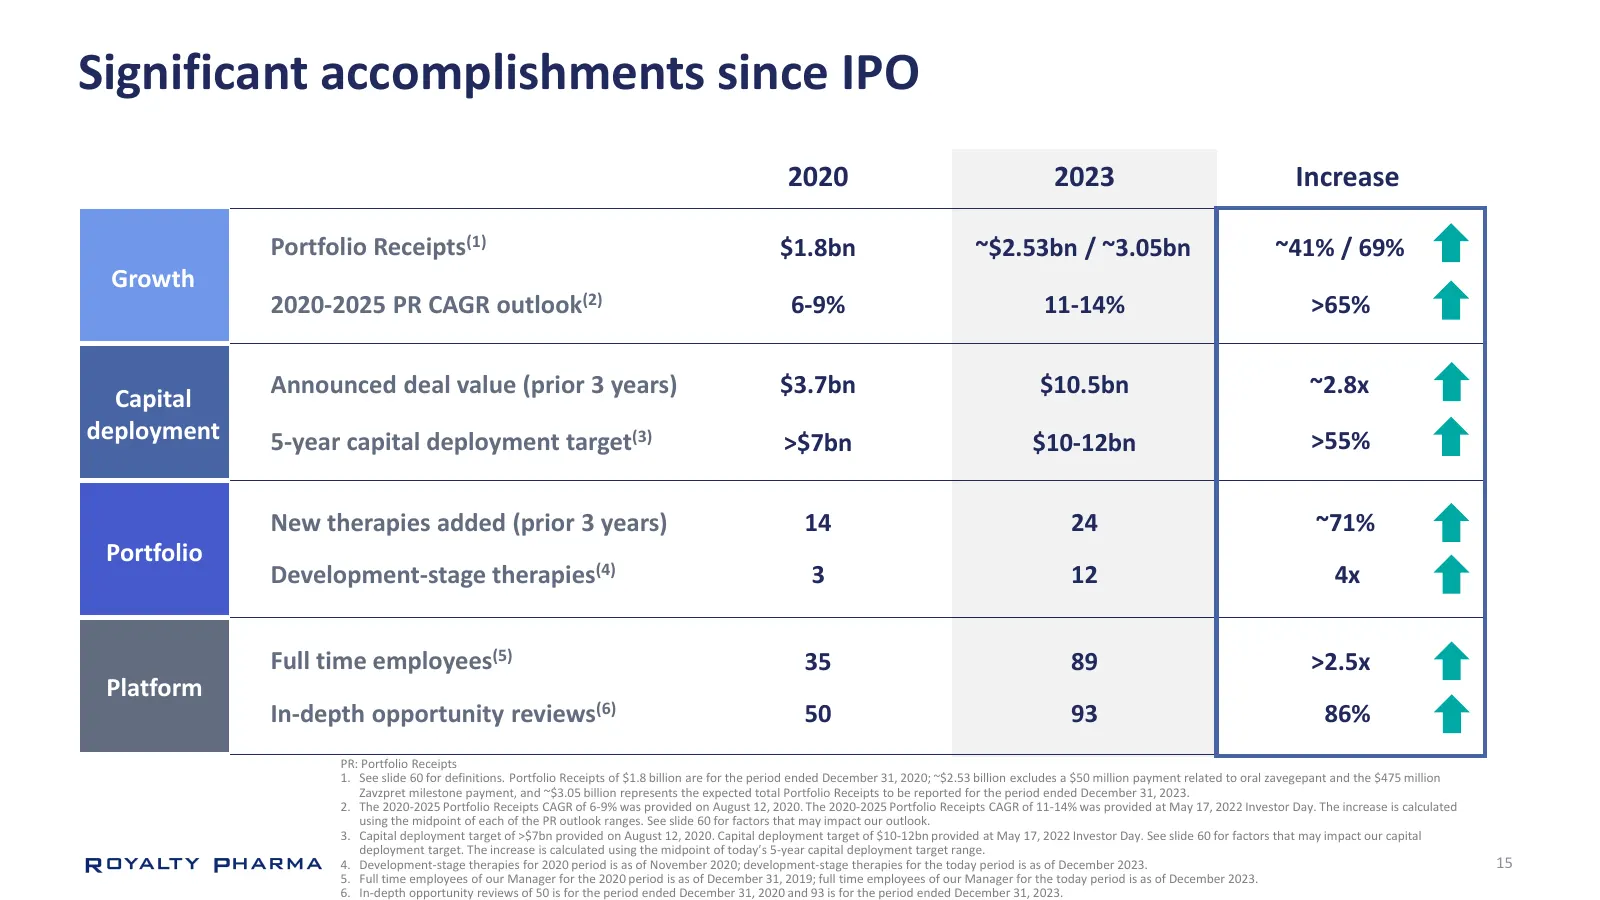
Slide 15: Significant accomplishments since IPO
Significant accomplishments since IPO 2020 2023 Increase Portfolio Receipts(1) $1.8bn ~$2.53bn / ~3.05bn ~41% / 69% Growth 2020-2025 PR CAGR outlook(2) 6-9% 11-14% >65% Announced deal value (prior 3 years) $3.7bn $10.5bn ~2.8x Capital deployment 5-year capital deployment target(3) >$7bn $10-12bn >55
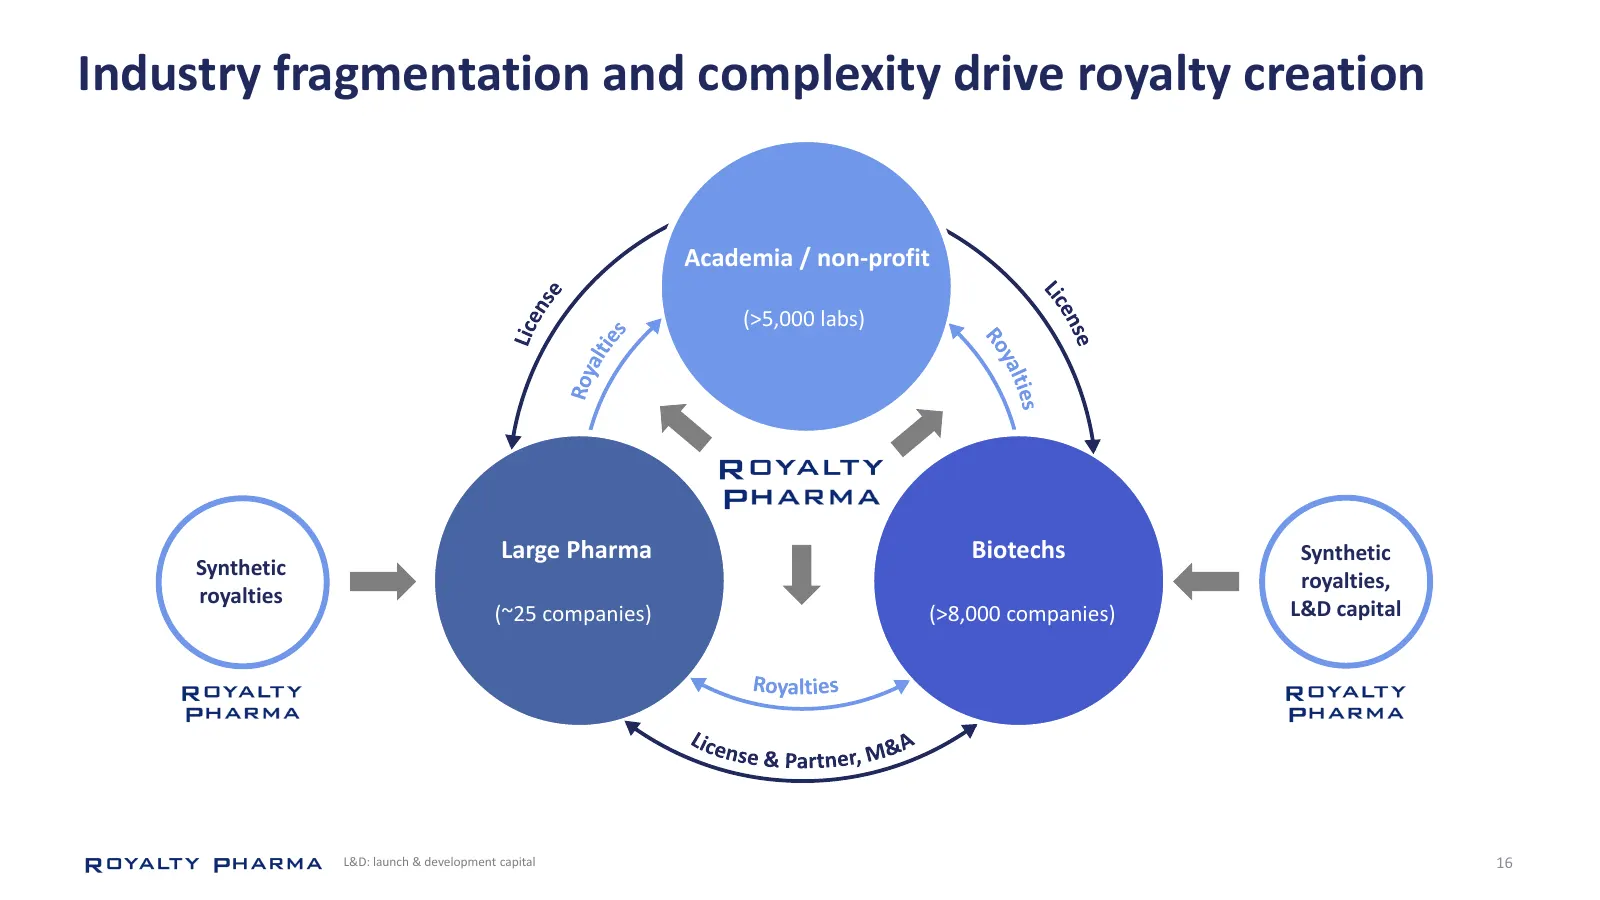
Slide 16: Industry fragmentation and complexity drive royalty creation
Industry fragmentation and complexity drive royalty creation Academia / non-profit e Lic ns en (>5,000 labs) Lice se ies Ro alt yal Roy ties Large Pharma Biotechs Synthetic Synthetic royalties, royalties (~25 companies) (>8,000 companies) L&D capital Royalties L ic e nse & Partner, M&A L&D: launch &
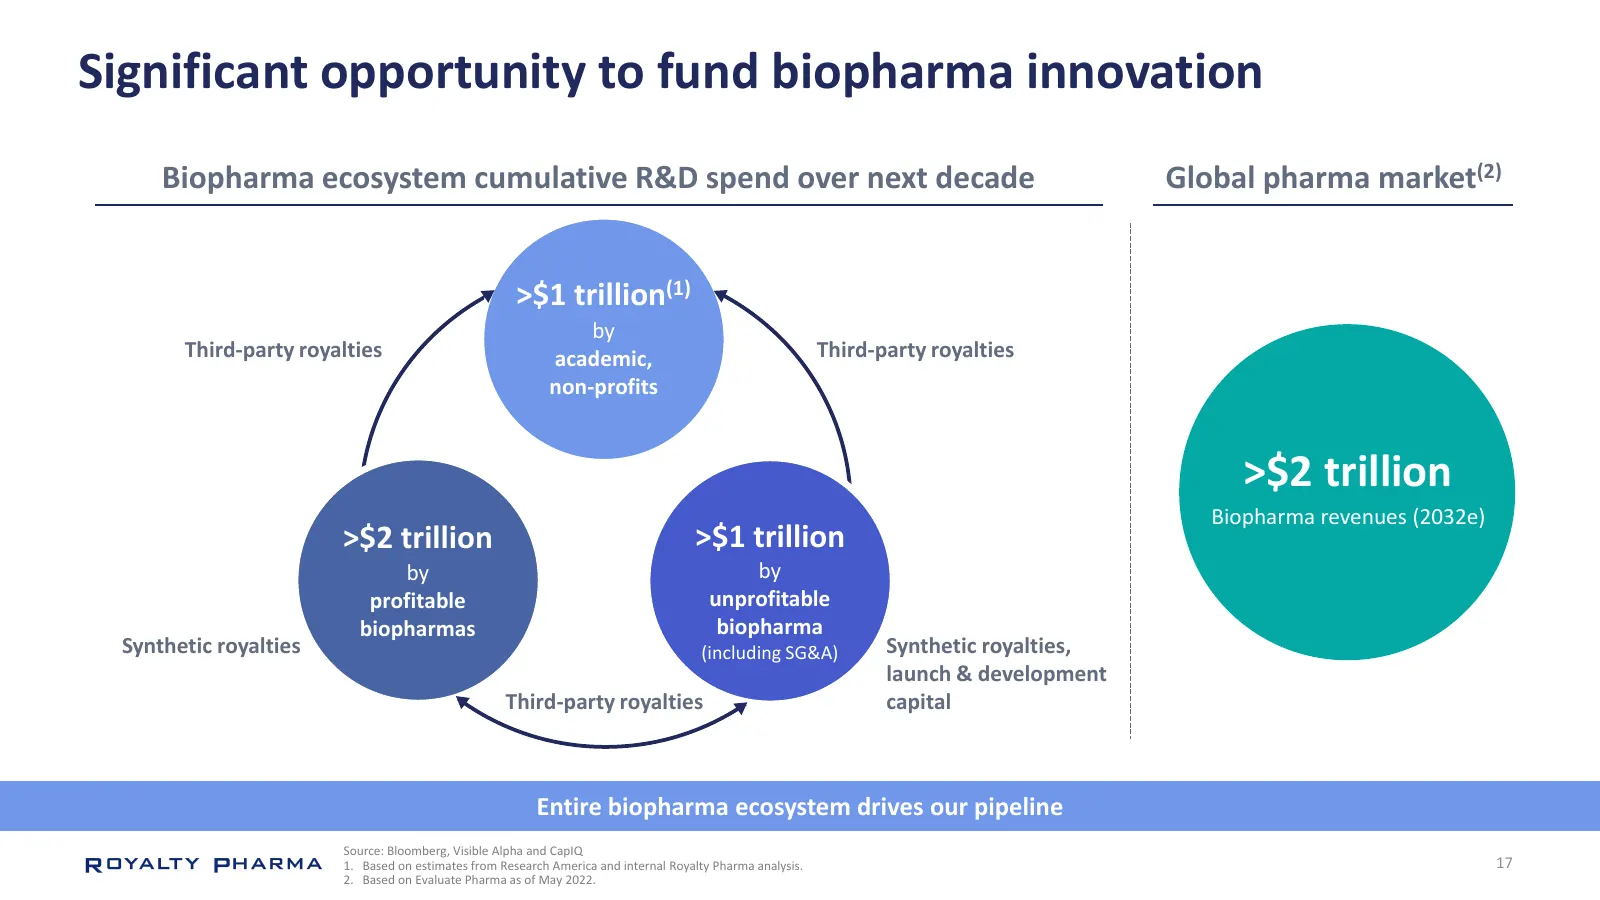
Slide 17: Significant opportunity to fund biopharma innovation
Significant opportunity to fund biopharma innovation Biopharma ecosystem cumulative R&D spend over next decade Global pharma market(2) >$1 trillion(1) by Third-party royalties academic, Third-party royalties non-profits >$2 trillion Biopharma revenues (2032e) >$2 trillion >$1 trillion by by profitab
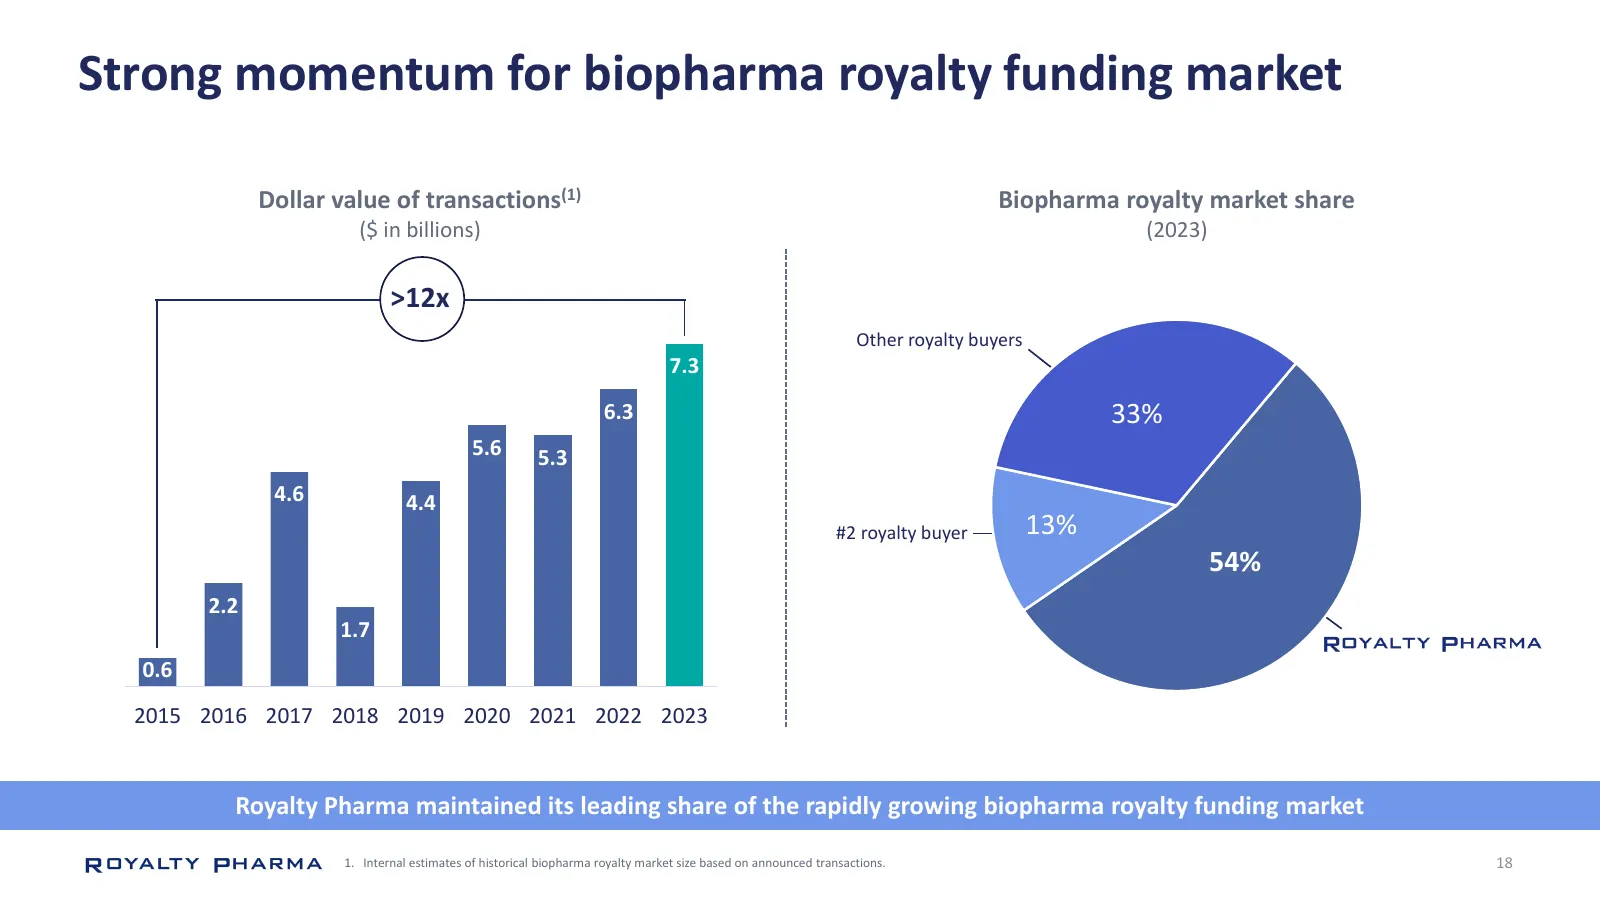
Slide 18: Strong momentum for biopharma royalty funding market
Strong momentum for biopharma royalty funding market Dollar value of transactions(1) Biopharma royalty market share ($ in billions) (2023) >12x Other royalty buyers 7.3 6.3 33% 5.6 5.3 4.6 4.4 #2 royalty buyer 13% 54% 2.2 1.7 0.6 2015 2016 2017 2018 2019 2020 2021 2022 2023 Royalty Pharma maintained
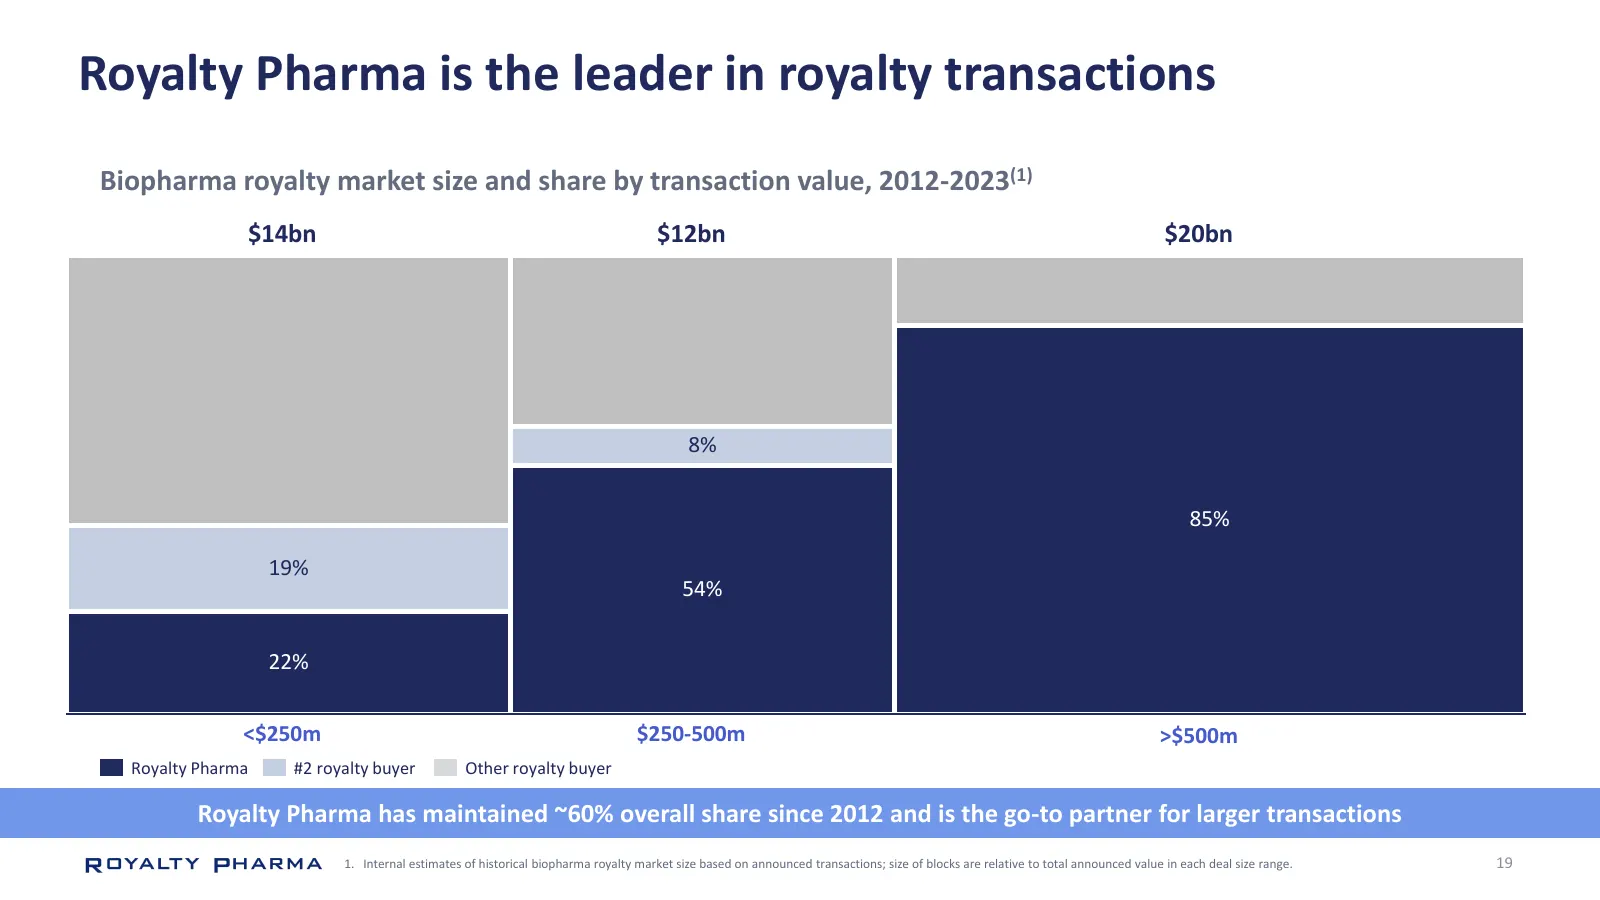
Slide 19: Royalty Pharma is the leader in royalty transactions
Royalty Pharma is the leader in royalty transactions Biopharma royalty market size and share by transaction value, 2012-2023(1) $14bn $12bn $20bn 7% 8% 83% 85% 21% 19% 53% 54% 26% 22% <$250m $250-500m >$500m Royalty Pharma #2 royalty buyer Other royalty buyer Royalty Pharma has maintained ~60% overa
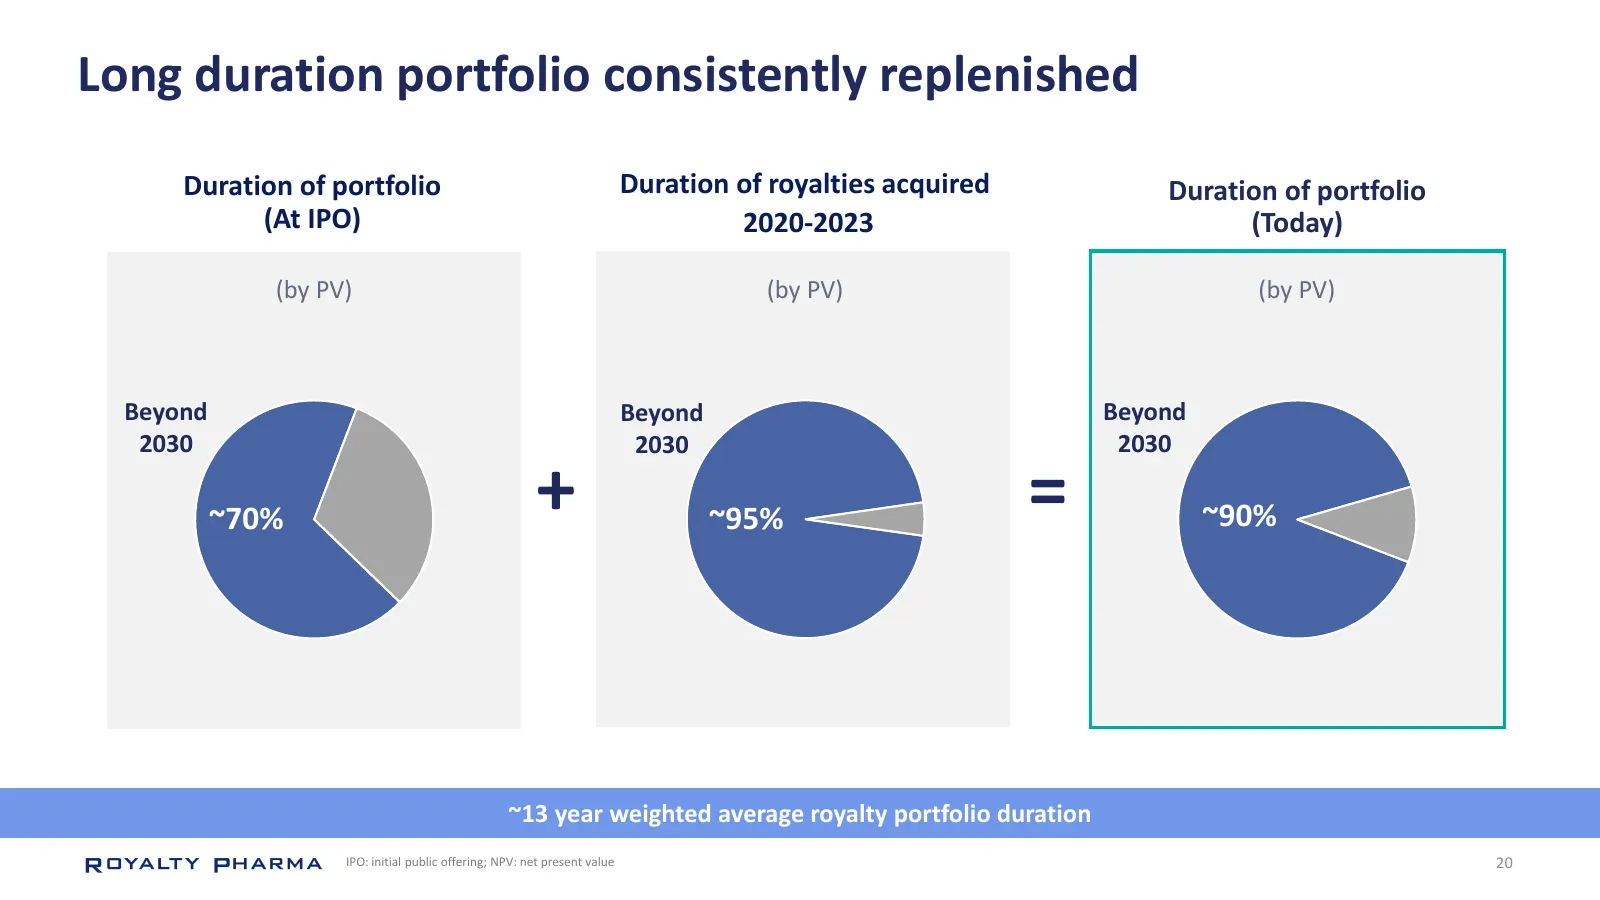
Slide 20: Long duration portfolio consistently replenished
Long duration portfolio consistently replenished Duration of portfolio Duration of royalties acquired Duration of portfolio (At IPO) 2020-2023 (Today) (by PV) (by PV) (by PV) Beyond Beyond Beyond 2030 2030 2030 ~70% + ~95% = ~90% ~13 year weighted average royalty portfolio duration IPO: initial publ
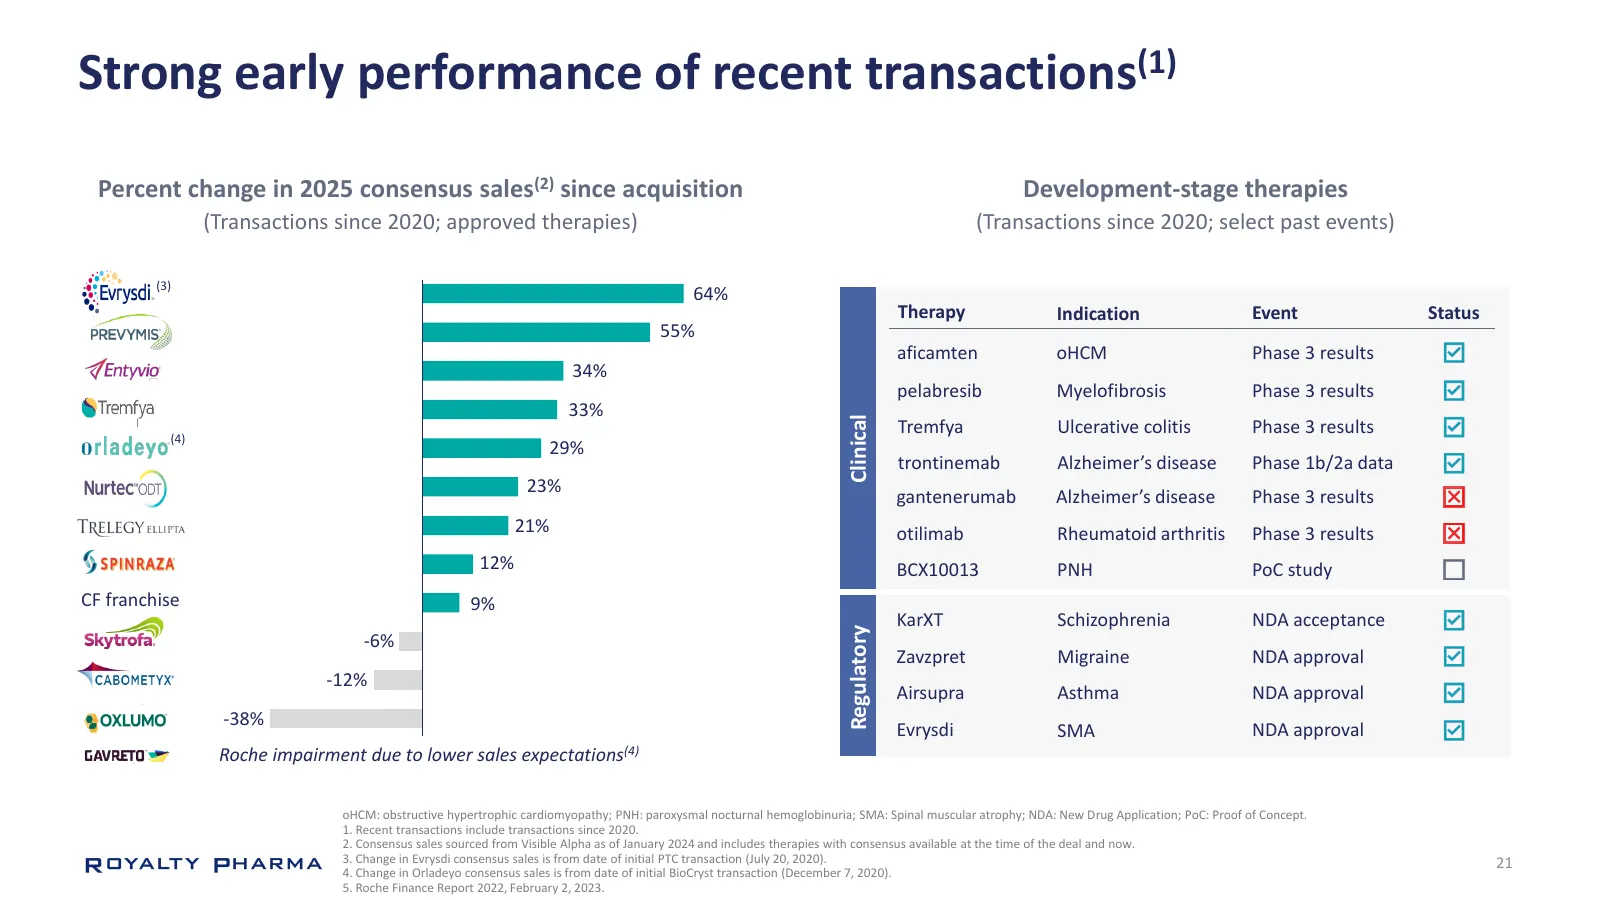
Slide 21: Strong early performance of recent transactions
Strong early performance of recent transactions(1) Percent change in 2025 consensus sales(2) since acquisition Development-stage therapies (Transactions since 2020; approved therapies) (Transactions since 2020; select past events) (3) 64% Therapy Indication Event Status 55% aficamten oHCM Phase 3 re
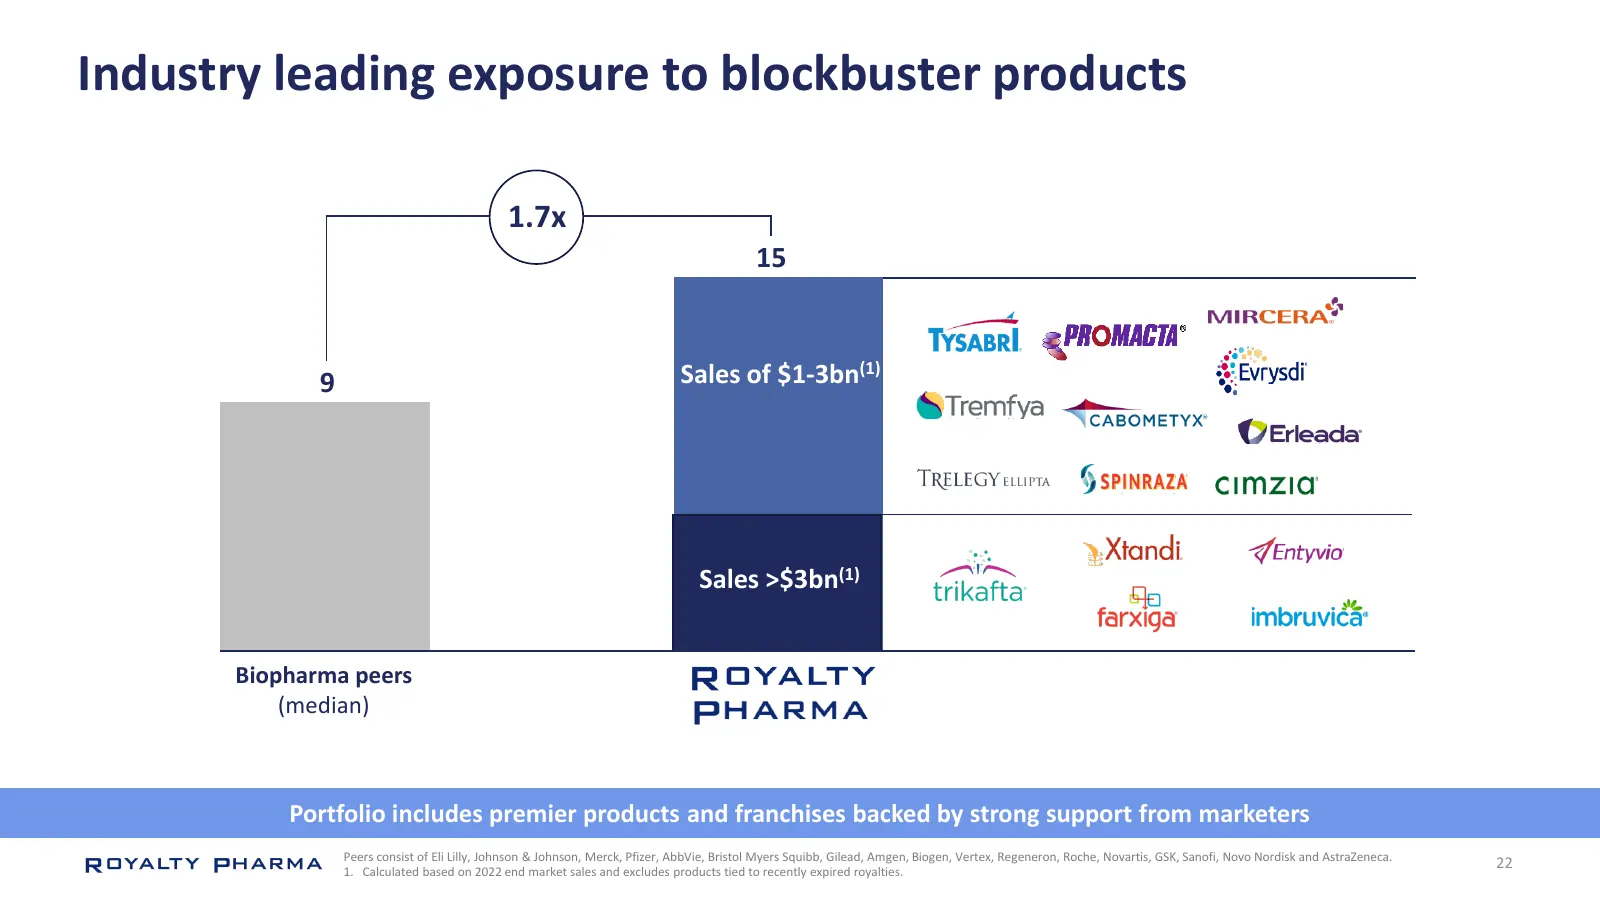
Slide 22: Industry leading exposure to blockbuster products
Industry leading exposure to blockbuster products 1.7x 15 9 Sales of $1-3bn(1) Sales >$3bn(1) Biopharma peers (median) Portfolio includes premier products and franchises backed by strong support from marketers Peers consist of Eli Lilly, Johnson & Johnson, Merck, Pfizer, AbbVie, Bristol Myers Squibb
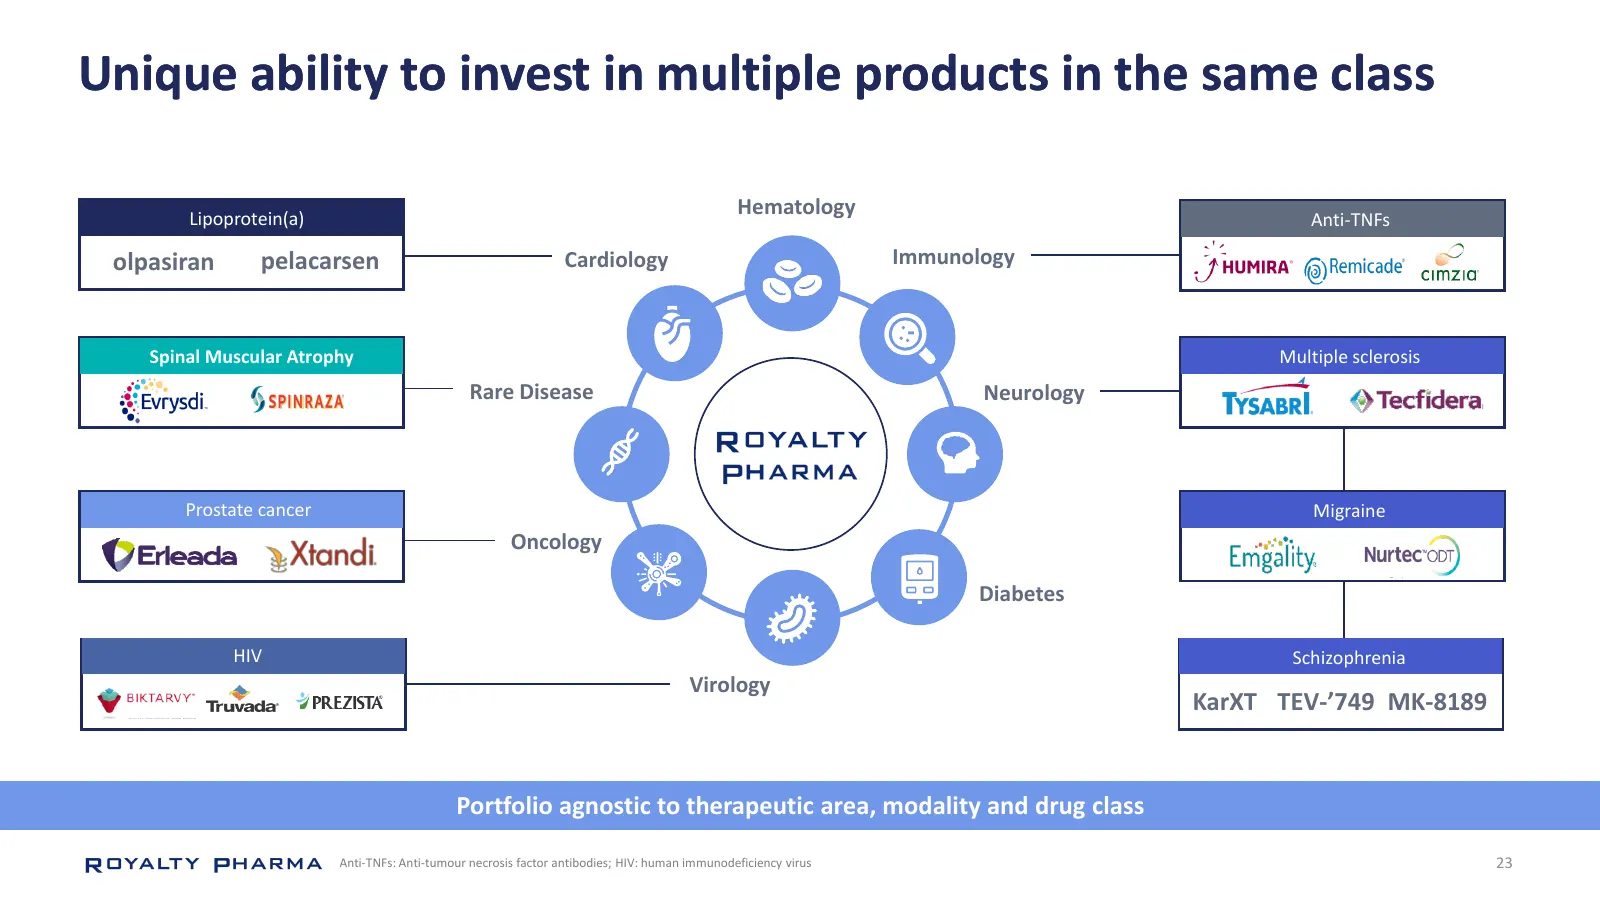
Slide 23: Unique ability to invest in multiple products in the same class
Unique ability to invest in multiple products in the same class Lipoprotein(a) Hematology Anti-TNFs olpasiran pelacarsen Cardiology Immunology Spinal Muscular Atrophy Multiple sclerosis Rare Disease Neurology Royalty Prostate cancer Pharma Migraine Oncology Diabetes HIV Schizophrenia Virology KarXT
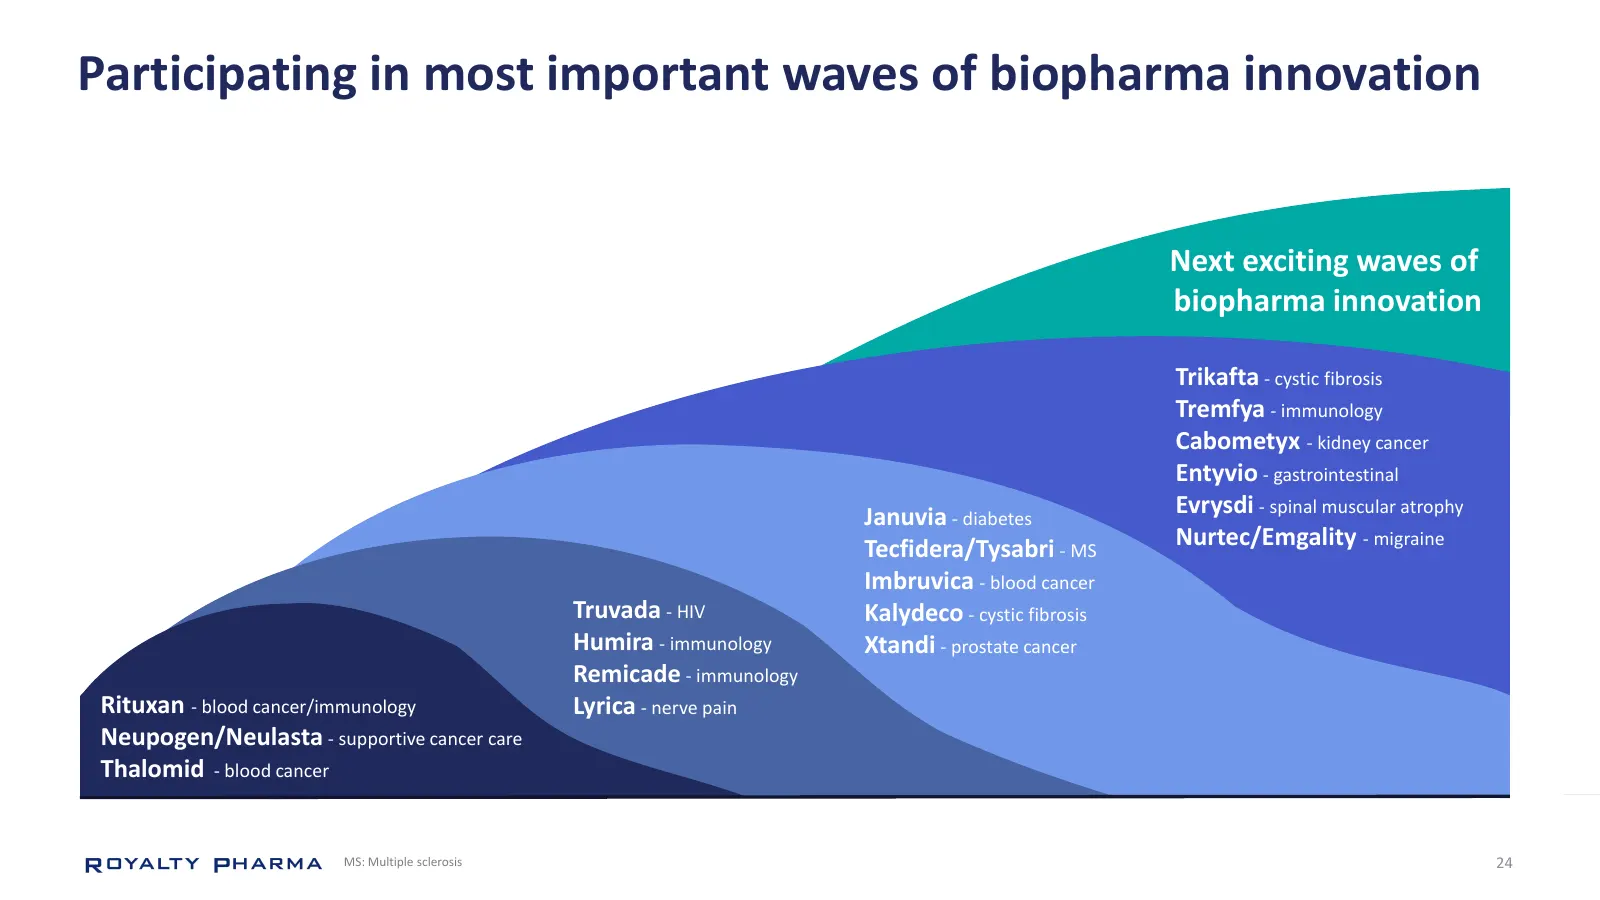
Slide 24: Participating in most important waves of biopharma innovation
Participating in most important waves of biopharma innovation Next exciting waves of biopharma innovation Trikafta - cystic fibrosis Xtandi Tremfya - immunology Trikafta Cabometyx - kidney cancer Tremfya Entyvio - gastrointestinal Entyvio Januvia - diabetes Evrysdi - spinal muscular atrophy Evrysdi
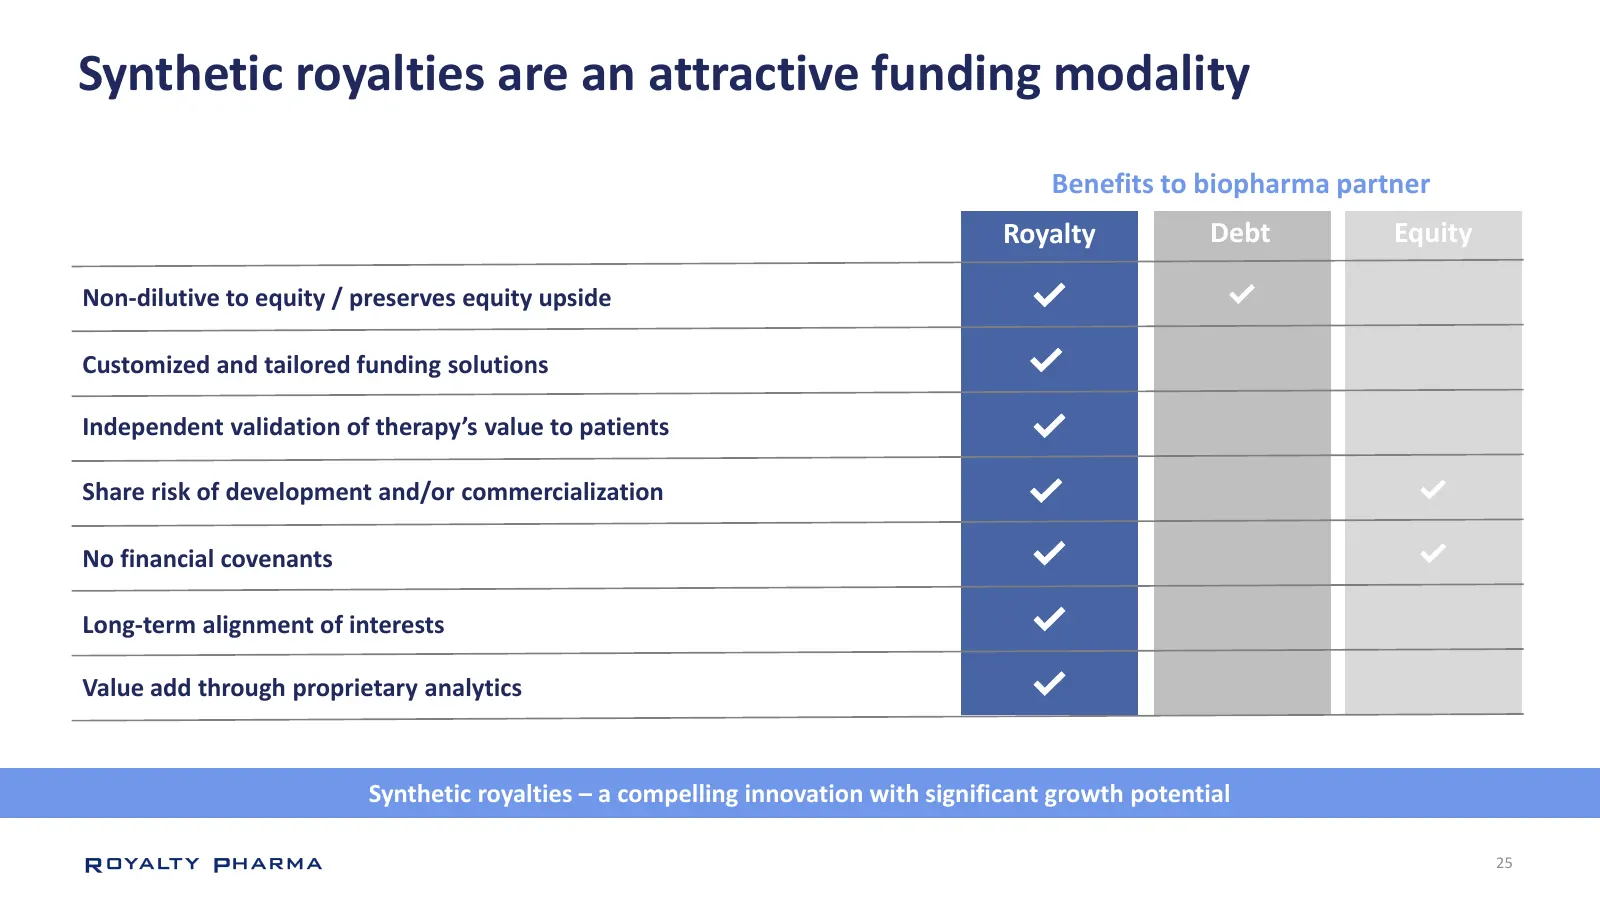
Slide 25: Synthetic royalties are an attractive funding modality
Synthetic royalties are an attractive funding modality Benefits to biopharma partner Royalty Debt Equity Non-dilutive to equity / preserves equity upside Customized and tailored funding solutions Independent validation of therapy’s value to patients Share risk of development and/or commercialization
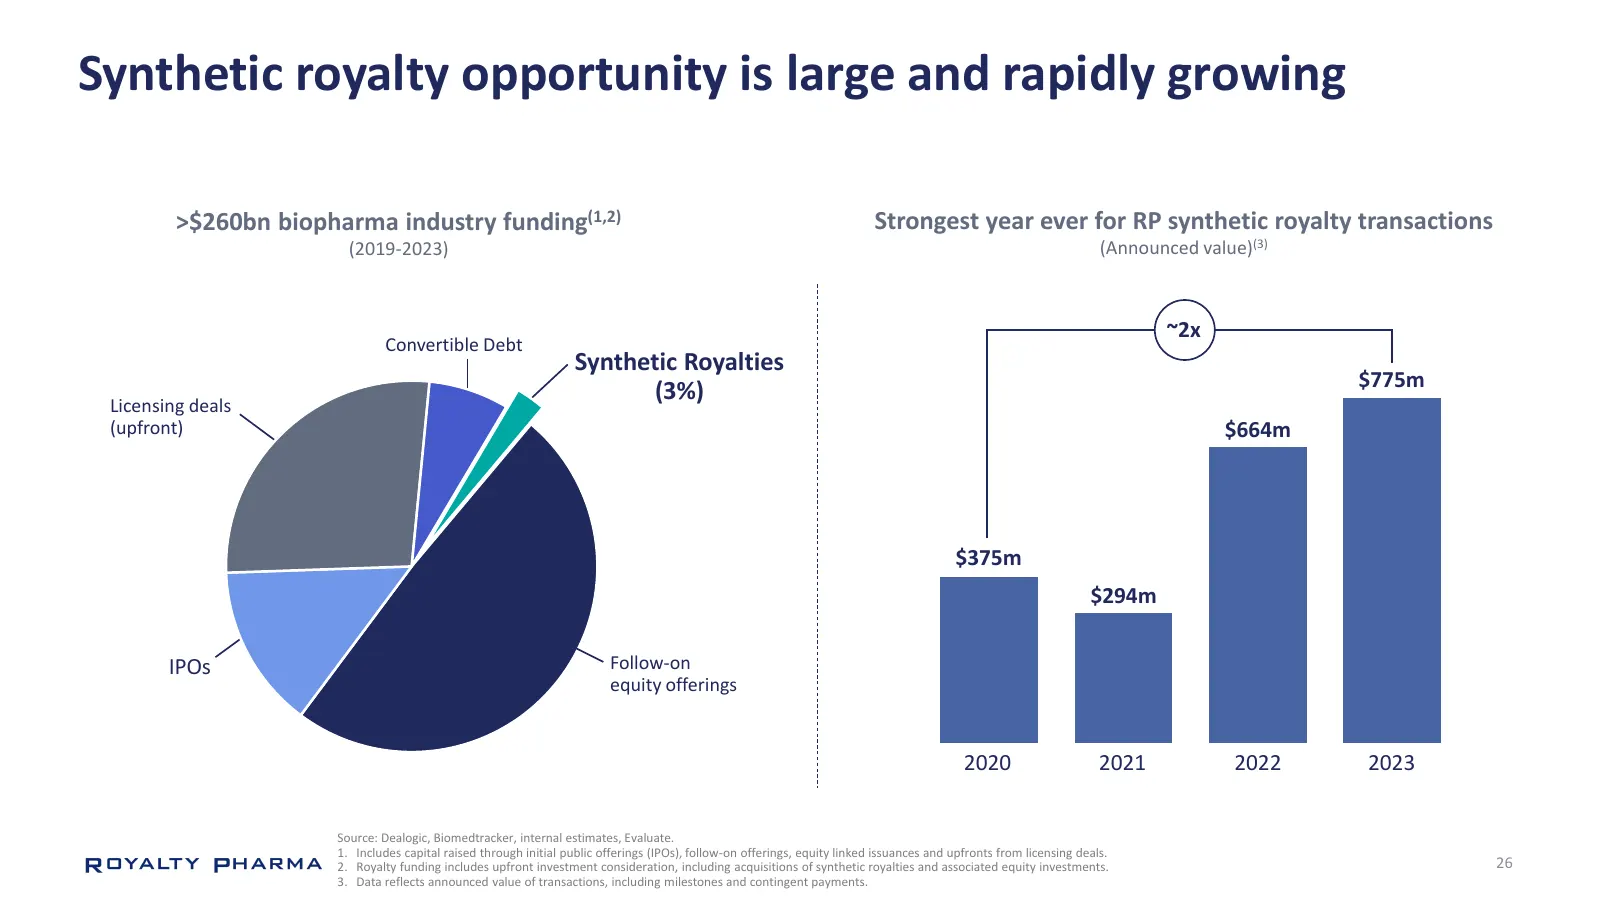
Slide 26: Synthetic royalty opportunity is large and rapidly growing
Synthetic royalty opportunity is large and rapidly growing >$260bn biopharma industry funding(1,2) Strongest year ever for RP synthetic royalty transactions (2019-2023) (Announced value)(3) ~2x Convertible Debt Synthetic Royalties $775m Licensing deals (3%) (upfront) $664m $375m $294m IPOs Follow-on
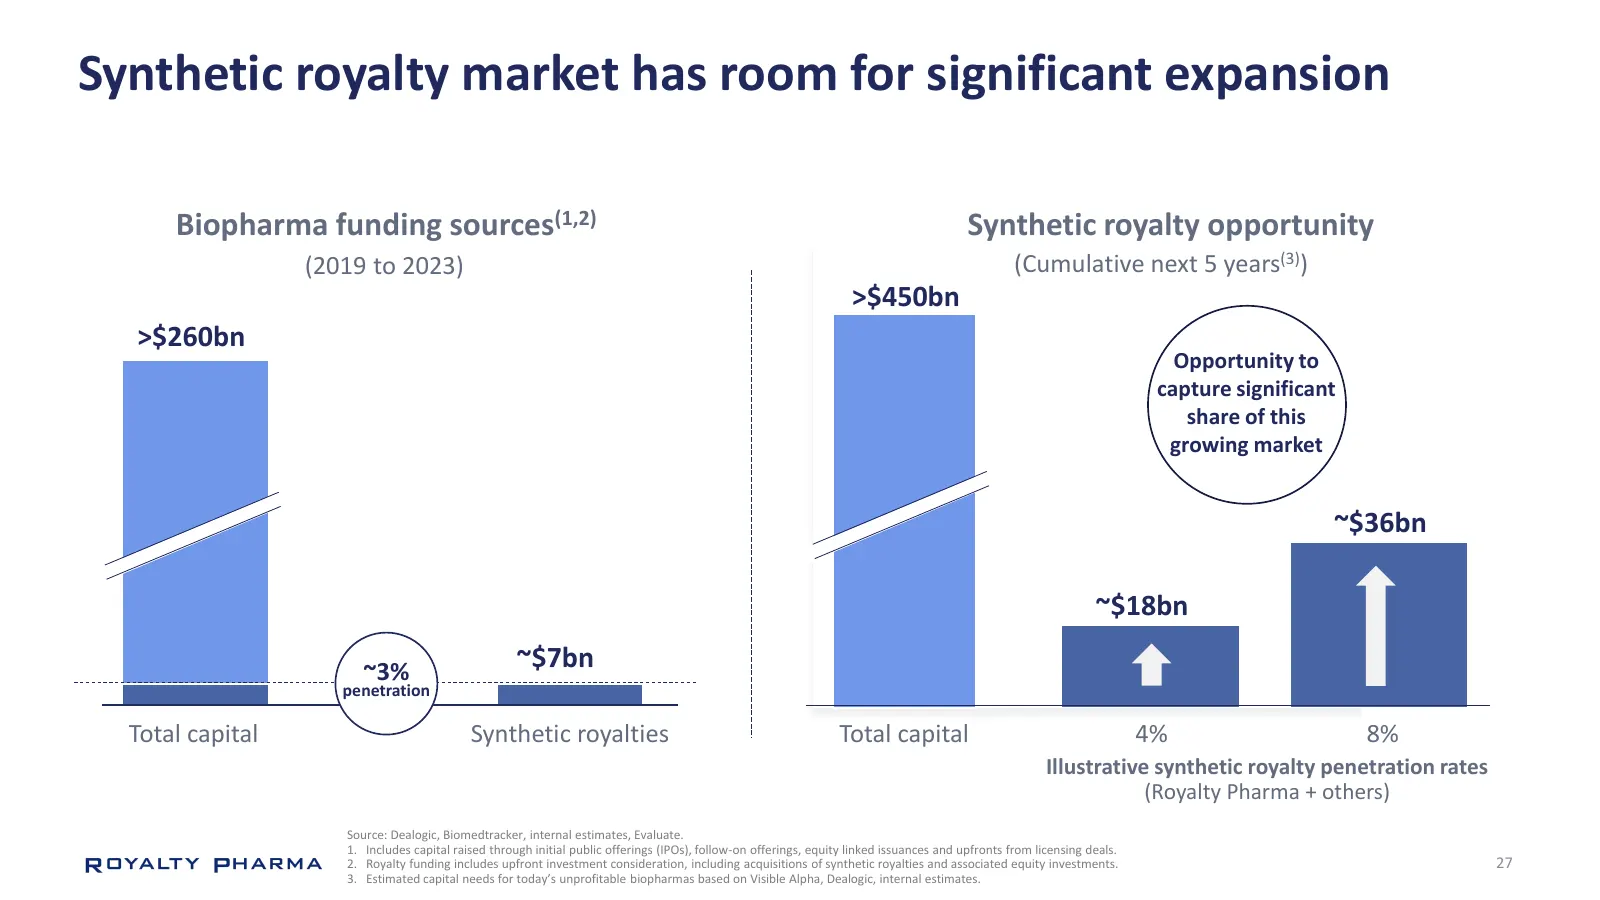
Slide 27: Synthetic royalty market has room for significant expansion
Synthetic royalty market has room for significant expansion Biopharma funding sources(1,2) Synthetic royalty opportunity (2019 to 2023) (Cumulative next 5 years(3)) >$450bn >$260bn Opportunity to capture significant share of this growing market ~$36bn ~$18bn ~3% ~$7bn penetration Total capital Synth
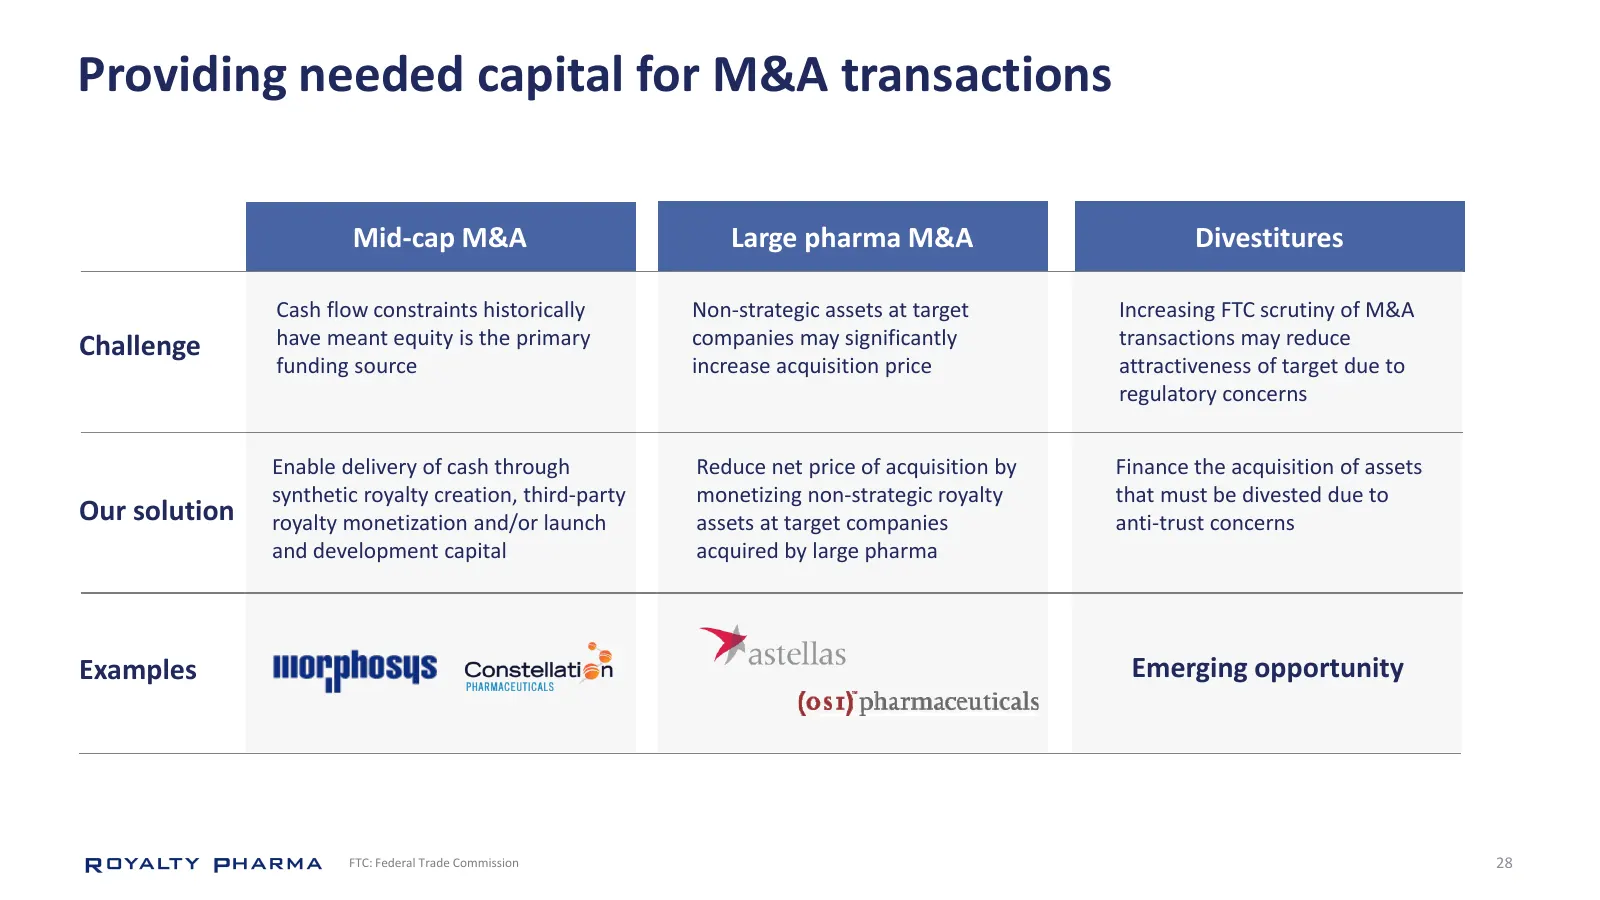
Slide 28: Providing needed capital for M&A transactions
Providing needed capital for M&A transactions Mid-cap M&A Large pharma M&A Divestitures Cash flow constraints historically Non-strategic assets at target Increasing FTC scrutiny of M&A Challenge have meant equity is the primary companies may significantly transactions may reduce funding source incre
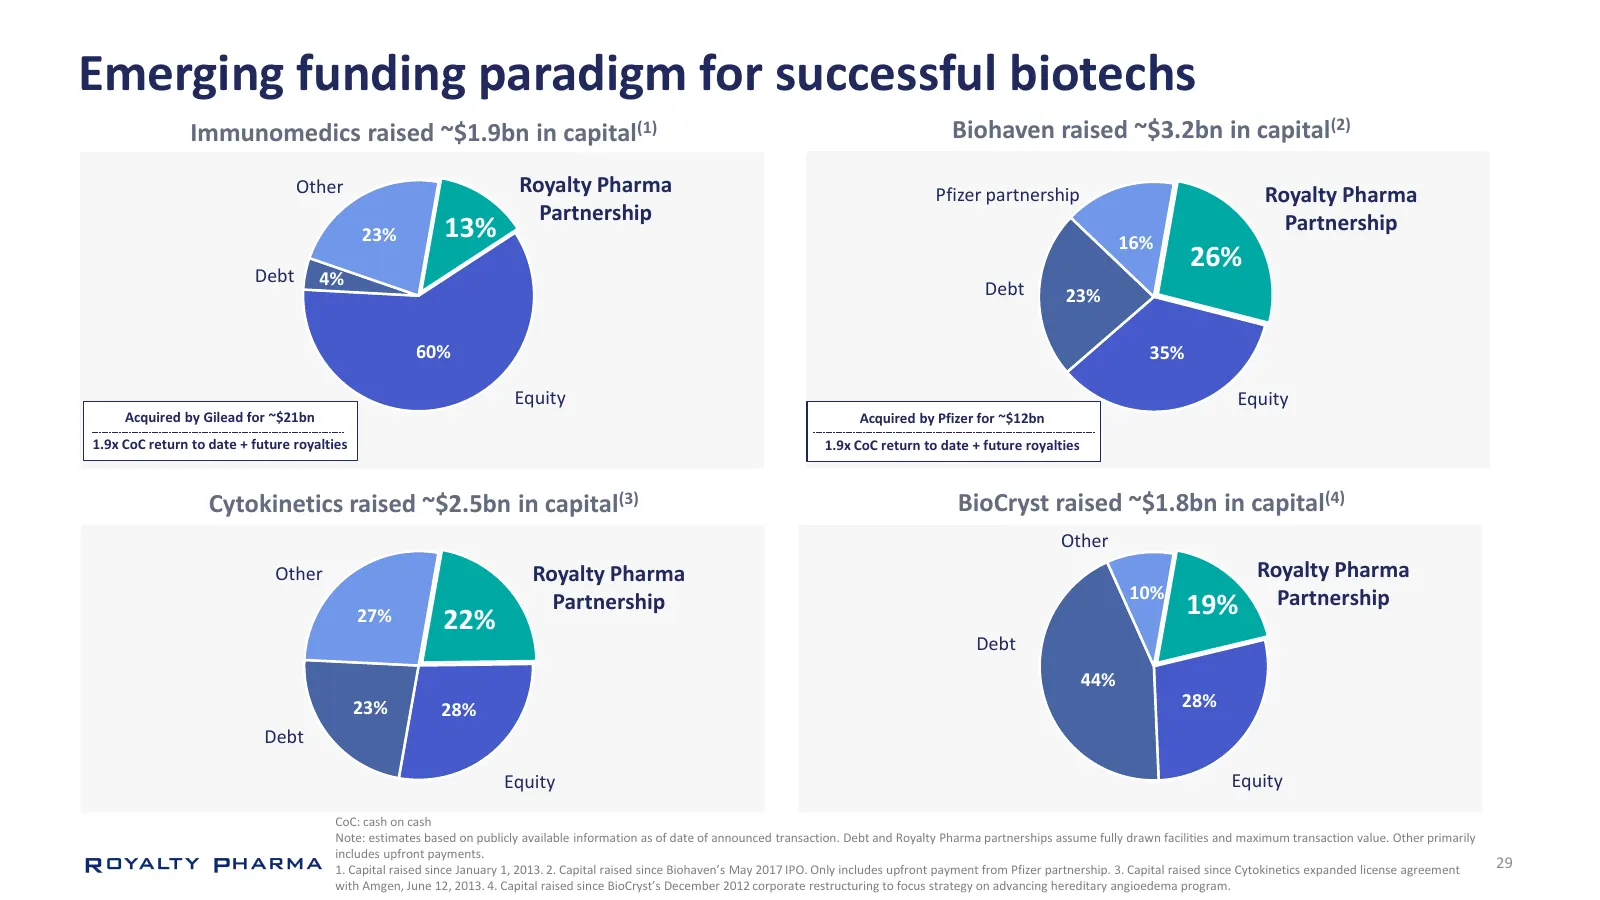
Slide 29: Emerging funding paradigm for successful biotechs
Emerging funding paradigm for successful biotechs Immunomedics raised ~$1.9bn in capital(1) Biohaven raised ~$3.2bn in capital(2) Other Royalty Pharma Pfizer partnership Royalty Pharma Partnership Partnership 23% 13% 16% 26% Debt 4% Debt 23% 60% 35% Equity Equity Acquired by Gilead for ~$21bn Acquir
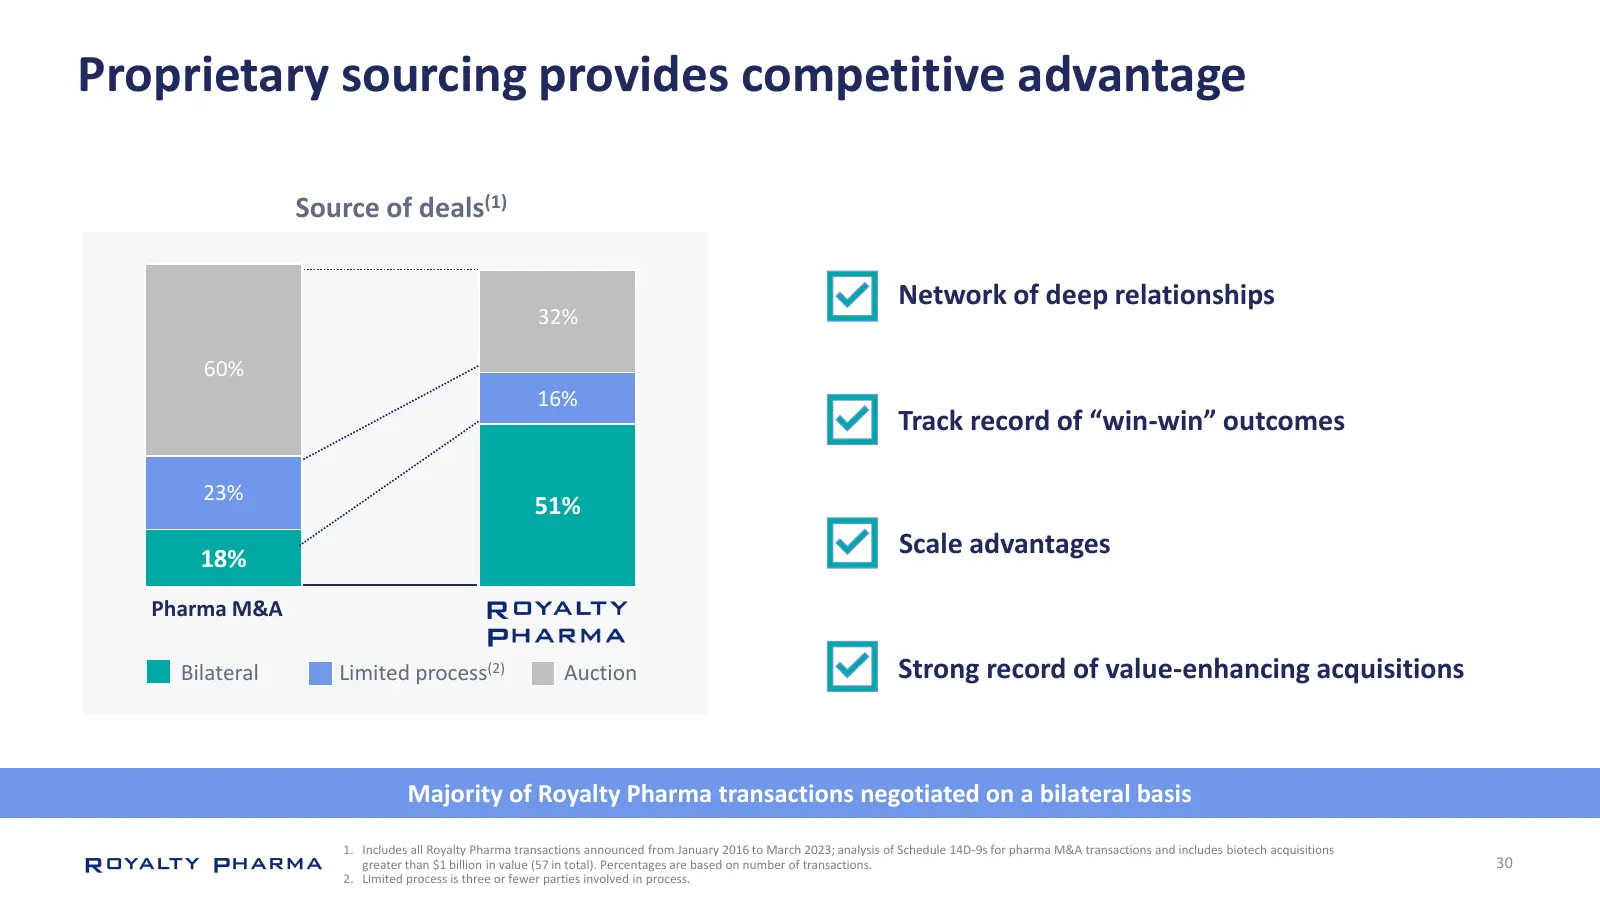
Slide 30: Proprietary sourcing provides competitive advantage
Proprietary sourcing provides competitive advantage Source of deals(1) Network of deep relationships 32% 60% 16% Track record of “win-win” outcomes 23% 51% 18% Scale advantages Pharma M&A Bilateral Limited process(2) Auction Strong record of value-enhancing acquisitions Majority of Royalty Pharma tr
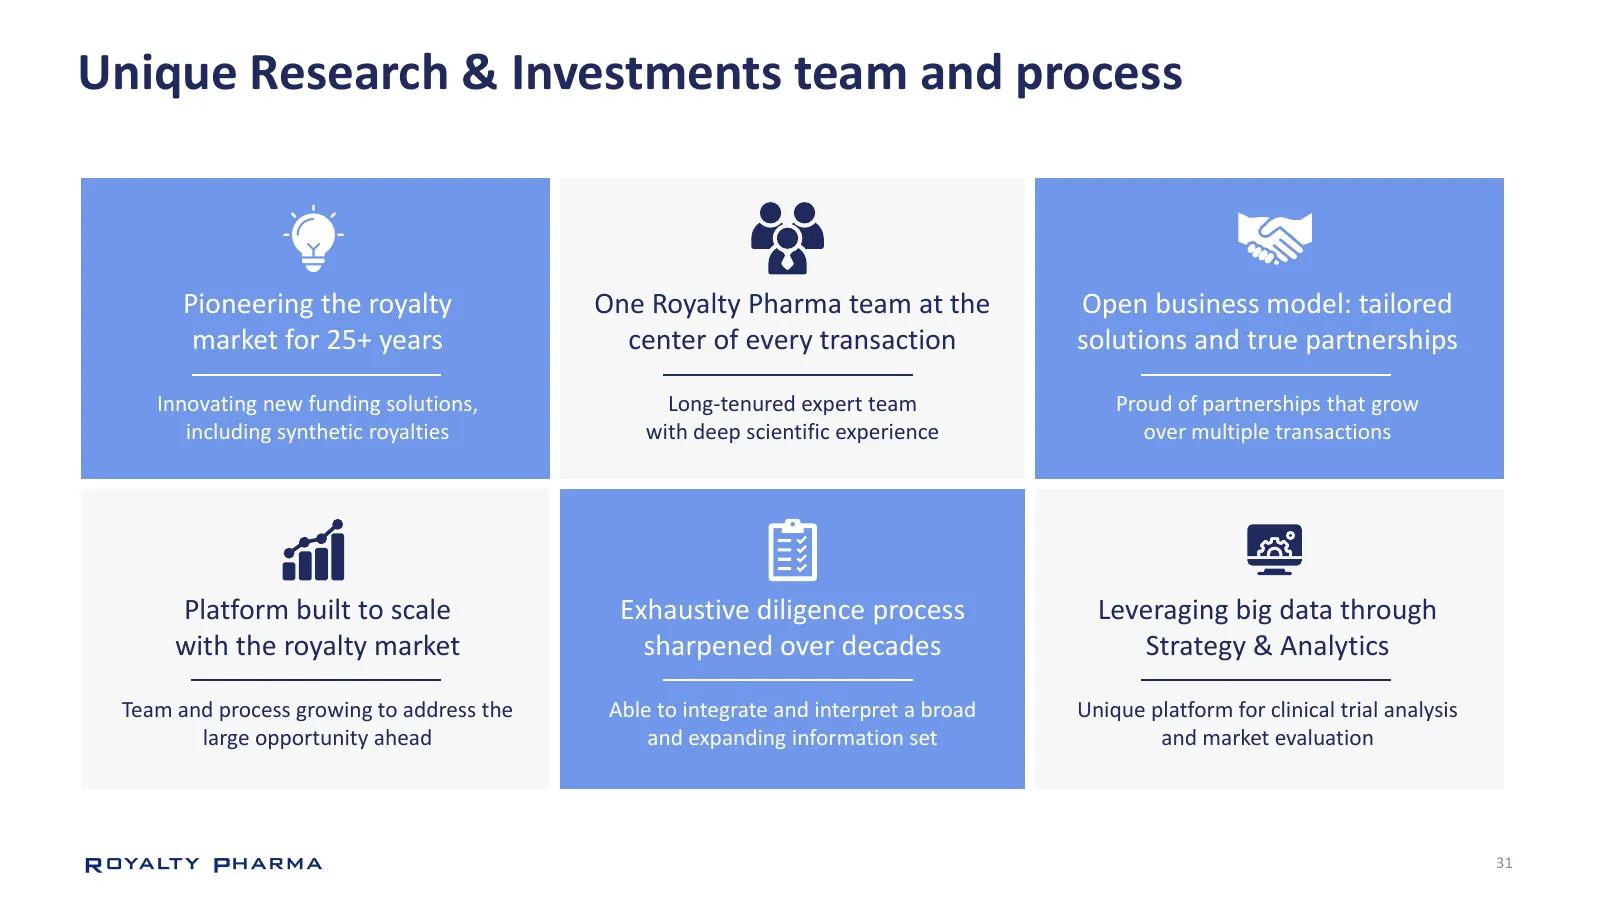
Slide 31: Unique Research & Investments team and process
Unique Research & Investments team and process Pioneering the royalty One Royalty Pharma team at the Open business model: tailored market for 25+ years center of every transaction solutions and true partnerships Innovating new funding solutions, Long-tenured expert team Proud of partnerships that gr
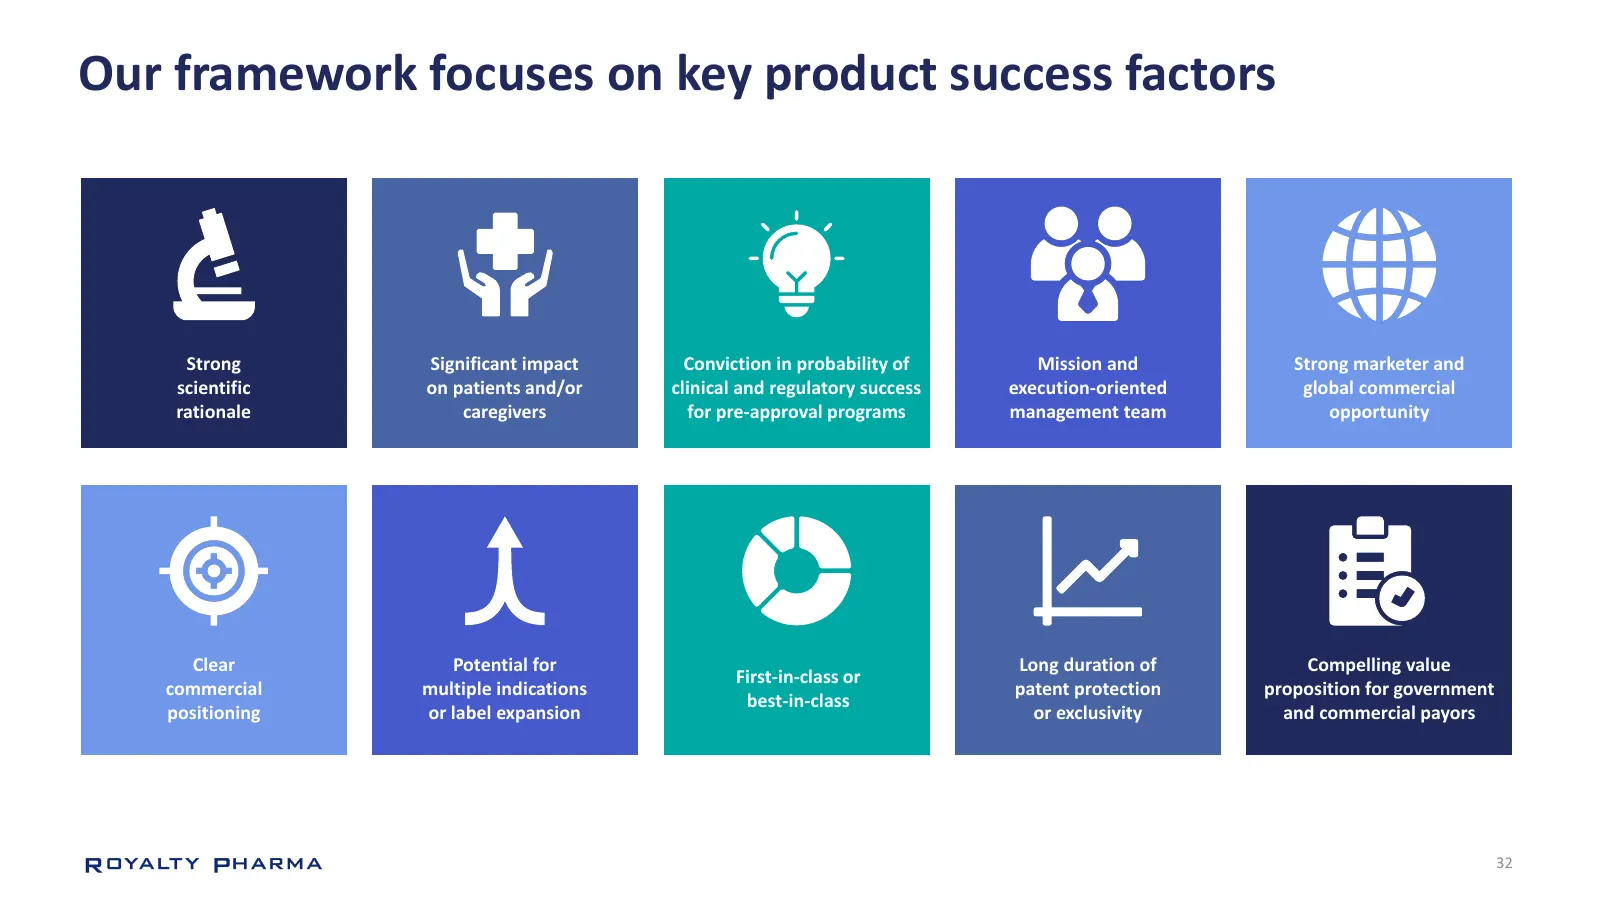
Slide 32: Our framework focuses on key product success factors
Our framework focuses on key product success factors Strong Significant impact Conviction in probability of Mission and Strong marketer and scientific on patients and/or clinical and regulatory success execution-oriented global commercial rationale caregivers for pre-approval programs management tea
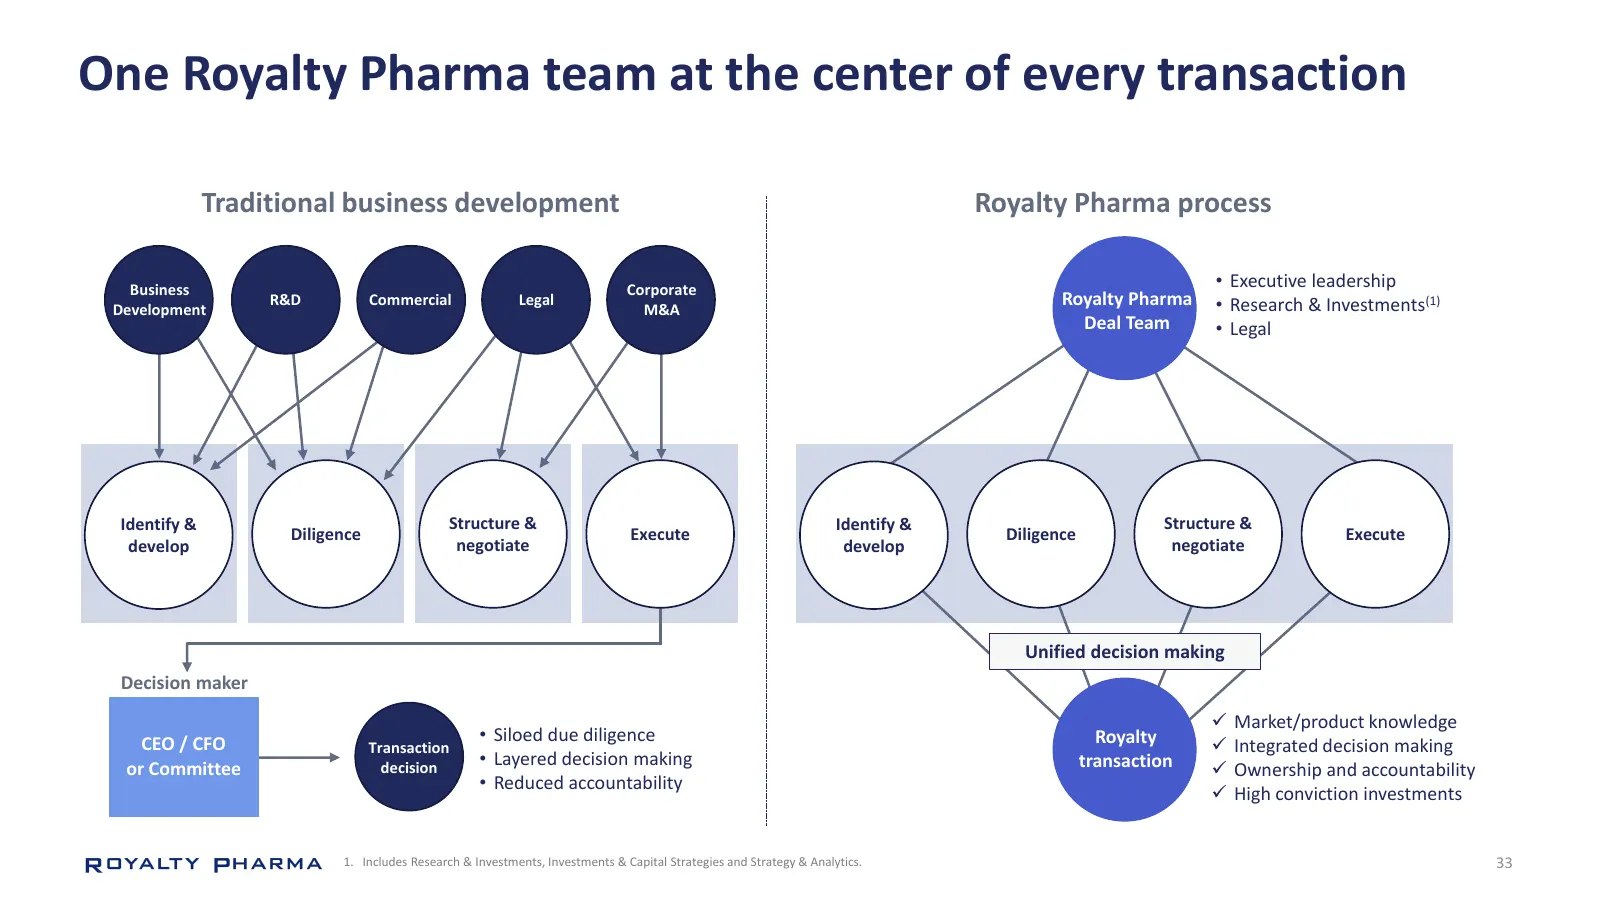
Slide 33: One Royalty Pharma team at the center of every transaction
One Royalty Pharma team at the center of every transaction Traditional business development Royalty Pharma process Business Corporate • Executive leadership R&D Commercial Legal Royalty Pharma • Research & Investments(1) Development M&A Deal Team • Legal Identify & Structure & Identify & Structure &
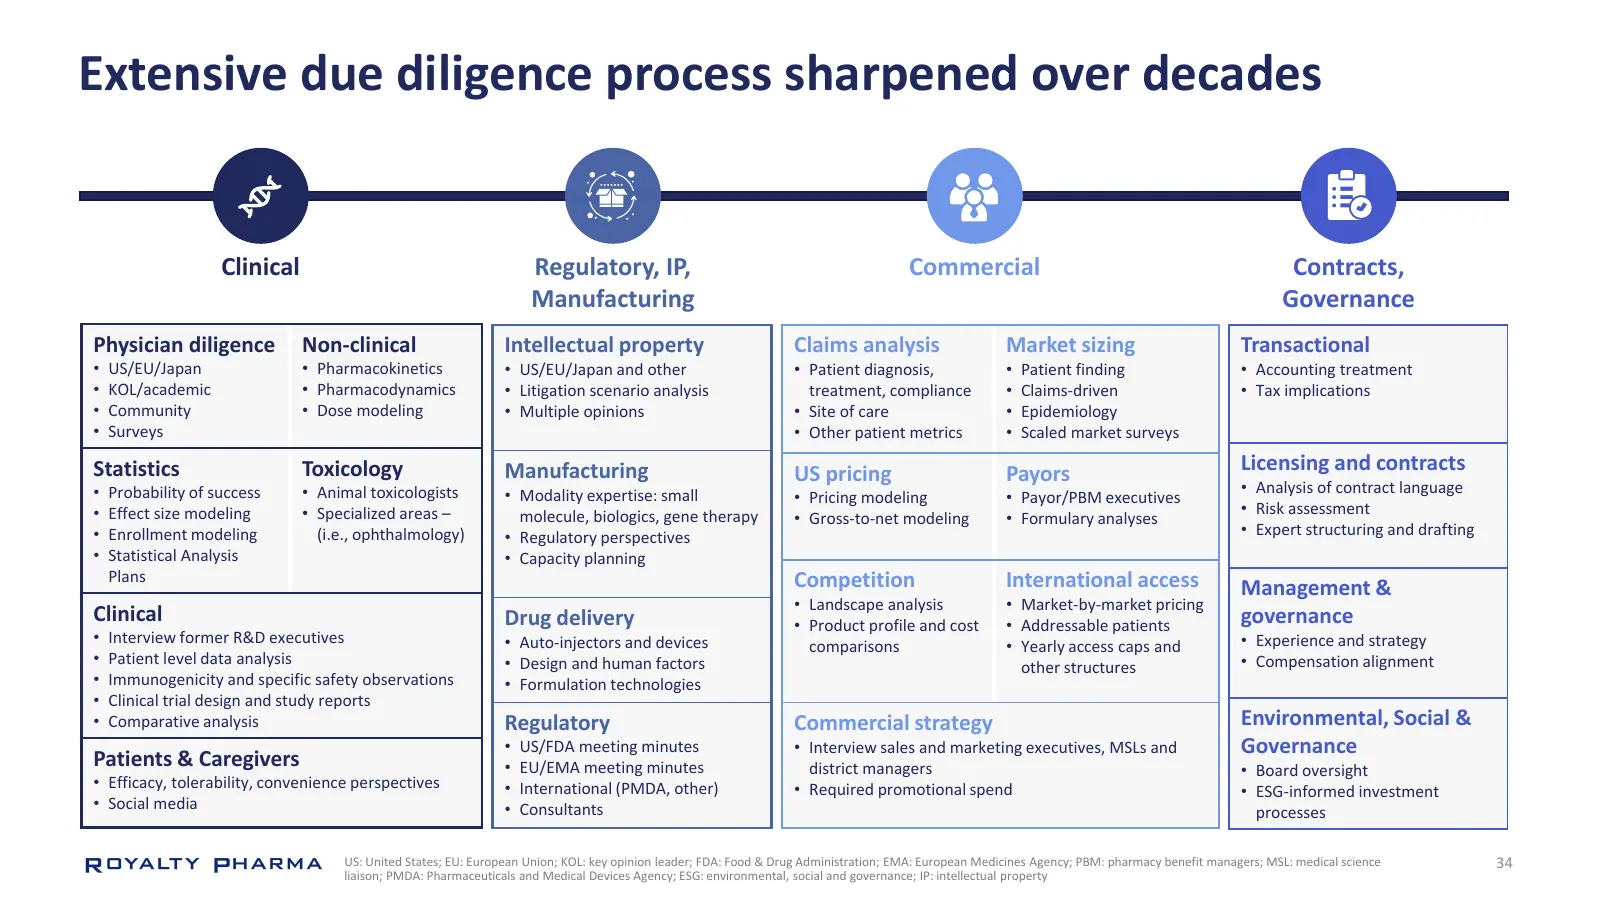
Slide 34: Extensive due diligence process sharpened over decades
Extensive due diligence process sharpened over decades Clinical Regulatory, IP, Commercial Contracts, Manufacturing Governance Physician diligence Non-clinical Intellectual property Claims analysis Market sizing Transactional • US/EU/Japan • Pharmacokinetics • US/EU/Japan and other • Patient diagnos
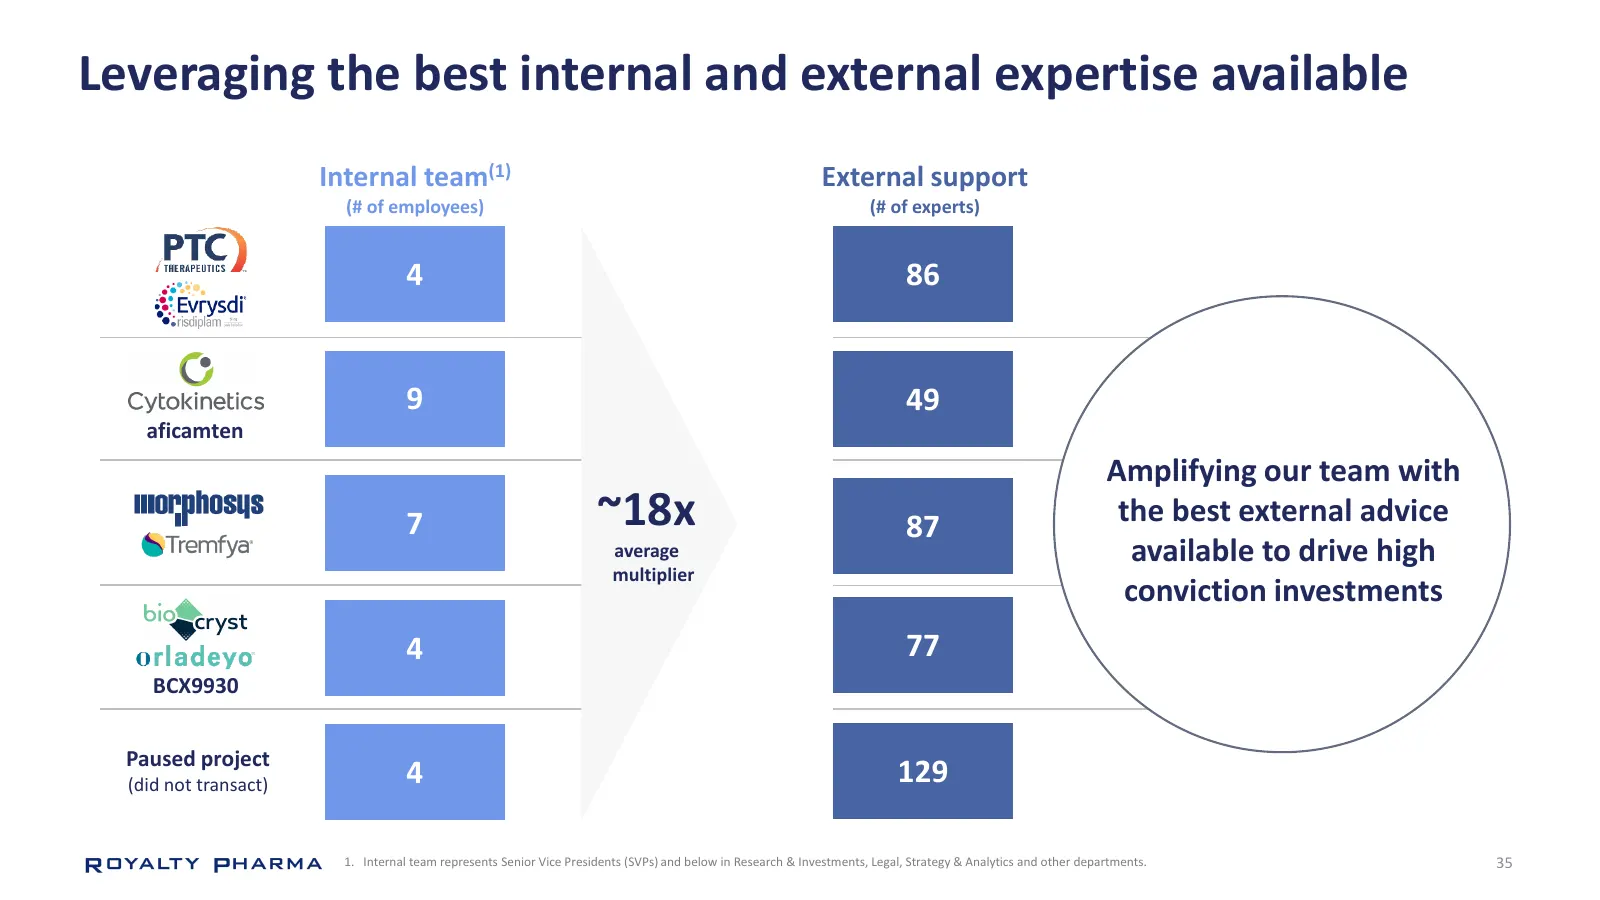
Slide 35: Leveraging the best internal and external expertise available
Leveraging the best internal and external expertise available Internal team(1) External support (# of employees) (# of experts) 4 86 9 49 aficamten Amplifying our team with 7 ~18x 87 the best external advice average available to drive high multiplier conviction investments 4 77 BCX9930 Paused projec
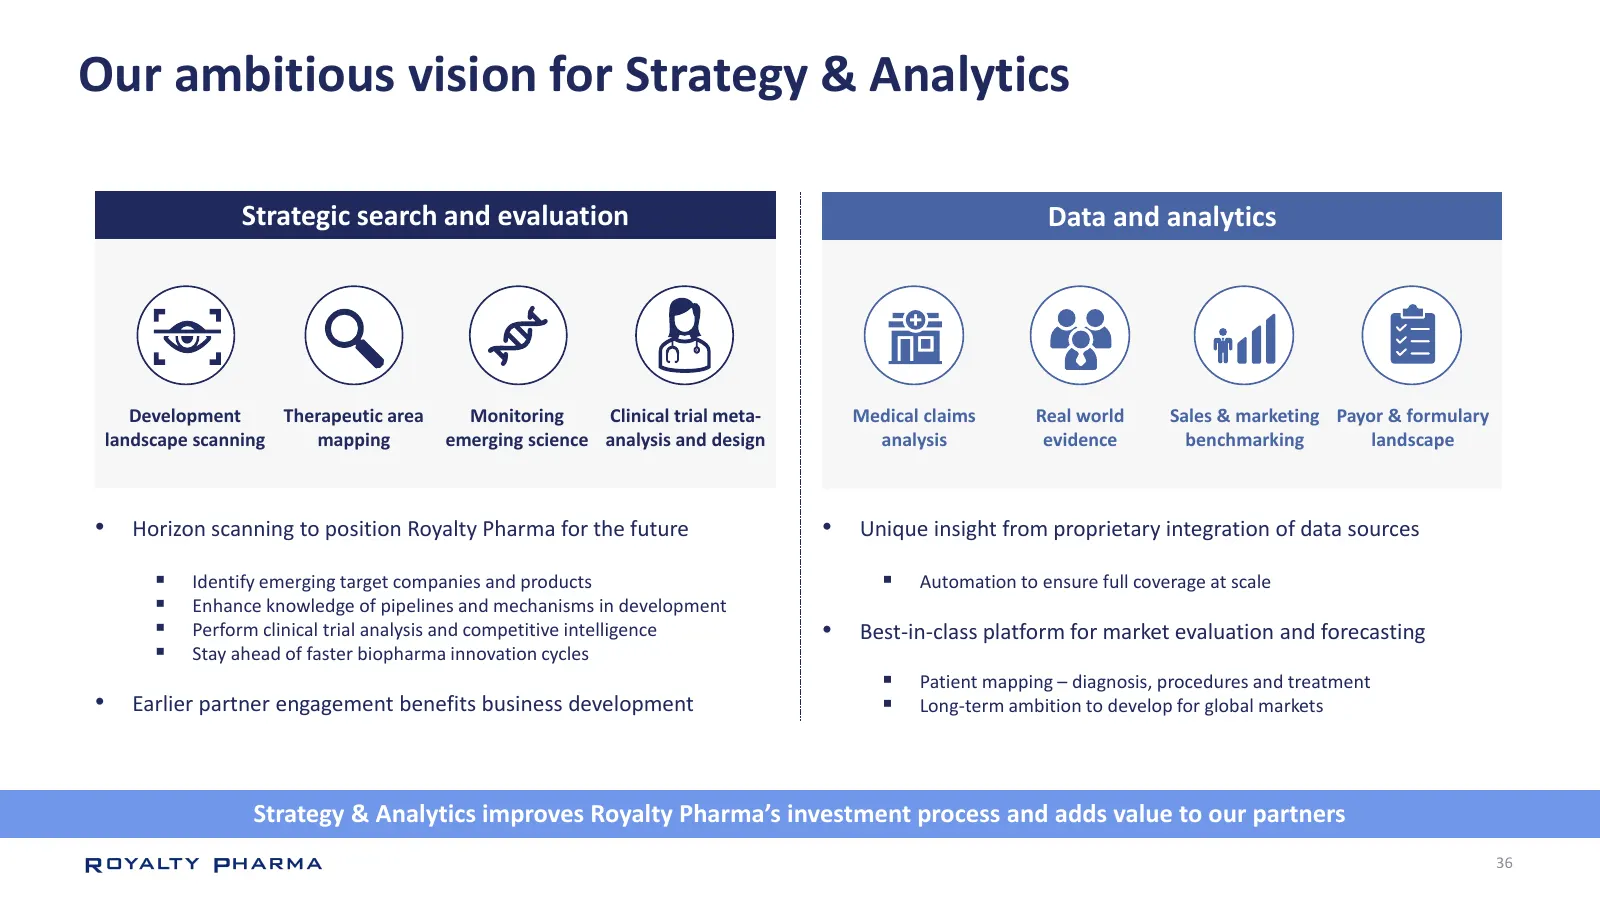
Slide 36: Our ambitious vision for Strategy & Analytics
Our ambitious vision for Strategy & Analytics Strategic search and evaluation Data and analytics Development Therapeutic area Monitoring Clinical trial meta- Medical claims Real world Sales & marketing Payor & formulary landscape scanning mapping emerging science analysis and design analysis evidenc
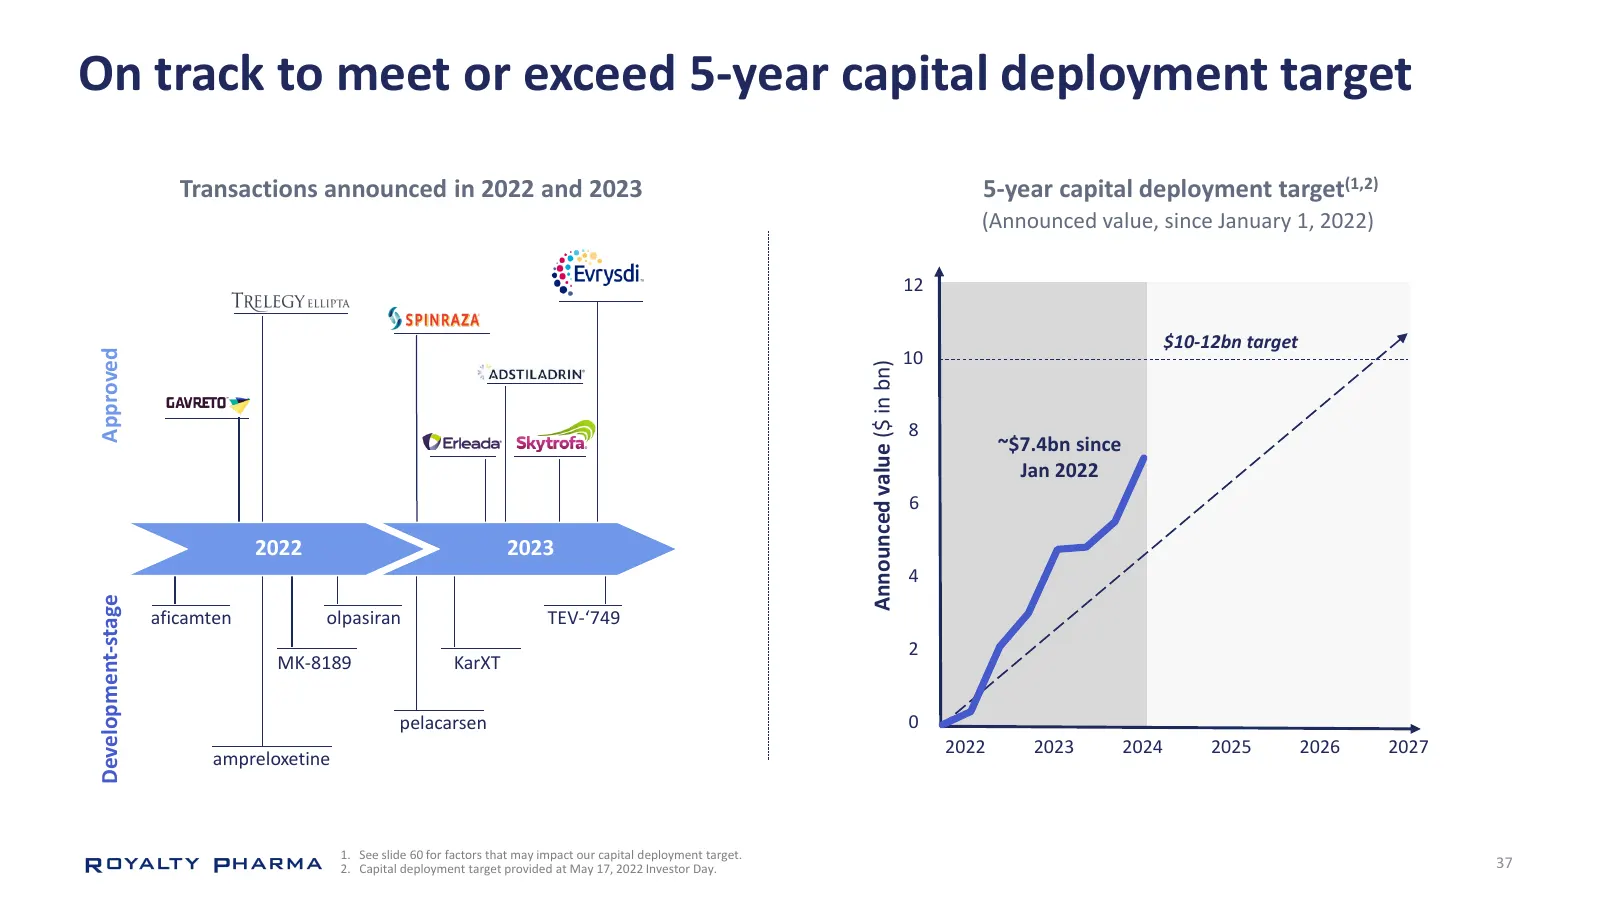
Slide 37: On track to meet or exceed 5-year capital deployment target
On track to meet or exceed 5-year capital deployment target Transactions announced in 2022 and 2023 5-year capital deployment target(1,2) (Announced value, since January 1, 2022) 12 $10-12bn target Approved 10 Announced value ($ in bn) 8 ~$7.4bn since Jan 2022 6 2022 2023 4 Development-stage aficamt
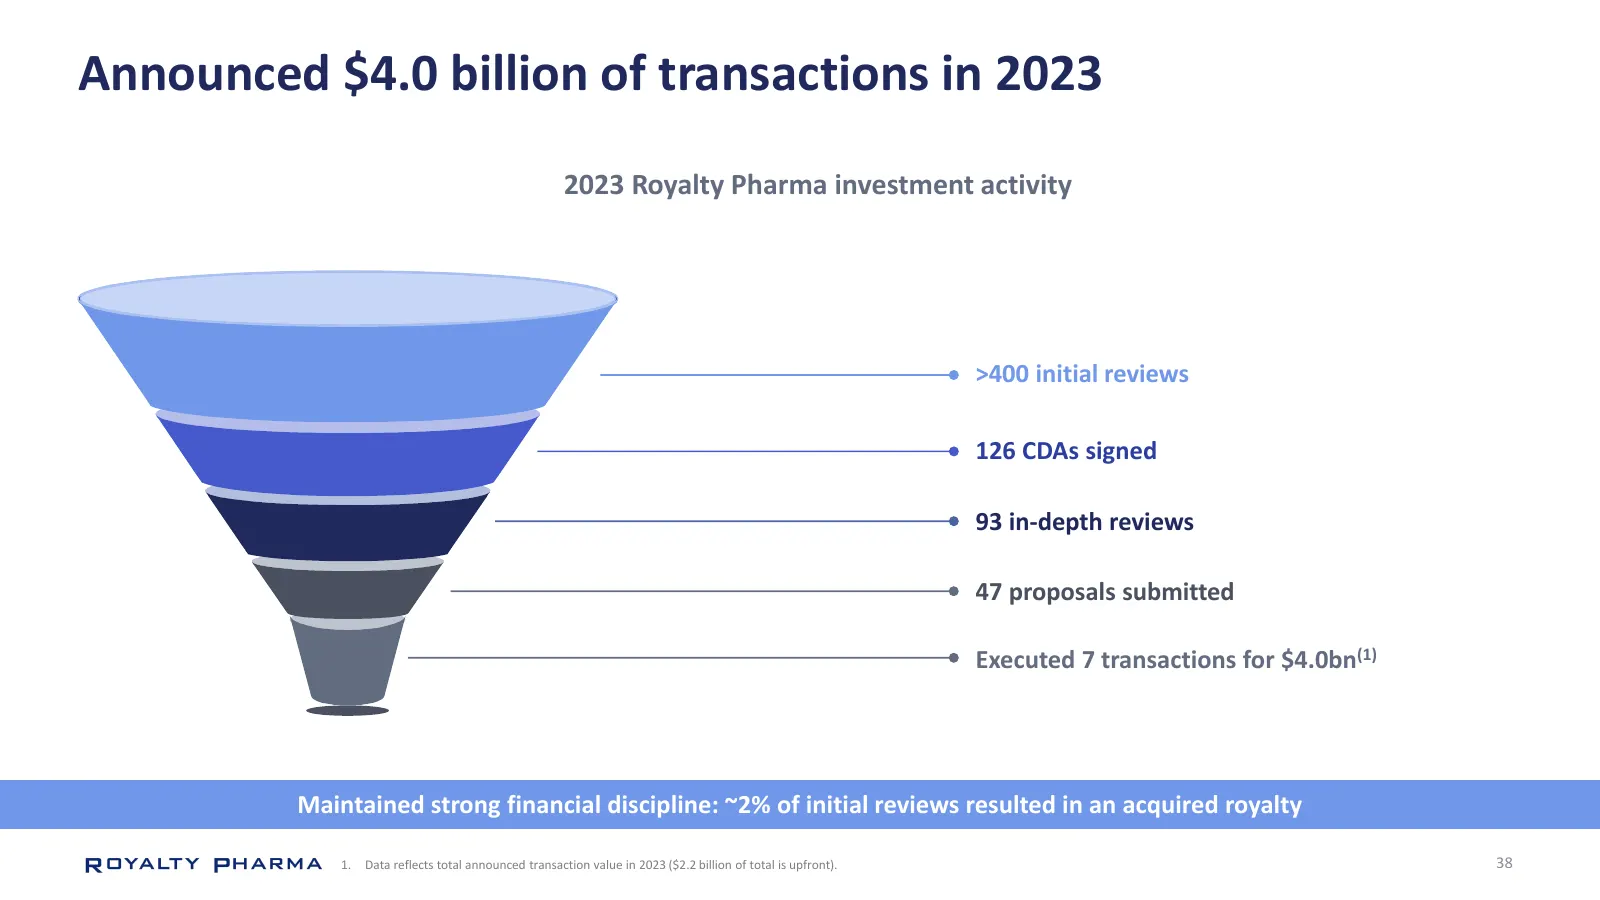
Slide 38: Announced $4.0 billion of transactions in 2023
Announced $4.0 billion of transactions in 2023 2023 Royalty Pharma investment activity >400 initial reviews 126 CDAs signed 93 in-depth reviews 47 proposals submitted Executed 7 transactions for $4.0bn(1) Maintained strong financial discipline: ~2% of initial reviews resulted in an acquired royalty
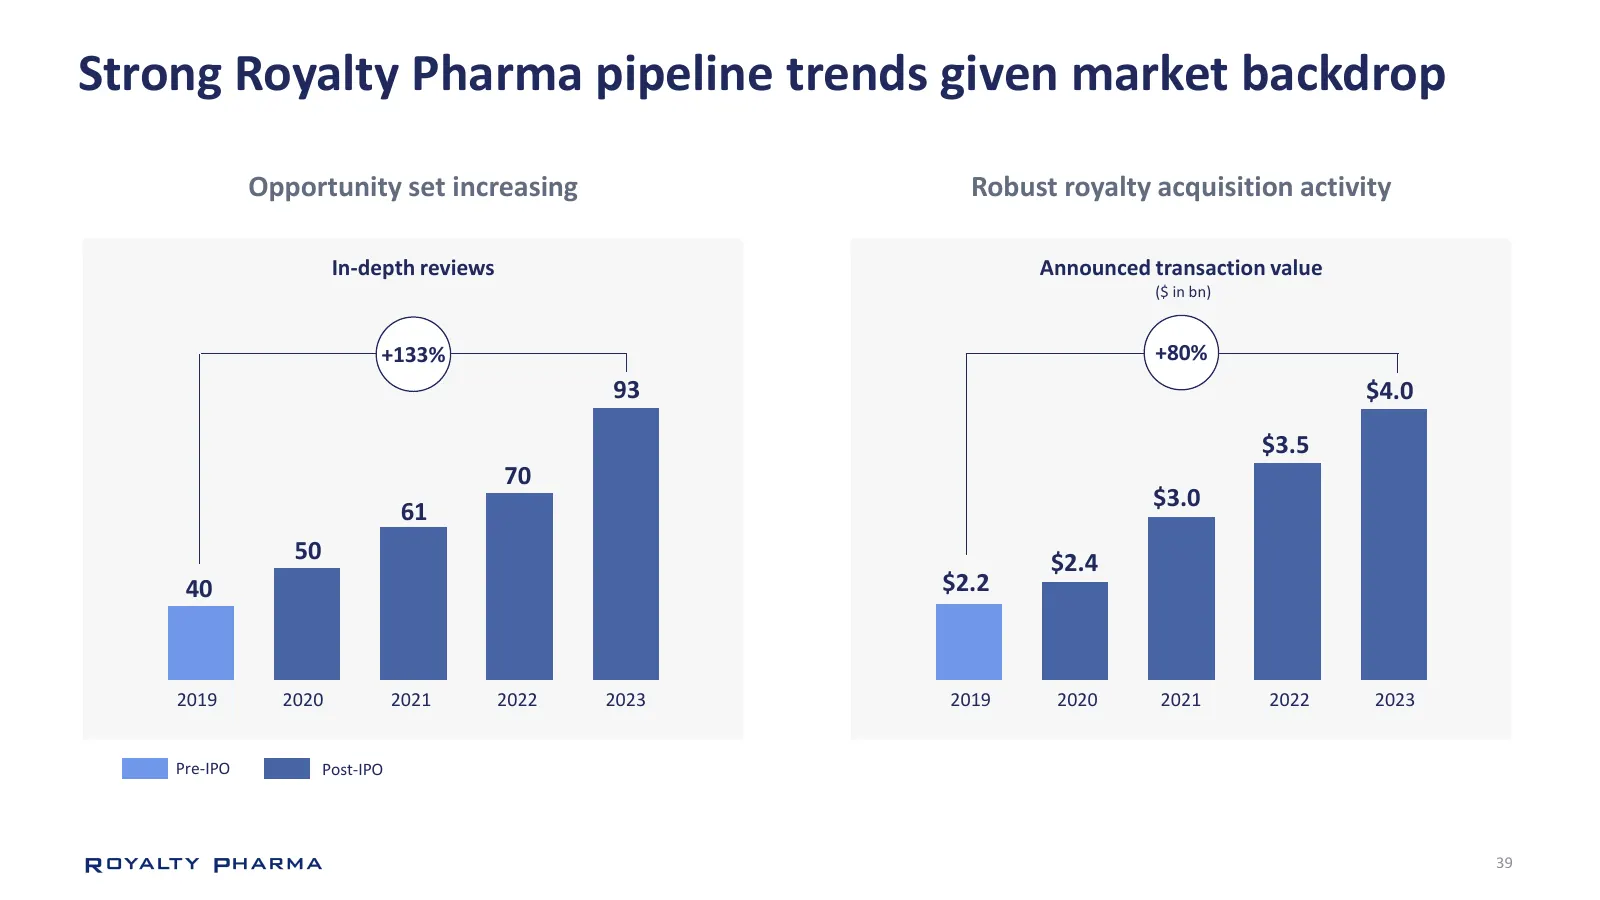
Slide 39: Strong Royalty Pharma pipeline trends given market backdrop
Strong Royalty Pharma pipeline trends given market backdrop Opportunity set increasing Robust royalty acquisition activity In-depth reviews Announced transaction value ($ in bn) +133% +80% 93 $4.0 $3.5 70 $3.0 61 50 $2.4 40 $2.2 2019 2020 2021 2022 2023 2019 2020 2021 2022 2023 Pre-IPO Post-IPO 39
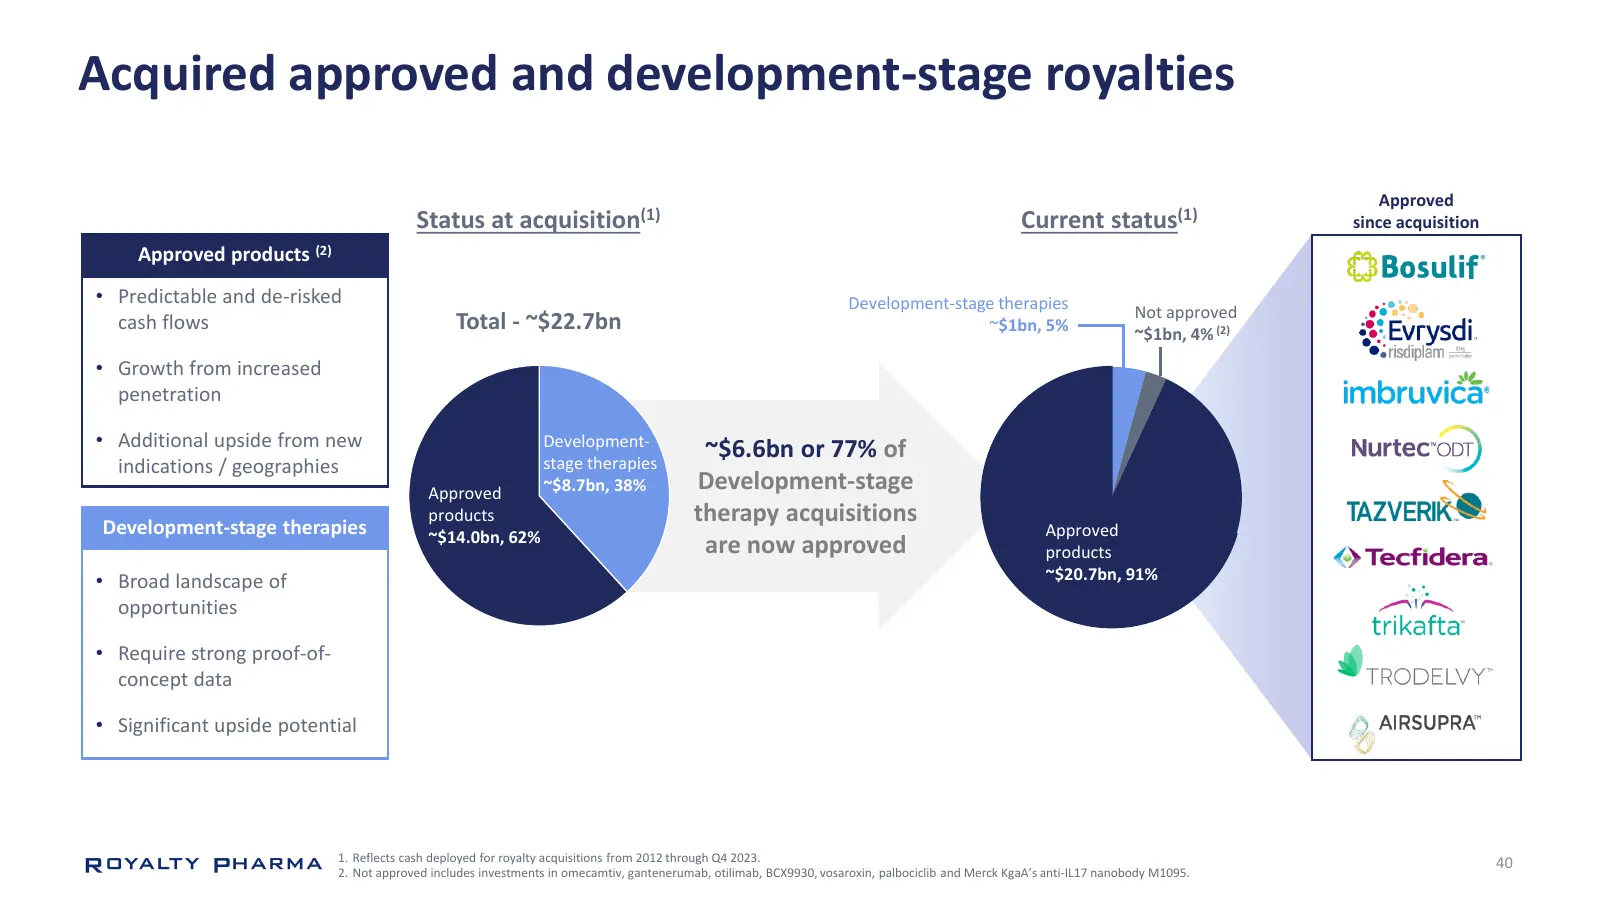
Slide 40: Acquired approved and development-stage royalties
Acquired approved and development-stage royalties Approved Status at acquisition(1) Current status(1) since acquisition Approved products (2) • Predictable and de-risked Development-stage therapies Not approved cash flows Total - ~$22.7bn ~$1bn, 5% ~$1bn, 4% (2) • Growth from increased penetration •
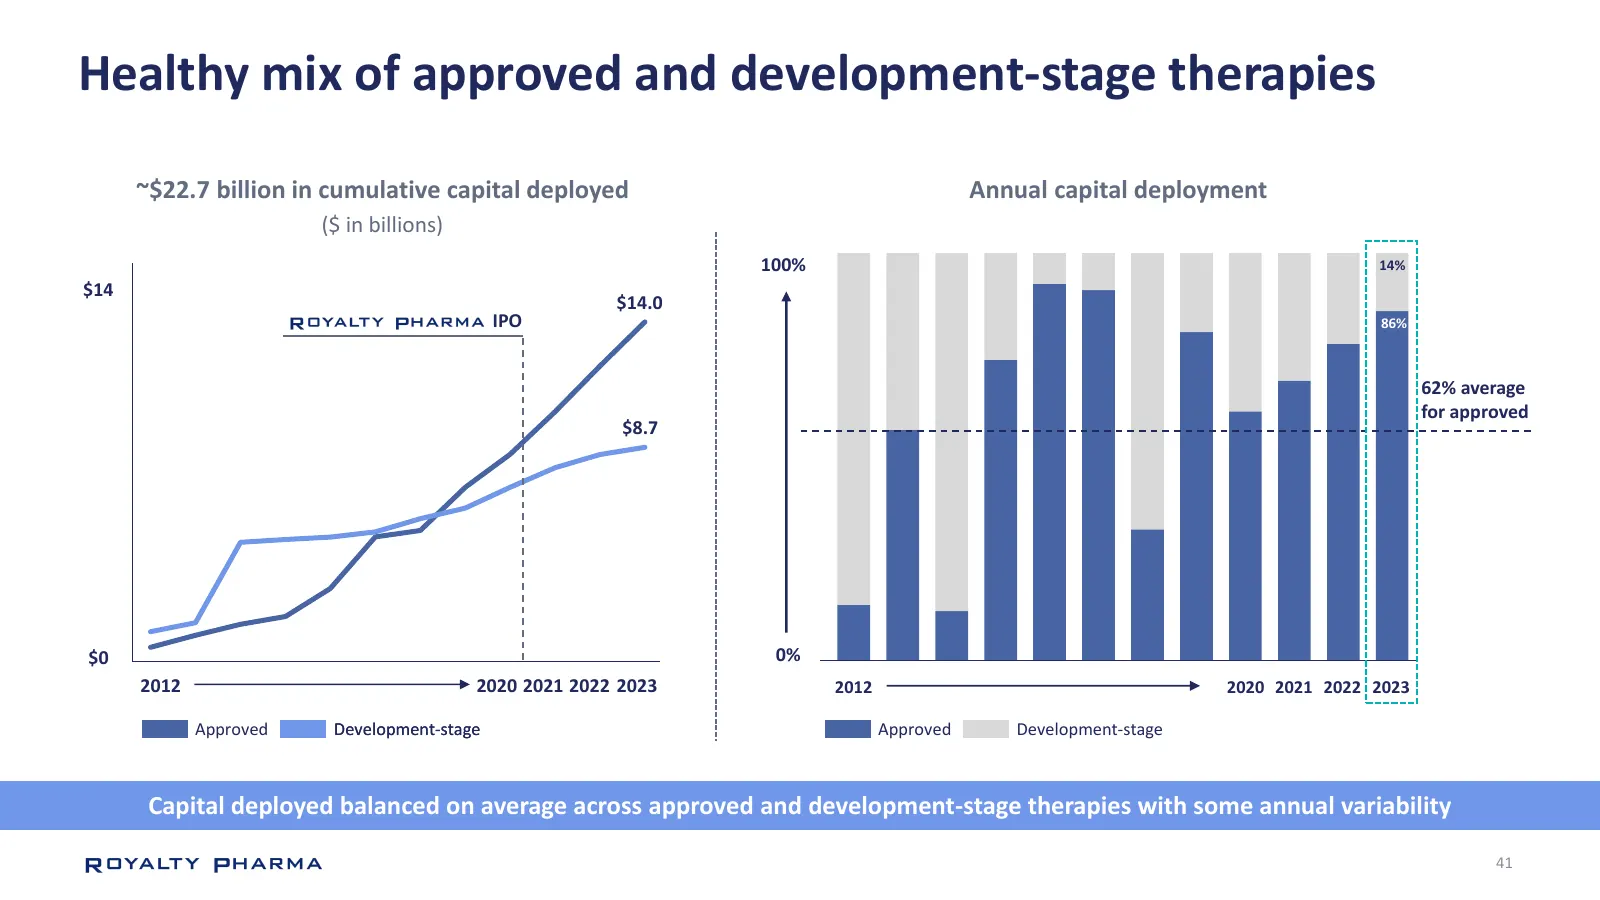
Slide 41: Healthy mix of approved and development-stage therapies
Healthy mix of approved and development-stage therapies ~$22.7 billion in cumulative capital deployed Annual capital deployment ($ in billions) 100% 14% $14 $14.0 IPO 86% 62% average for approved $8.7 $0 0% 2012 2020 2021 2022 2023 2012 2020 2021 2022 2023 Approved Development-stage Approved Develop
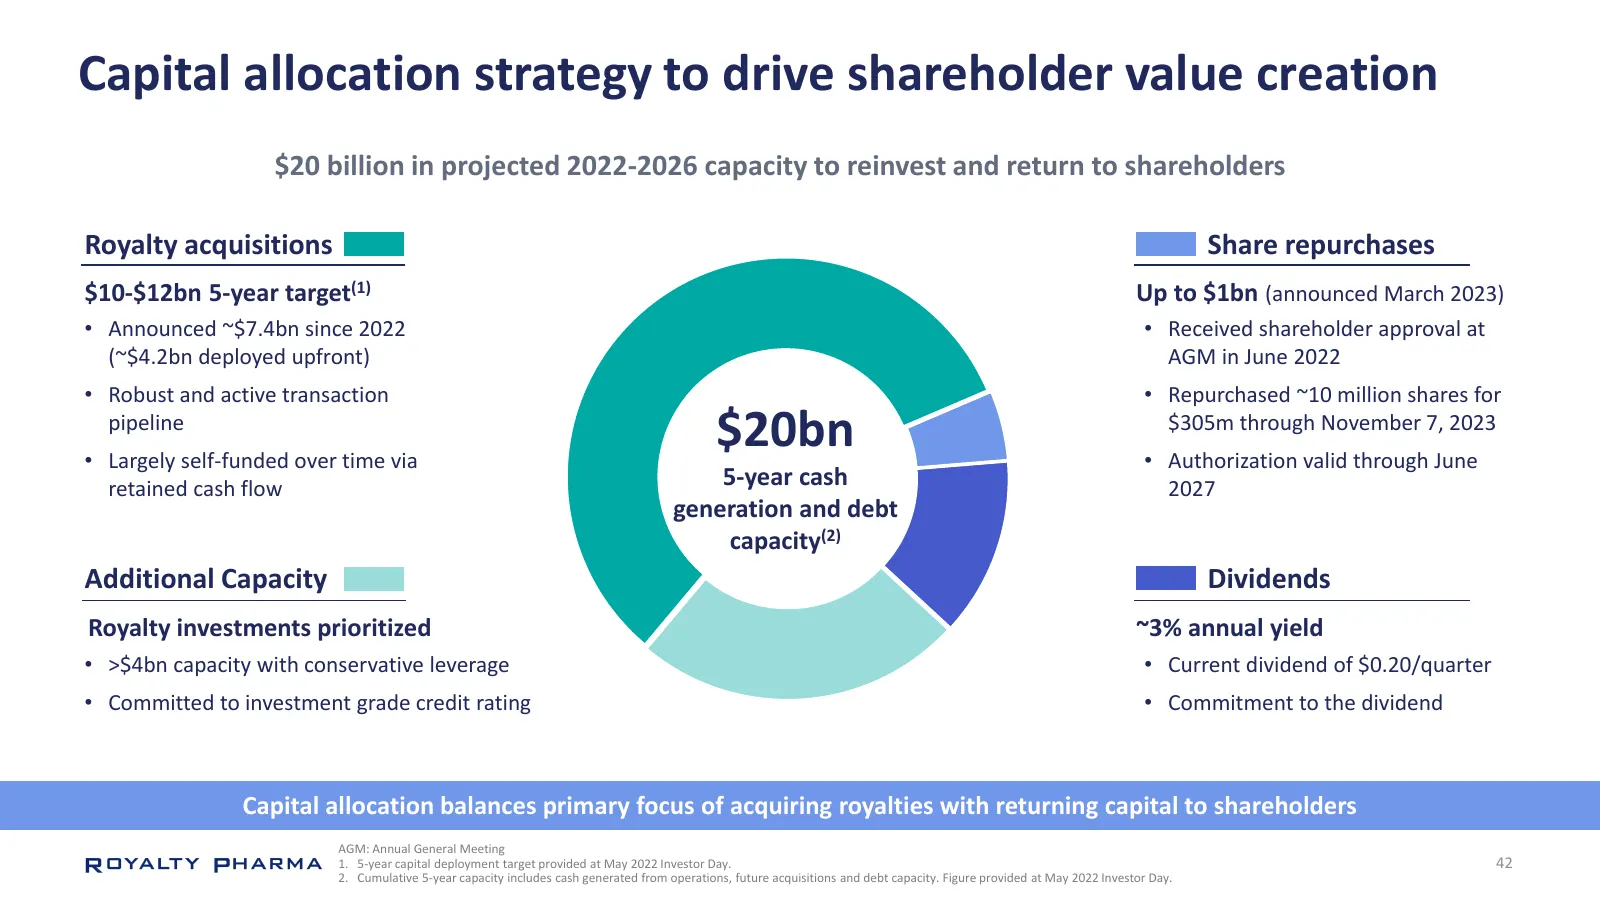
Slide 42: Capital allocation strategy to drive shareholder value creation
Capital allocation strategy to drive shareholder value creation $20 billion in projected 2022-2026 capacity to reinvest and return to shareholders Royalty acquisitions Share repurchases $10-$12bn 5-year target(1) Up to $1bn (announced March 2023) • Announced ~$7.4bn since 2022 • Received shareholder
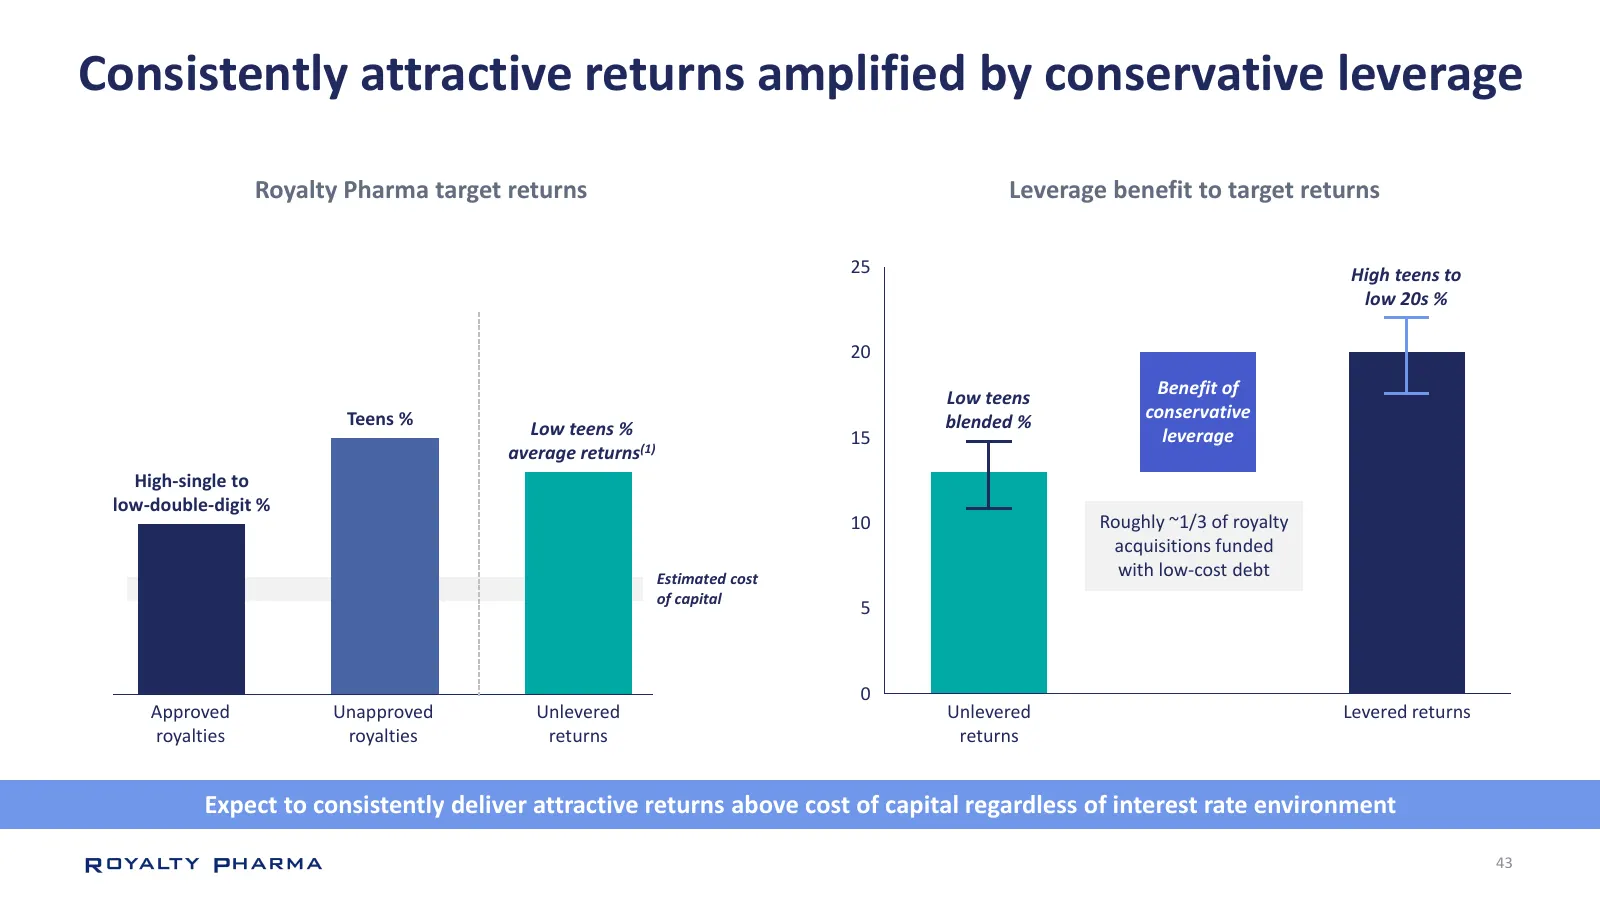
Slide 43: Consistently attractive returns amplified by conservative leverage
Consistently attractive returns amplified by conservative leverage Royalty Pharma target returns Leverage benefit to target returns 25 High teens to low 20s % 20 Low teens Benefit of Teens % blended % conservative Low teens % 15 leverage average returns(1) High-single to low-double-digit % 10 Roughl
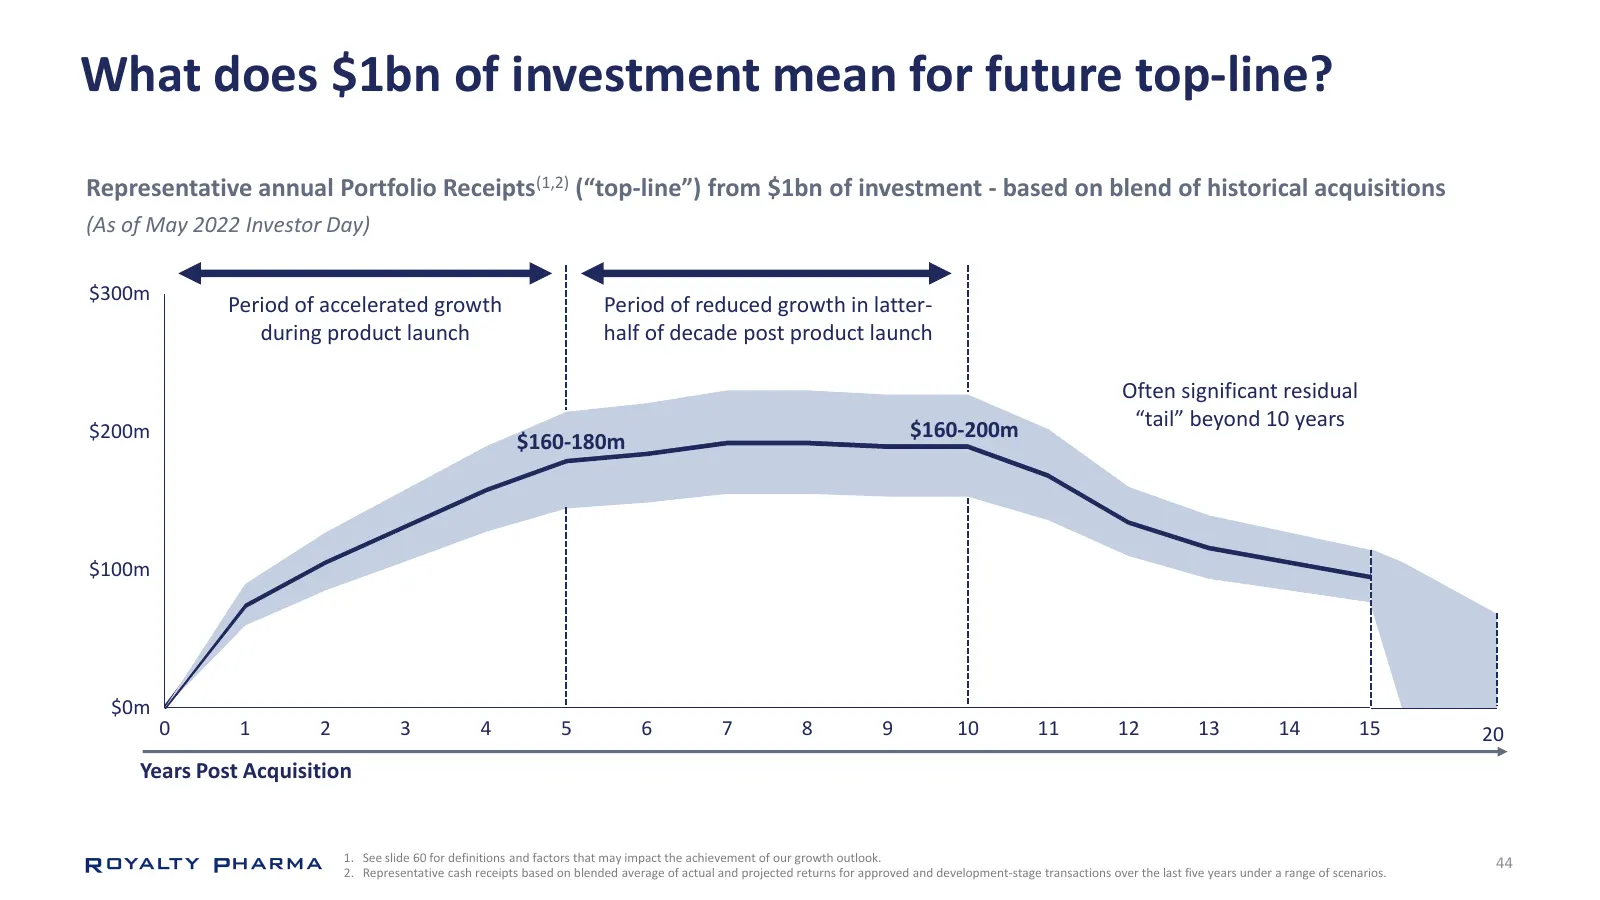
Slide 44: What does $1bn of investment mean for future top-line?
What does $1bn of investment mean for future top-line? Representative annual Portfolio Receipts(1,2) (“top-line”) from $1bn of investment - based on blend of historical acquisitions (As of May 2022 Investor Day) $300m Period of accelerated growth Period of reduced growth in latter- during product la
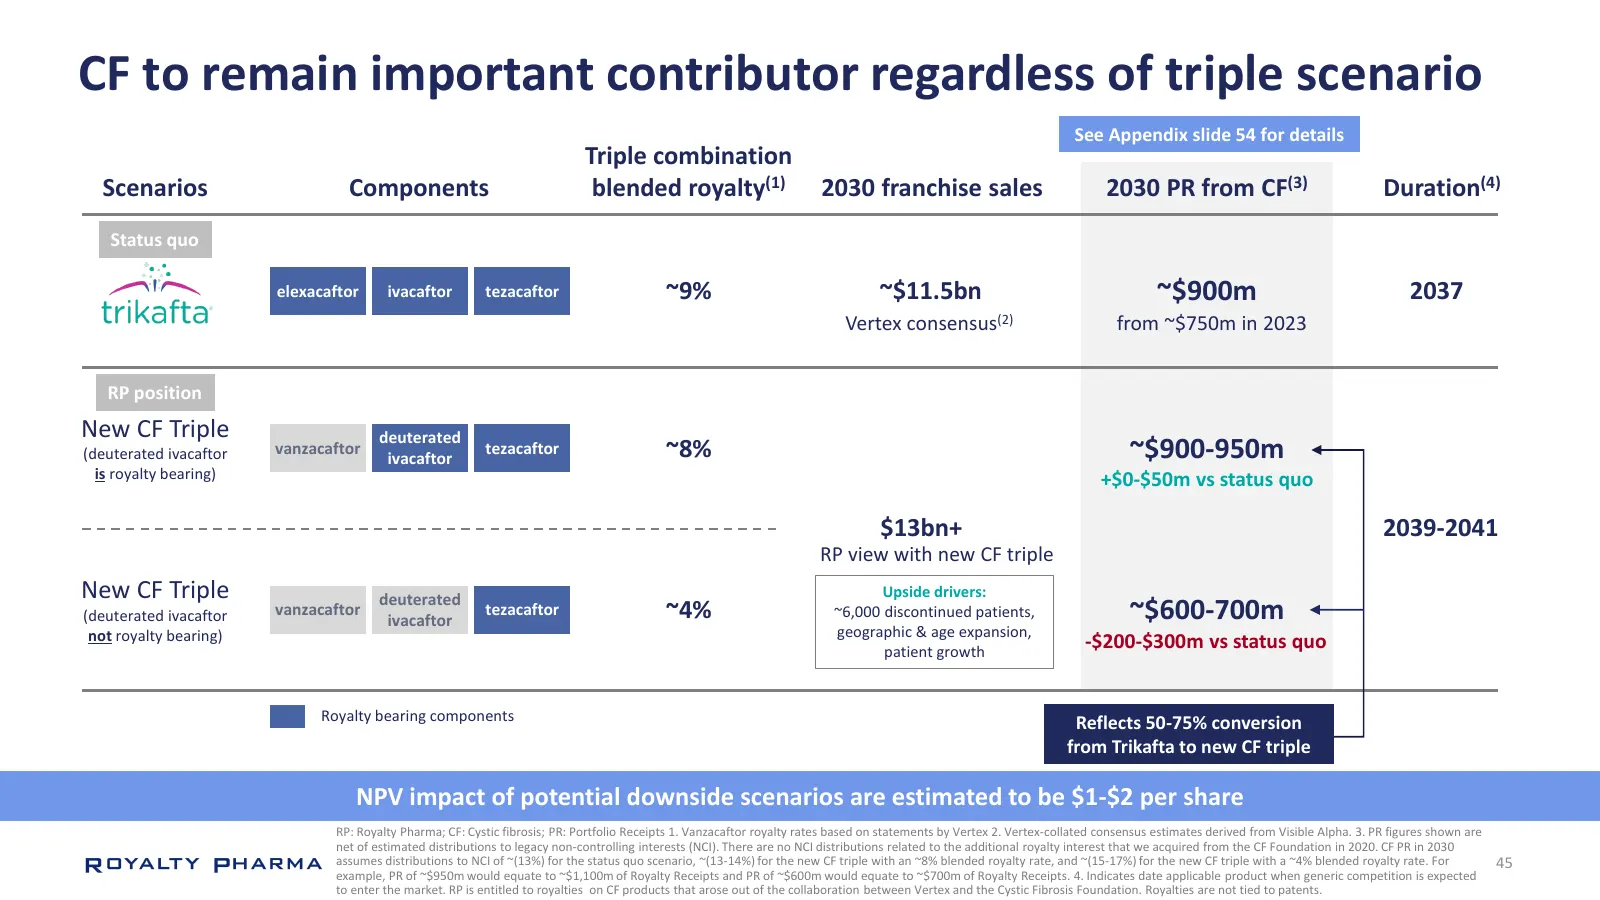
Slide 45: CF to remain important contributor regardless of triple scenario
CF to remain important contributor regardless of triple scenario See Appendix slide 54 for details Triple combination Scenarios Components blended royalty(1) 2030 franchise sales 2030 PR from CF(3) Duration(4) Status quo elexacaftor ivacaftor tezacaftor ~9% ~$11.5bn ~$900m 2037 Vertex consensus(2) f
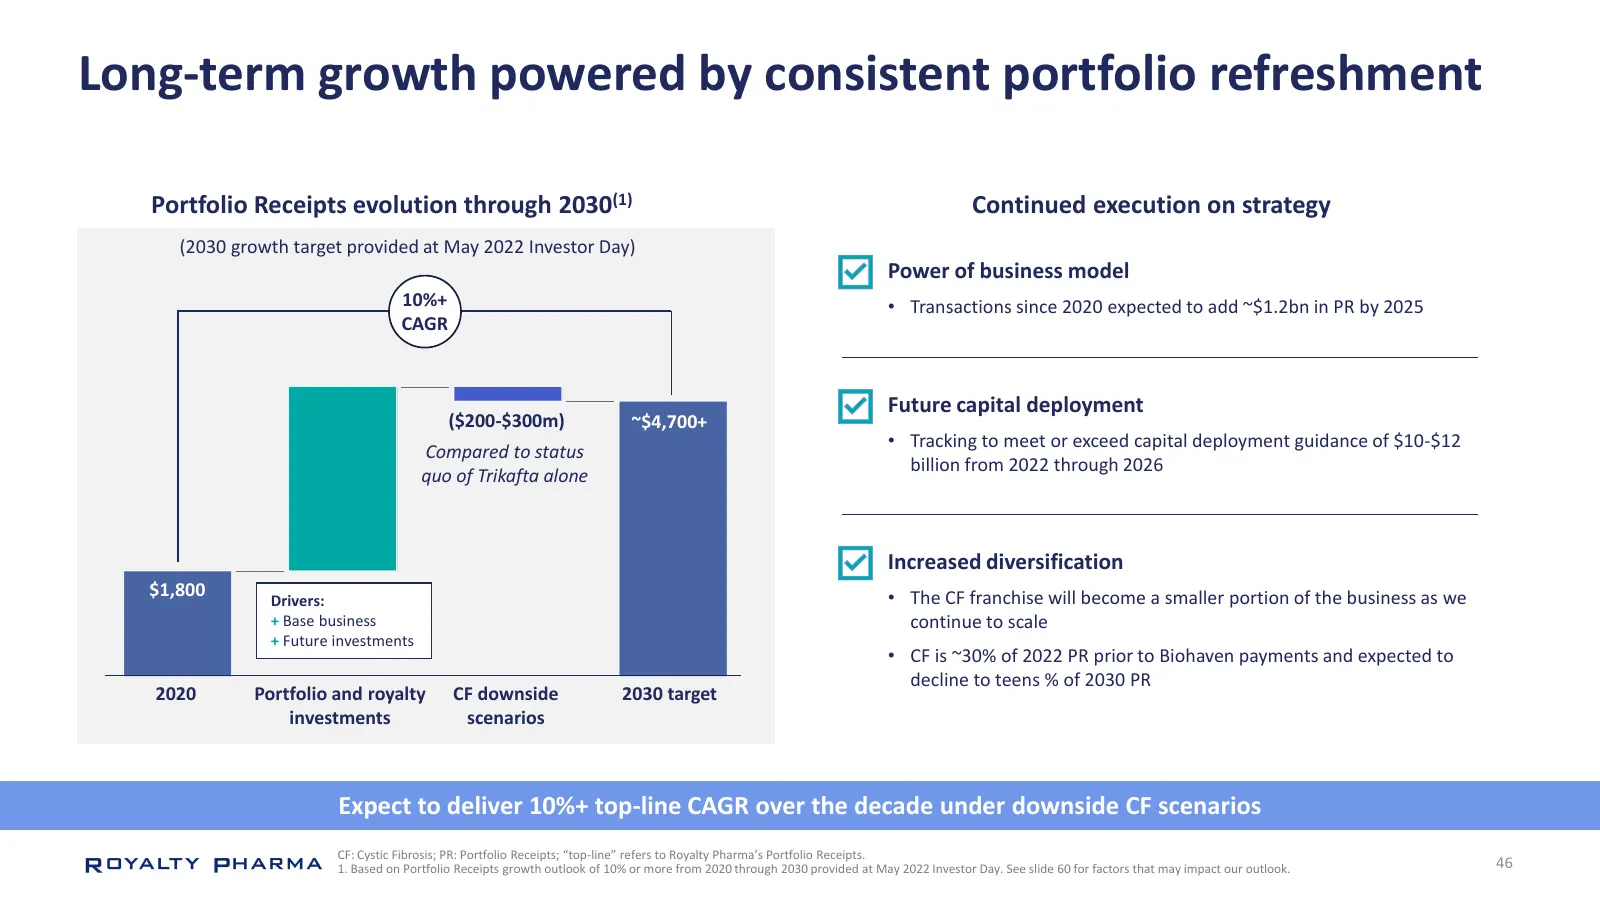
Slide 46: Long-term growth powered by consistent portfolio refreshment
Long-term growth powered by consistent portfolio refreshment Portfolio Receipts evolution through 2030(1) Continued execution on strategy (2030 growth target provided at May 2022 Investor Day) Power of business model 10%+ • Transactions since 2020 expected to add ~$1.2bn in PR by 2025 0 CAGR Future
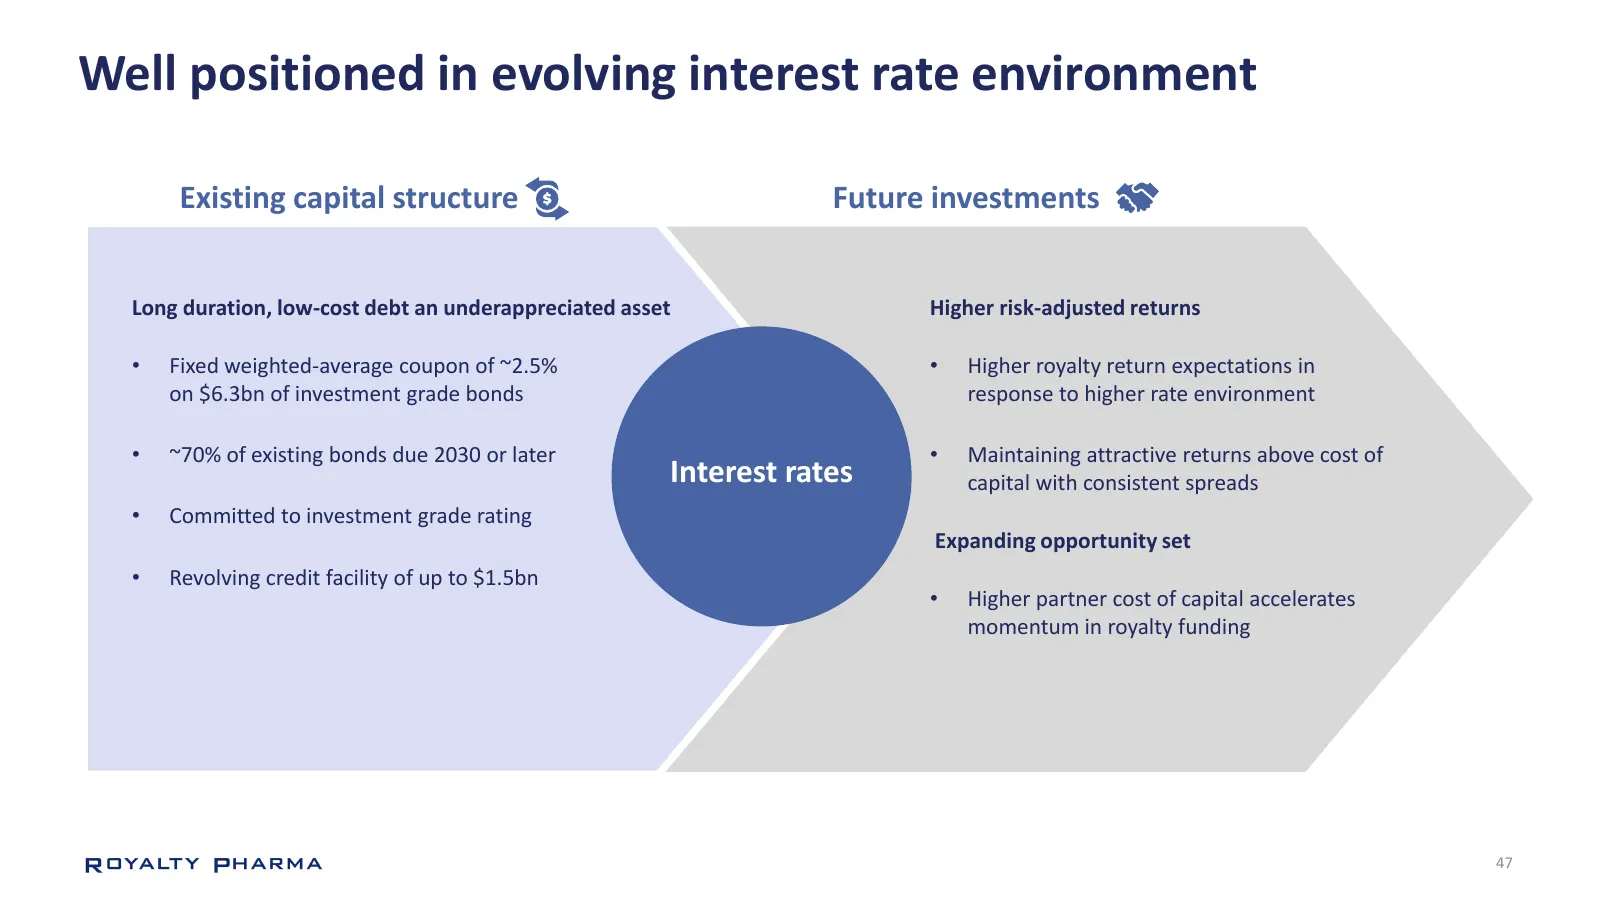
Slide 47: Well positioned in evolving interest rate environment
Well positioned in evolving interest rate environment Existing capital structure Future investments Long duration, low-cost debt an underappreciated asset Higher risk-adjusted returns • Fixed weighted-average coupon of ~2.5% • Higher royalty return expectations in on $6.3bn of investment grade bonds
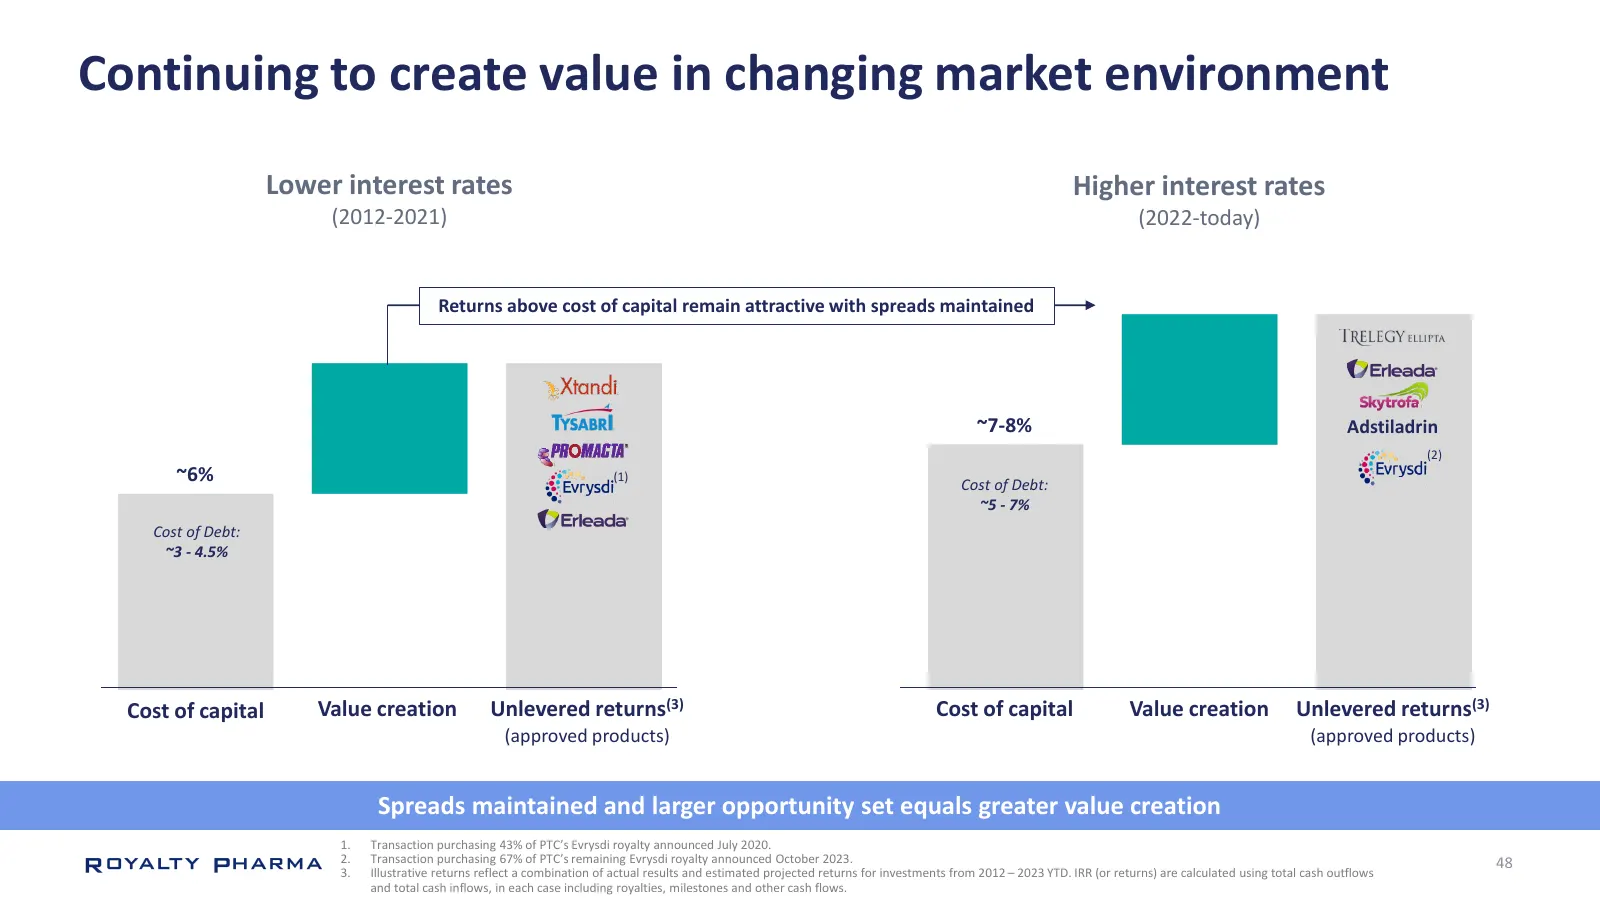
Slide 48: Continuing to create value in changing market environment
Continuing to create value in changing market environment Lower interest rates Higher interest rates (2012-2021) (2022-today) Returns above cost of capital remain attractive with spreads maintained ~7-8% Adstiladrin (2) ~6% (1) Cost of Debt: ~5 - 7% Cost of Debt: ~3 - 4.5% Cost of capital Value crea
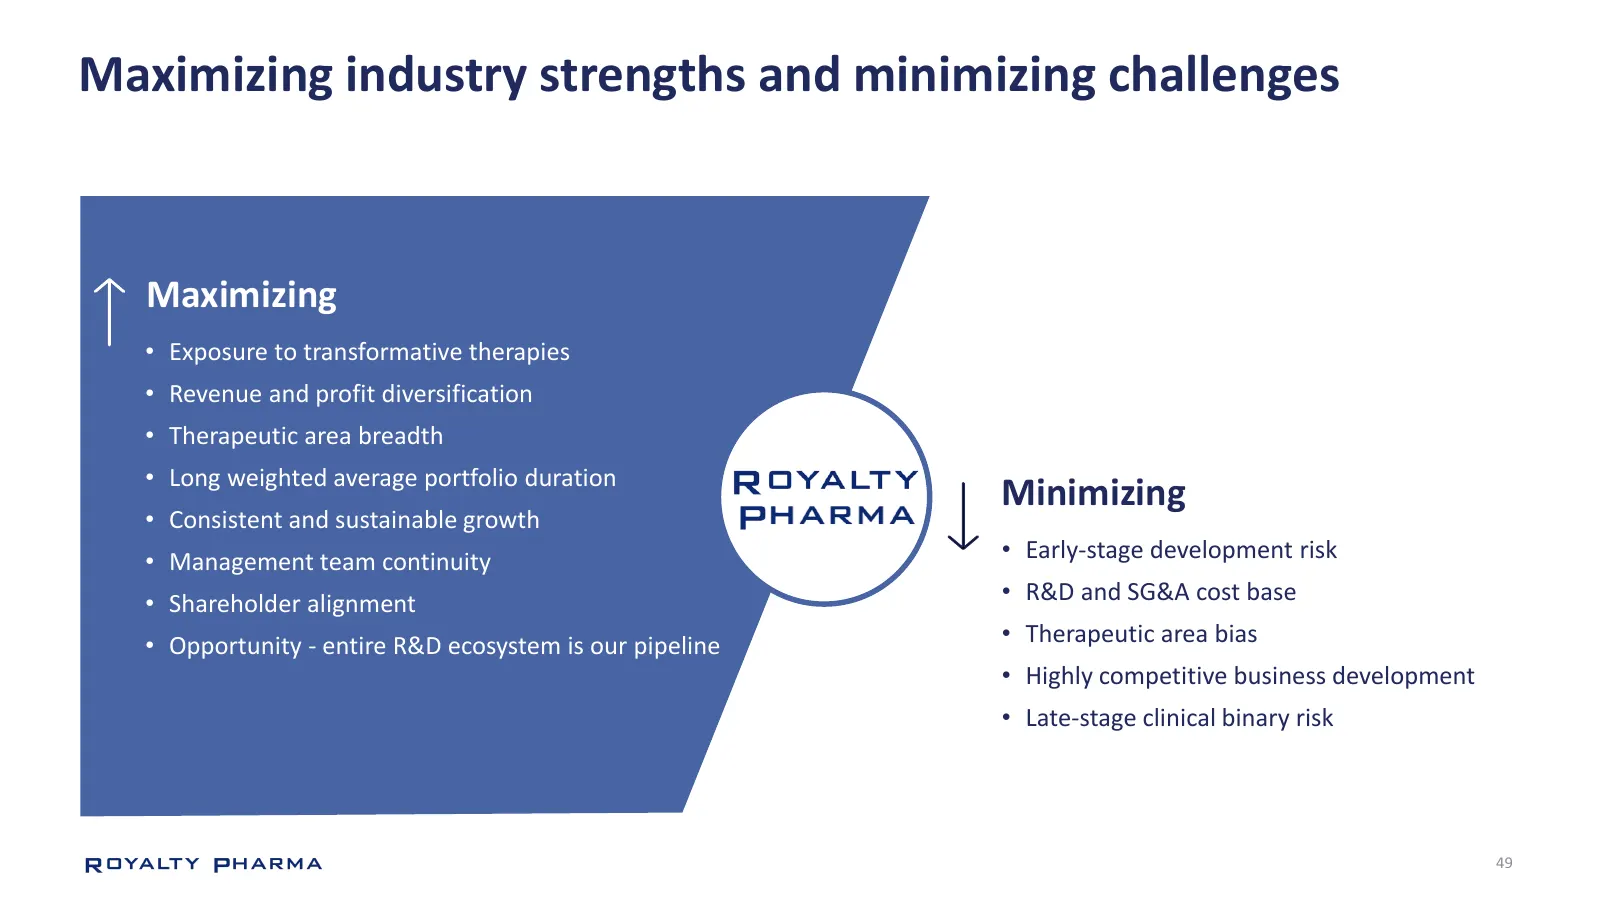
Slide 49: Maximizing industry strengths and minimizing challenges
Maximizing industry strengths and minimizing challenges Maximizing • Exposure to transformative therapies • Revenue and profit diversification • Therapeutic area breadth • Long weighted average portfolio duration Minimizing • Consistent and sustainable growth • Management team continuity • Early-sta
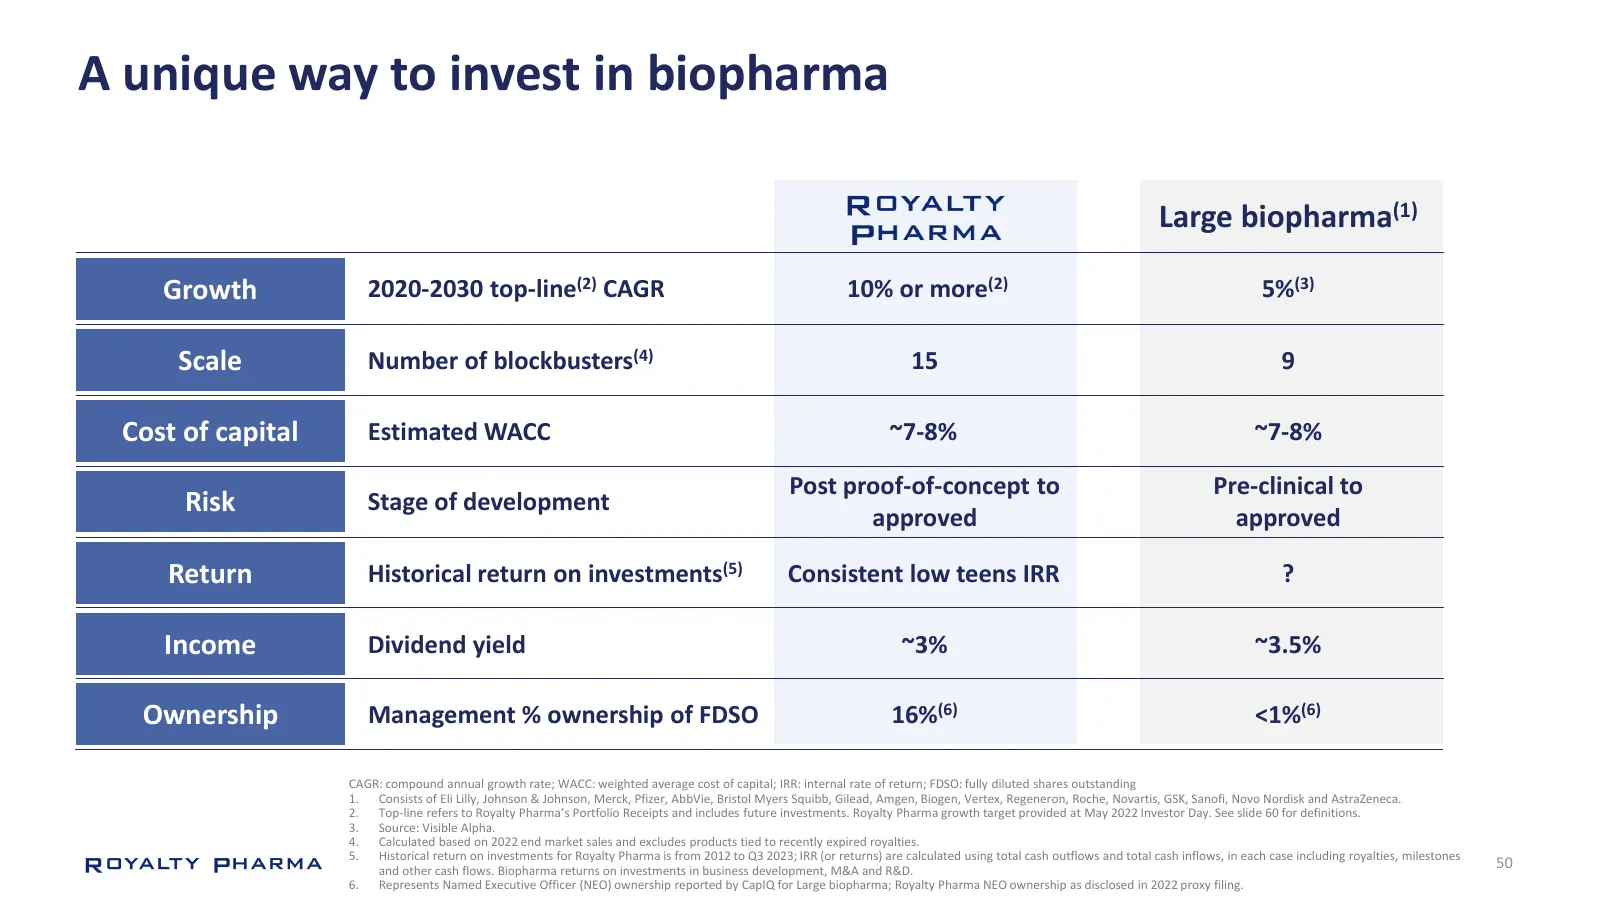
Slide 50: A unique way to invest in biopharma
A unique way to invest in biopharma Large biopharma(1) Growth Maximizing 2020-2030 top-line(2) CAGR 10% or more(2) 5%(3) Scale Number of blockbusters(4) 15 9 Cost of capital Estimated WACC ~7-8% ~7-8% Post proof-of-concept to Pre-clinical to Risk Stage of development approved approved Return Histori
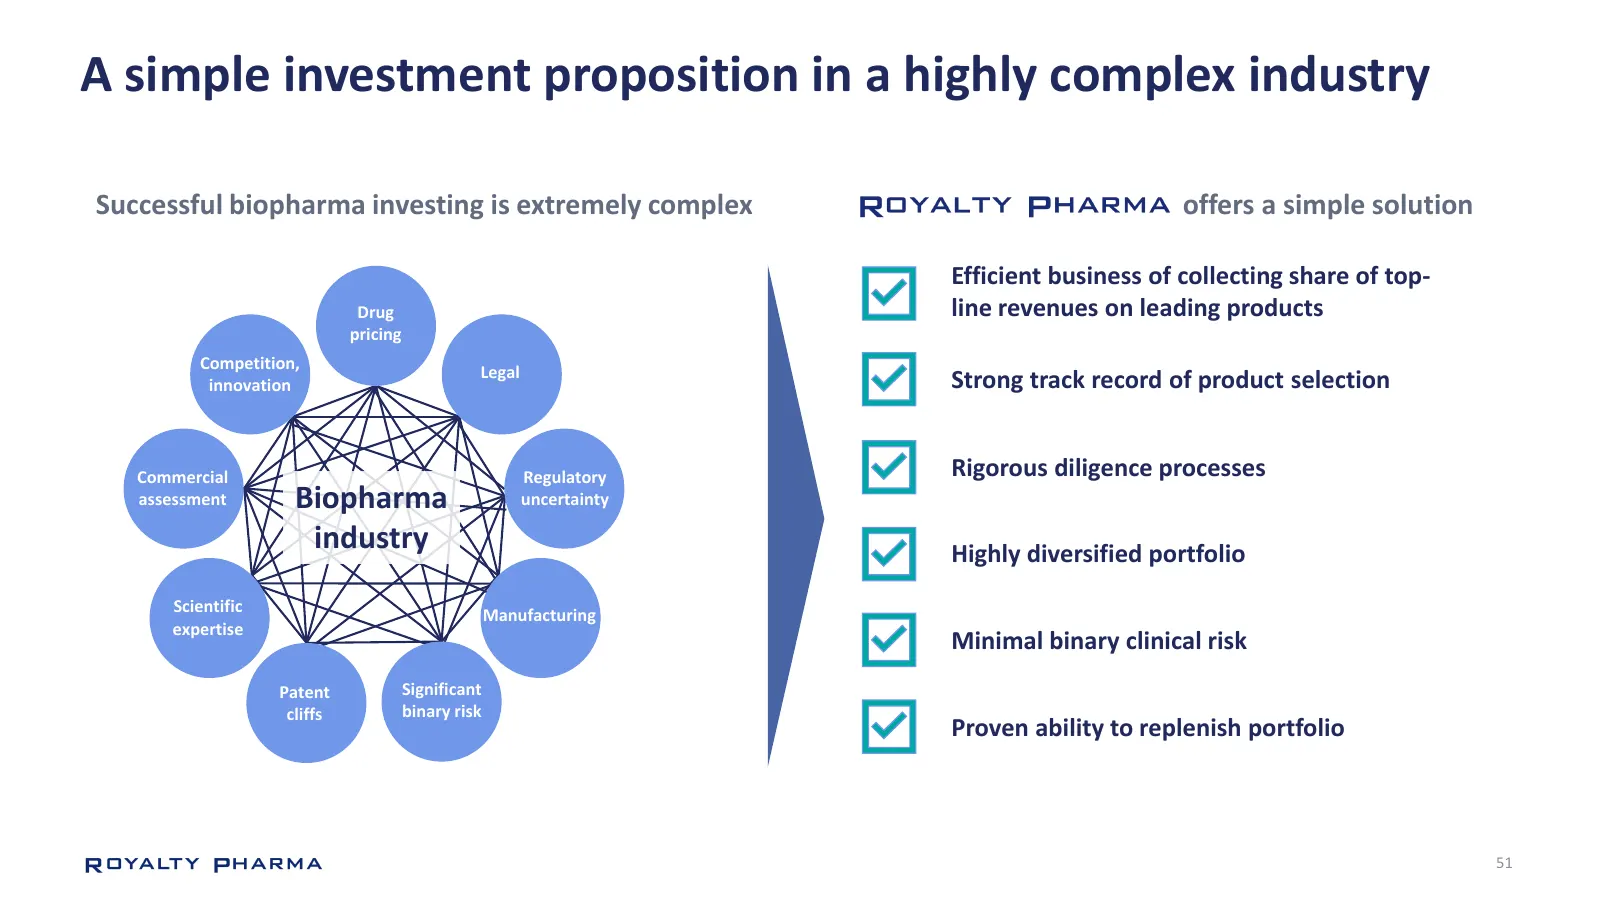
Slide 51: A simple investment proposition in a highly complex industry
A simple investment proposition in a highly complex industry Successful biopharma investing is extremely complex offers a simple solution Efficient business of collecting share of top- Drug line revenues on leading products pricing Competition, Legal innovation Strong track record of product selecti
Slide 52: Appendix
Appendix ROYALTY PHARMA
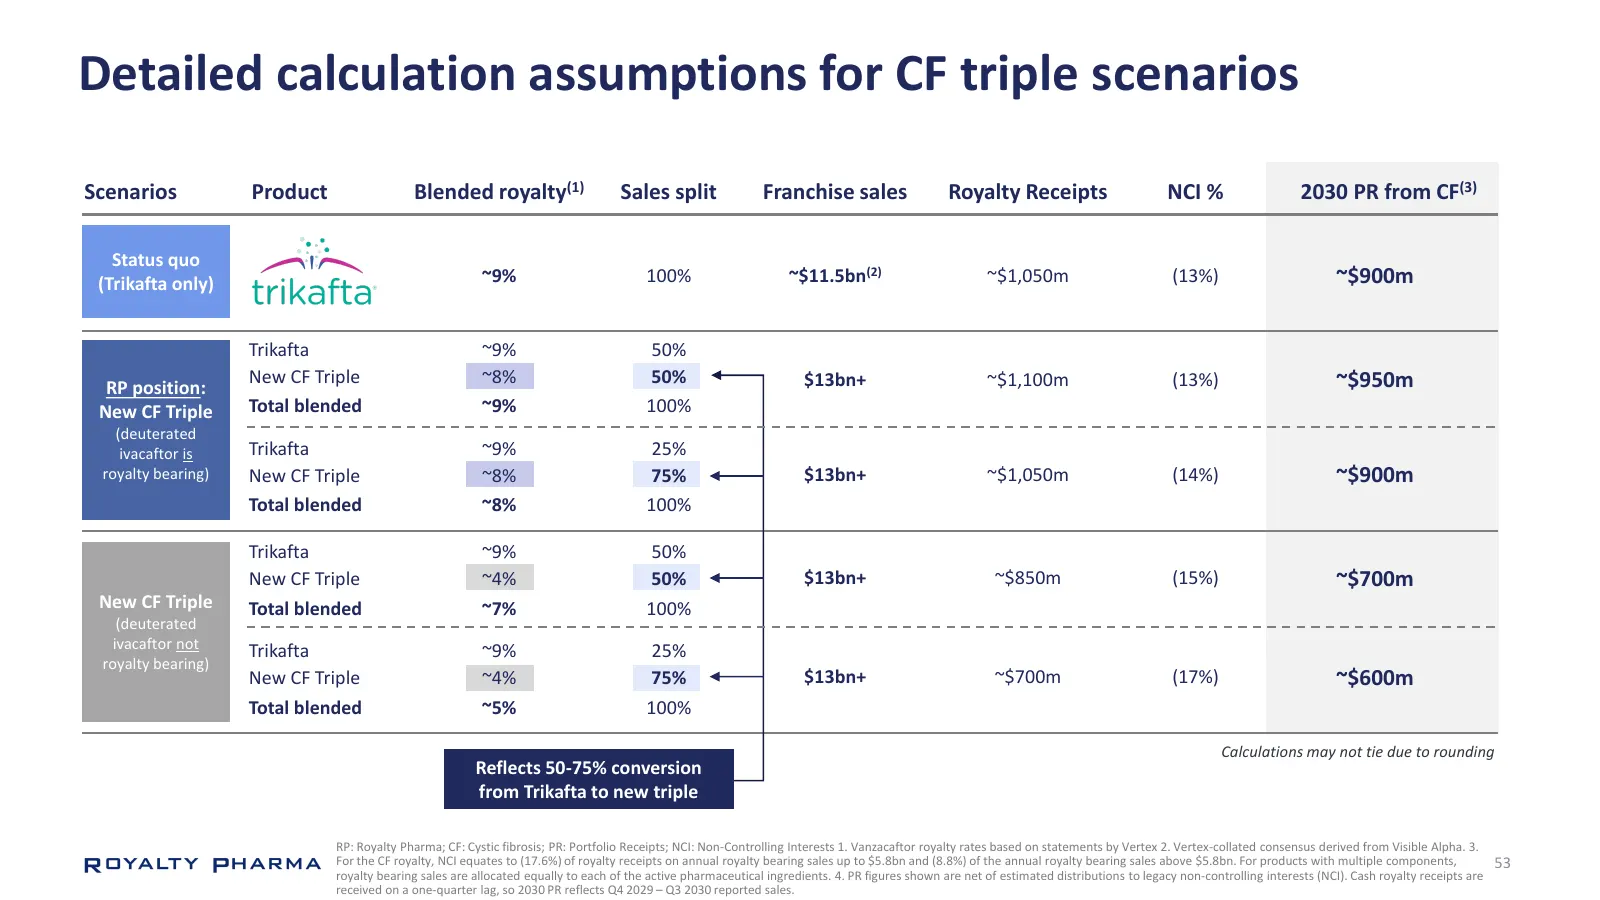
Slide 53: Detailed calculation assumptions for CF triple scenarios
Detailed calculation assumptions for CF triple scenarios Scenarios Product Blended royalty(1) Sales split Franchise sales Royalty Receipts NCI % 2030 PR from CF(3) Status quo (Trikafta only) ~9% 100% ~$11.5bn(2) ~$1,050m (13%) ~$900m Trikafta ~9% 50% New CF Triple ~8% 50% $13bn+ ~$1,100m (13%) ~$950
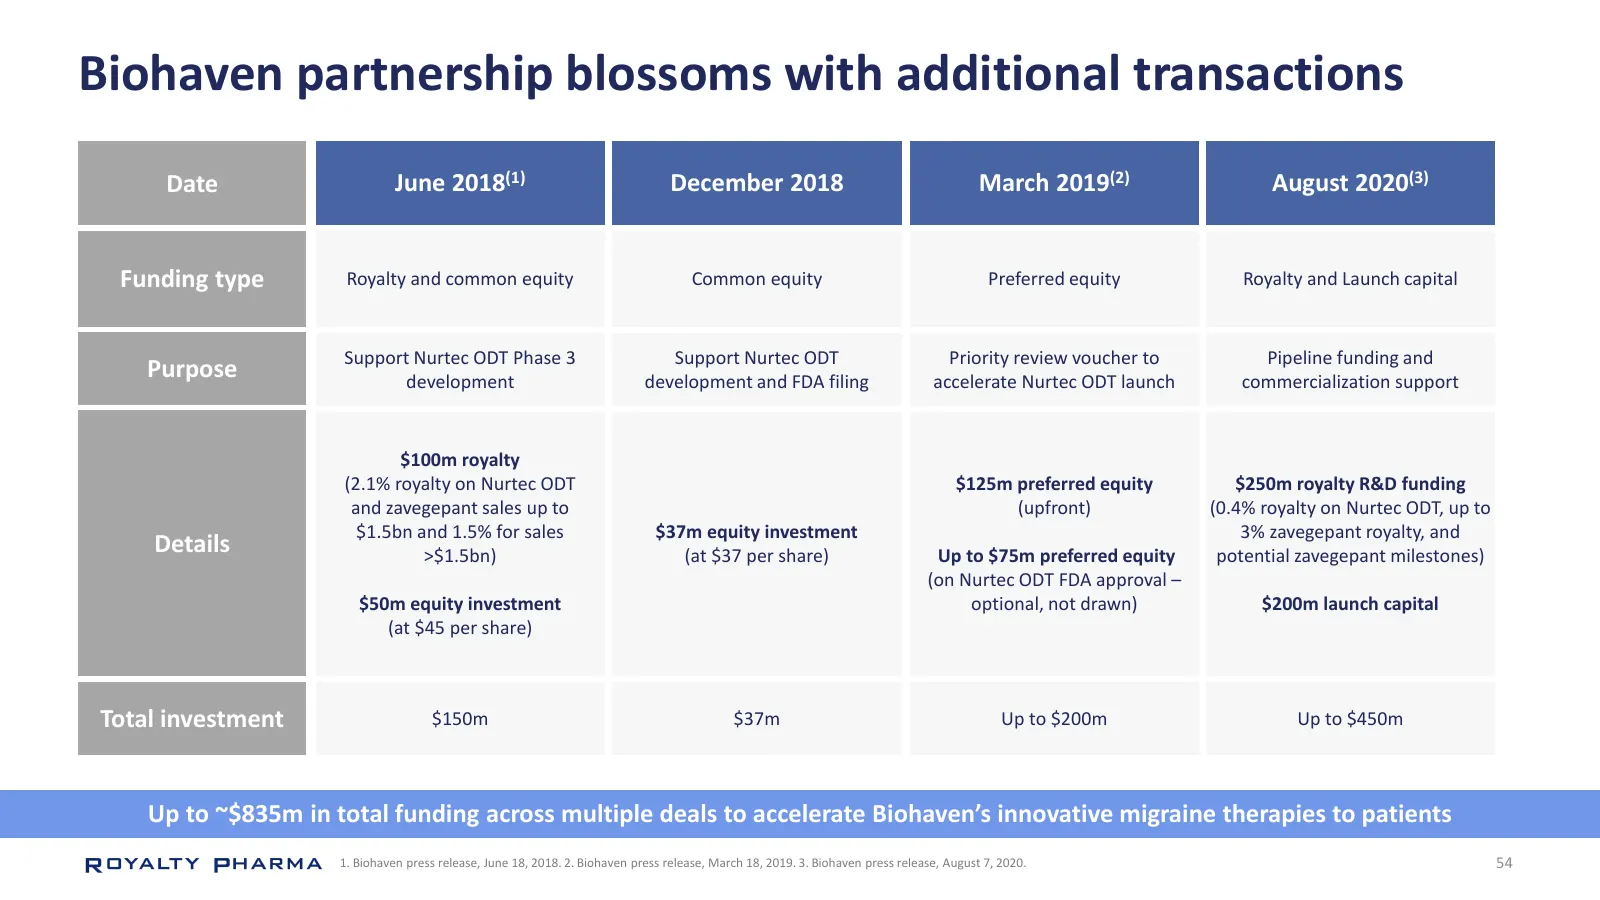
Slide 54: Biohaven partnership blossoms with additional transactions
Biohaven partnership blossoms with additional transactions Date June 2018(1) December 2018 March 2019(2) August 2020(3) Funding type Royalty and common equity Common equity Preferred equity Royalty and Launch capital Support Nurtec ODT Phase 3 Support Nurtec ODT Priority review voucher to Pipeline f
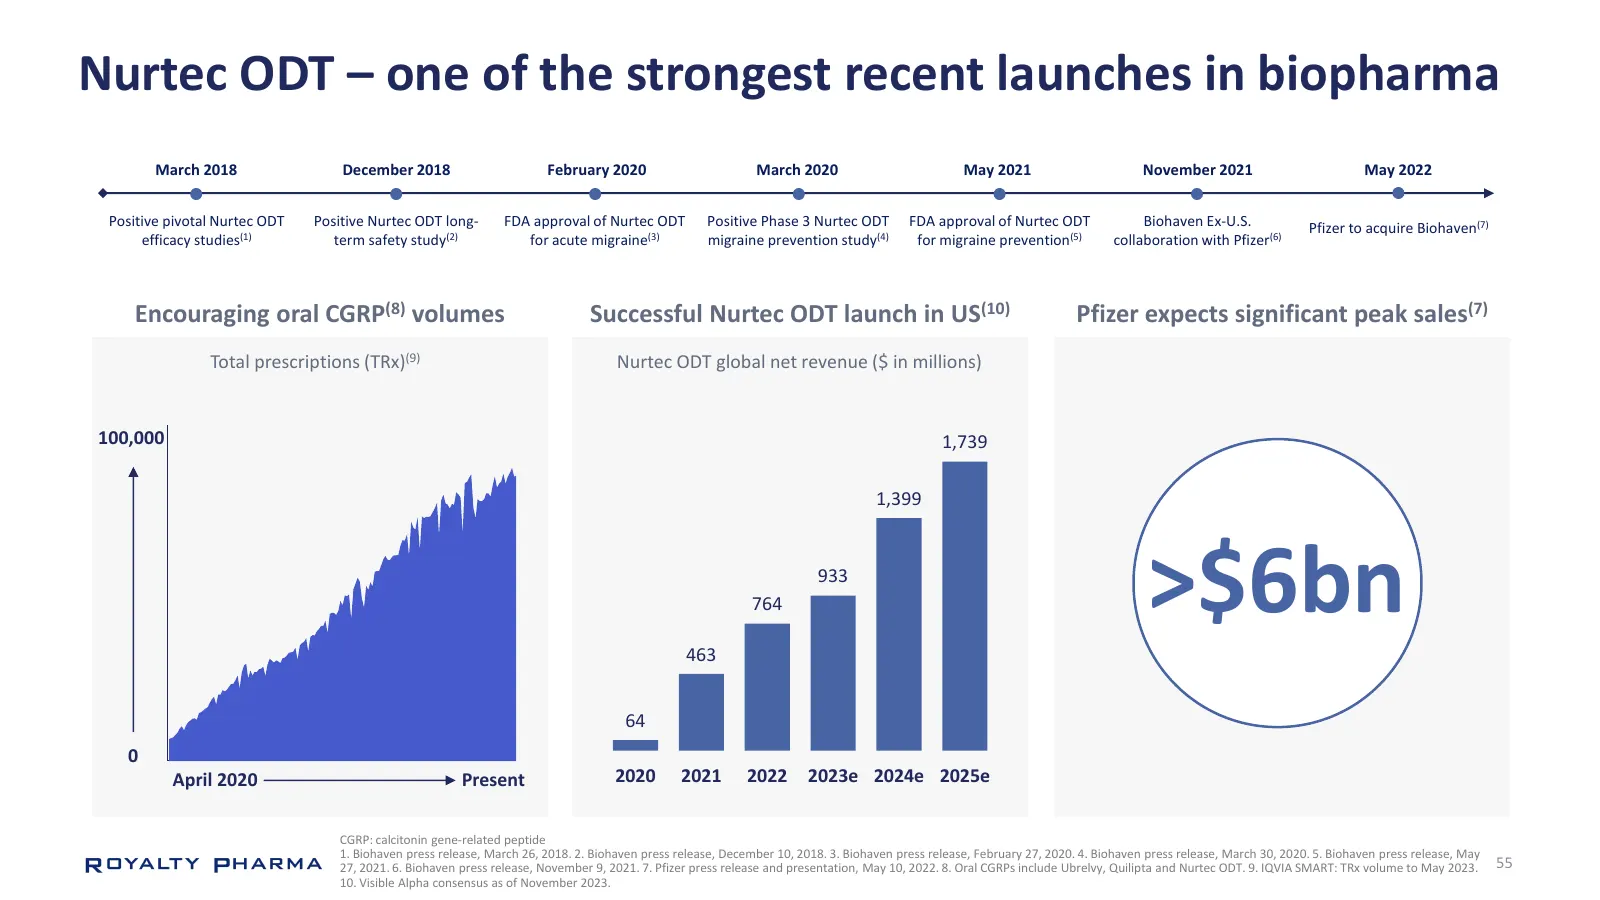
Slide 55: Nurtec ODT – one of the strongest recent launches in biopharma
Nurtec ODT – one of the strongest recent launches in biopharma March 2018 December 2018 February 2020 March 2020 May 2021 November 2021 May 2022 Positive pivotal Nurtec ODT Positive Nurtec ODT long- FDA approval of Nurtec ODT Positive Phase 3 Nurtec ODT FDA approval of Nurtec ODT Biohaven Ex-U.S. Pf
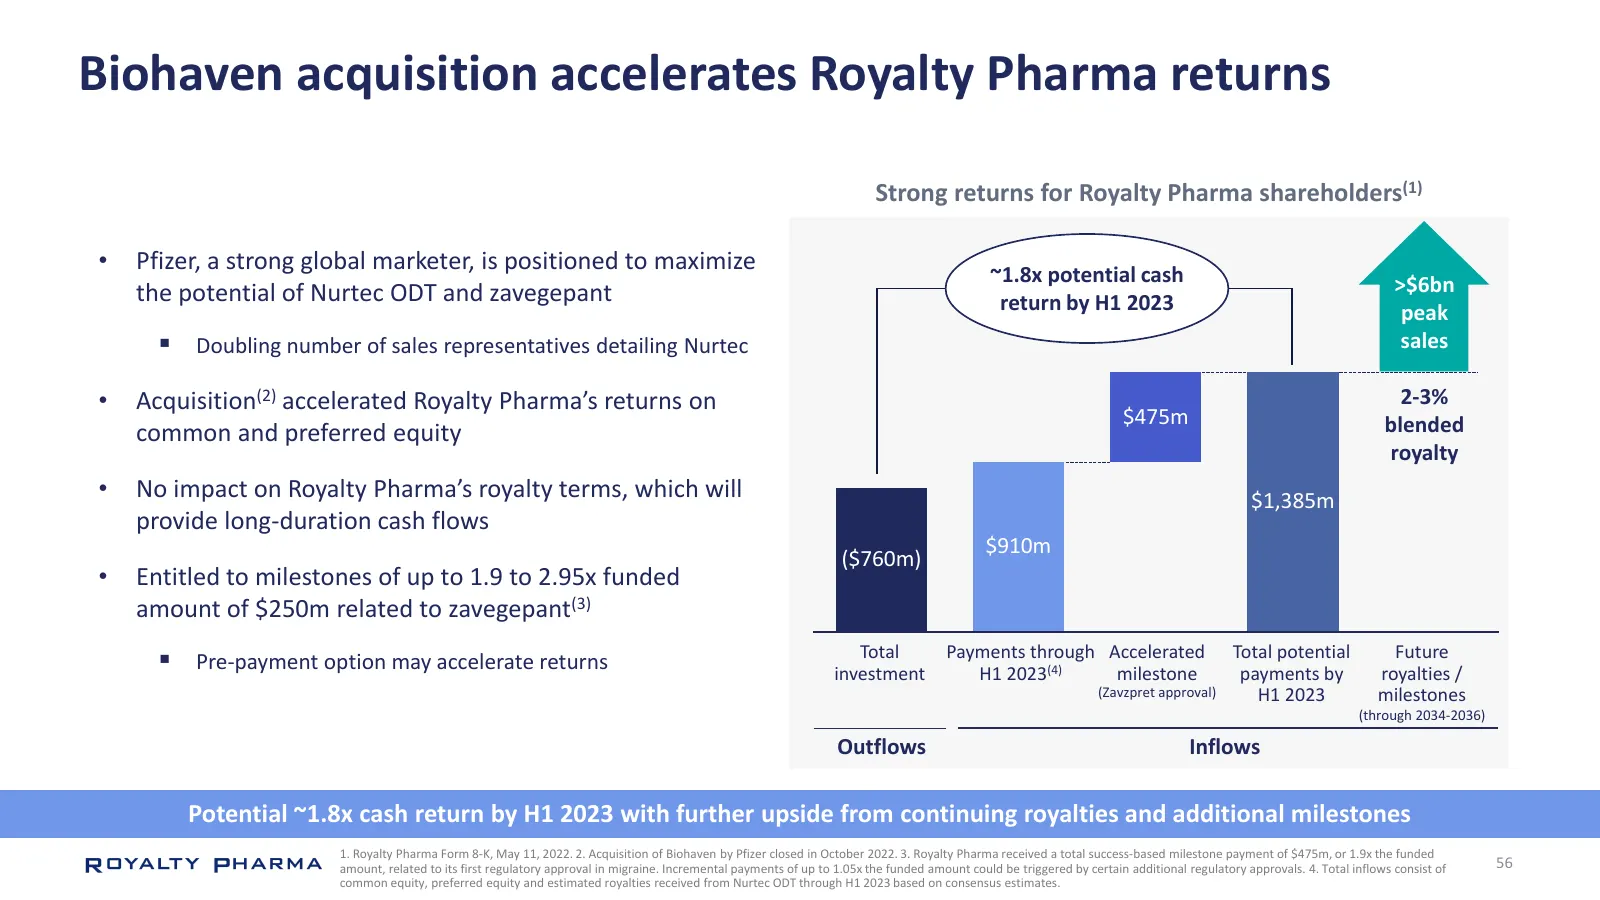
Slide 56: Biohaven acquisition accelerates Royalty Pharma returns
Biohaven acquisition accelerates Royalty Pharma returns Strong returns for Royalty Pharma shareholders(1) • Pfizer, a strong global marketer, is positioned to maximize ~1.8x potential cash the potential of Nurtec ODT and zavegepant >$6bn return by H1 2023 peak ▪ Doubling number of sales representati
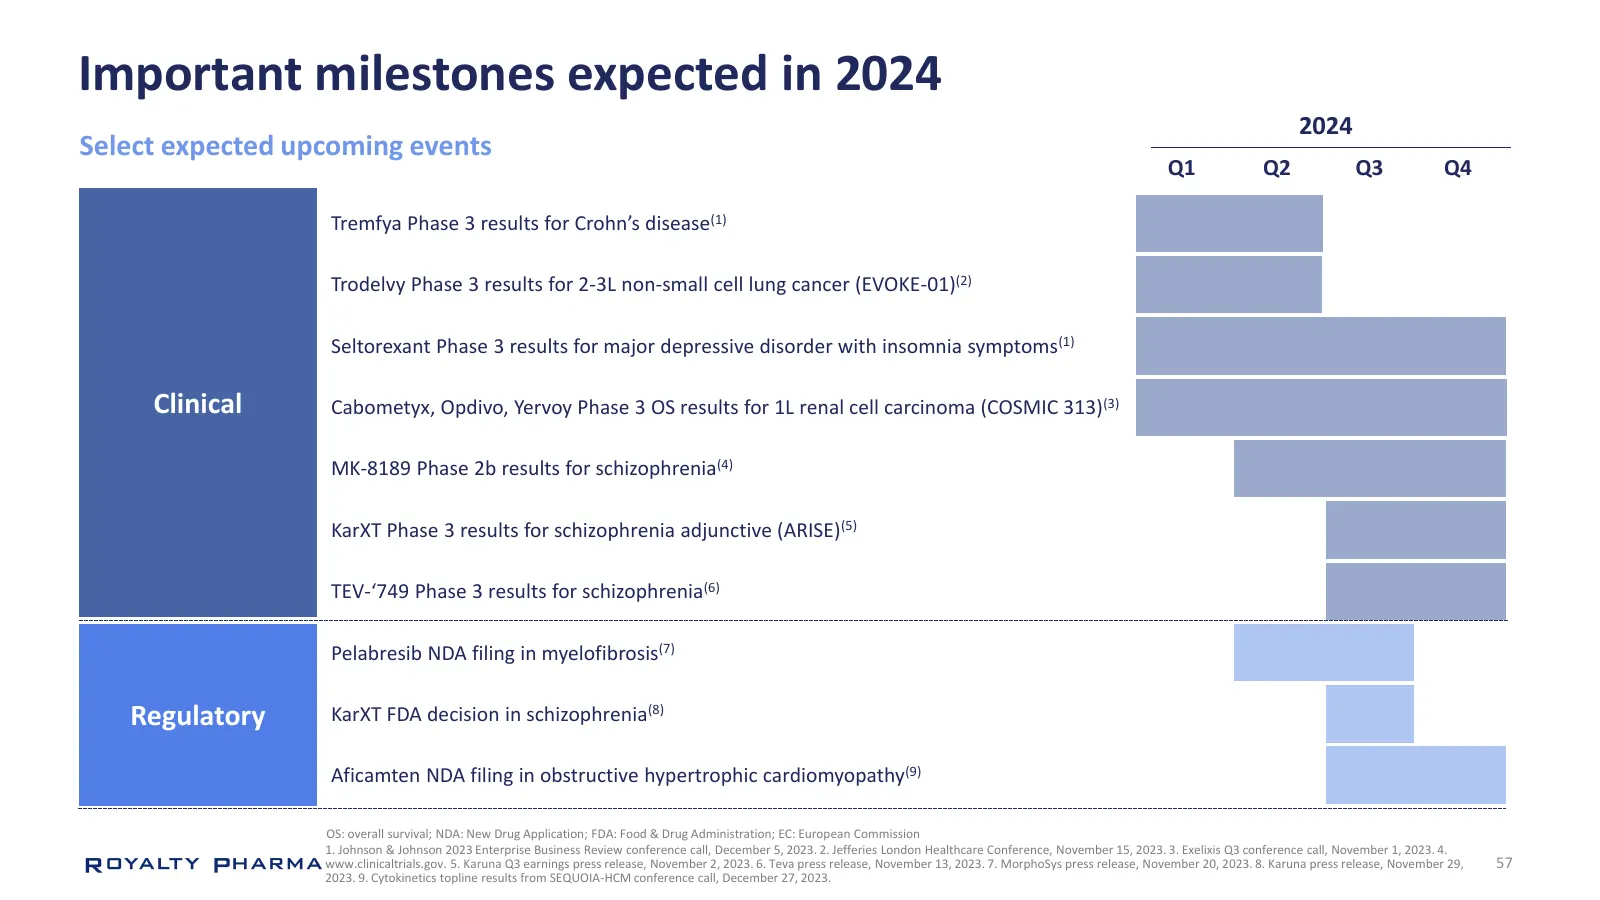
Slide 57: Important milestones expected in 2024
Important milestones expected in 2024 2024 Select expected upcoming events Q1 Q2 Q3 Q4 Tremfya Phase 3 results for Crohn’s disease(1) Trodelvy Phase 3 results for 2-3L non-small cell lung cancer (EVOKE-01)(2) Seltorexant Phase 3 results for major depressive disorder with insomnia symptoms(1) Clinica
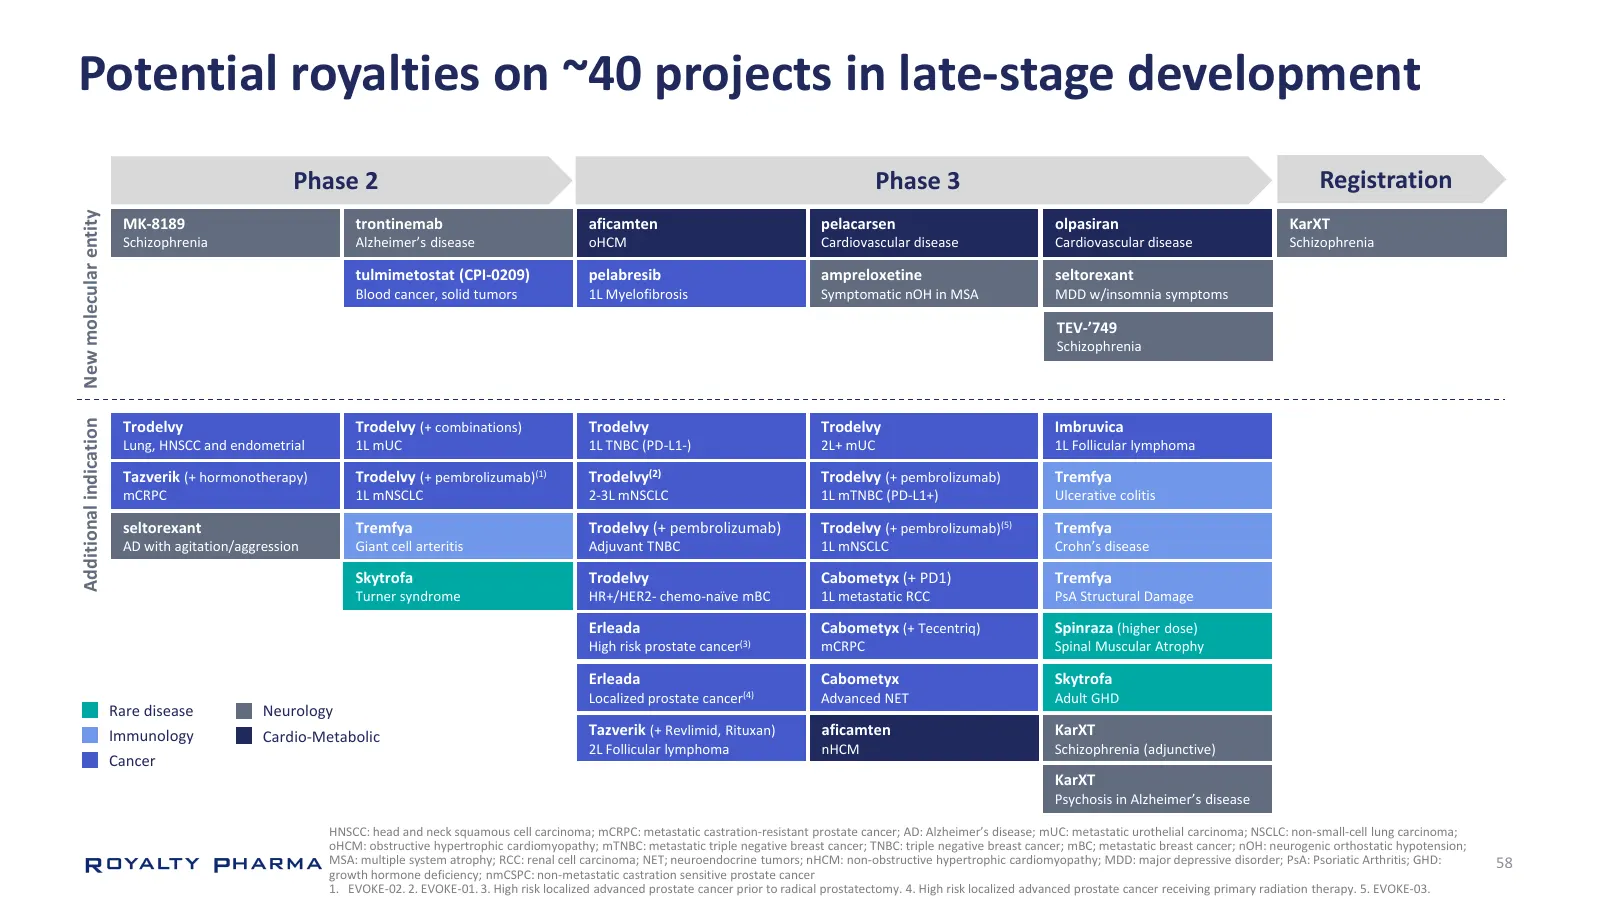
Slide 58: Potential royalties on ~40 projects in late-stage development
Potential royalties on ~40 projects in late-stage development Phase 2 Phase 3 Registration New molecular entity MK-8189 trontinemab aficamten pelacarsen olpasiran KarXT Schizophrenia Alzheimer’s disease oHCM Cardiovascular disease Cardiovascular disease Schizophrenia tulmimetostat (CPI-0209) pelabre
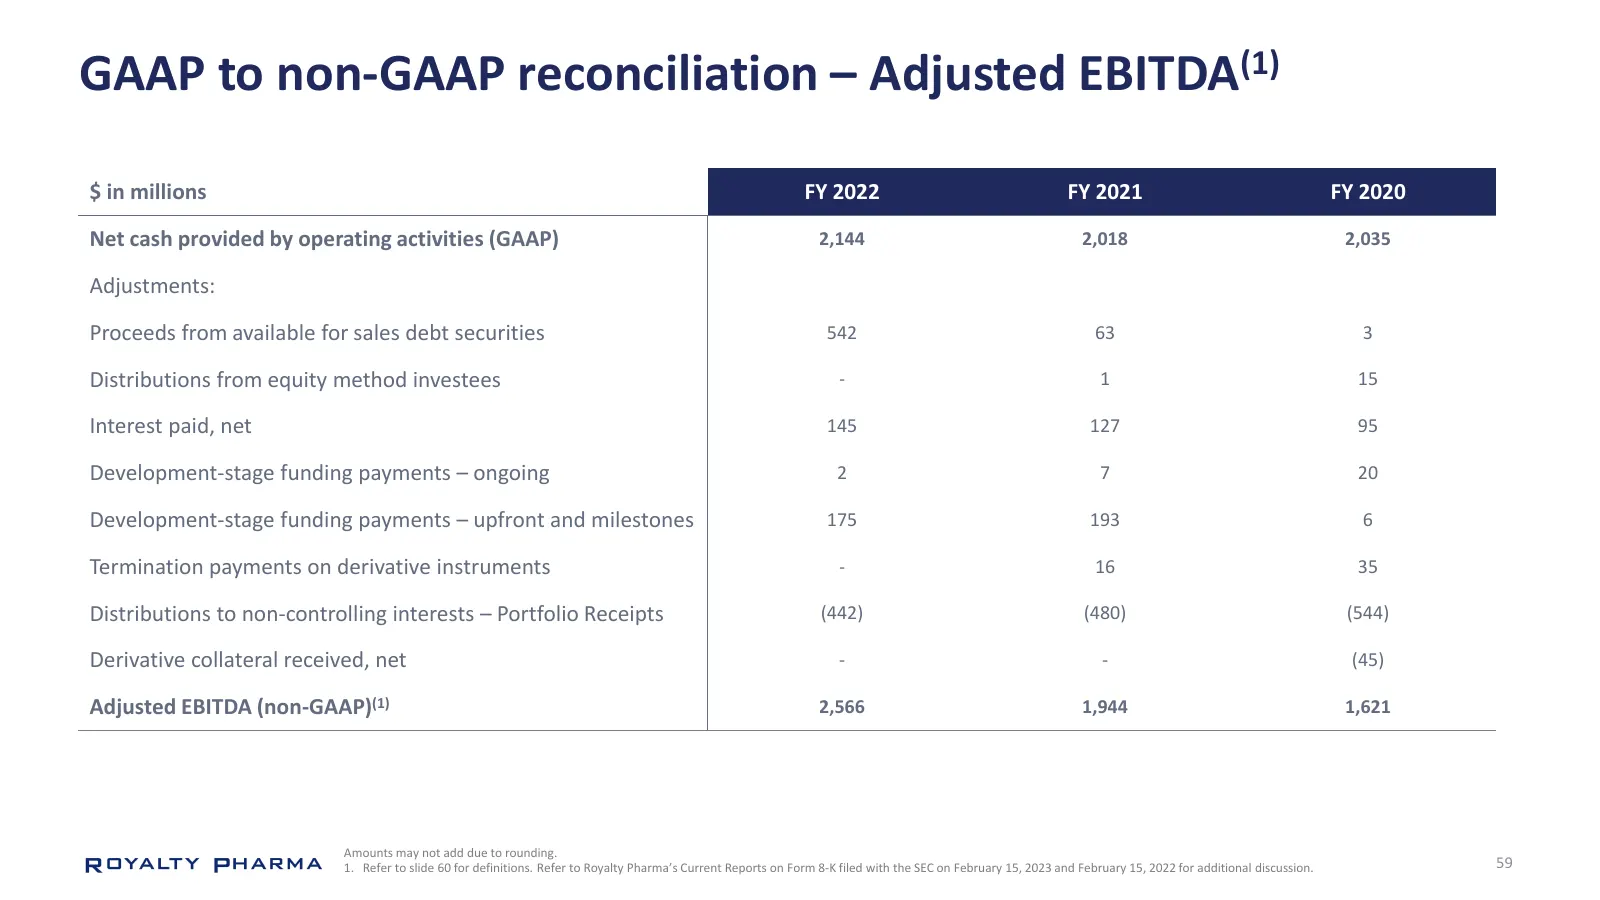
Slide 59: GAAP to non-GAAP reconciliation – Adjusted EBITDA
GAAP to non-GAAP reconciliation – Adjusted EBITDA(1) $ in millions FY 2022 FY 2021 FY 2020 Net cash provided by operating activities (GAAP) 2,144 2,018 2,035 Adjustments: Proceeds from available for sales debt securities 542 63 3 Distributions from equity method investees - 1 15 Interest paid, net 1
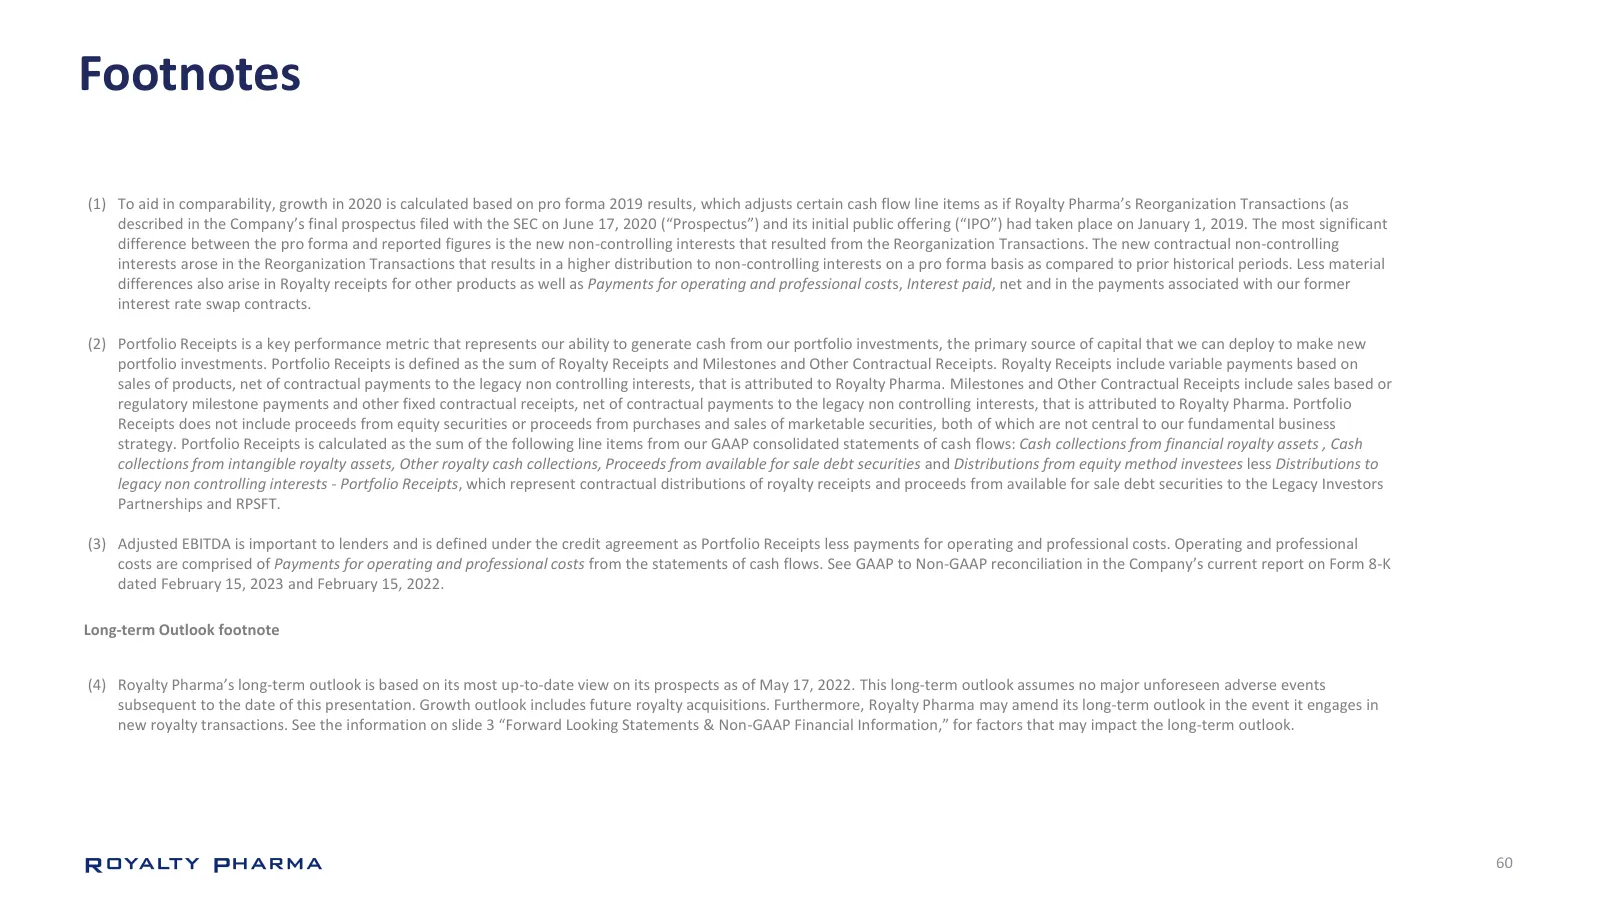
Slide 60: Footnotes
Footnotes (1) To aid in comparability, growth in 2020 is calculated based on pro forma 2019 results, which adjusts certain cash flow line items as if Royalty Pharma’s Reorganization Transactions (as described in the Company’s final prospectus filed with the SEC on June 17, 2020 (“Prospectus”) and it
Source: Internet Archive copy of royaltypharma.com
More decks from Royalty Pharma plc
 Q3 2026 Earnings Presentation30 slides · Nov 4, 2026
 Investor Presentation (November 2026)91 slides · November 2026
 Merger or Acquisition (November 2026)5 slides · November 2026
 Q2 2026 Earnings Presentation33 slides · Aug 5, 2026
 Investor Presentation (August 2026)90 slides · August 2026
 Investor Presentation (August 2026)91 slides · August 2026