Sembcorp Industries Ltd. · SGX:U96
Sembcorp Industries — FY2015 Earnings Presentation
23 slides from Sembcorp Industries's earnings presentation, Feb 17, 2016
Slide 1: FY2015 Results Announcement
FY2015 Results Announcement February 17, 2016 © Sembcorp Industries 2016 Scope of Presentation • CEO’s Report • Financial Review • Group Outlook © Sembcorp Industries 2016 2
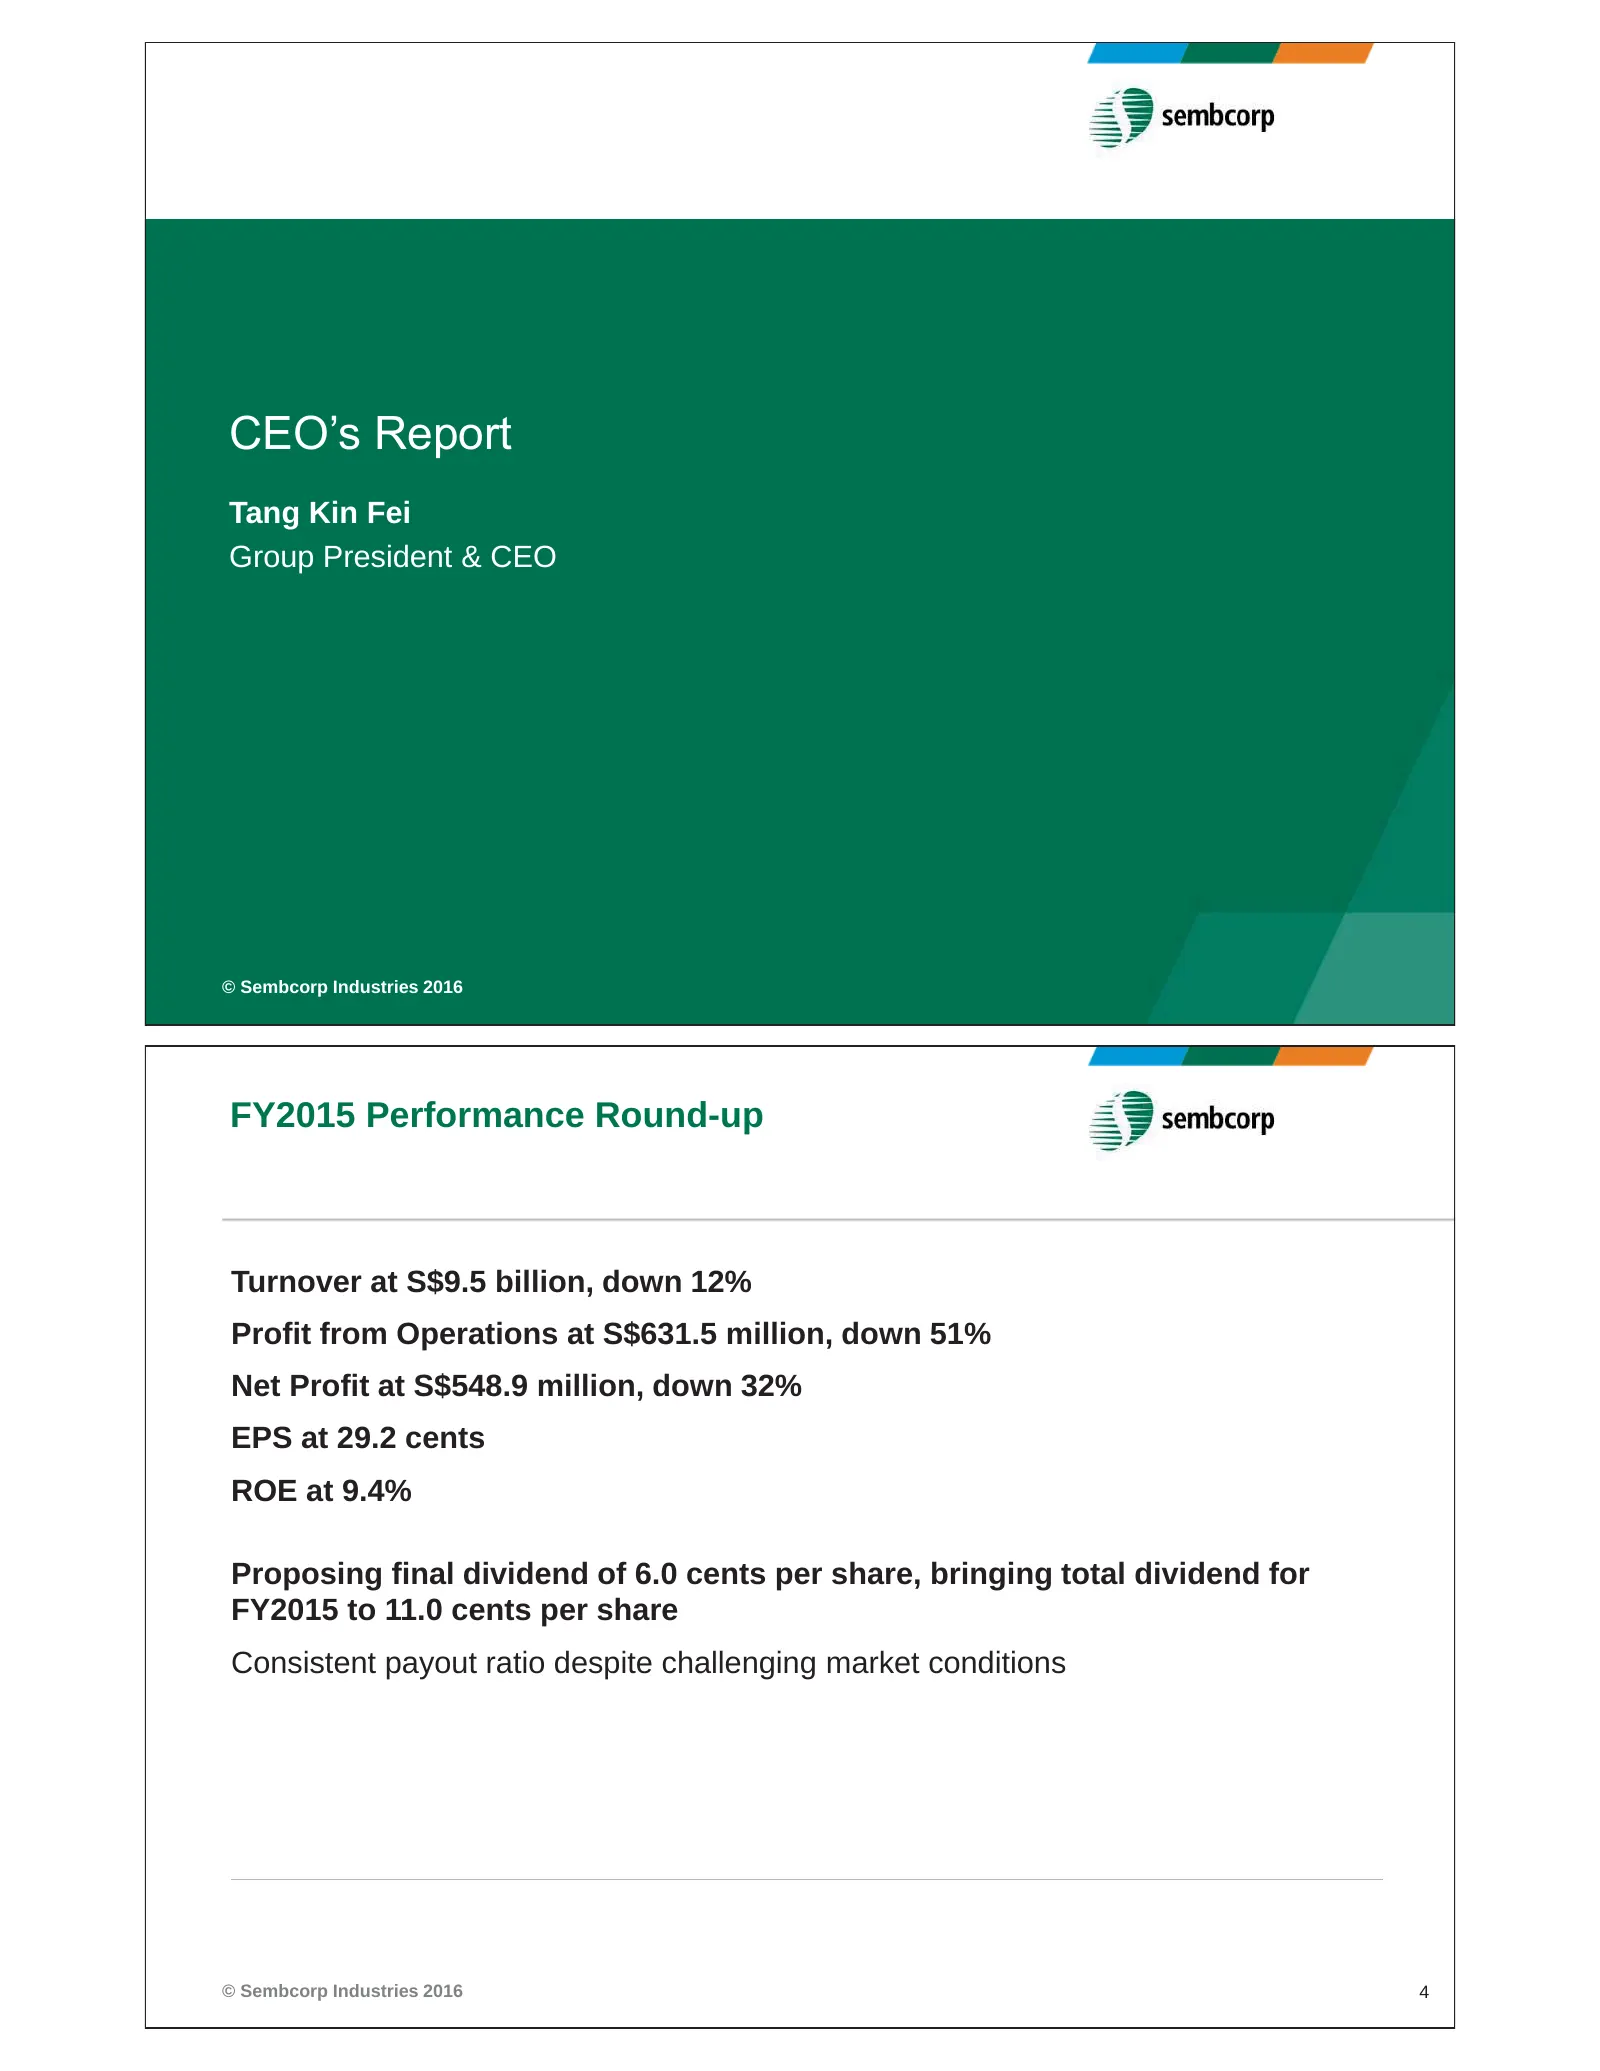
Slide 2: CEO's Report: FY2015 Performance Round-up
CEO’s Report Tang Kin Fei Group President & CEO © Sembcorp Industries 2016 FY2015 Performance Round-up Turnover at S$9.5 billion, down 12% Profit from Operations at S$631.5 million, down 51% Net Profit at S$548.9 million, down 32% EPS at 29.2 cents ROE at 9.4% Proposing final dividend of 6.0 cents p
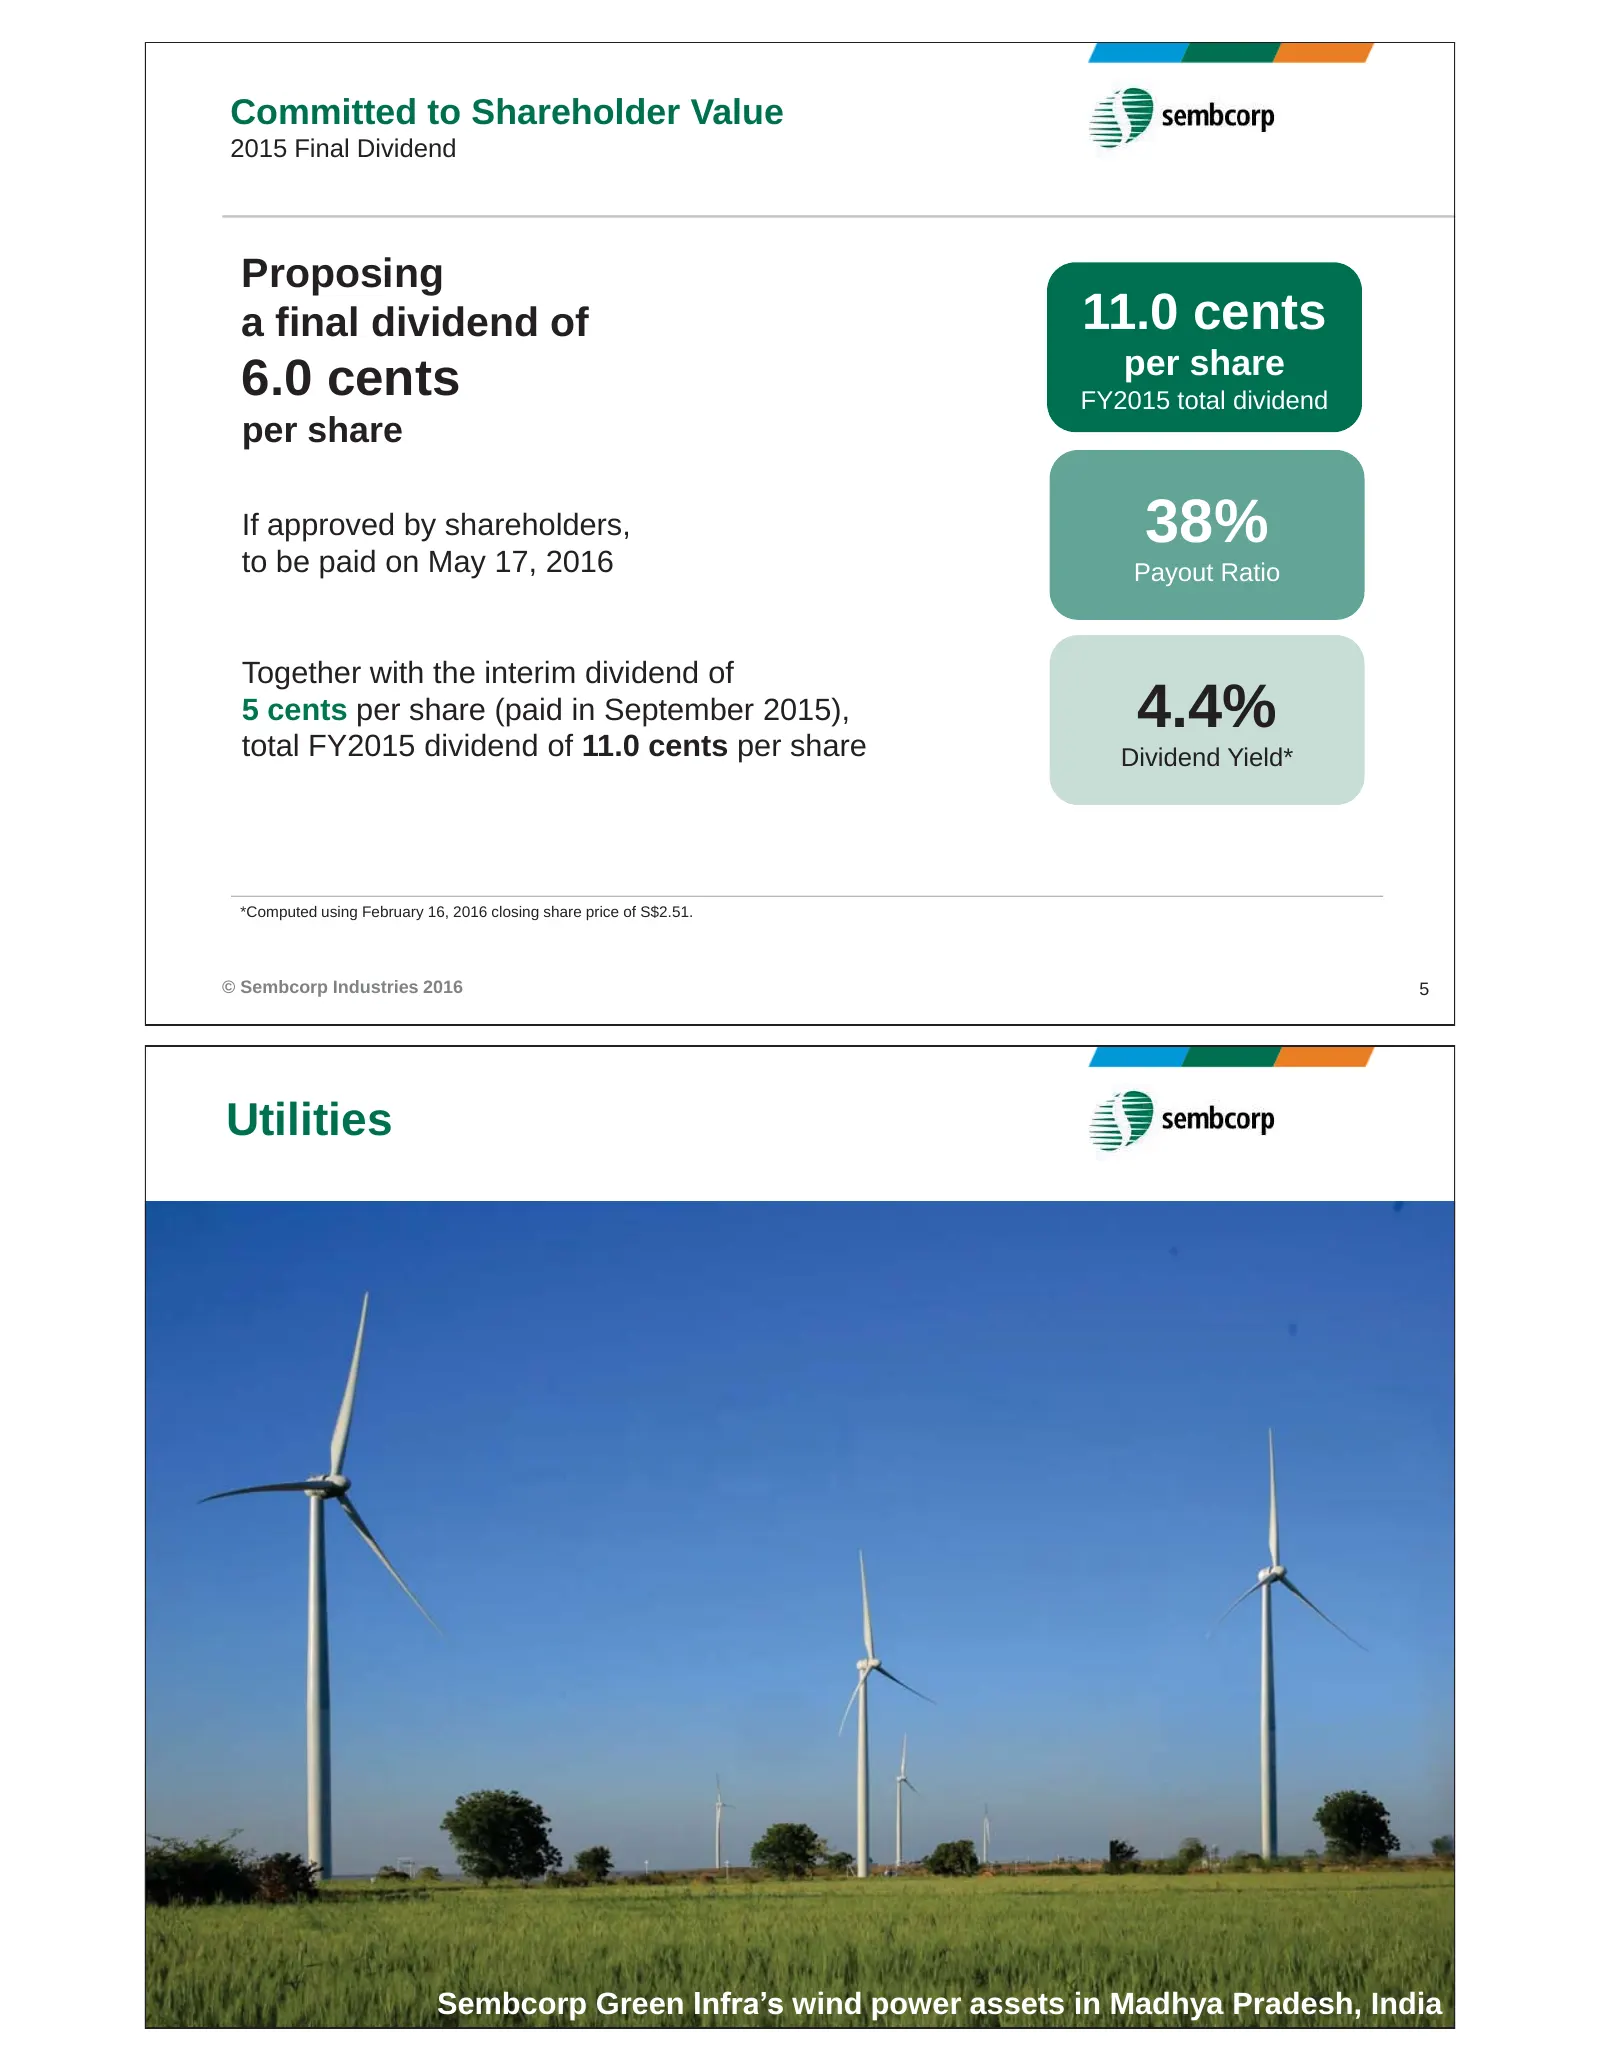
Slide 3: Committed to Shareholder Value
Committed to Shareholder Value 2015 Final Dividend Proposing a final dividend of 11.0 cents per share 6.0 cents FY2015 total dividend per share If approved by shareholders, to be paid on May 17, 2016 38% Payout Ratio Together with the interim dividend of 5 cents per share (paid in September 2015), t
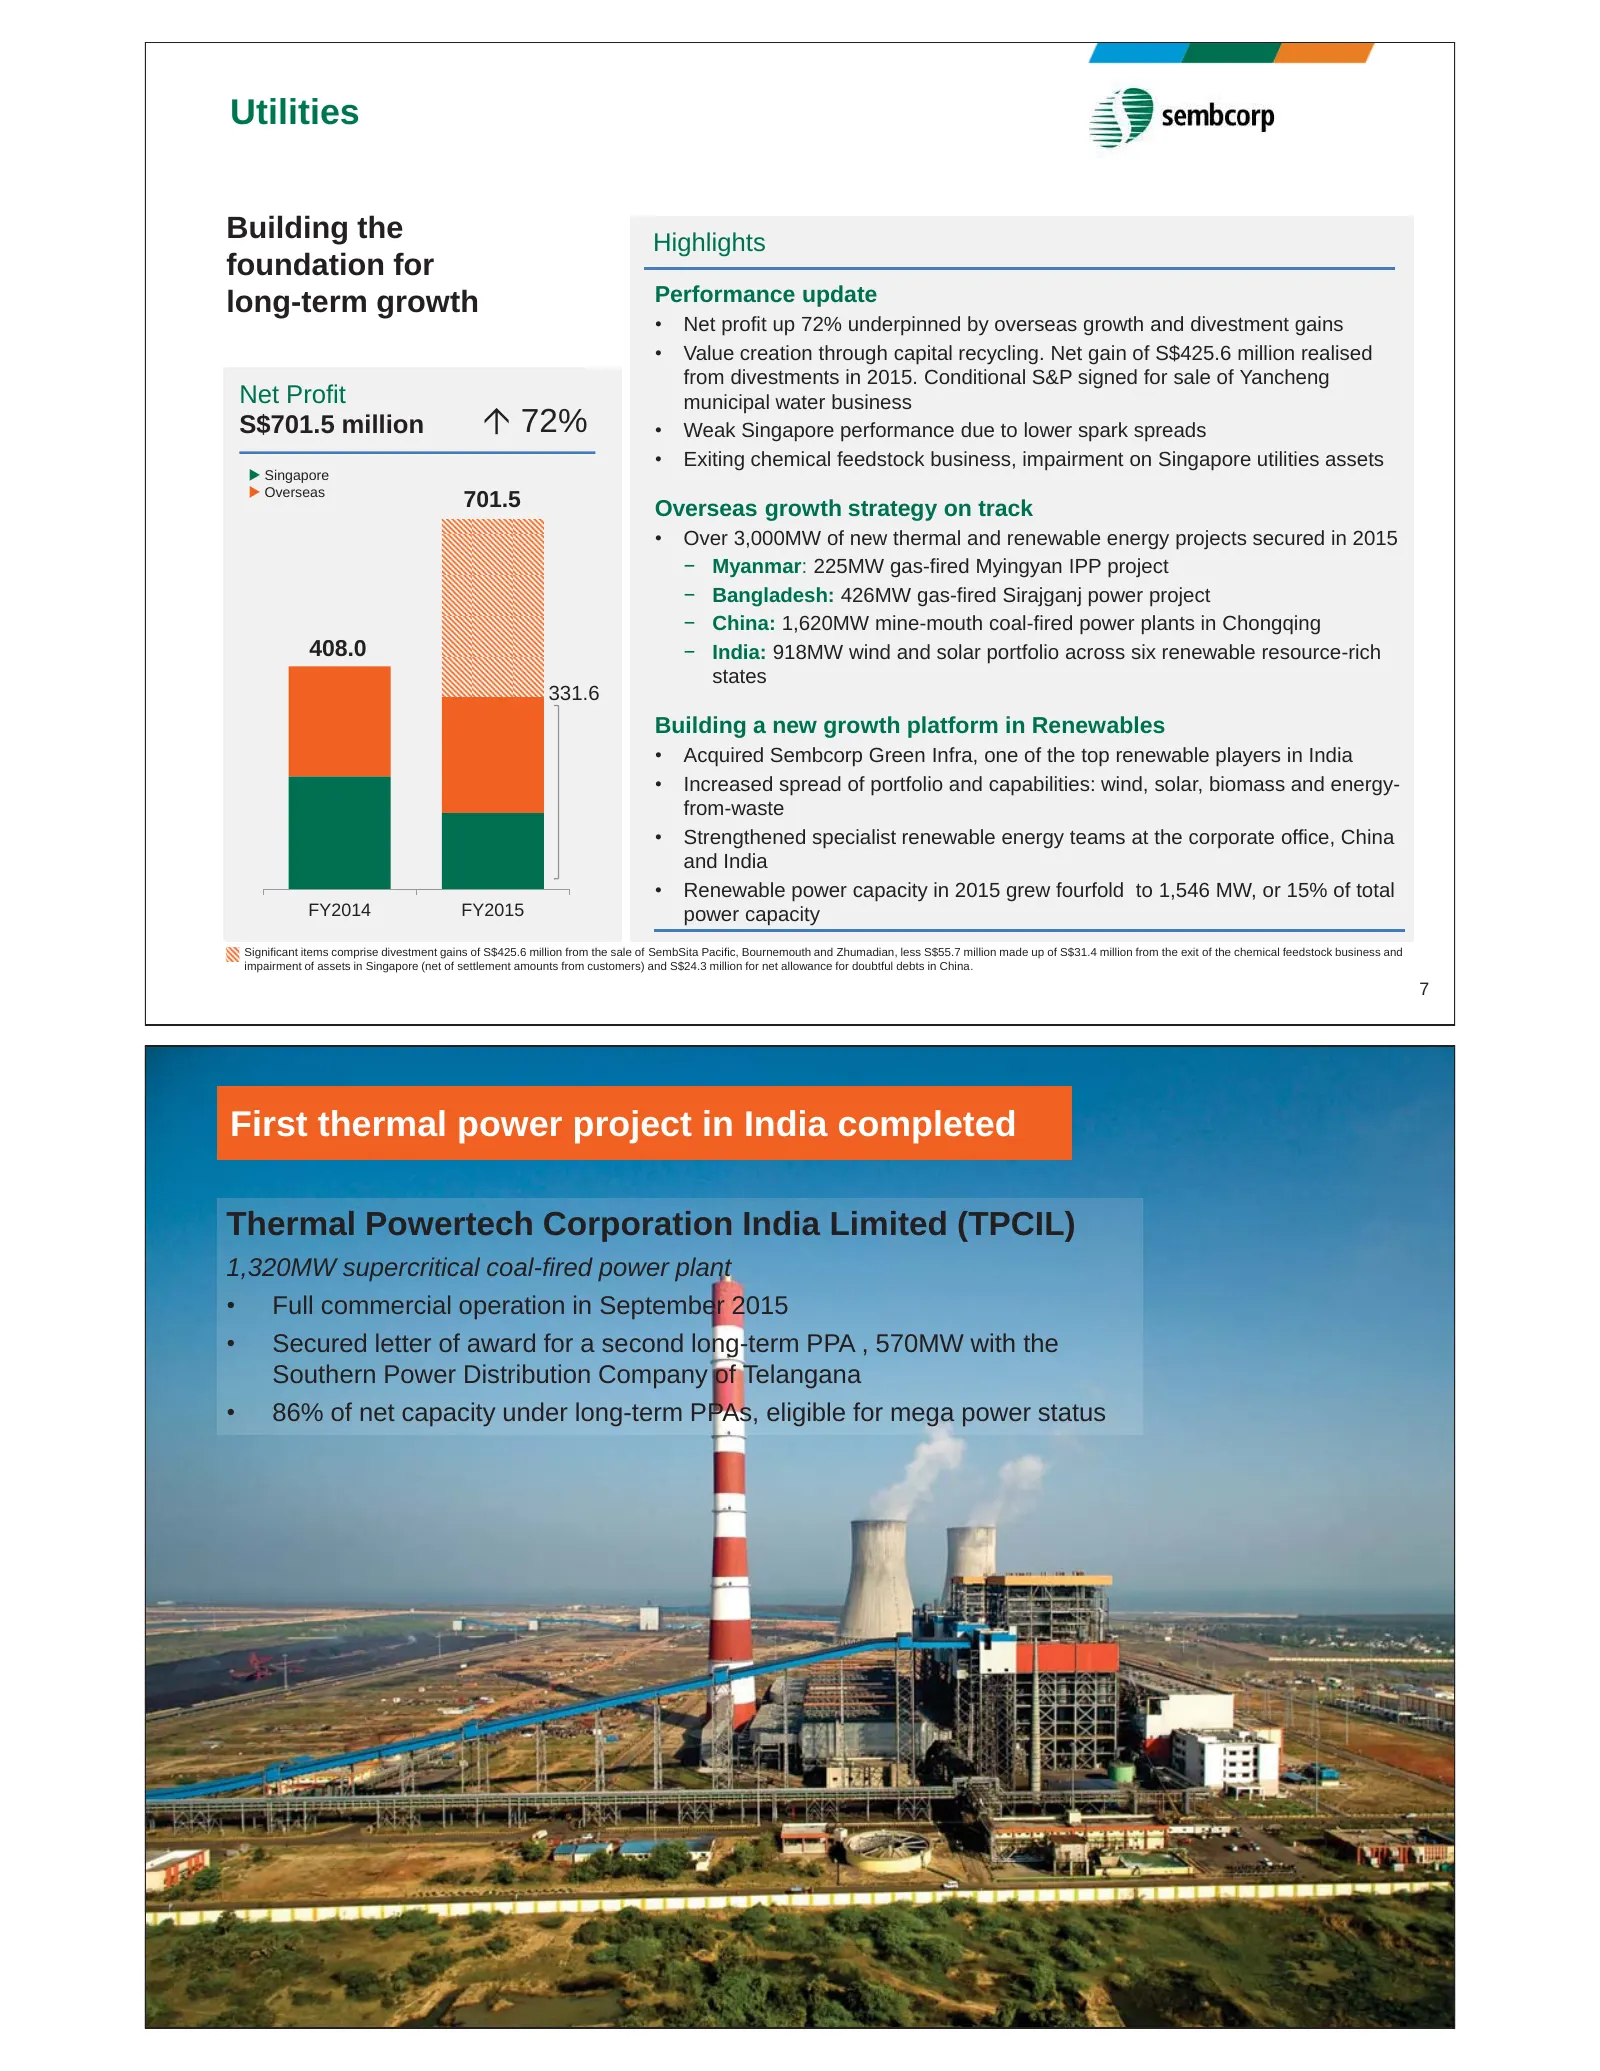
Slide 4: Utilities: Building the foundation for long-term growth
Utilities Building the Highlights foundation for long-term growth Performance update • Net profit up 72% underpinned by overseas growth and divestment gains • Value creation through capital recycling. Net gain of S$425.6 million realised from divestments in 2015. Conditional S&P signed for sale of Y
Slide 5: Utilities Scorecard 2011-2015
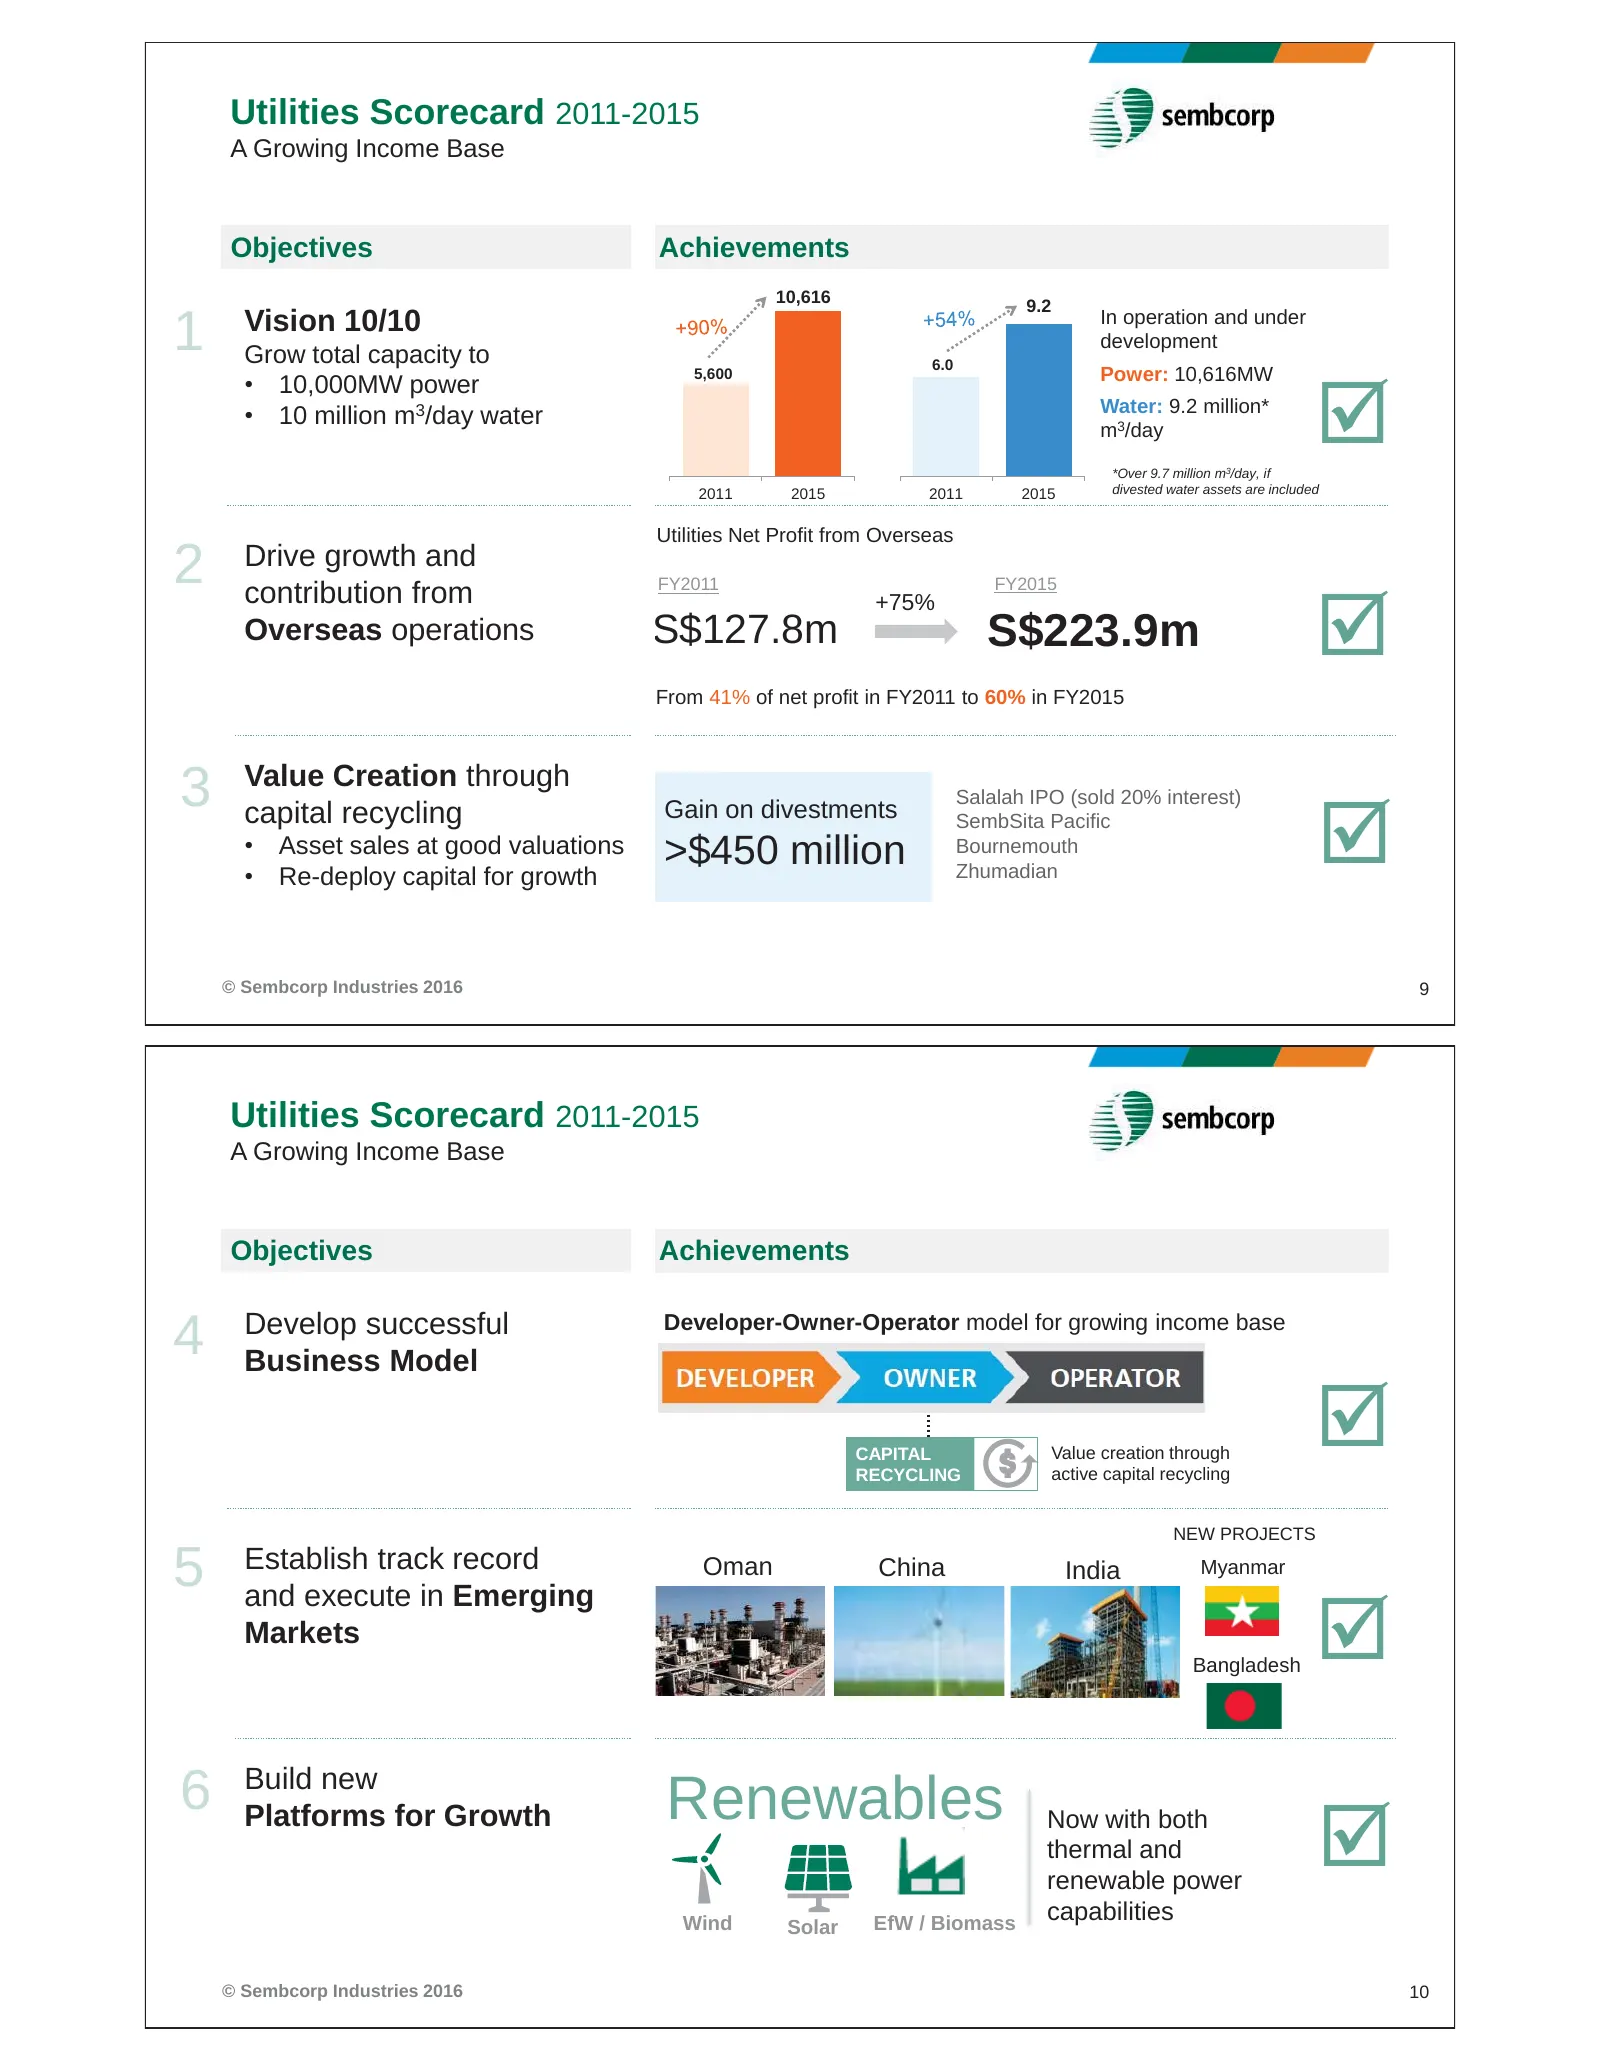
Utilities Scorecard 2011-2015 A Growing Income Base Objectives Achievements 10,616 9.2 Vision 10/10 In operation and under 1 Grow total capacity to 6.0 development Power: 10,616MW ; 5,600 • 10,000MW power Water: 9.2 million* • 10 million m3/day water m3/day *Over 9.7 million m3/day, if 2011 2015 201
Slide 6: Solid Pipeline of Projects
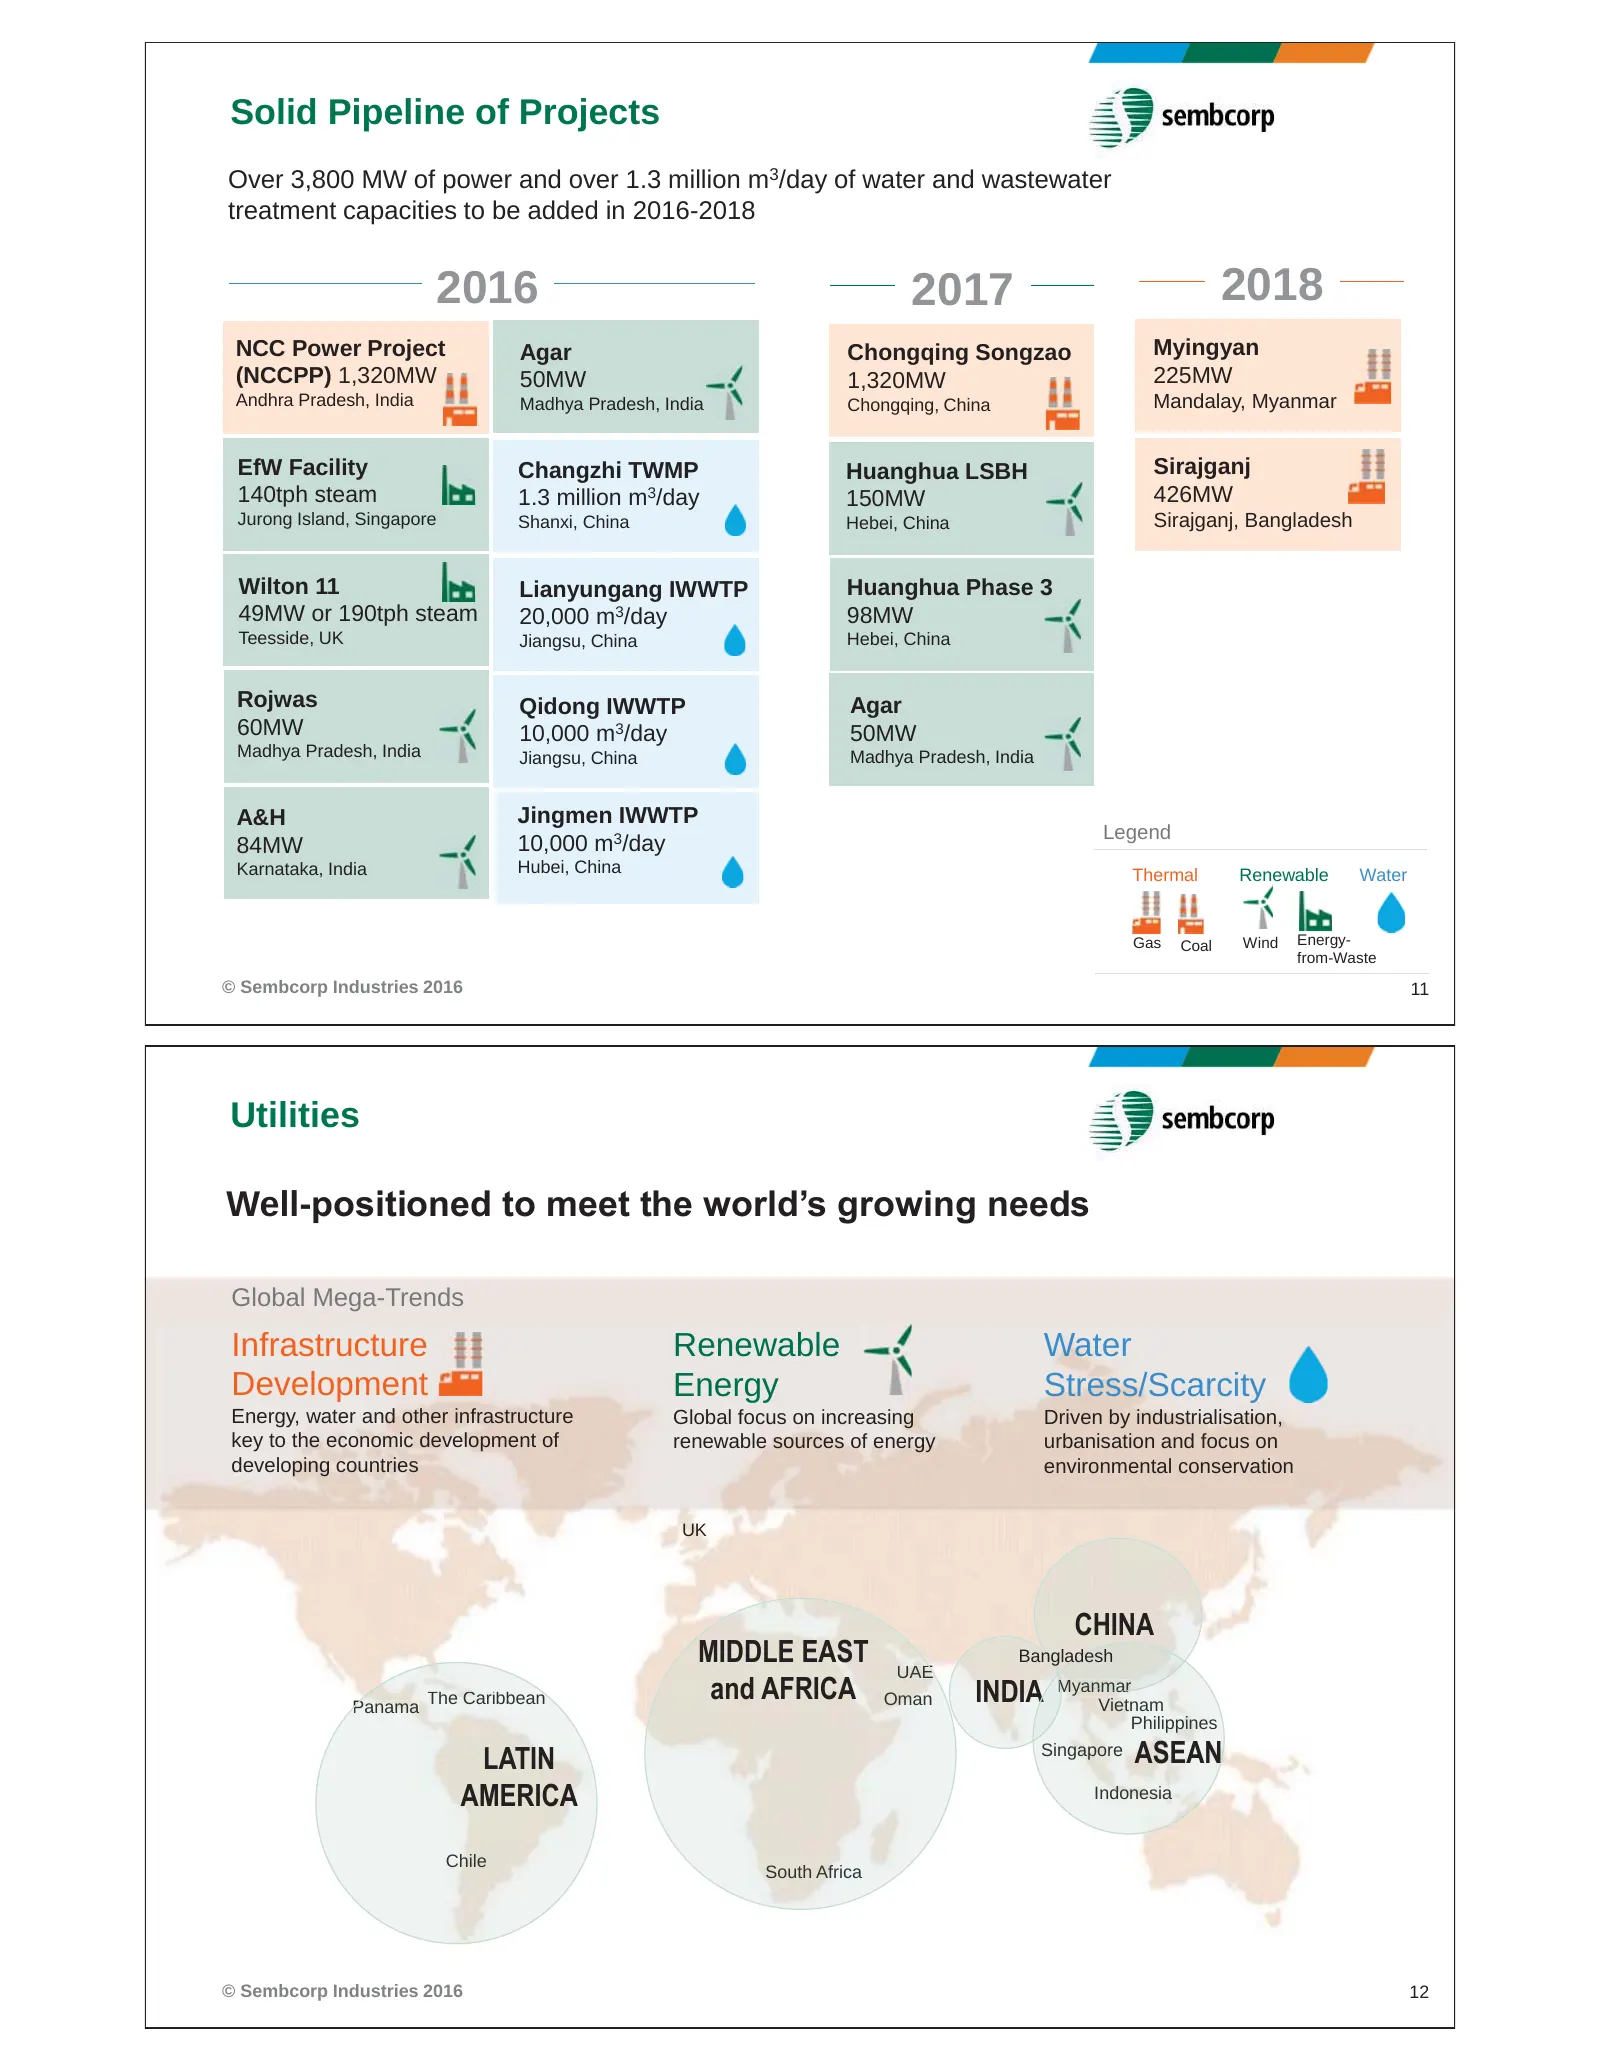
Solid Pipeline of Projects Over 3,800 MW of power and over 1.3 million m3/day of water and wastewater treatment capacities to be added in 2016-2018 2016 2017 2018 NCC Power Project Agar Chongqing Songzao Myingyan (NCCPP) 1,320MW 50MW 1,320MW 225MW Andhra Pradesh, India Madhya Pradesh, India Chongqin
Slide 7: Marine: Challenging macro environment
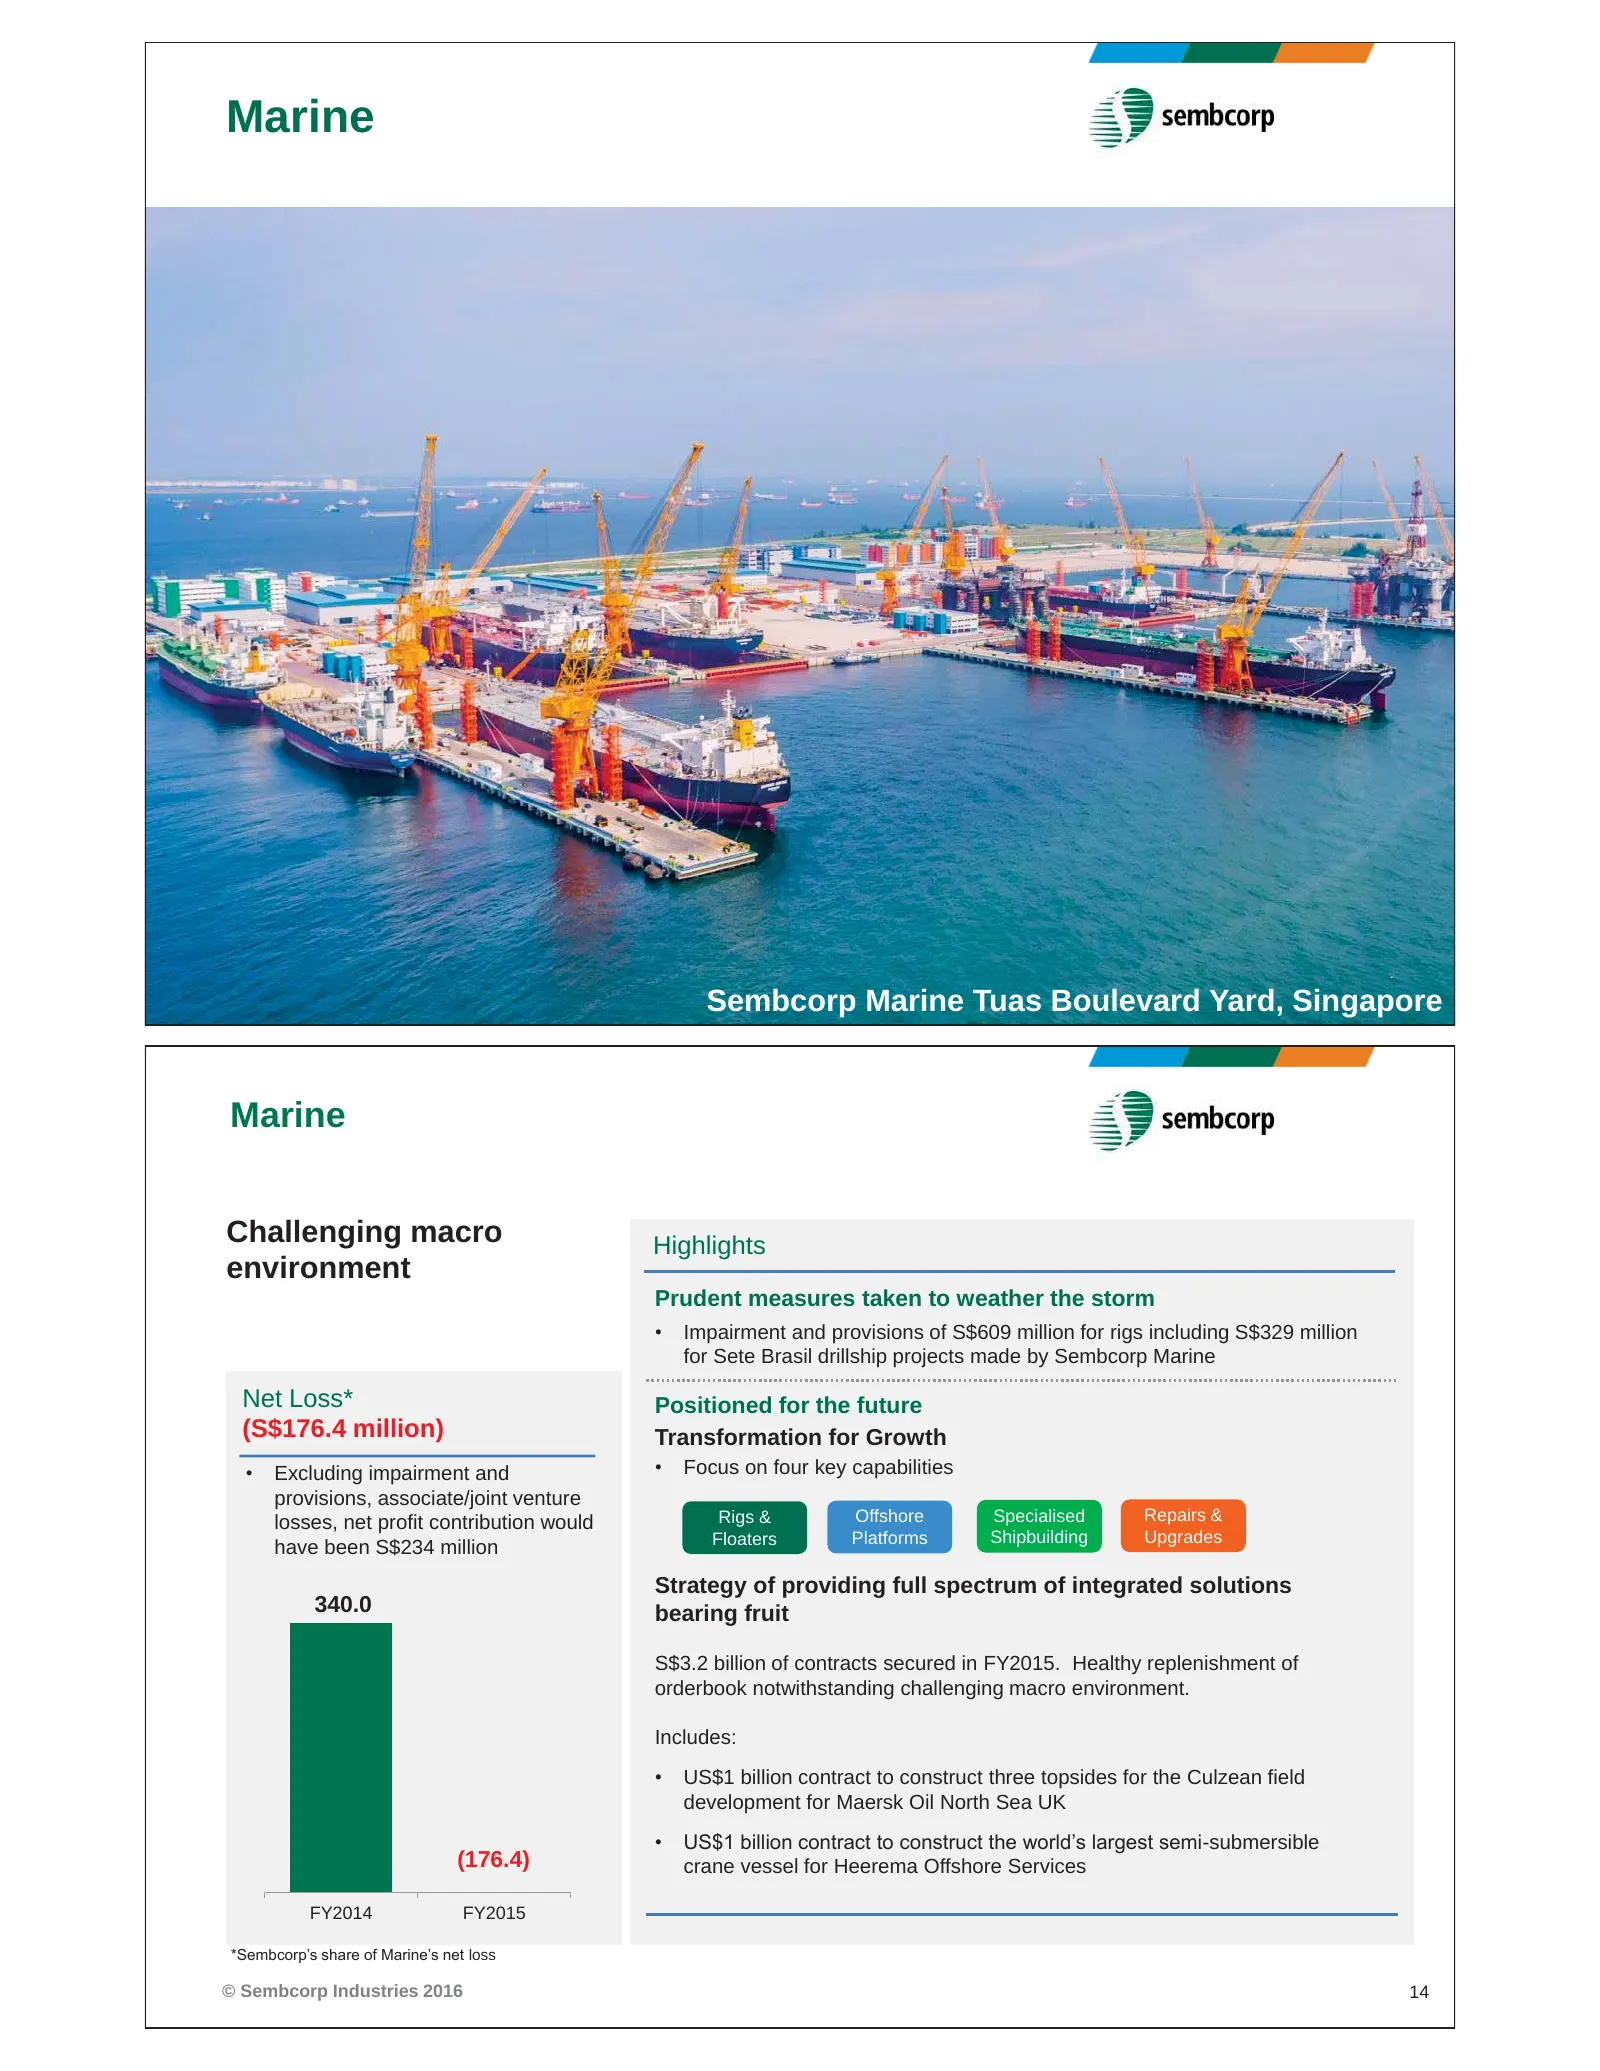
Marine © Sembcorp Industries 2016 13 Sembcorp Marine Tuas Boulevard Yard, Singapore Marine Challenging macro Highlights environment Prudent measures taken to weather the storm • Impairment and provisions of S$609 million for rigs including S$329 million for Sete Brasil drillship projects made by Sem
Slide 8: Diversified Product Capabilities
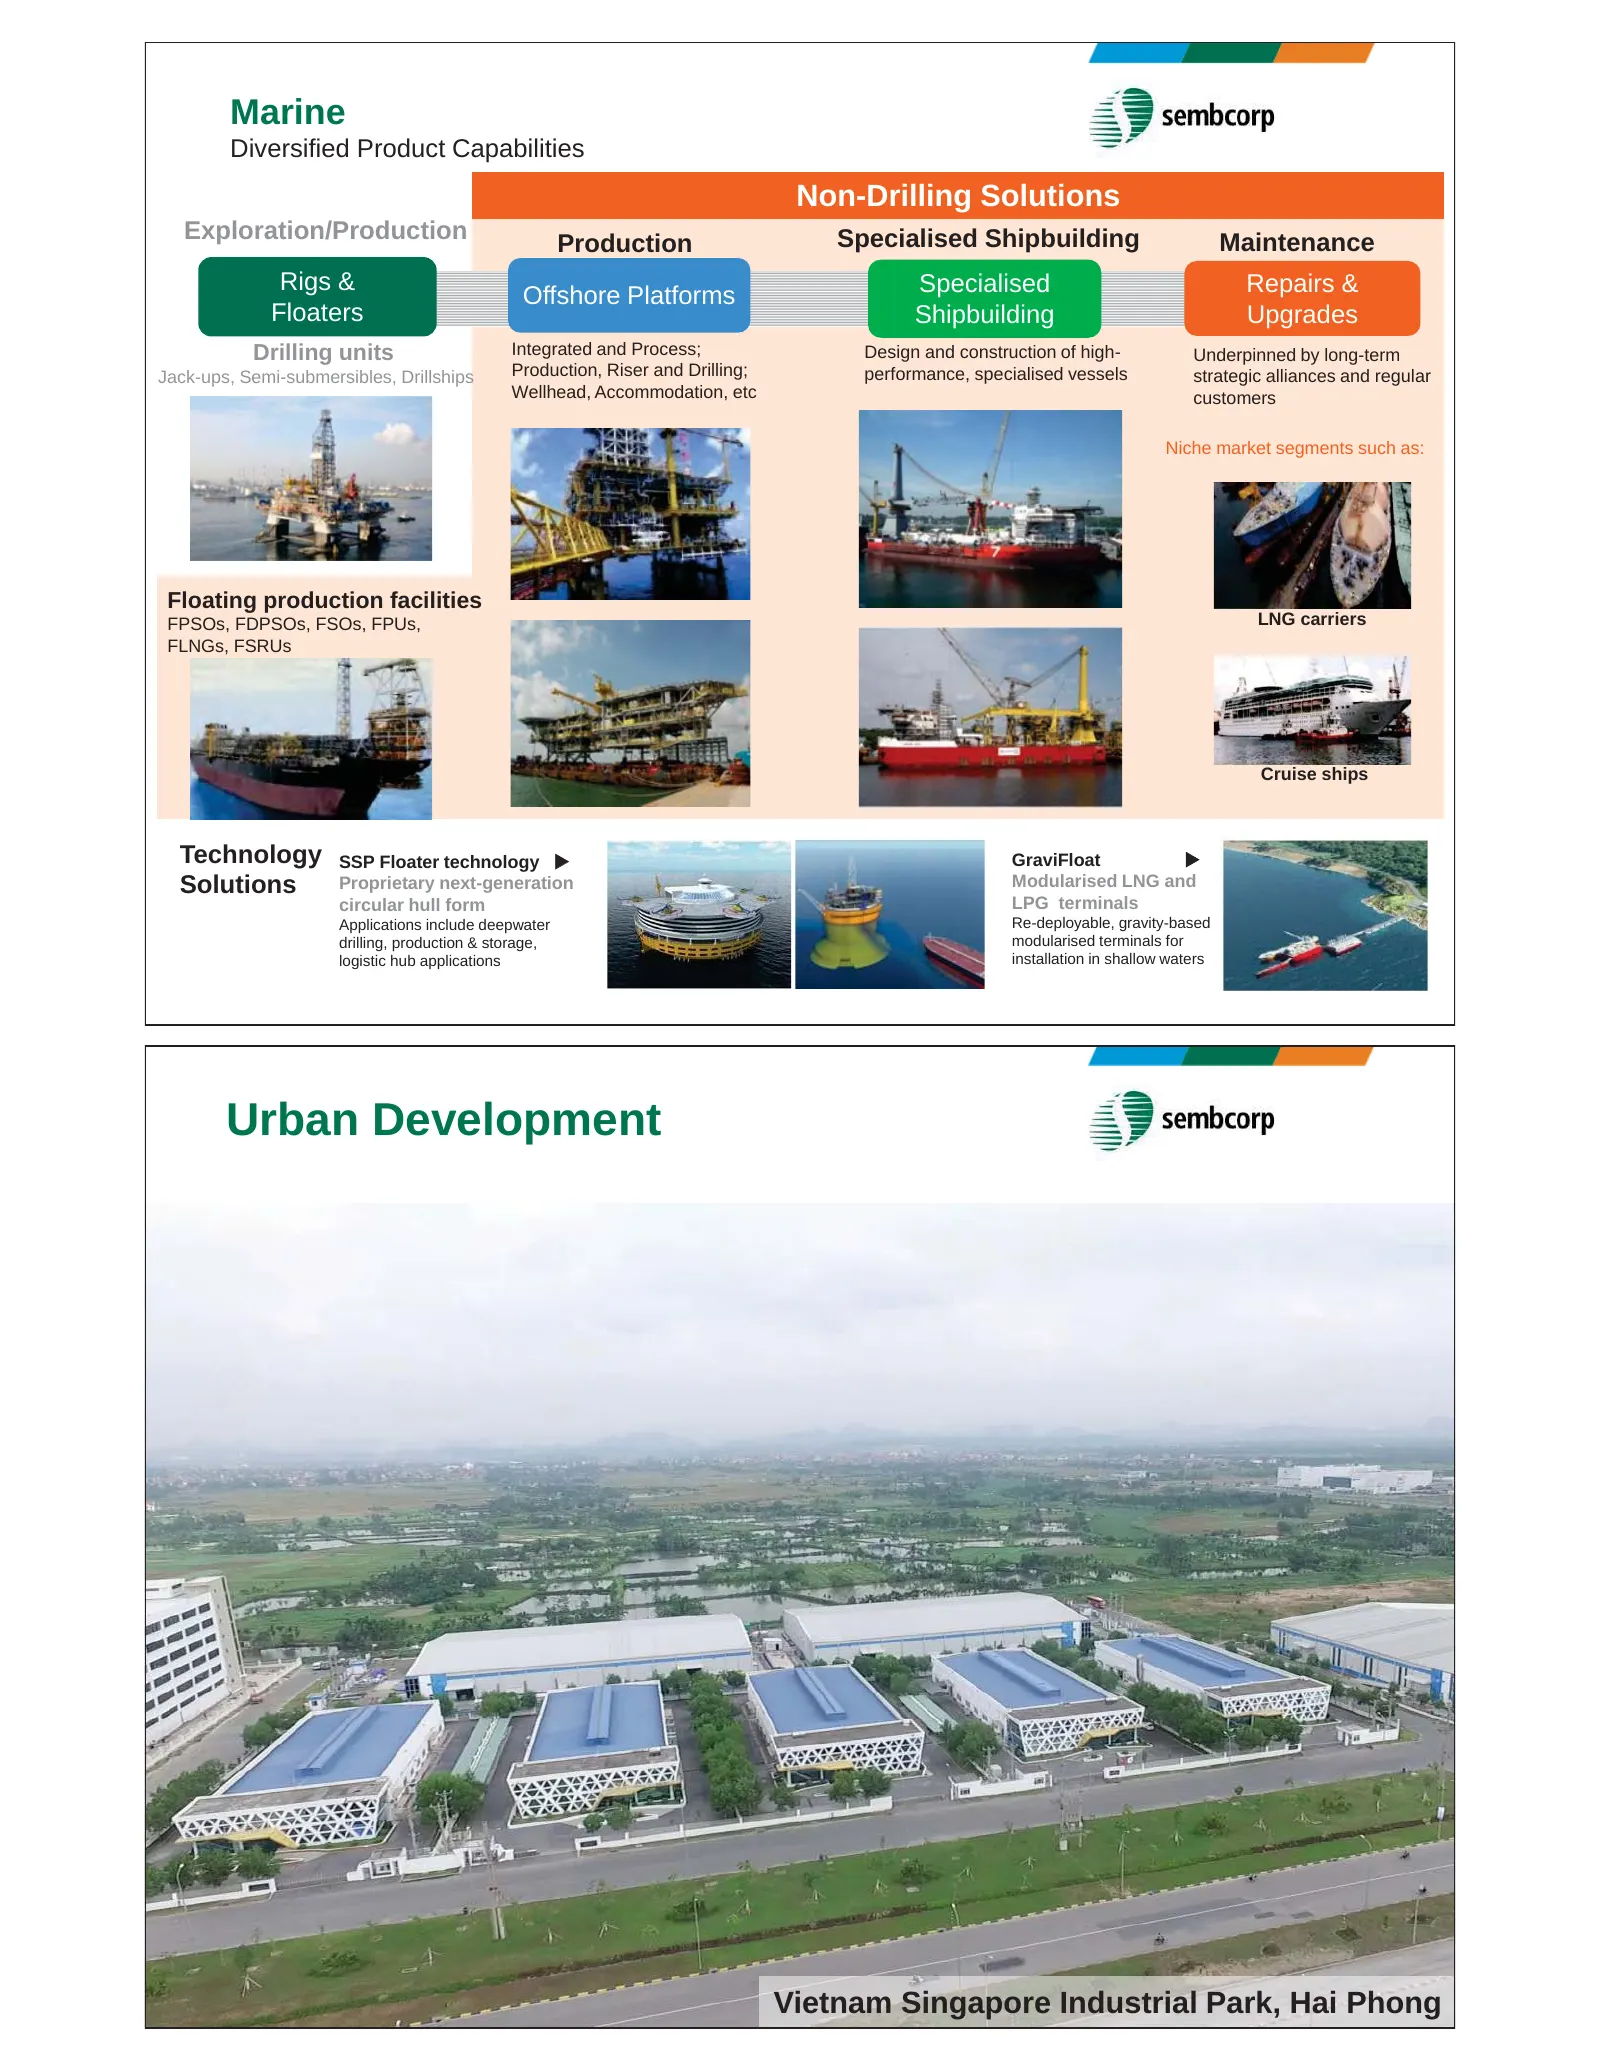
Marine Diversified Product Capabilities Non-Drilling Solutions Exploration/Production Production Specialised Shipbuilding Maintenance Rigs & Specialised Repairs & Offshore Platforms Floaters Shipbuilding Upgrades Drilling units Integrated and Process; Design and construction of high- Underpinned by
Slide 9: Urban Development
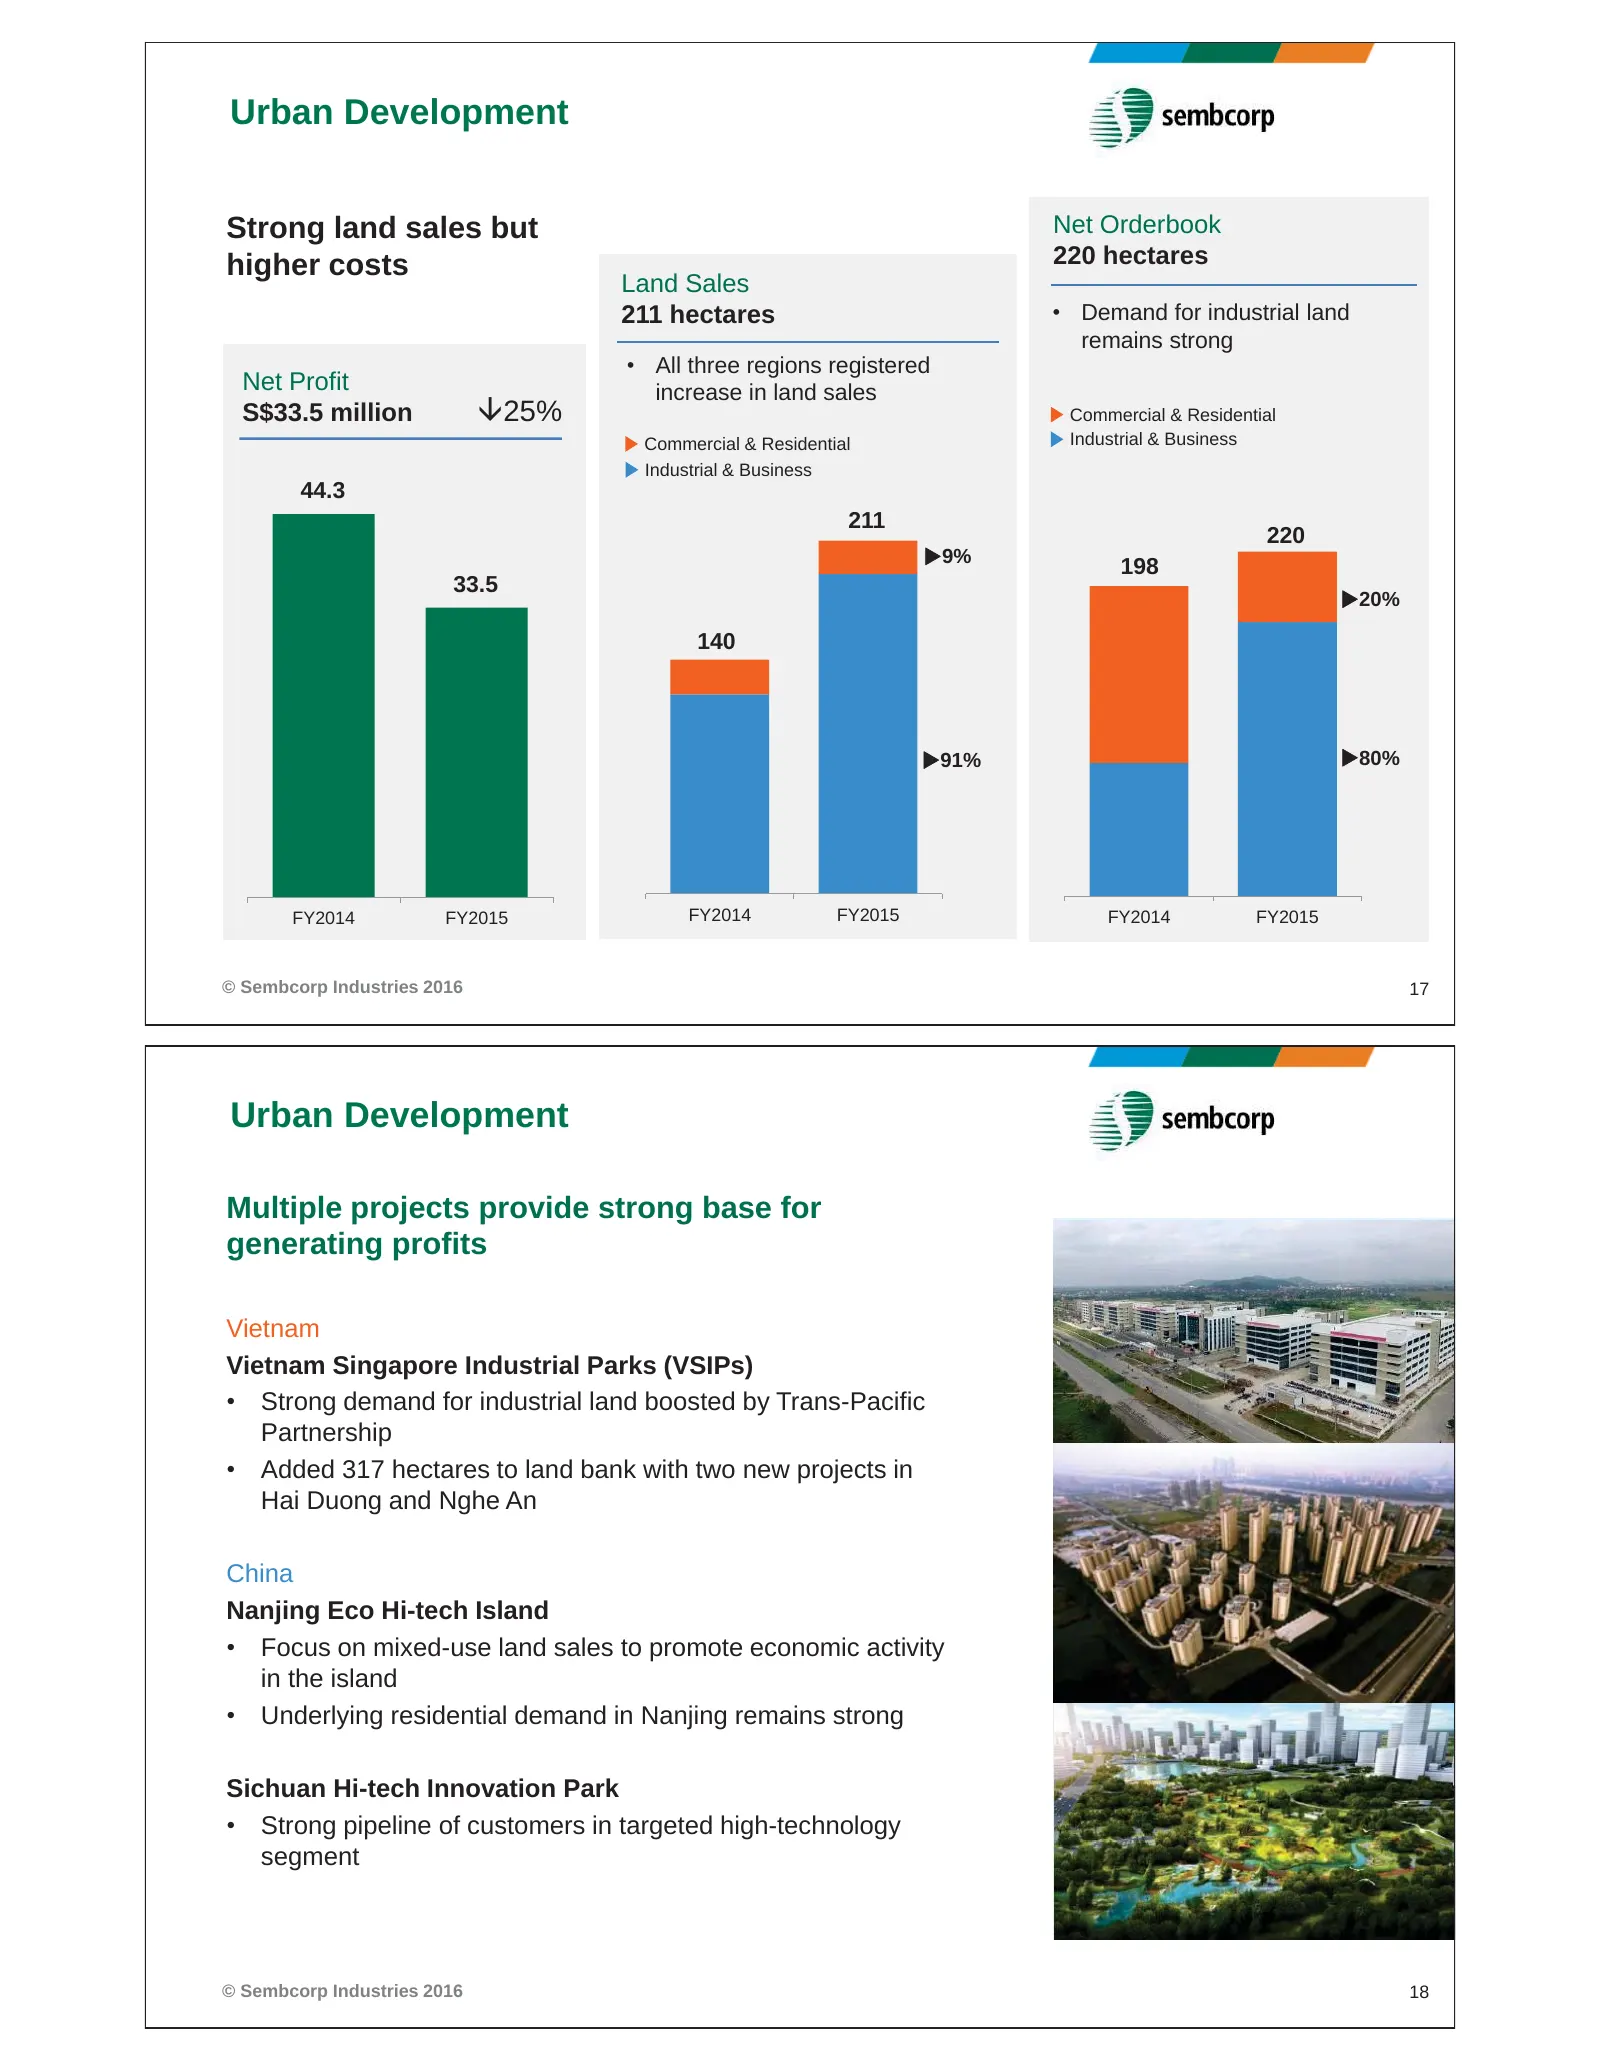
Urban Development Strong land sales but Net Orderbook higher costs 220 hectares Land Sales 211 hectares • Demand for industrial land remains strong • All three regions registered Net Profit increase in land sales S$33.5 million È25% Commercial & Residential Commercial & Residential Industrial & Busi
Slide 10: Weather the storm, emerge stronger as a Group
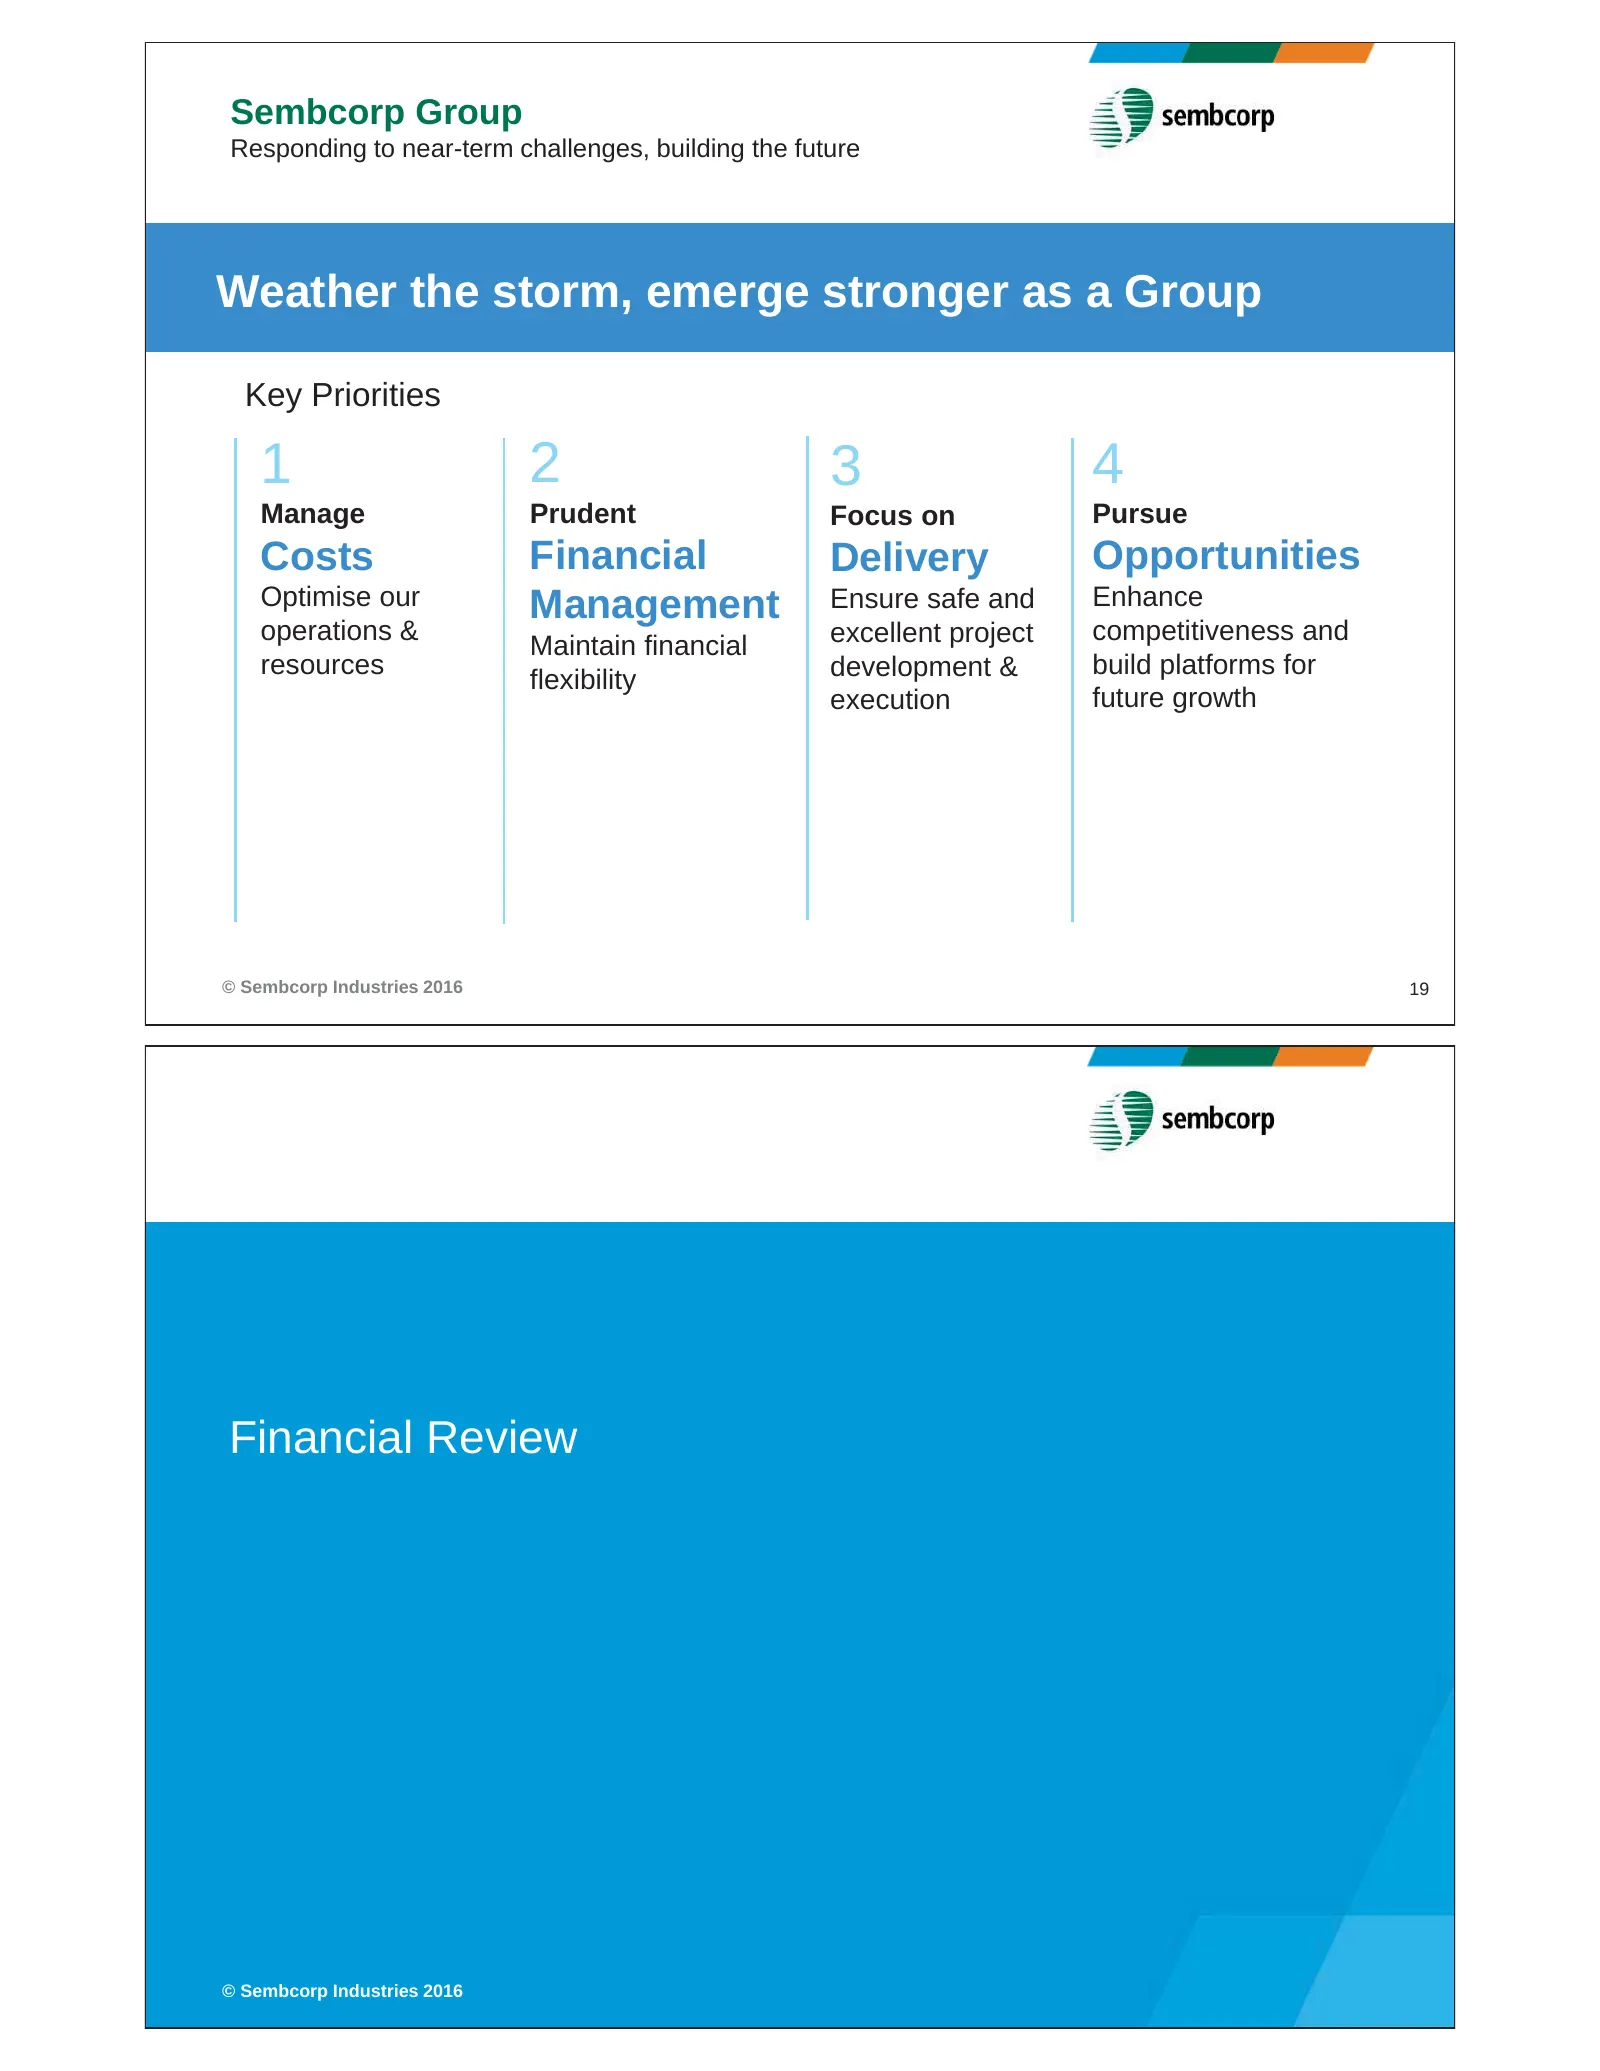
Sembcorp Group Responding to near-term challenges, building the future Weather the storm, emerge stronger as a Group Key Priorities 1 2 3 4 Manage Prudent Focus on Pursue Costs Financial Delivery Opportunities Optimise our Management Ensure safe and Enhance operations & excellent project competitive
Slide 11: Group Profit & Loss
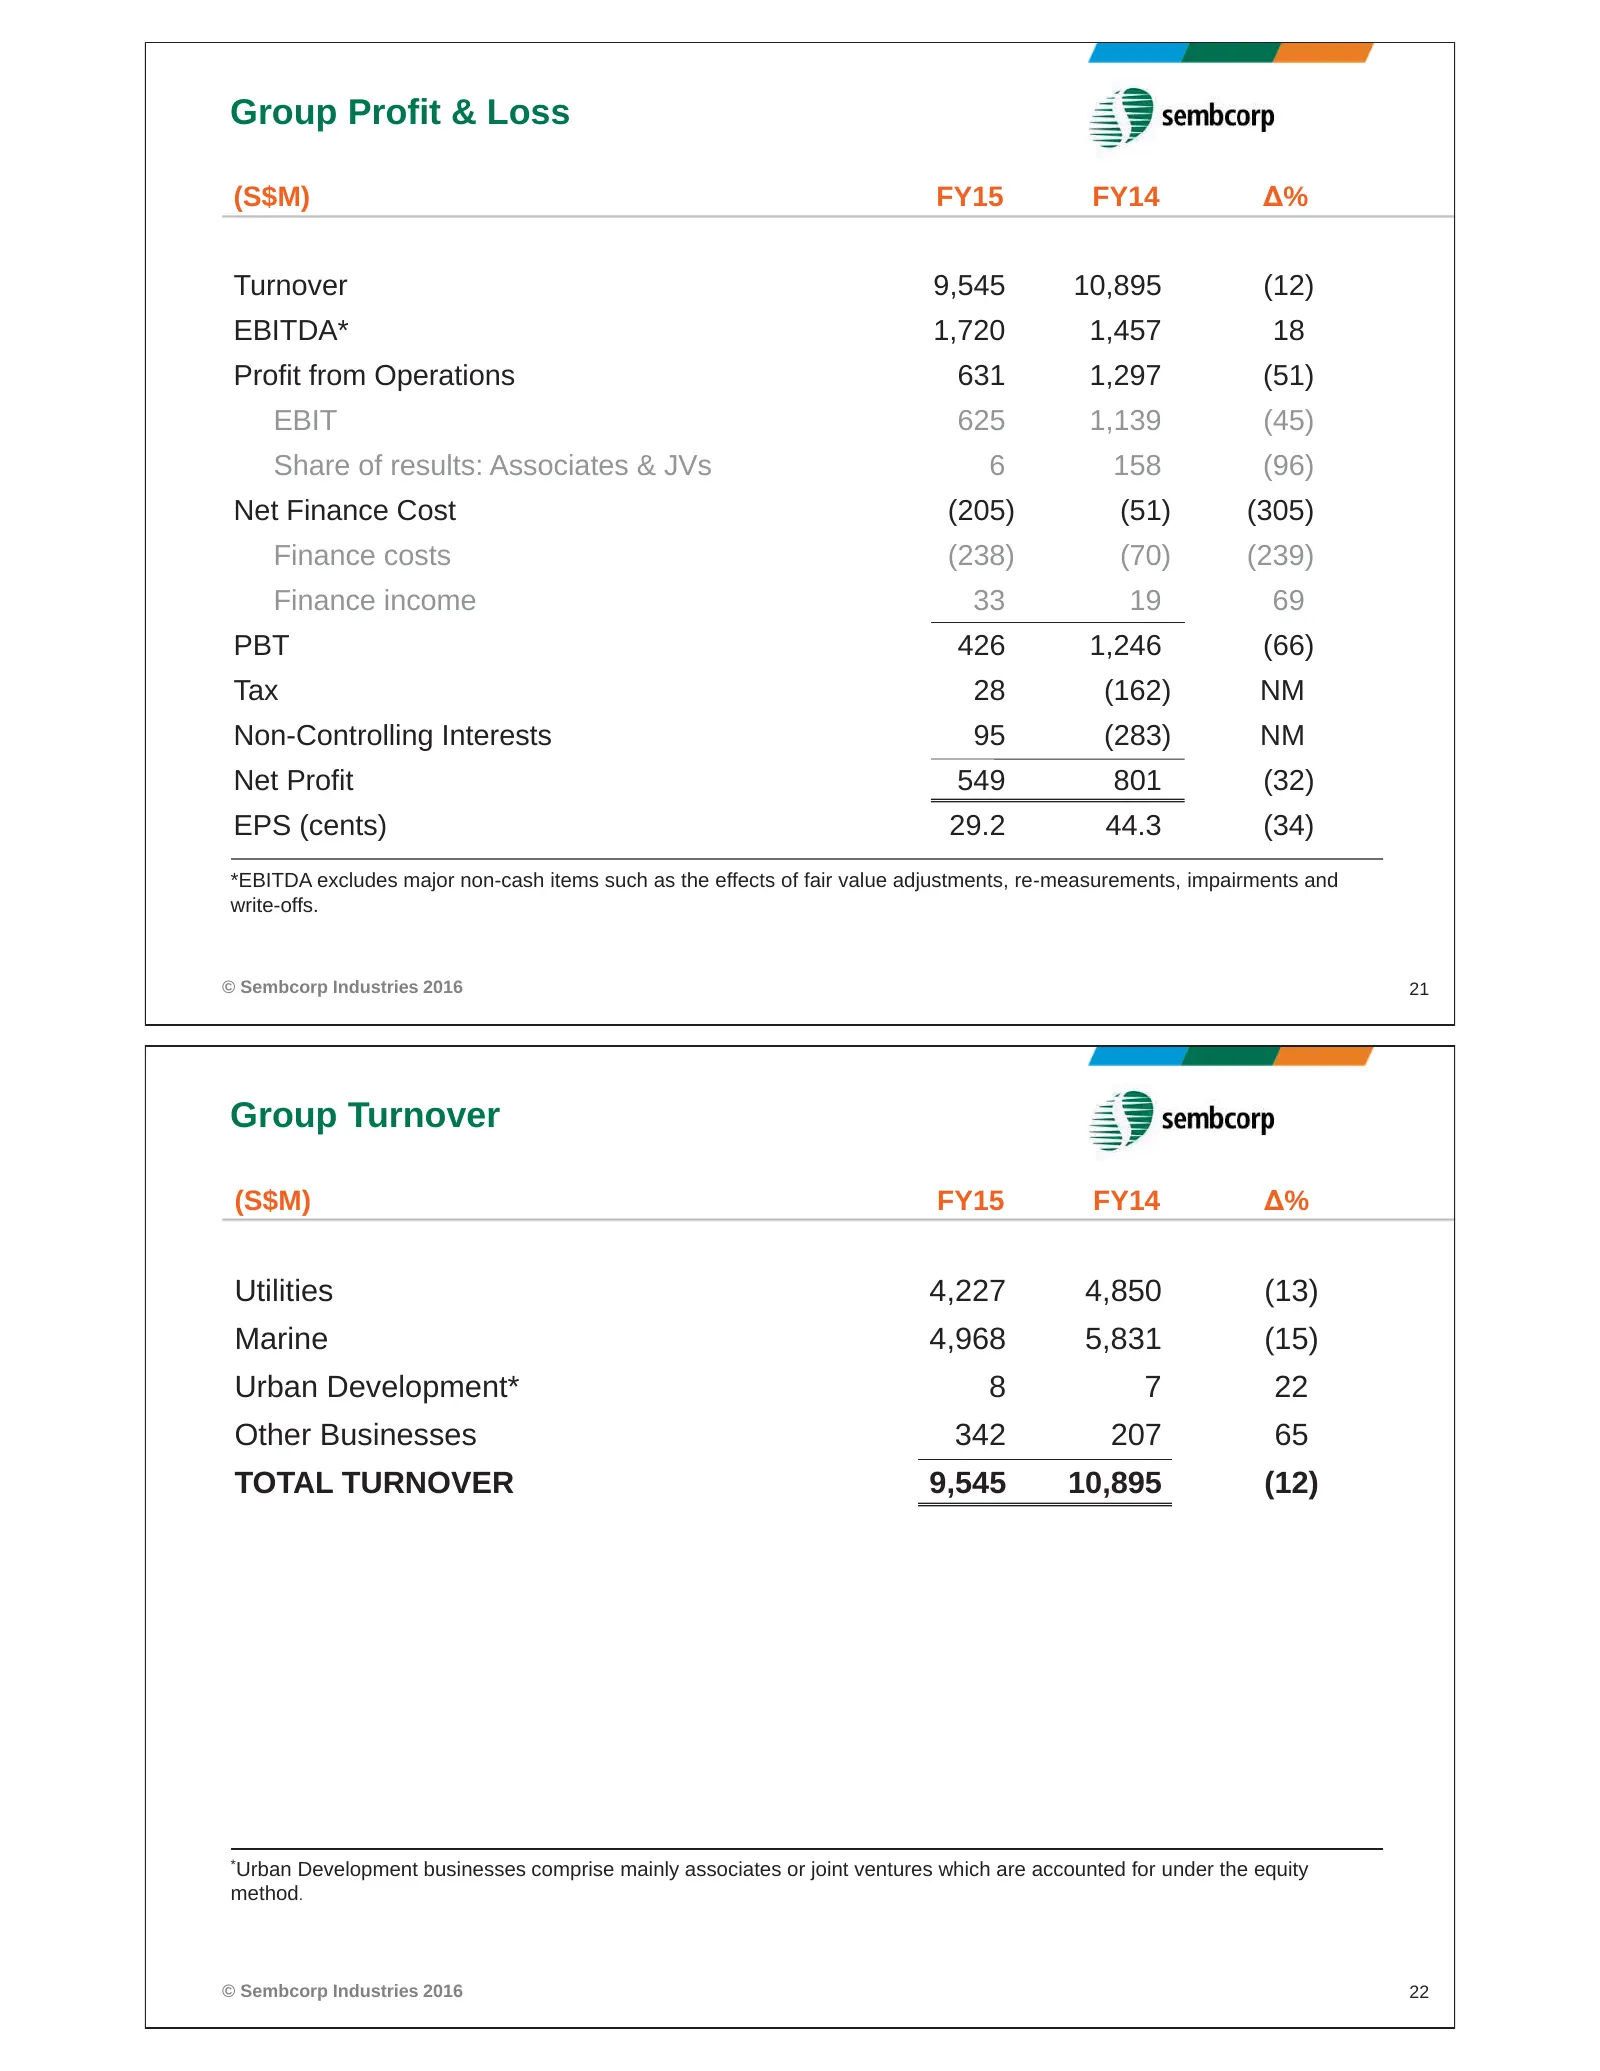
Group Profit & Loss (S$M) FY15 FY14 Δ% Turnover 9,545 10,895 (12) EBITDA* 1,720 1,457 18 Profit from Operations 631 1,297 (51) EBIT 625 1,139 (45) Share of results: Associates & JVs 6 158 (96) Net Finance Cost (205) (51) (305) Finance costs (238) (70) (239) Finance income 33 19 69 PBT 426 1,246 (66)
Slide 12: Group Profit from Operations and Net Profit
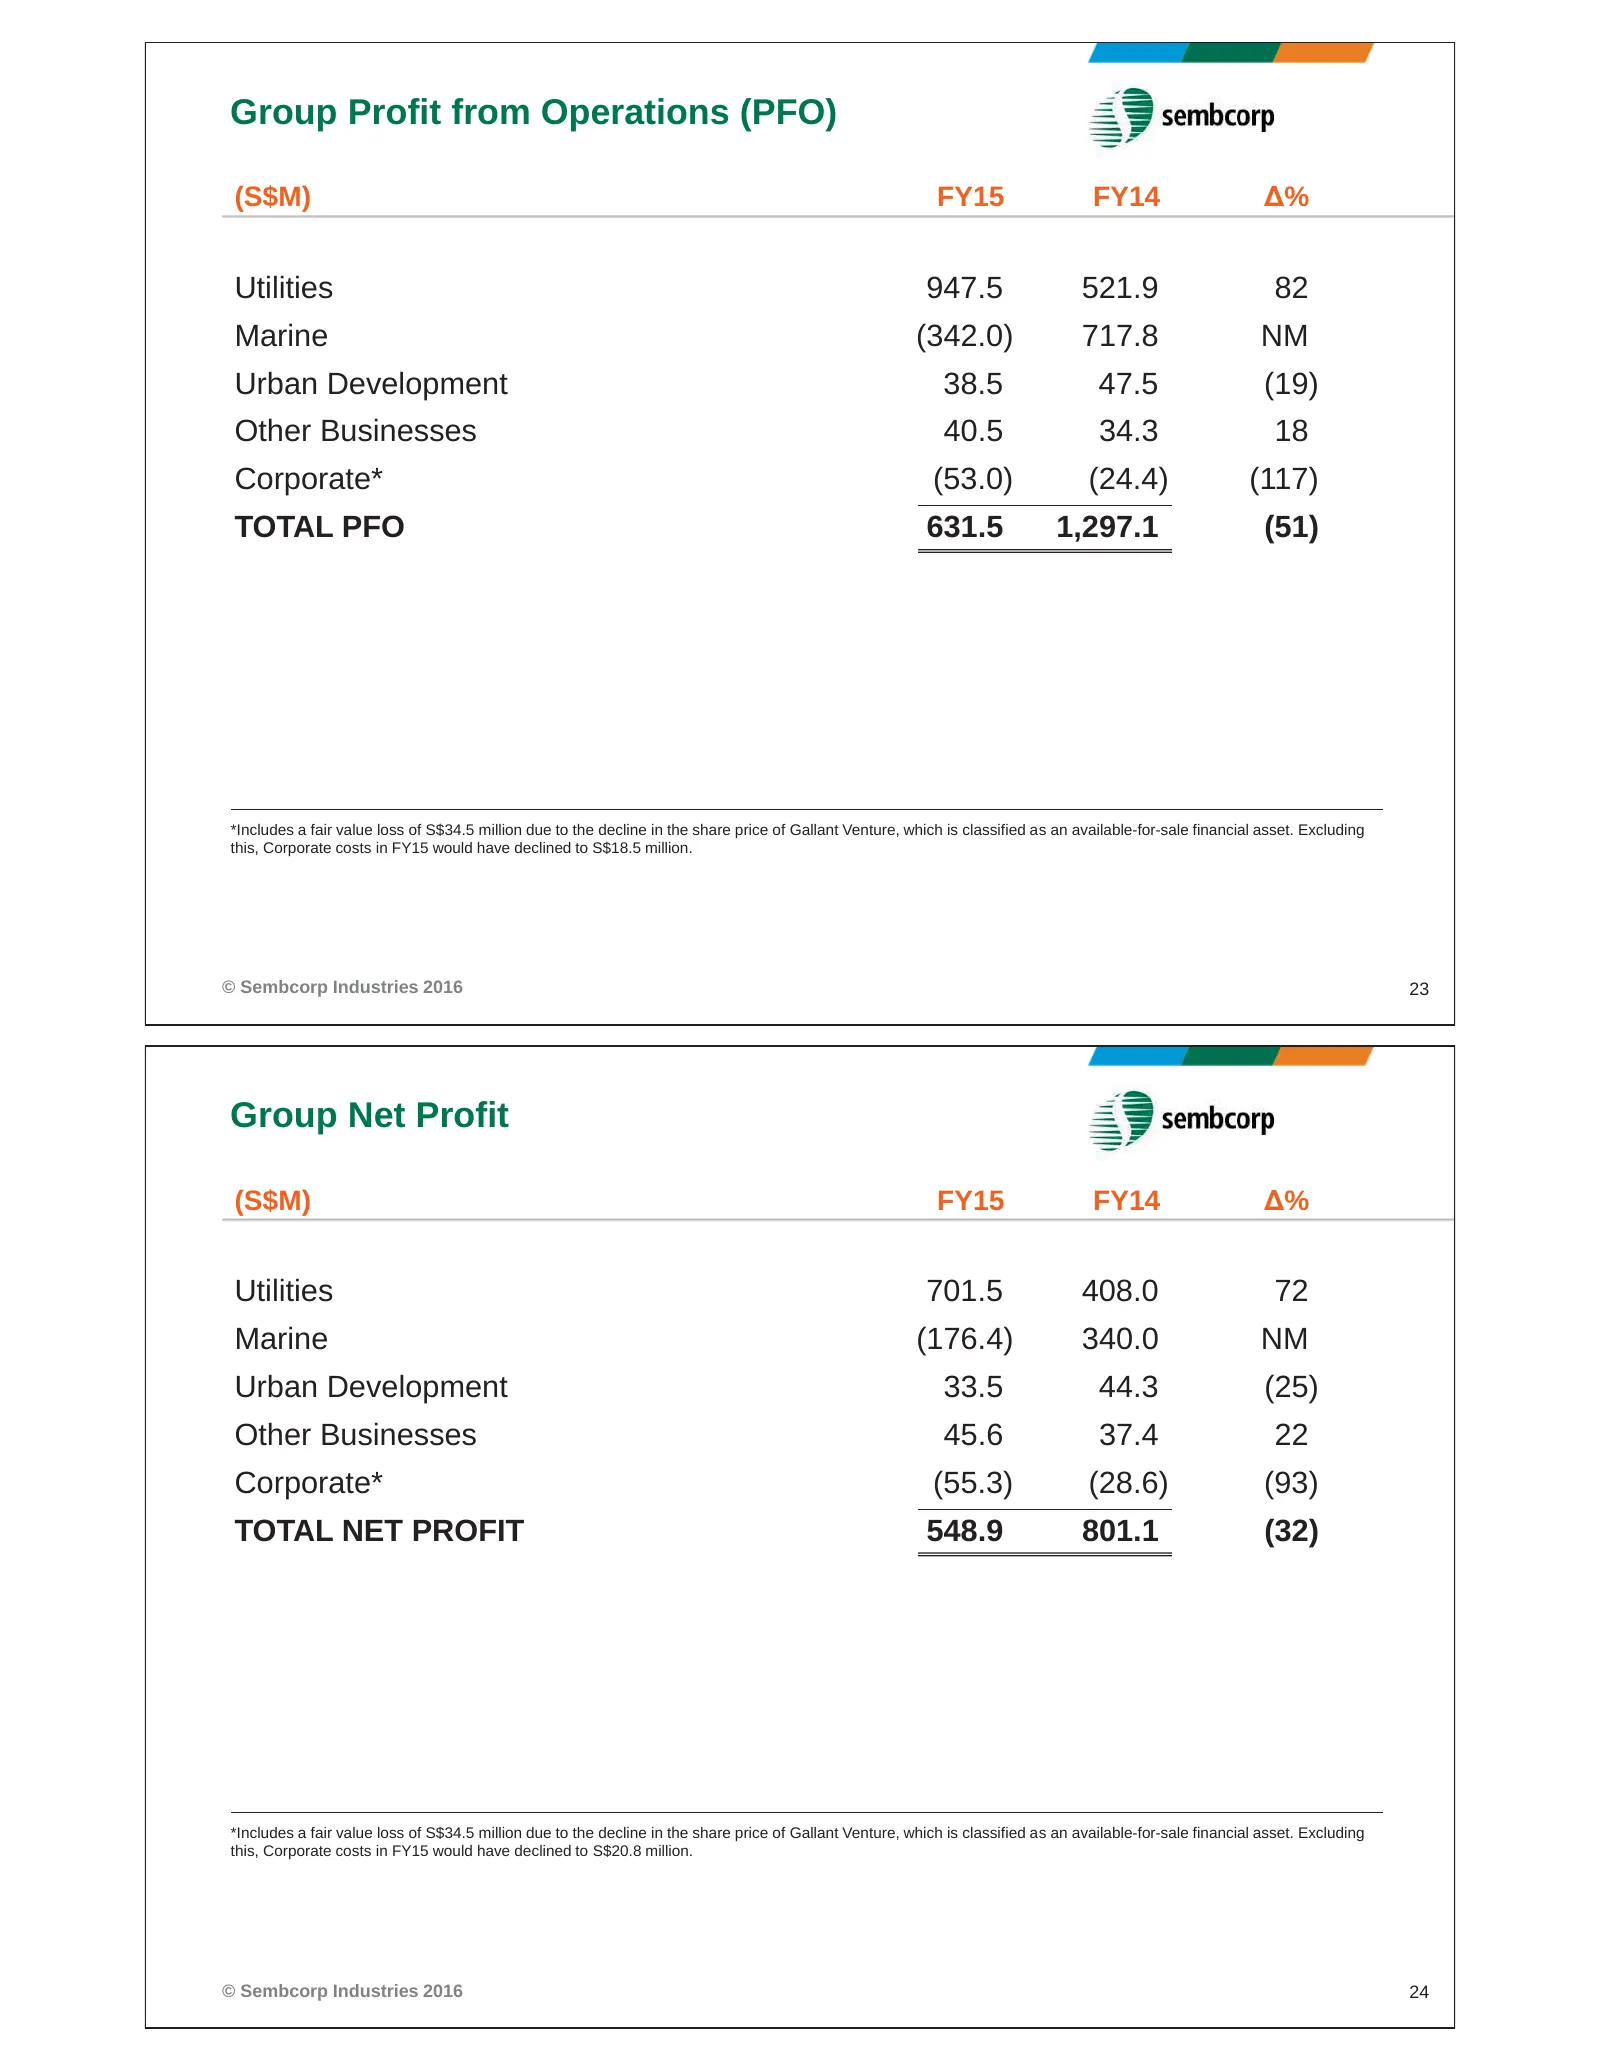
Group Profit from Operations (PFO) (S$M) FY15 FY14 Δ% Utilities 947.5 521.9 82 Marine (342.0) 717.8 NM Urban Development 38.5 47.5 (19) Other Businesses 40.5 34.3 18 Corporate* (53.0) (24.4) (117) TOTAL PFO 631.5 1,297.1 (51) *Includes a fair value loss of S$34.5 million due to the decline in the sh
Slide 13: Utilities Net Profit
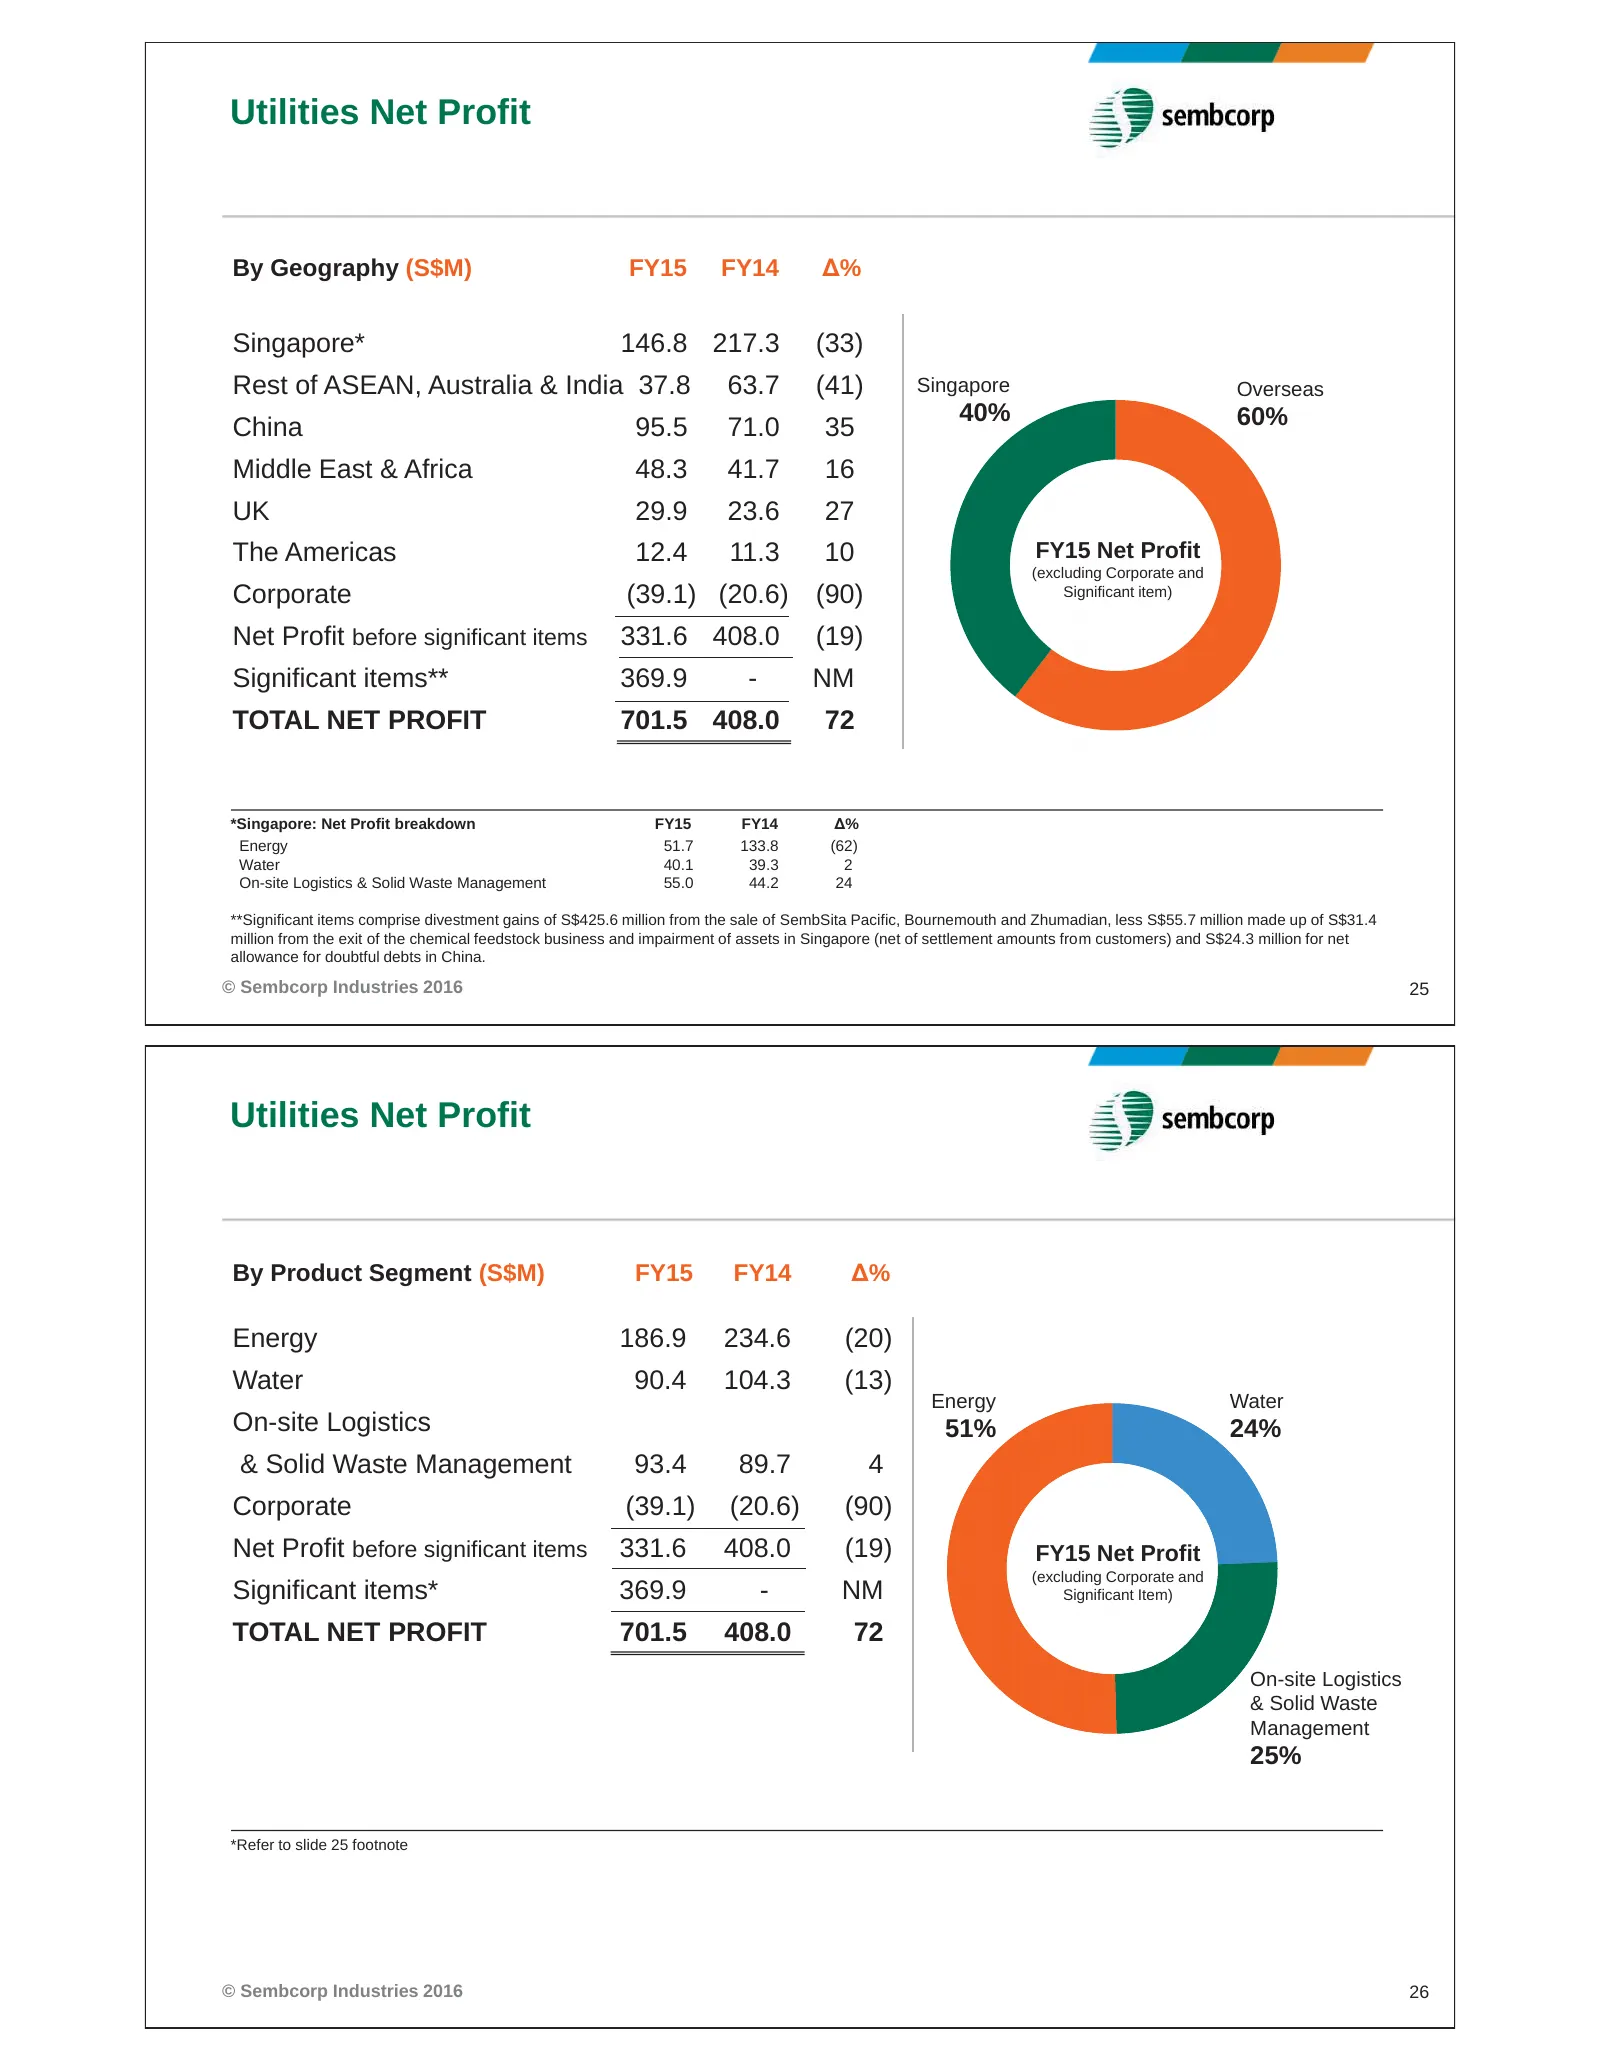
Utilities Net Profit By Geography (S$M) FY15 FY14 Δ% Singapore* 146.8 217.3 (33) Rest of ASEAN, Australia & India 37.8 63.7 (41) Singapore Overseas 40% 60% China 95.5 71.0 35 Middle East & Africa 48.3 41.7 16 UK 29.9 23.6 27 The Americas 12.4 11.3 10 FY15 Net Profit (excluding Corporate and Corporat
Slide 14: Group Capex, Equity Investment and Free Cash Flow
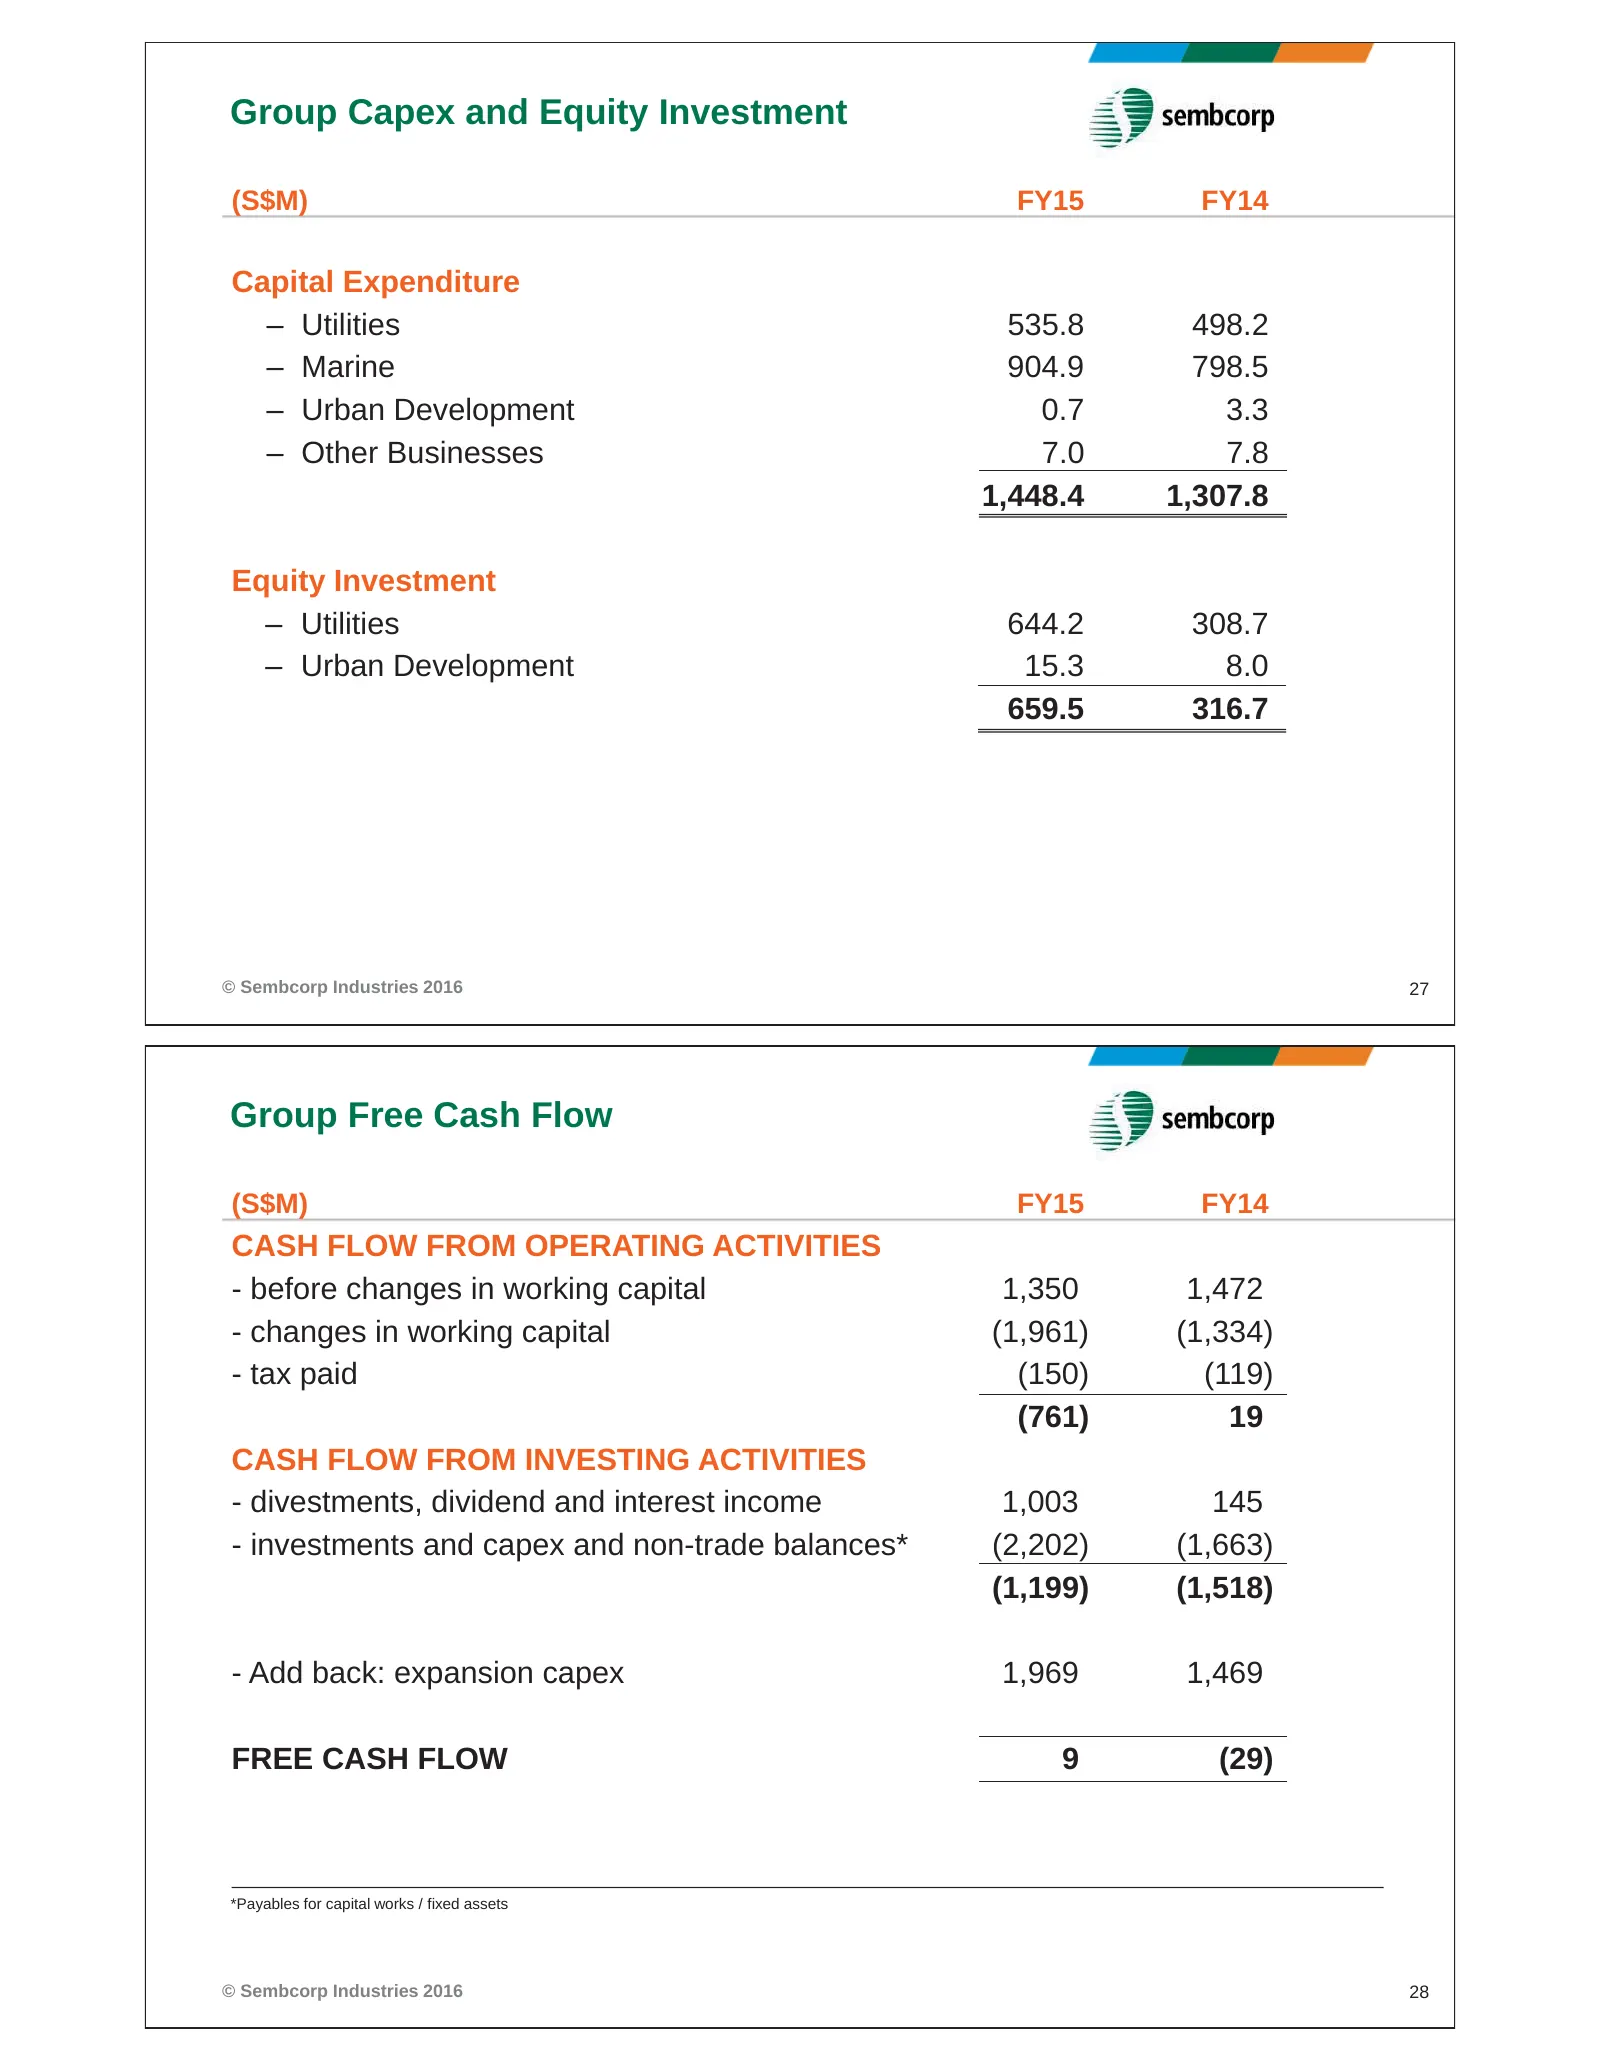
Group Capex and Equity Investment (S$M) FY15 FY14 Capital Expenditure – Utilities 535.8 498.2 – Marine 904.9 798.5 – Urban Development 0.7 3.3 – Other Businesses 7.0 7.8 1,448.4 1,307.8 Equity Investment – Utilities 644.2 308.7 – Urban Development 15.3 8.0 659.5 316.7 © Sembcorp Industries 2016 27 G
Slide 15: Group Borrowings and Financial Indicators
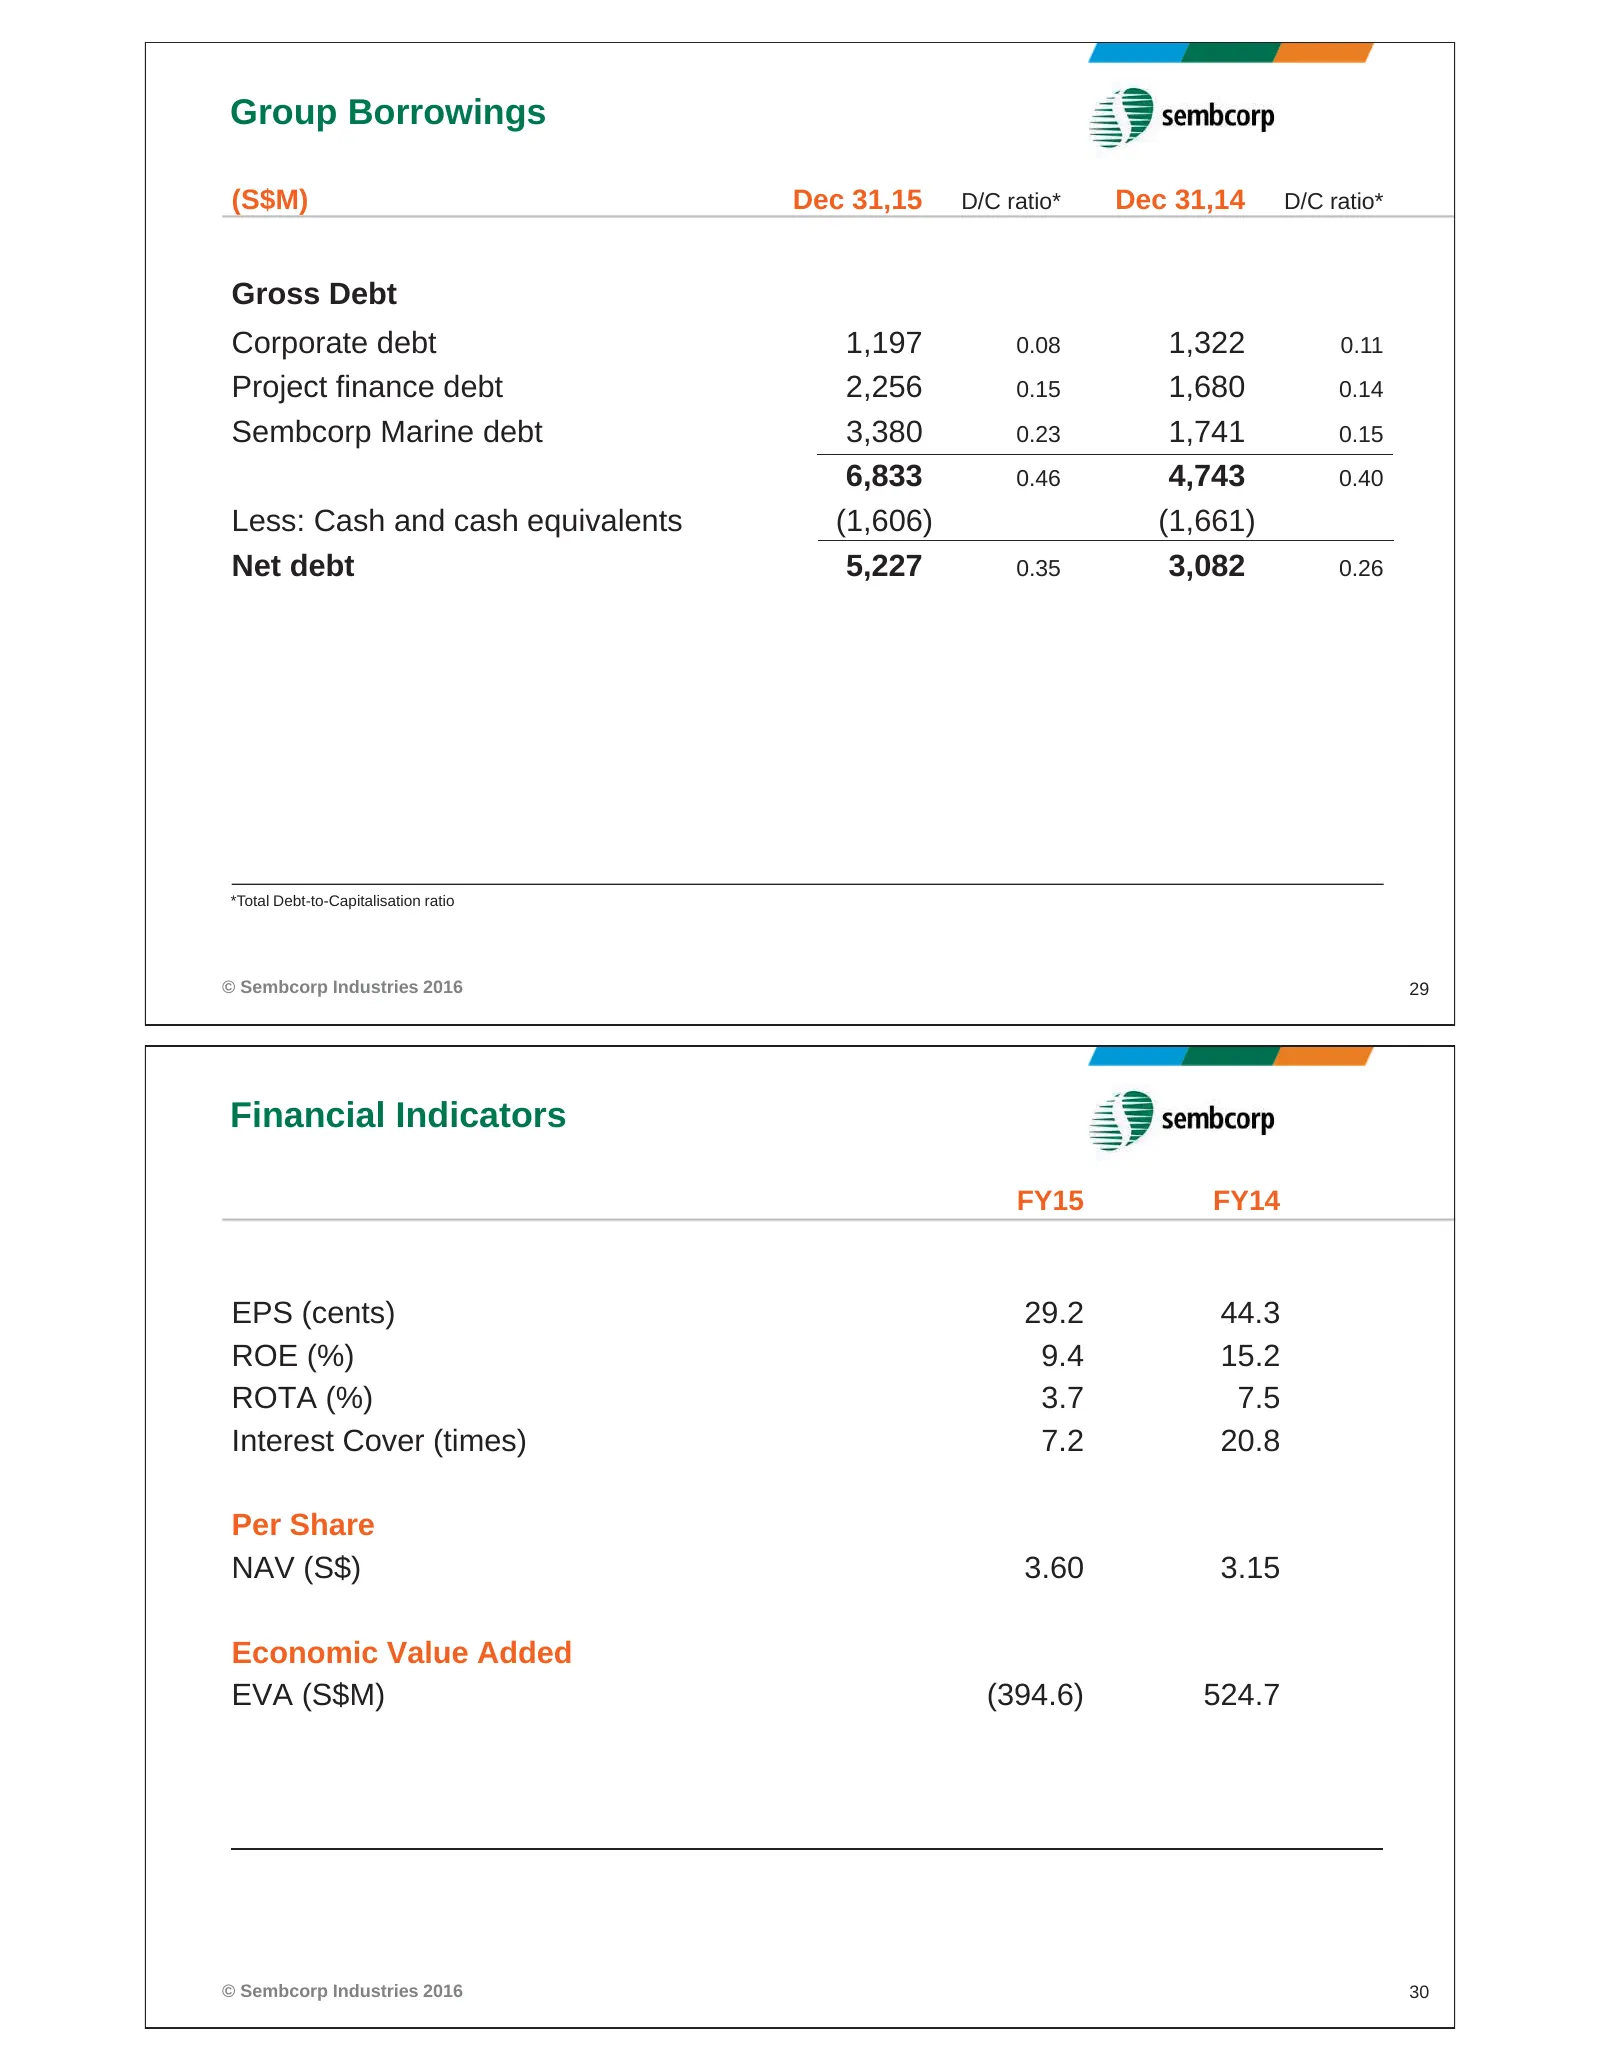
Group Borrowings (S$M) Dec 31,15 D/C ratio* Dec 31,14 D/C ratio* Gross Debt Corporate debt 1,197 0.08 1,322 0.11 Project finance debt 2,256 0.15 1,680 0.14 Sembcorp Marine debt 3,380 0.23 1,741 0.15 6,833 0.46 4,743 0.40 Less: Cash and cash equivalents (1,606) (1,661) Net debt 5,227 0.35 3,082 0.26
Slide 16: Group Outlook
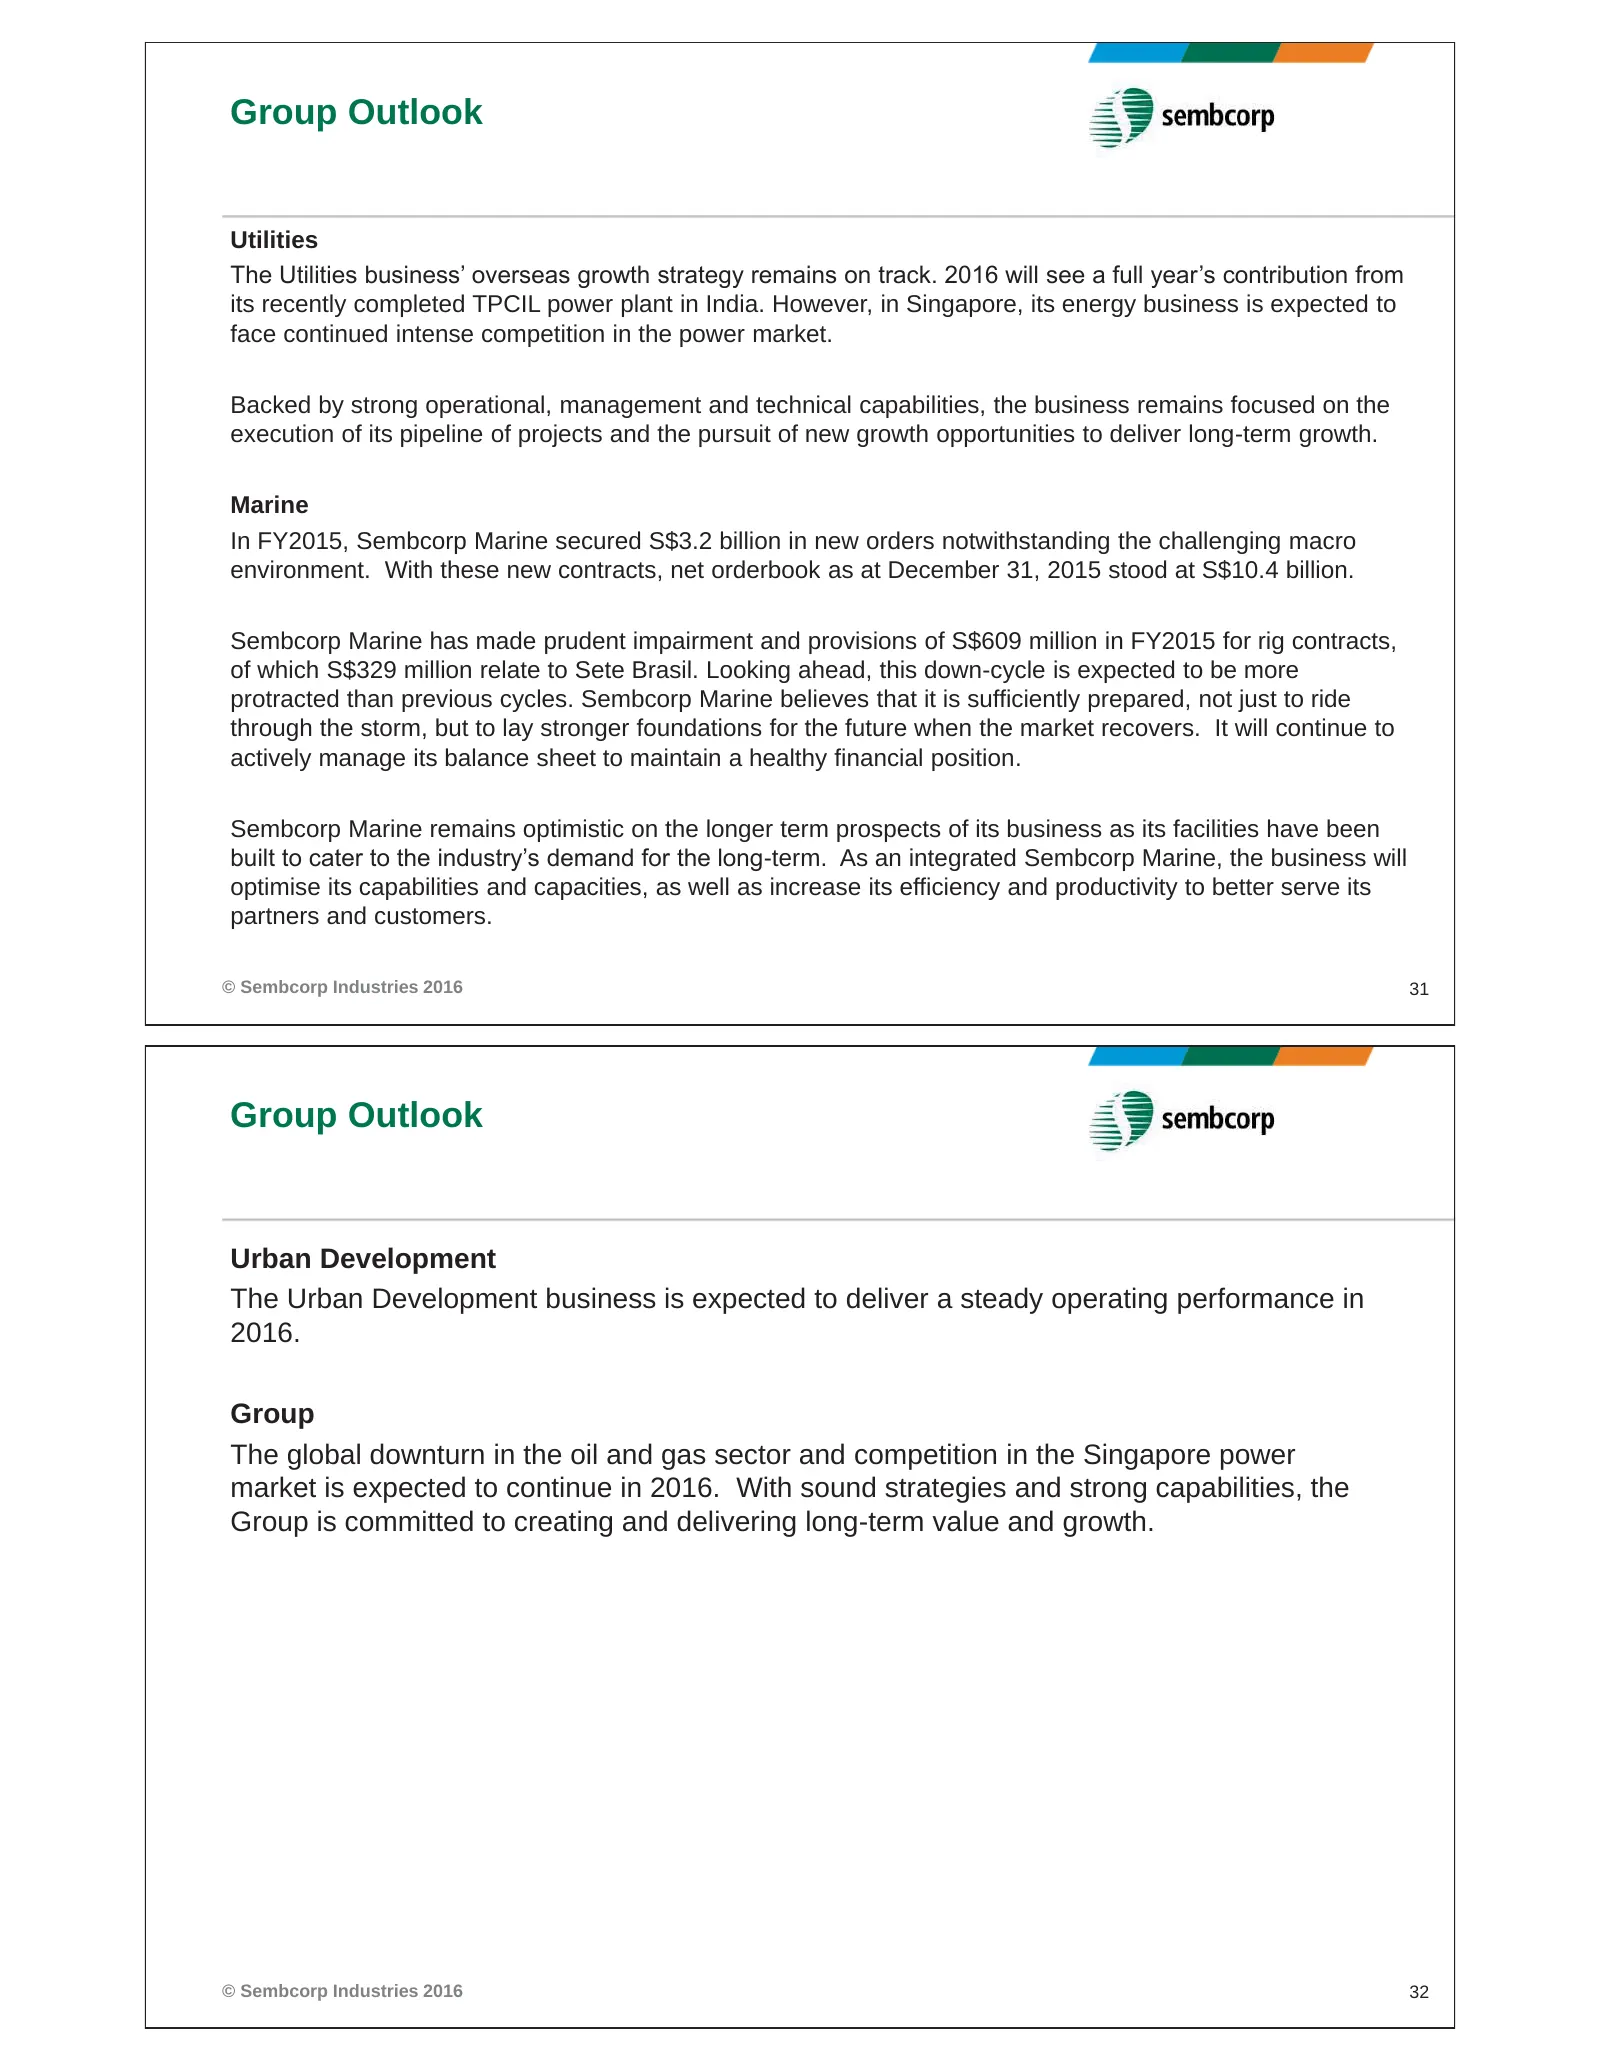
Group Outlook Utilities The Utilities business’ overseas growth strategy remains on track. 2016 will see a full year’s contribution from its recently completed TPCIL power plant in India. However, in Singapore, its energy business is expected to face continued intense competition in the power market
Slide 17: Disclaimer
Vital Partners. Essential Solutions. Disclaimer This presentation contains certain statements that are not statements of historical fact, i.e. forward- looking statements. These forward-looking statements are based on current expectations, projections and assumptions about future events. Although Se
Slide 18: Appendix: Group Profit & Loss 4Q15
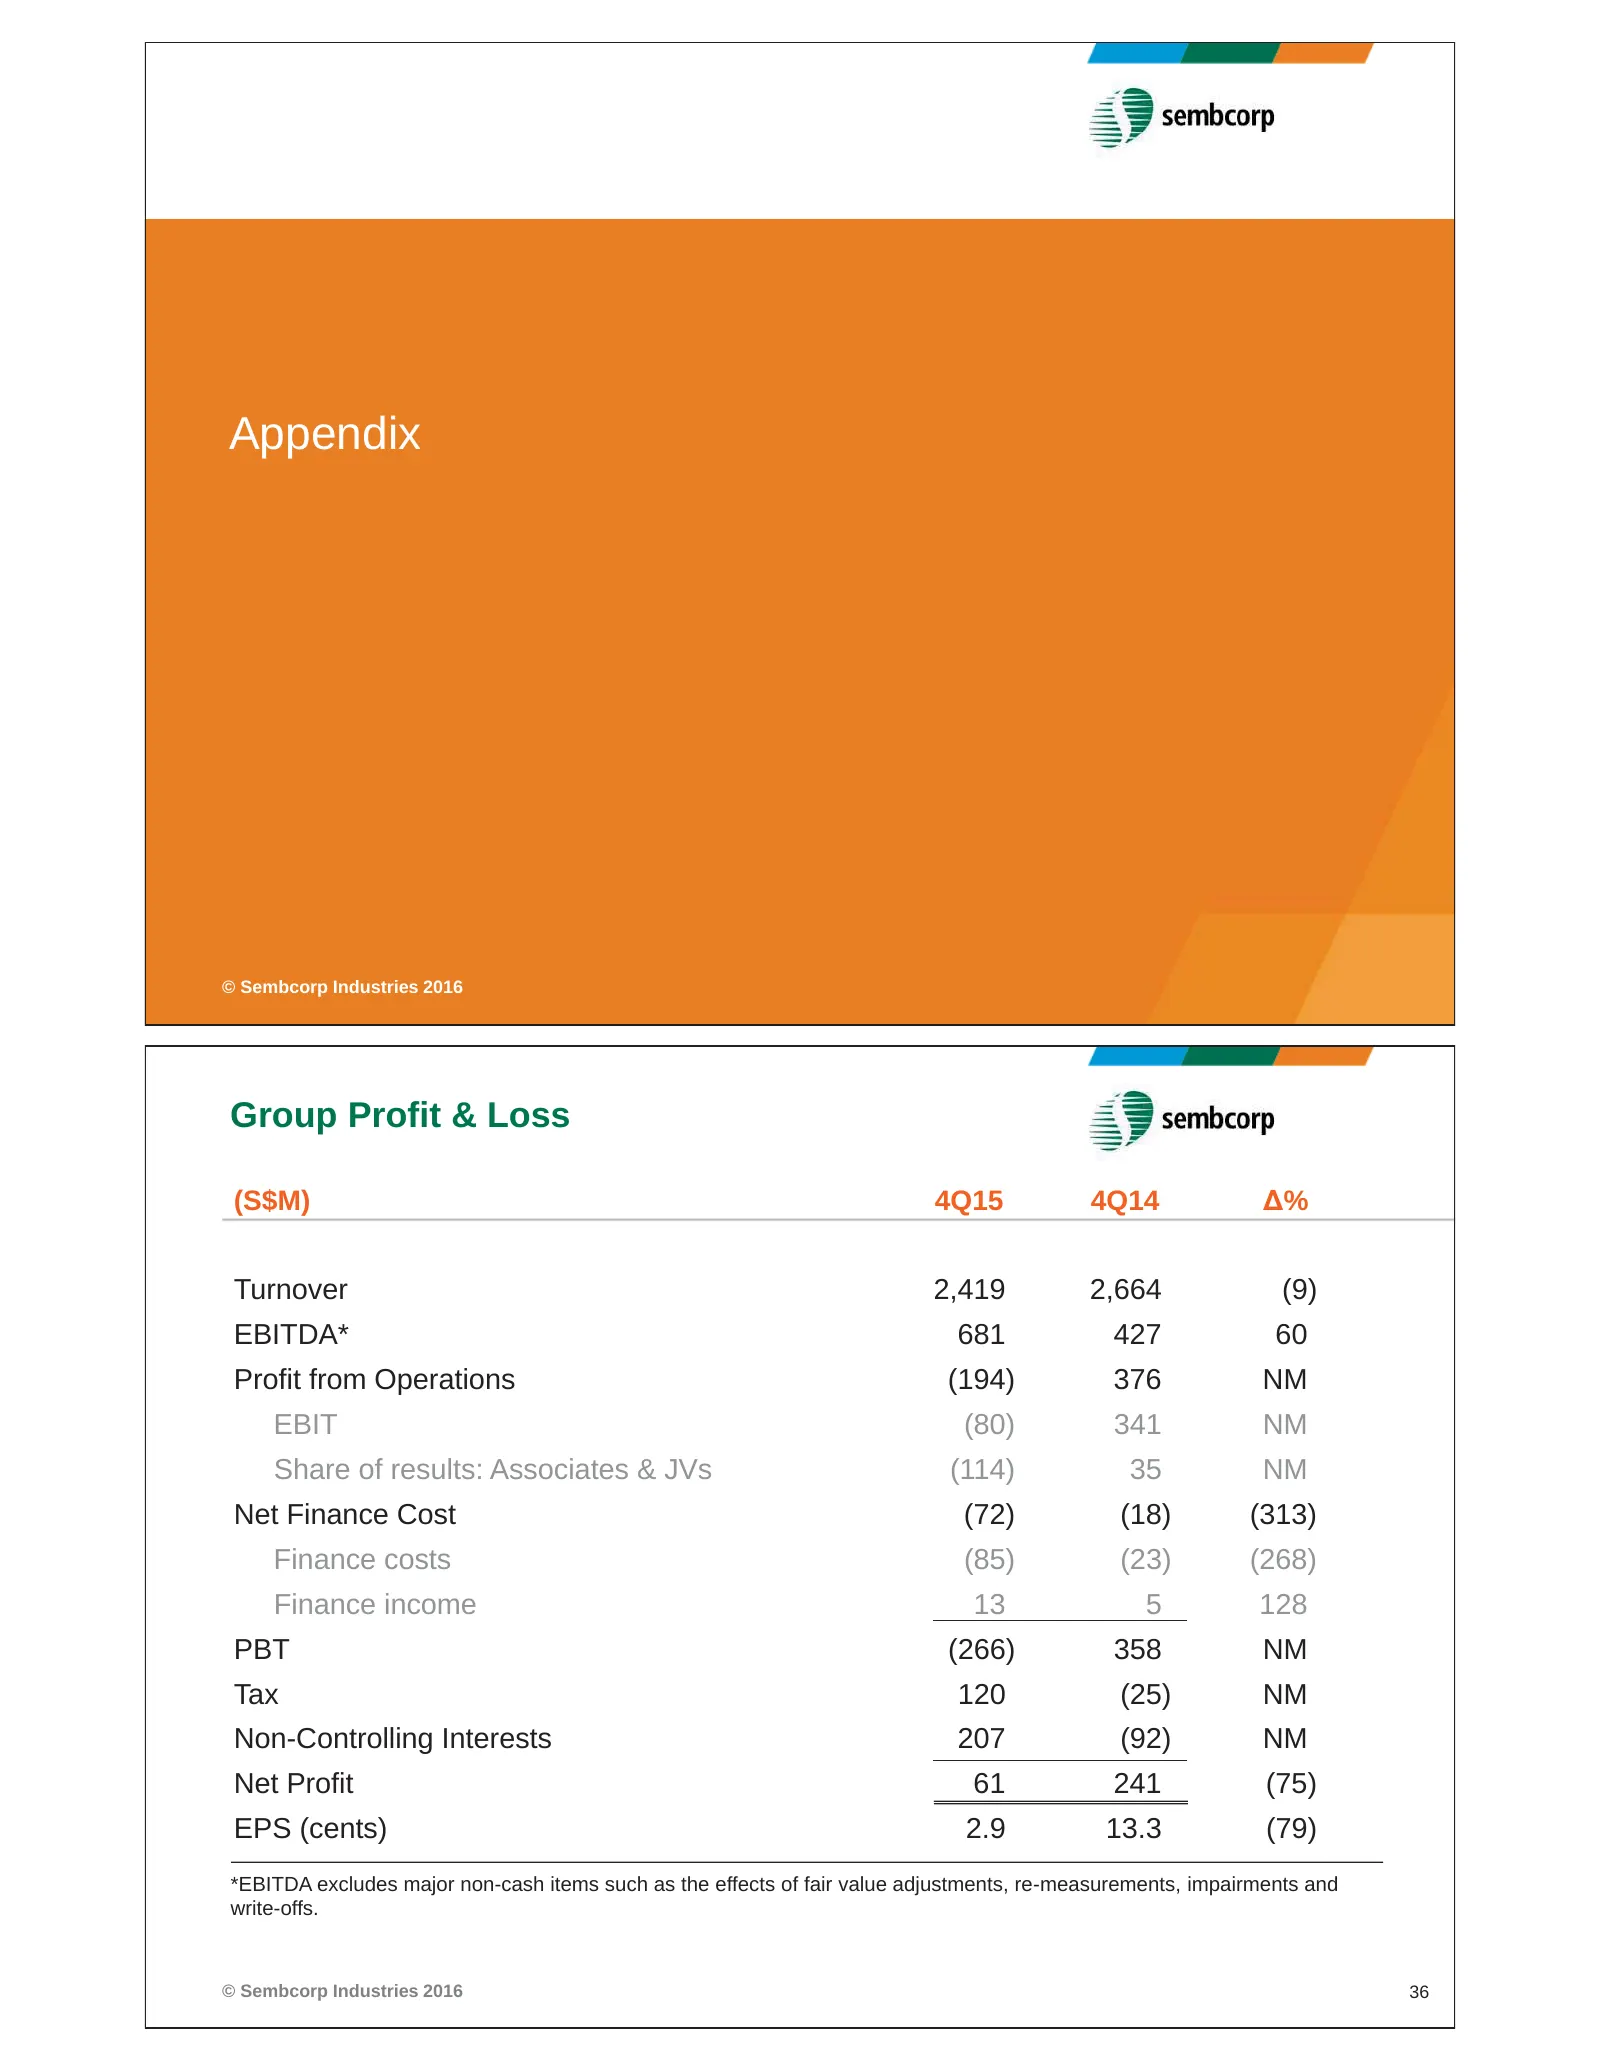
Appendix © Sembcorp Industries 2016 Group Profit & Loss (S$M) 4Q15 4Q14 Δ% Turnover 2,419 2,664 (9) EBITDA* 681 427 60 Profit from Operations (194) 376 NM EBIT (80) 341 NM Share of results: Associates & JVs (114) 35 NM Net Finance Cost (72) (18) (313) Finance costs (85) (23) (268) Finance income 13
Slide 19: Group Turnover and Profit from Operations 4Q15
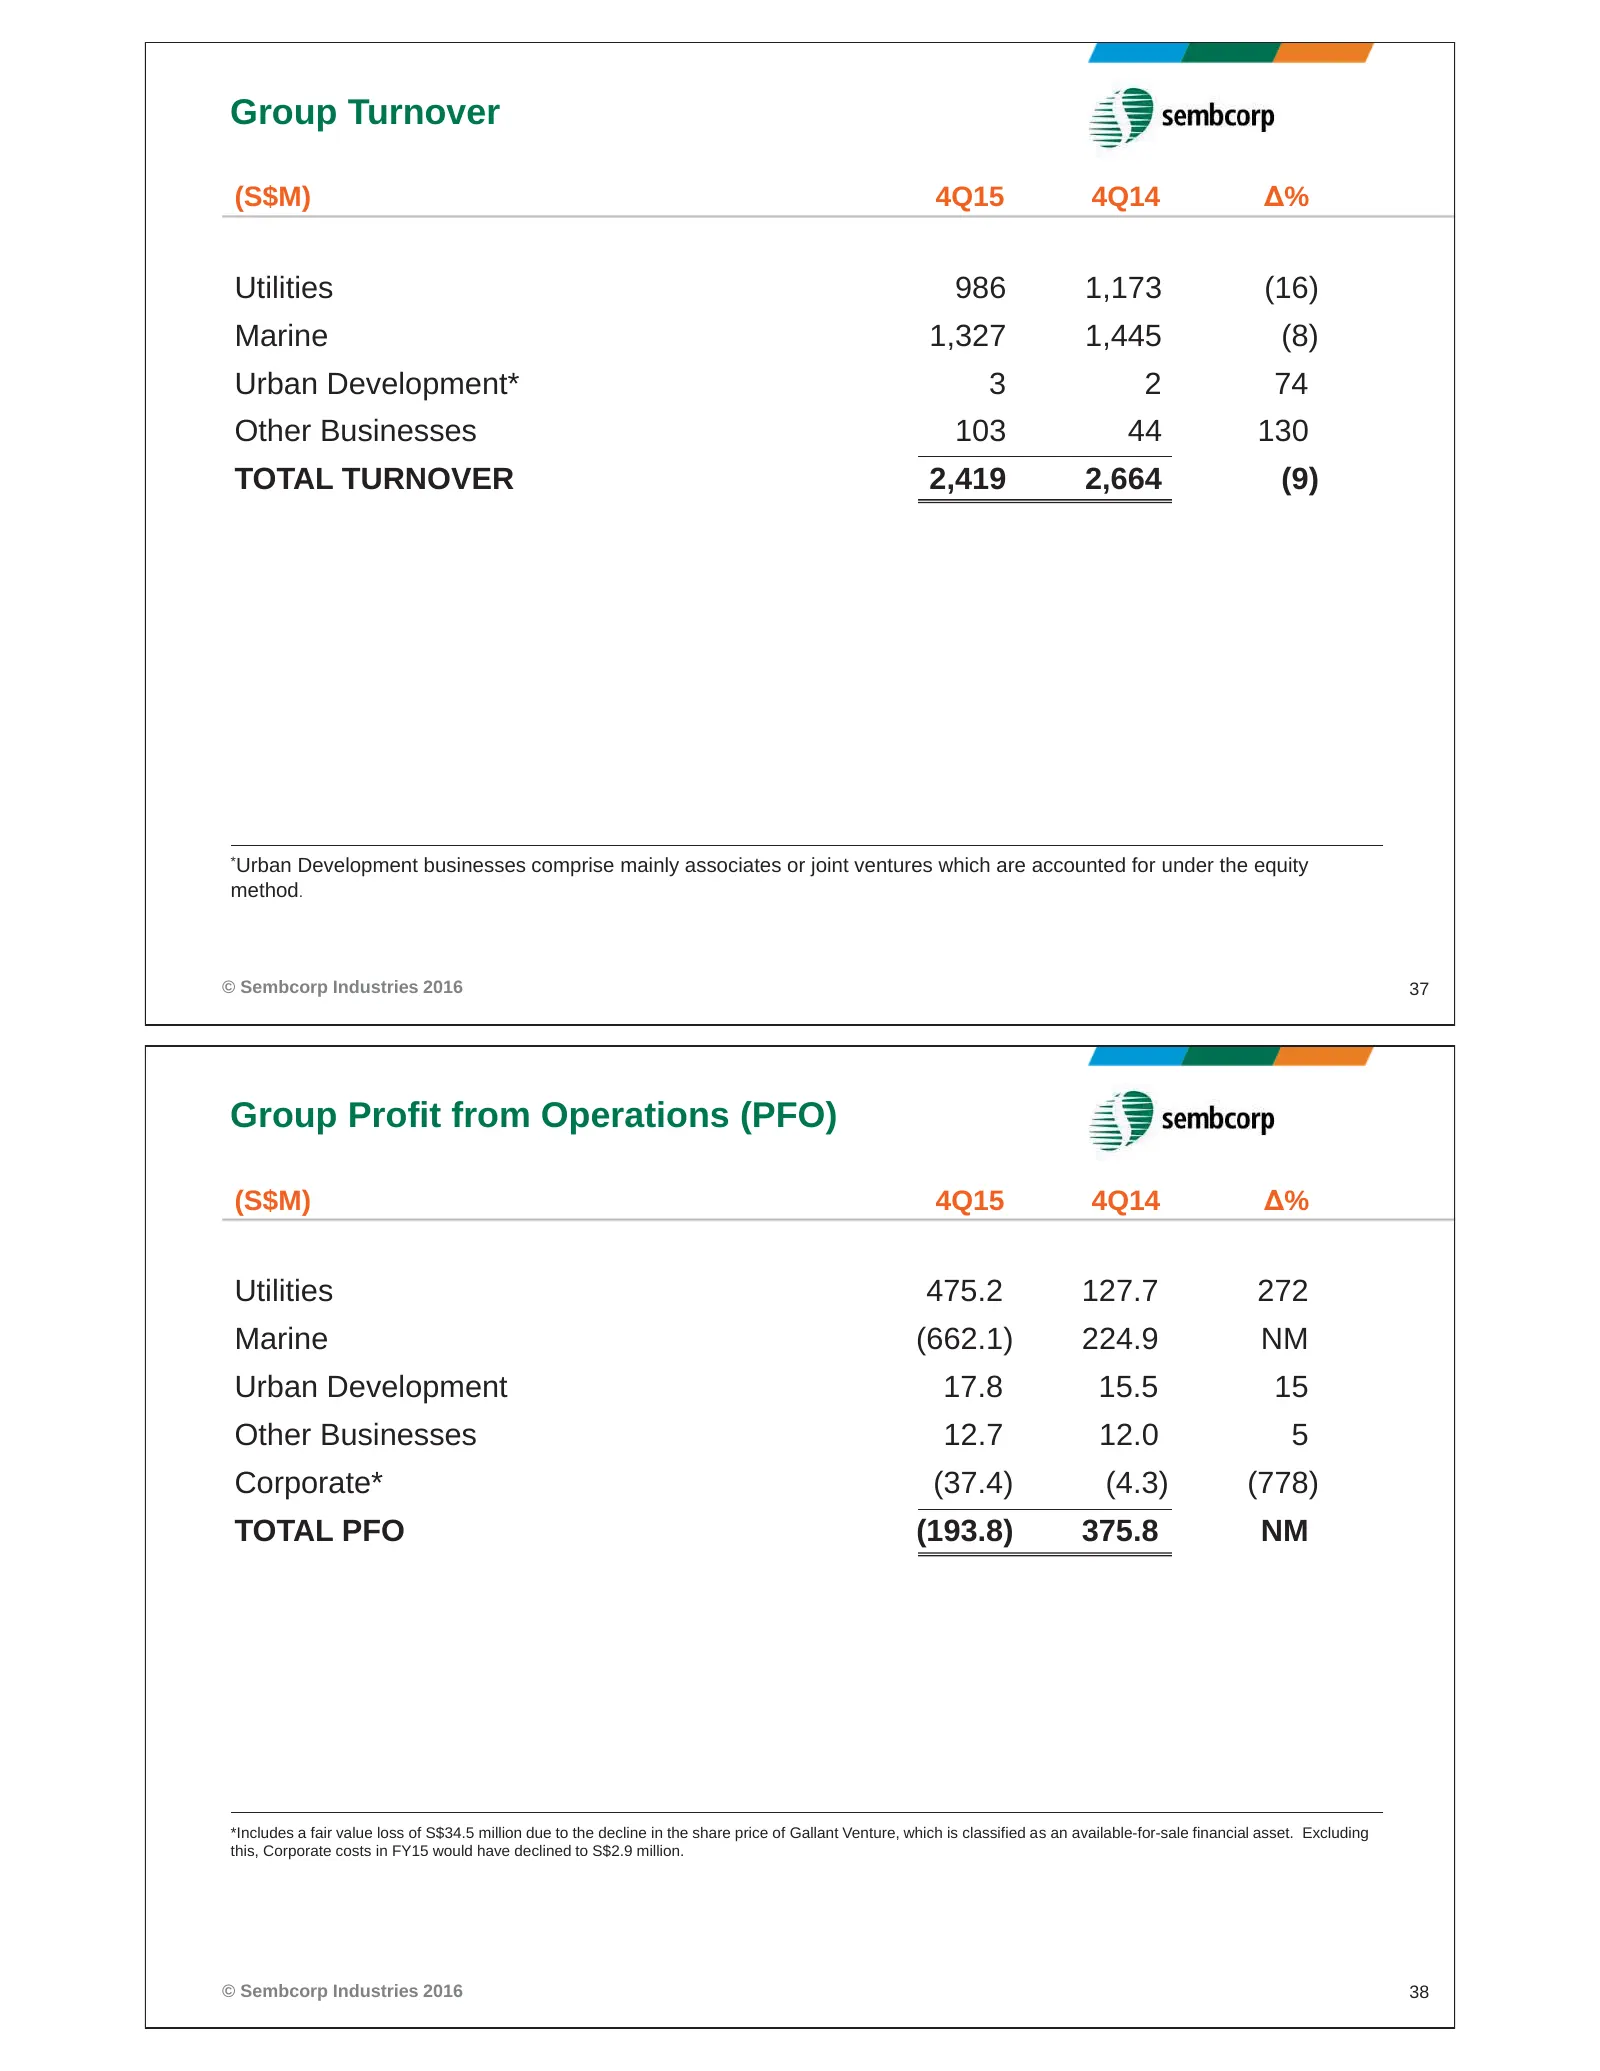
Group Turnover (S$M) 4Q15 4Q14 Δ% Utilities 986 1,173 (16) Marine 1,327 1,445 (8) Urban Development* 3 2 74 Other Businesses 103 44 130 TOTAL TURNOVER 2,419 2,664 (9) *Urban Development businesses comprise mainly associates or joint ventures which are accounted for under the equity method. © Sembcor
Slide 20: Group Net Profit and Utilities Turnover
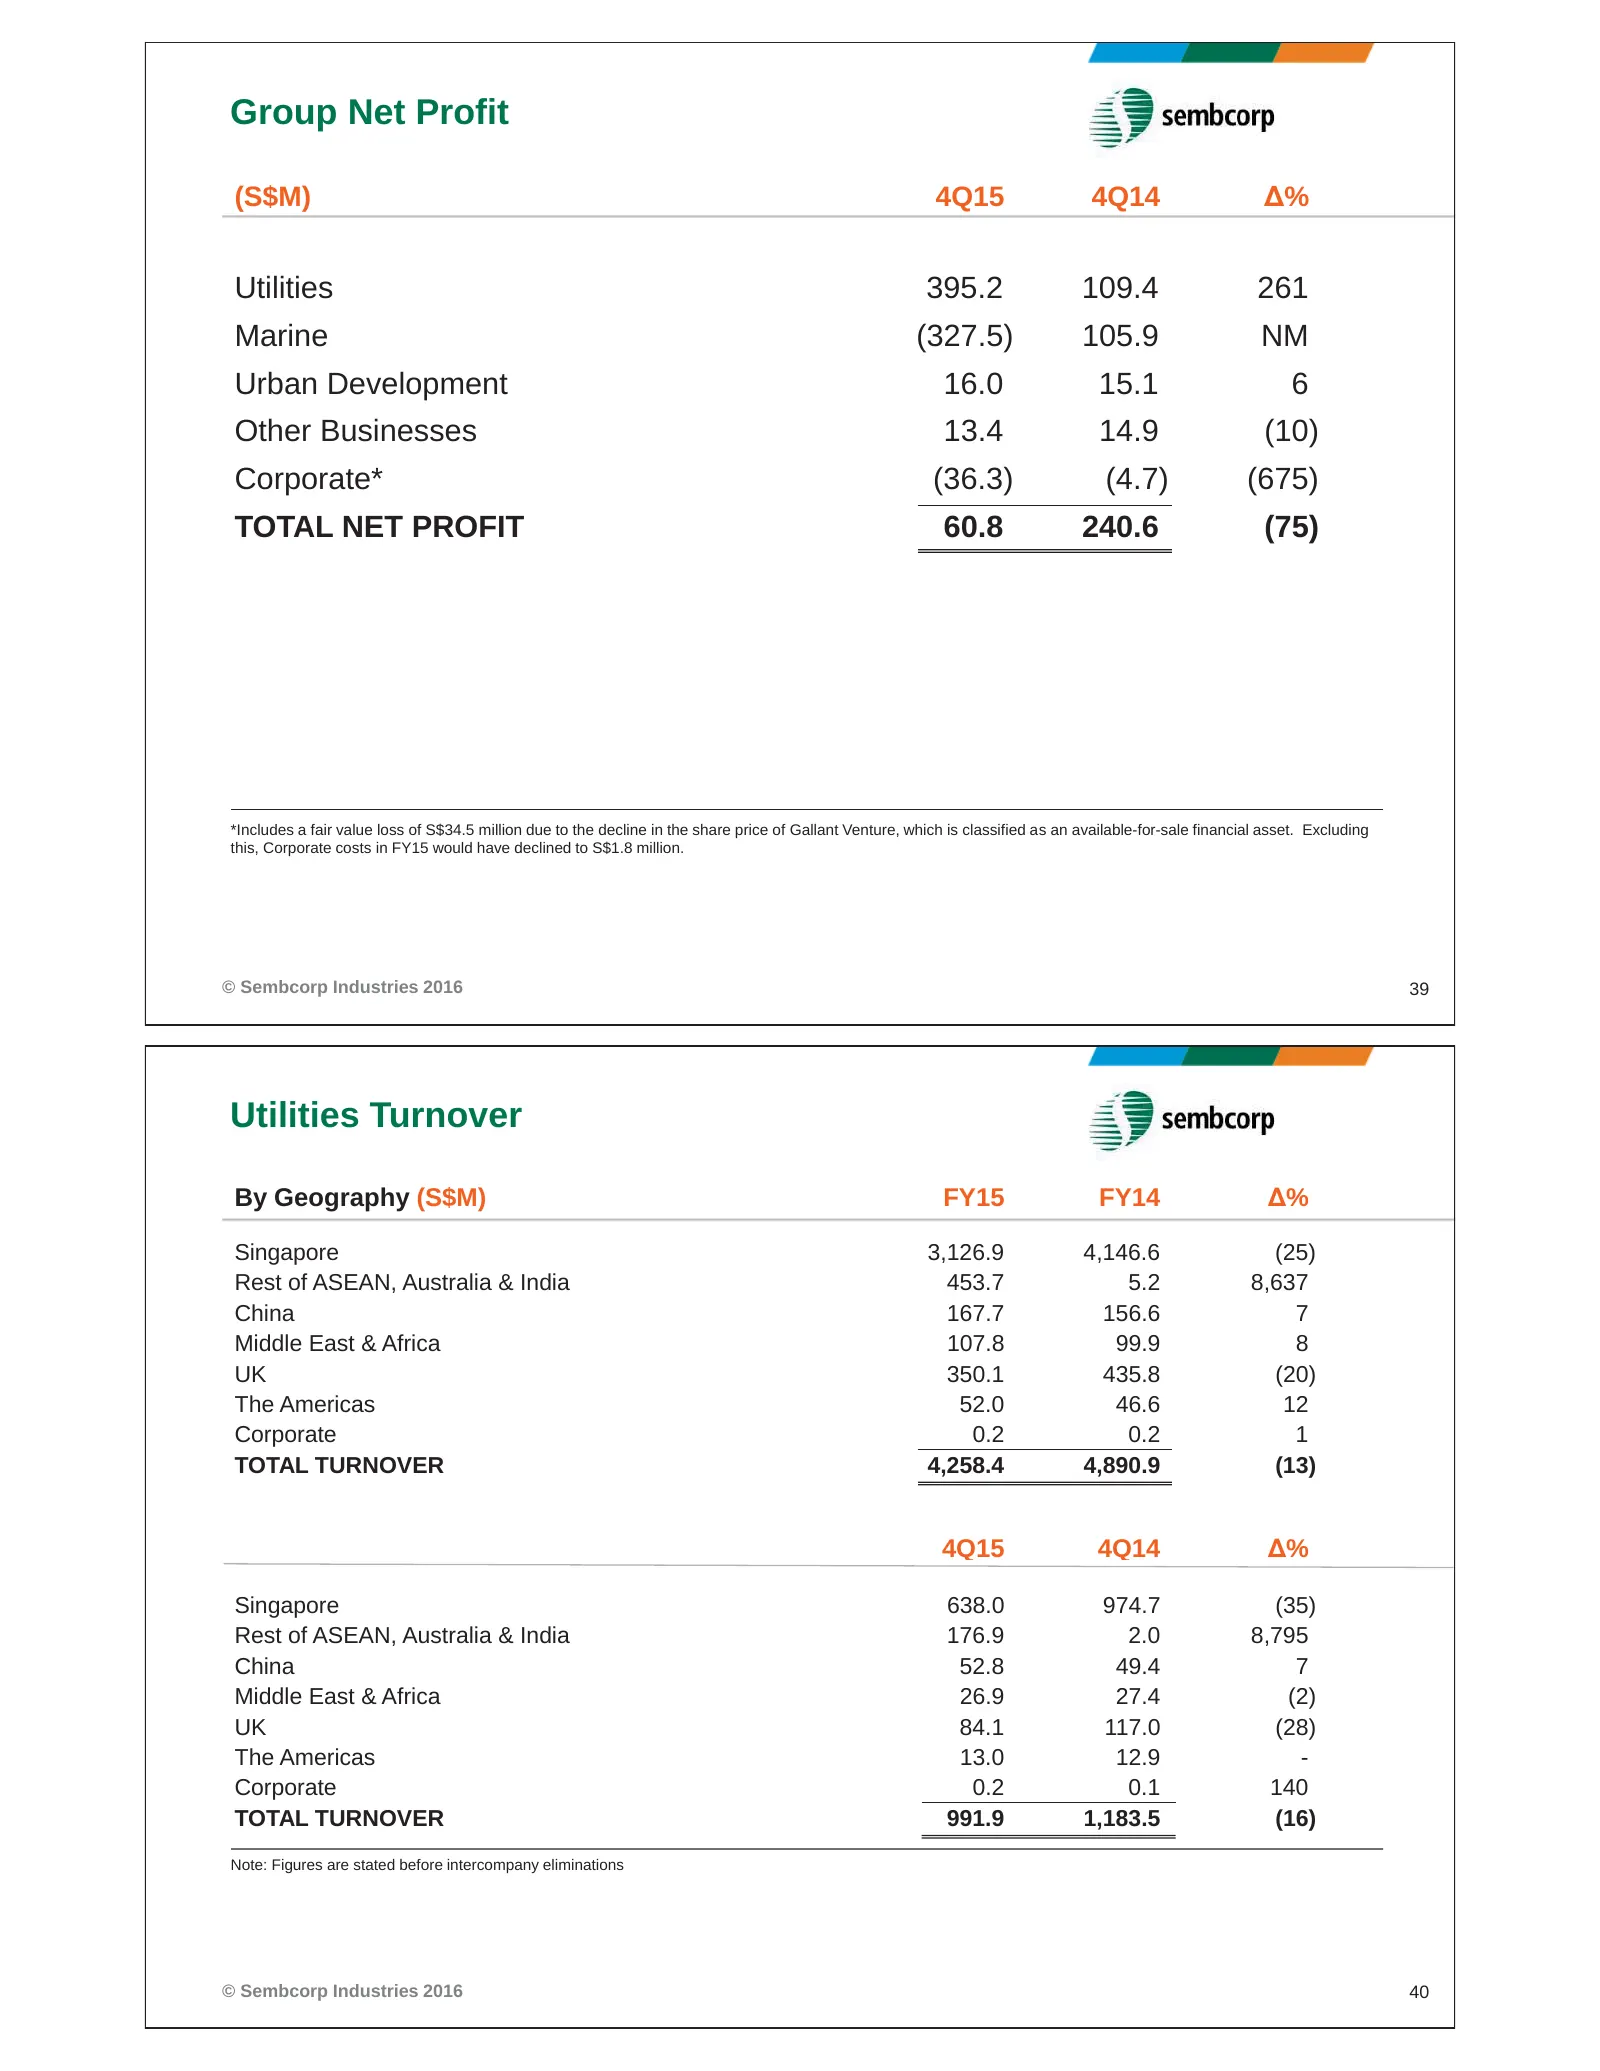
Group Net Profit (S$M) 4Q15 4Q14 Δ% Utilities 395.2 109.4 261 Marine (327.5) 105.9 NM Urban Development 16.0 15.1 6 Other Businesses 13.4 14.9 (10) Corporate* (36.3) (4.7) (675) TOTAL NET PROFIT 60.8 240.6 (75) *Includes a fair value loss of S$34.5 million due to the decline in the share price of Ga
Slide 21: Utilities PFO and Net Profit by Geography
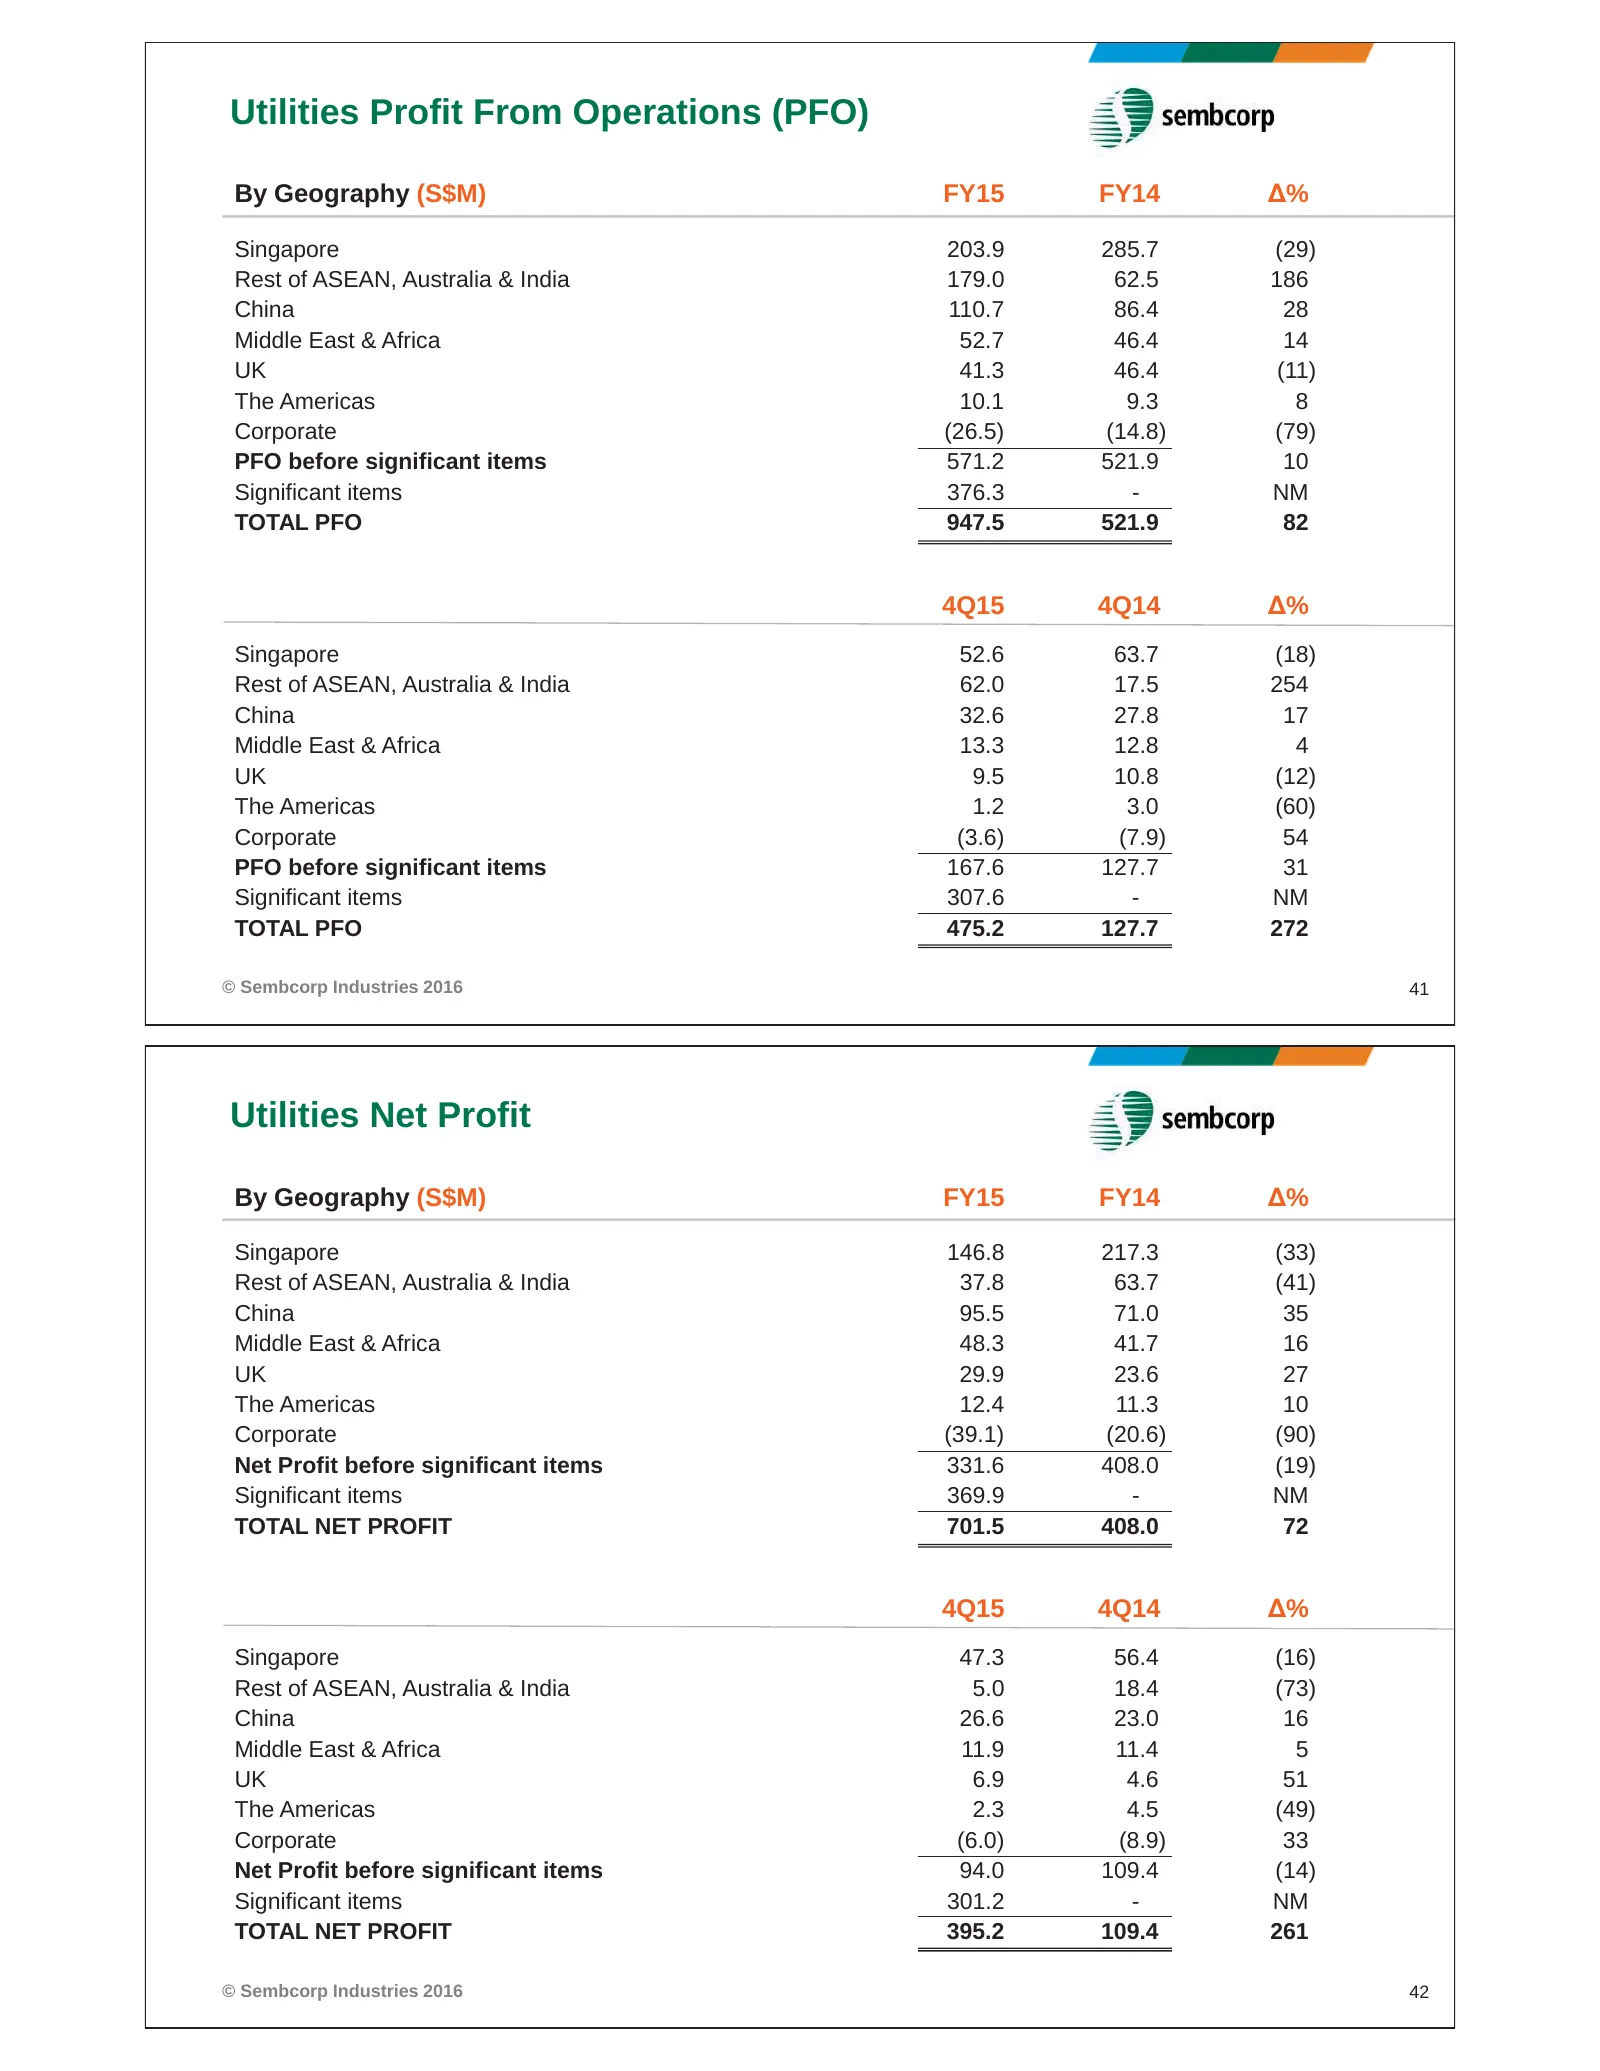
Utilities Profit From Operations (PFO) By Geography (S$M) FY15 FY14 Δ% Singapore 203.9 285.7 (29) Rest of ASEAN, Australia & India 179.0 62.5 186 China 110.7 86.4 28 Middle East & Africa 52.7 46.4 14 UK 41.3 46.4 (11) The Americas 10.1 9.3 8 Corporate (26.5) (14.8) (79) PFO before significant items
Slide 22: Utilities Turnover and PFO by Product Segment
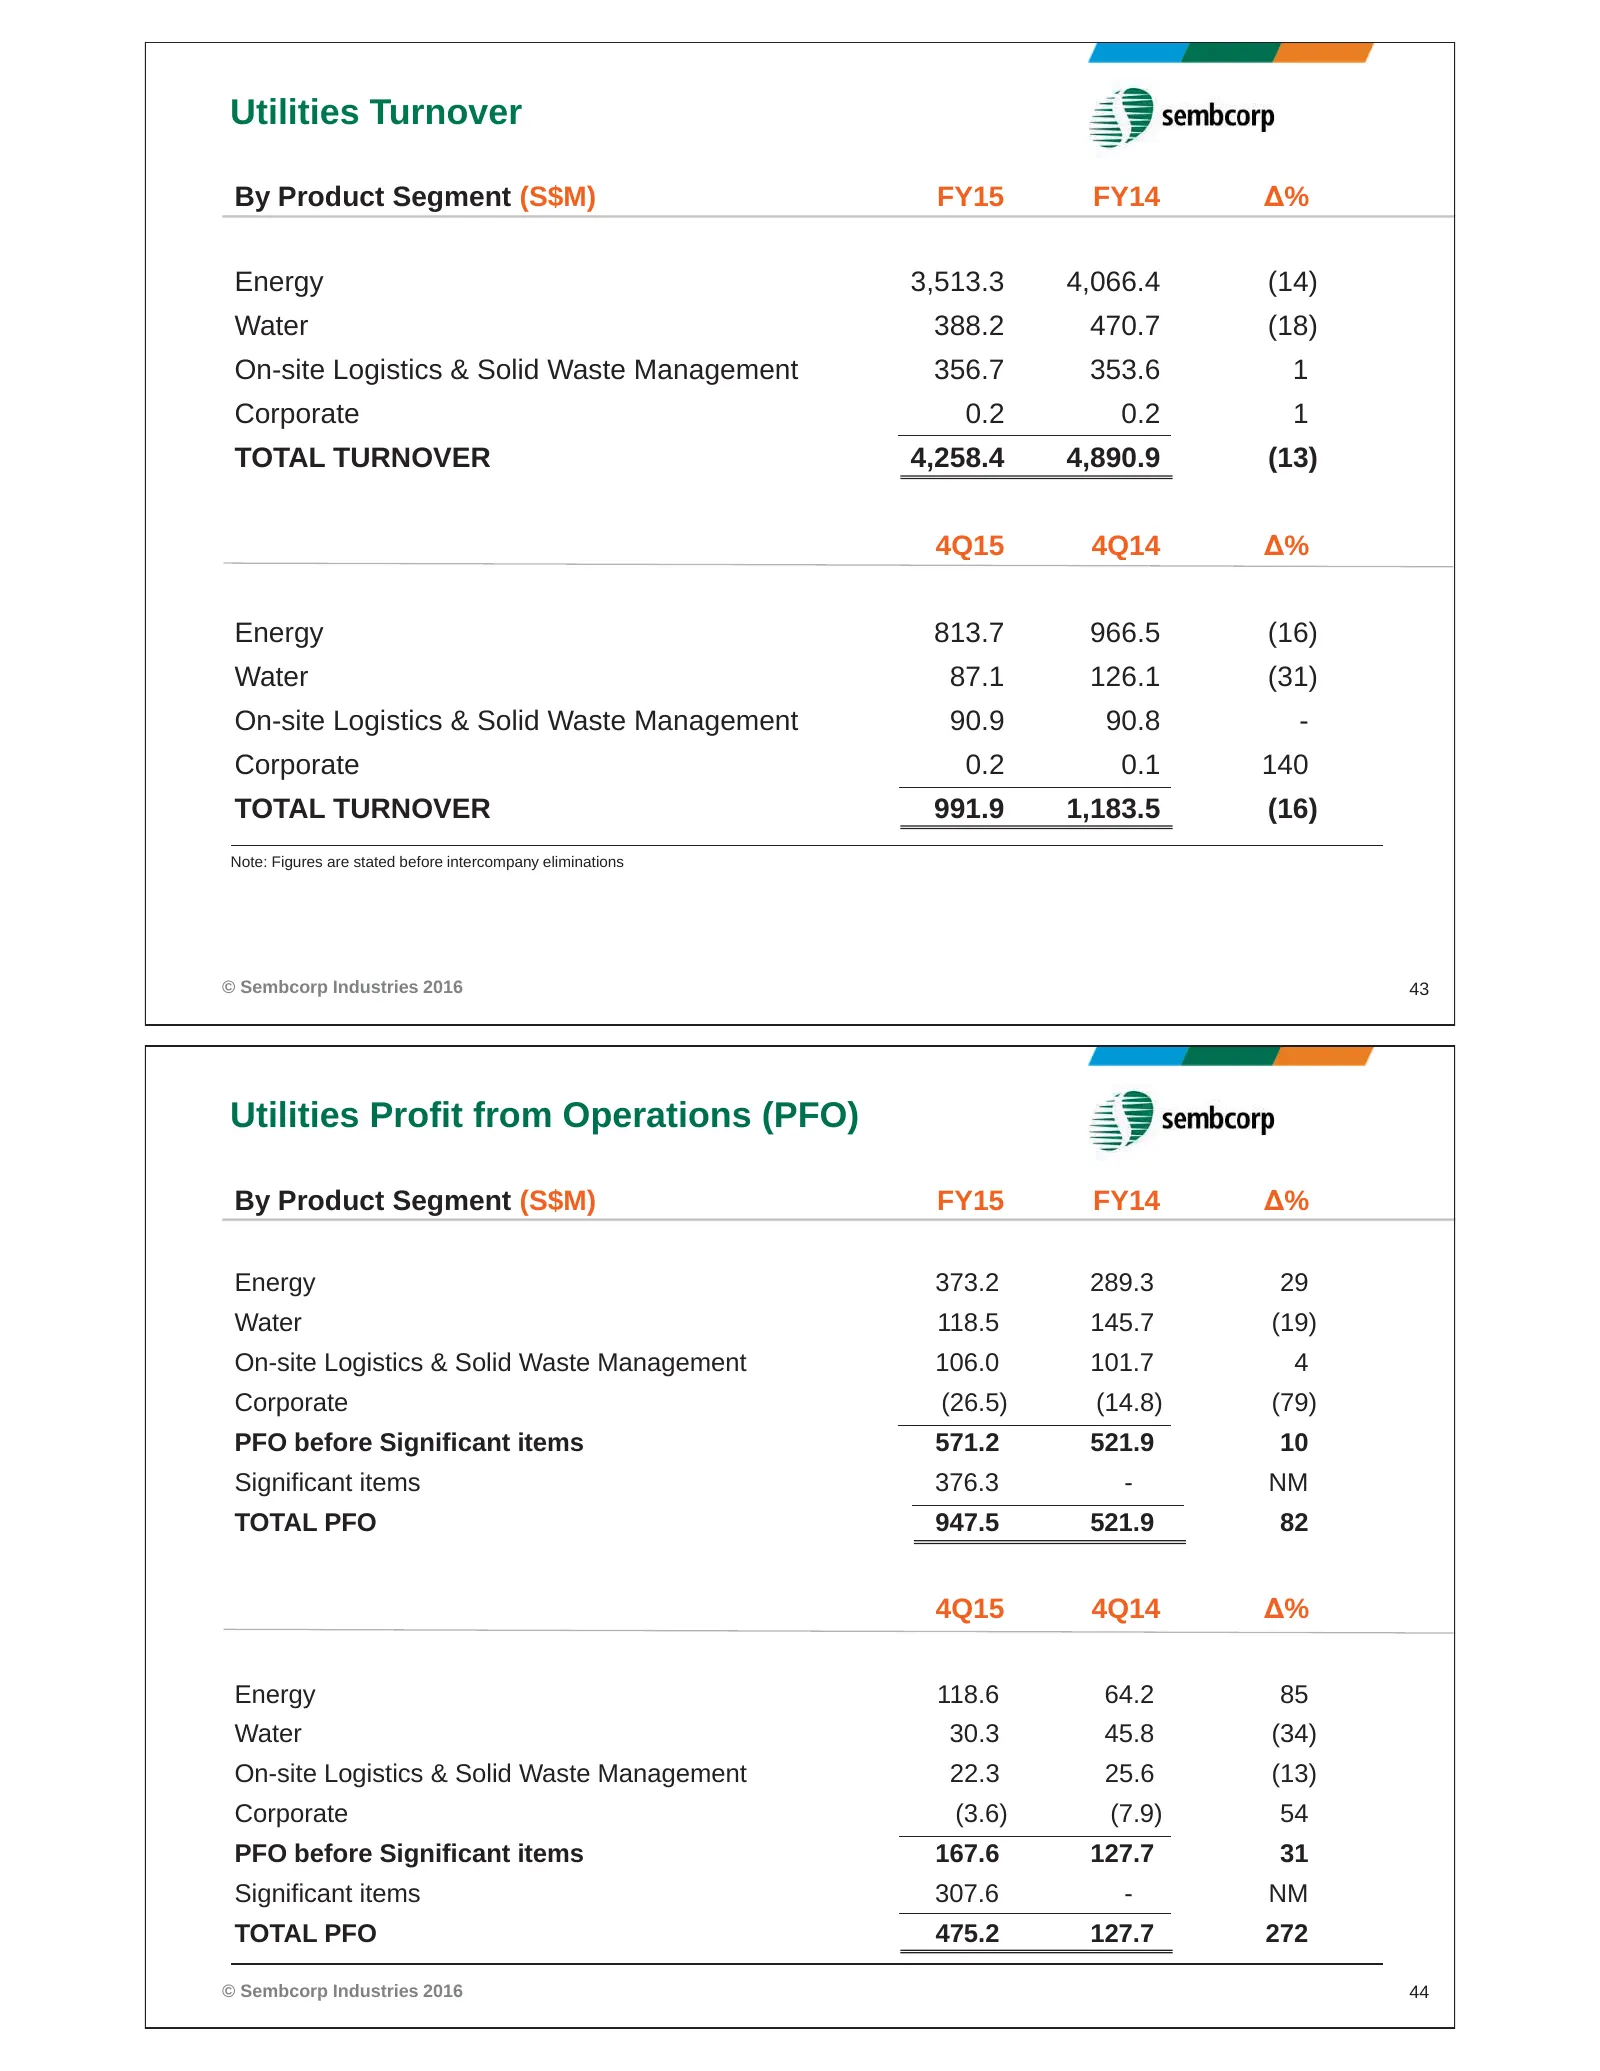
Utilities Turnover By Product Segment (S$M) FY15 FY14 Δ% Energy 3,513.3 4,066.4 (14) Water 388.2 470.7 (18) On-site Logistics & Solid Waste Management 356.7 353.6 1 Corporate 0.2 0.2 1 TOTAL TURNOVER 4,258.4 4,890.9 (13) 4Q15 4Q14 Δ% Energy 813.7 966.5 (16) Water 87.1 126.1 (31) On-site Logistics &
Slide 23: Utilities Net Profit by Product Segment
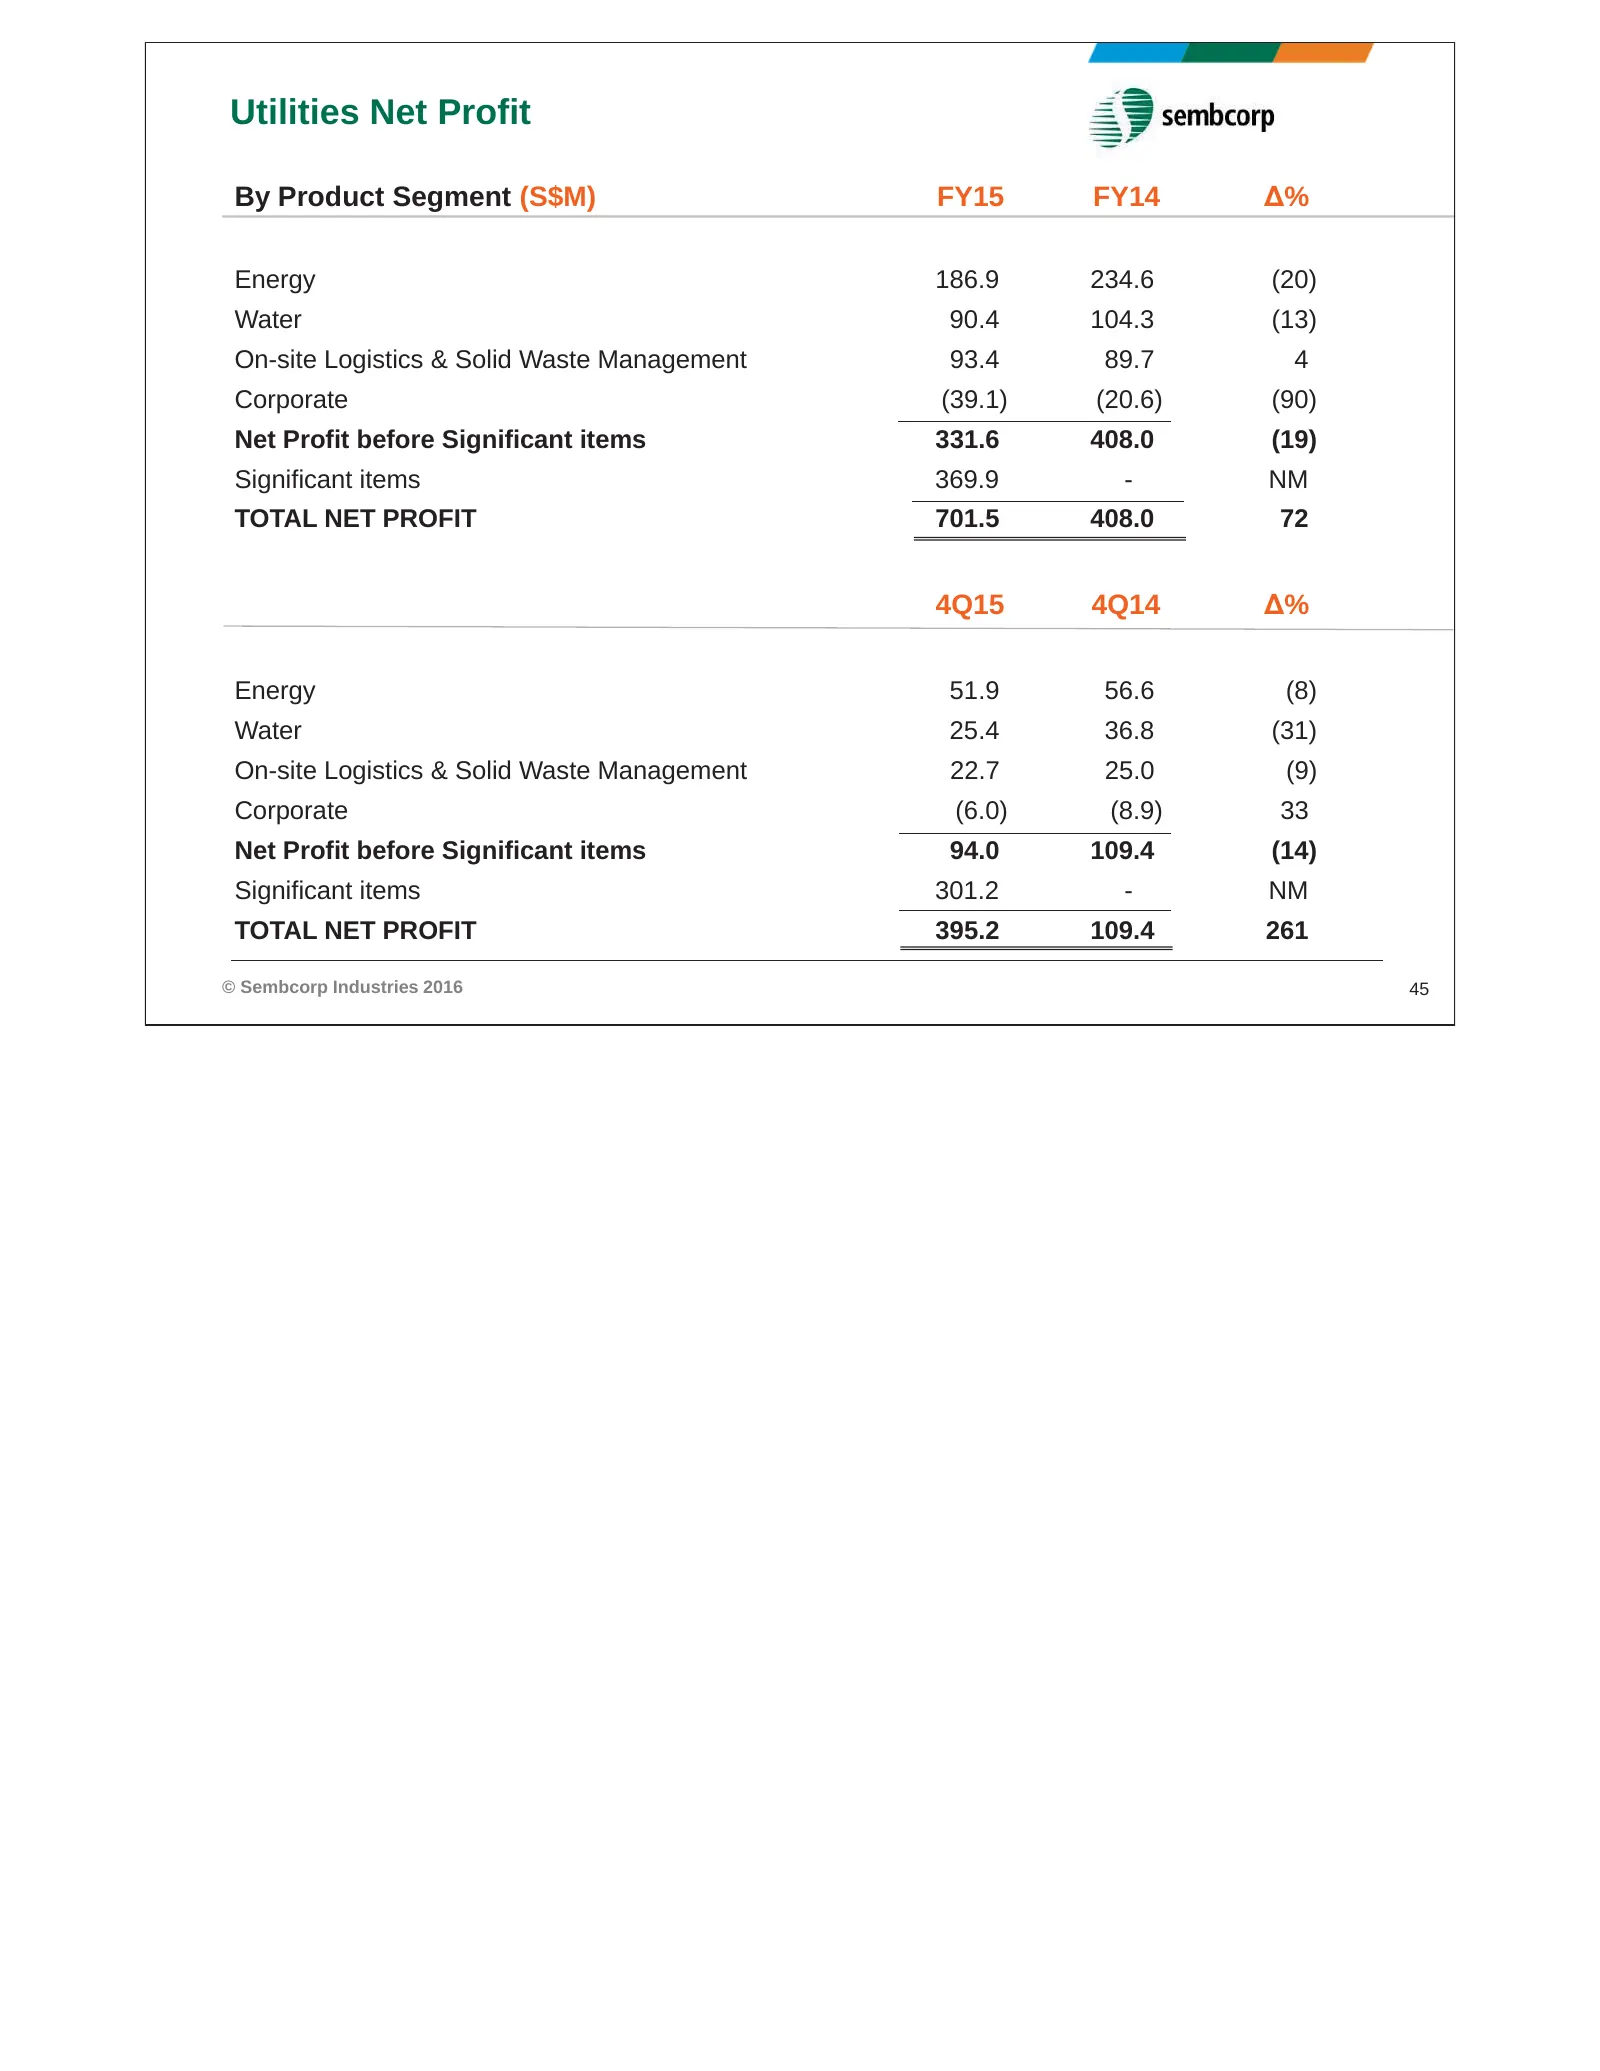
Utilities Net Profit By Product Segment (S$M) FY15 FY14 Δ% Energy 186.9 234.6 (20) Water 90.4 104.3 (13) On-site Logistics & Solid Waste Management 93.4 89.7 4 Corporate (39.1) (20.6) (90) Net Profit before Significant items 331.6 408.0 (19) Significant items 369.9 - NM TOTAL NET PROFIT 701.5 408.0
Source: Internet Archive copy of sembcorp.com
More decks from Sembcorp Industries Ltd.
 H1 2026 Earnings Presentation26 slides · Aug 13, 2026
 Investor Presentation (June 2026)52 slides · June 2026
 Shareholder Meeting (April 2026)11 slides · Apr 29, 2026
 FY2025 Earnings Presentation35 slides · Feb 25, 2026
 Merger or Acquisition (January 2026)13 slides · Jan 30, 2026
 Merger or Acquisition (December 2025)24 slides · Dec 11, 2025