Nan Ya Plastics Corporation · TWSE:1303
Nan Ya Plastics — FY2019 Earnings Presentation
13 slides from Nan Ya Plastics's earnings presentation, March 2020
Slide 1: Nan Ya Plastics Year 2019 Operations & Performance
Nan Ya Plastics Year 2019 Operations & Performance Mar. 2020
Slide 2: Agenda
Agenda • Overview • Financial Highlights • Capacity Expansion Plan • Q&A
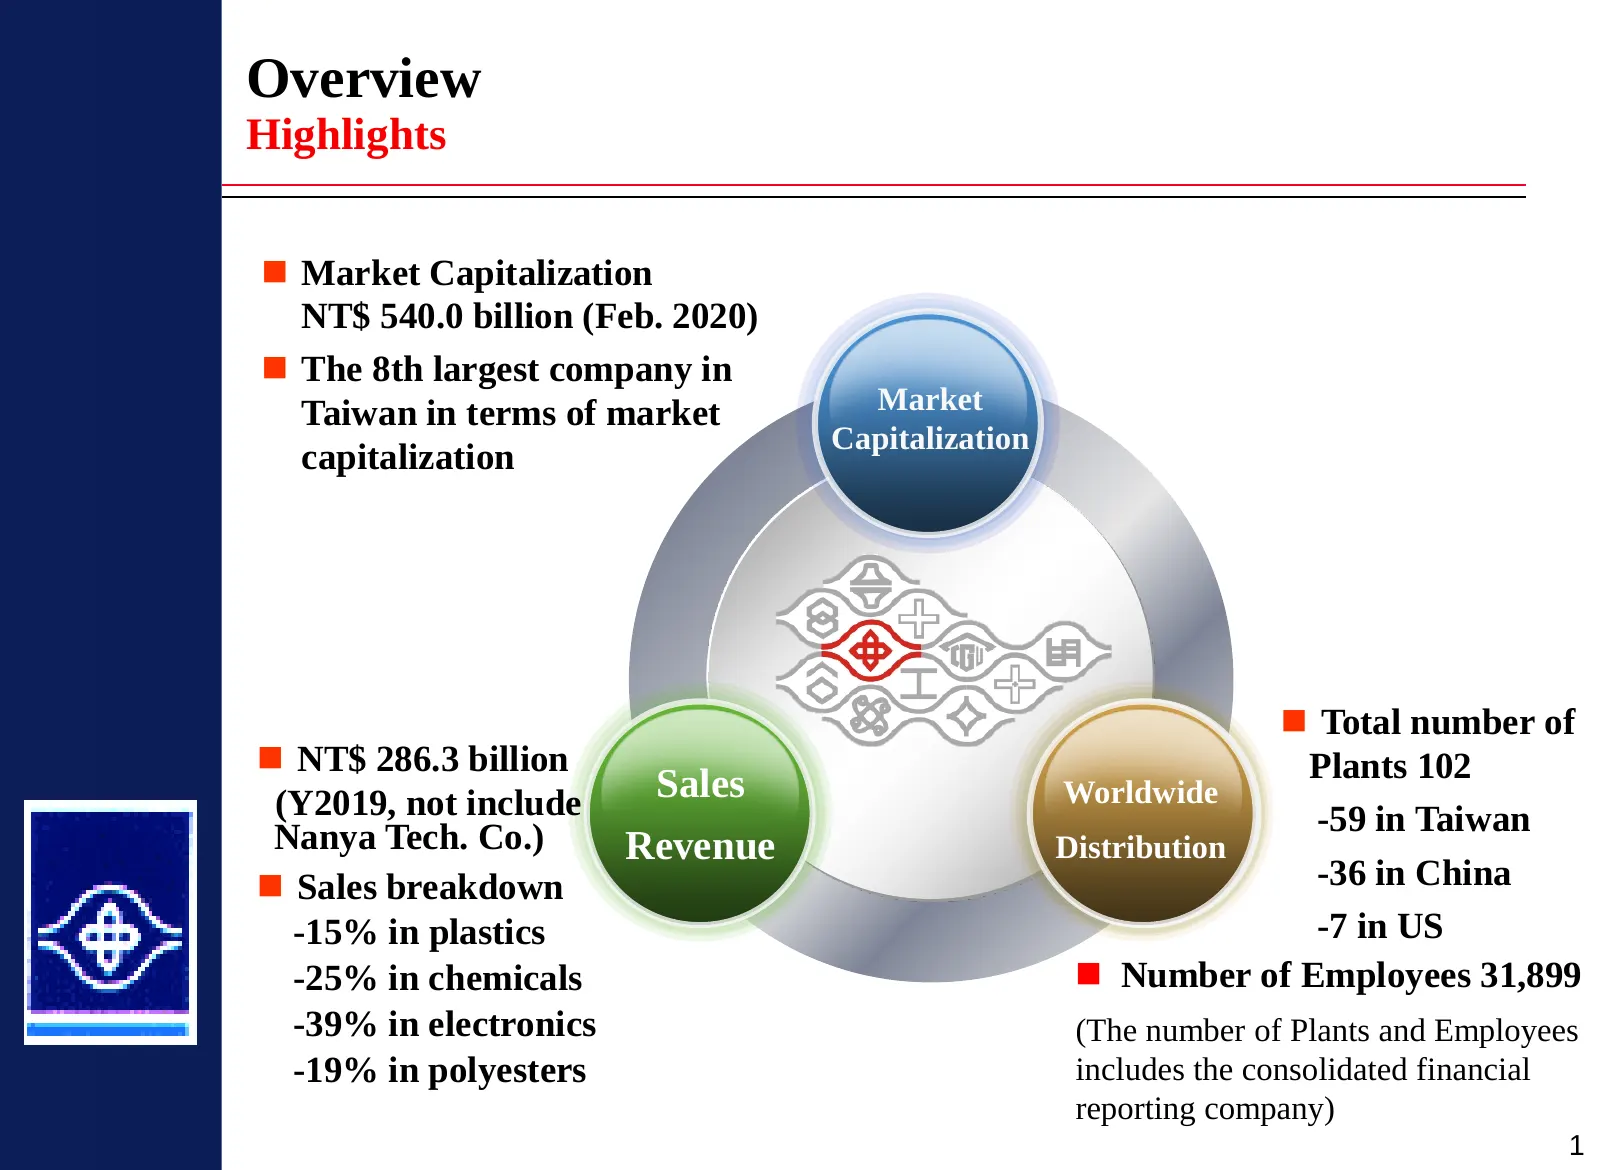
Slide 3: Overview: Highlights
Overview Highlights Market Capitalization NT$ 540.0 billion (Feb. 2020) The 8th largest company in Taiwan in terms of market Market Capitalization capitalization Total number of NT$ 286.3 billion Plants 102 (Y2019, not include Sales Worldwide Nanya Tech. Co.) -59 in Taiwan Revenue Distributi
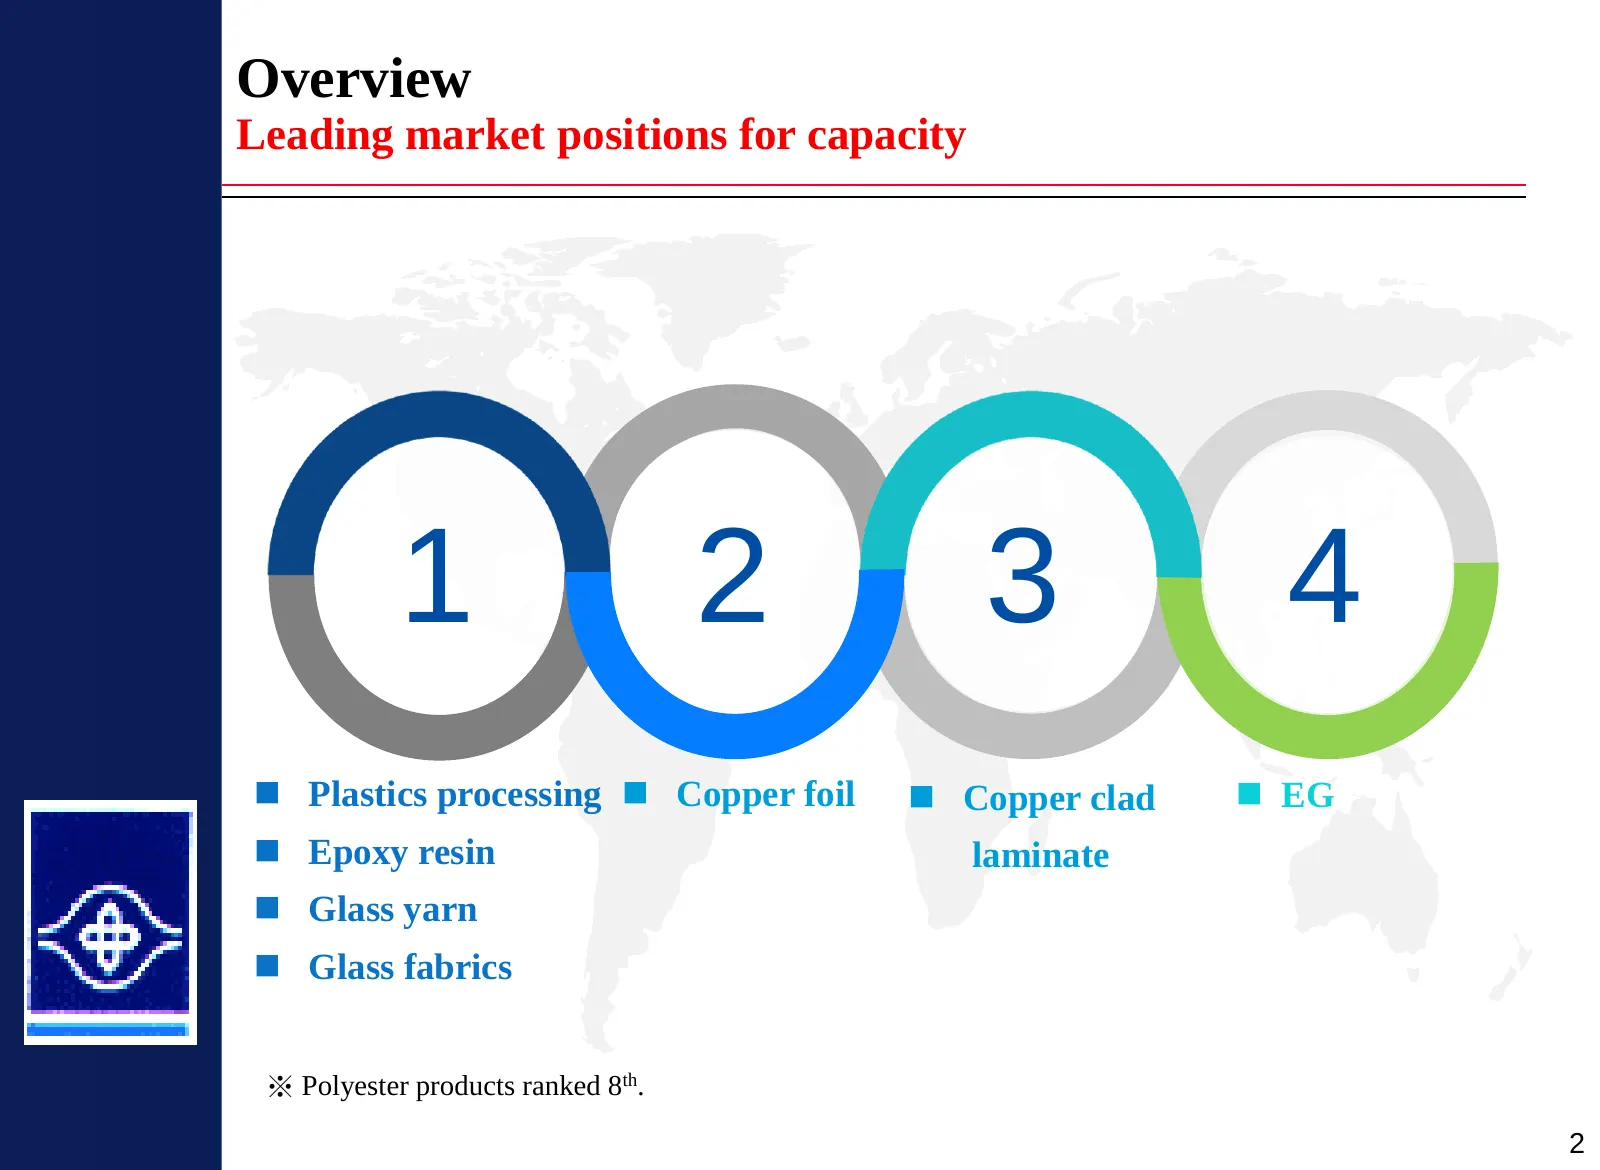
Slide 4: Leading market positions for capacity
Overview Leading market positions for capacity 1 2 3 4 Plastics processing Copper foil Copper clad EG Epoxy resin laminate Glass yarn Glass fabrics ※ Polyester products ranked 8th. 2
Slide 5: Overview: History
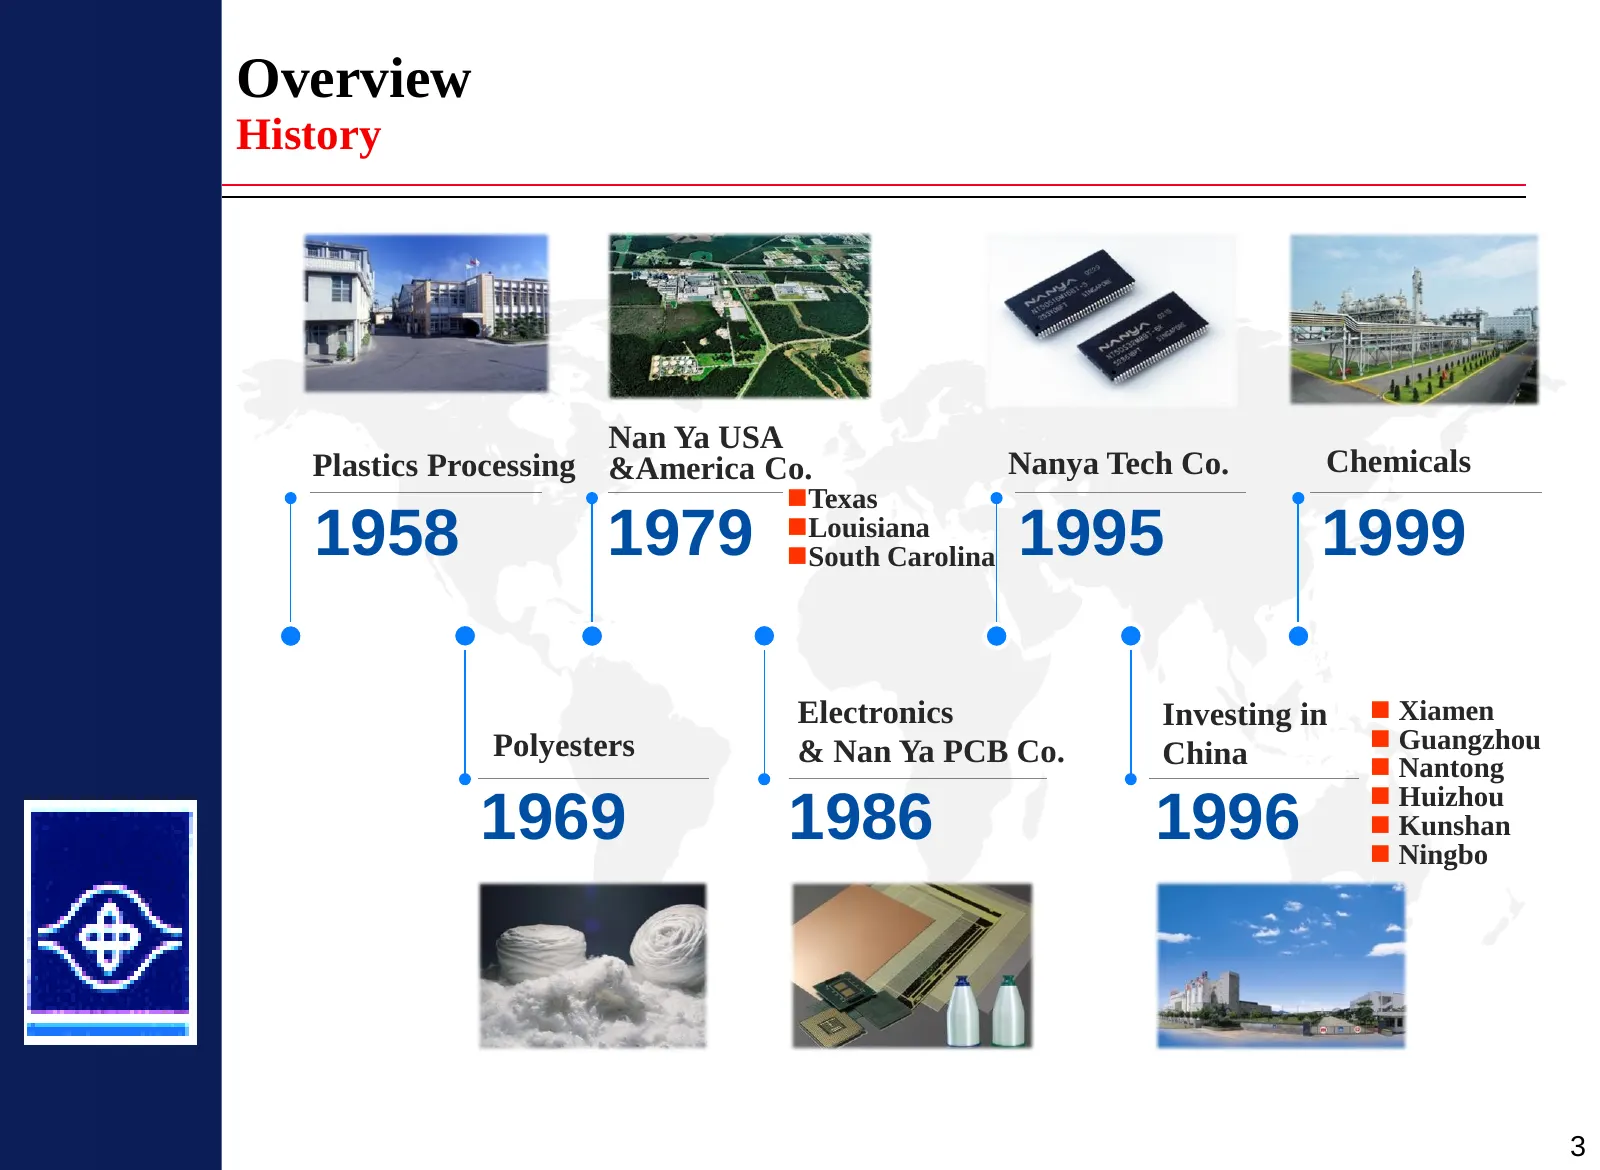
Overview History Nan Ya USA Plastics Processing &America Co. Nanya Tech Co. Chemicals Texas 1958 1979 Louisiana South Carolina 1995 1999 Electronics Investing in Xiamen Polyesters & Nan Ya PCB Co. Guangzhou China Nantong Huizhou 1969 1986 1996 Kunshan Ningbo 3
Slide 6: Major Businesses
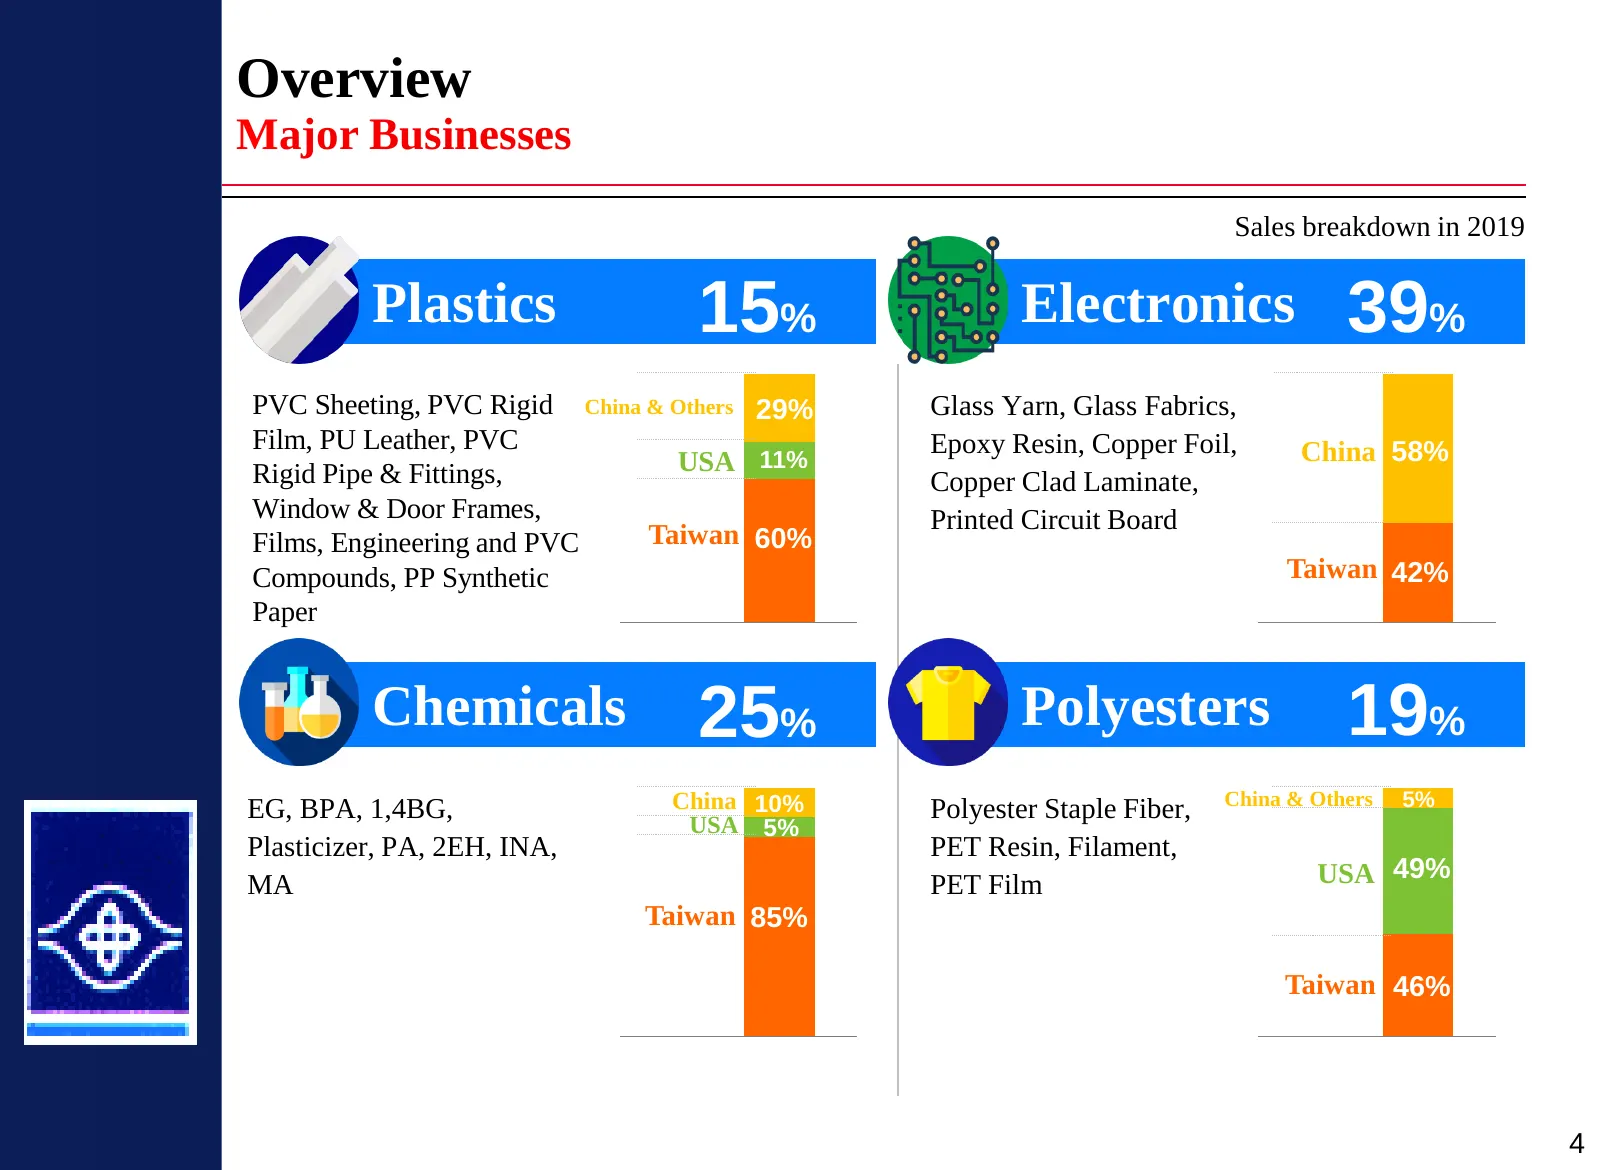
Overview Major Businesses Sales breakdown in 2019 Plastics 15% Electronics 39% PVC Sheeting, PVC Rigid China & Others 29% Glass Yarn, Glass Fabrics, Film, PU Leather, PVC Epoxy Resin, Copper Foil, China 58% Rigid Pipe & Fittings, USA 11% Copper Clad Laminate, Window & Door Frames, Printed Circuit Bo
Slide 7: Consolidated Revenue (IFRS)
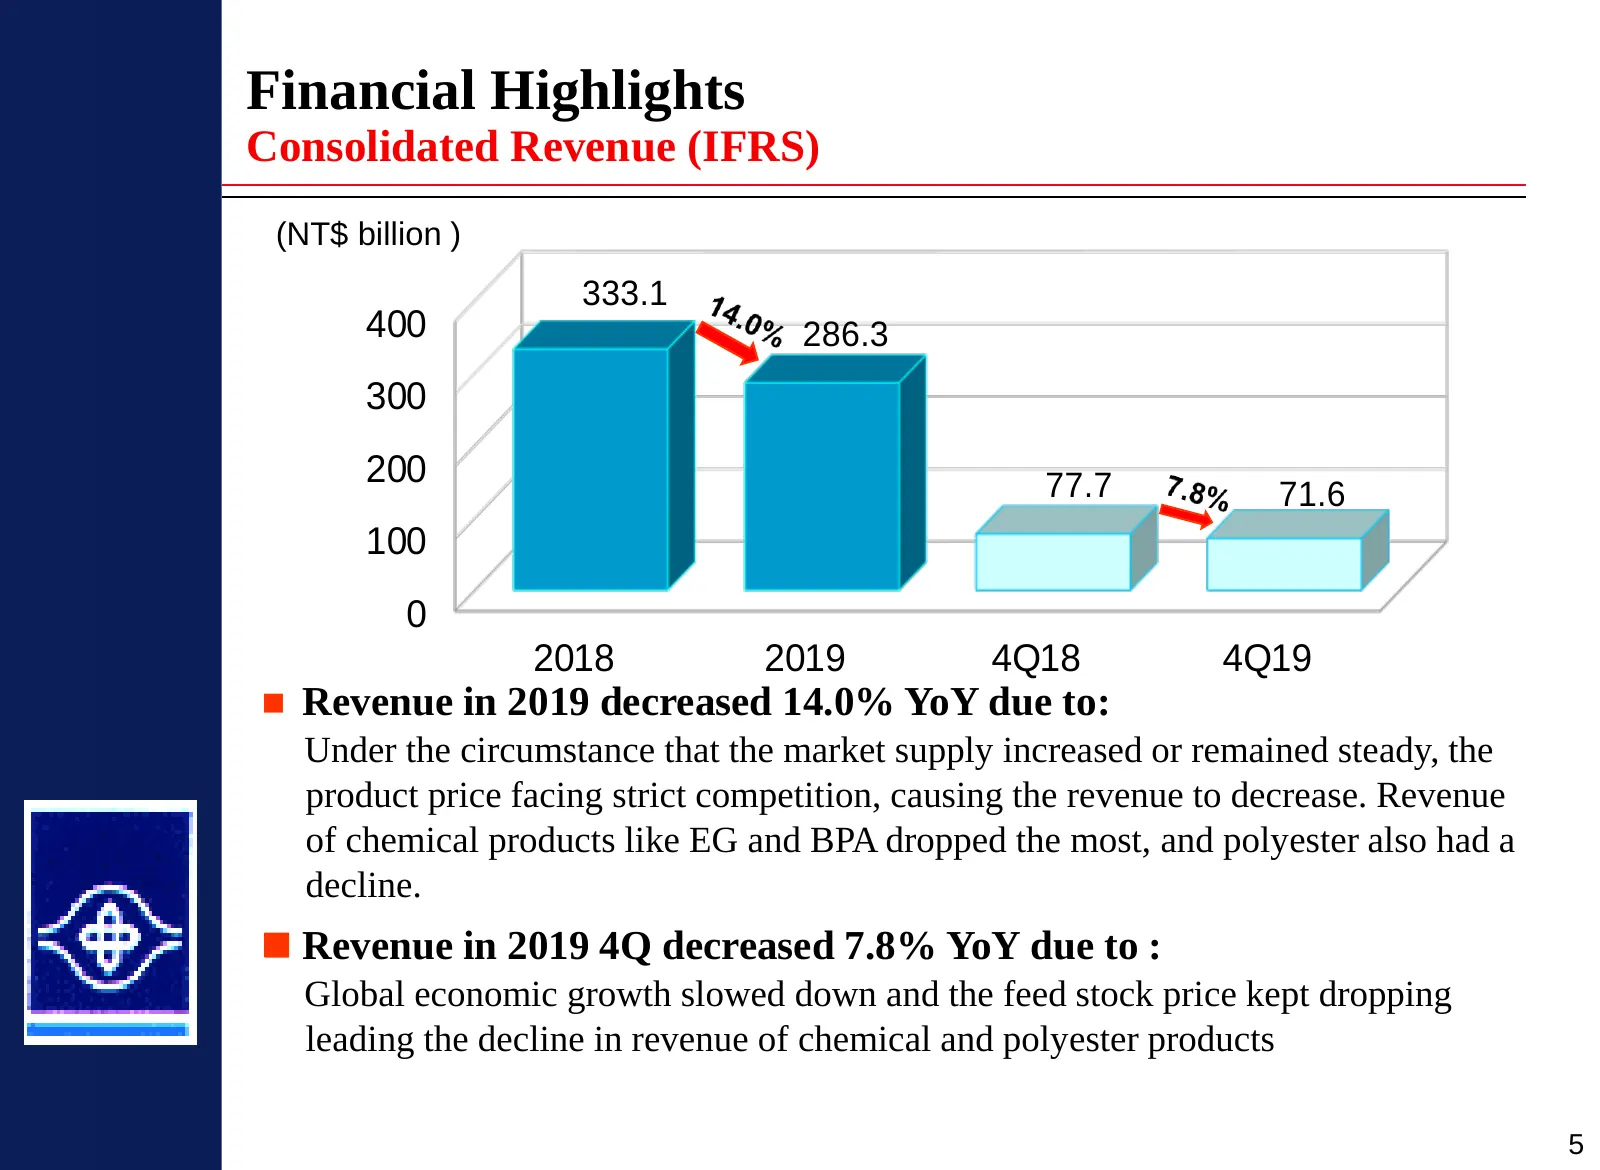
Financial Highlights Consolidated Revenue (IFRS) (NT$ billion ) 333.1 400 286.3 300 200 77.7 71.6 100 0 2018 2019 4Q18 4Q19 Revenue in 2019 decreased 14.0% YoY due to: Under the circumstance that the market supply increased or remained steady, the product price facing strict competition, causing t
Slide 8: Pre-tax Income
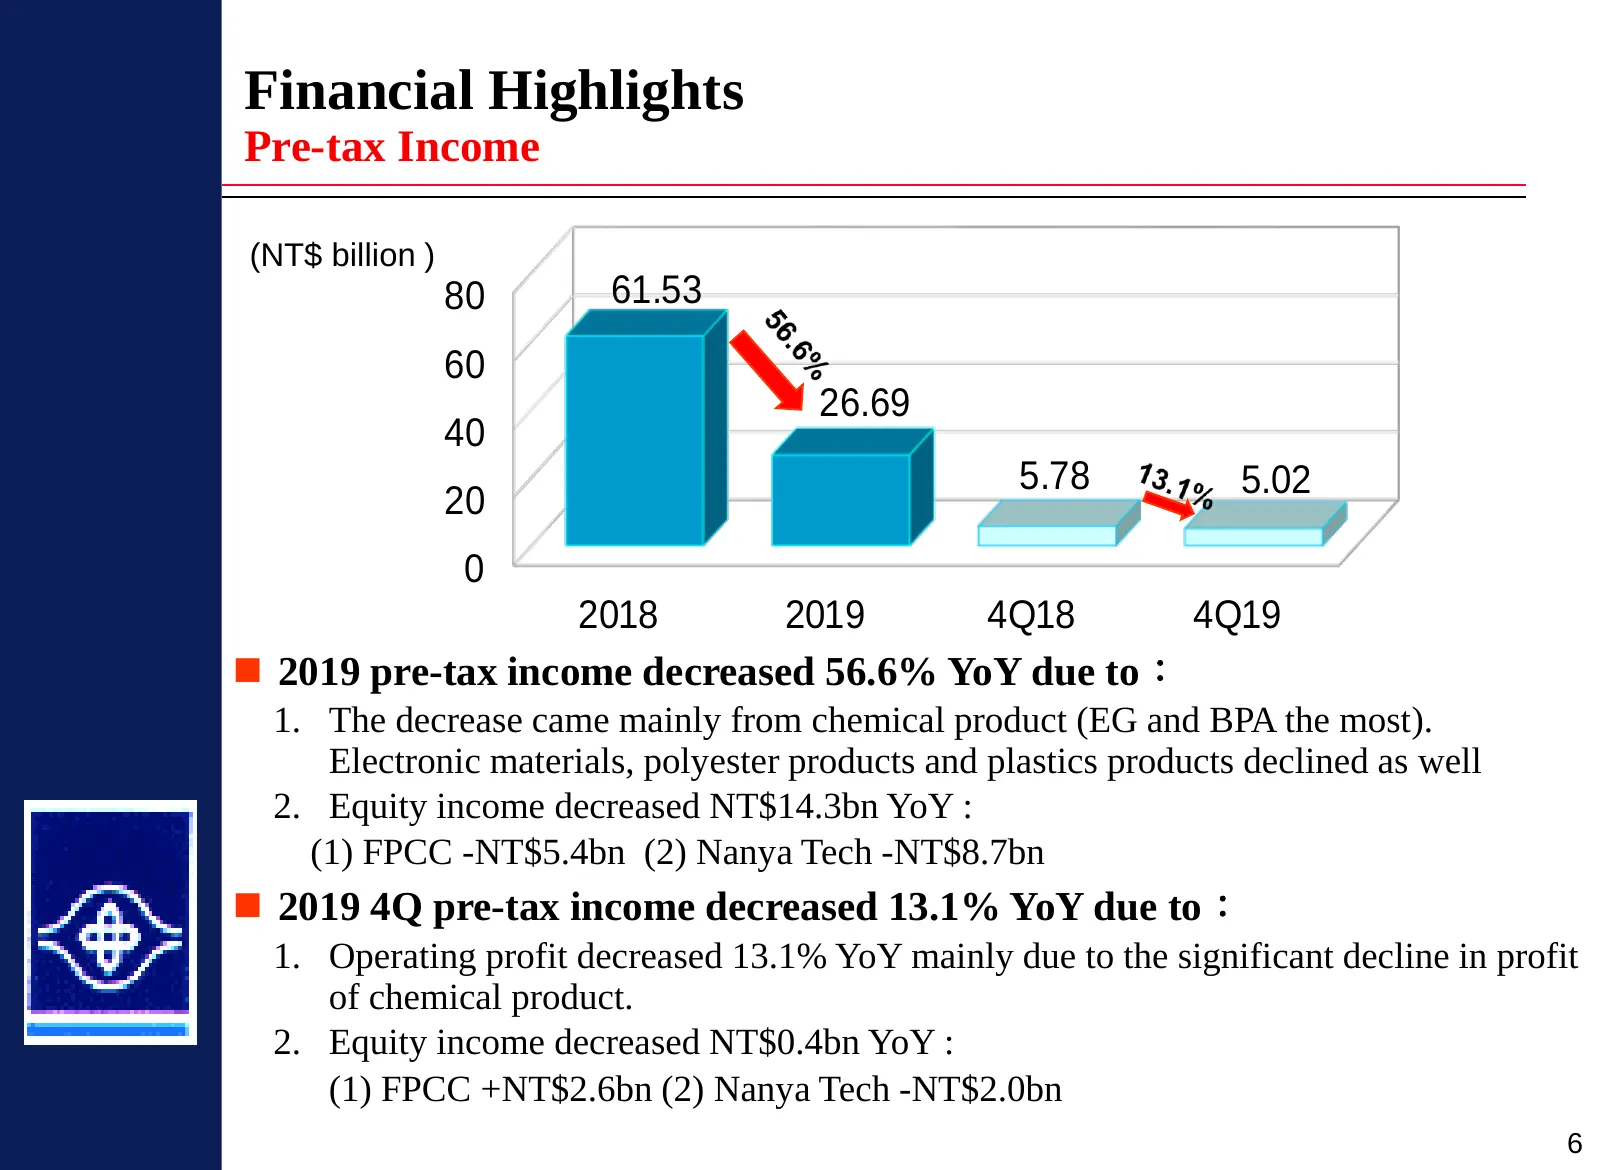
Financial Highlights Pre-tax Income (NT$ billion ) 80 61.53 60 26.69 40 5.78 5.02 20 0 2018 2019 4Q18 4Q19 2019 pre-tax income decreased 56.6% YoY due to: 1. The decrease came mainly from chemical product (EG and BPA the most). Electronic materials, polyester products and plastics products decline
Slide 9: Revenue Breakdown
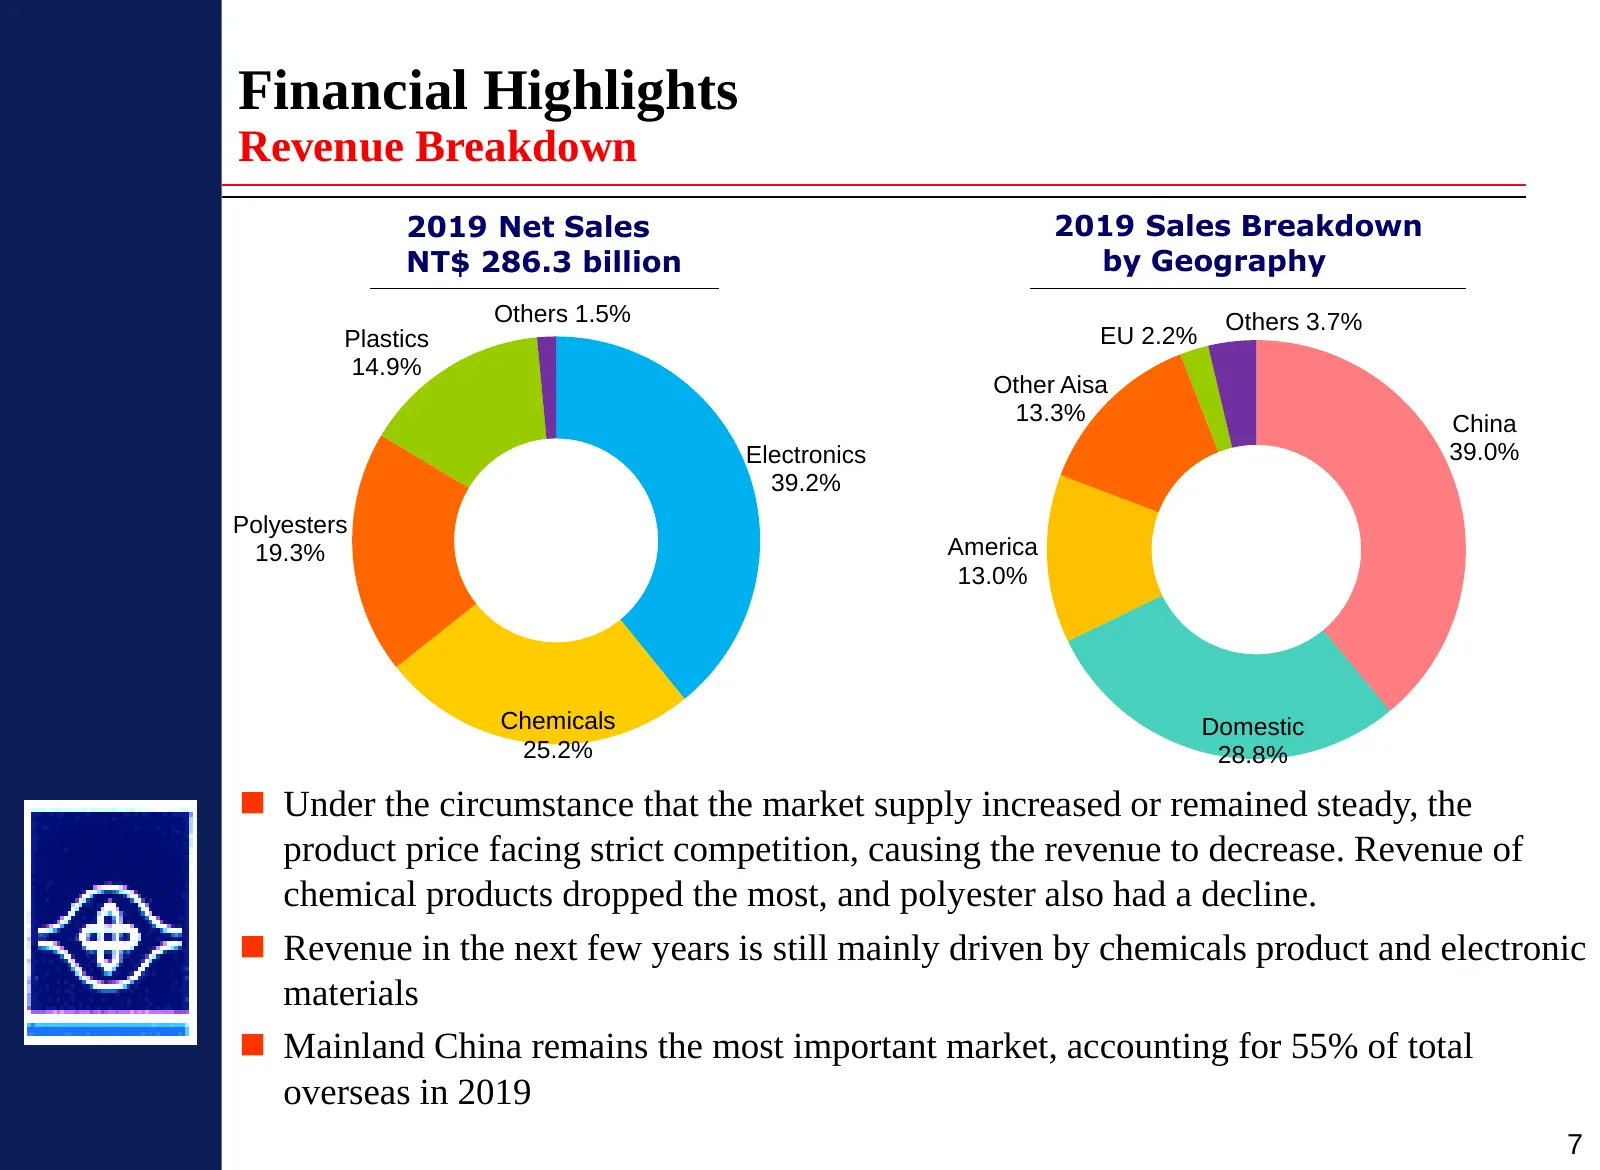
Financial Highlights Revenue Breakdown 2019 Net Sales 2019 Sales Breakdown NT$ 286.3 billion by Geography Others 1.5% Others 3.7% Plastics EU 2.2% 14.9% Other Aisa 13.3% China Electronics 39.0% 39.2% Polyesters 19.3% America 13.0% Chemicals Domestic 25.2% 28.8% Under the circumstance that the mark
Slide 10: Revenue Breakdown by Product Segment
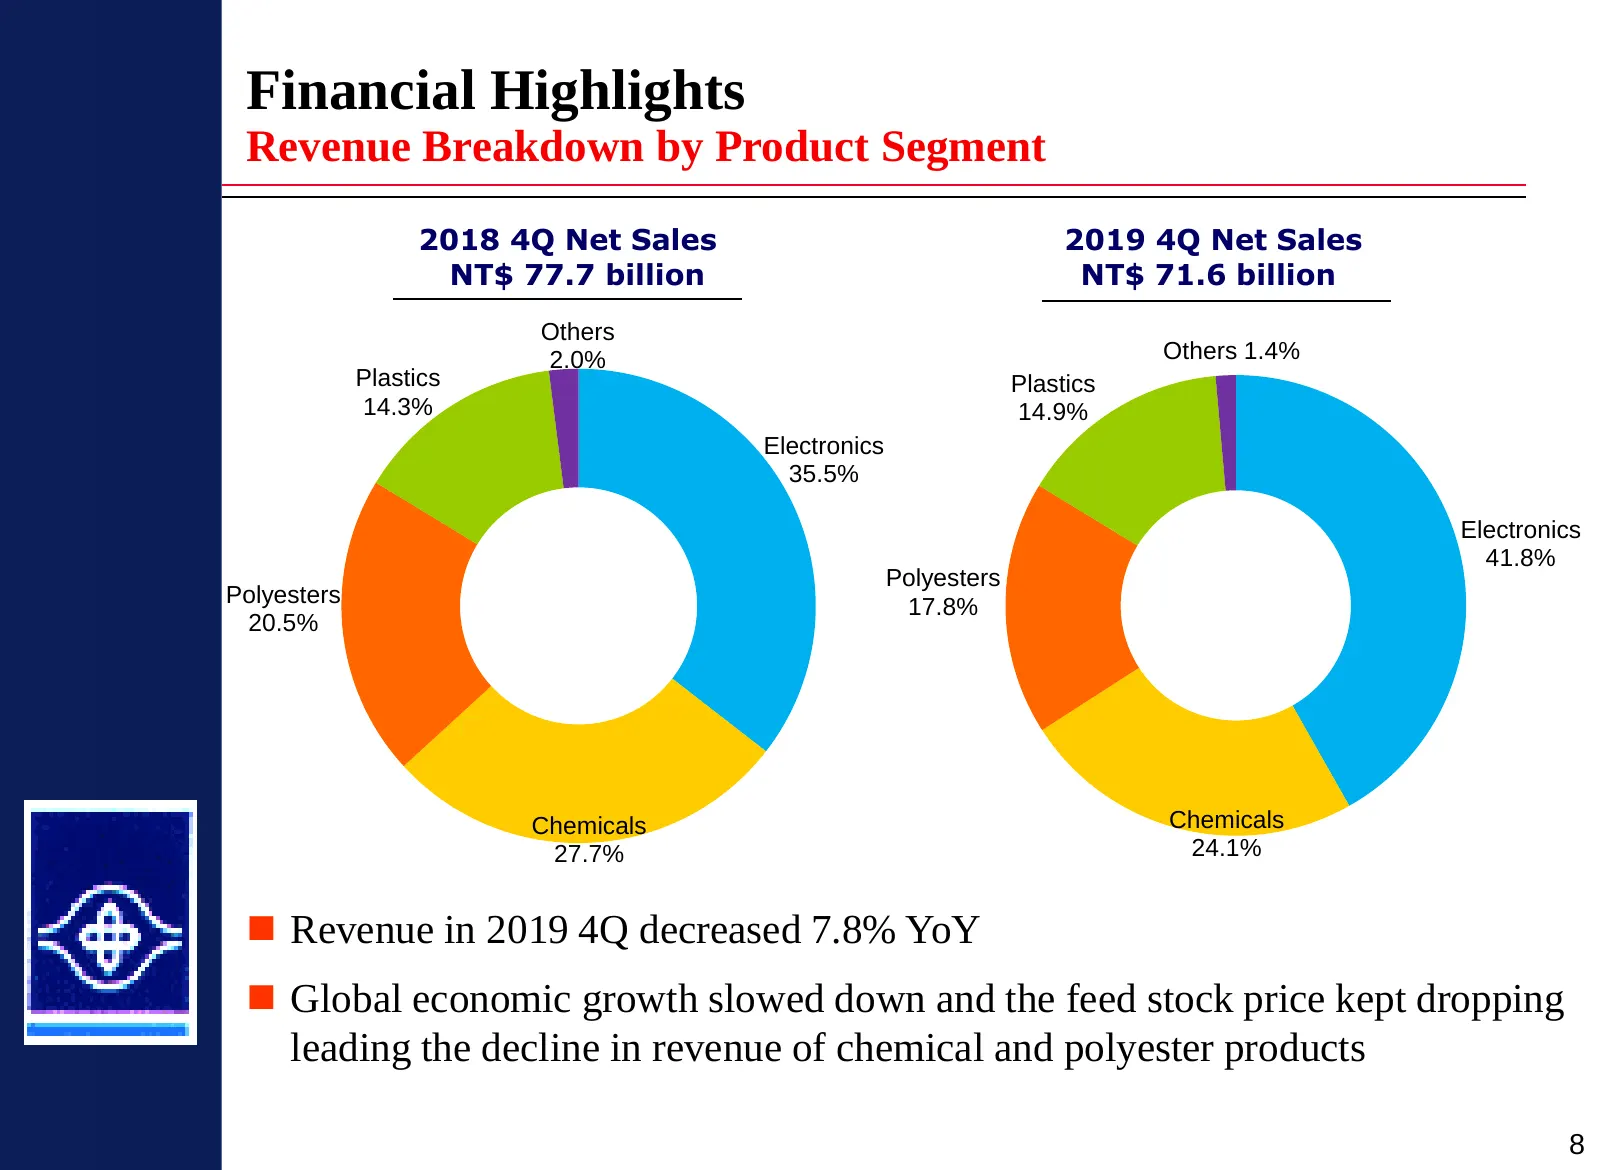
Financial Highlights Revenue Breakdown by Product Segment 2018 4Q Net Sales 2019 4Q Net Sales NT$ 77.7 billion NT$ 71.6 billion Others 2.0% Others 1.4% Plastics Plastics 14.3% 14.9% Electronics 35.5% Electronics 41.8% Polyesters Polyesters 17.8% 20.5% Chemicals Chemicals 27.7% 24.1% Revenue in 201
Slide 11: Operating Profits Breakdown by Product Segment
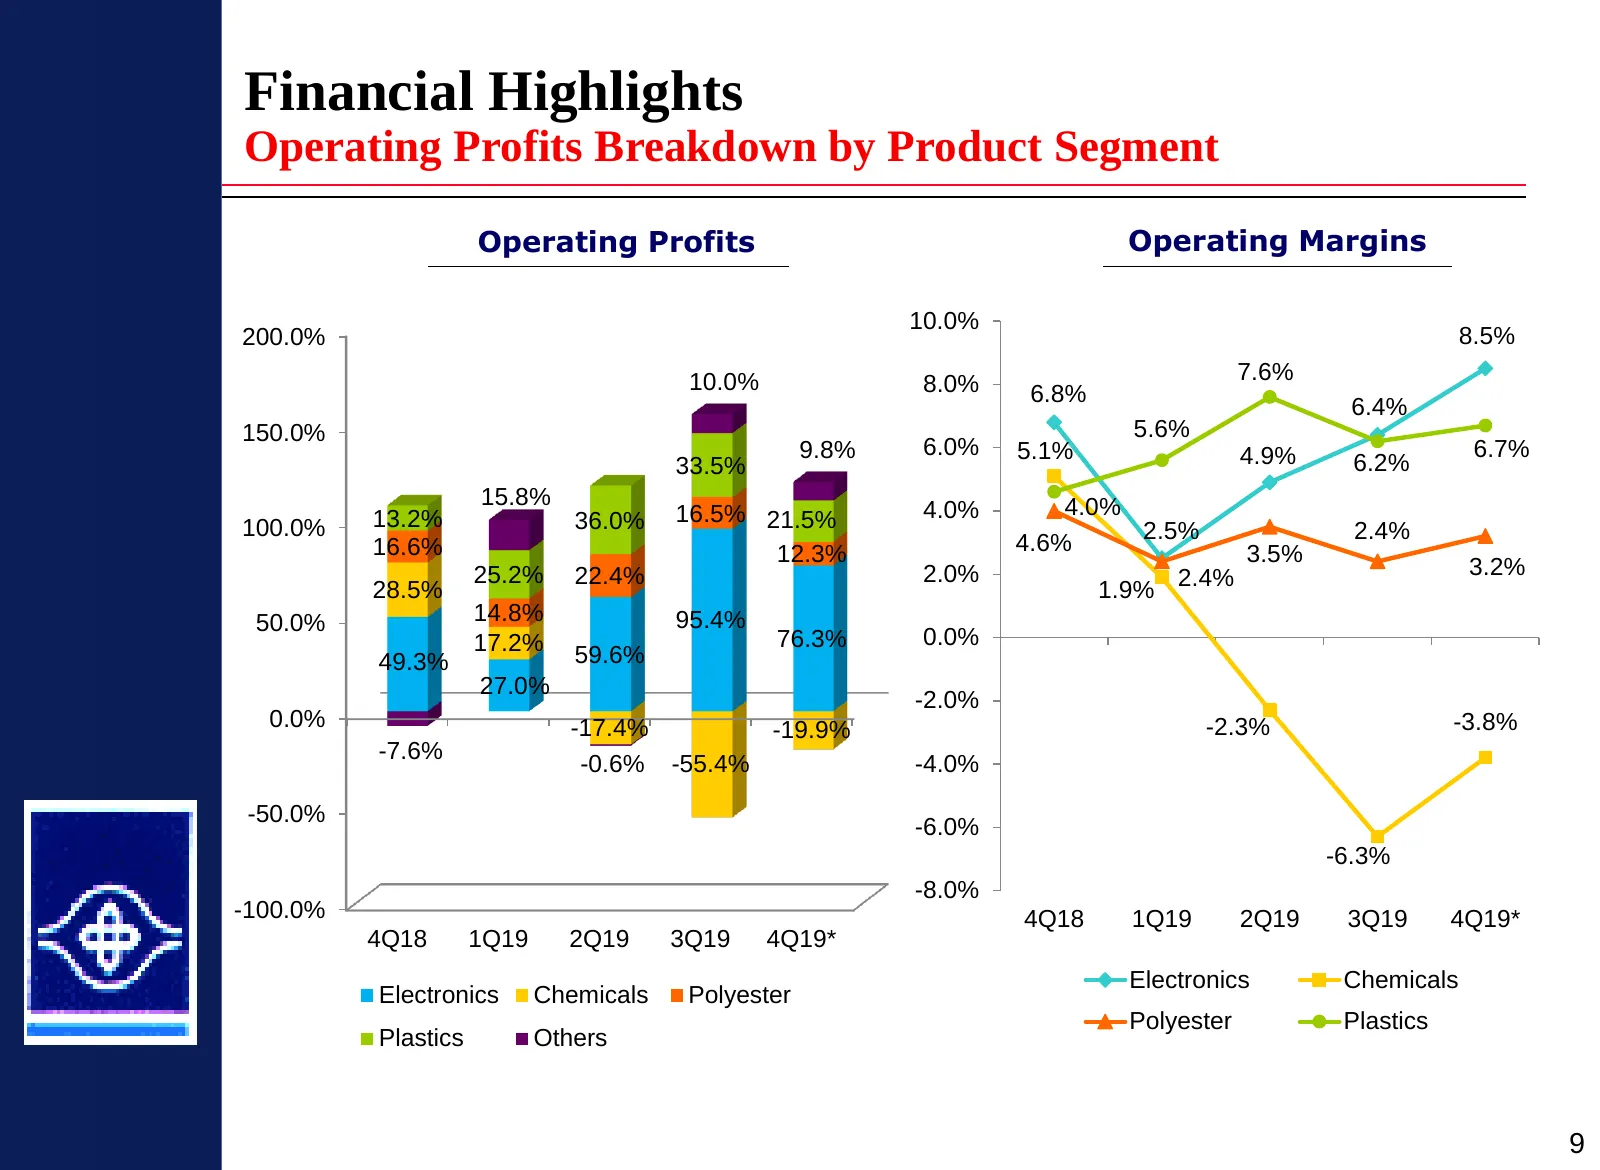
Financial Highlights Operating Profits Breakdown by Product Segment Operating Profits Operating Margins 10.0% 200.0% 8.5% 10.0% 8.0% 7.6% 6.8% 6.4% 150.0% 5.6% 9.8% 6.0% 5.1% 4.9% 6.7% 33.5% 6.2% 15.8% 4.0% 13.2% 36.0% 16.5% 21.5% 4.0% 100.0% 2.5% 2.4% 16.6% 12.3% 4.6% 3.5% 25.2% 22.4% 2.0% 2.4% 3.2
Slide 12: Capacity Expansion Plan
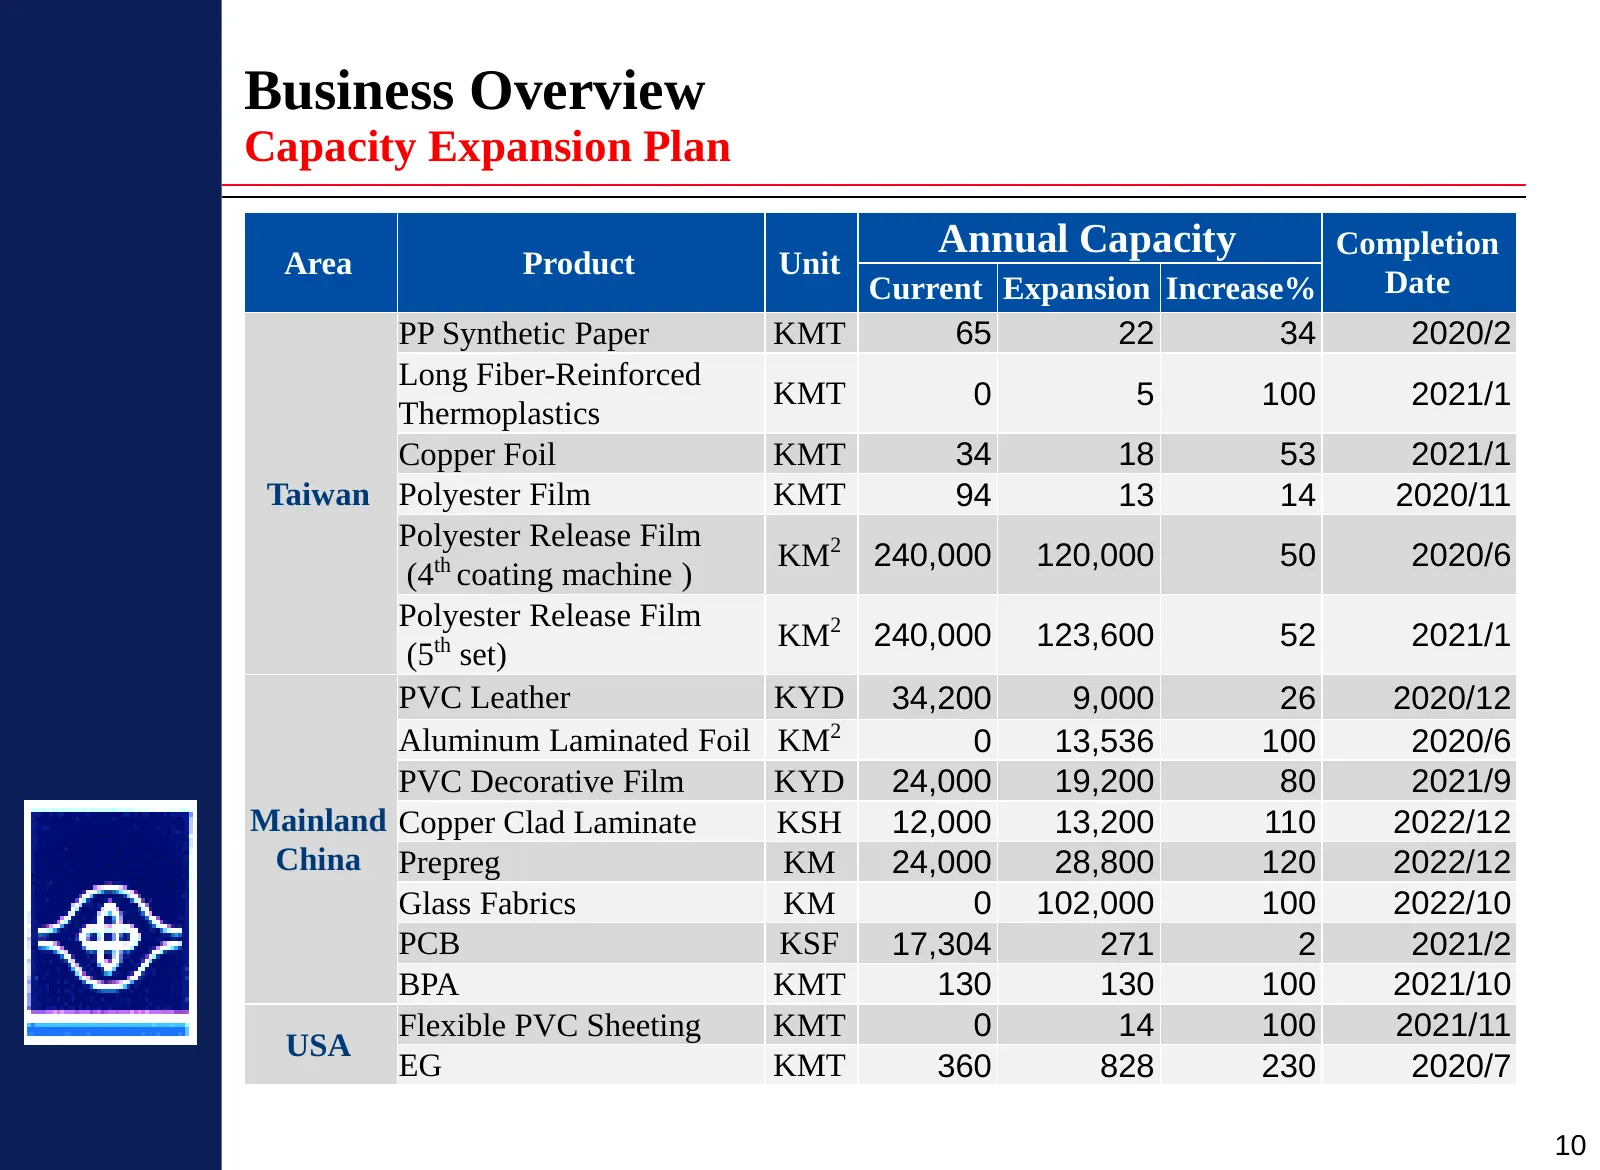
Business Overview Capacity Expansion Plan Annual Capacity Completion Area Product Unit Current Expansion Increase% Date PP Synthetic Paper KMT 65 22 34 2020/2 Long Fiber-Reinforced KMT 0 5 100 2021/1 Thermoplastics Copper Foil KMT 34 18 53 2021/1 Taiwan Polyester Film KMT 94 13 14 2020/11 Polyester

Slide 13: THE END
THE END
Source: company website
More decks from Nan Ya Plastics Corporation
 President Securities Institutional Investors Conference (August 2026)15 slides · August 2026
 Q1 2026 Earnings Presentation15 slides · May 26, 2026
 CTBC Securities Institutional Investors Conference 202615 slides · Mar 13, 2026
 Concord Securities Institutional Investors Conference (November 2025)15 slides · Nov 19, 2025
 Taishin Securities 2025 Q3 Investment Forum15 slides · Aug 26, 2025
 Capital Securities 2025 Q2 Investment Forum14 slides · Jun 17, 2025