Alfen NV · EURONEXT:ALFEN
Alfen NV — Investor Day (October 2019)
86 slides from Alfen NV's investor day presentation, Oct 29, 2019
Slide 1: Capital Markets Day London 29 October 2019
Alfen Capital Markets Day London 29 October 2019 1
Slide 2: Disclaimer
Disclaimer This communication may include forward-looking statements. All statements other than statements of historical facts may be forward-looking statements. These forward- looking statements may be identified by the use of forward-looking terminology, including the terms such as guidance, expec
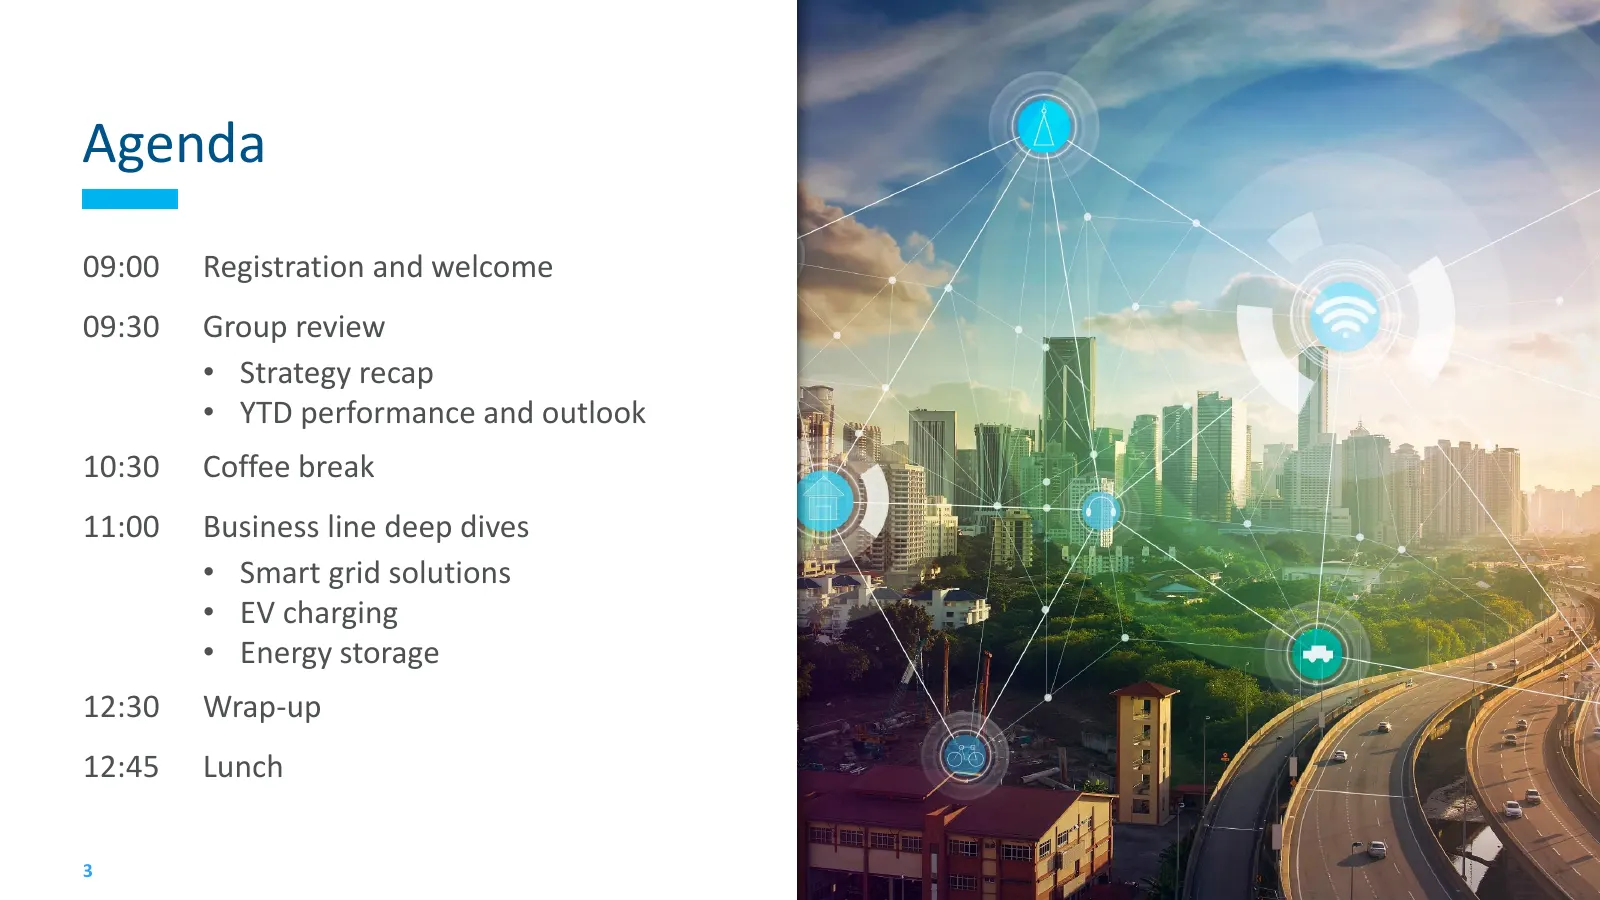
Slide 3: Agenda
Agenda 09:00 Registration and welcome 09:30 Group review • Strategy recap • YTD performance and outlook 10:30 Coffee break 11:00 Business line deep dives • Smart grid solutions • EV charging • Energy storage 12:30 Wrap-up 12:45 Lunch 3
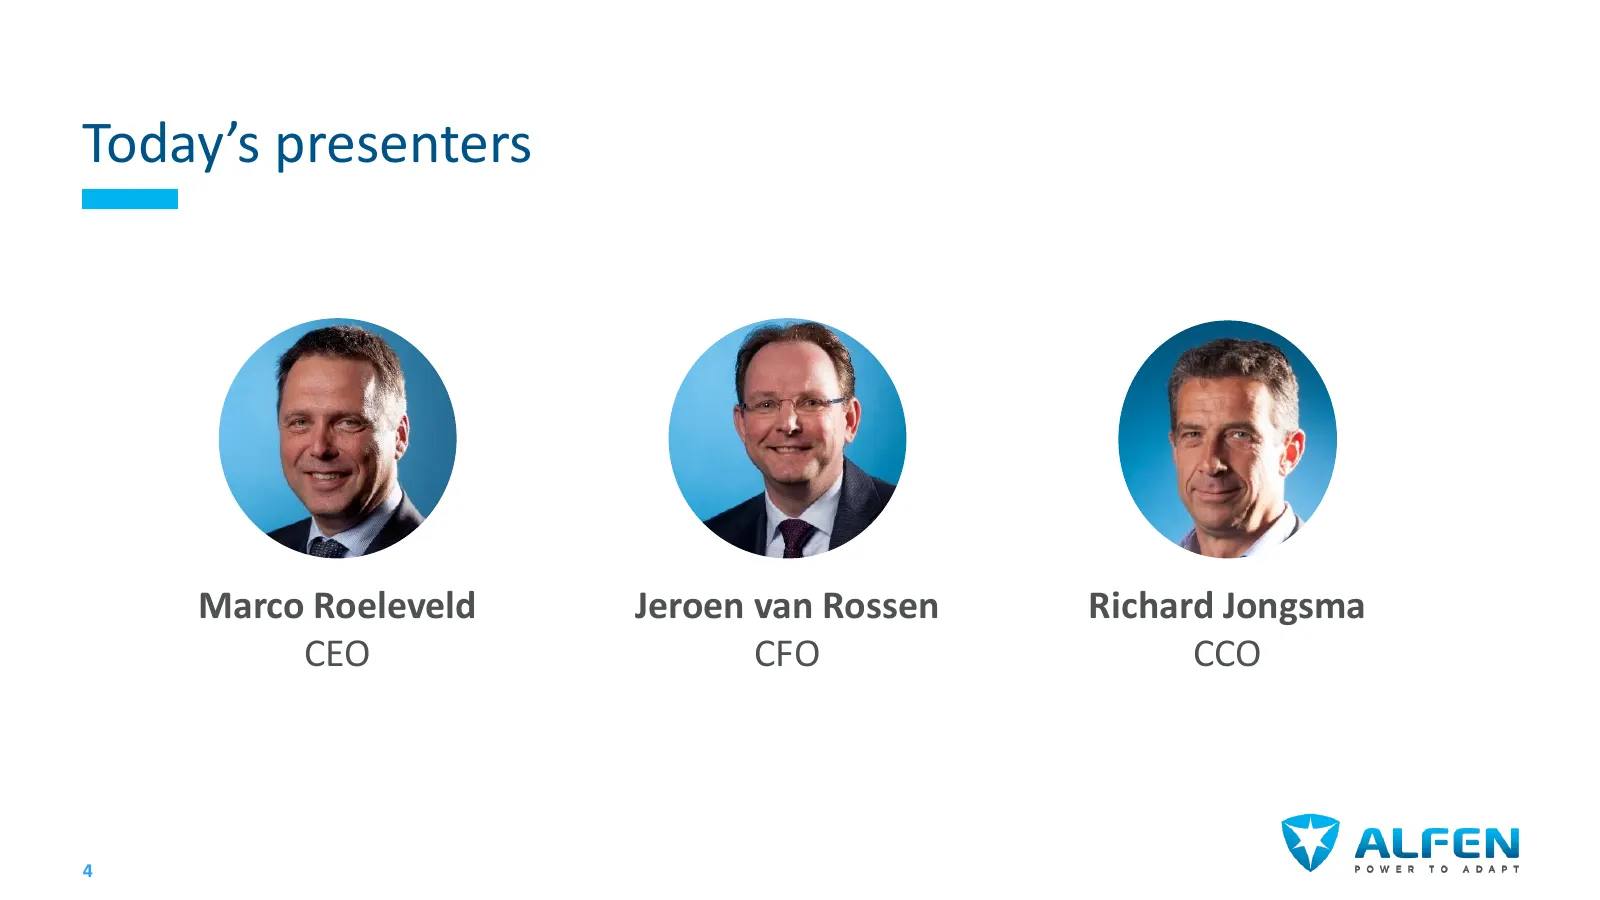
Slide 4: Today's presenters
Today’s presenters Marco Roeleveld Jeroen van Rossen Richard Jongsma CEO CFO CCO 4
Slide 5: Agenda
Agenda 09:00 Registration and welcome 09:30 Group review • Strategy recap • YTD performance and outlook 10:30 Coffee break 11:00 Business line deep dives • Smart grid solutions • EV charging • Energy storage 12:30 Wrap-up 12:45 Lunch 5
Slide 6: Video
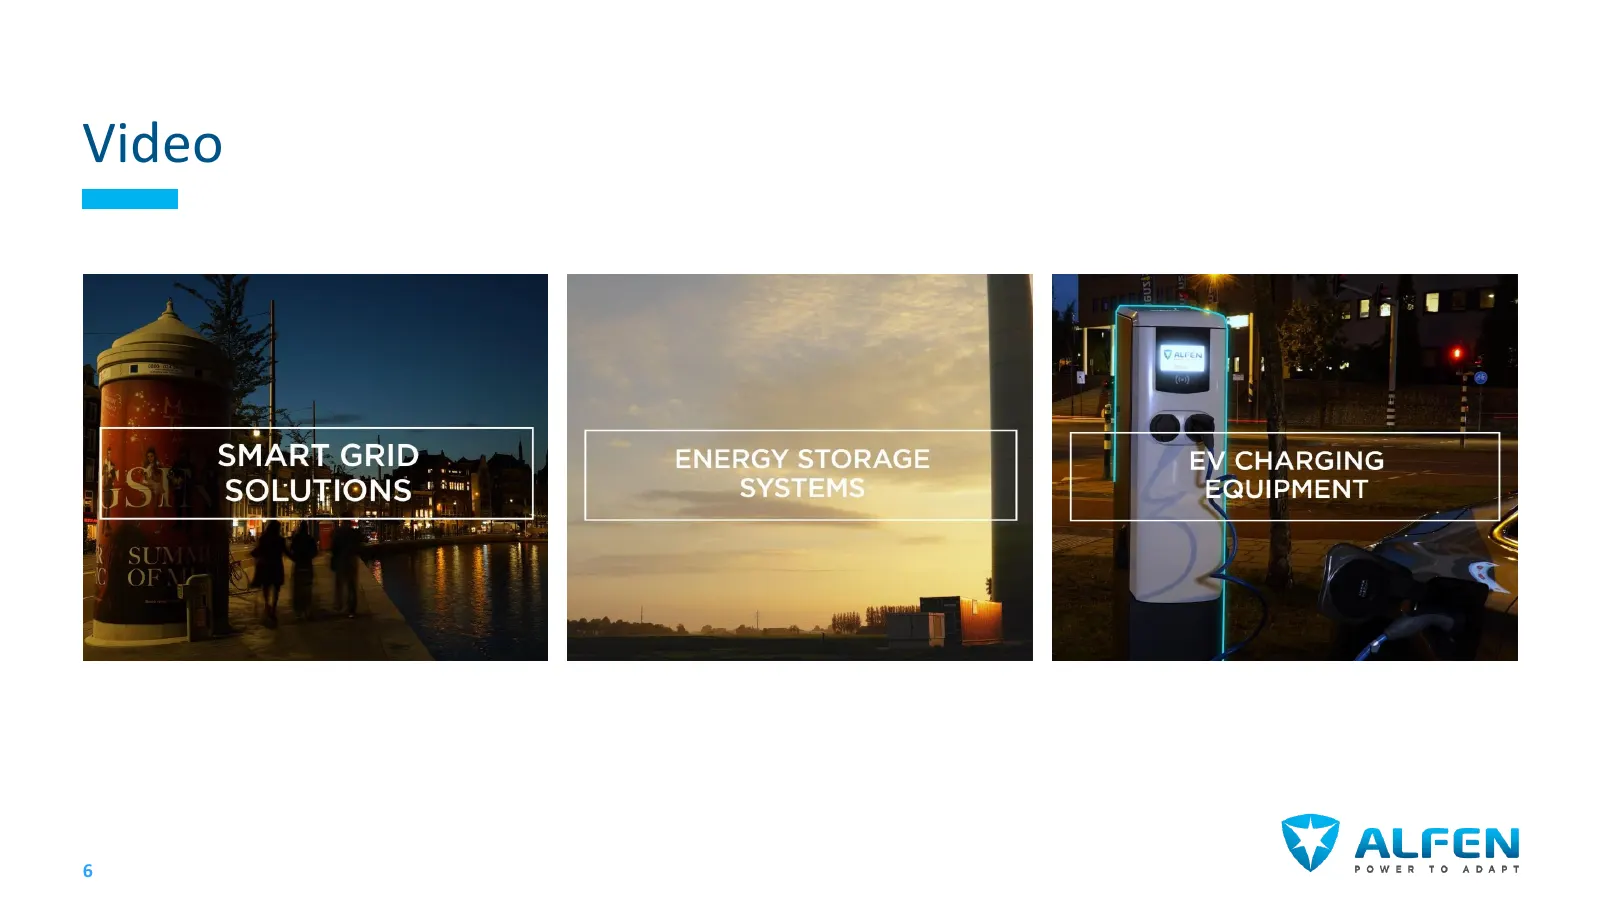
Video {/ CHARGING EQUIPMENT wv AGT CIN POWER TO ADAPT
Slide 7: Unique integrated business model
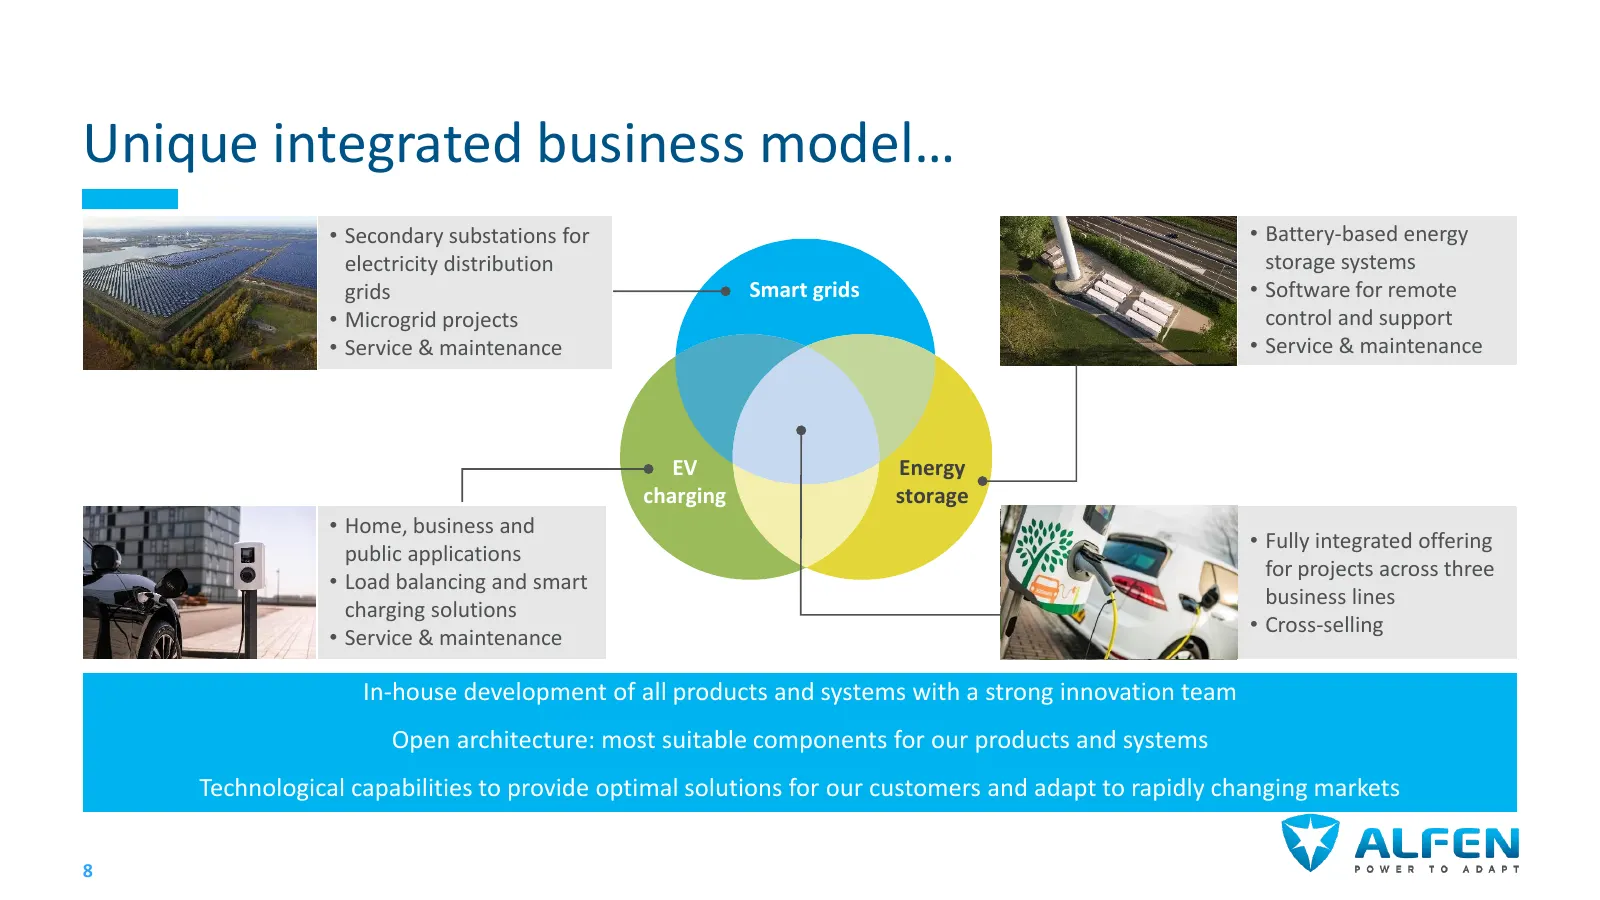
Unique integrated business model… • Secondary substations for • Battery-based energy electricity distribution storage systems grids Smart grids • Software for remote • Microgrid projects control and support • Service & maintenance • Service & maintenance EV Energy charging storage • Home, business a
Slide 8: Supported by long-term growth trends
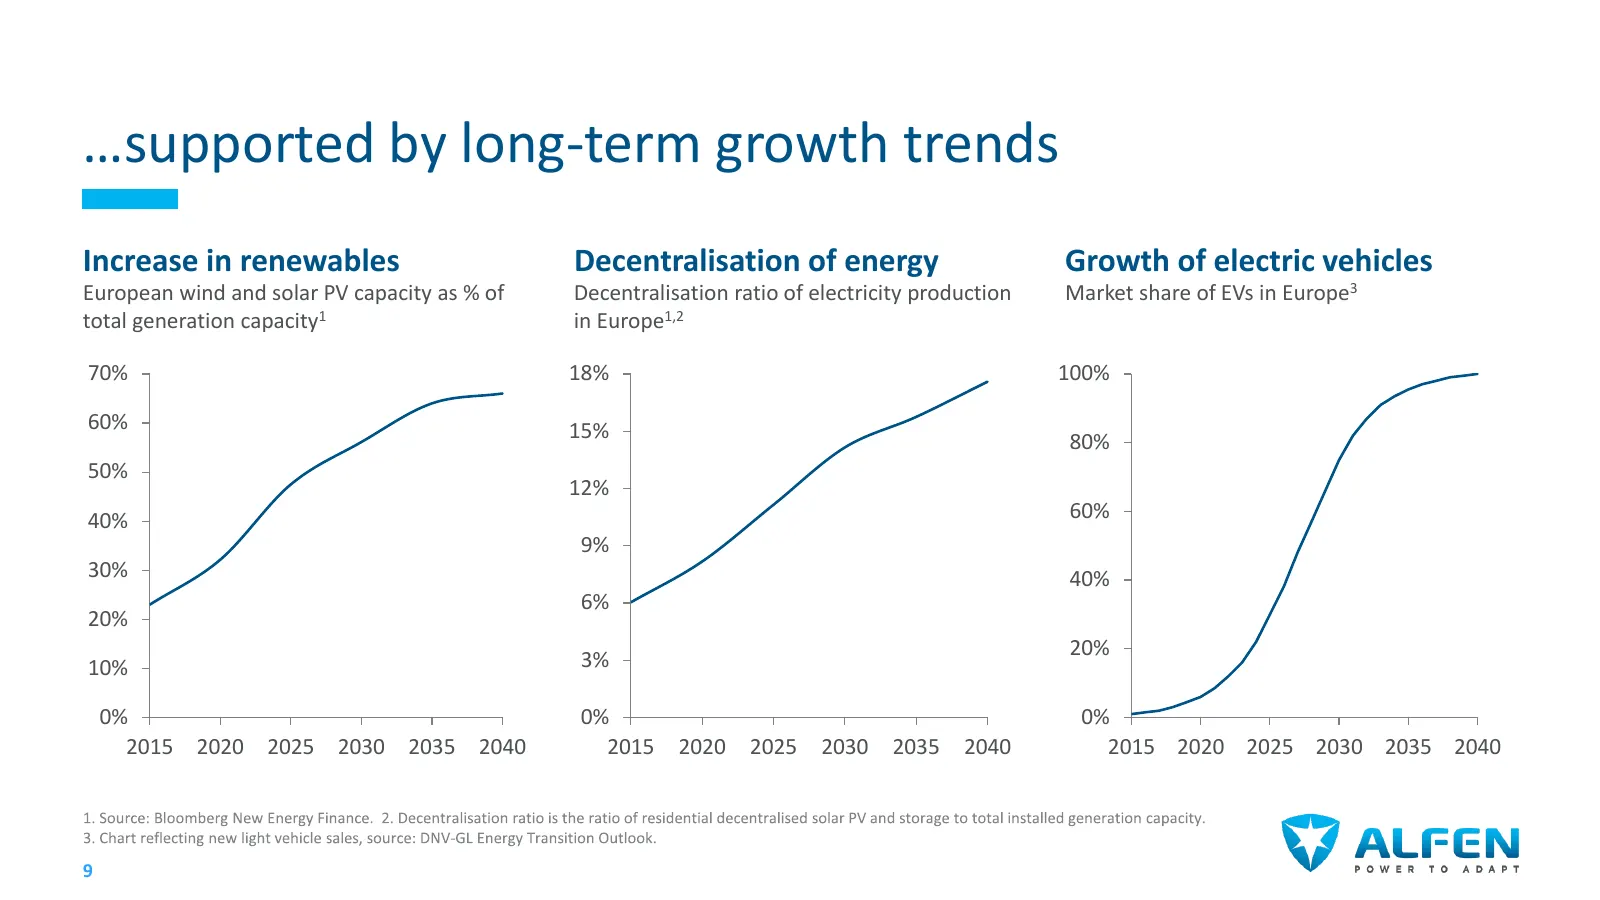
…supported by long-term growth trends Increase in renewables Decentralisation of energy Growth of electric vehicles European wind and solar PV capacity as % of Decentralisation ratio of electricity production Market share of EVs in Europe3 total generation capacity1 in Europe1,2 70% 18% 100% 60% 15%
Slide 9: Our value proposition to the market
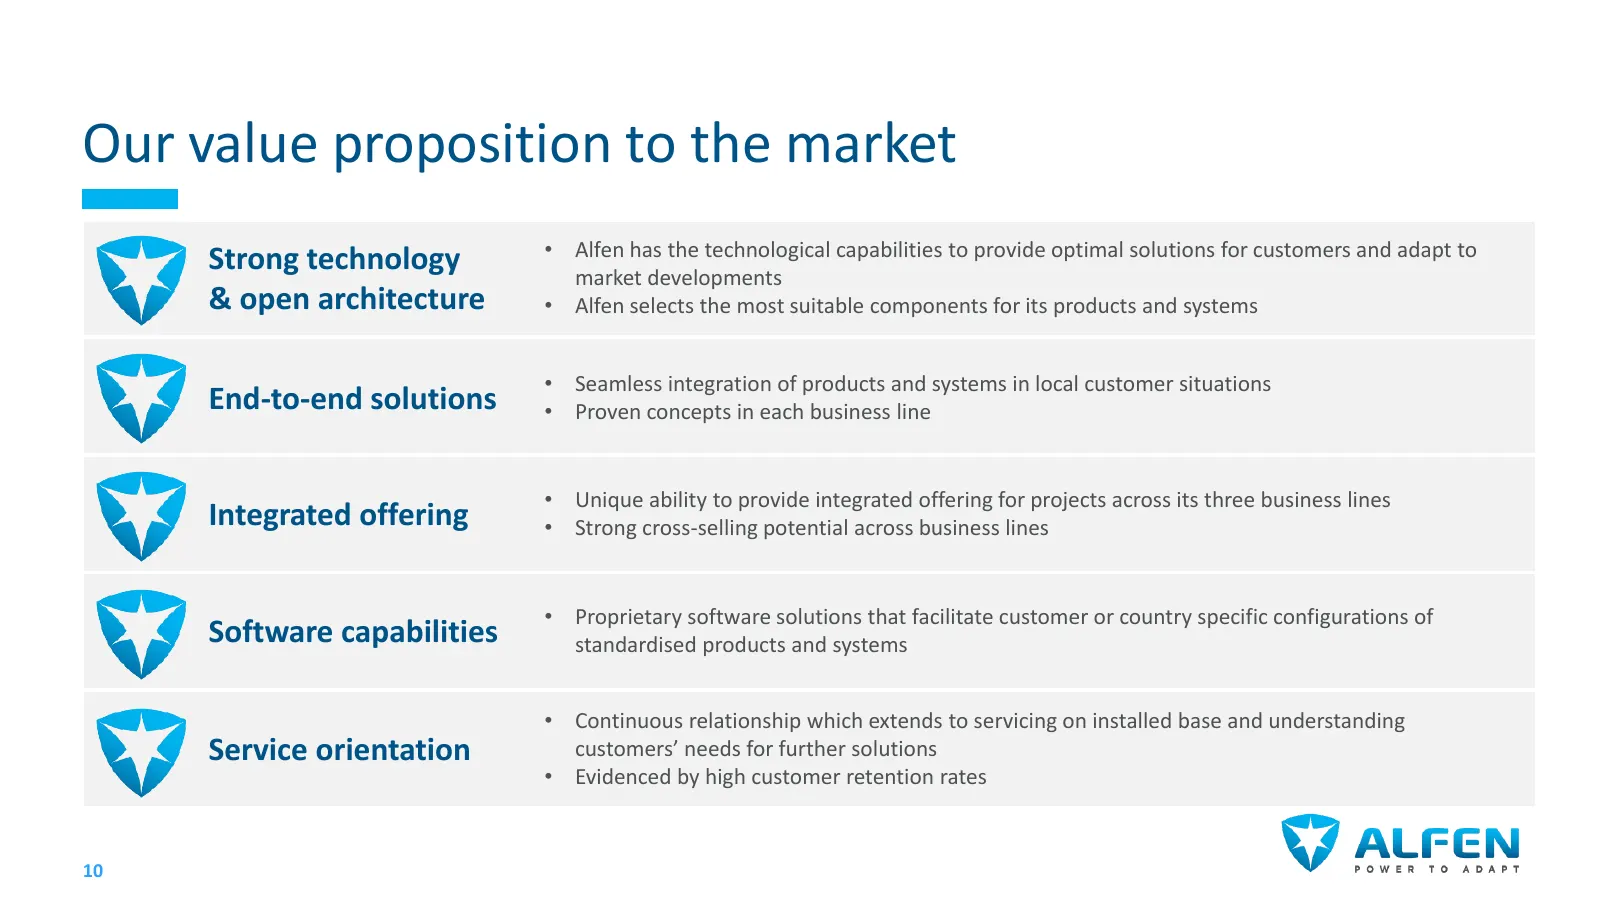
Our value proposition to the market Strong technology • Alfen has the technological capabilities to provide optimal solutions for customers and adapt to market developments & open architecture • Alfen selects the most suitable components for its products and systems • Seamless integration of product
Slide 10: Only independent player active in all three business lines
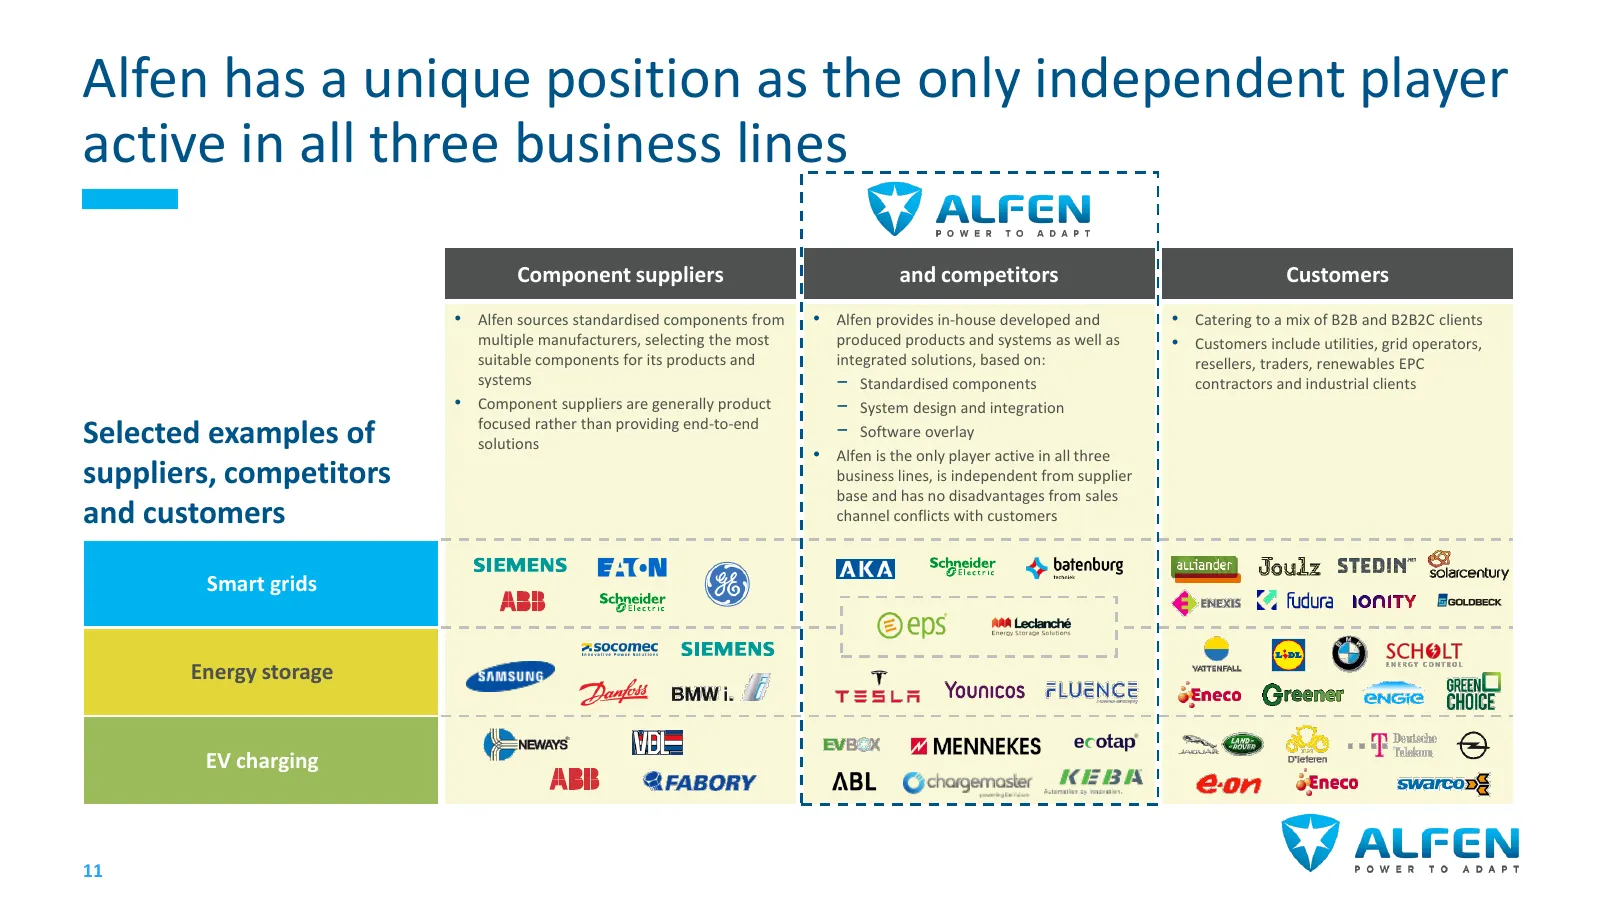
Alfen has a unique position as the only independent player active in all three business lines Component suppliers and competitors Customers • Alfen sources standardised components from • Alfen provides in-house developed and • Catering to a mix of B2B and B2B2C clients multiple manufacturers, select
Slide 11: Growth strategy remains unchanged
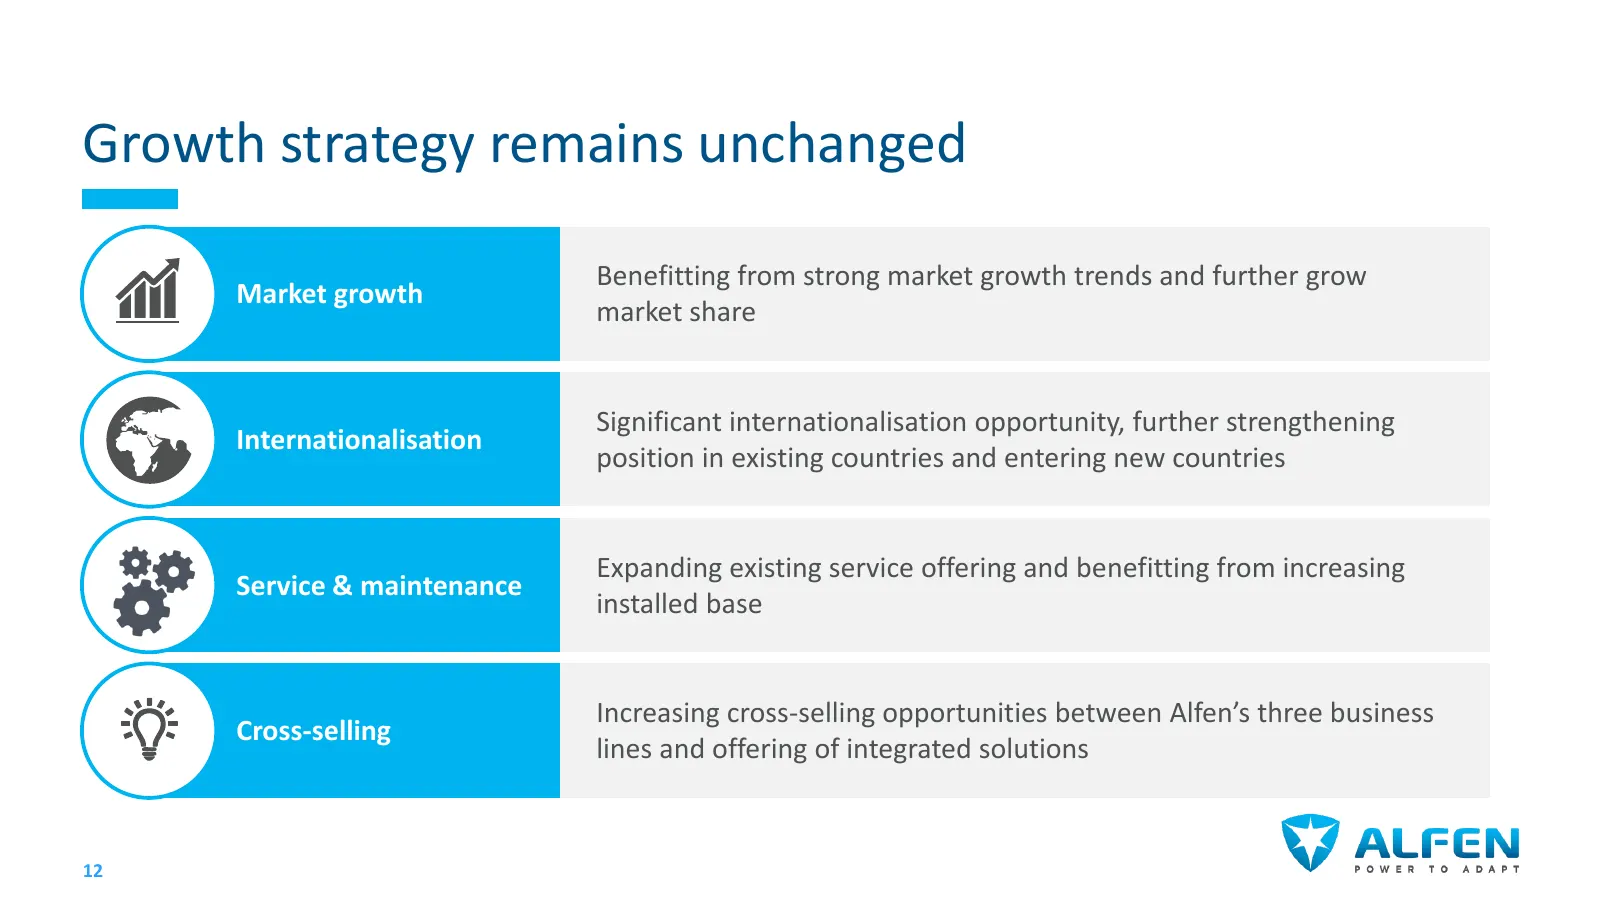
Growth strategy remains unchanged Benefitting from strong market growth trends and further grow Market growth market share Significant internationalisation opportunity, further strengthening Internationalisation position in existing countries and entering new countries Expanding existing service off
Slide 12: Benefitting from fast growing market segments
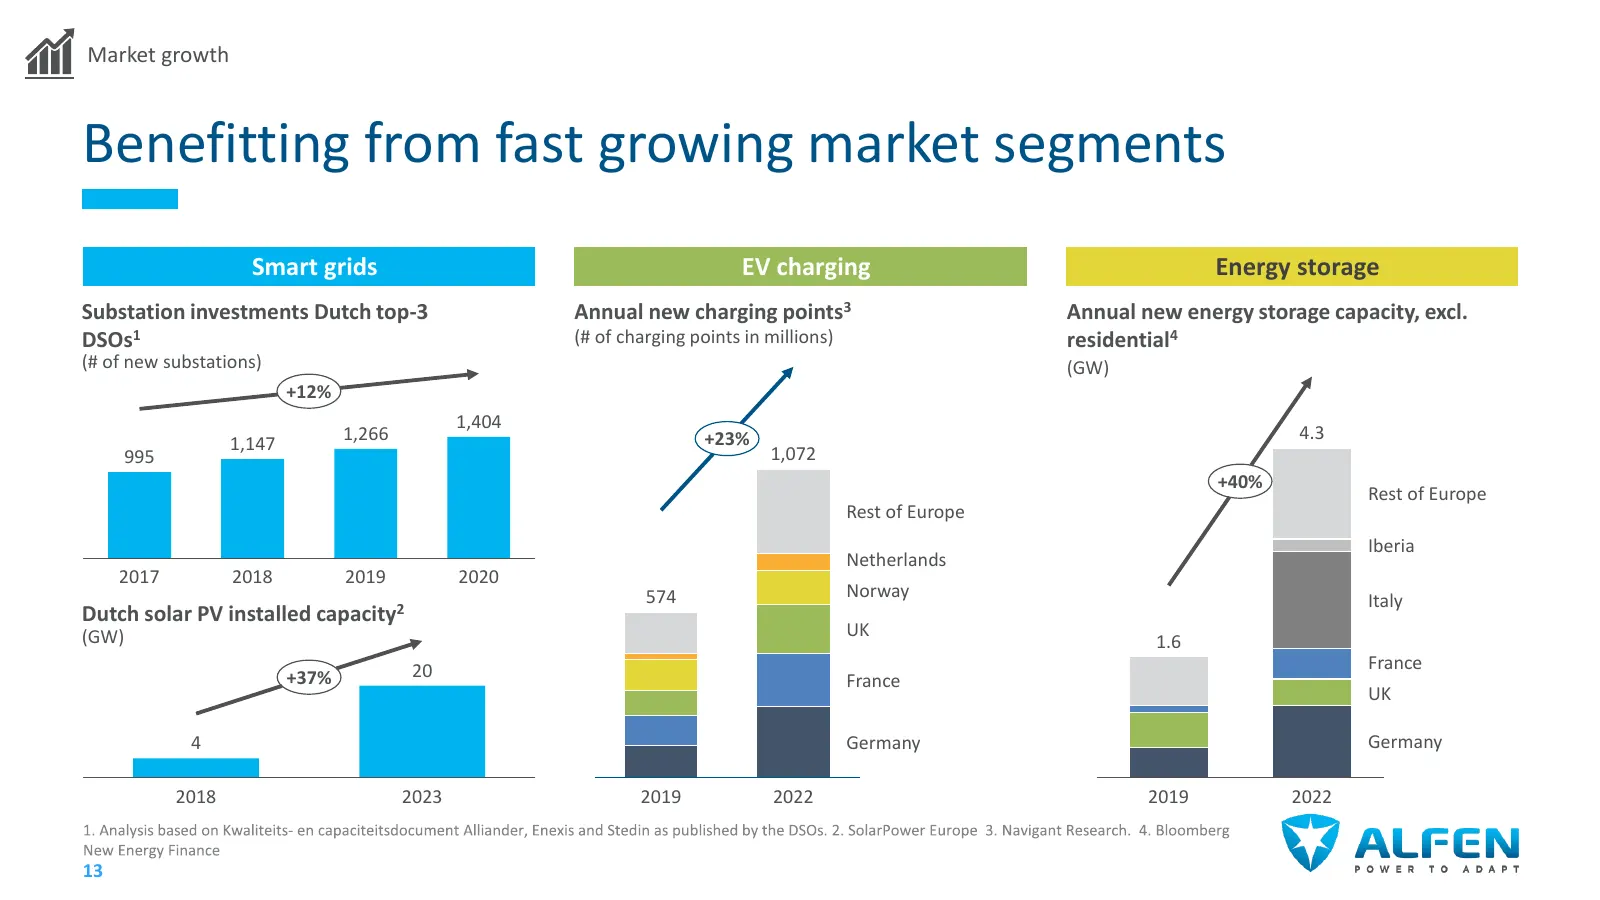
Market growth Benefitting from fast growing market segments Smart grids EV charging Energy storage Substation investments Dutch top-3 Annual new charging points3 Annual new energy storage capacity, excl. DSOs1 (# of charging points in millions) residential4 (# of new substations) (GW) +12% 1,404 1,2
Slide 13: Expanding footprint
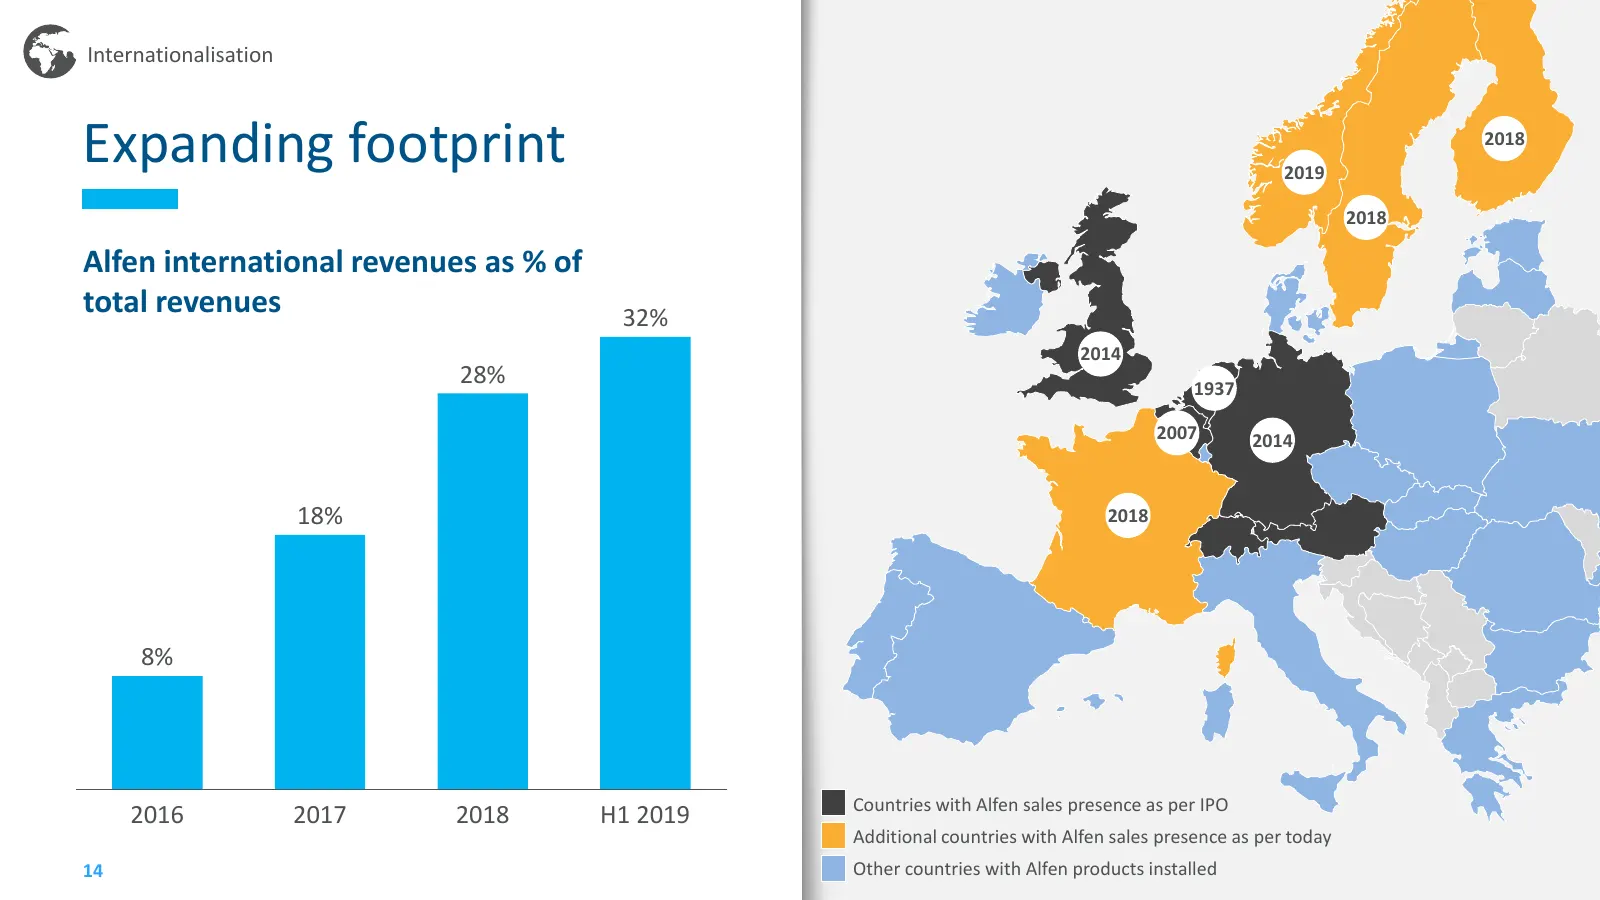
Internationalisation Expanding footprint 2019 2018 2018 Alfen international revenues as % of total revenues 32% 2014 28% 1937 2007 2014 18% 2018 8% Countries with Alfen sales presence as per IPO 2016 2017 2018 H1 2019 Additional countries with Alfen sales presence as per today 14 Other countries wit
Slide 14: Focus on expanding recurring revenues from service
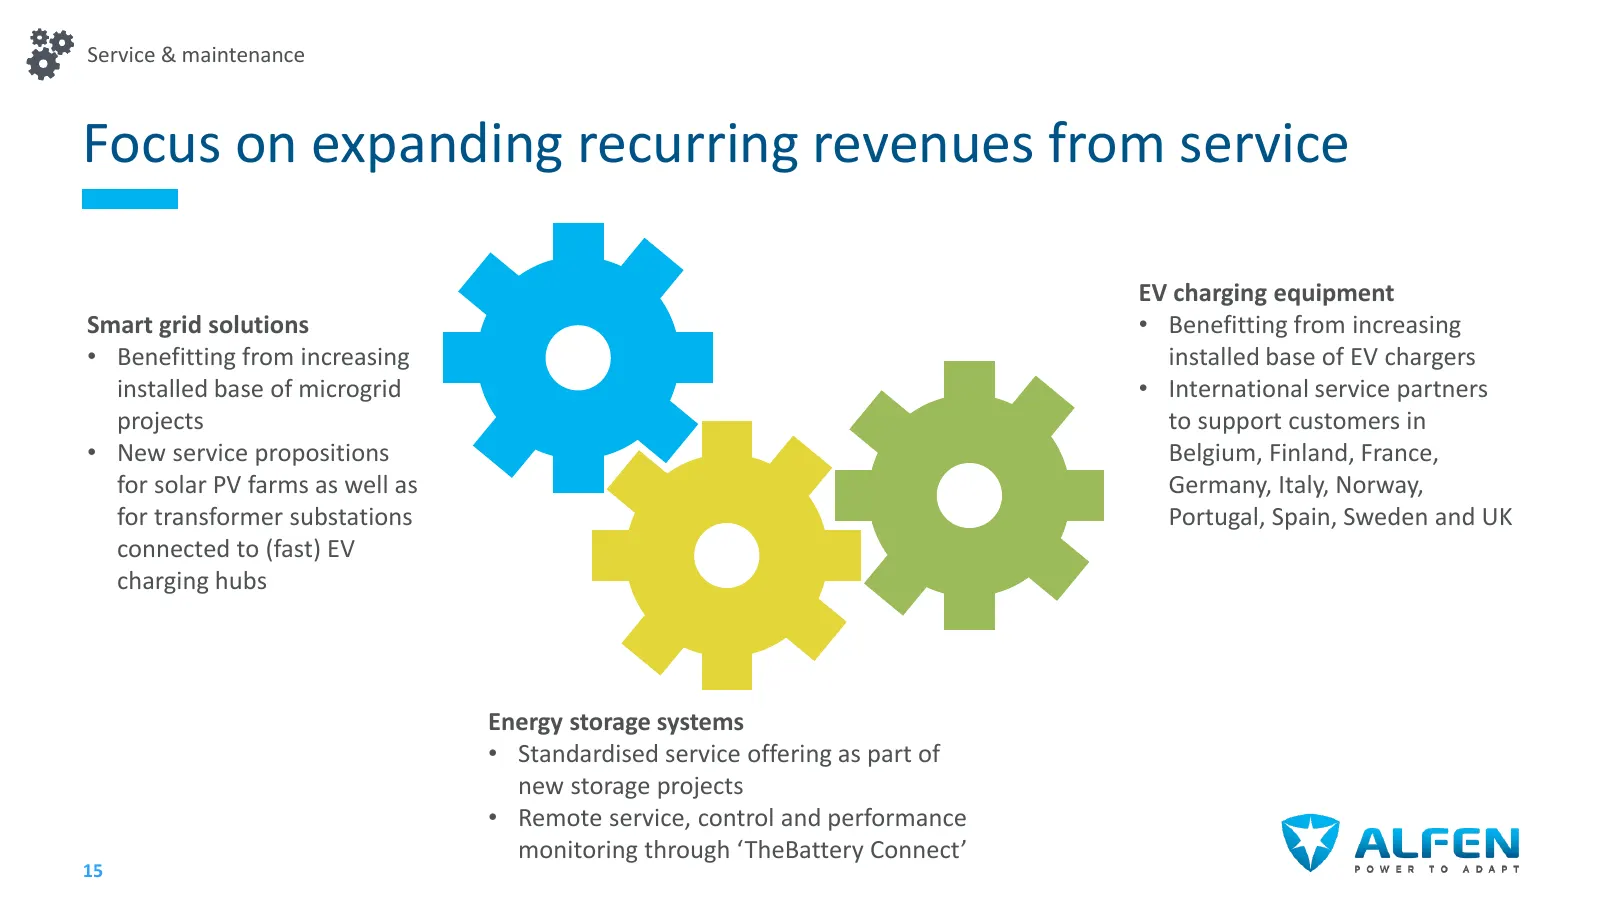
Service & maintenance Focus on expanding recurring revenues from service EV charging equipment Smart grid solutions • Benefitting from increasing • Benefitting from increasing installed base of EV chargers installed base of microgrid • International service partners projects to support customers in
Slide 15: Increasingly benefitting from cross-sell
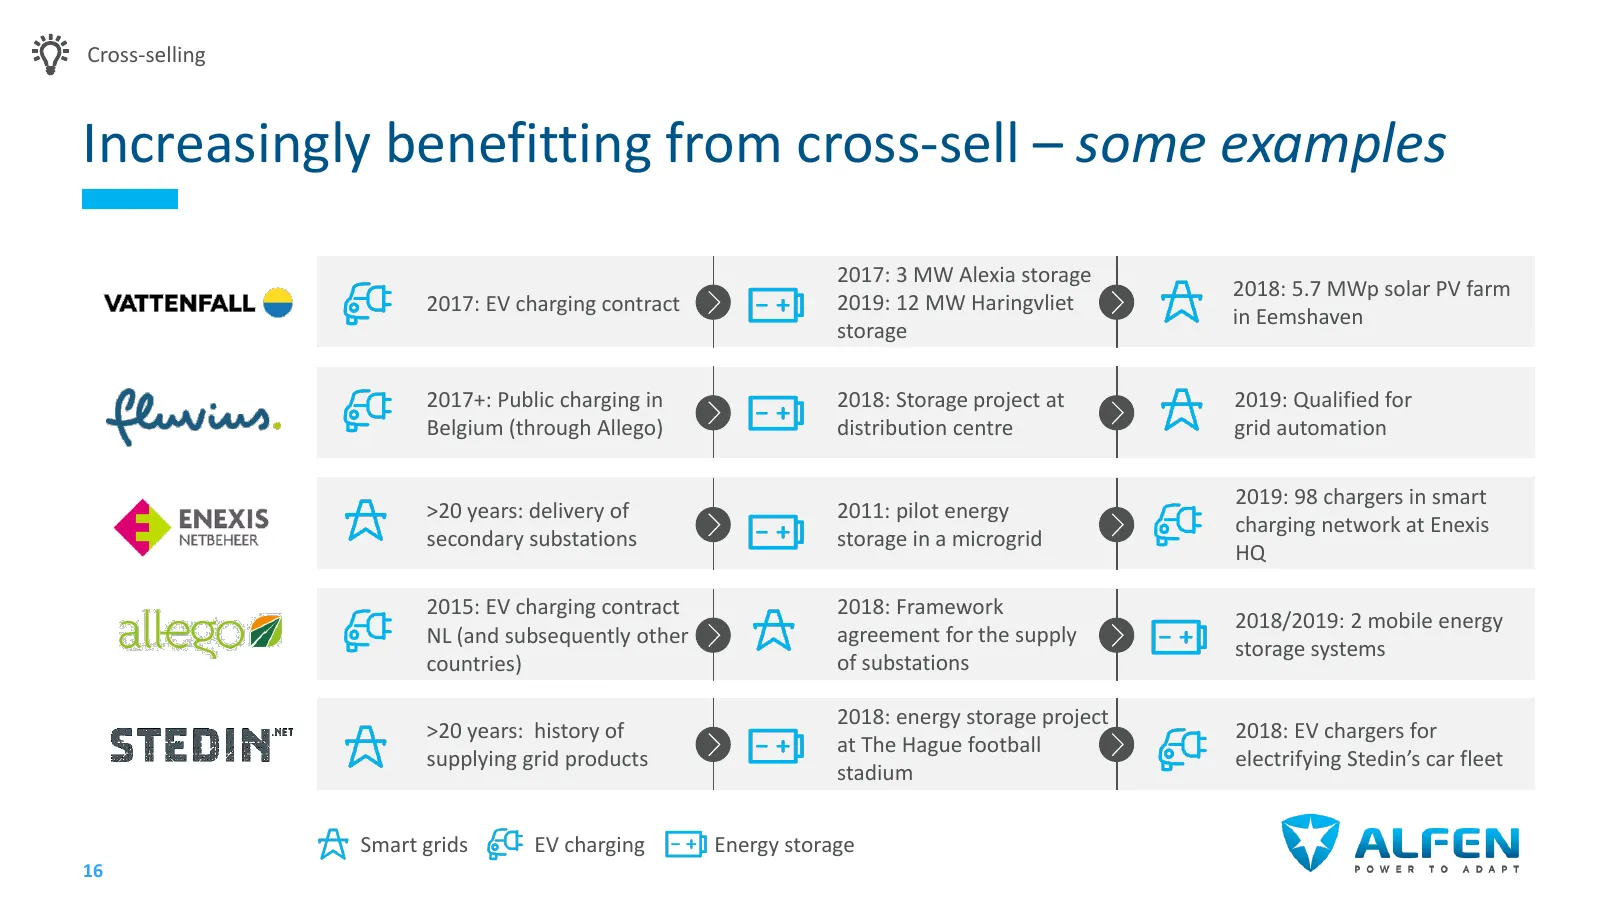
Cross-selling Increasingly benefitting from cross-sell – some examples 2017: 3 MW Alexia storage 2018: 5.7 MWp solar PV farm 2017: EV charging contract 2019: 12 MW Haringvliet in Eemshaven storage 2017+: Public charging in 2018: Storage project at 2019: Qualified for Belgium (through Allego) distrib
Slide 16: Organisation well prepared to capture growth
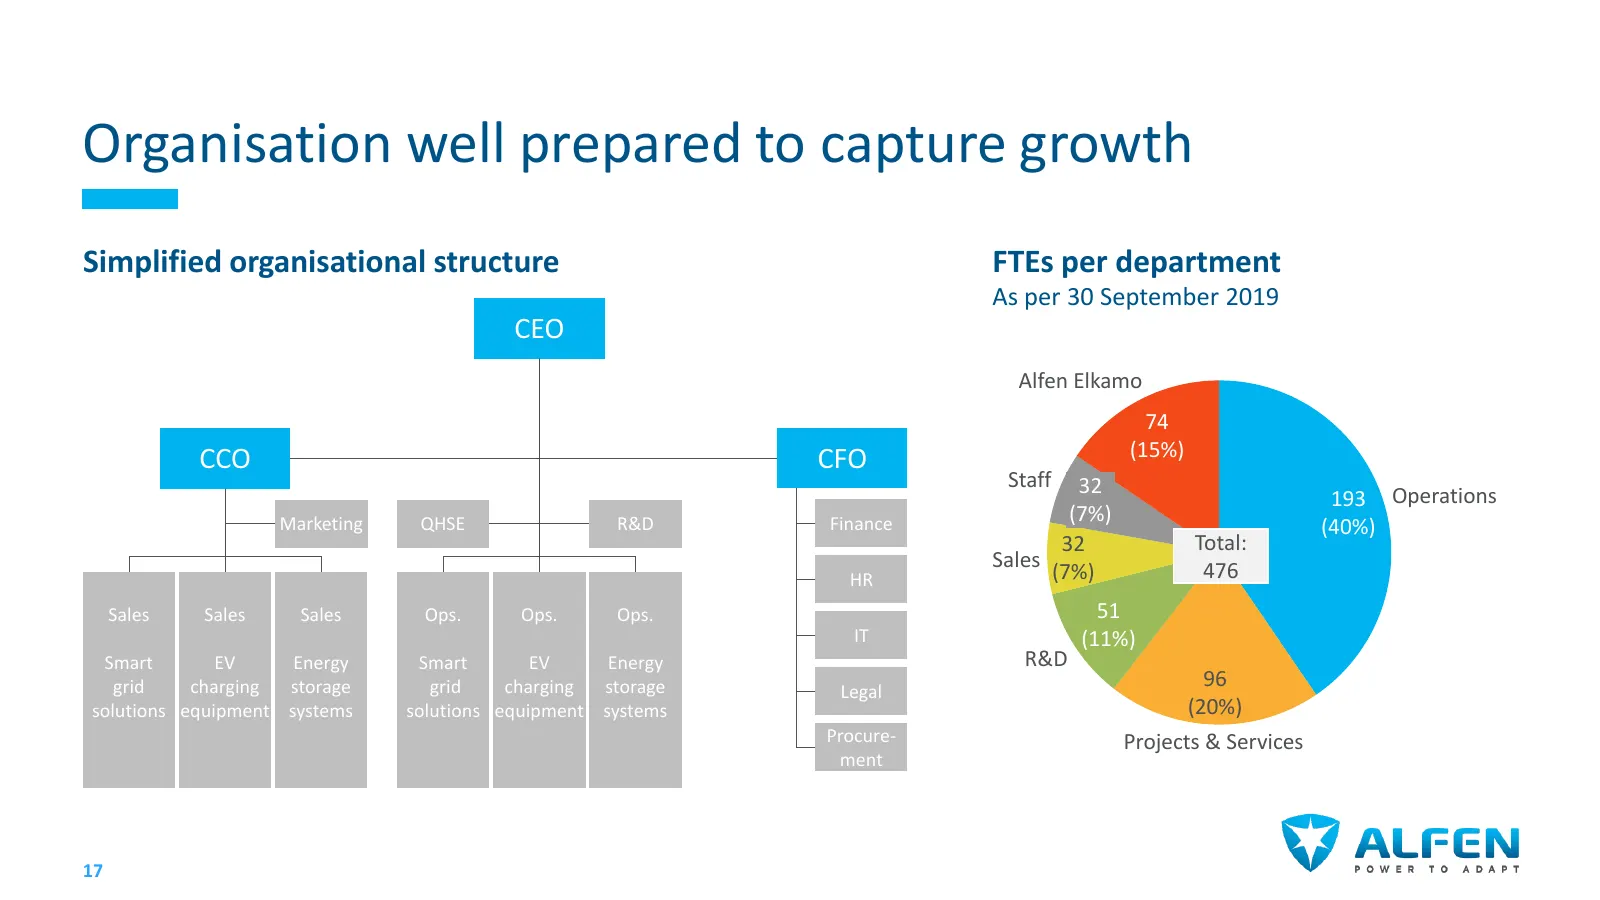
Organisation well prepared to capture growth Simplified organisational structure FTEs per department As per 30 September 2019 CEO Alfen Elkamo 74 CCO CFO (15%) Staff 32 193 Operations Marketing QHSE R&D Finance (7%) (40%) 32 Total: Sales 476 HR (7%) Sales Sales Sales Ops. Ops. Ops. 51 IT (11%) Smart
Slide 17: Several initiatives in place to support steep growth
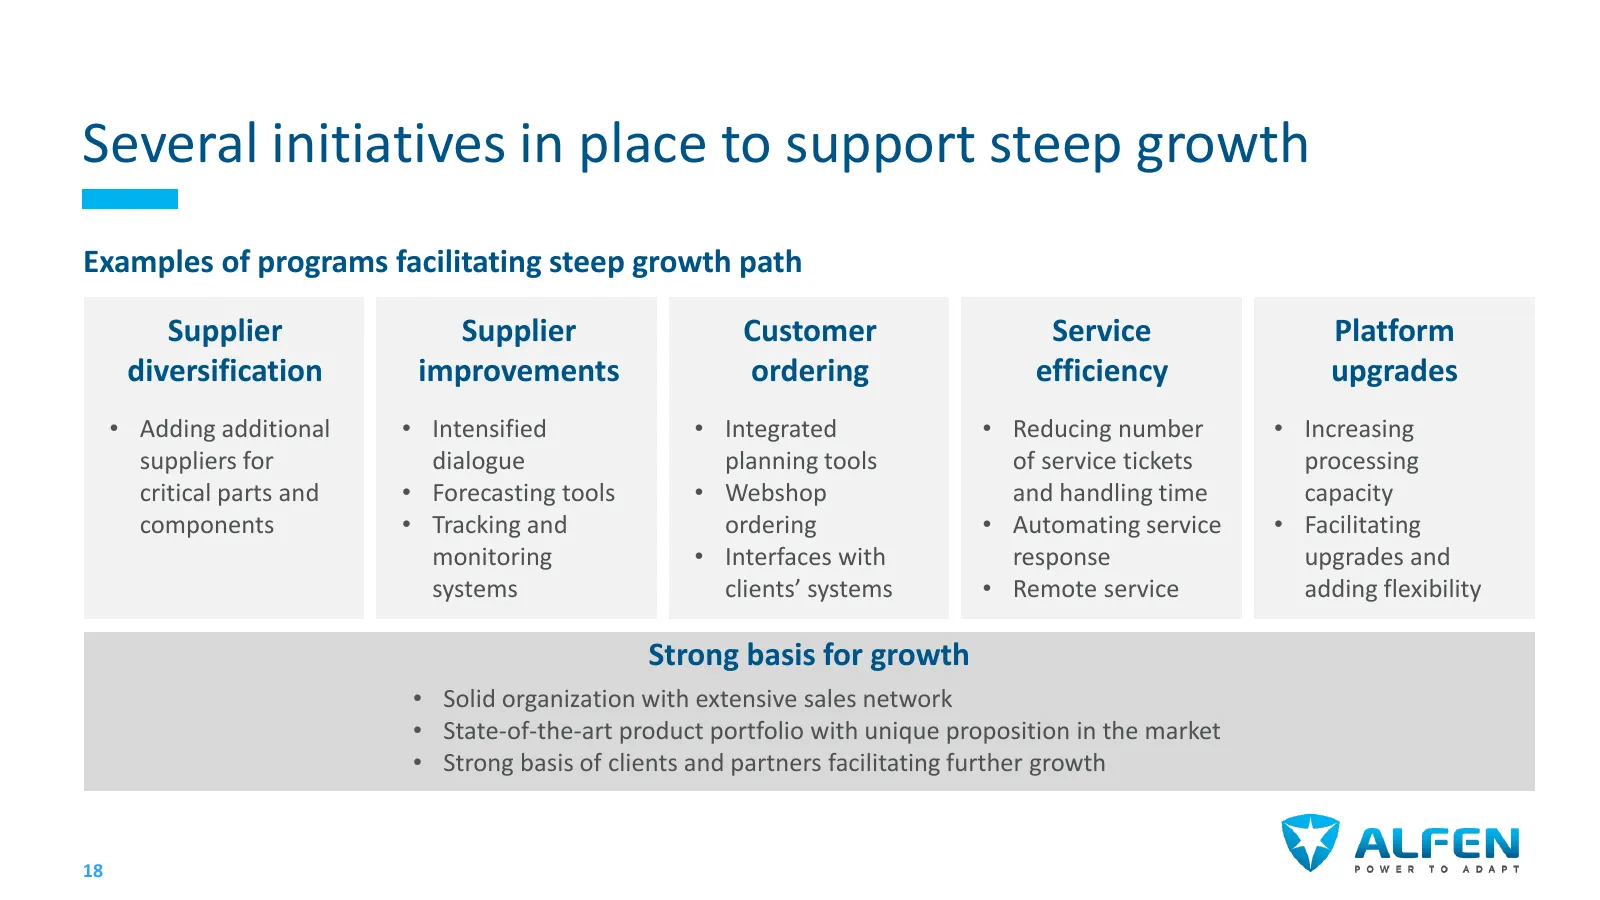
Several initiatives in place to support steep growth Examples of programs facilitating steep growth path Supplier Supplier Customer Service Platform diversification improvements ordering efficiency upgrades • Adding additional • Intensified • Integrated • Reducing number • Increasing suppliers for d
Slide 18: Long history of working with a broad range of CSR themes
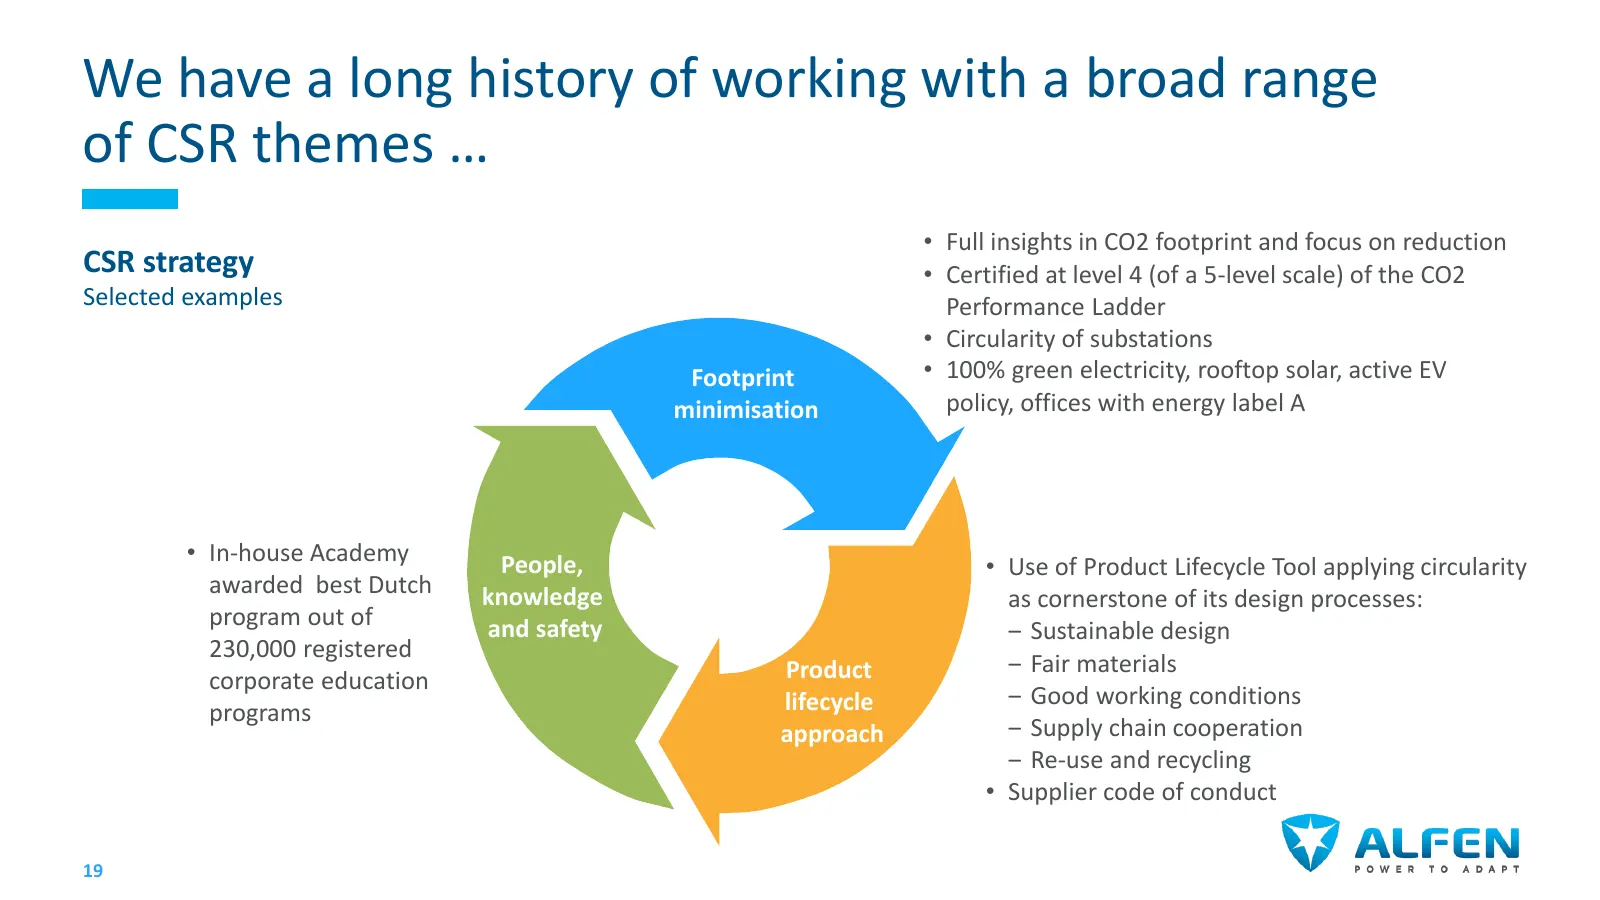
We have a long history of working with a broad range of CSR themes … • Full insights in CO2 footprint and focus on reduction CSR strategy • Certified at level 4 (of a 5-level scale) of the CO2 Selected examples Performance Ladder • Circularity of substations Footprint • 100% green electricity, rooft
Slide 19: Alignment with UN Sustainable Development Goals
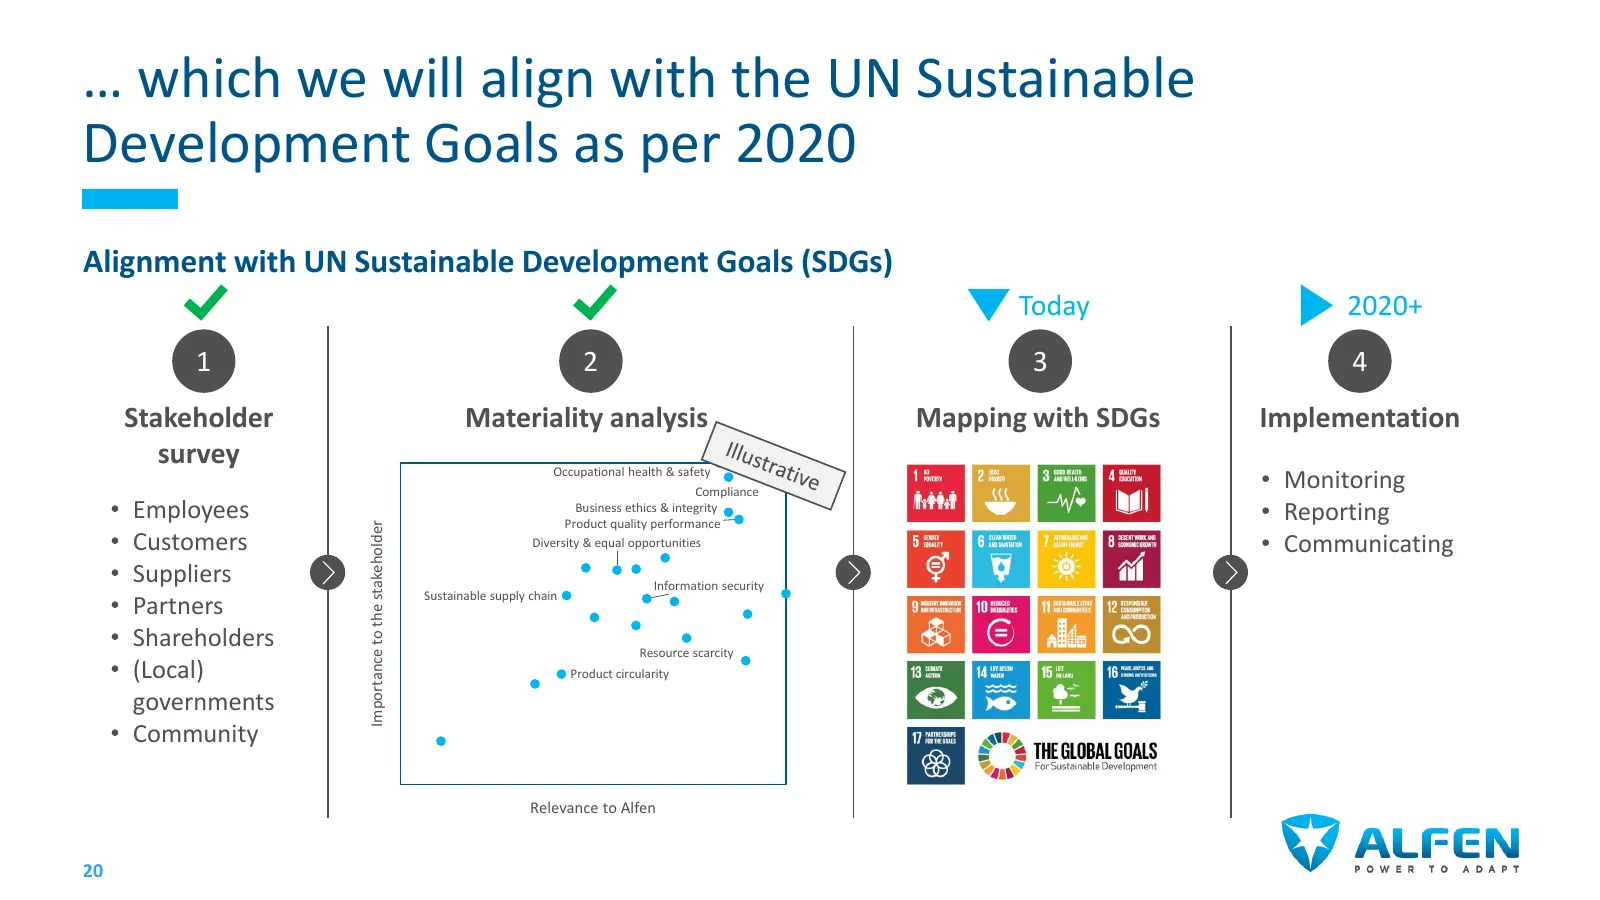
… which we will align with the UN Sustainable Development Goals as per 2020 Alignment with UN Sustainable Development Goals (SDGs) Today 2020+ 1 2 3 4 Stakeholder Materiality analysis Mapping with SDGs Implementation survey Occupational health & safety Compliance • Monitoring • Employees Business et
Slide 20: Four strategic objectives
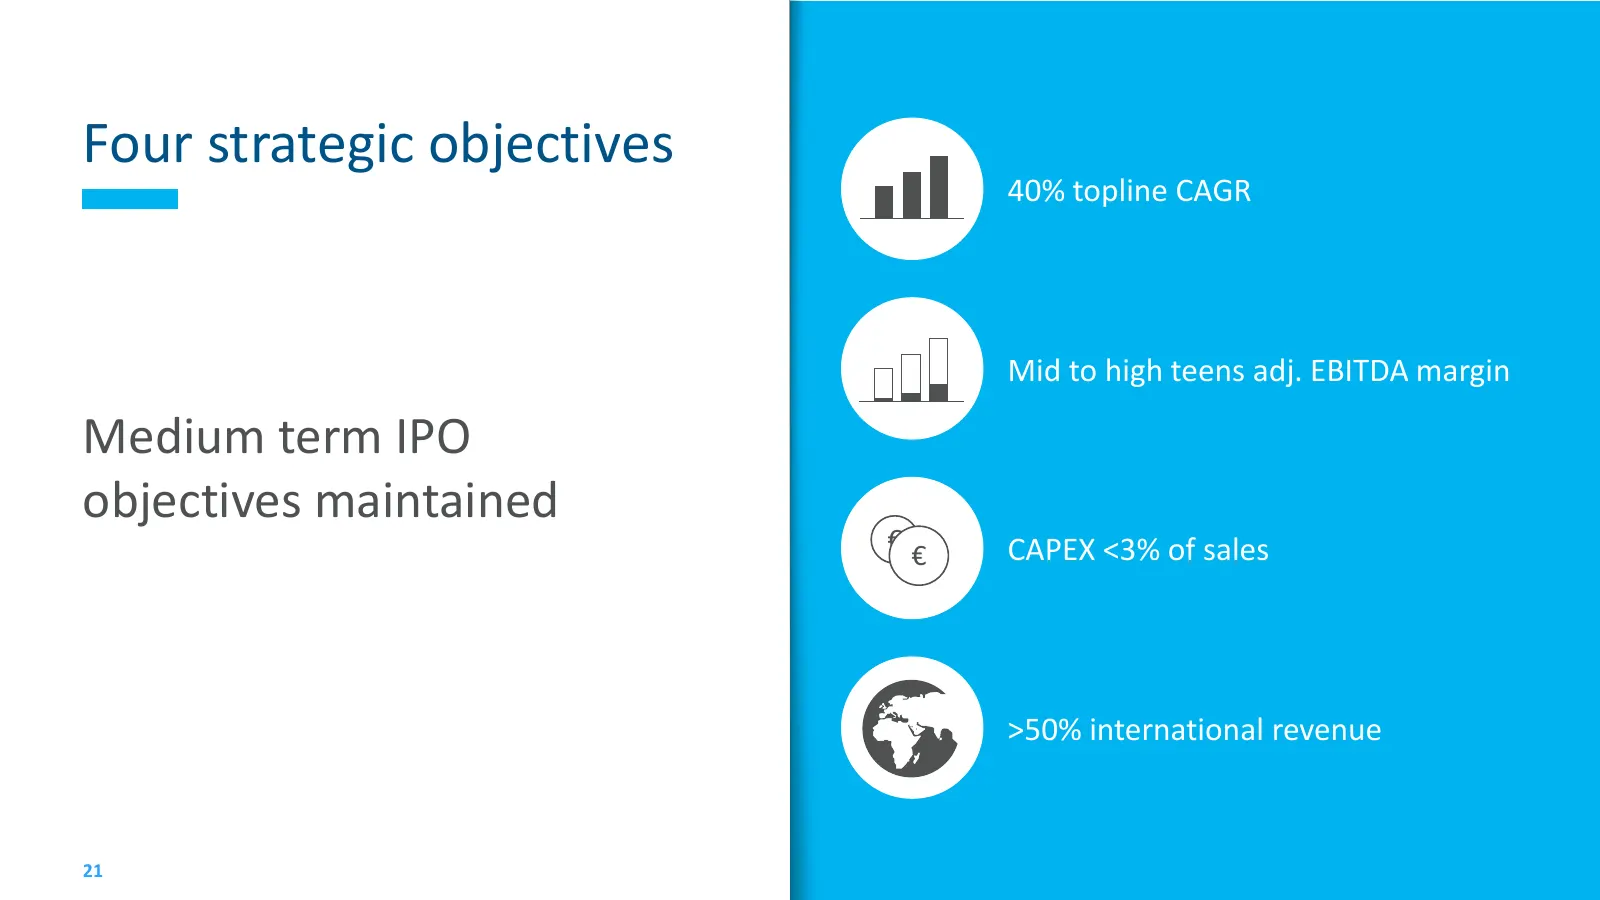
Four strategic objectives 40% topline CAGR Mid to high teens adj. EBITDA margin Medium term IPO objectives maintained € CAPEX <3% of sales € >50% international revenue 21
Slide 21: Agenda
Agenda 09:00 Registration and welcome 09:30 Group review • Strategy recap • YTD performance and outlook 10:30 Coffee break 11:00 Business line deep dives • Smart grid solutions • EV charging • Energy storage 12:30 Wrap-up 12:45 Lunch 22
Slide 22: Presence at trade fairs in 2019
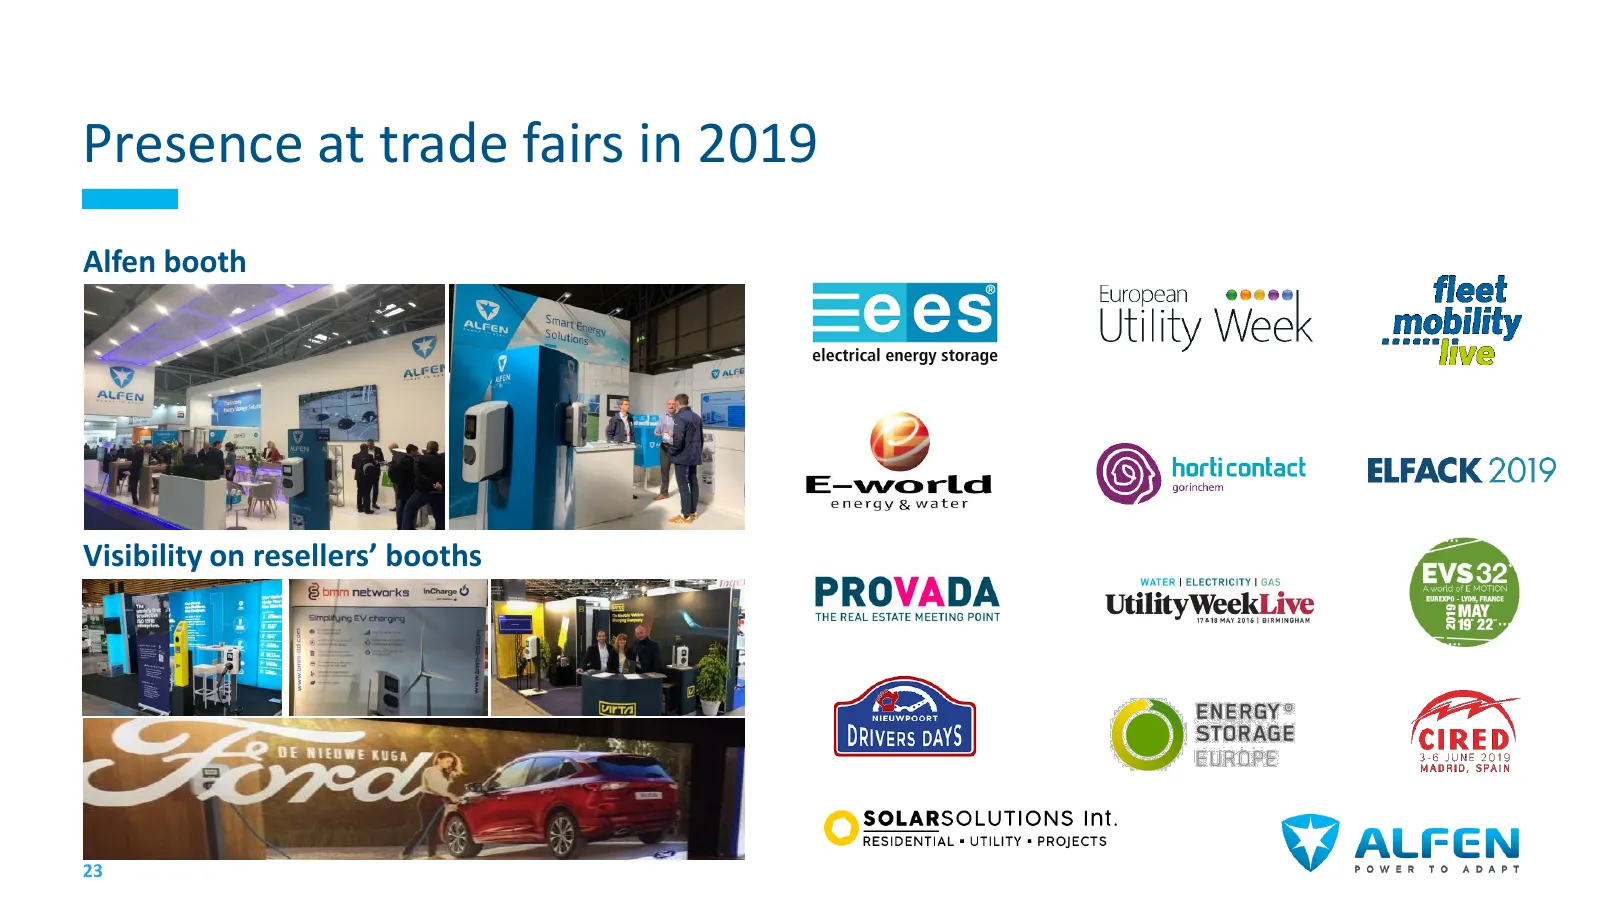
Presence at trade fairs in 2019 Alfen booth Visibility on resellers’ booths 23
Slide 23: Important wins in 2019
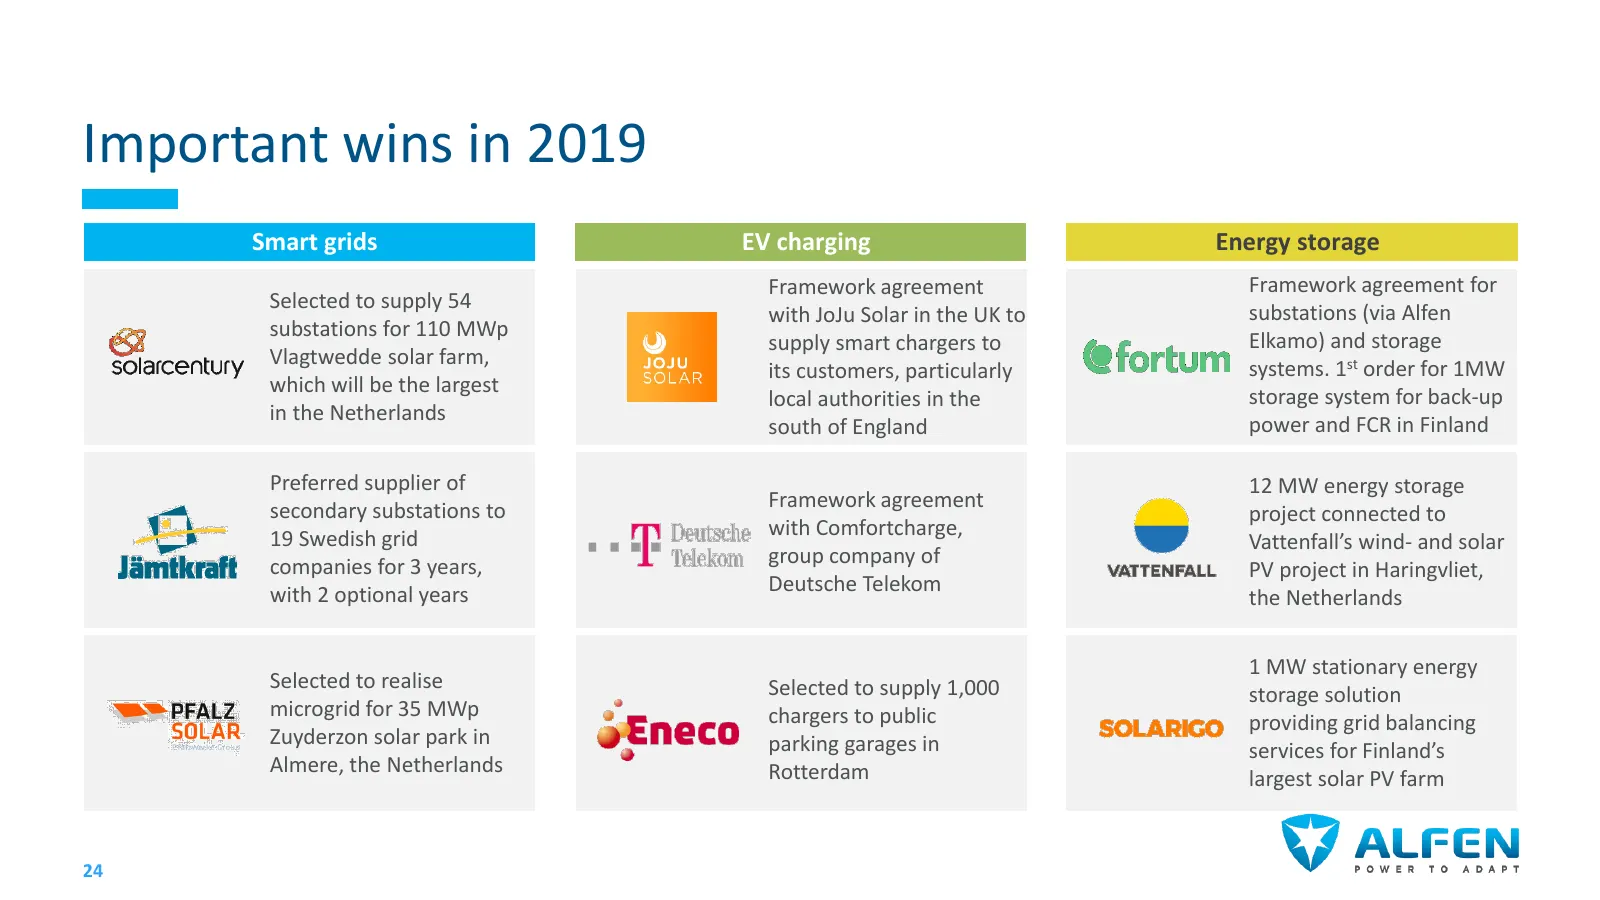
Important wins in 2019 Smart grids EV charging Energy storage Framework agreement Framework agreement for Selected to supply 54 with JoJu Solar in the UK to substations (via Alfen substations for 110 MWp supply smart chargers to Elkamo) and storage Vlagtwedde solar farm, its customers, particularly
Slide 24: Highlights of 2019
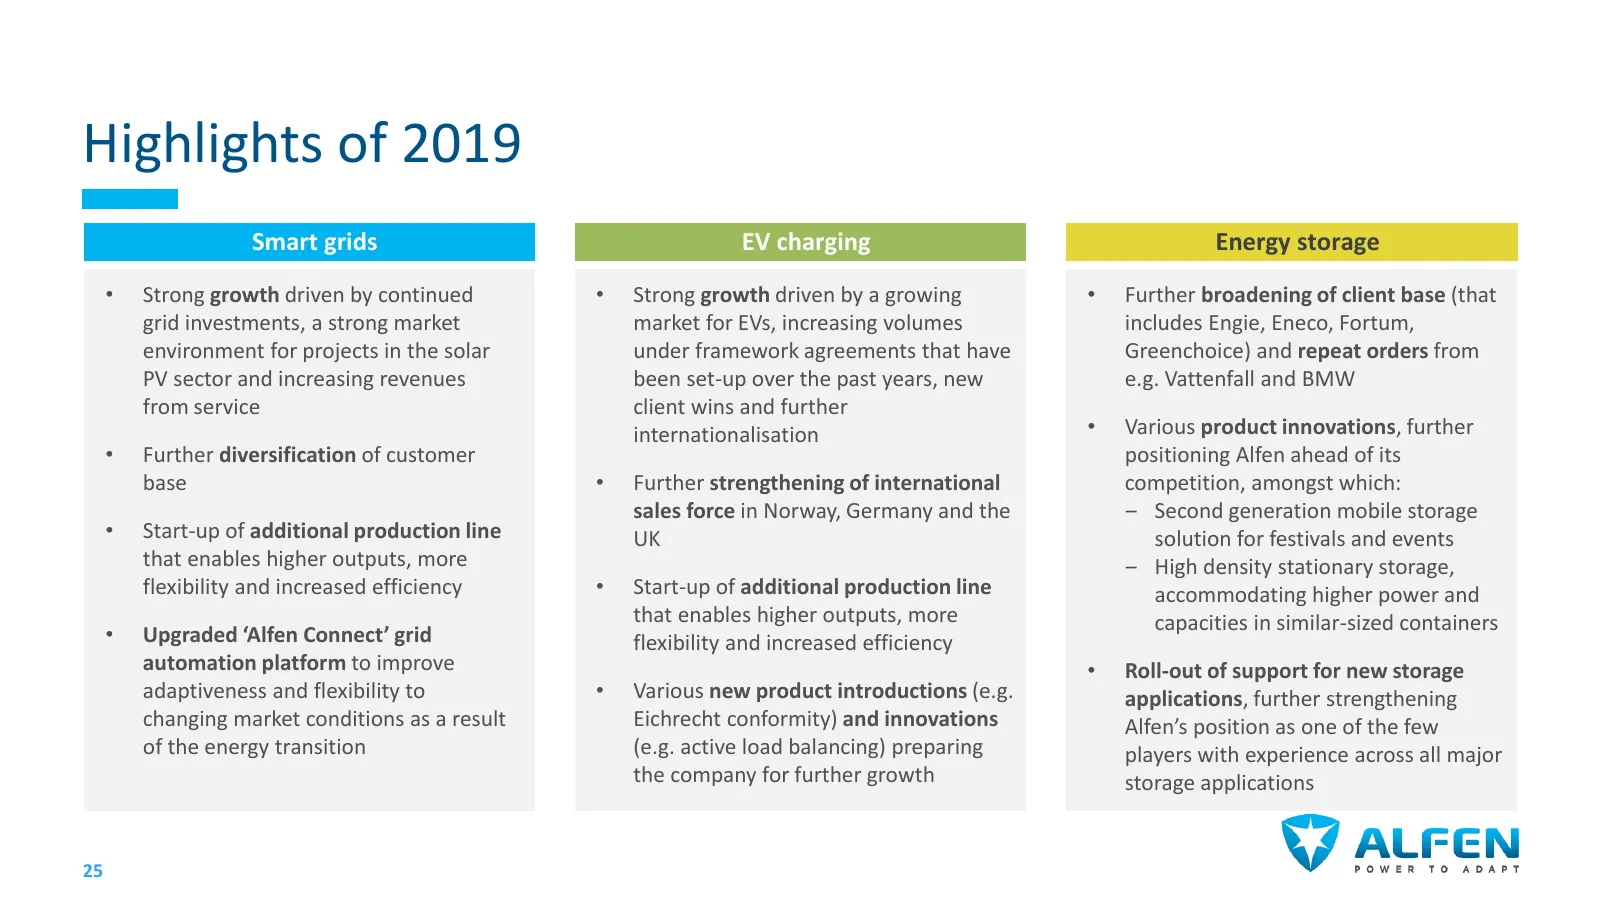
Highlights of 2019 Smart grids EV charging Energy storage • Strong growth driven by continued • Strong growth driven by a growing • Further broadening of client base (that grid investments, a strong market market for EVs, increasing volumes includes Engie, Eneco, Fortum, environment for projects in
Slide 25: 2019 H1: well on-track
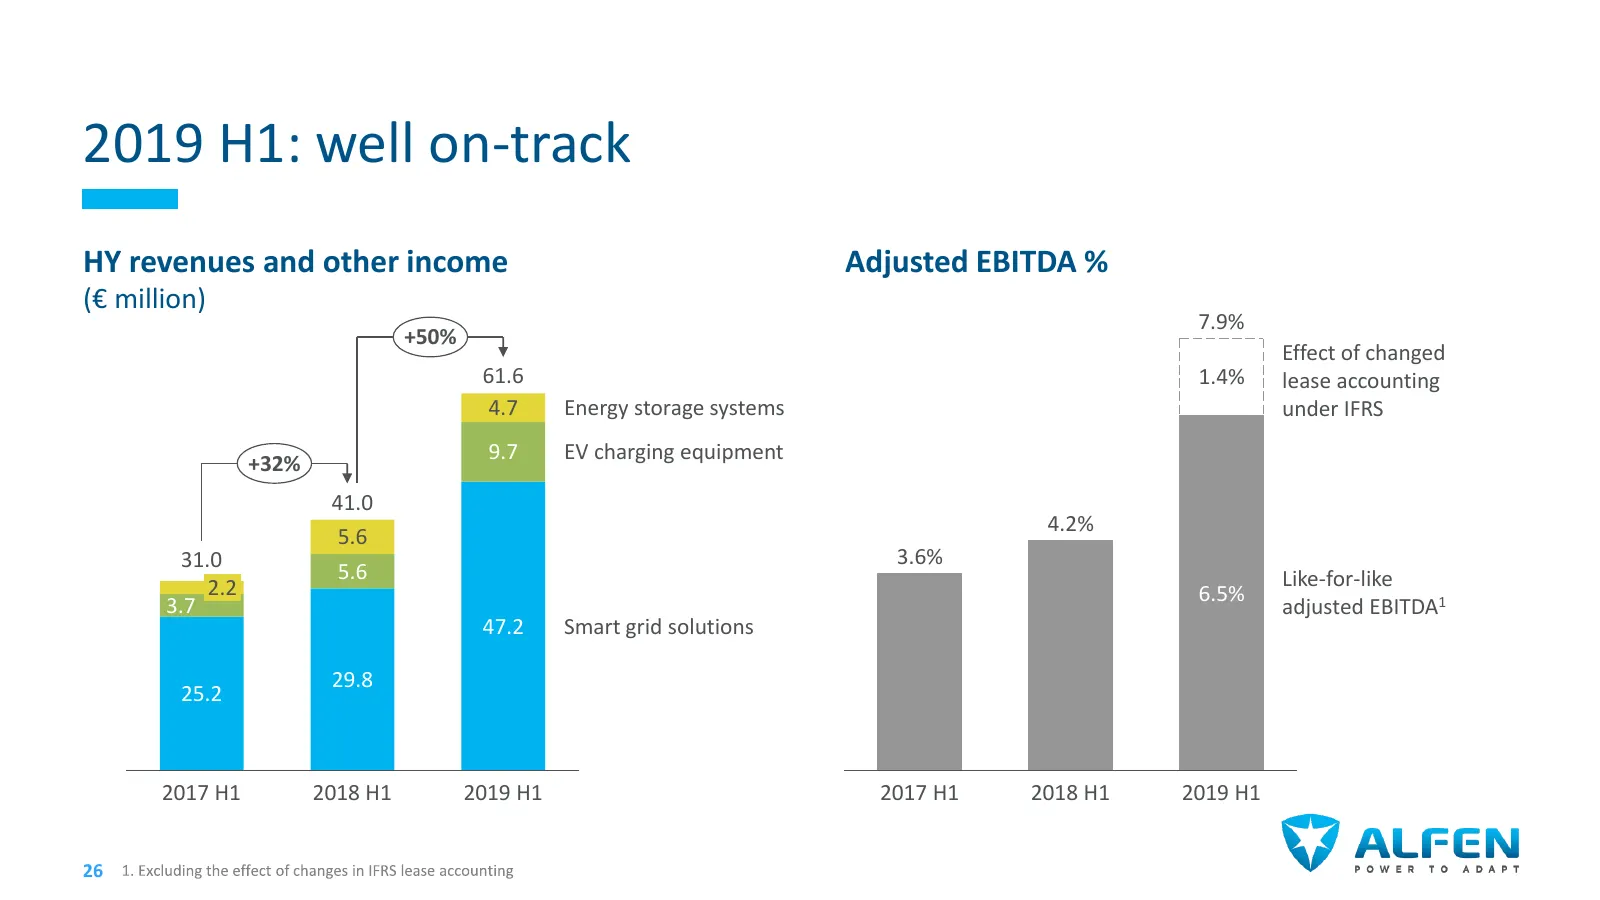
2019 H1: well on-track HY revenues and other income Adjusted EBITDA % (€ million) 7.9% +50% Effect of changed 61.6 1.4% lease accounting 4.7 Energy storage systems under IFRS +32% 9.7 EV charging equipment 41.0 4.2% 5.6 31.0 3.6% 5.6 Like-for-like 2.2 6.5% 3.7 adjusted EBITDA1 47.2 Smart grid soluti
Slide 26: 2019 Q3: profitable growth continues (1/2)
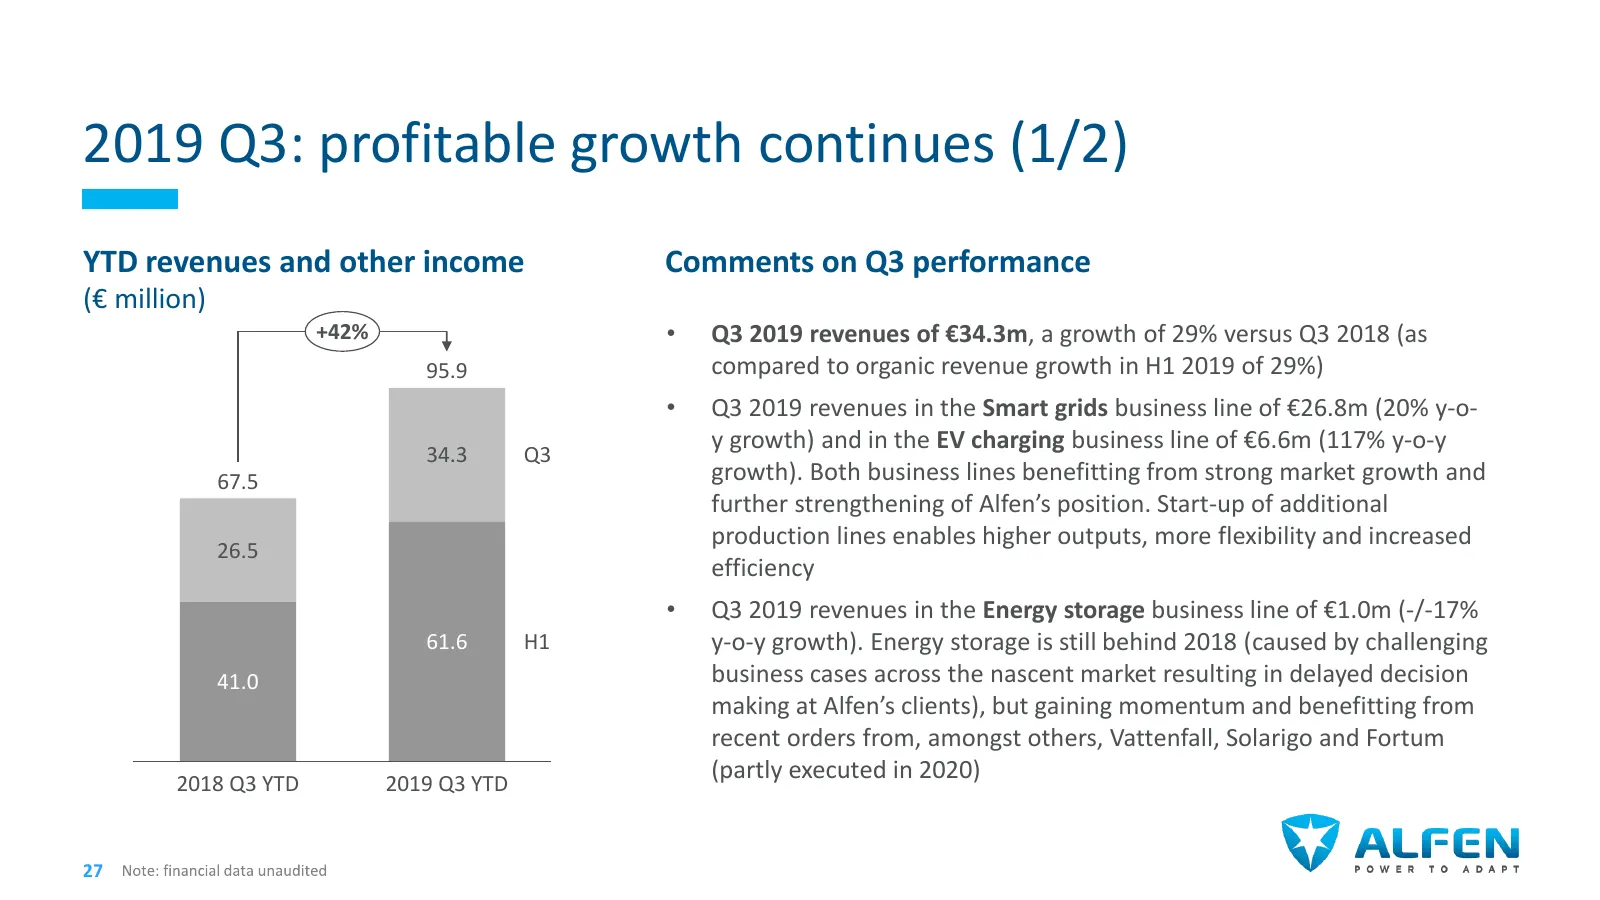
2019 Q3: profitable growth continues (1/2) YTD revenues and other income Comments on Q3 performance (€ million) +42% • Q3 2019 revenues of €34.3m, a growth of 29% versus Q3 2018 (as 95.9 compared to organic revenue growth in H1 2019 of 29%) • Q3 2019 revenues in the Smart grids business line of €26.
Slide 27: 2019 Q3: profitable growth continues (2/2)
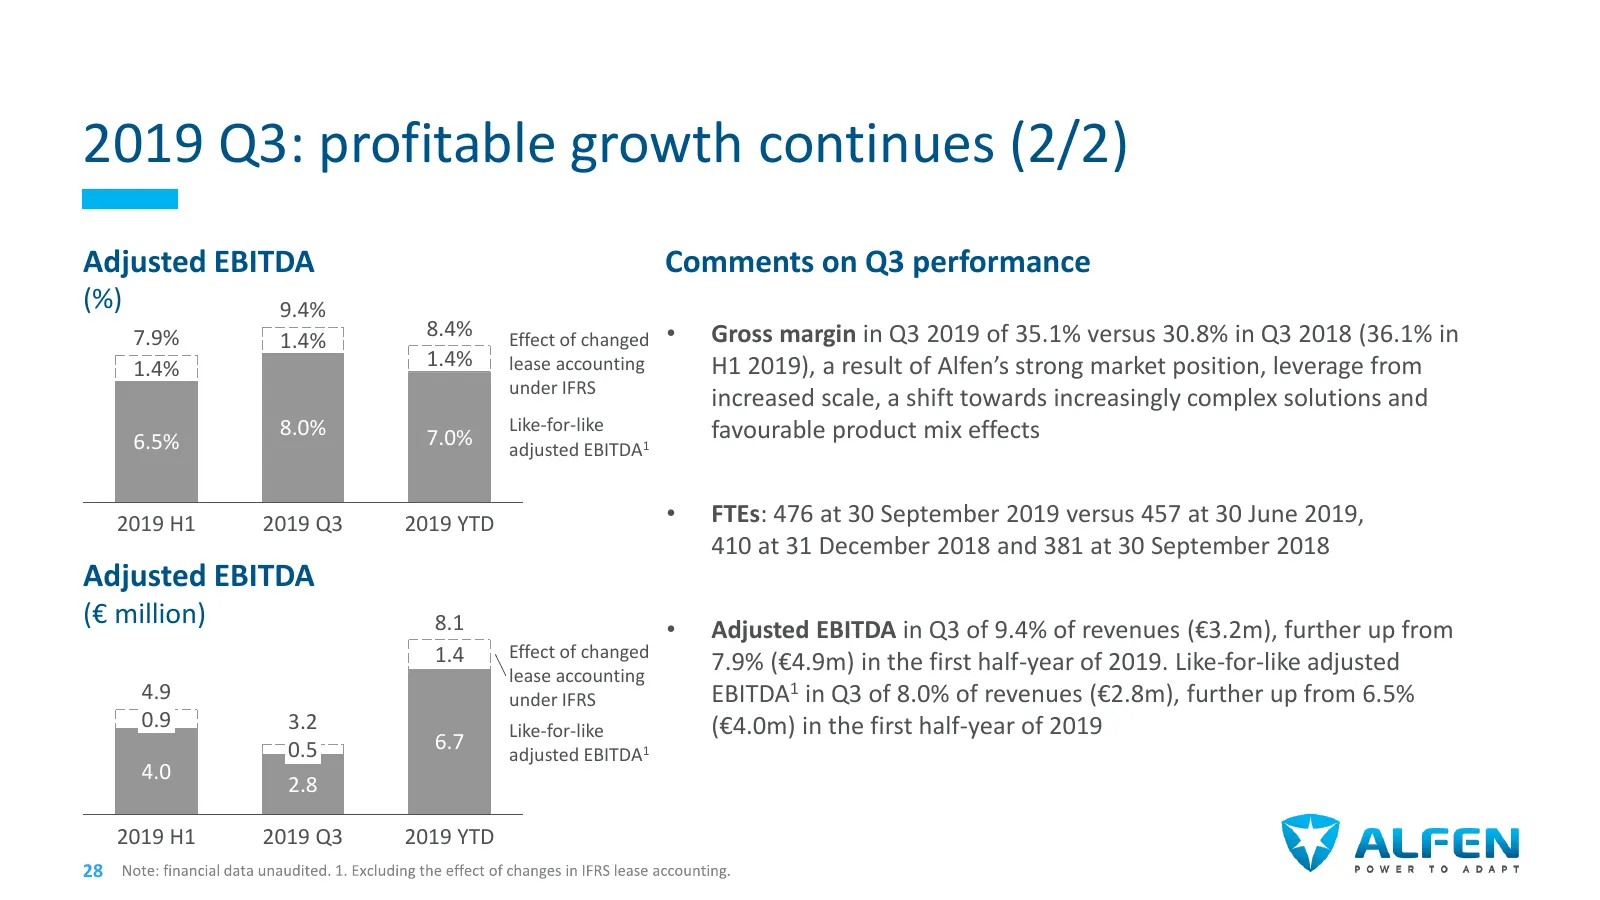
2019 Q3: profitable growth continues (2/2) Adjusted EBITDA Comments on Q3 performance (%) 9.4% 7.9% 1.4% 8.4% Effect of changed • Gross margin in Q3 2019 of 35.1% versus 30.8% in Q3 2018 (36.1% in 1.4% 1.4% lease accounting H1 2019), a result of Alfen’s strong market position, leverage from under IF
Slide 28: Outlook
Outlook • For the full year of 2019, we reconfirm our revenue outlook of €135m to €145m • For 2020 and beyond, we anticipate to further benefit from the long-term trends around the energy transition, as well as our strategy of internationalisation, cross-sell and expanding service 29
Slide 29: Q&A
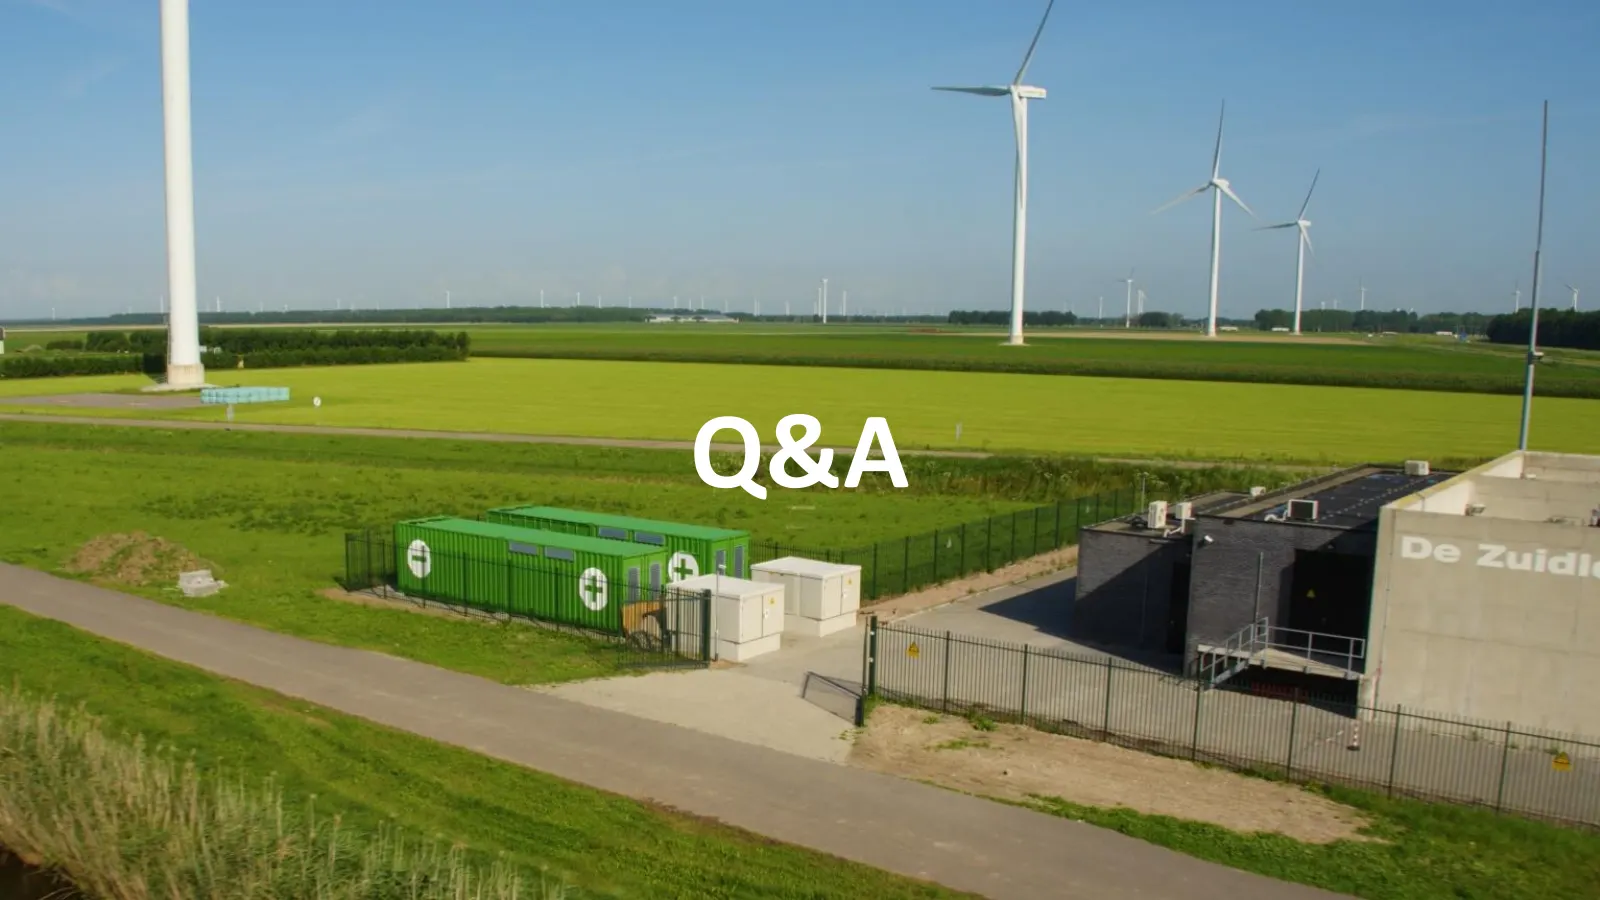
Q&A 30
Slide 30: Agenda
Agenda 09:00 Registration and welcome 09:30 Group review • Strategy recap • YTD performance and outlook 10:30 Coffee break 11:00 Business line deep dives • Smart grid solutions • EV charging • Energy storage 12:30 Wrap-up 12:45 Lunch 31
Slide 31: Agenda
Agenda 09:00 Registration and welcome 09:30 Group review • Strategy recap • YTD performance and outlook 10:30 Coffee break 11:00 Business line deep dives • Smart grid solutions • EV charging • Energy storage 12:30 Wrap-up 12:45 Lunch 32
Slide 32: Smart grid solutions' key offering: substations and microgrid projects
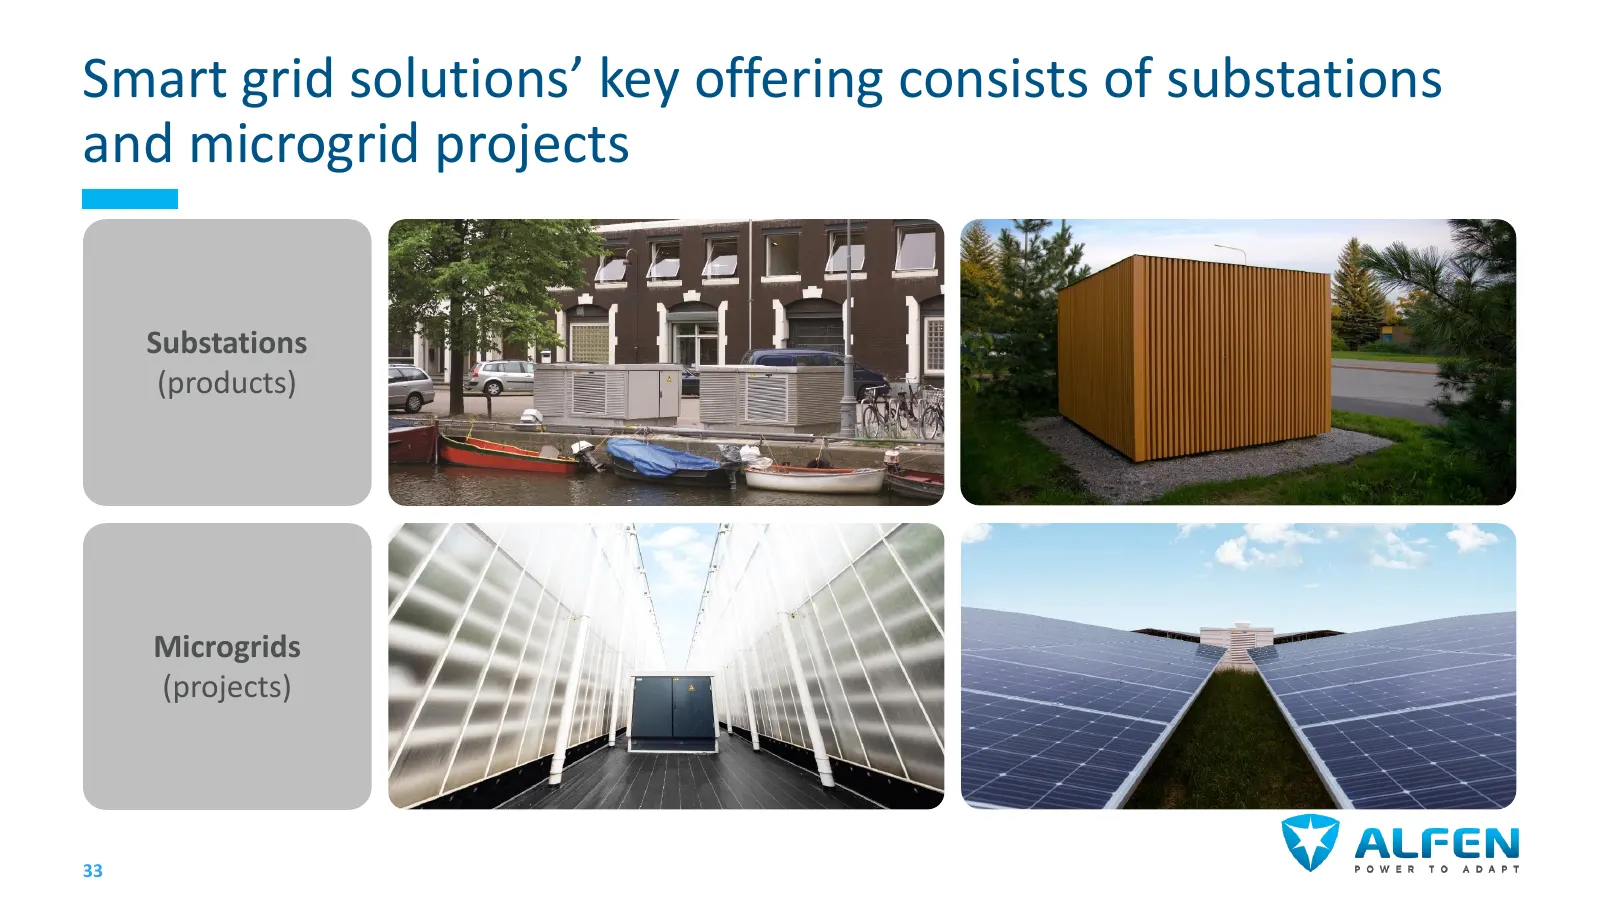
Smart grid solutions’ key offering consists of substations and microgrid projects Substations (products) Microgrids (projects) 33
Slide 33: Smart grid solutions revenues up 18% per year 2015-2018
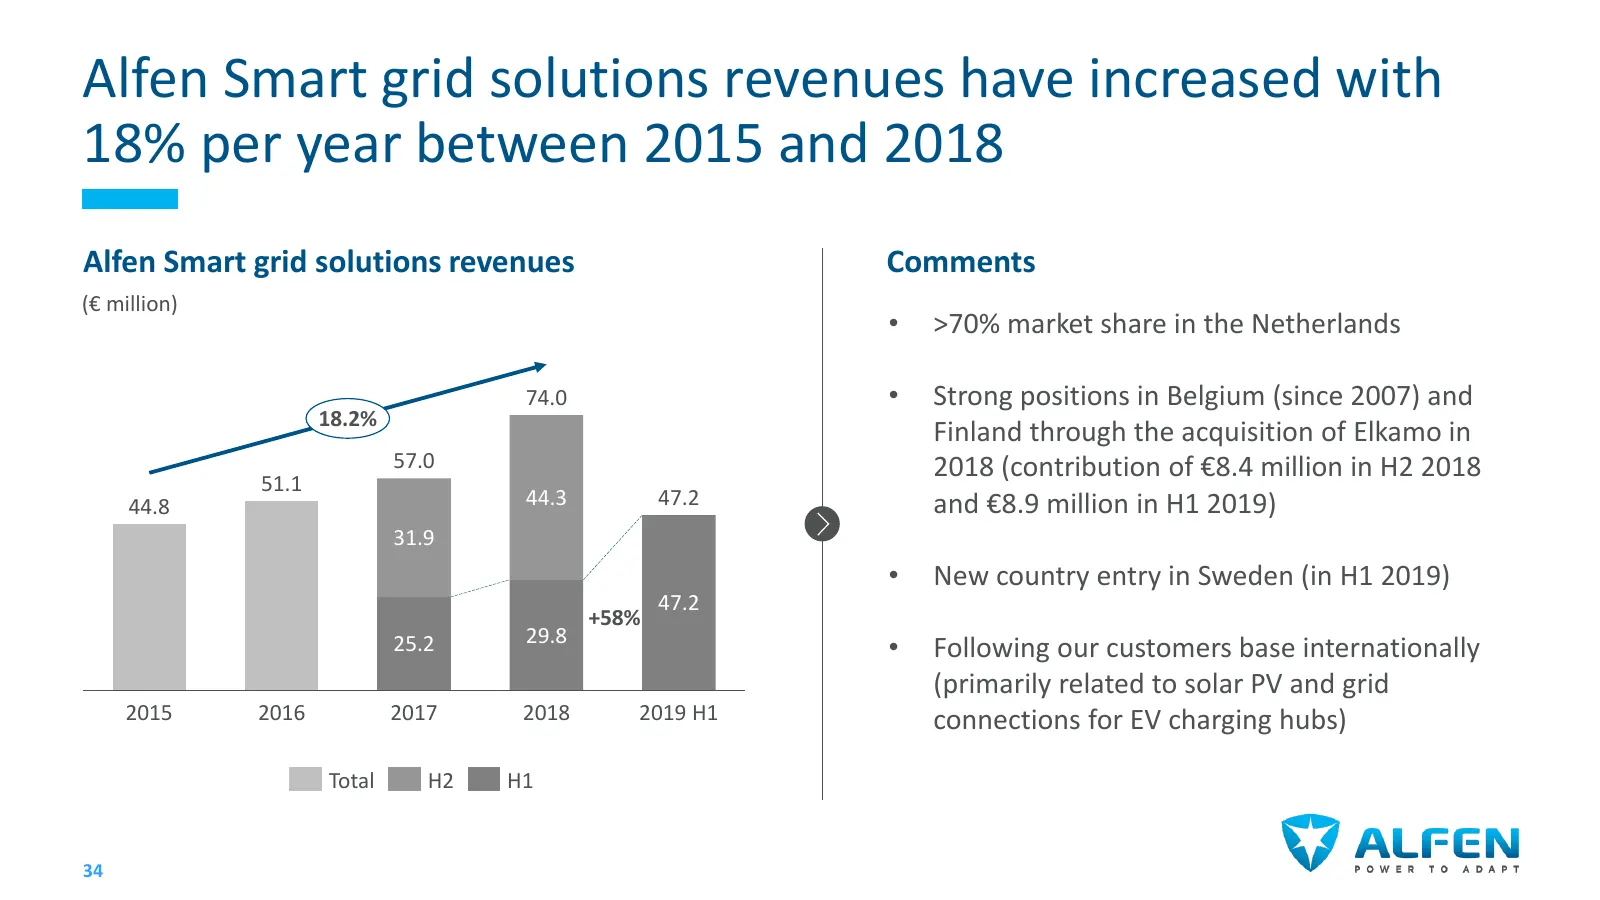
Alfen Smart grid solutions revenues have increased with 18% per year between 2015 and 2018 Alfen Smart grid solutions revenues Comments (€ million) • >70% market share in the Netherlands 74.0 • Strong positions in Belgium (since 2007) and 18.2% Finland through the acquisition of Elkamo in 57.0 2018
Slide 34: Long-term growth drivers from the energy transition
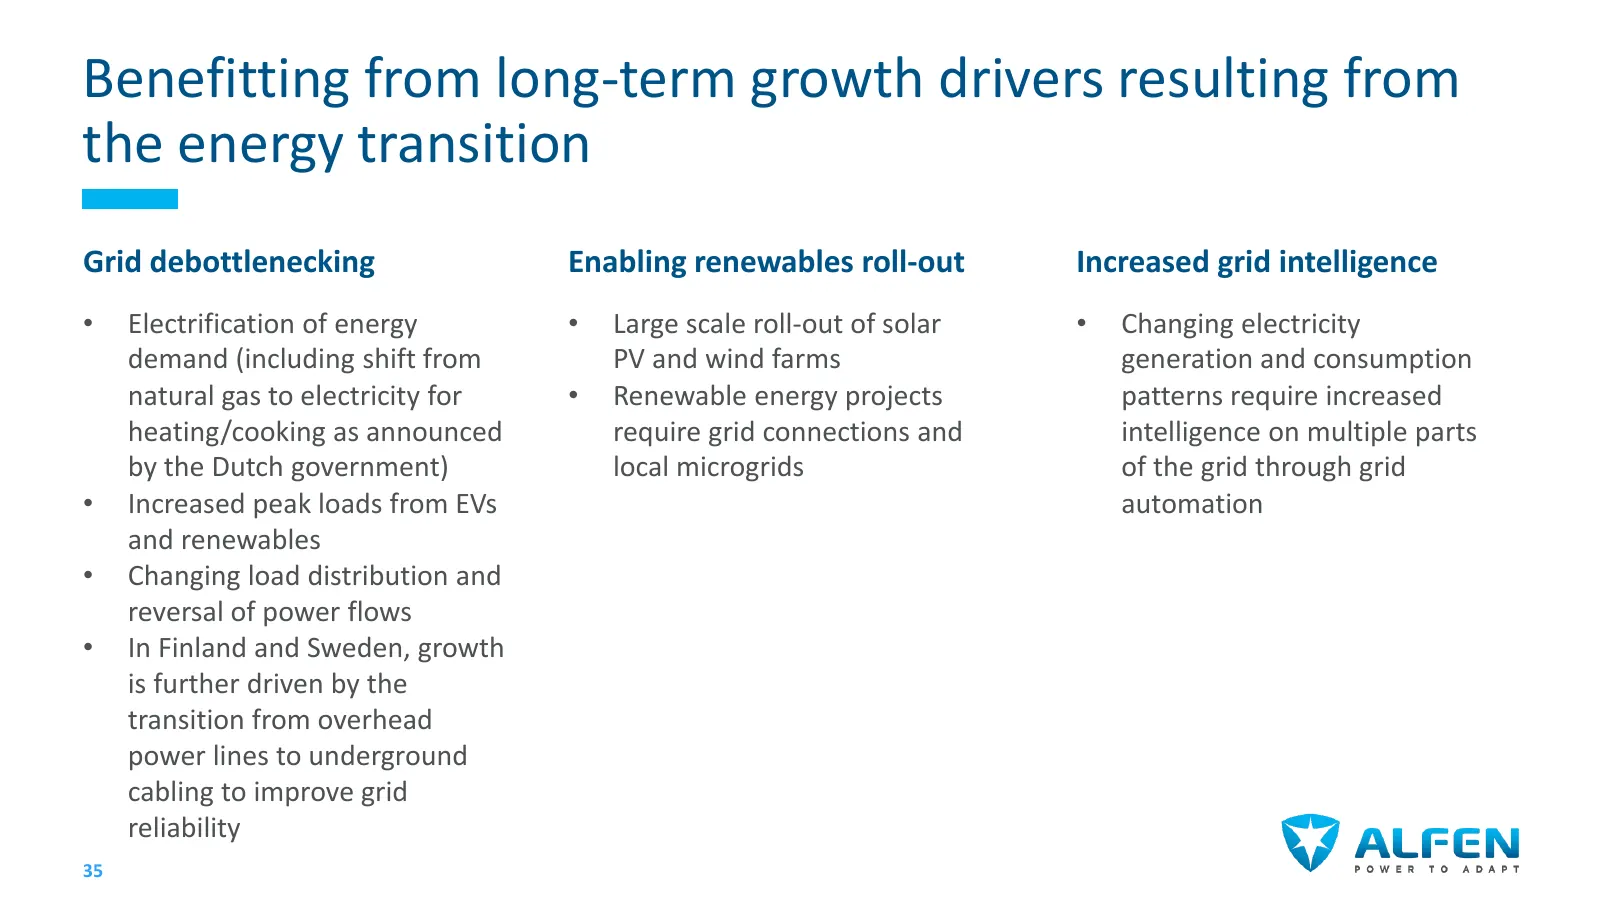
Benefitting from long-term growth drivers resulting from the energy transition Grid debottlenecking Enabling renewables roll-out Increased grid intelligence • Electrification of energy • Large scale roll-out of solar • Changing electricity demand (including shift from PV and wind farms generation an
Slide 35: Market growth rates in the range of 10-40% per year
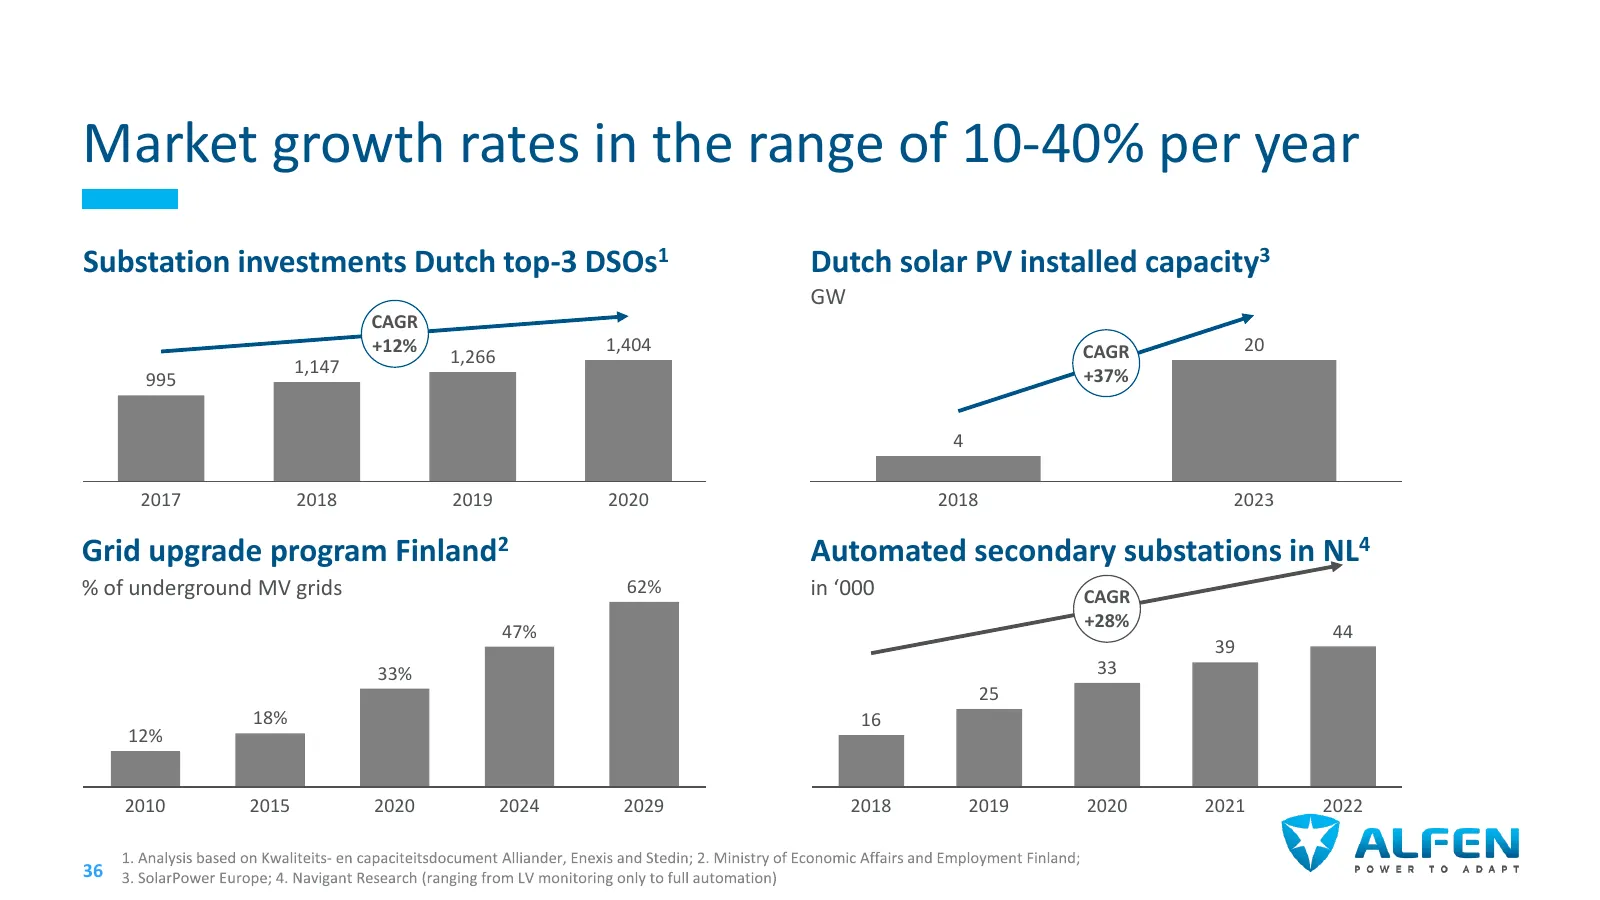
Market growth rates in the range of 10-40% per year Substation investments Dutch top-3 DSOs1 Dutch solar PV installed capacity3 GW CAGR +12% 1,404 CAGR 20 1,266 1,147 +37% 995 4 2017 2018 2019 2020 2018 2023 Grid upgrade program Finland2 Automated secondary substations in NL4 % of underground MV gri
Slide 36: Client base of Smart grid solutions increasingly diversifying
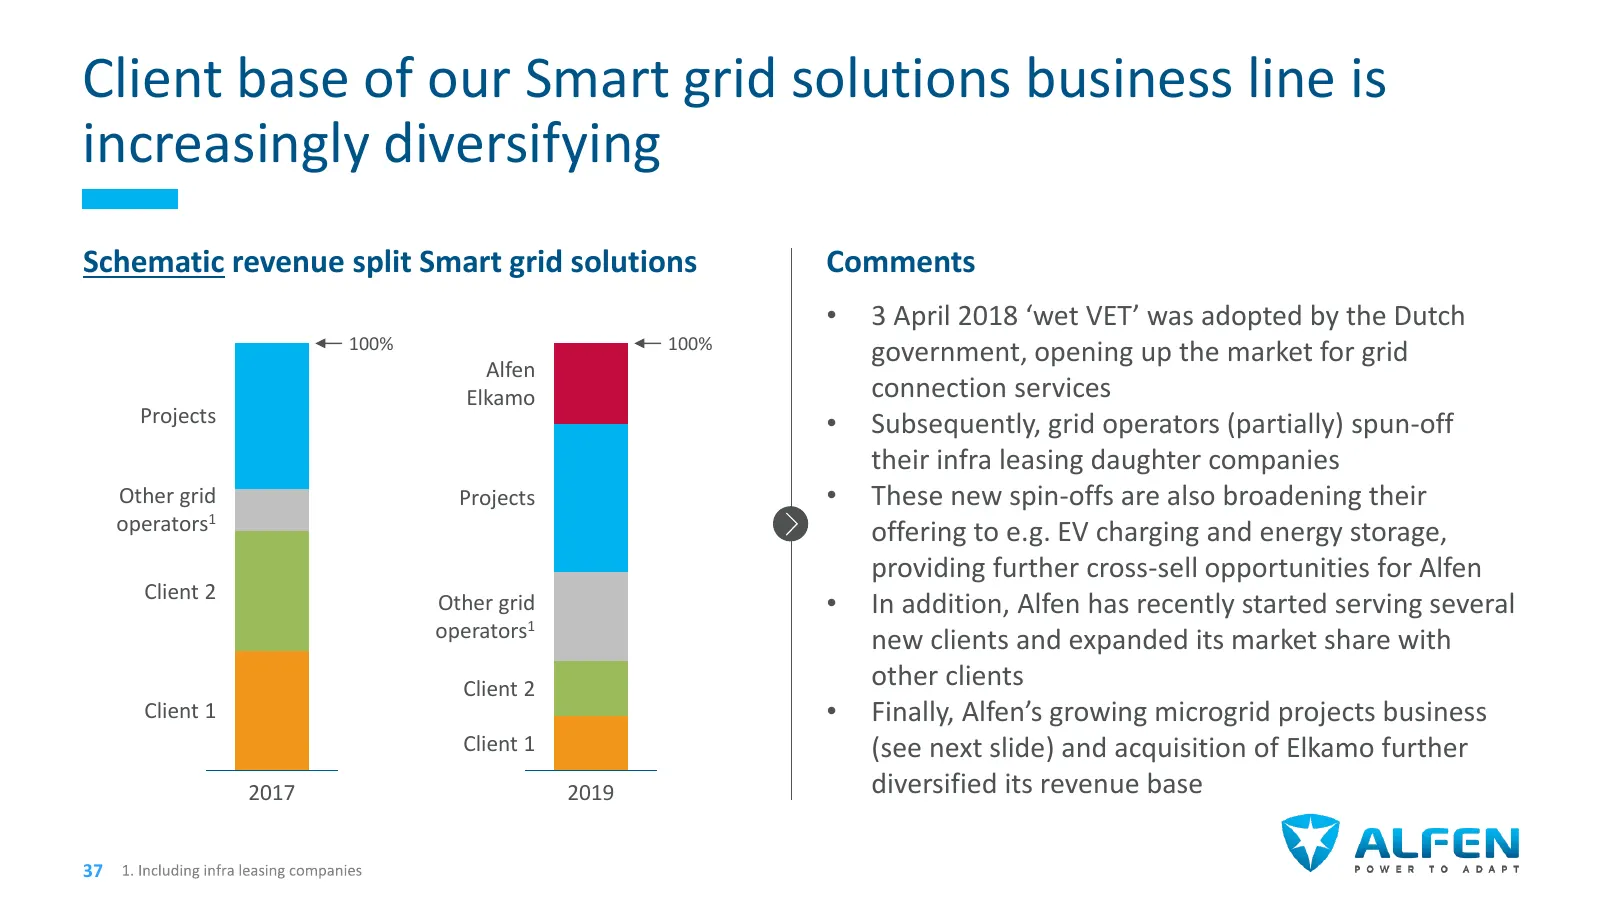
Client base of our Smart grid solutions business line is increasingly diversifying Schematic revenue split Smart grid solutions Comments • 3 April 2018 ‘wet VET’ was adopted by the Dutch 100% 100% government, opening up the market for grid Alfen Elkamo connection services Projects • Subsequently, gr
Slide 37: Microgrid projects benefitting from solar PV roll-out
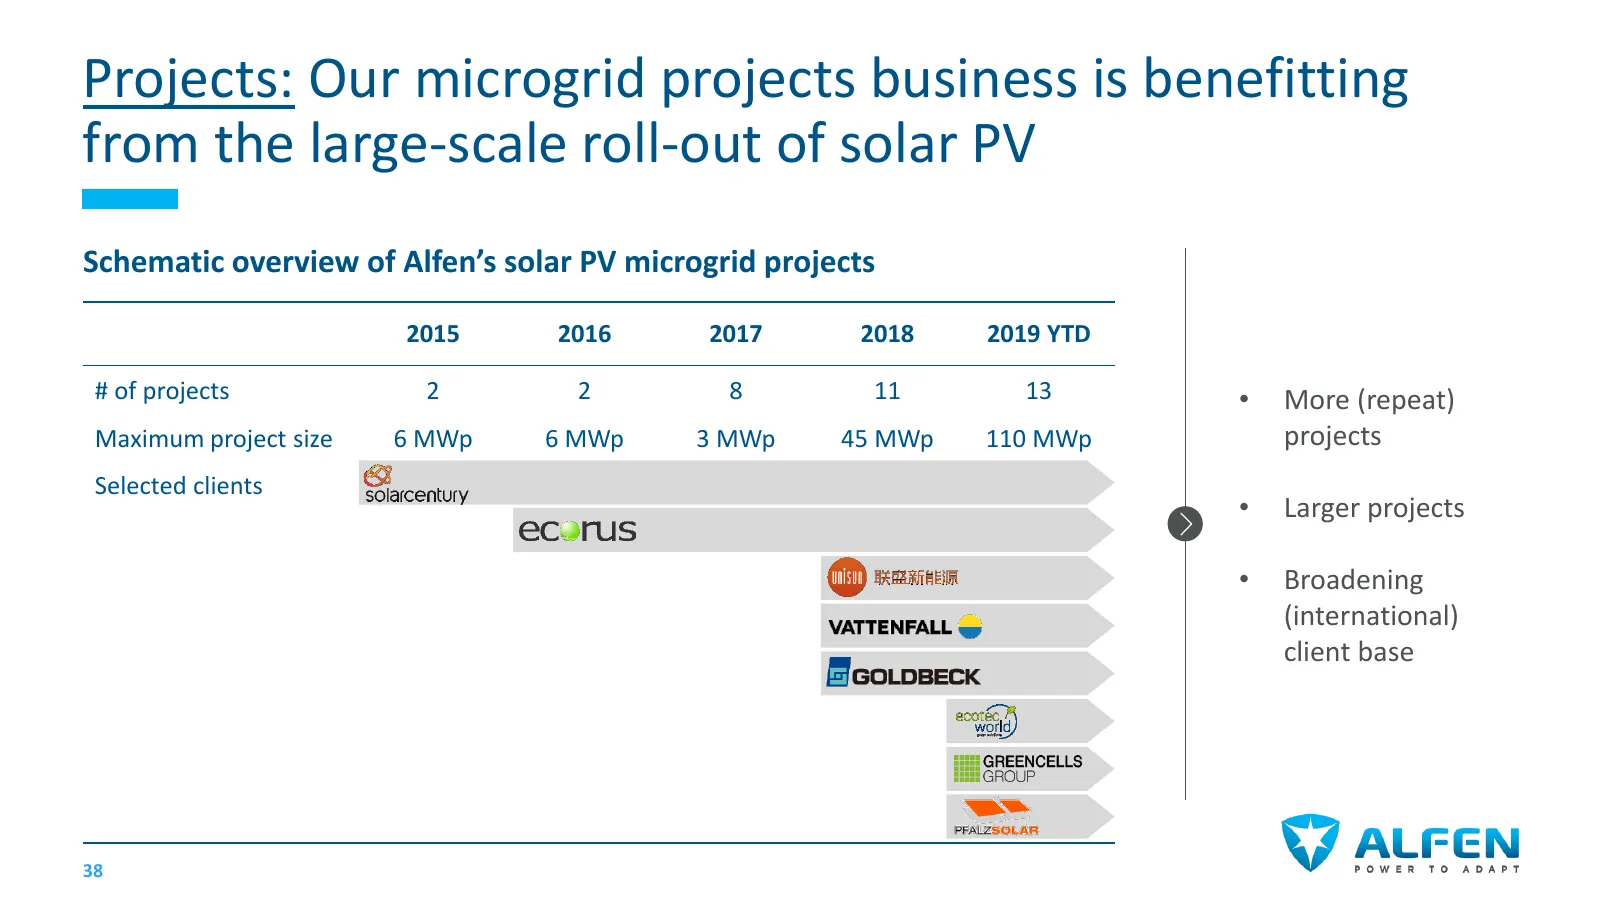
Projects: Our microgrid projects business is benefitting from the large-scale roll-out of solar PV Schematic overview of Alfen’s solar PV microgrid projects 2015 2016 2017 2018 2019 YTD # of projects 2 2 8 11 13 • More (repeat) Maximum project size 6 MWp 6 MWp 3 MWp 45 MWp 110 MWp projects Selected
Slide 38: Case study: Solarcentury
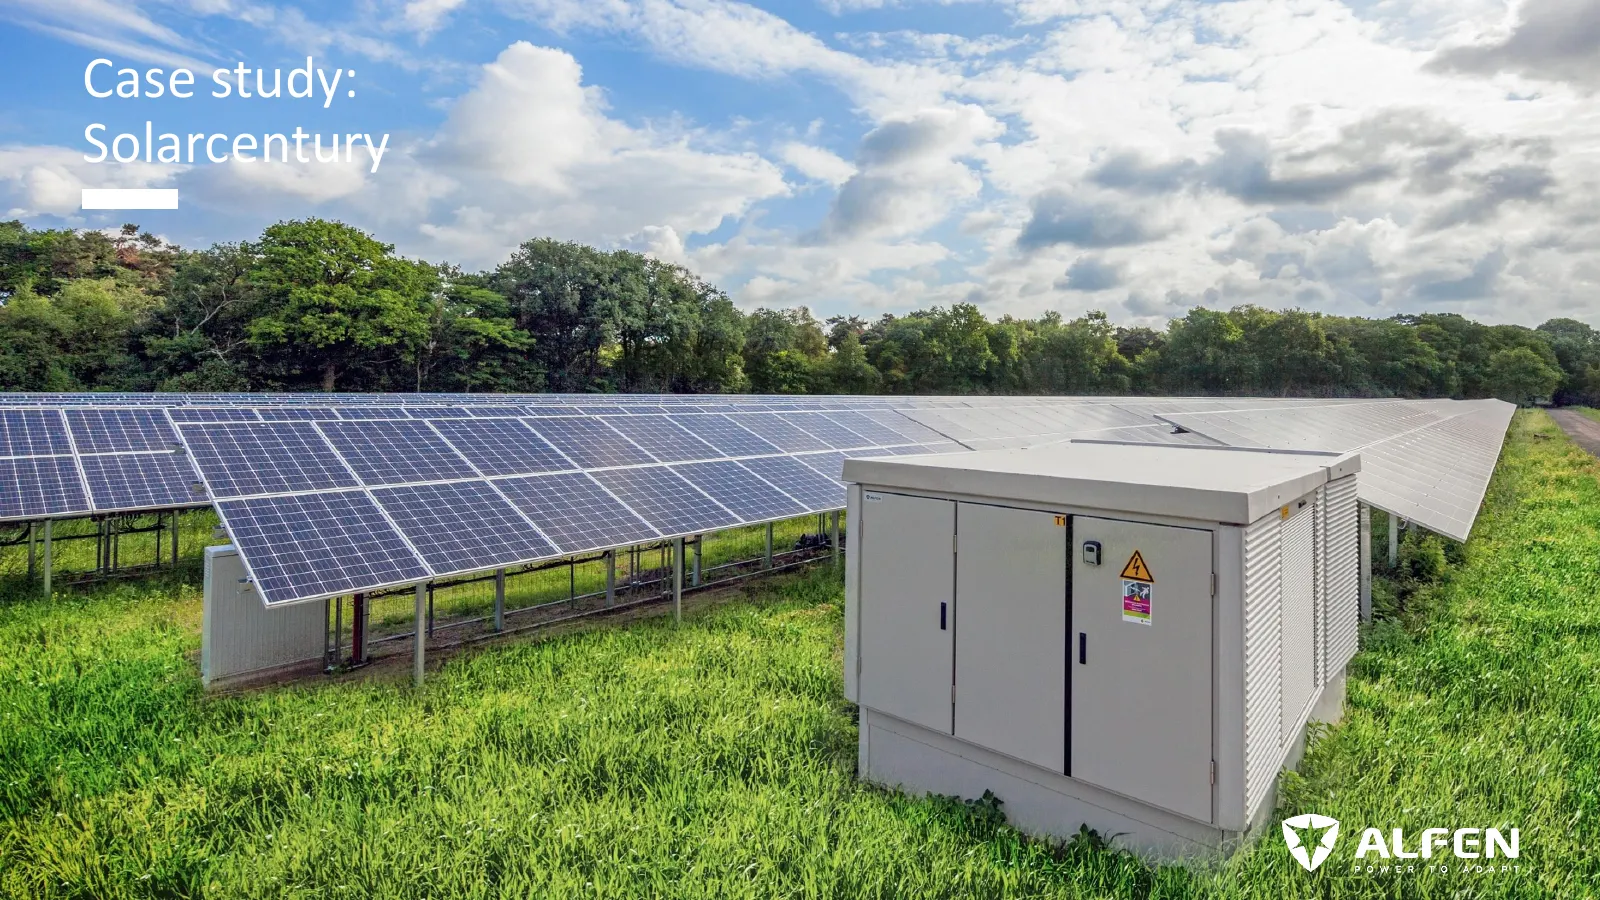
Case study: Solarcentury 39
Slide 39: Case study: Solarcentury
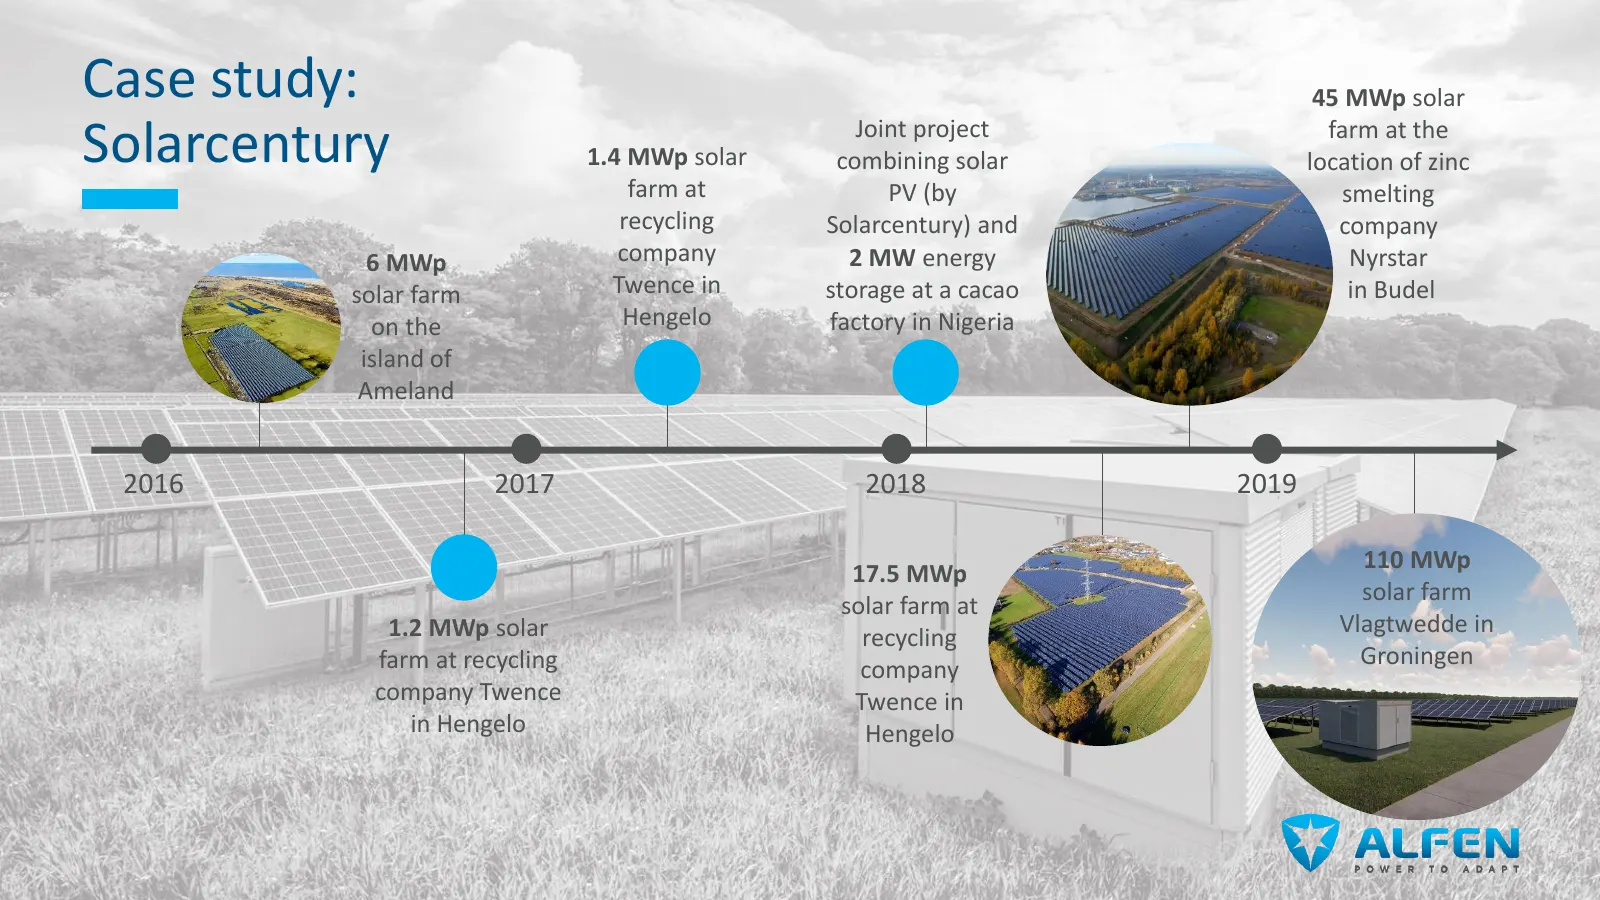
Case study: 45 MWp solar Solarcentury 1.4 MWp solar Joint project combining solar farm at the location of zinc farm at PV (by smelting recycling Solarcentury) and company 6 MWp company 2 MW energy Nyrstar solar farm Twence in storage at a cacao in Budel on the Hengelo factory in Nigeria island of Am
Slide 40: Case study: Multi-utility energy company ECW
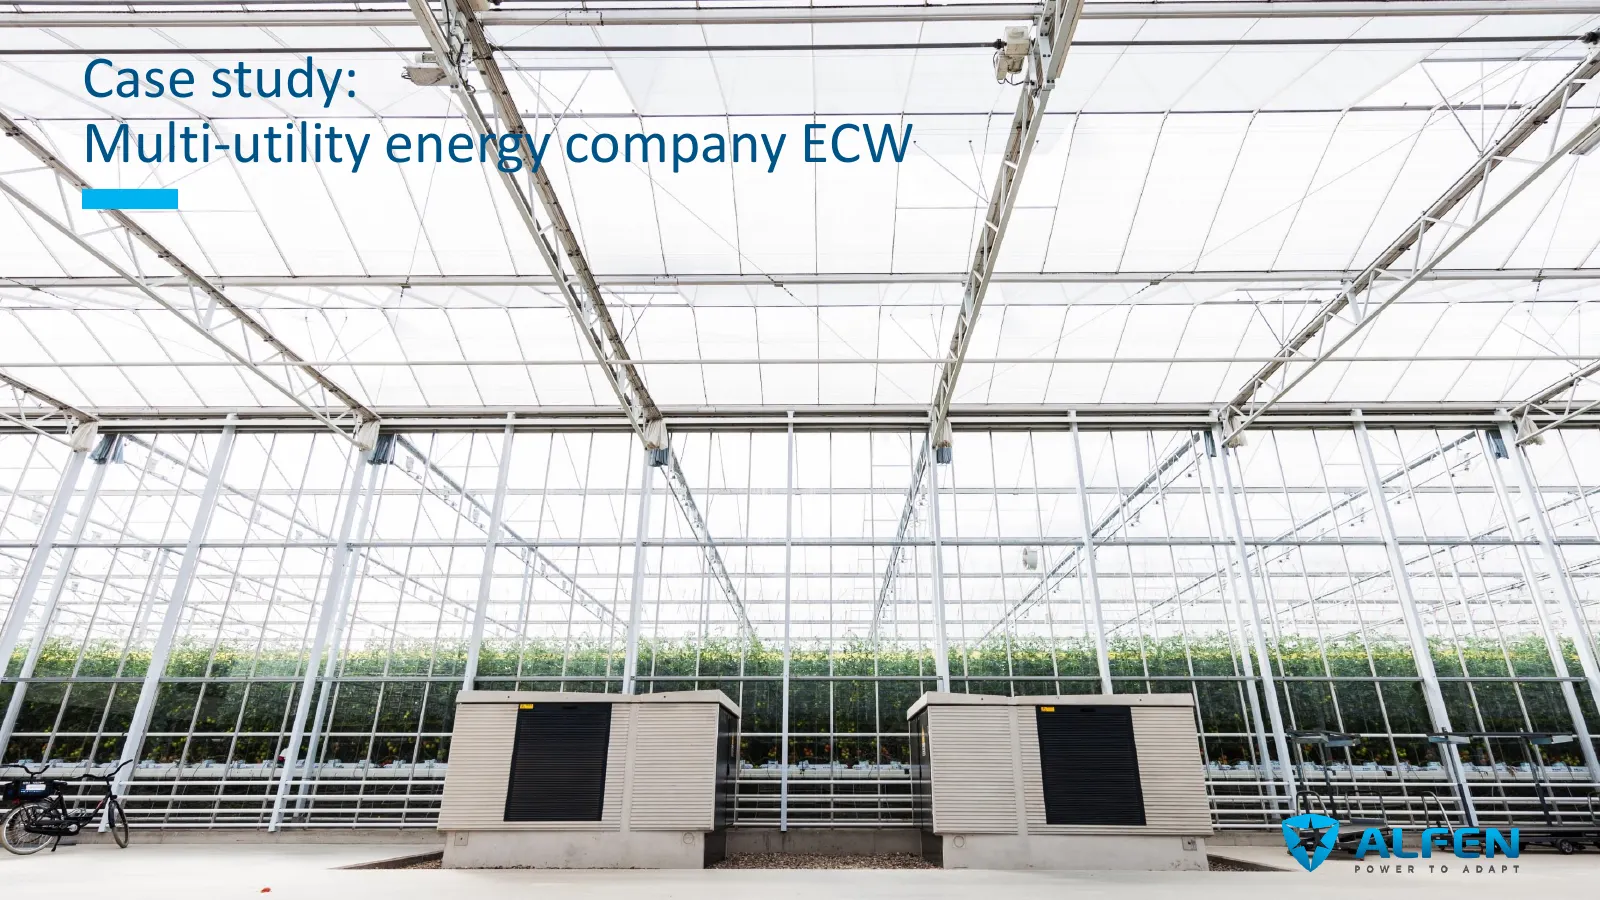
Case study: Multi-utility energy company ECW 41
Slide 41: Case study: Multi-utility energy company ECW
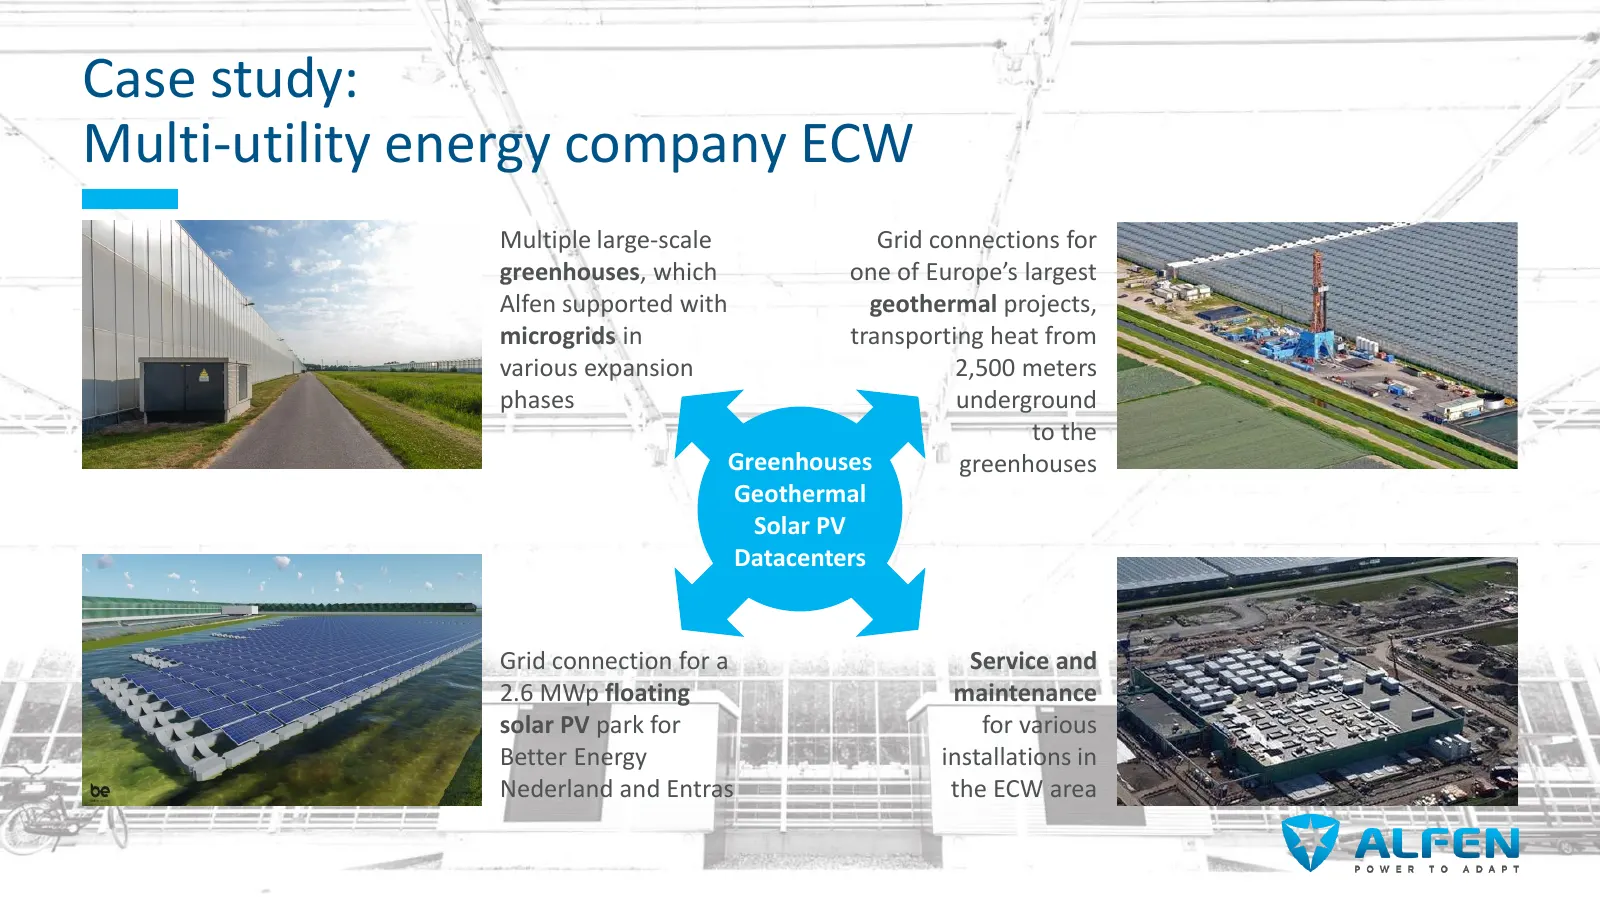
Case study: Multi-utility energy company ECW Multiple large-scale Grid connections for greenhouses, which one of Europe’s largest Alfen supported with geothermal projects, microgrids in transporting heat from various expansion 2,500 meters phases underground to the Greenhouses greenhouses Geothermal
Slide 42: Overview facilities Smart grid solutions
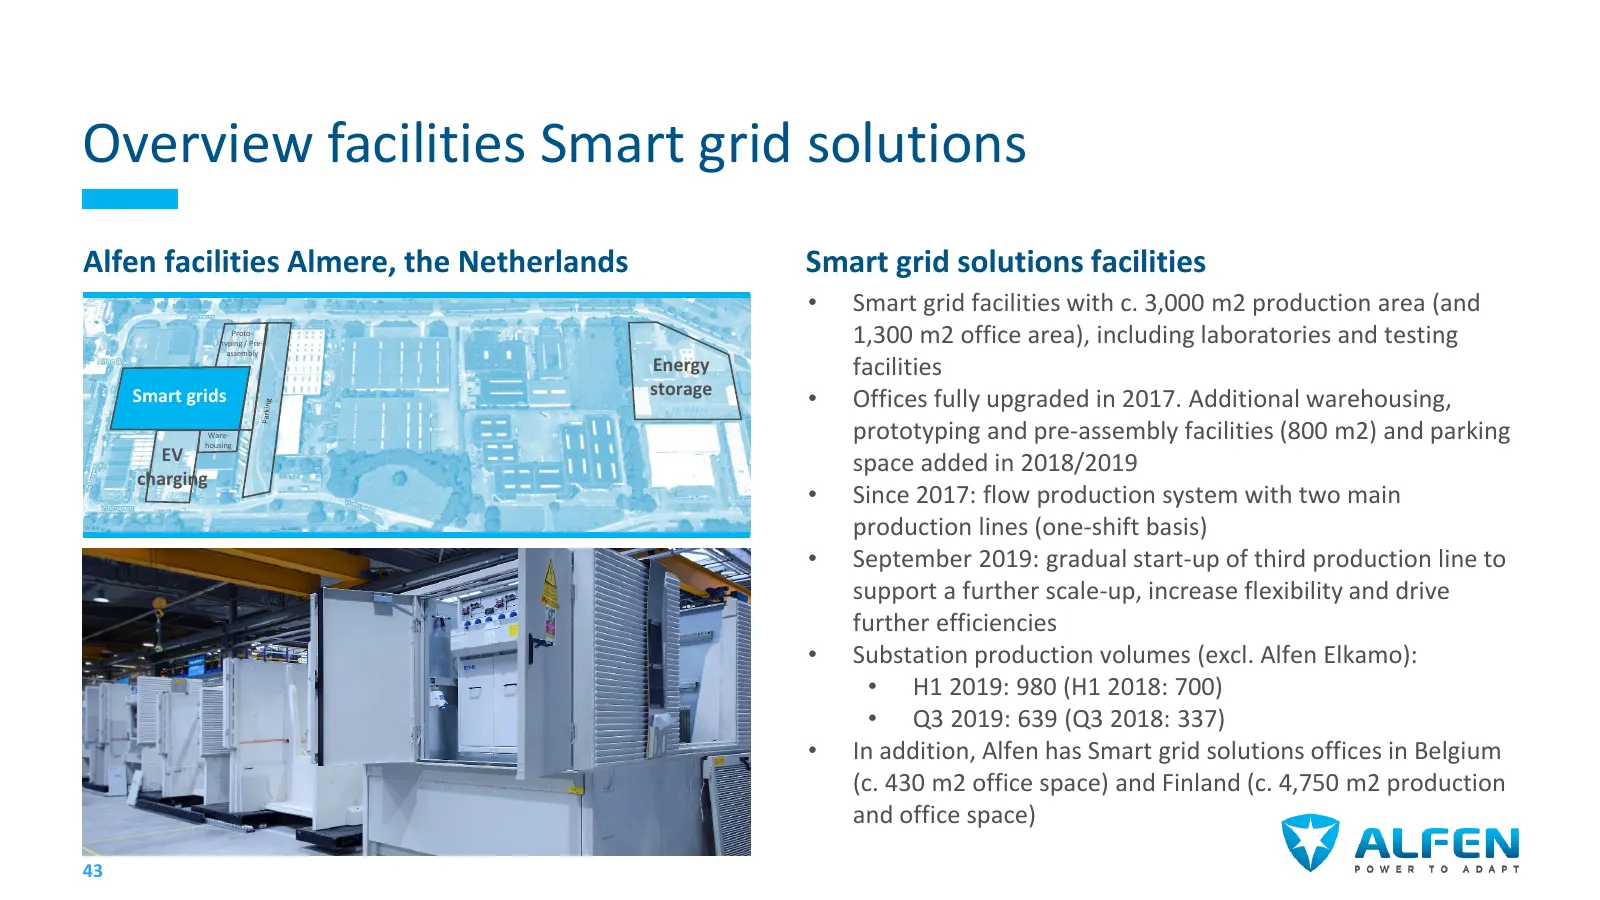
Overview facilities Smart grid solutions Alfen facilities Almere, the Netherlands Smart grid solutions facilities • Smart grid facilities with c. 3,000 m2 production area (and Proto- typing / Pre- assembly 1,300 m2 office area), including laboratories and testing Energy facilities storage Smart grid
Slide 43: Focus on continuous innovation
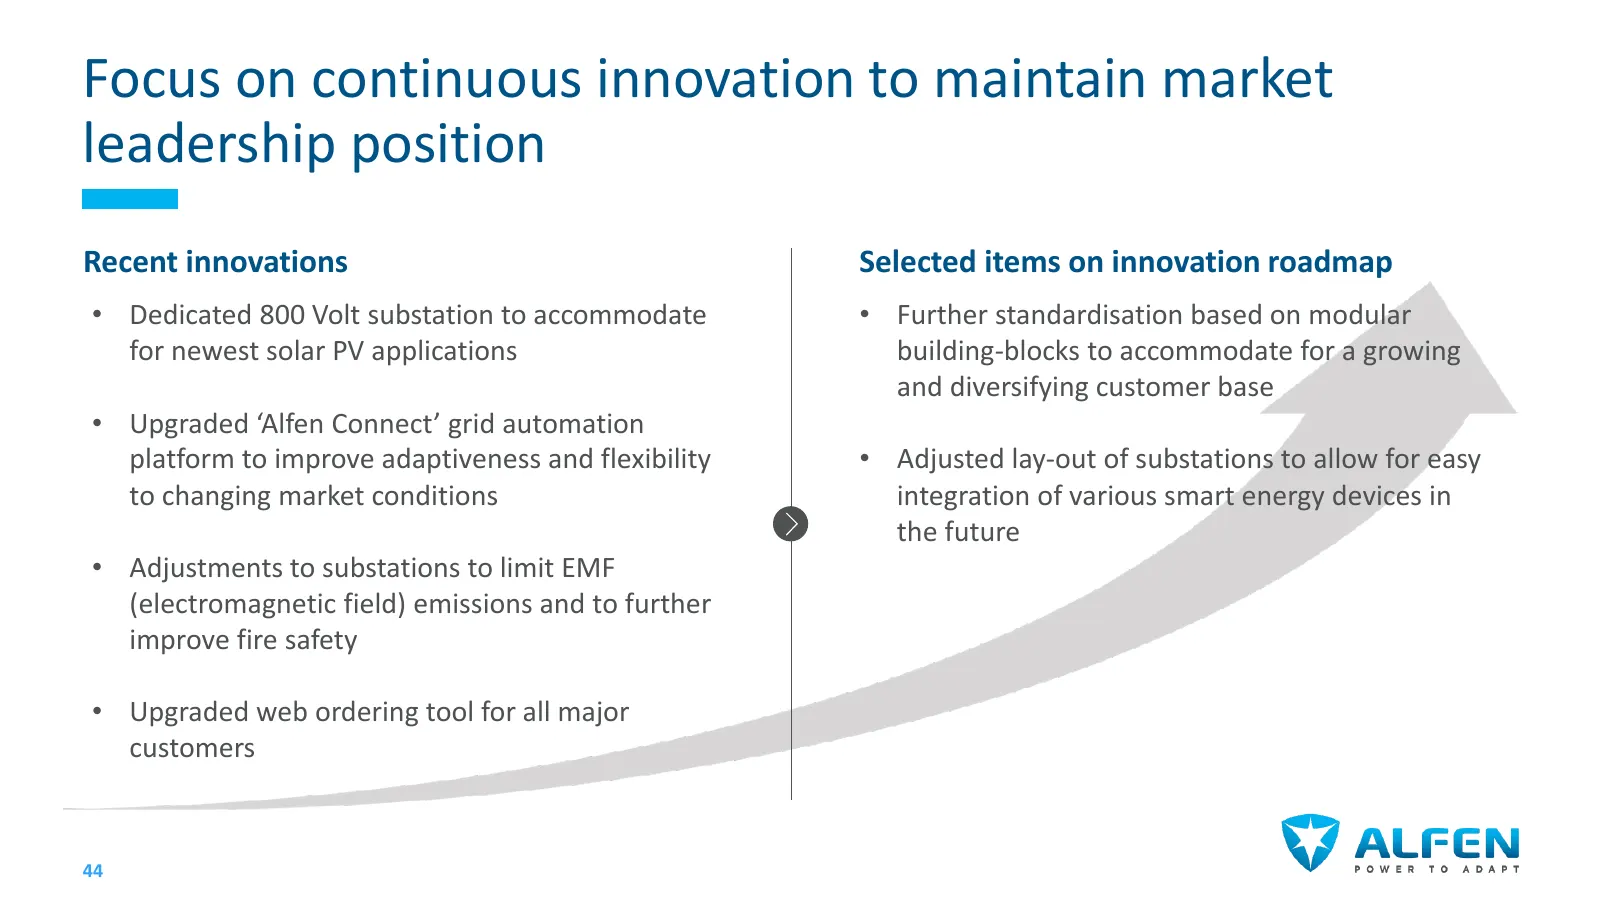
Focus on continuous innovation to maintain market leadership position Recent innovations Selected items on innovation roadmap • Dedicated 800 Volt substation to accommodate • Further standardisation based on modular for newest solar PV applications building-blocks to accommodate for a growing and di
Slide 44: Summary of strategic focus
Summary of strategic focus Maintain strong market positions in the Netherlands, Belgium and Finland Further grow internationally in Sweden and selectively in other countries (‘follow-our-customer’ approach) Smart grid solutions Capture increasing share of service revenues from growing installed base
Slide 45: Q&A
Q&A 46
Slide 46: Agenda
Agenda 09:00 Registration and welcome 09:30 Group review • Strategy recap • YTD performance and outlook 10:30 Coffee break 11:00 Business line deep dives • Smart grid solutions • EV charging • Energy storage 12:30 Wrap-up 12:45 Lunch 47
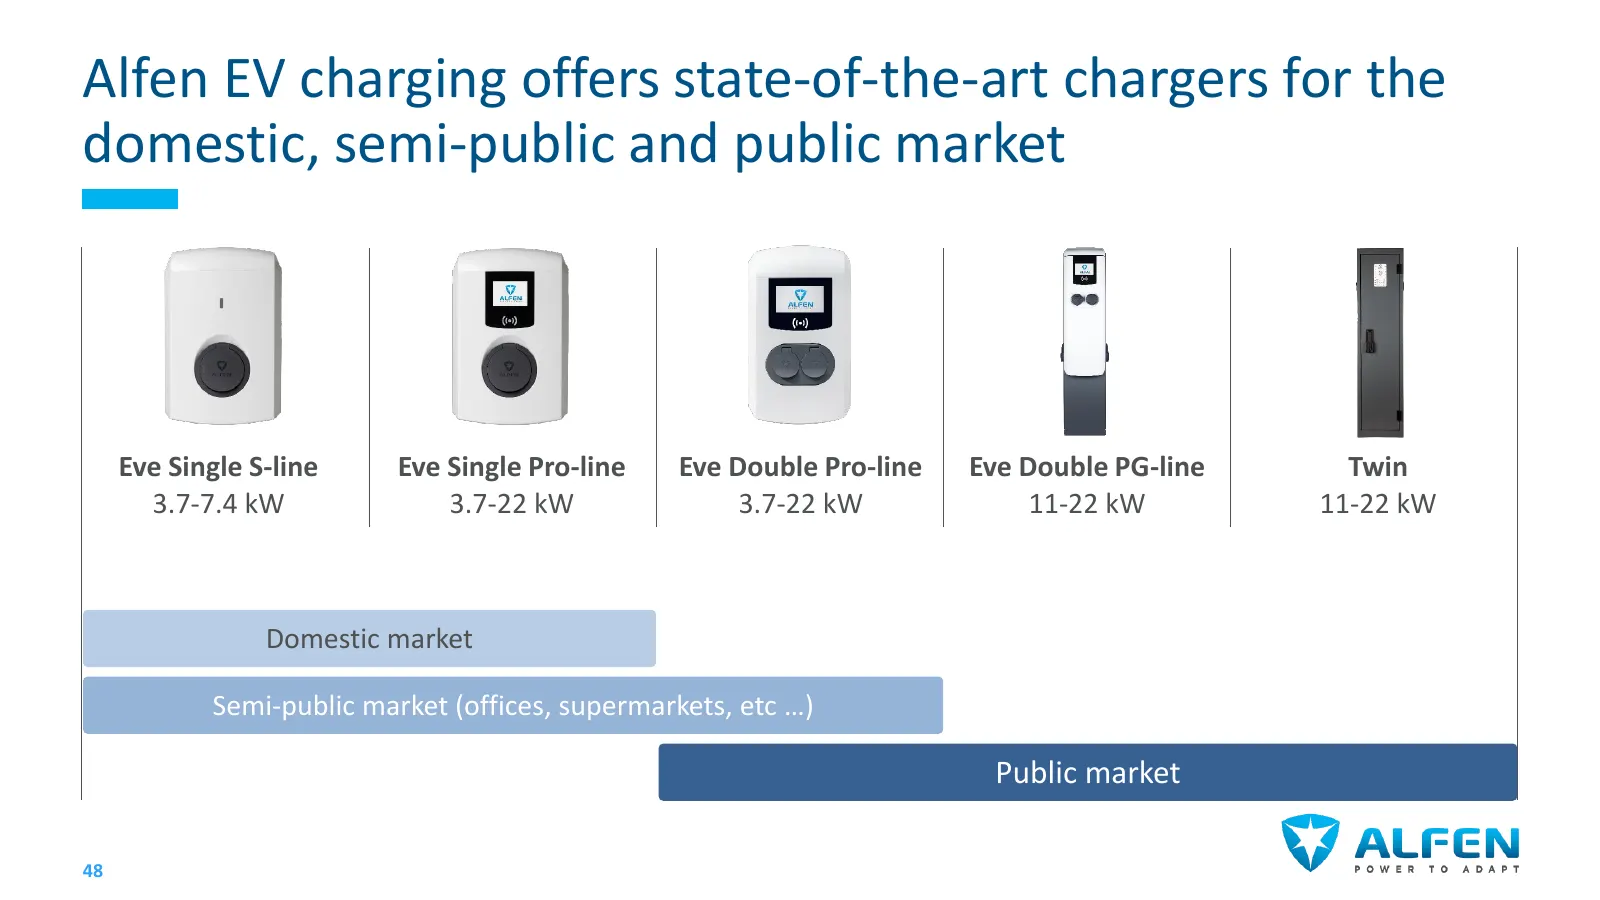
Slide 47: Alfen EV charging offers state-of-the-art chargers
Alfen EV charging offers state-of-the-art chargers for the domestic, semi-public and public market Eve Single S-line Eve Single Pro-line Eve Double Pro-line Eve Double PG-line Twin 3.7-7.4 kW 3.7-22 kW 3.7-22 kW 11-22 kW 11-22 kW Domestic market Semi-public market (offices, supermarkets, etc …) Publ
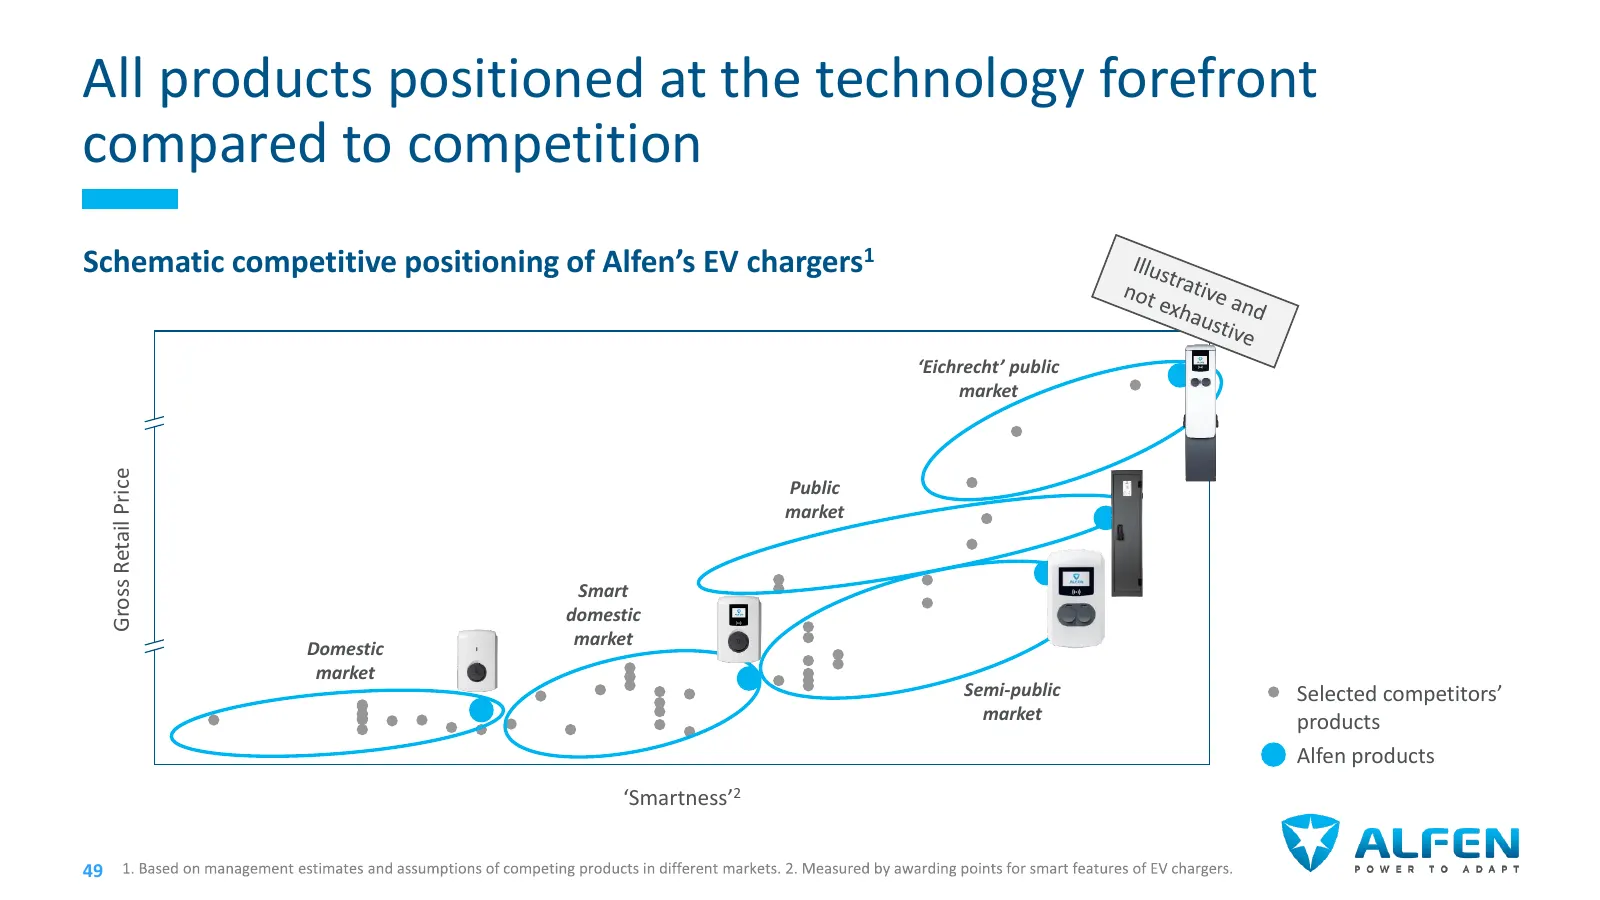
Slide 48: All products positioned at the technology forefront
All products positioned at the technology forefront compared to competition Schematic competitive positioning of Alfen’s EV chargers1 ‘Eichrecht’ public market Gross Retail Price Public market Smart domestic market Domestic market Semi-public Selected competitors’ market products Alfen products ‘Sma
Slide 49: EV charging equipment revenues up 29% per year
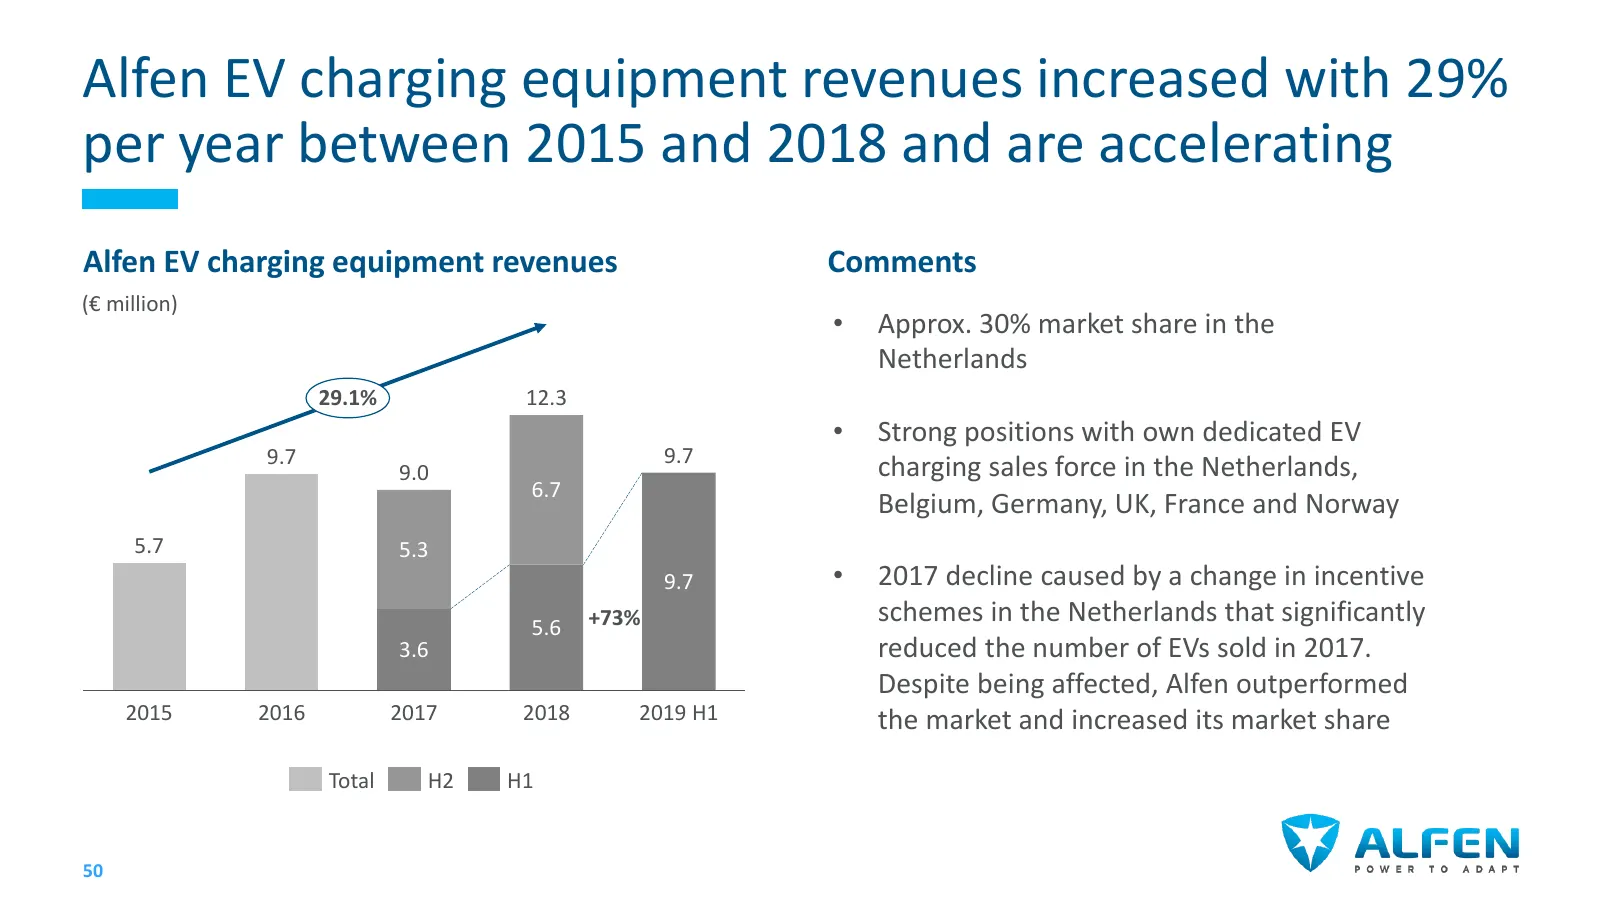
Alfen EV charging equipment revenues increased with 29% per year between 2015 and 2018 and are accelerating Alfen EV charging equipment revenues Comments (€ million) • Approx. 30% market share in the Netherlands 29.1% 12.3 • Strong positions with own dedicated EV 9.7 9.7 9.0 charging sales force in
Slide 50: Growth supported by fundamental drivers and government incentives
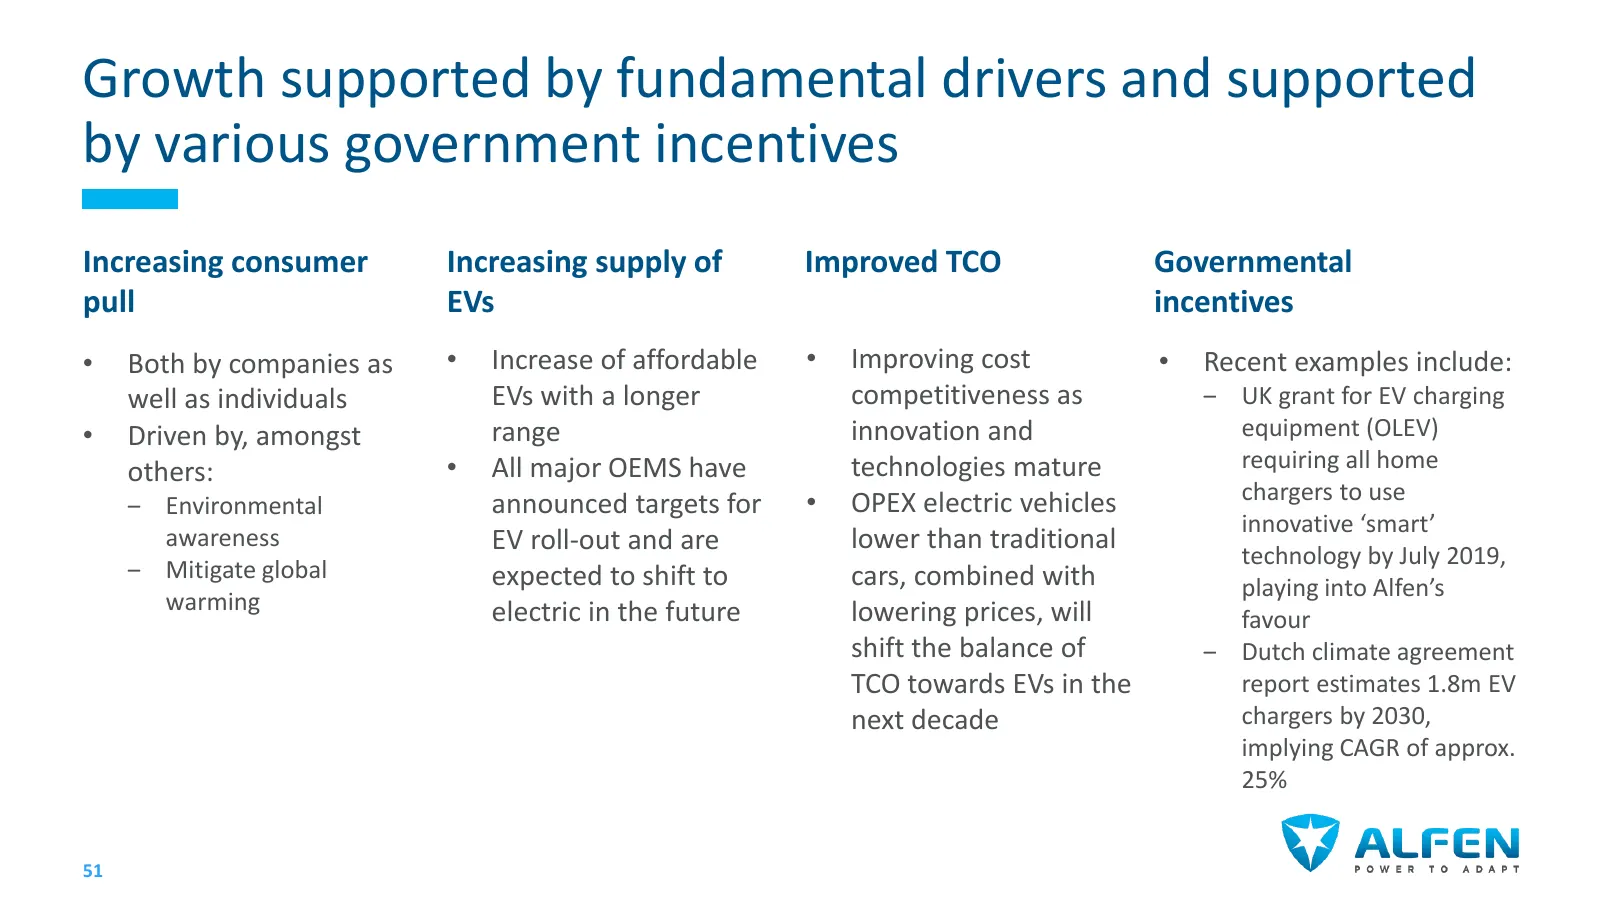
Growth supported by fundamental drivers and supported by various government incentives Increasing consumer Increasing supply of Improved TCO Governmental pull EVs incentives • Both by companies as • Increase of affordable • Improving cost • Recent examples include: well as individuals EVs with a lon
Slide 51: Market growth rates for EV charge points around 23%
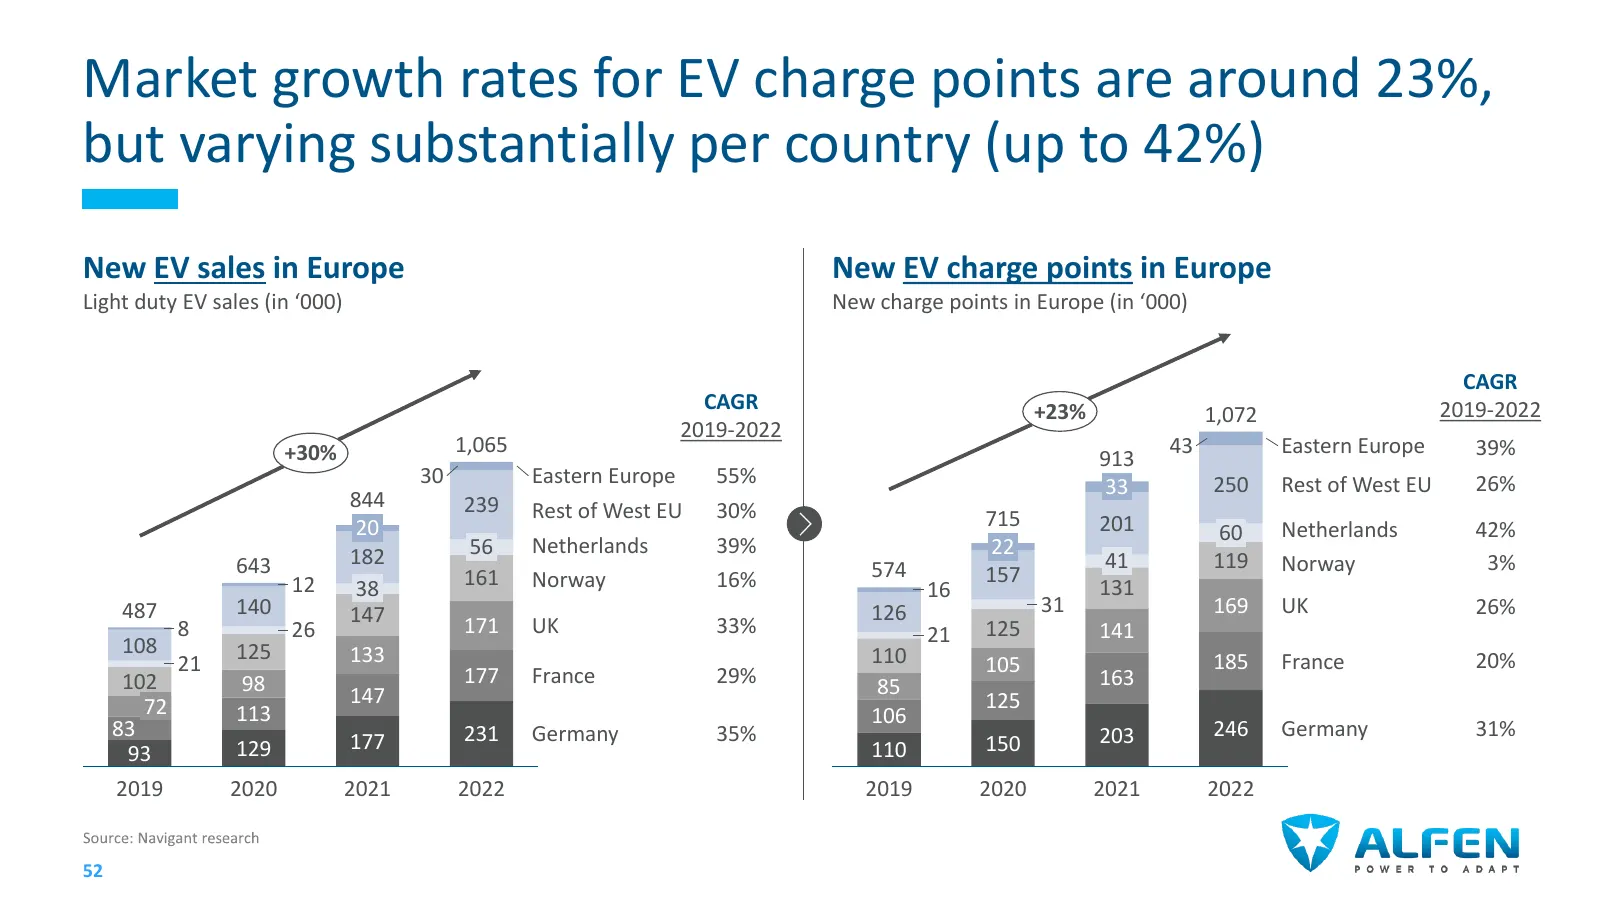
Market growth rates for EV charge points are around 23%, but varying substantially per country (up to 42%) New EV sales in Europe New EV charge points in Europe Light duty EV sales (in ‘000) New charge points in Europe (in ‘000) CAGR CAGR +23% 2019-2022 1,072 2019-2022 +30% 1,065 43 Eastern Europe 3
Slide 52: Domestic EV charging market expected to remain dominant
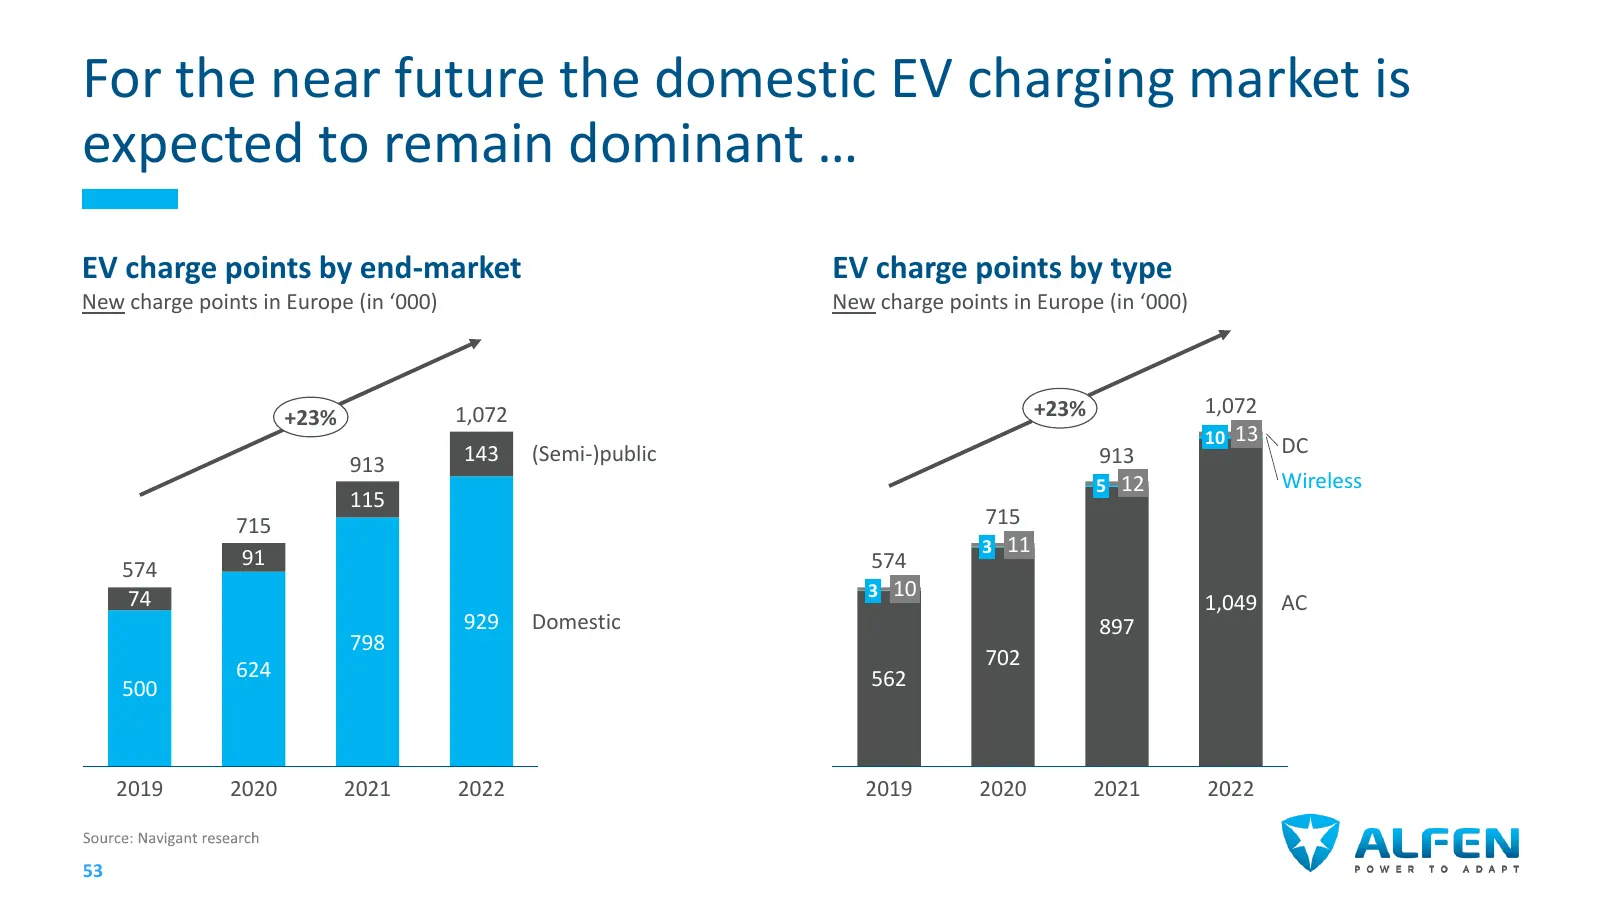
For the near future the domestic EV charging market is expected to remain dominant … EV charge points by end-market EV charge points by type New charge points in Europe (in ‘000) New charge points in Europe (in ‘000) +23% 1,072 +23% 1,072 10 13 DC 913 143 (Semi-)public 913 5 12 Wireless 115 715 715
Slide 53: Public charging largest market segment in 2030
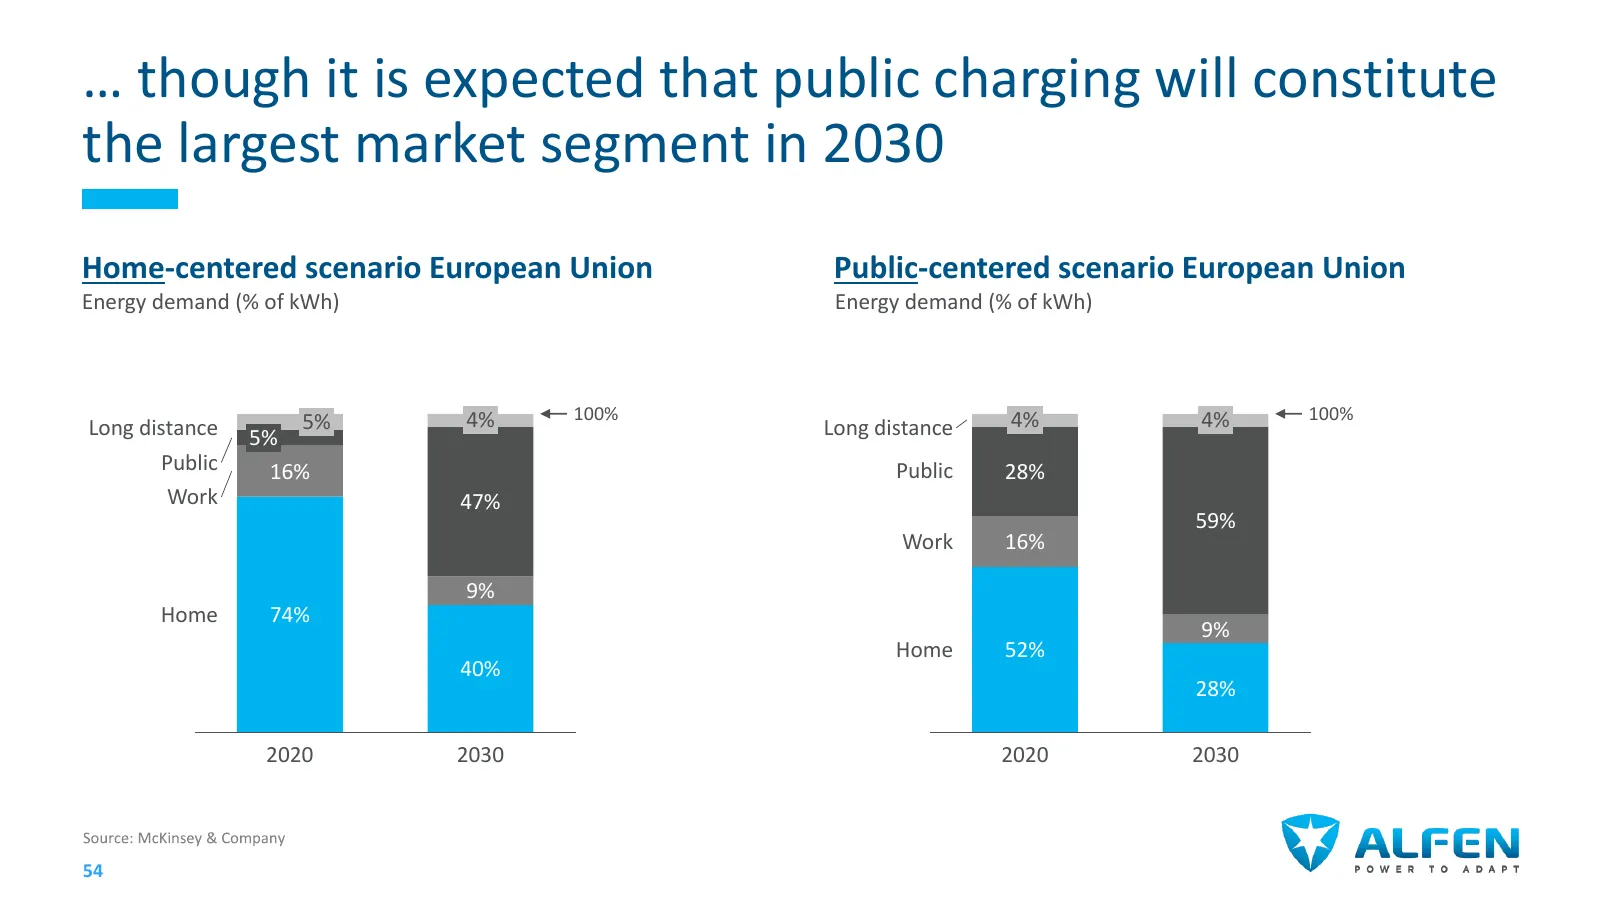
… though it is expected that public charging will constitute the largest market segment in 2030 Home-centered scenario European Union Public-centered scenario European Union Energy demand (% of kWh) Energy demand (% of kWh) 5% 4% 100% 4% 4% 100% Long distance 5% Long distance Public 16% Public 28% W
Slide 54: Client base growing steadily and diversifying
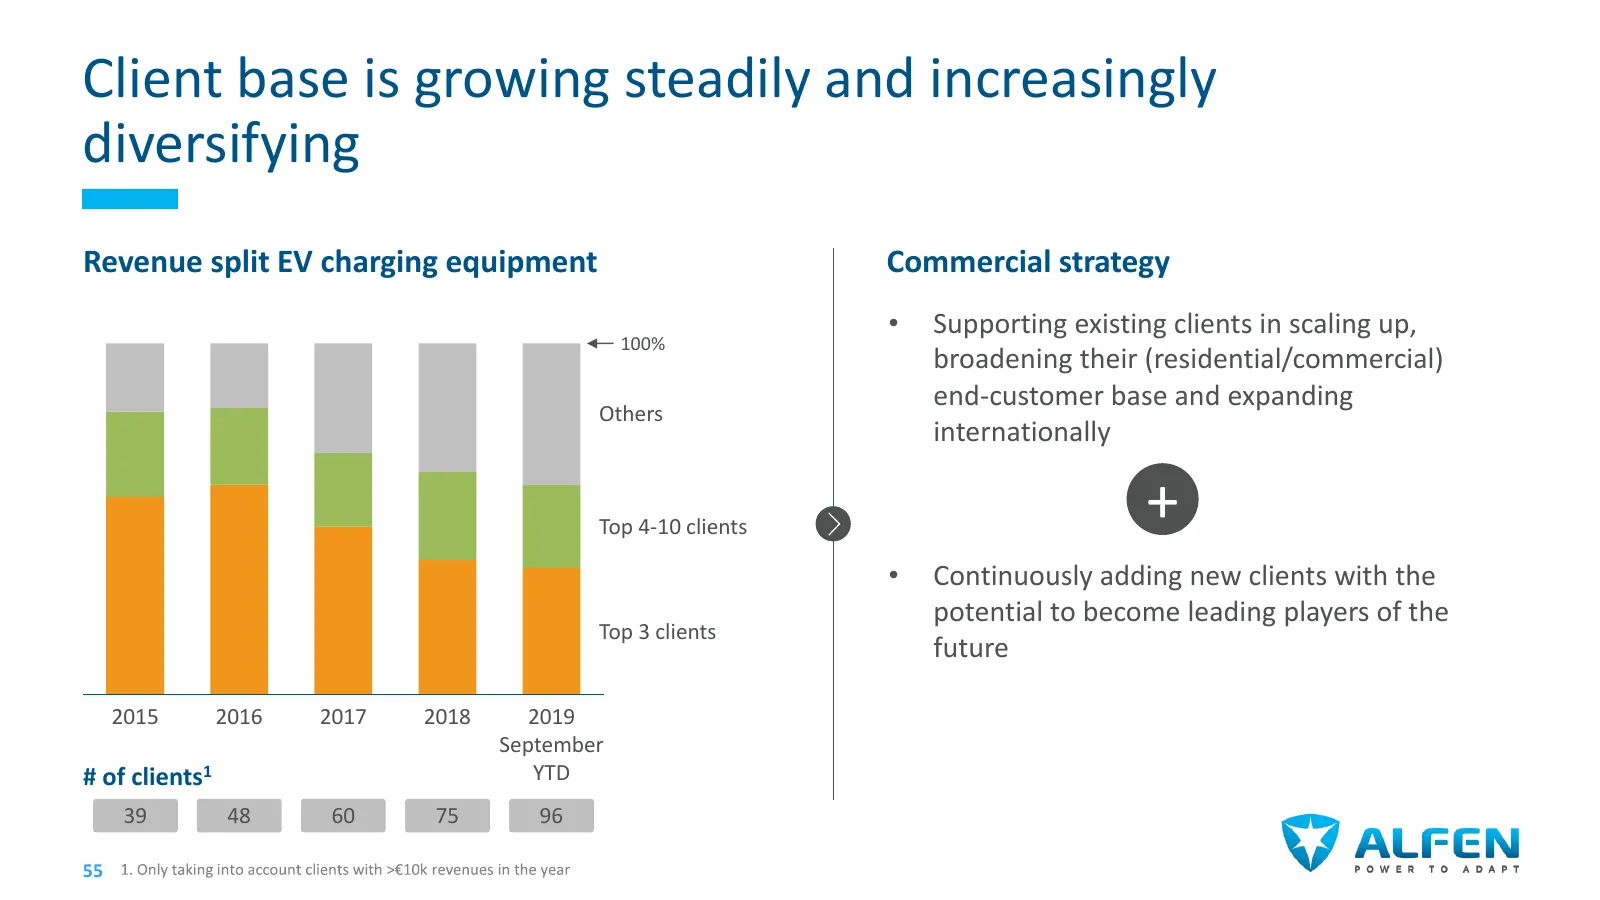
Client base is growing steadily and increasingly diversifying Revenue split EV charging equipment Commercial strategy • Supporting existing clients in scaling up, 100% broadening their (residential/commercial) end-customer base and expanding Others internationally Top 4-10 clients + • Continuously a
Slide 55: Geographical footprint covers all relevant markets
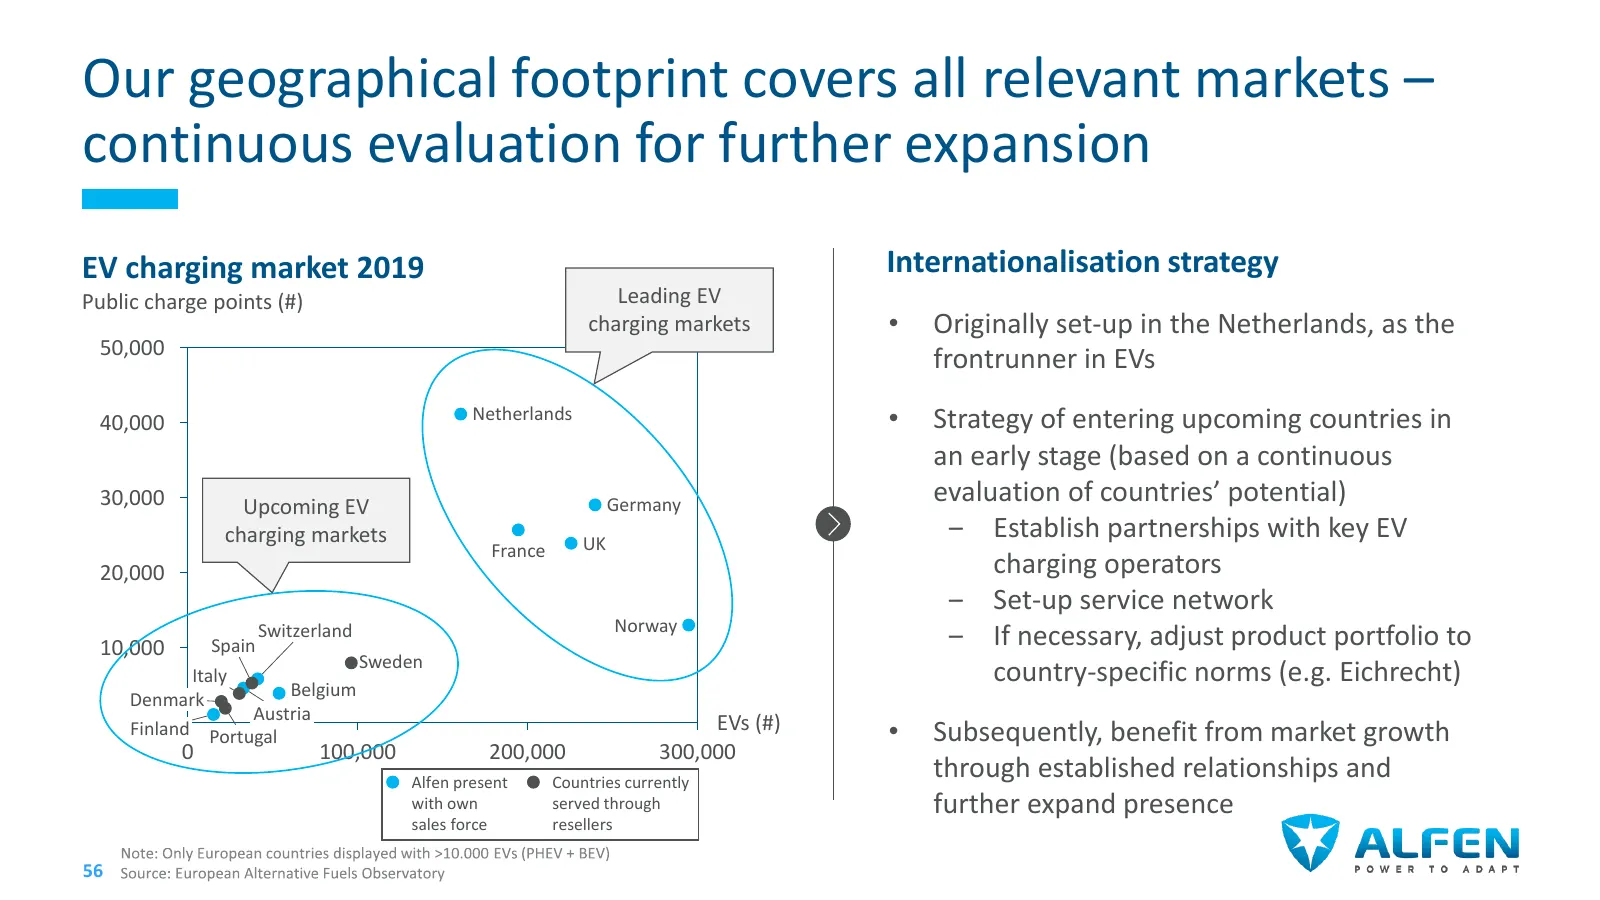
Our geographical footprint covers all relevant markets – continuous evaluation for further expansion EV charging market 2019 Internationalisation strategy Public charge points (#) Leading EV charging markets • Originally set-up in the Netherlands, as the 50,000 frontrunner in EVs 40,000 Netherlands
Slide 56: Case study: Allego
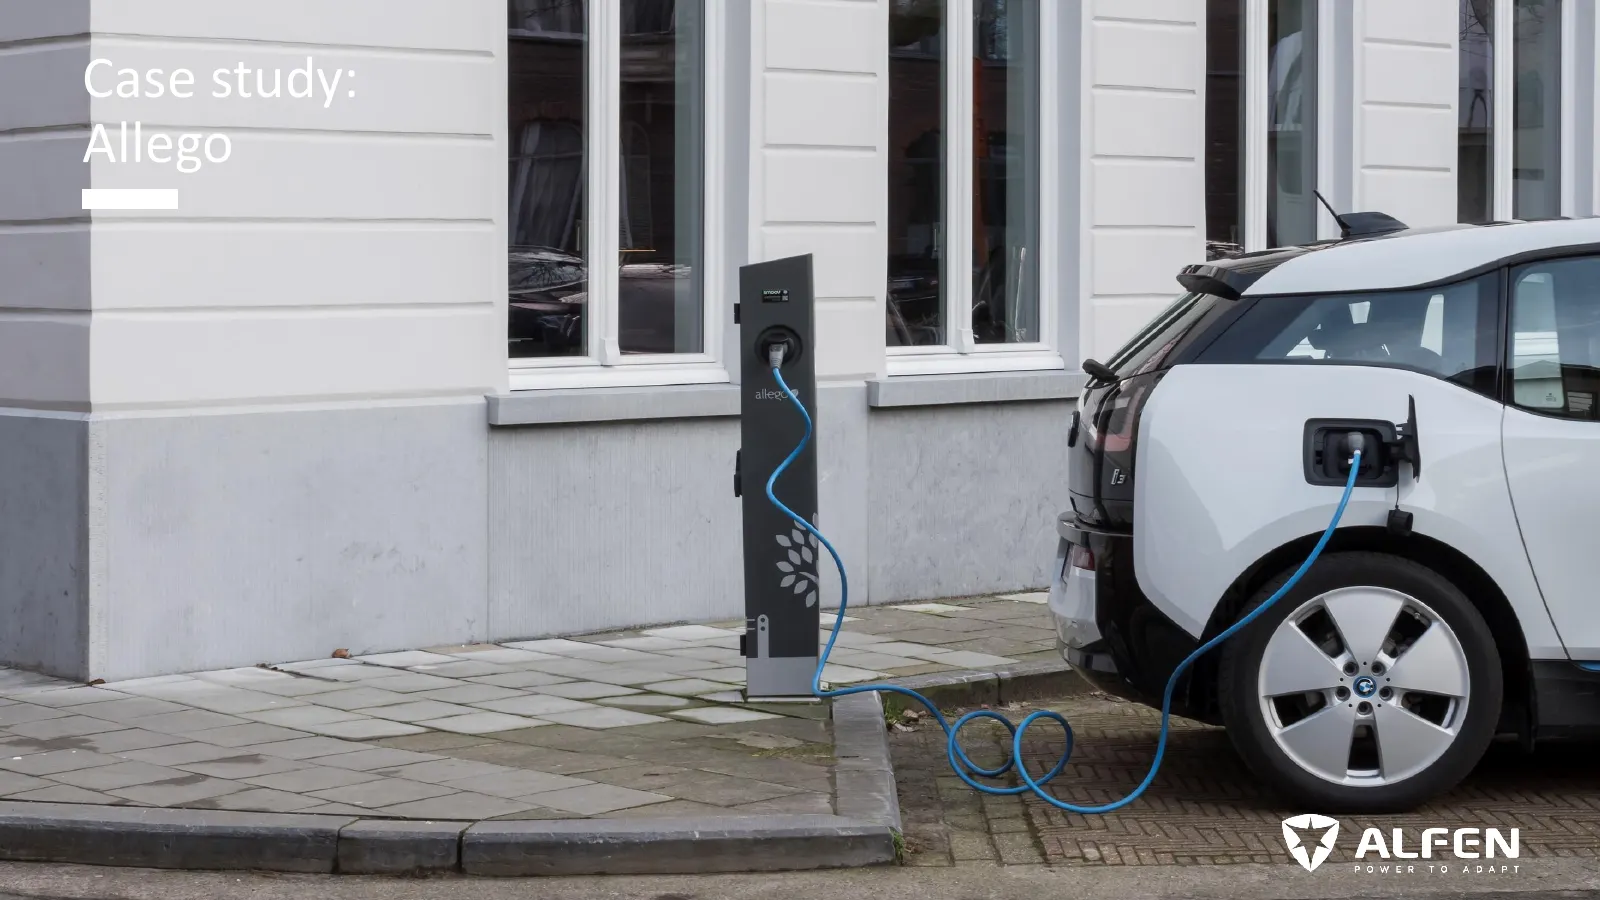
Case study: Allego 57
Slide 57: Case study: Allego
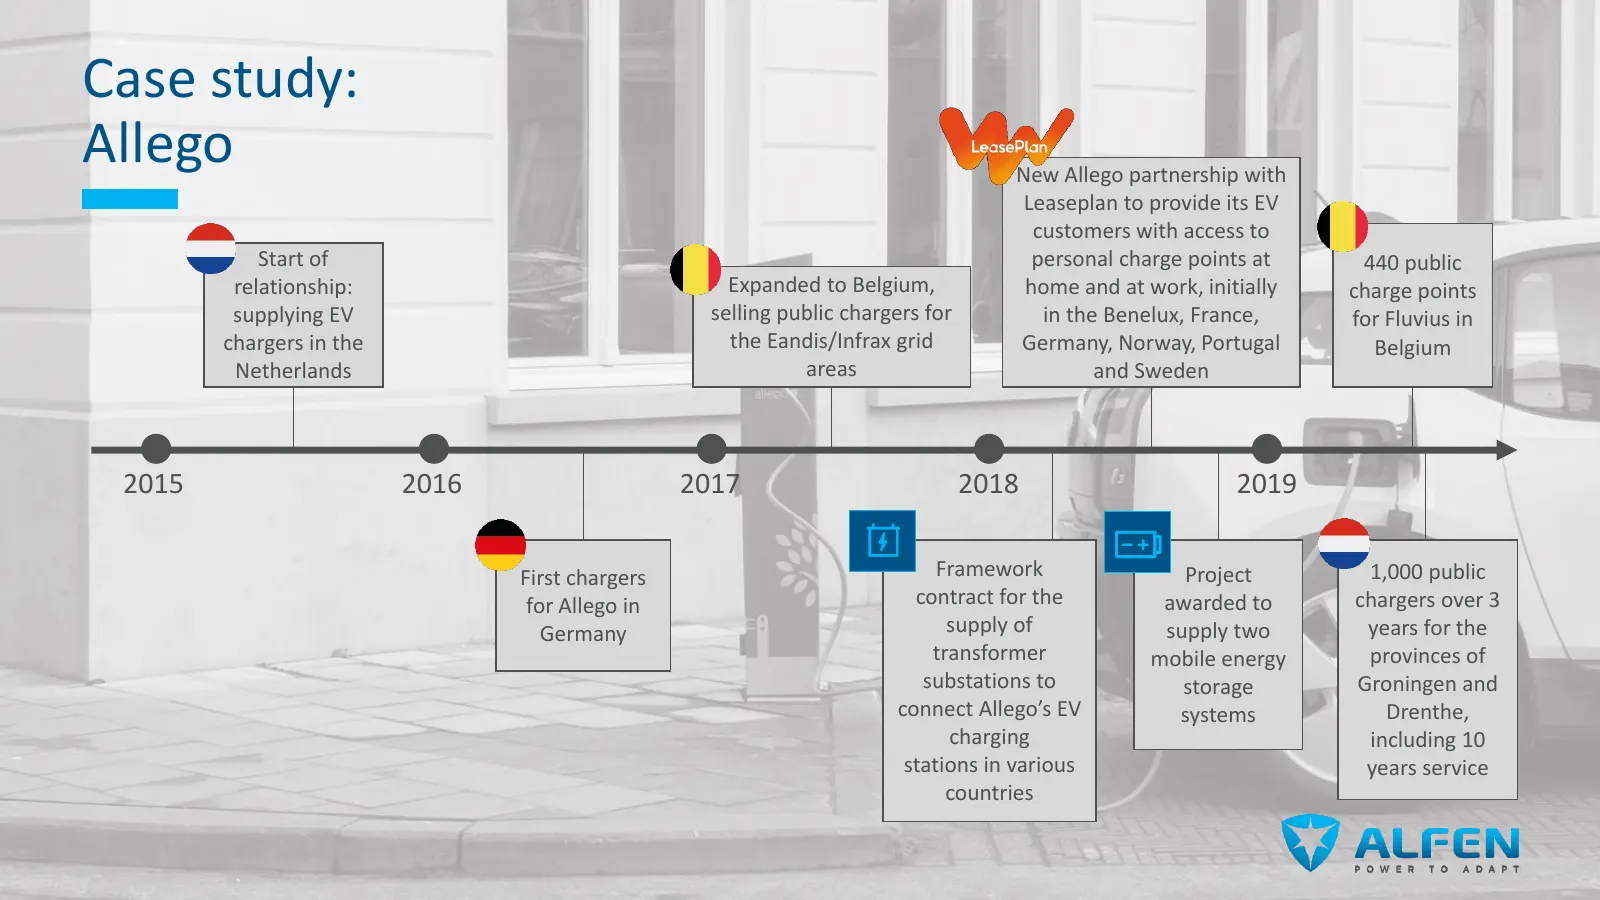
Case study: Allego New Allego partnership with Leaseplan to provide its EV customers with access to Start of personal charge points at 440 public relationship: Expanded to Belgium, home and at work, initially charge points supplying EV selling public chargers for in the Benelux, France, for Fluvius
Slide 58: Case study: Enexis
Case study: wee NEXIS”
Slide 59: Case study: Enexis
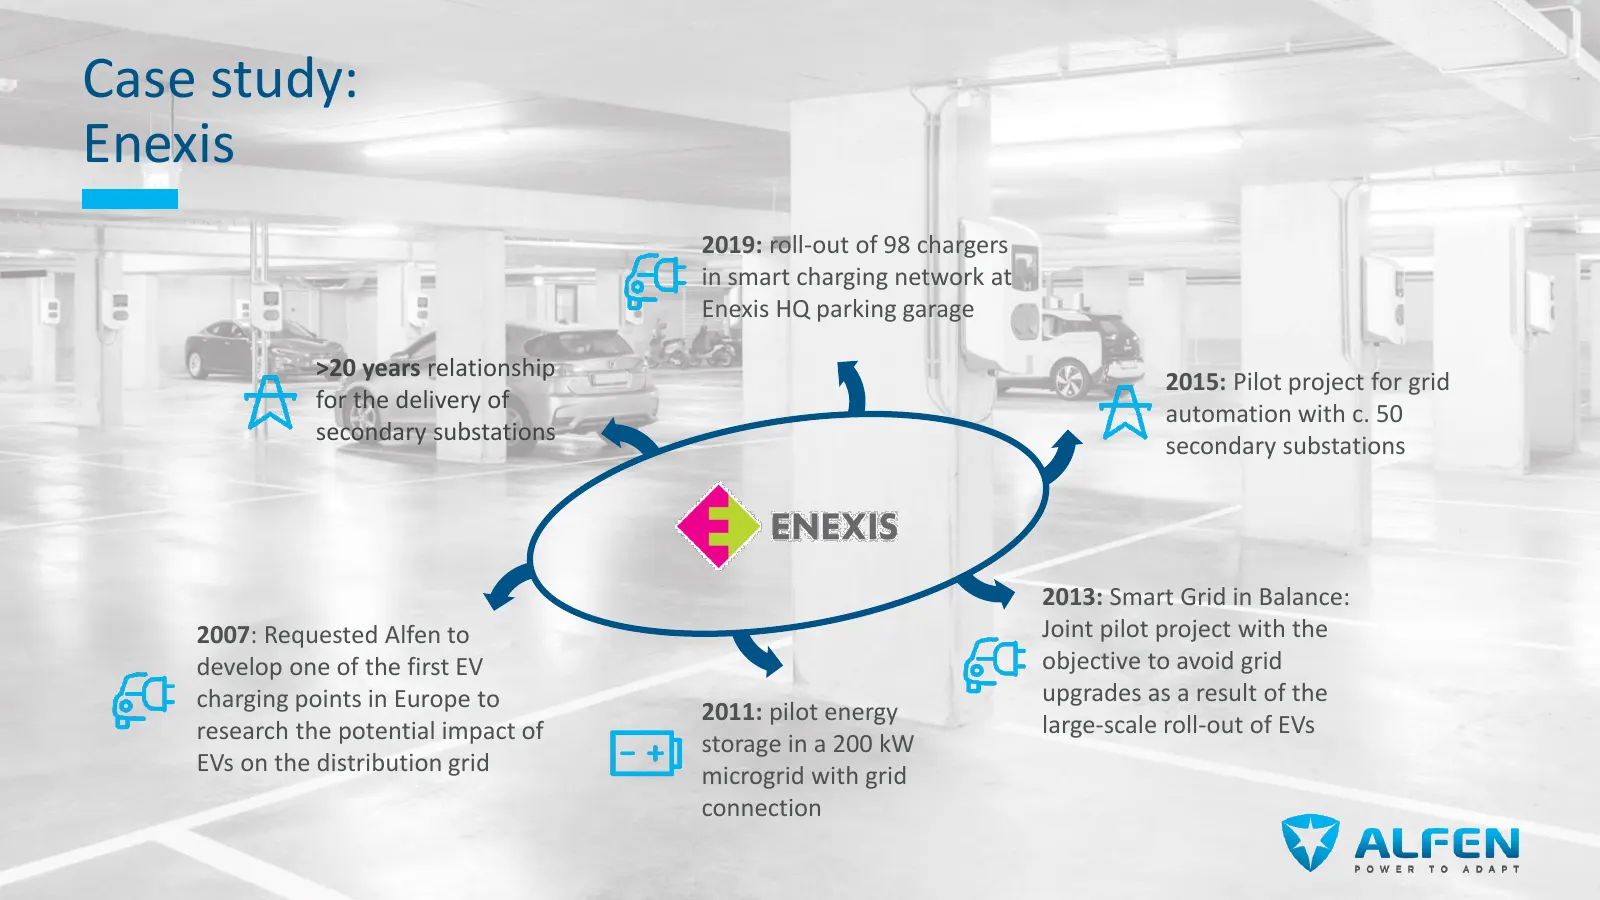
Case study: Enexis 2019: roll-out of 98 chargers in smart charging network at Enexis HQ parking garage >20 years relationship 2015: Pilot project for grid for the delivery of automation with c. 50 secondary substations secondary substations 2013: Smart Grid in Balance: 2007: Requested Alfen to Joint
Slide 60: Overview facilities EV charging equipment
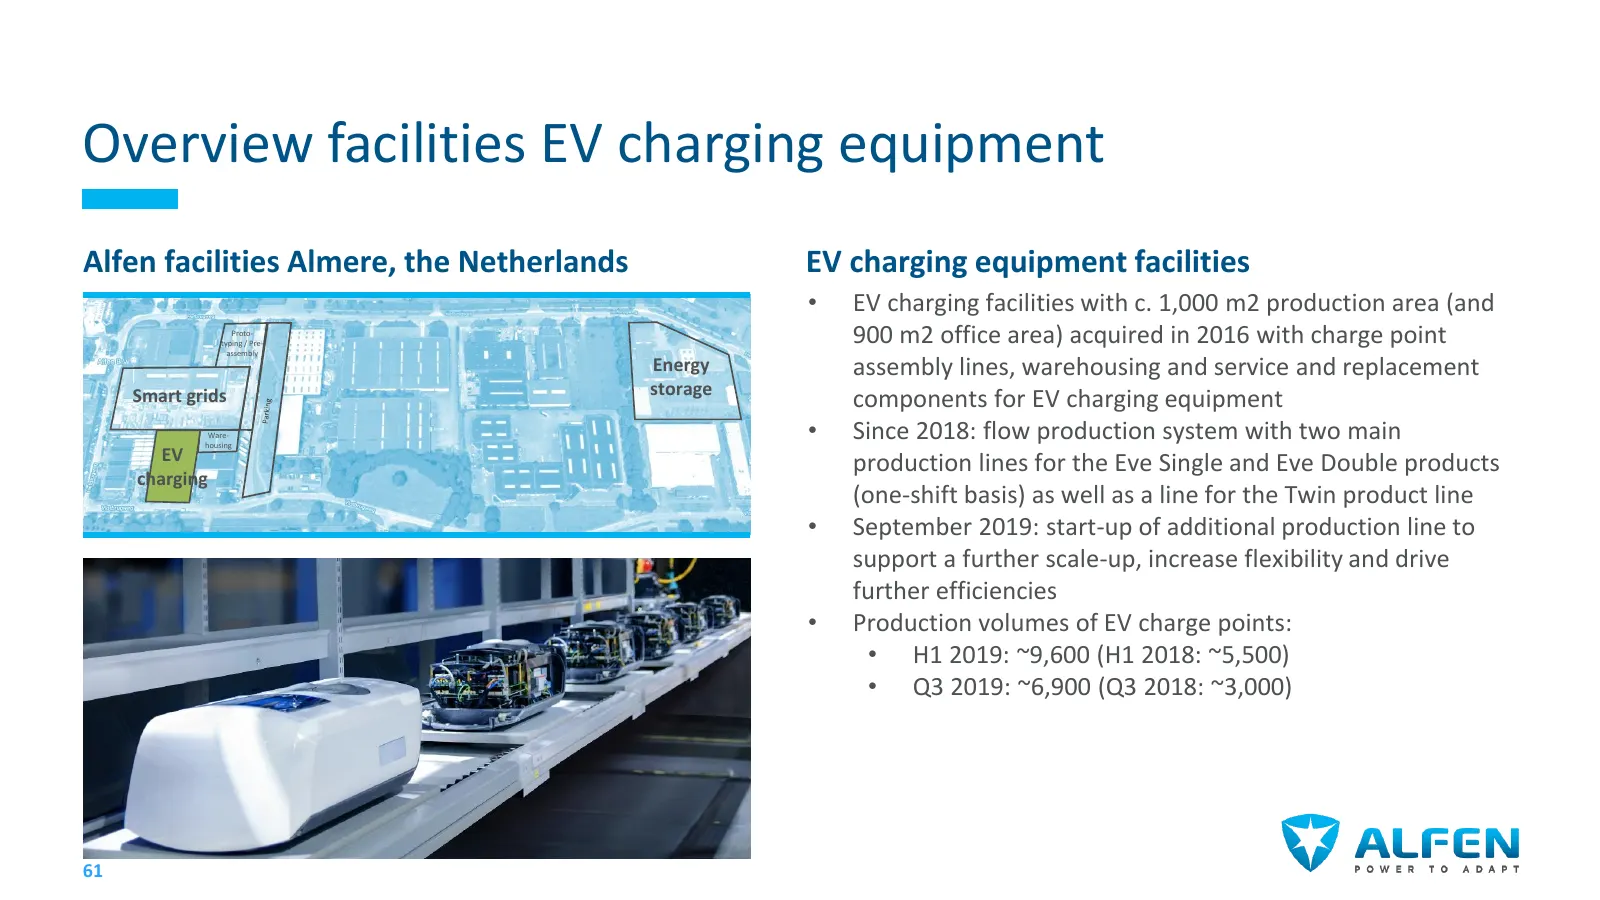
Overview facilities EV charging equipment Alfen facilities Almere, the Netherlands EV charging equipment facilities • EV charging facilities with c. 1,000 m2 production area (and Proto- typing / Pre- assembly 900 m2 office area) acquired in 2016 with charge point Energy assembly lines, warehousing a
Slide 61: Focus on continuous innovation
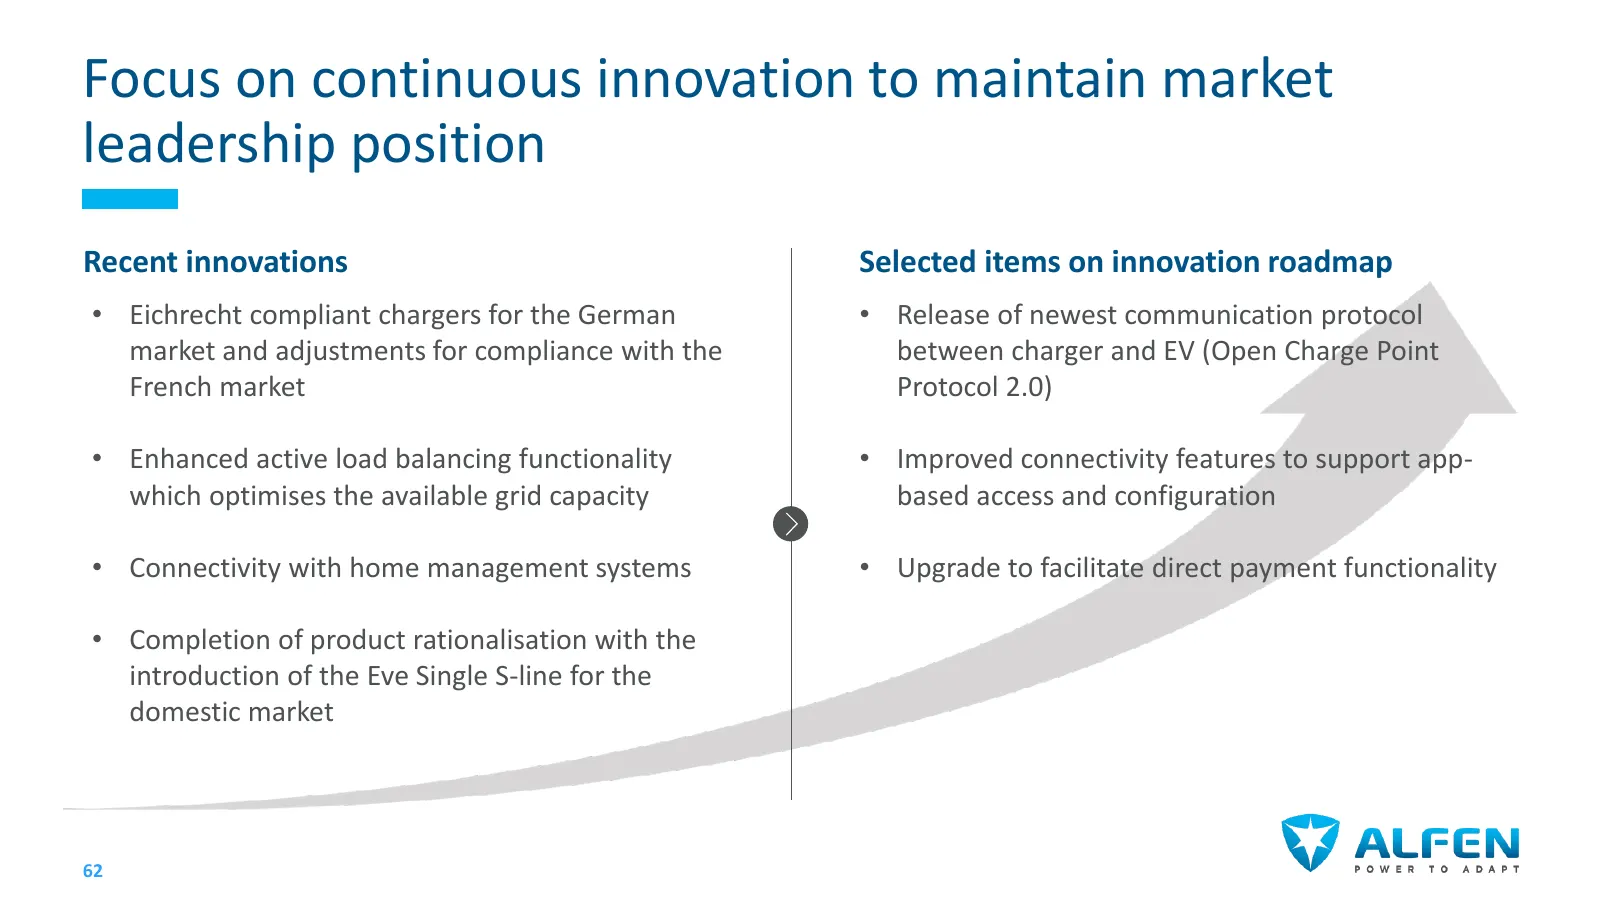
Focus on continuous innovation to maintain market leadership position Recent innovations Selected items on innovation roadmap • Eichrecht compliant chargers for the German • Release of newest communication protocol market and adjustments for compliance with the between charger and EV (Open Charge Po
Slide 62: Summary of strategic focus
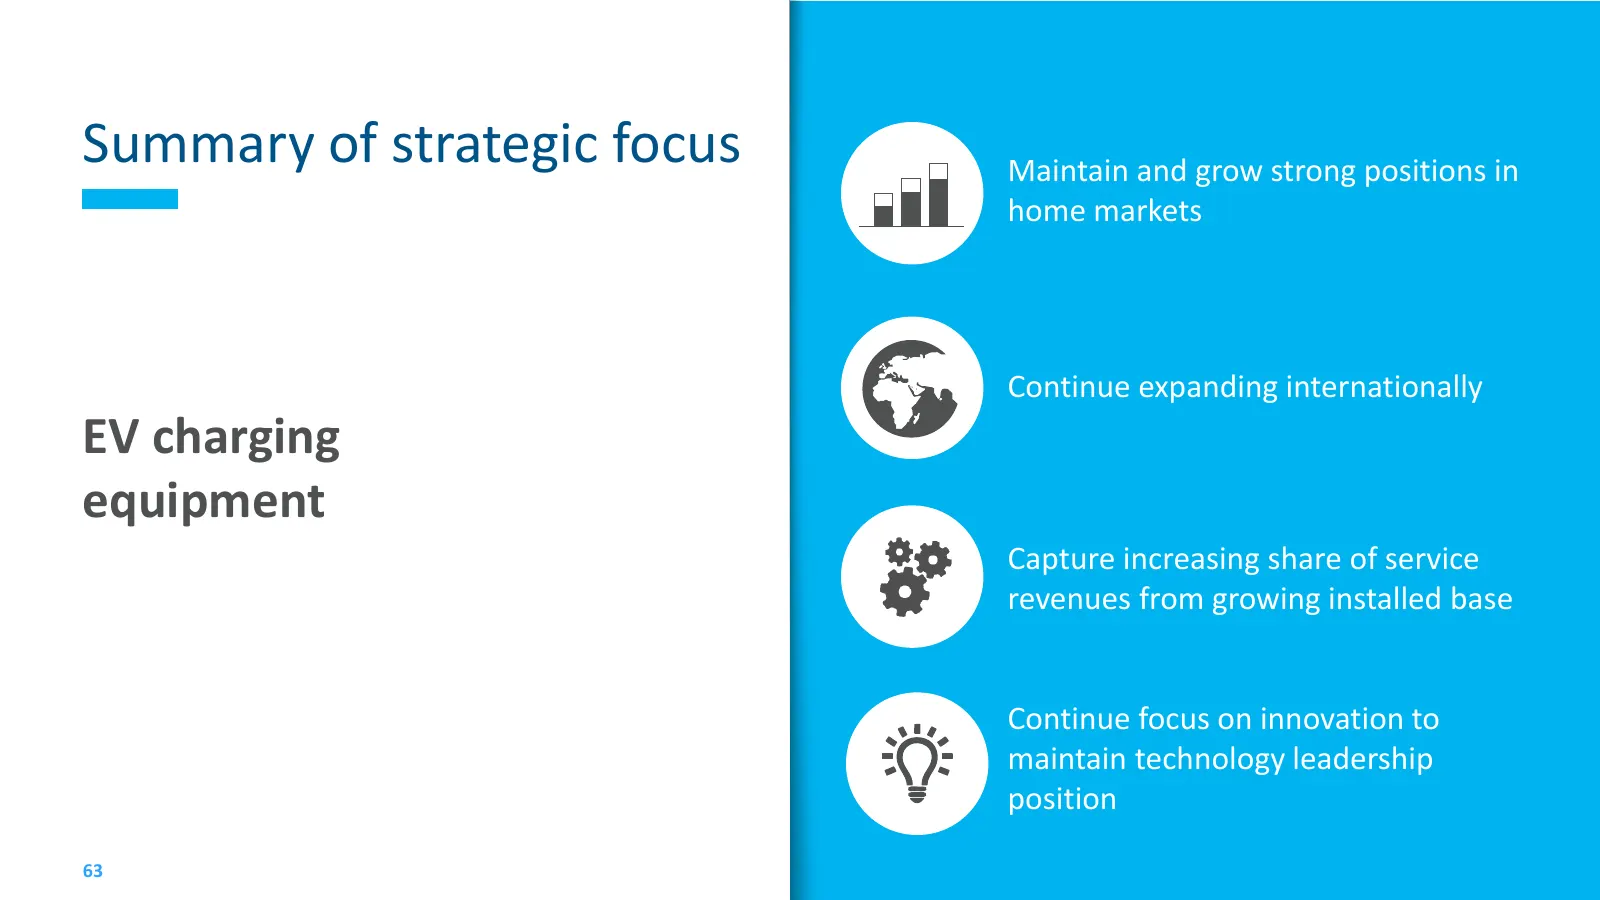
Summary of strategic focus Maintain and grow strong positions in home markets Continue expanding internationally EV charging equipment Capture increasing share of service revenues from growing installed base Continue focus on innovation to maintain technology leadership position 63
Slide 63: Q&A
Q&A 64
Slide 64: Agenda
Agenda 09:00 Registration and welcome 09:30 Group review • Strategy recap • YTD performance and outlook 10:30 Coffee break 11:00 Business line deep dives • Smart grid solutions • EV charging • Energy storage 12:30 Wrap-up 12:45 Lunch 65
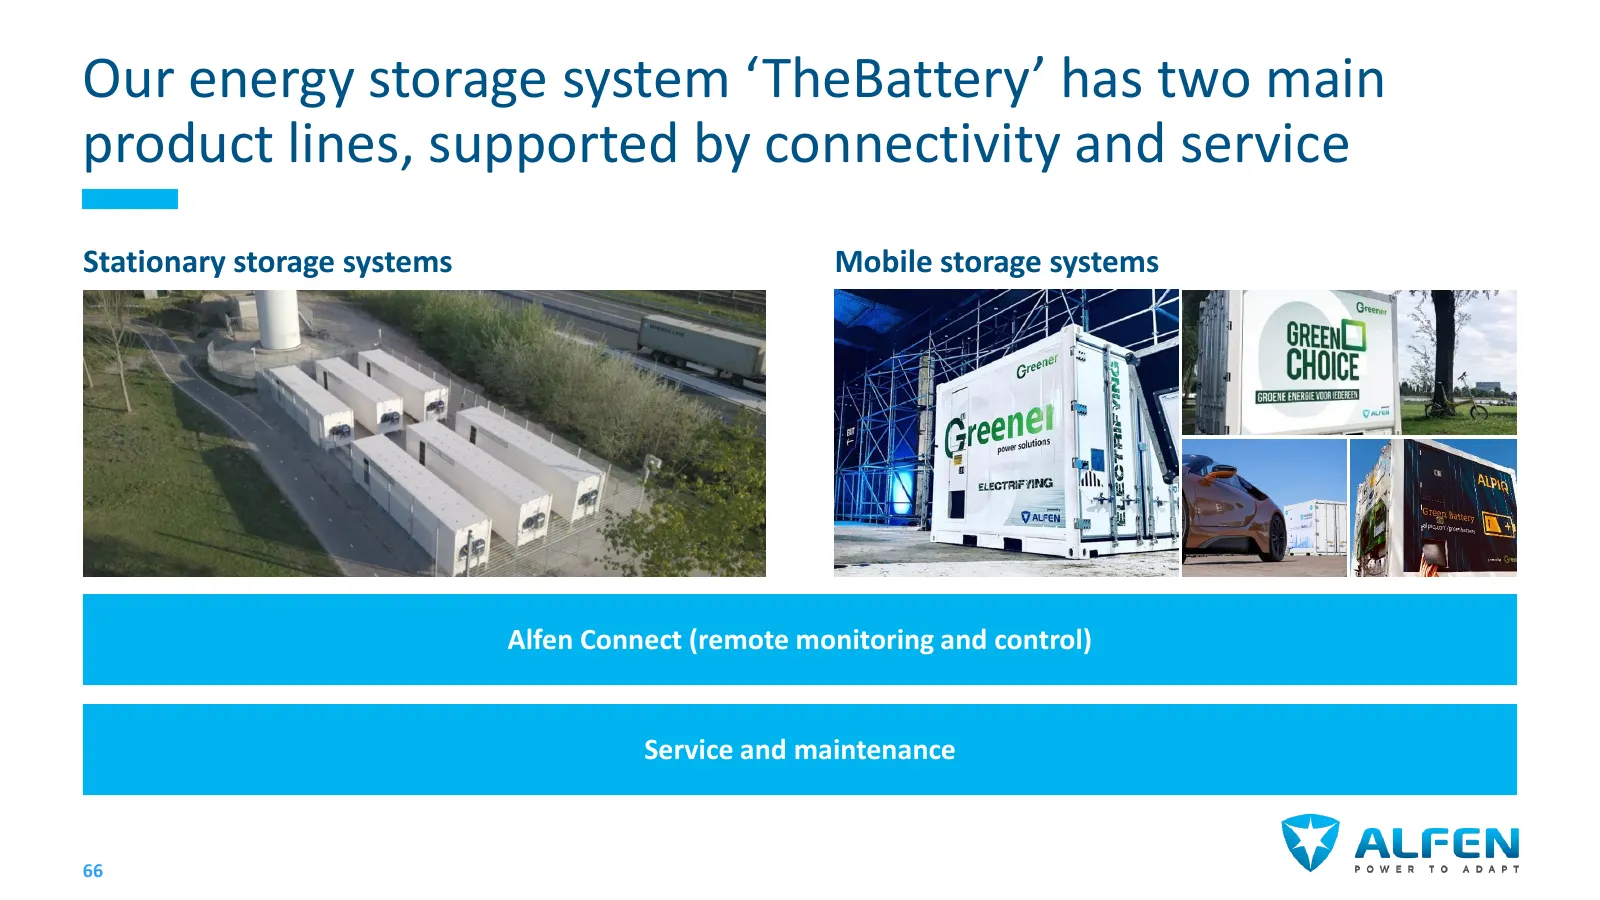
Slide 65: Energy storage system 'TheBattery' product lines
Our energy storage system ‘TheBattery’ has two main product lines, supported by connectivity and service Stationary storage systems Mobile storage systems Alfen Connect (remote monitoring and control) Service and maintenance 66
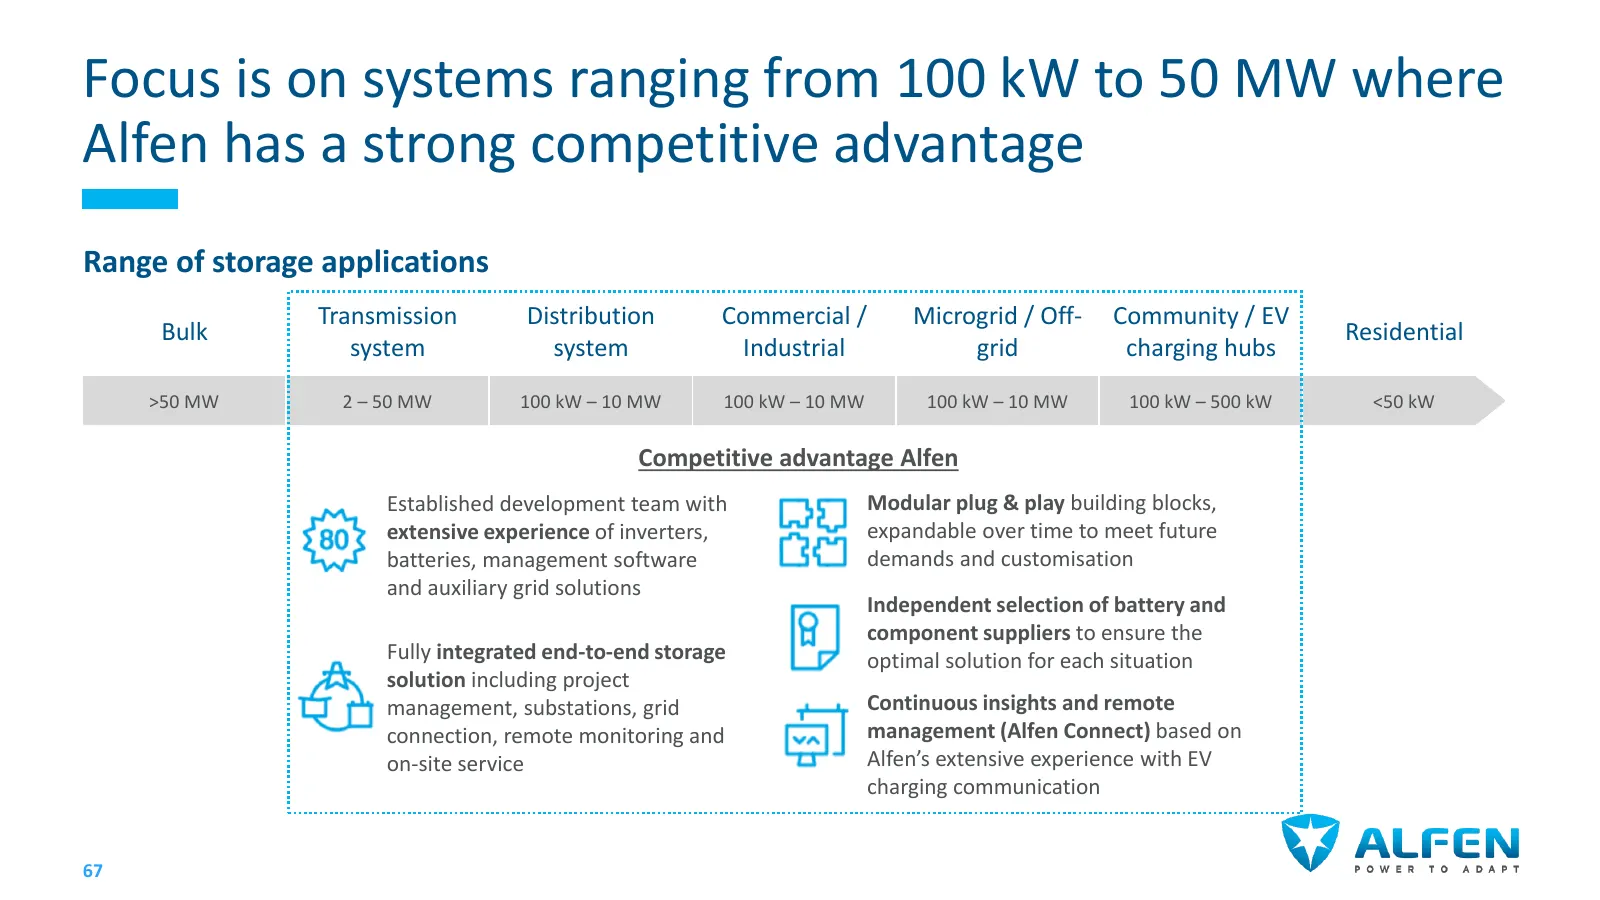
Slide 66: Focus on systems from 100 kW to 50 MW
Focus is on systems ranging from 100 kW to 50 MW where Alfen has a strong competitive advantage Range of storage applications Transmission Distribution Commercial / Microgrid / Off- Community / EV Bulk Residential system system Industrial grid charging hubs >50 MW 2 – 50 MW 100 kW – 10 MW 100 kW – 1
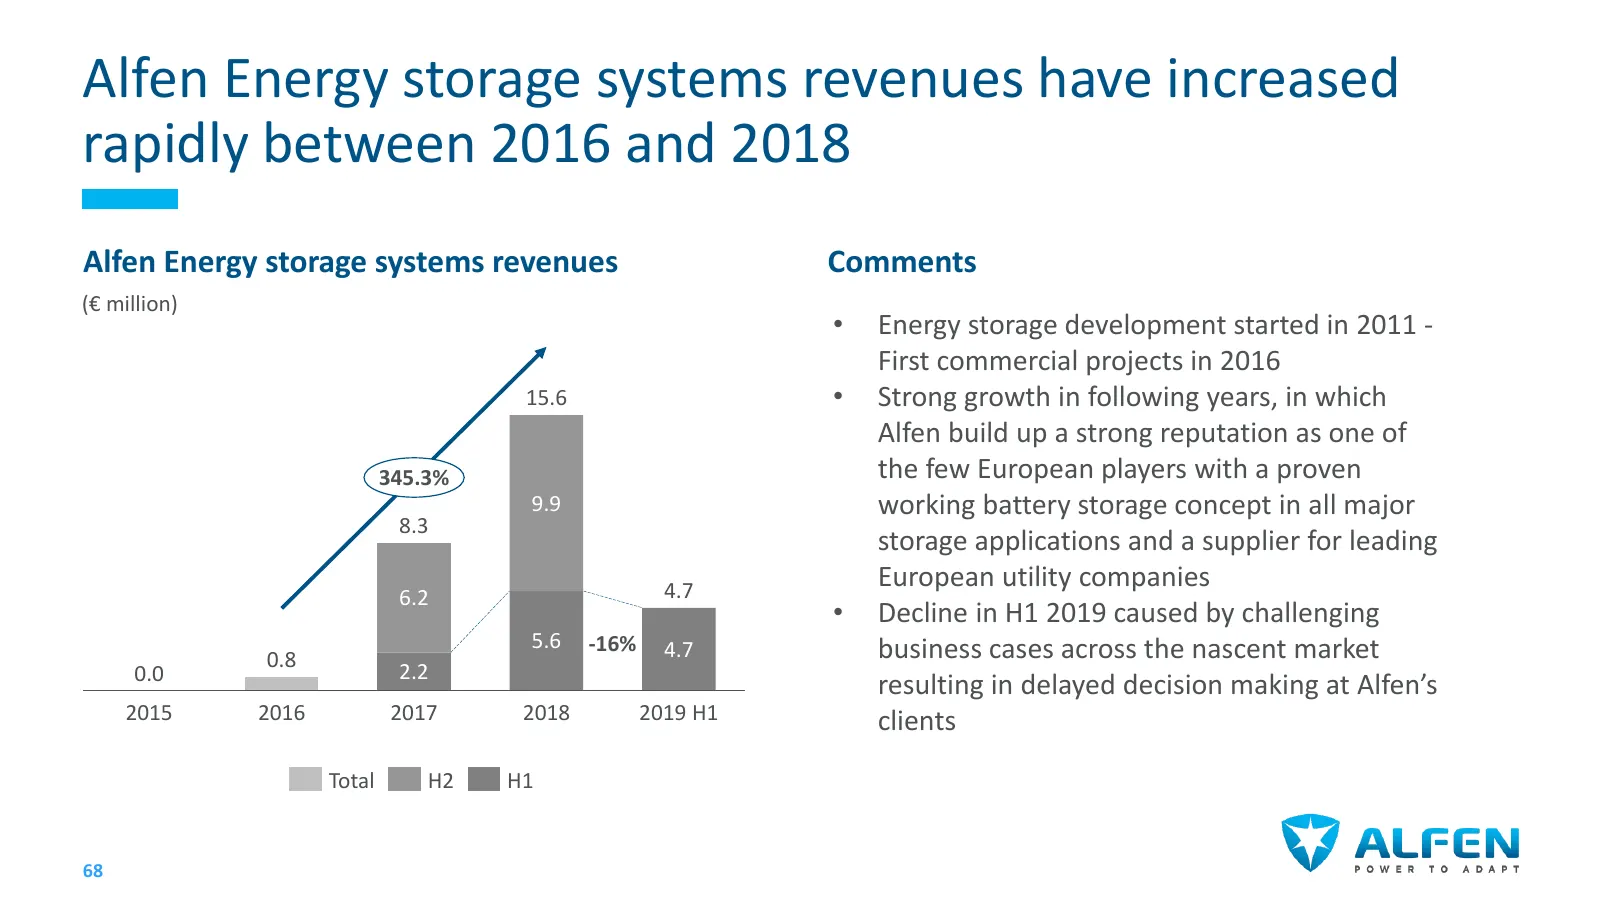
Slide 67: Energy storage systems revenues increased rapidly 2016-2018
Alfen Energy storage systems revenues have increased rapidly between 2016 and 2018 Alfen Energy storage systems revenues Comments (€ million) • Energy storage development started in 2011 - First commercial projects in 2016 15.6 • Strong growth in following years, in which Alfen build up a strong rep
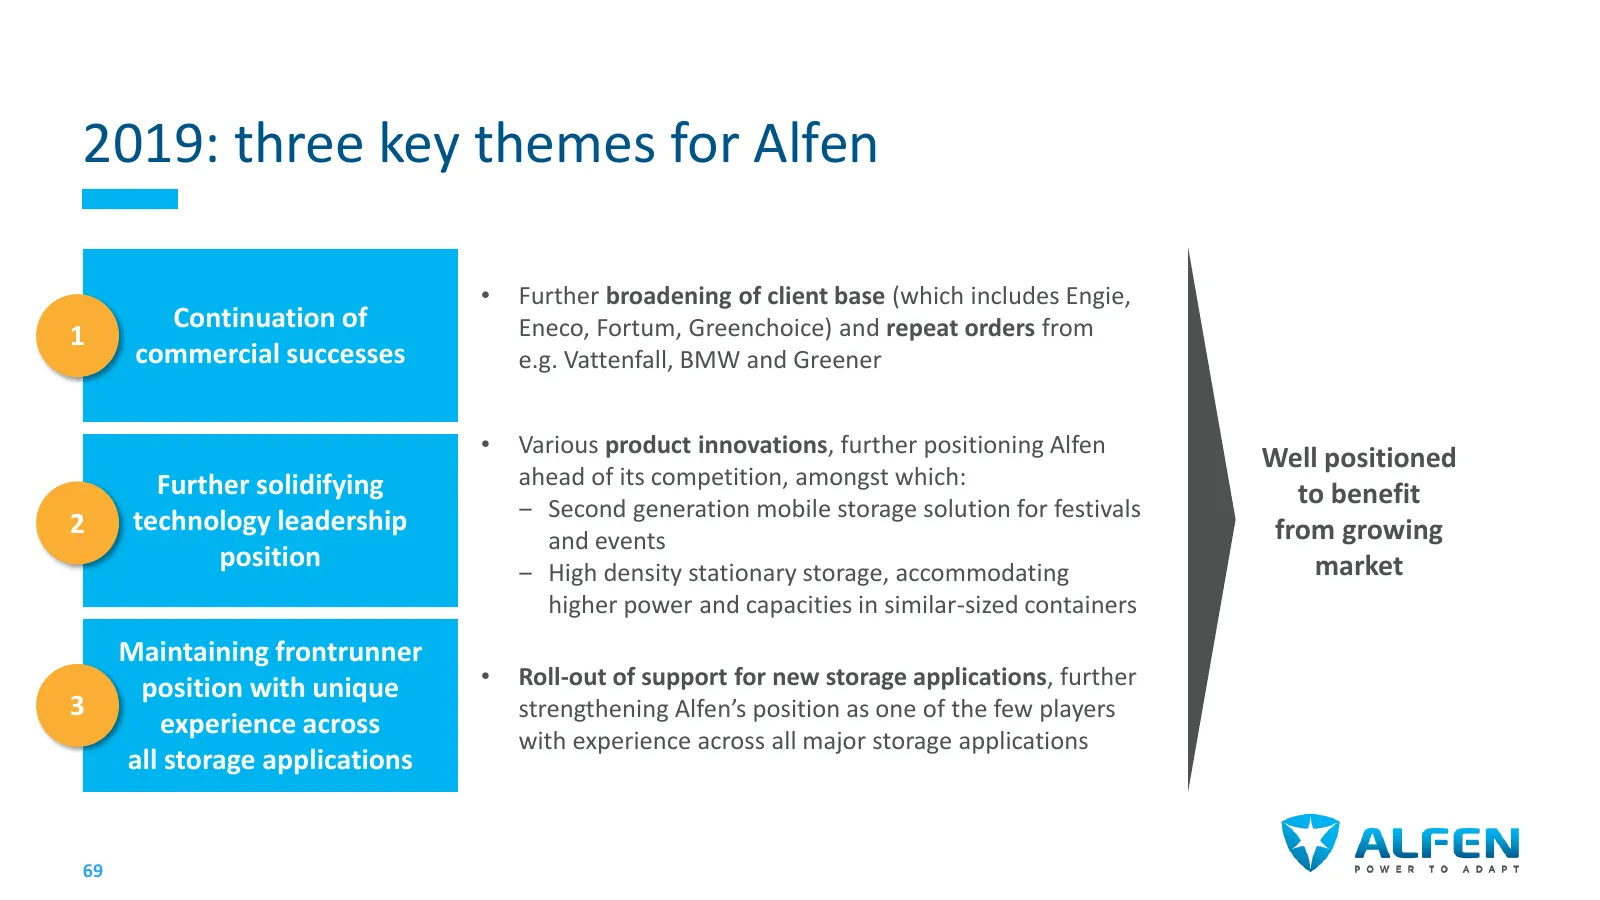
Slide 68: 2019: three key themes for Alfen
2019: three key themes for Alfen • Further broadening of client base (which includes Engie, Continuation of Eneco, Fortum, Greenchoice) and repeat orders from 1 commercial successes e.g. Vattenfall, BMW and Greener • Various product innovations, further positioning Alfen Well positioned Further soli
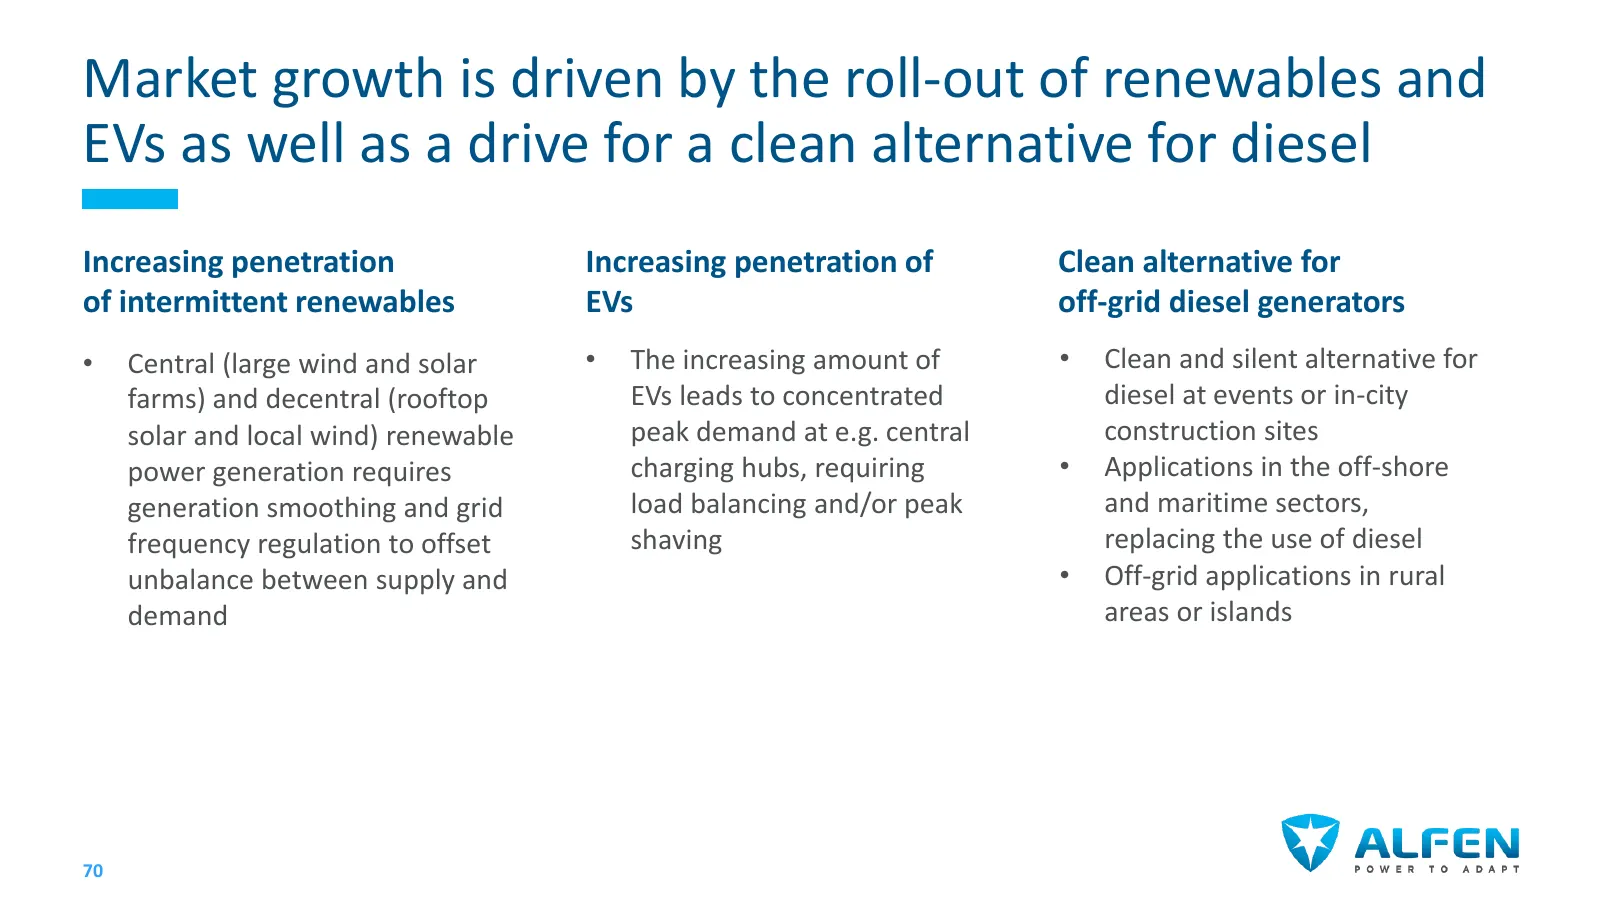
Slide 69: Market growth driven by renewables and EVs
Market growth is driven by the roll-out of renewables and EVs as well as a drive for a clean alternative for diesel Increasing penetration Increasing penetration of Clean alternative for of intermittent renewables EVs off-grid diesel generators • Central (large wind and solar • The increasing amount
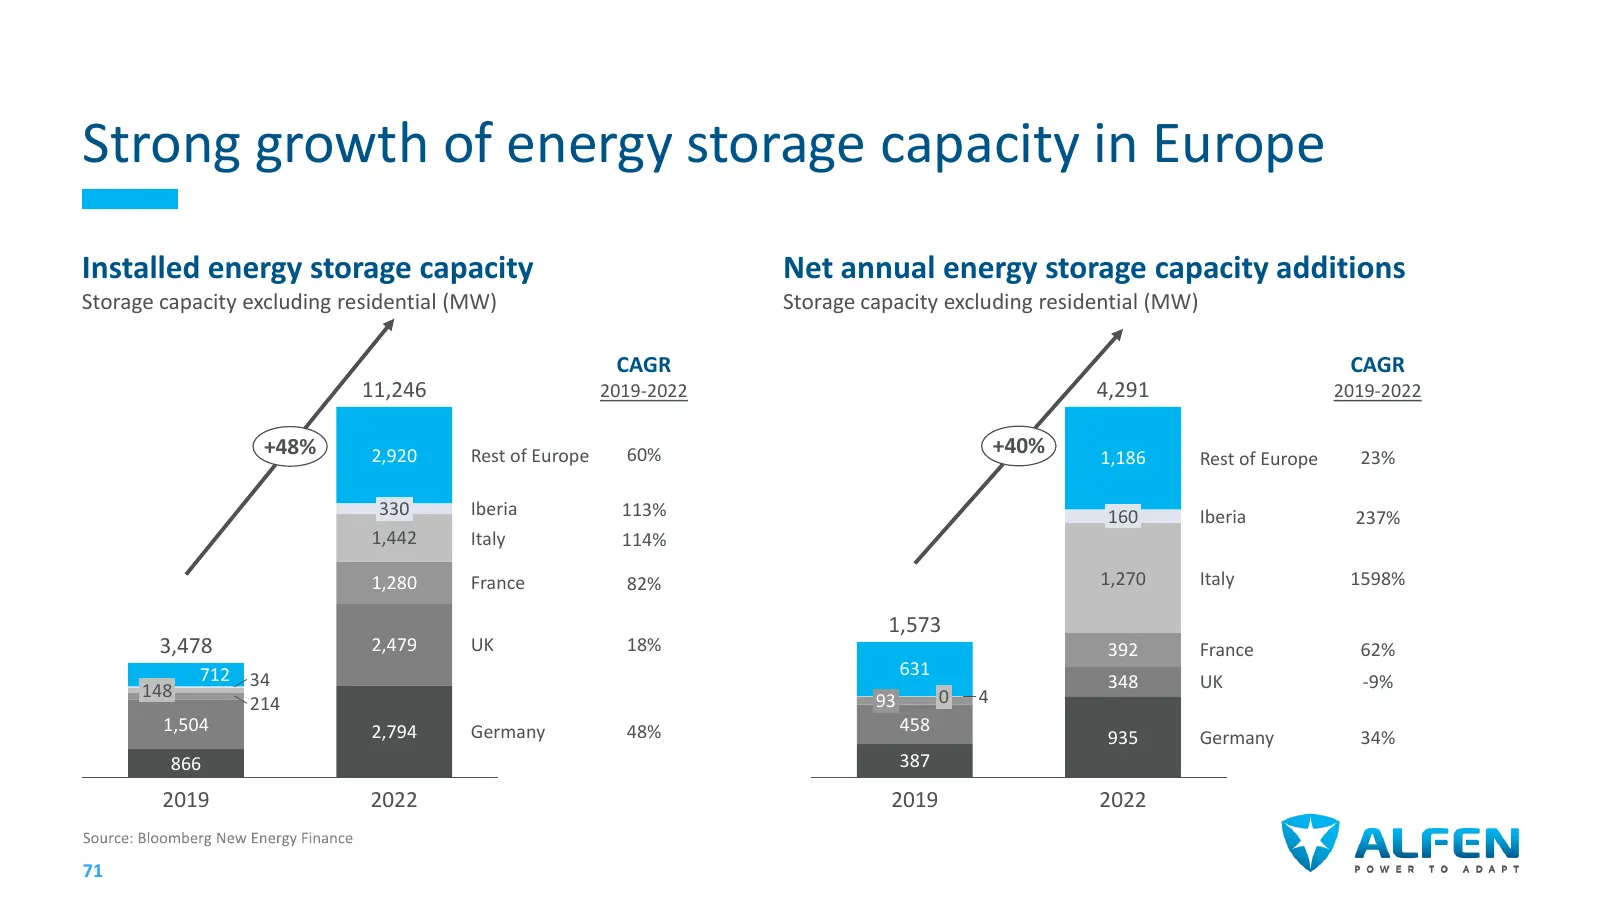
Slide 70: Strong growth of energy storage capacity in Europe
Strong growth of energy storage capacity in Europe Installed energy storage capacity Net annual energy storage capacity additions Storage capacity excluding residential (MW) Storage capacity excluding residential (MW) CAGR CAGR 11,246 2019-2022 4,291 2019-2022 +48% 2,920 Rest of Europe 60% +40% 1,18
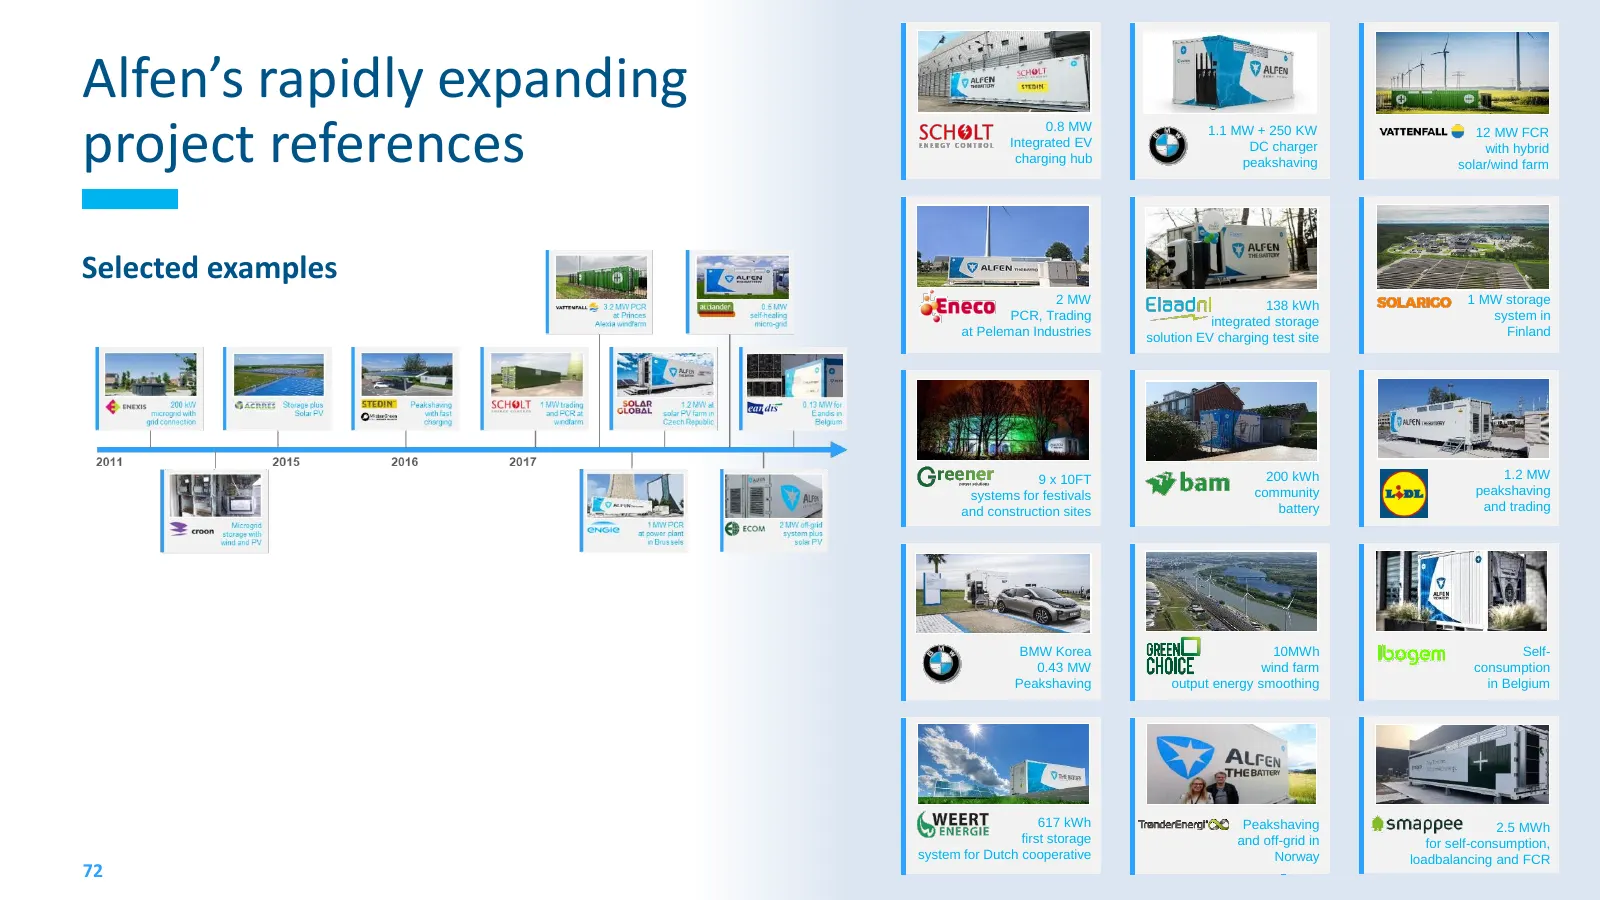
Slide 71: Alfen's rapidly expanding project references
Alfen’s rapidly expanding project references 0.8 MW 1.1 MW + 250 KW 12 MW FCR Integrated EV DC charger with hybrid charging hub peakshaving solar/wind farm Selected examples 2 MW 138 kWh 1 MW storage PCR, Trading integrated storage system in at Peleman Industries solution EV charging test site Finla
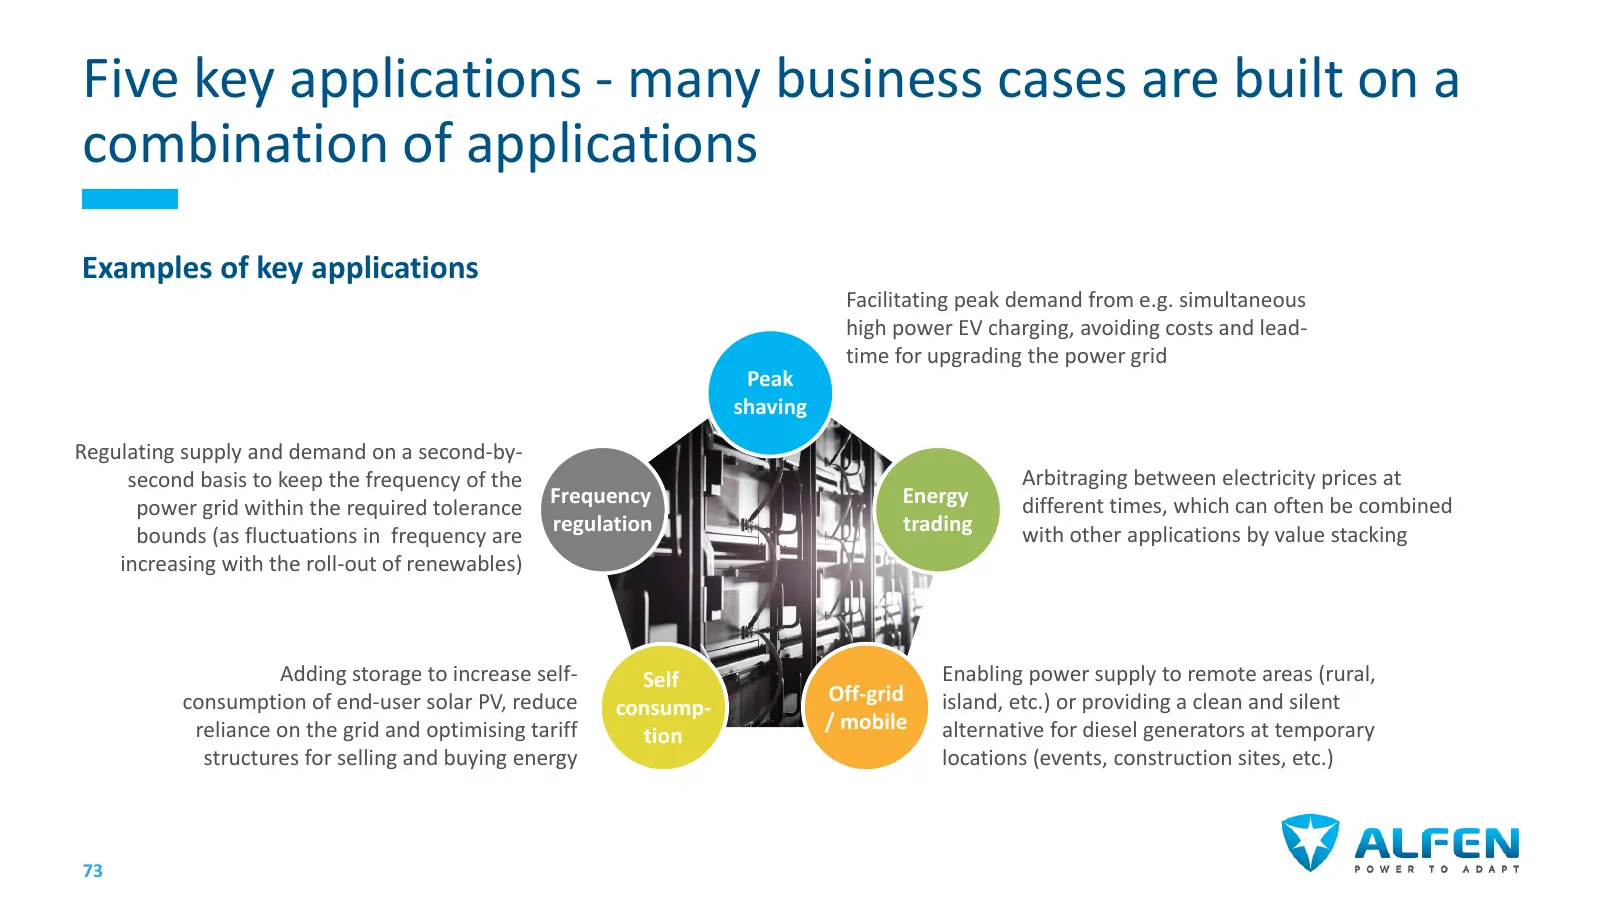
Slide 72: Five key applications of energy storage
Five key applications - many business cases are built on a combination of applications Examples of key applications Facilitating peak demand from e.g. simultaneous high power EV charging, avoiding costs and lead- time for upgrading the power grid Peak shaving Regulating supply and demand on a second
Slide 73: Unique experience across all major storage applications
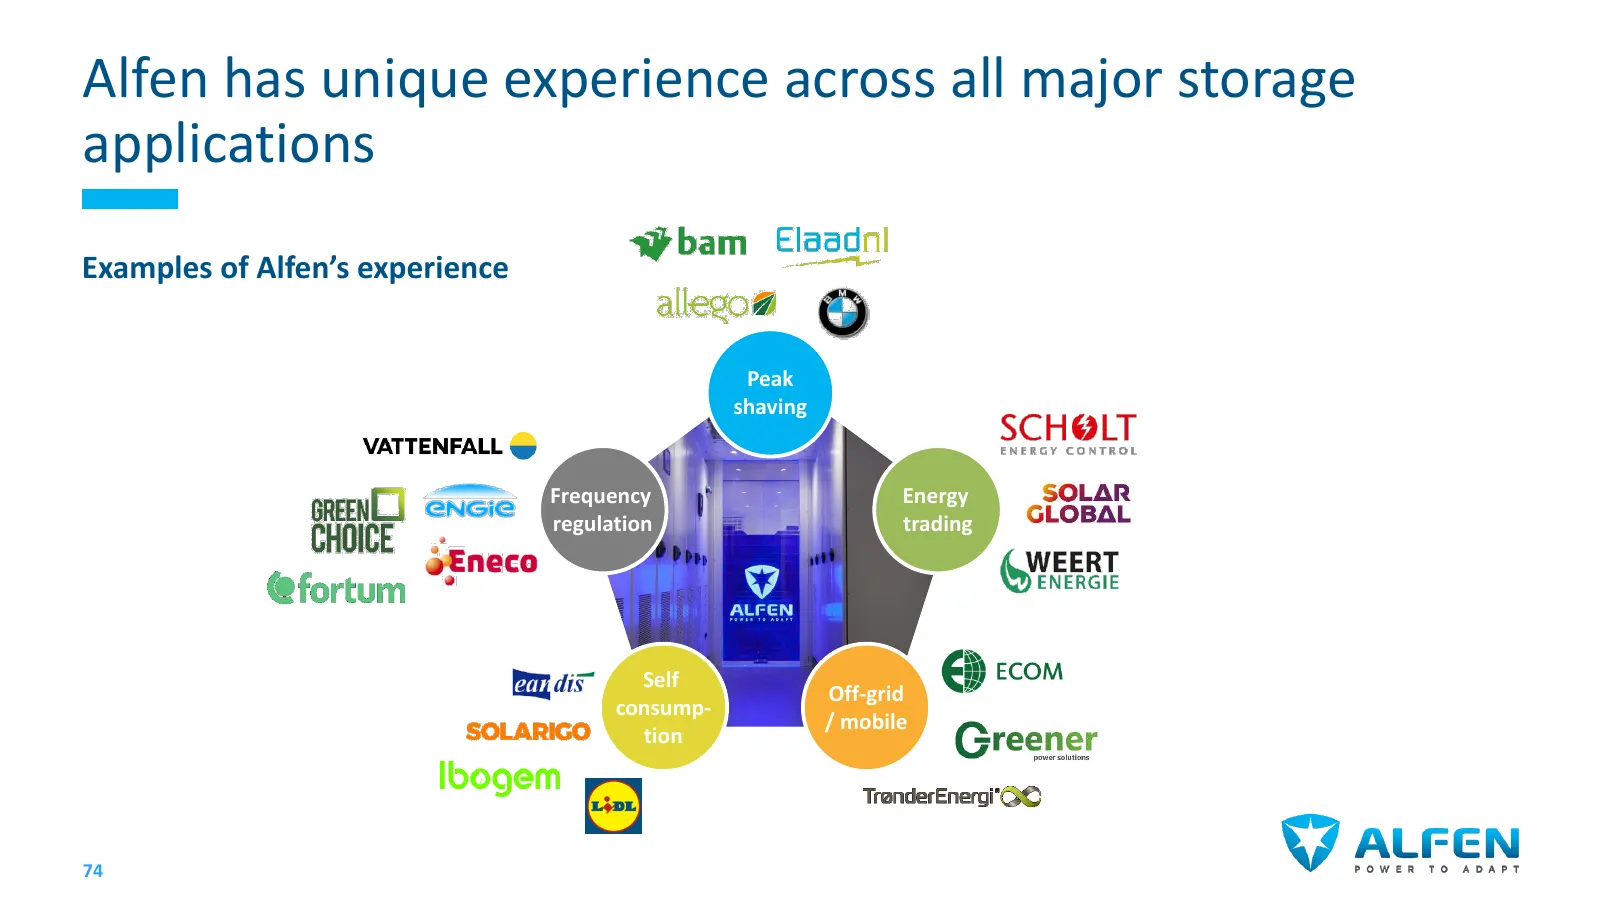
Alfen has unique experience across all major storage applications Examples of Alfen’s experience Peak shaving Frequency Energy regulation trading Self Off-grid consump- / mobile tion 74
Slide 74: Case study: Greenchoice
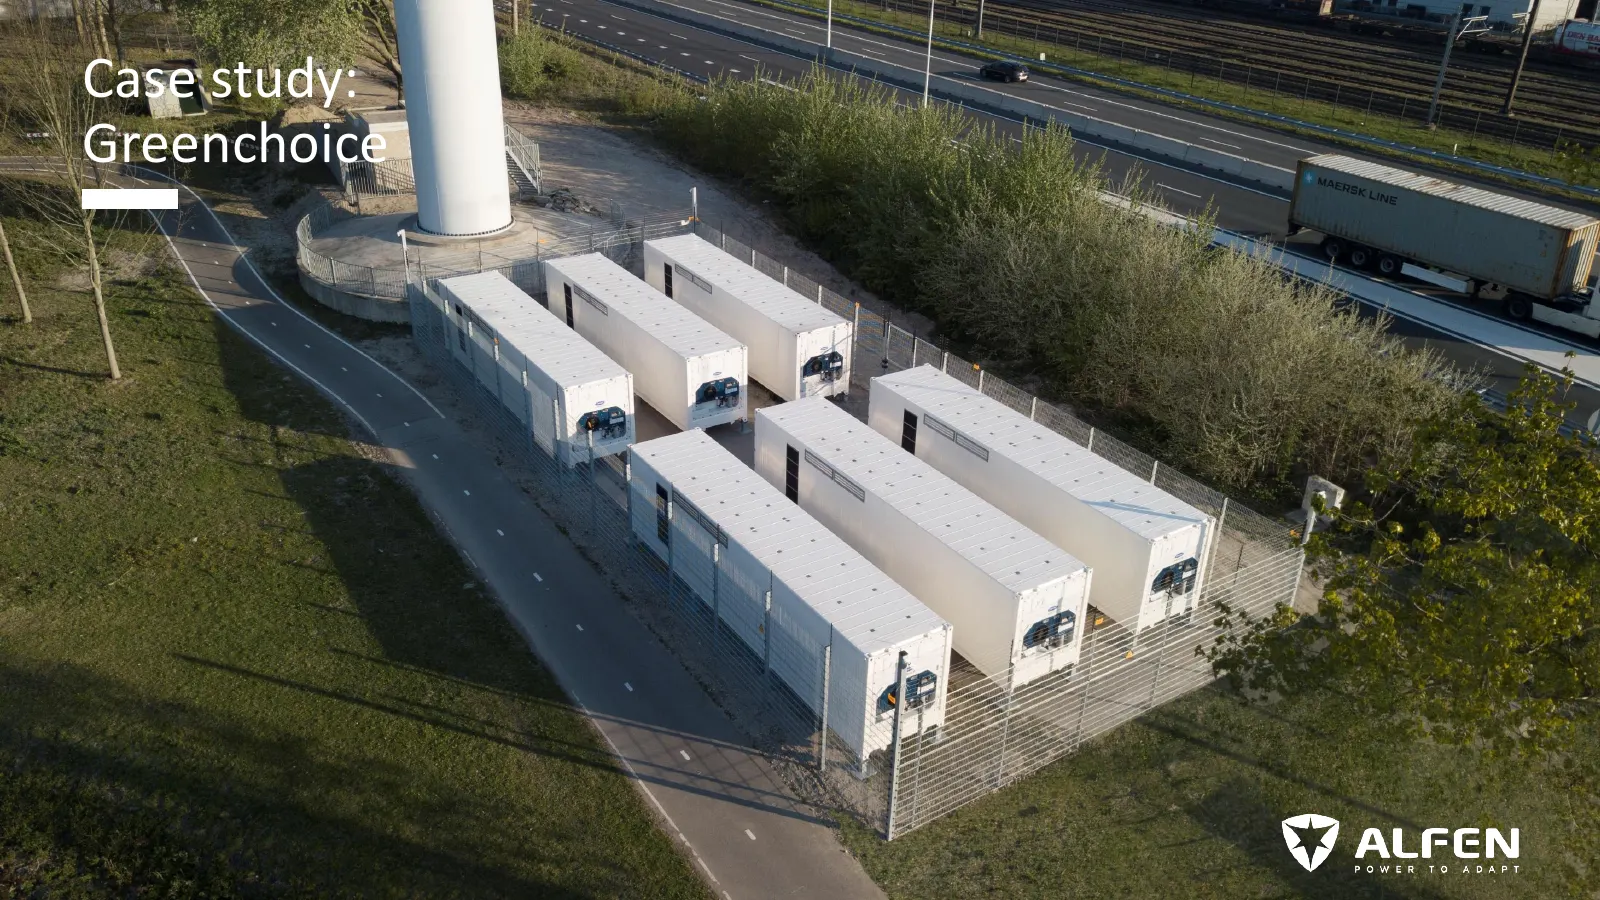
Case study: Greenchoice 75
Slide 75: Case study: Greenchoice
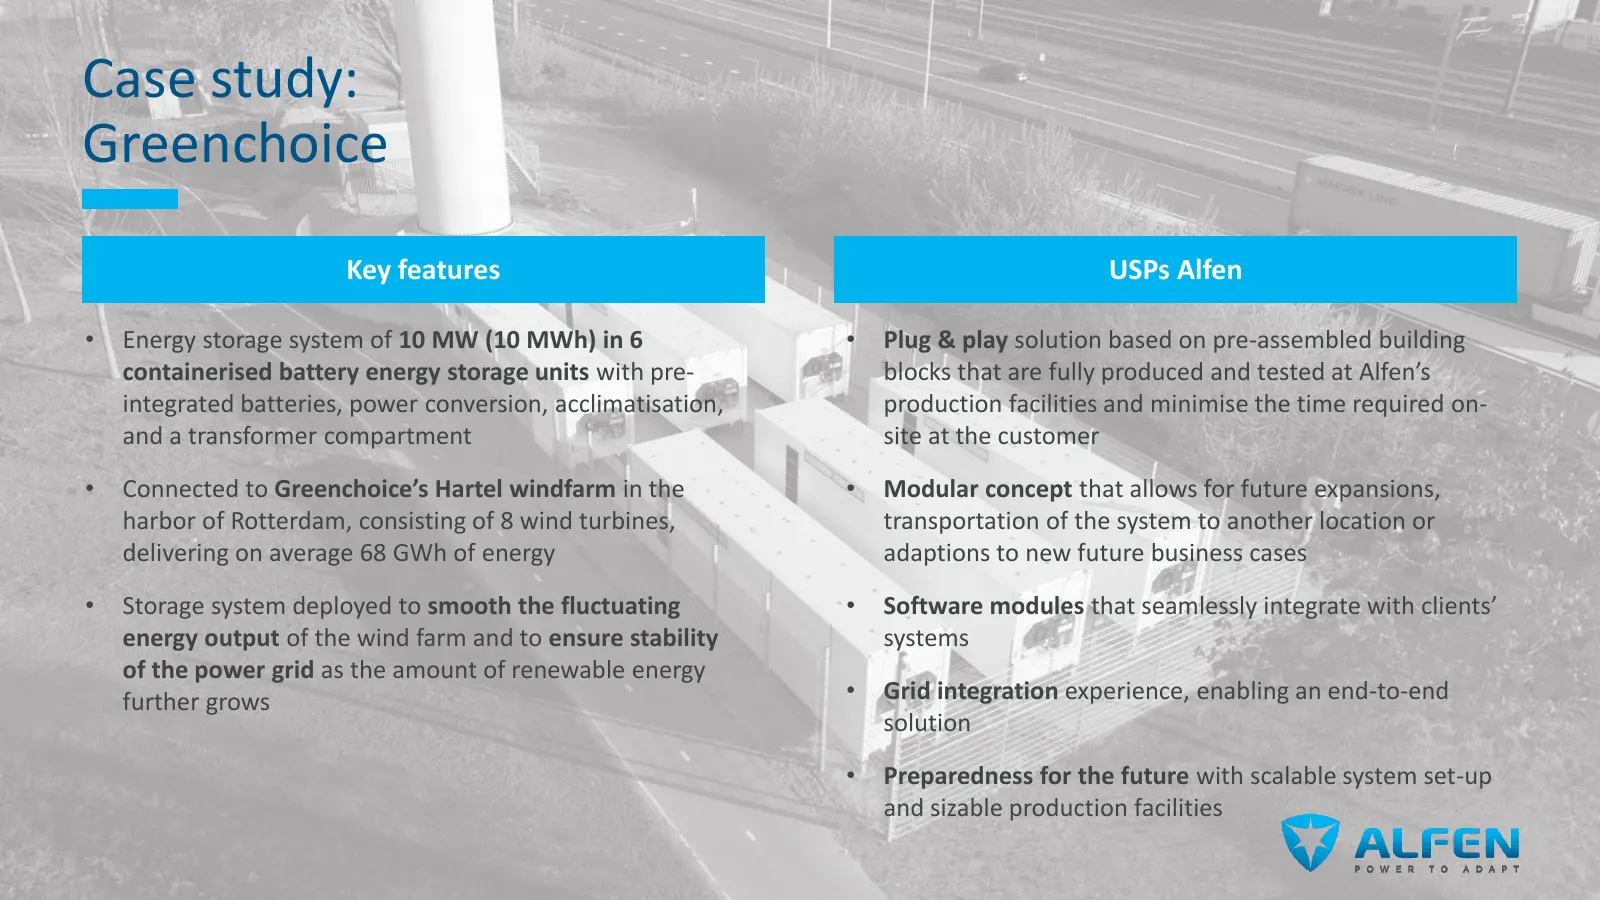
Case study: Greenchoice Key features USPs Alfen • Energy storage system of 10 MW (10 MWh) in 6 • Plug & play solution based on pre-assembled building containerised battery energy storage units with pre- blocks that are fully produced and tested at Alfen’s integrated batteries, power conversion, accl

Slide 76: Case study: Greener
Case study: Greener 77
Slide 77: Case study: Greener
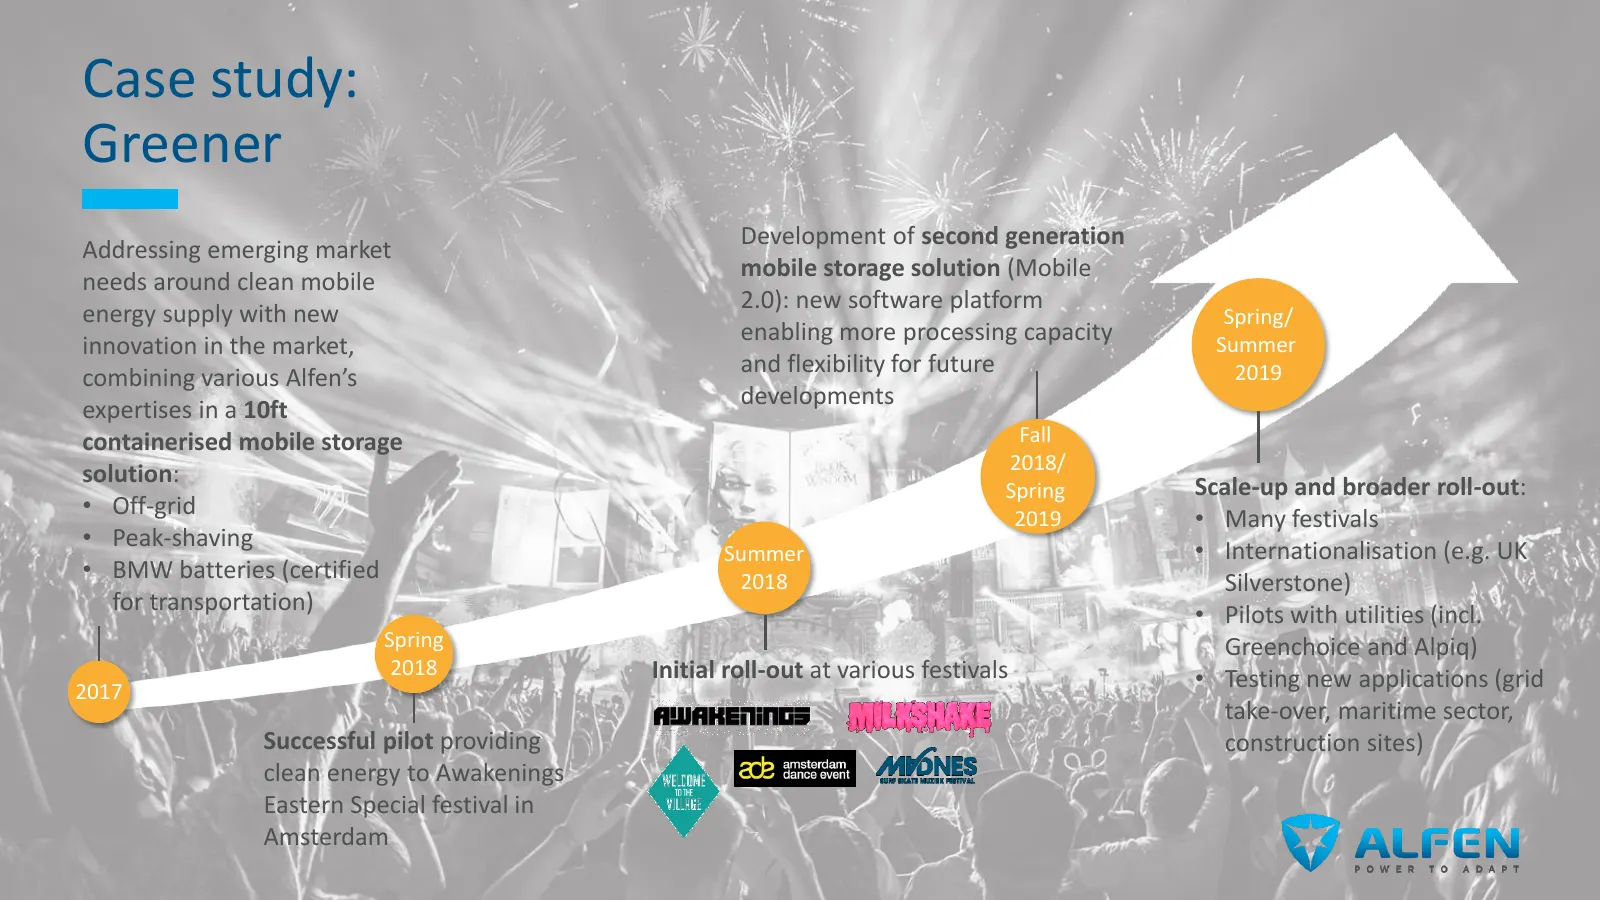
Case study: Greener Development of second generation Addressing emerging market mobile storage solution (Mobile needs around clean mobile 2.0): new software platform energy supply with new Spring/ enabling more processing capacity innovation in the market, Summer and flexibility for future 2019 comb
Slide 78: Overview facilities Energy storage systems
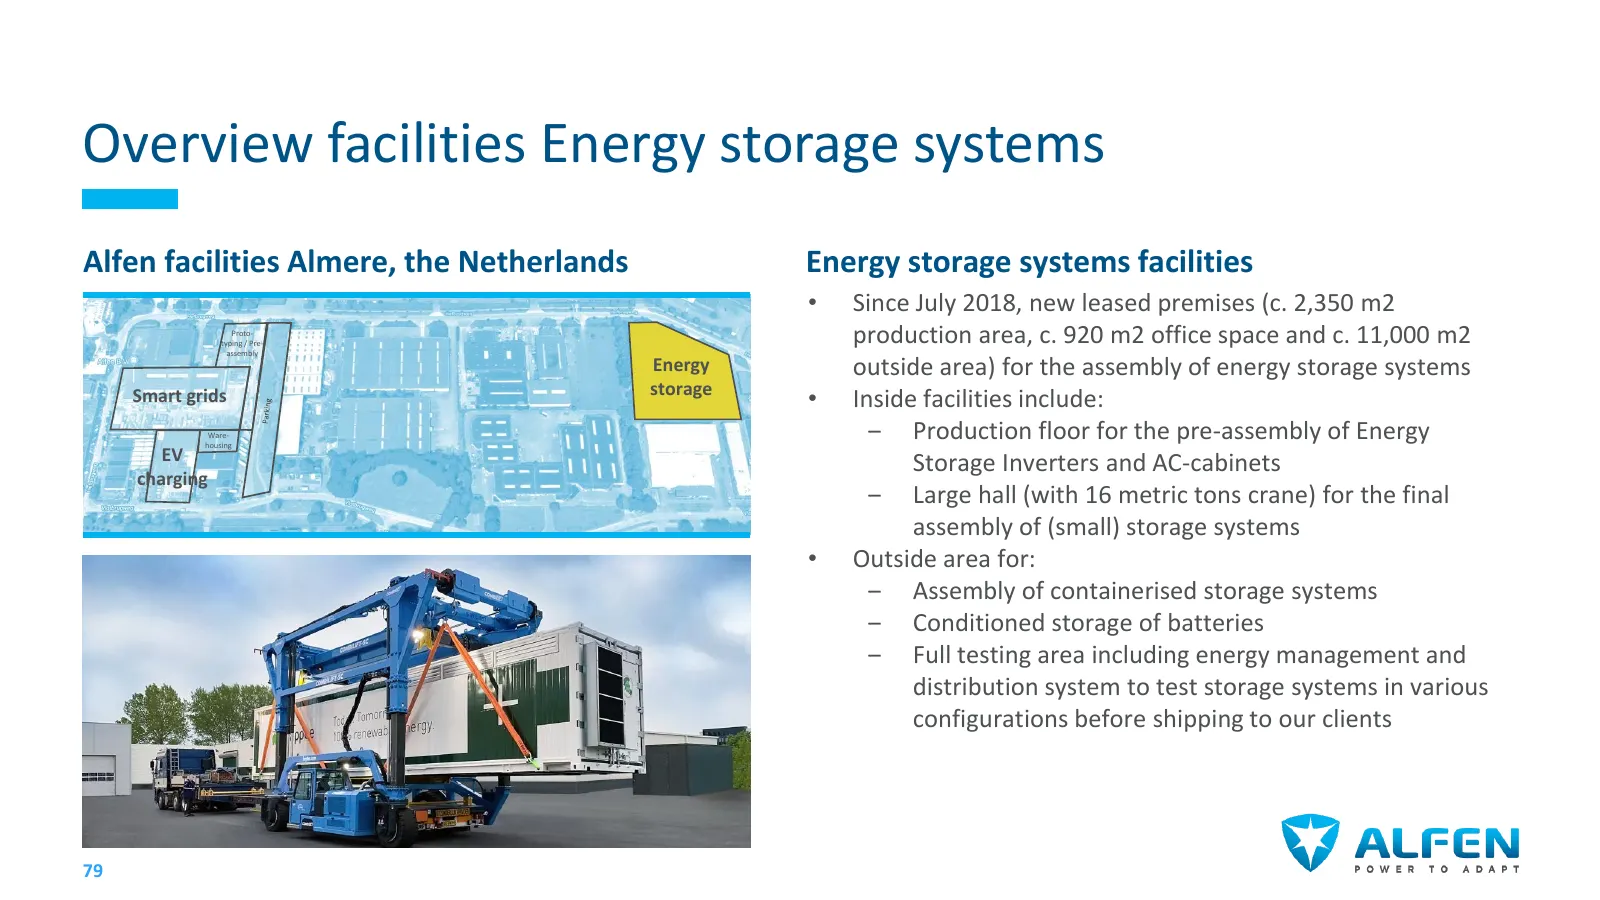
Overview facilities Energy storage systems Alfen facilities Almere, the Netherlands Energy storage systems facilities • Since July 2018, new leased premises (c. 2,350 m2 Proto- typing / Pre- assembly production area, c. 920 m2 office space and c. 11,000 m2 Energy outside area) for the assembly of en
Slide 79: Focus on continuous innovation
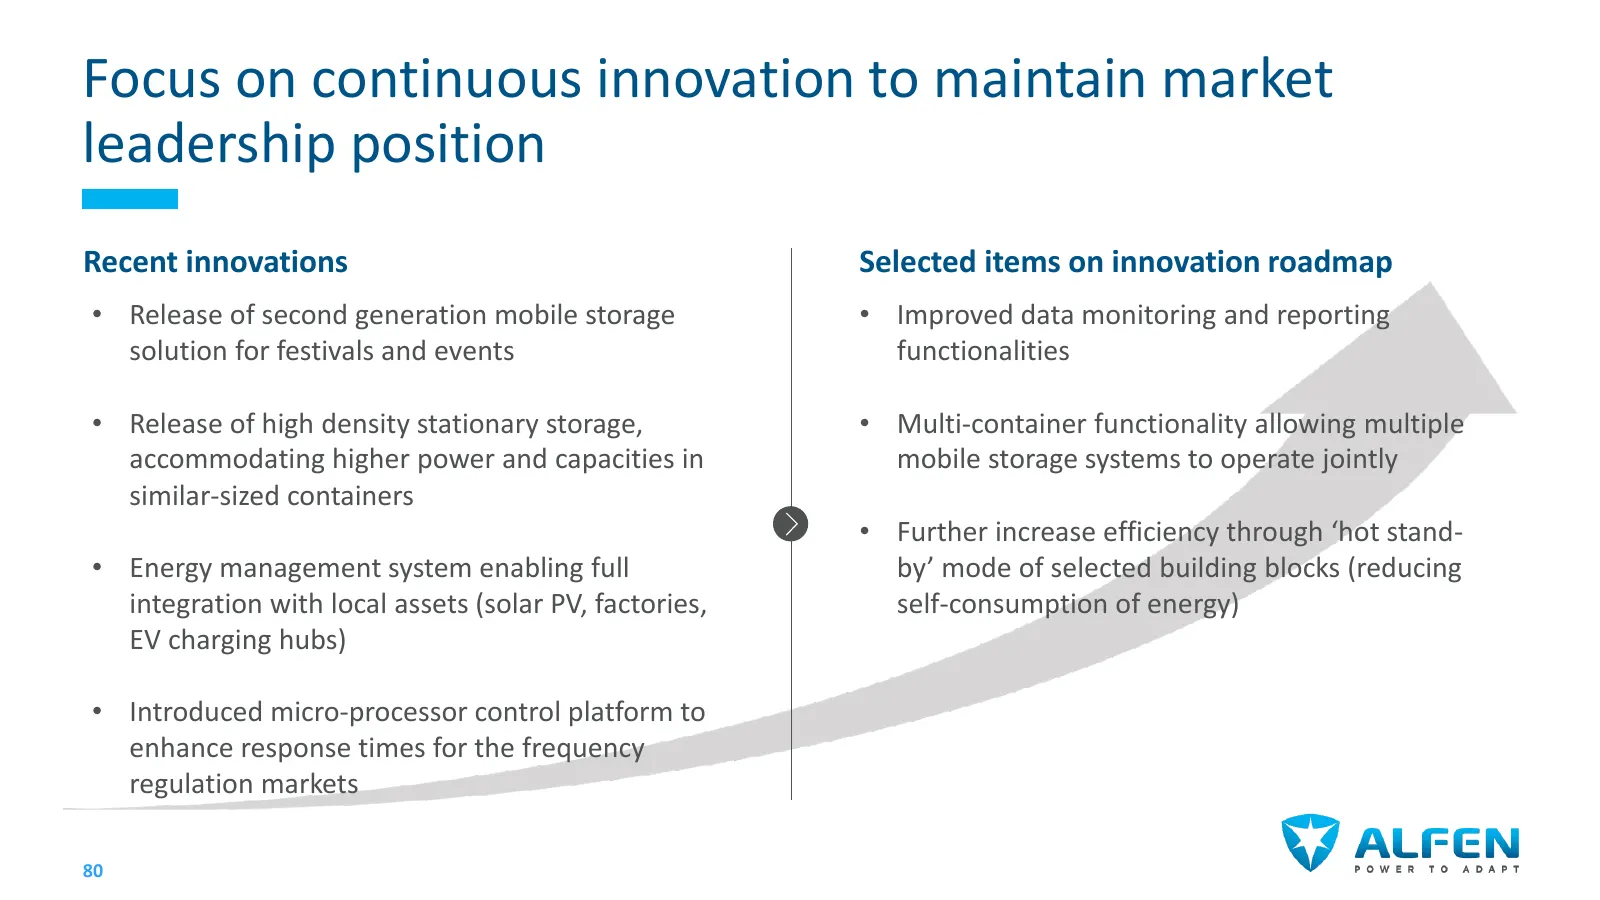
Focus on continuous innovation to maintain market leadership position Recent innovations Selected items on innovation roadmap • Release of second generation mobile storage • Improved data monitoring and reporting solution for festivals and events functionalities • Release of high density stationary
Slide 80: Summary of strategic focus
Summary of strategic focus Scaling-up with existing (international) clients and adding new clients across Europe (rest of world with a ‘follow- our-customer’ approach) Continuous innovation to maintain Energy storage technology leadership position systems Capture increasing share of recurring revenu
Slide 81: _ PELEMAN
_ PELEMAN @Eneco WY ALFEN NEXT Hier werken we samen aan de energietransitie : = ‘

Slide 82: Agenda
Agenda 09:00 Registration and welcome 09:30 Group review • Strategy recap • YTD performance and outlook 10:30 Coffee break 11:00 Business line deep dives • Smart grid solutions • EV charging • Energy storage 12:30 Wrap-up 12:45 Lunch 83
Slide 83: Agenda
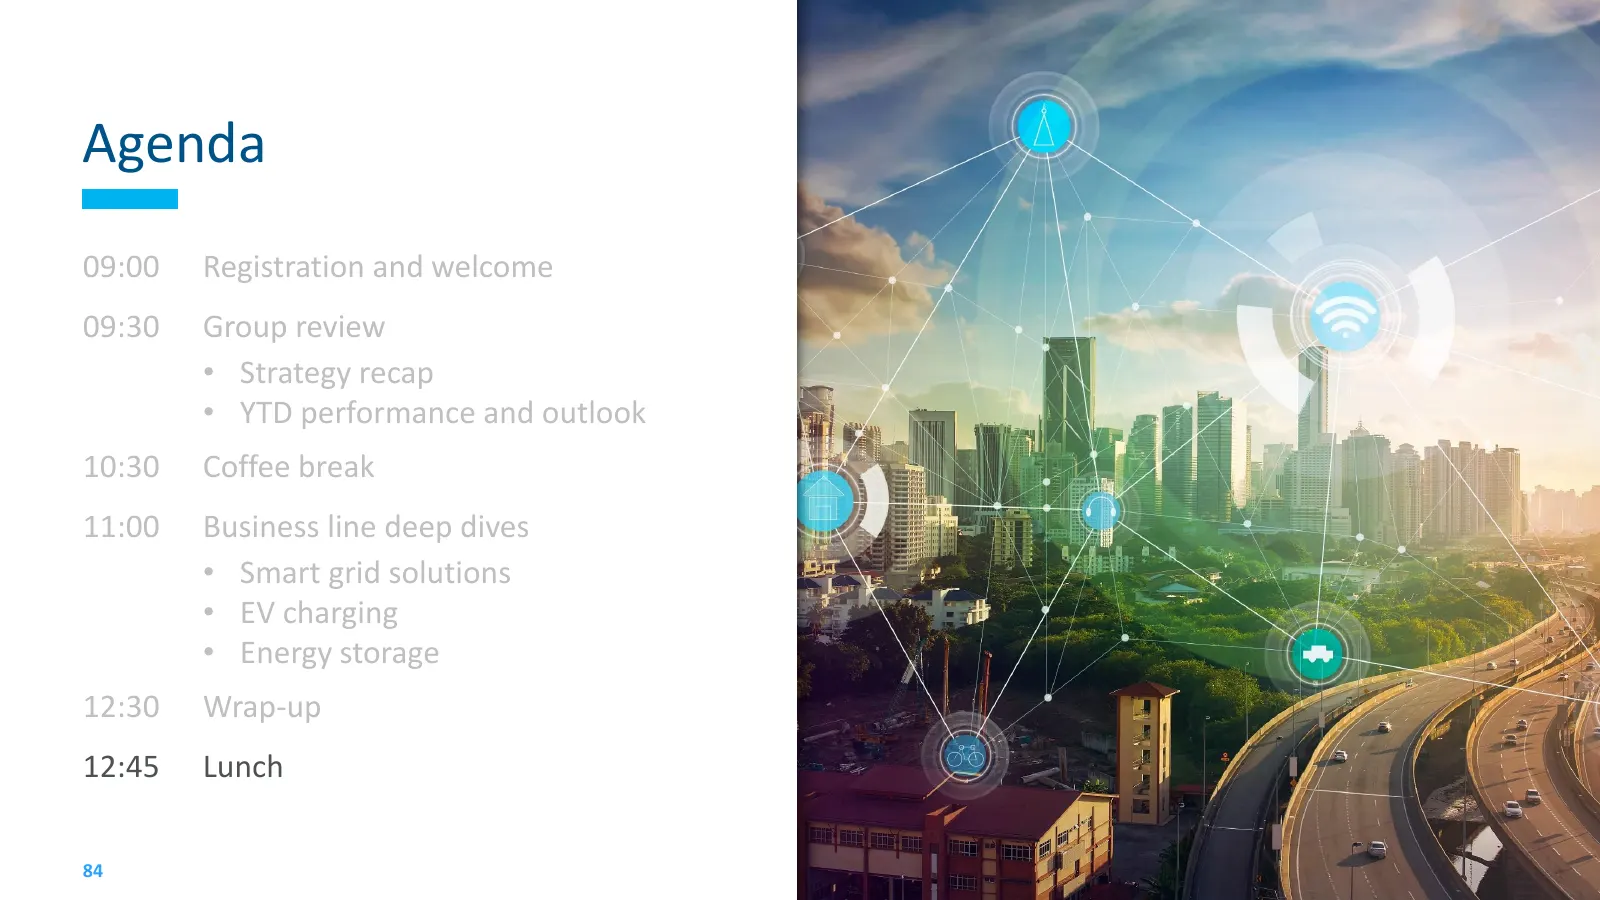
Agenda 09:00 Registration and welcome 09:30 Group review • Strategy recap • YTD performance and outlook 10:30 Coffee break 11:00 Business line deep dives • Smart grid solutions • EV charging • Energy storage 12:30 Wrap-up 12:45 Lunch 84
Slide 84: 85
85
Slide 85: Appendix - Income statement
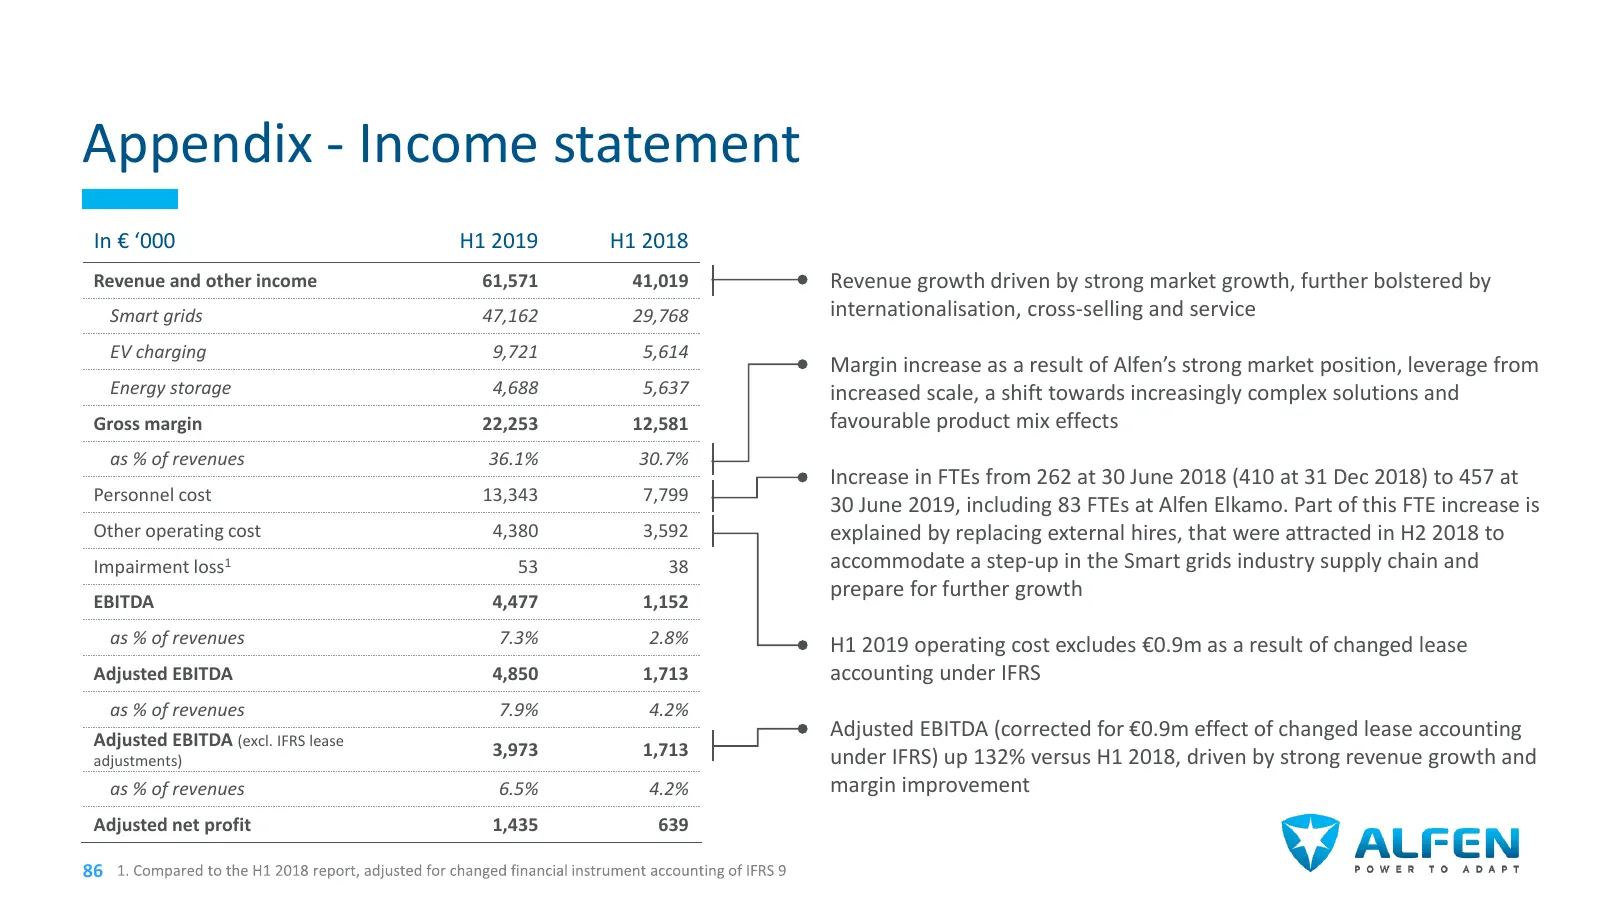
Appendix - Income statement In € ‘000 H1 2019 H1 2018 Revenue and other income 61,571 41,019 • Revenue growth driven by strong market growth, further bolstered by Smart grids 47,162 29,768 internationalisation, cross-selling and service EV charging 9,721 5,614 • Margin increase as a result of Alfen’
Slide 86: Appendix - Balance sheet
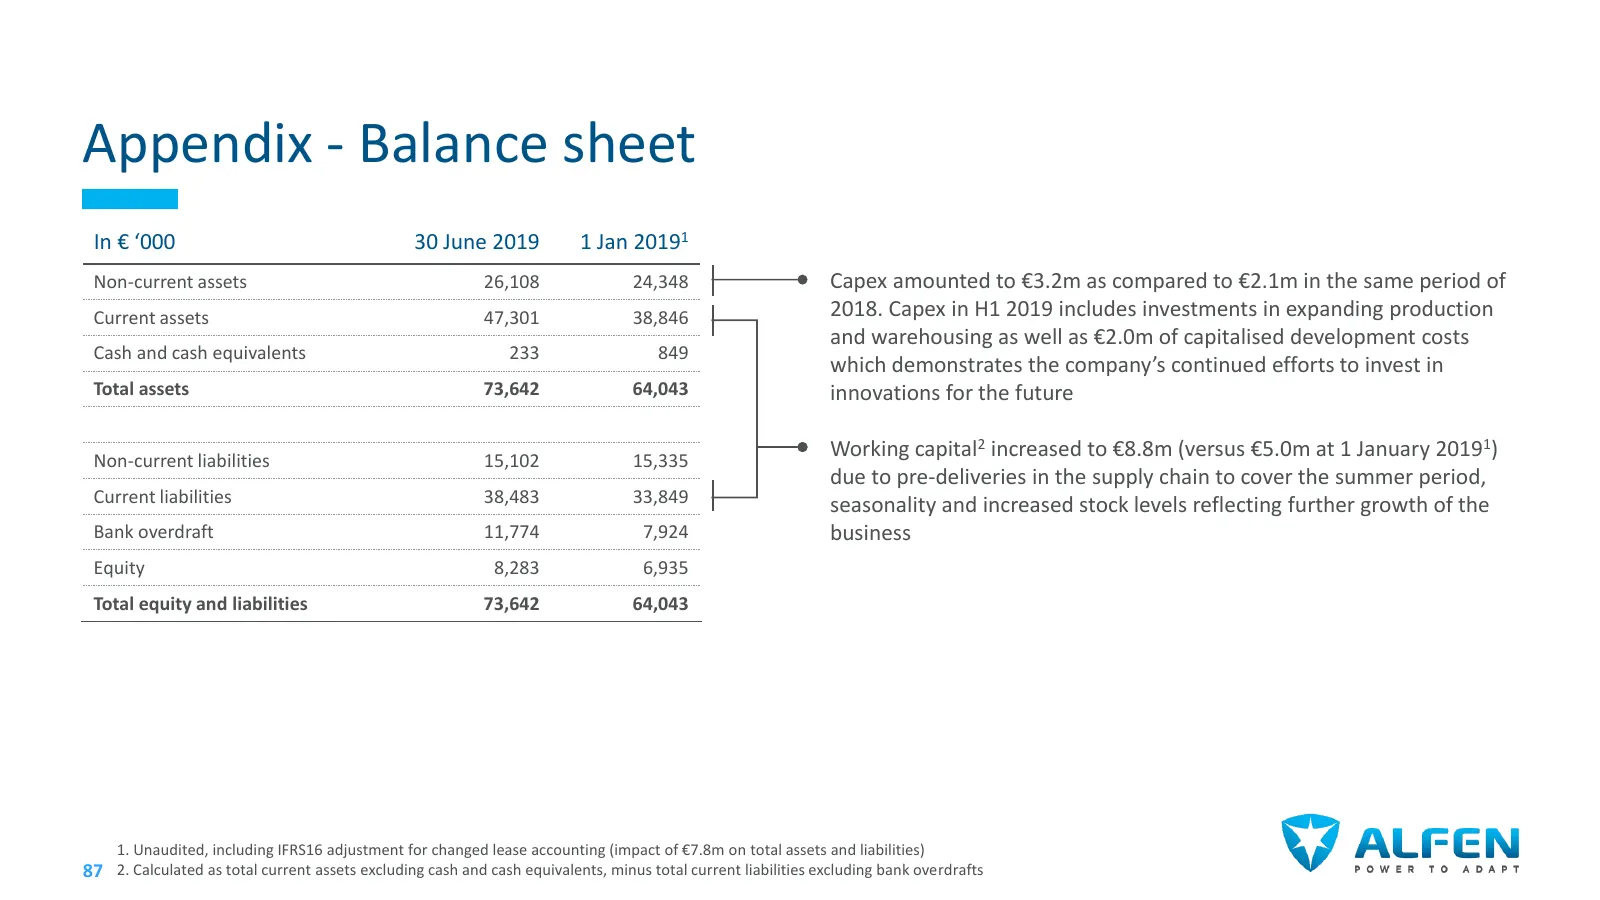
Appendix - Balance sheet In € ‘000 30 June 2019 1 Jan 20191 Non-current assets 26,108 24,348 • Capex amounted to €3.2m as compared to €2.1m in the same period of Current assets 47,301 38,846 2018. Capex in H1 2019 includes investments in expanding production and warehousing as well as €2.0m of capit
Source: Internet Archive copy of ir.alfen.com
More decks from Alfen NV
 Q3 2026 Earnings Presentation18 slides · Nov 4, 2026
 H1 2026 Earnings Presentation21 slides · Aug 19, 2026
 Q1 2026 Earnings Presentation18 slides · May 13, 2026
 FY2025 Earnings Presentation33 slides · Feb 11, 2026
 Q3 2025 Earnings Presentation18 slides · Nov 5, 2025
 H1 2025 Earnings Presentation22 slides · Aug 21, 2025