Spire Healthcare Group PLC · LSE:SPI
Spire Healthcare — FY2019 Earnings Presentation
52 slides from Spire Healthcare's earnings presentation, Mar 5, 2020

Slide 1: FY19 Results Presentation
FY19 Results Presentation 5 March 2020
Slide 2: Disclaimer
Disclaimer These materials contain certain forward-looking statements relating to the business of Spire Healthcare Group plc (the “Company”), including with respect to the progress, timing and completion of the Company’s development, the Company’s ability to treat, attract, and retain patients and c
Slide 3: Agenda
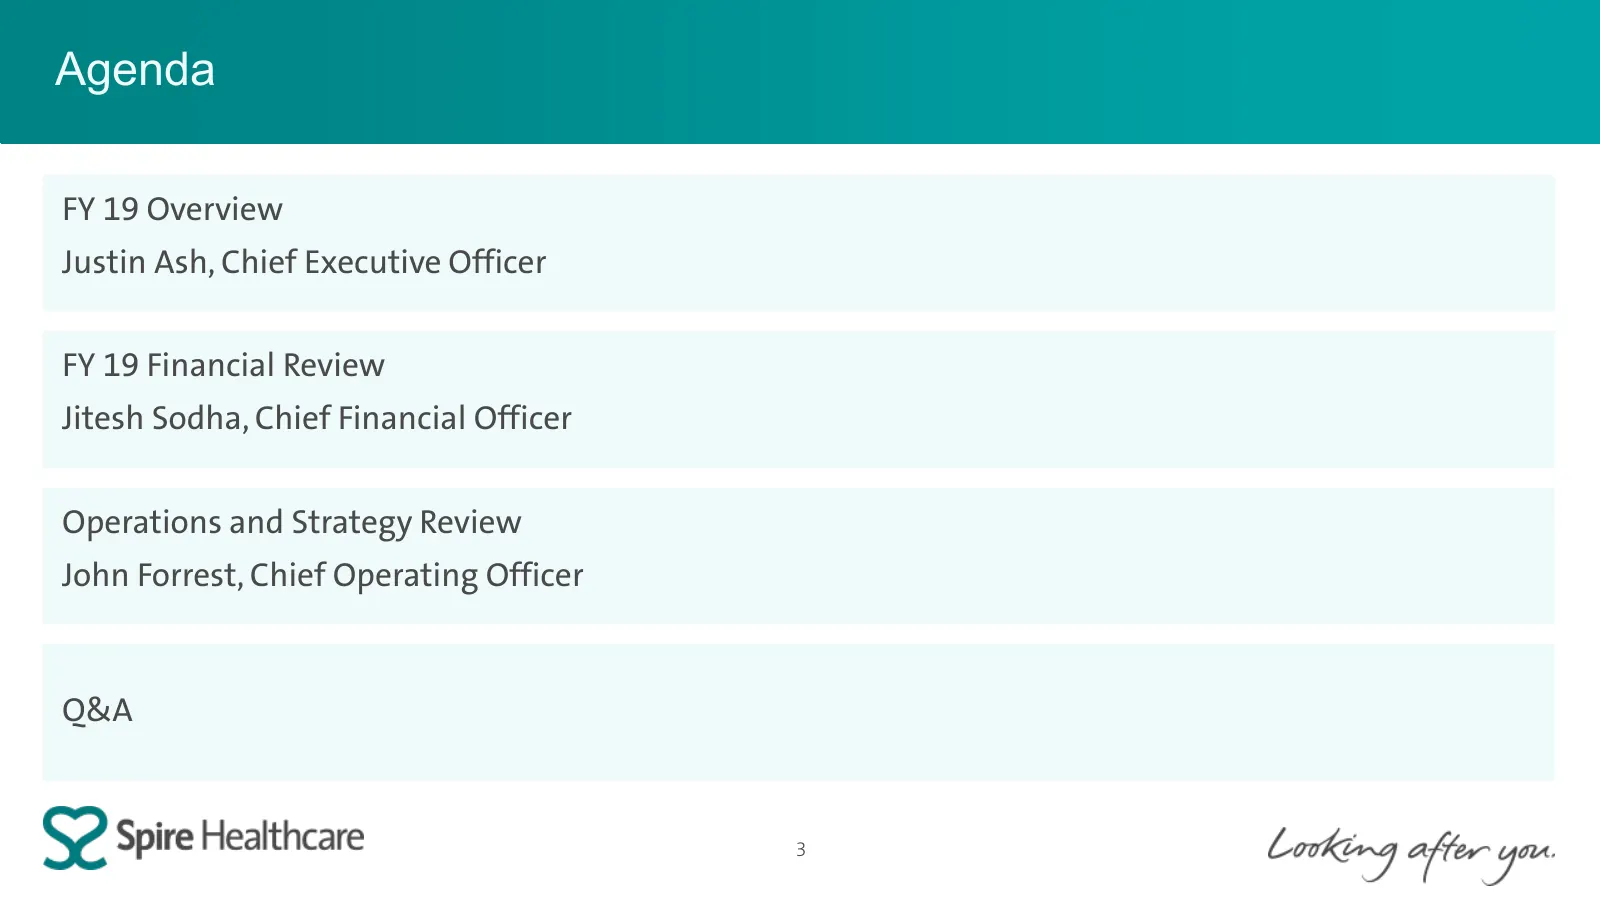
Agenda FY 19 Overview Justin Ash, Chief Executive Officer FY 19 Financial Review Jitesh Sodha, Chief Financial Officer Operations and Strategy Review John Forrest, Chief Operating Officer Q&A 3

Slide 4: FY19 Overview
FY 19 Overview Justin Ash, Chief Executive Officer
Slide 5: Our strategy
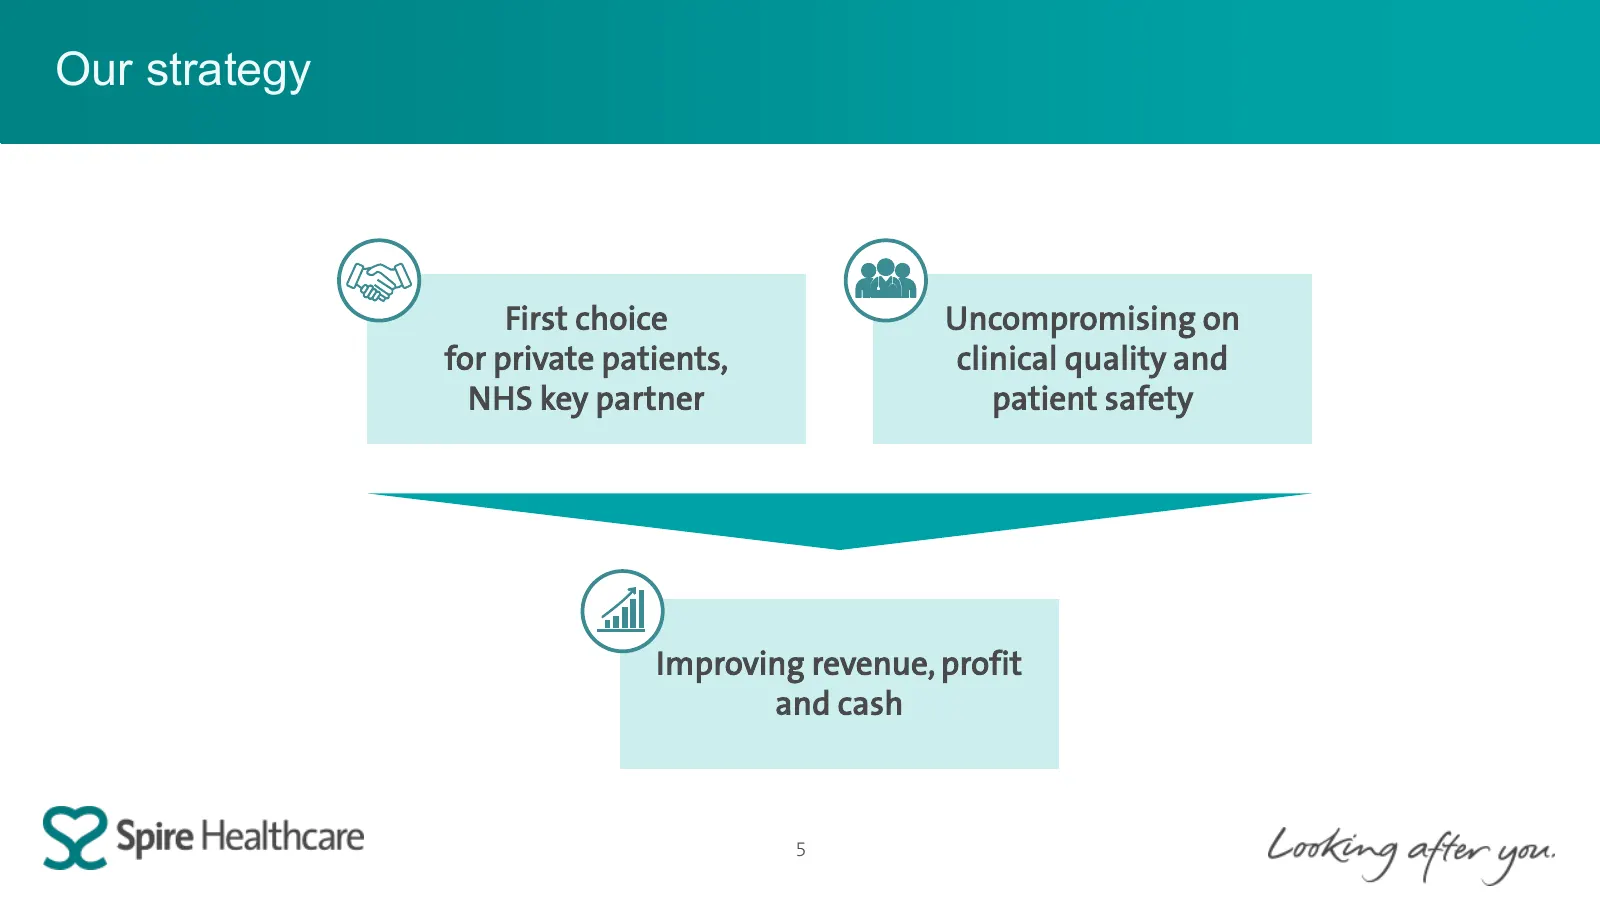
Our strategy First choice Uncompromising on for private patients, clinical quality and NHS key partner patient safety Improving revenue, profit and cash 5
Slide 6: Our strategy and purpose
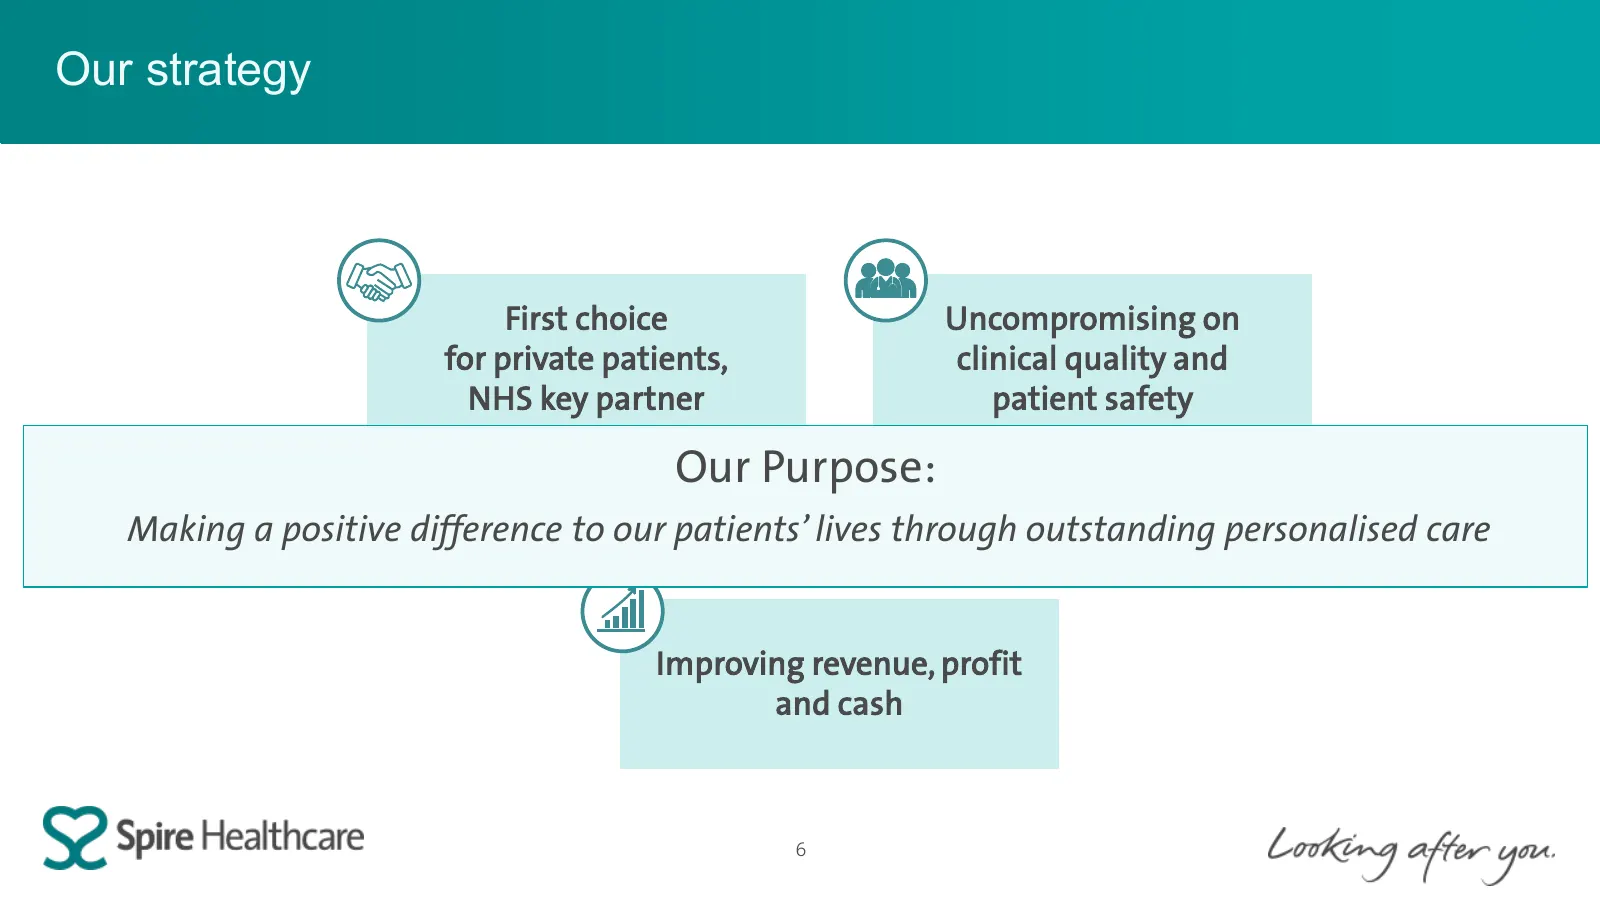
Our strategy First choice Uncompromising on for private patients, clinical quality and NHS key partner patient safety Our Purpose: Making a positive difference to our patients’ lives through outstanding personalised care Improving revenue, profit and cash 6
Slide 7: Delivering on strategy
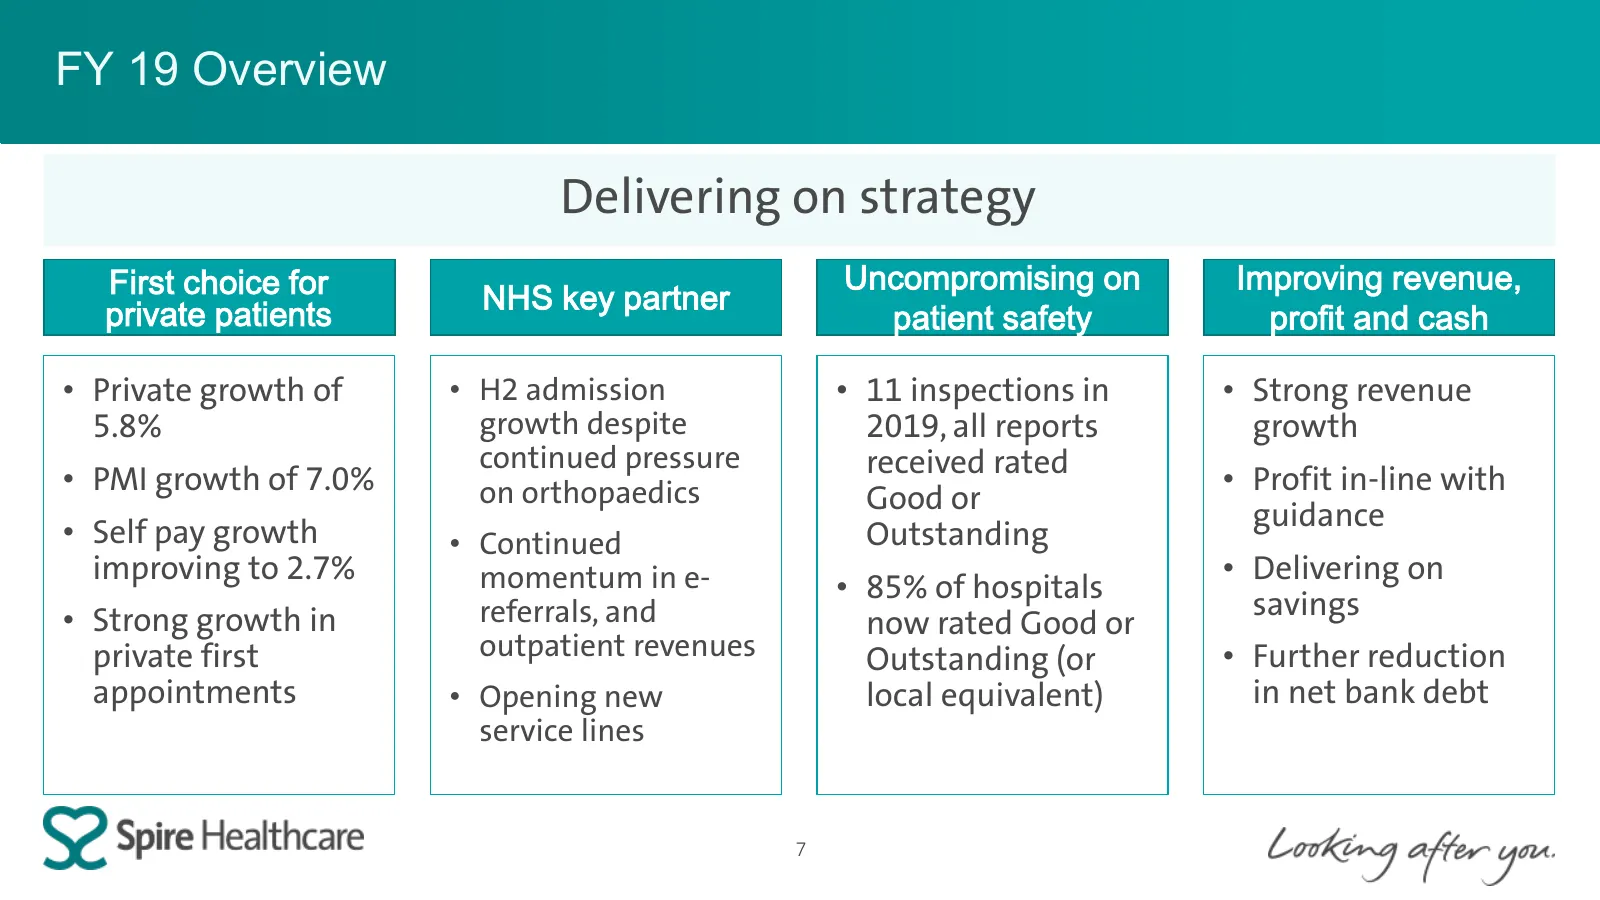
FY 19 Overview Delivering on strategy First choice for Uncompromising on Improving revenue, private patients NHS key partner patient safety profit and cash • Private growth of • H2 admission • 11 inspections in • Strong revenue 5.8% growth despite 2019, all reports growth continued pressure received
Slide 8: Strategic focus
Strategic focus Delivering on strategy First choice for Improving NHS key Uncompromising private revenue, profit partner on patient safety patients and cash 8

Slide 9: Quality initiatives
Quality initiatives Justin Ash, Chief Executive Officer
Slide 10: Uncompromising on clinical quality and patient safety
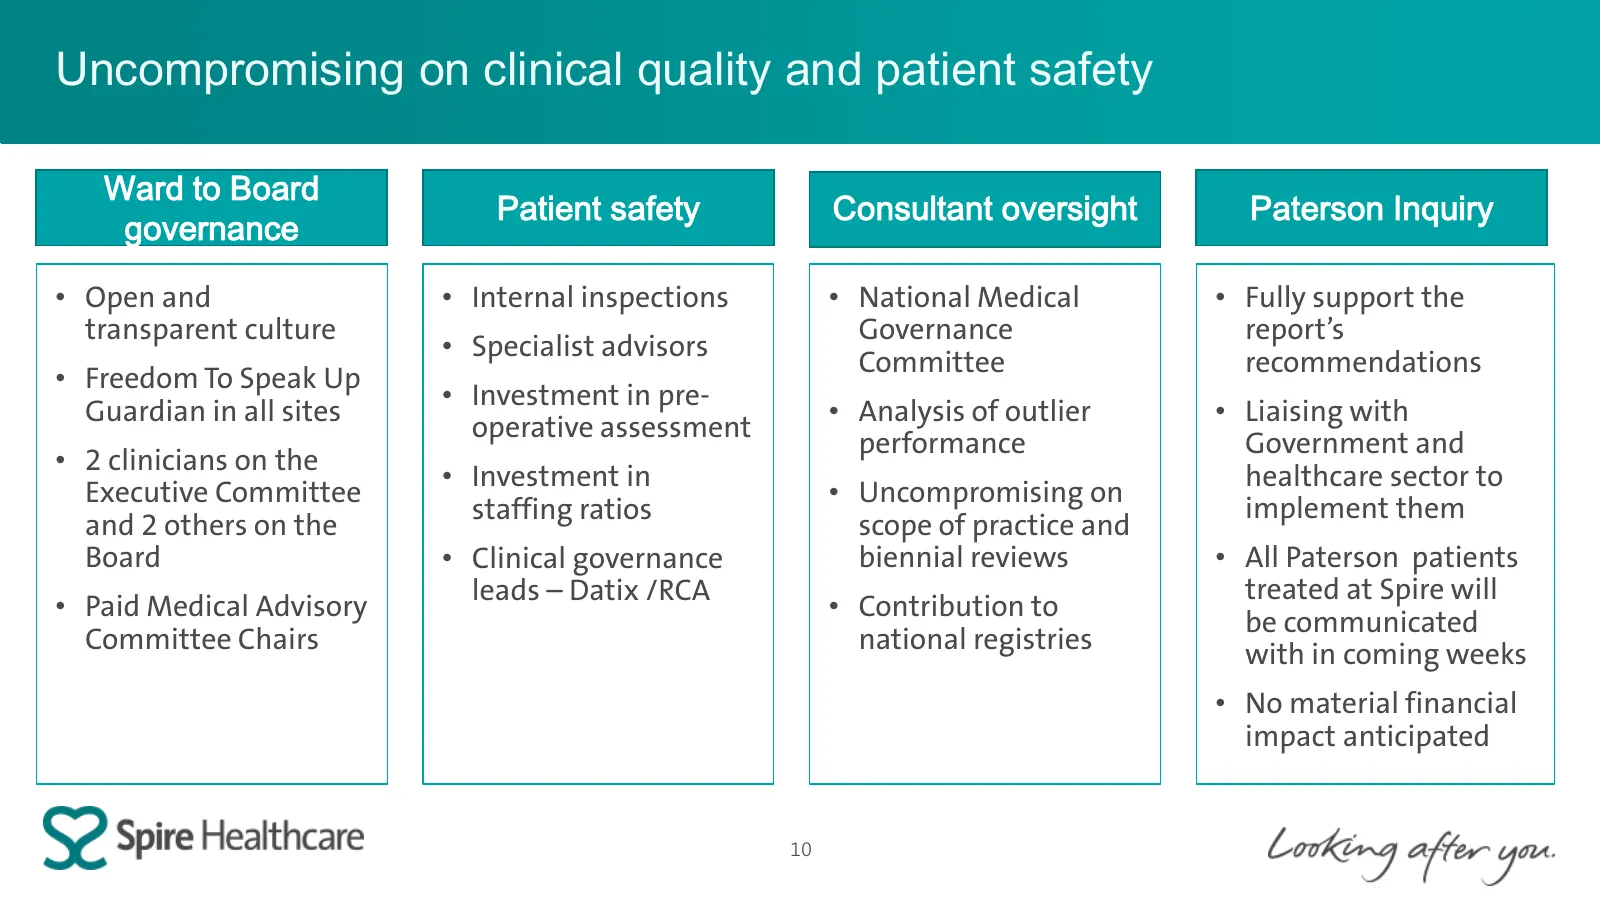
Uncompromising on clinical quality and patient safety Ward to Board Patient safety Consultant oversight Paterson Inquiry governance • Open and • Internal inspections • National Medical • Fully support the transparent culture Governance report’s • Specialist advisors Committee recommendations • Freed
Slide 11: Rigorous consultant oversight
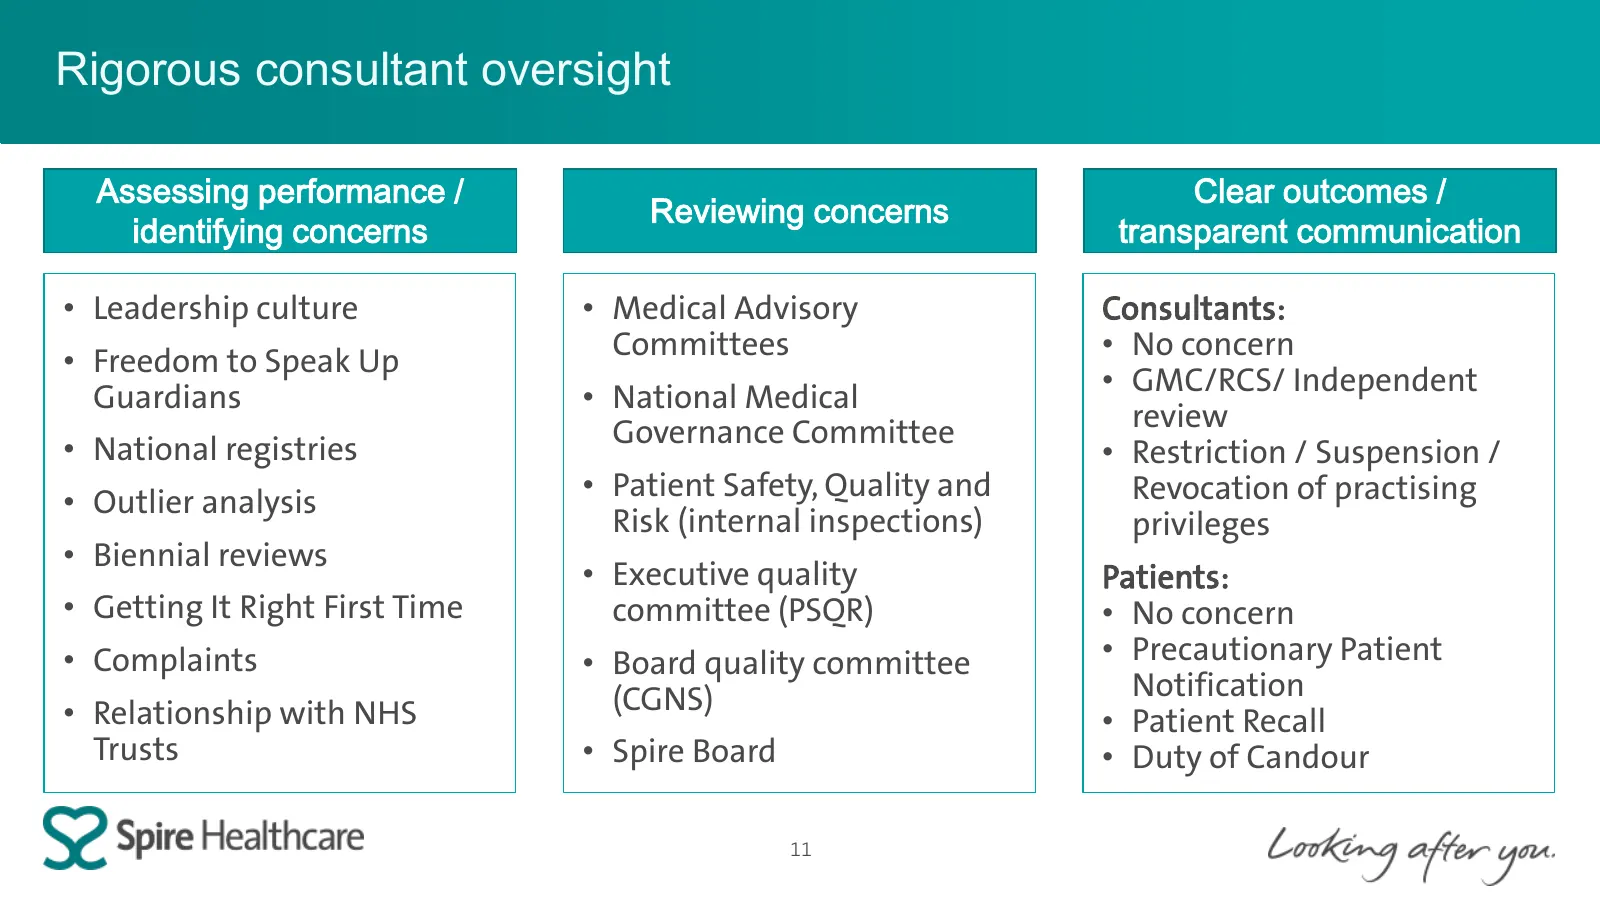
Rigorous consultant oversight Assessing performance / Clear outcomes / Reviewing concerns identifying concerns transparent communication • Leadership culture • Medical Advisory Consultants: • Freedom to Speak Up Committees • No concern Guardians • National Medical • GMC/RCS/ Independent Governance C
Slide 12: Driving up quality ratings
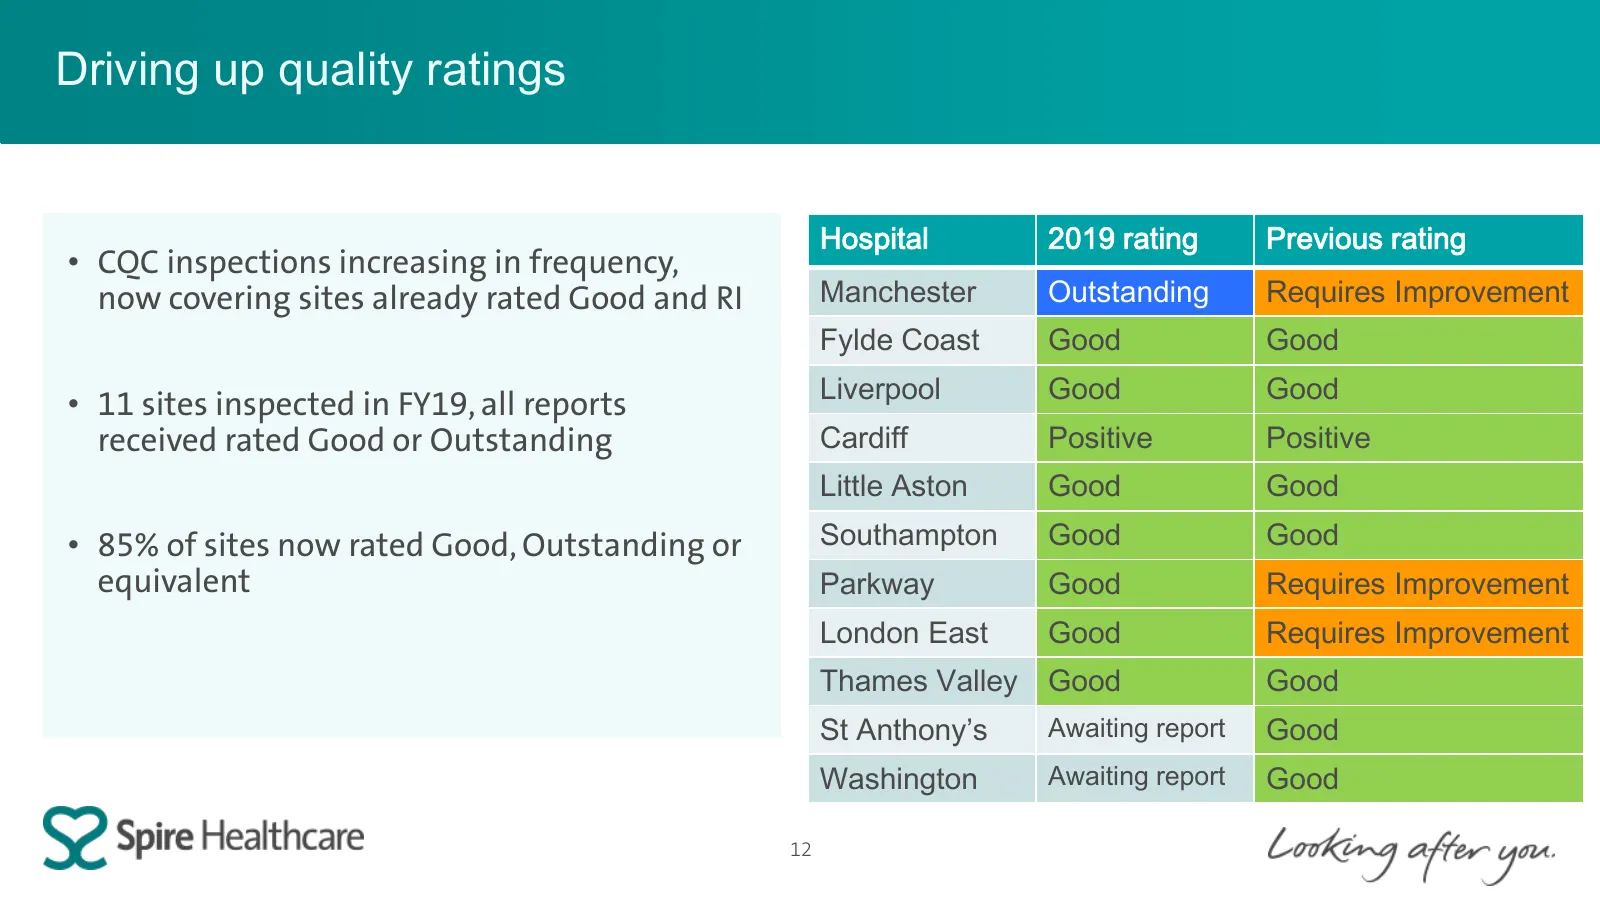
Driving up quality ratings Hospital 2019 rating Previous rating • CQC inspections increasing in frequency, now covering sites already rated Good and RI Manchester Outstanding Requires Improvement Fylde Coast Good Good Liverpool Good Good • 11 sites inspected in FY19, all reports received rated Good
Slide 13: Demonstrating robust quality systems
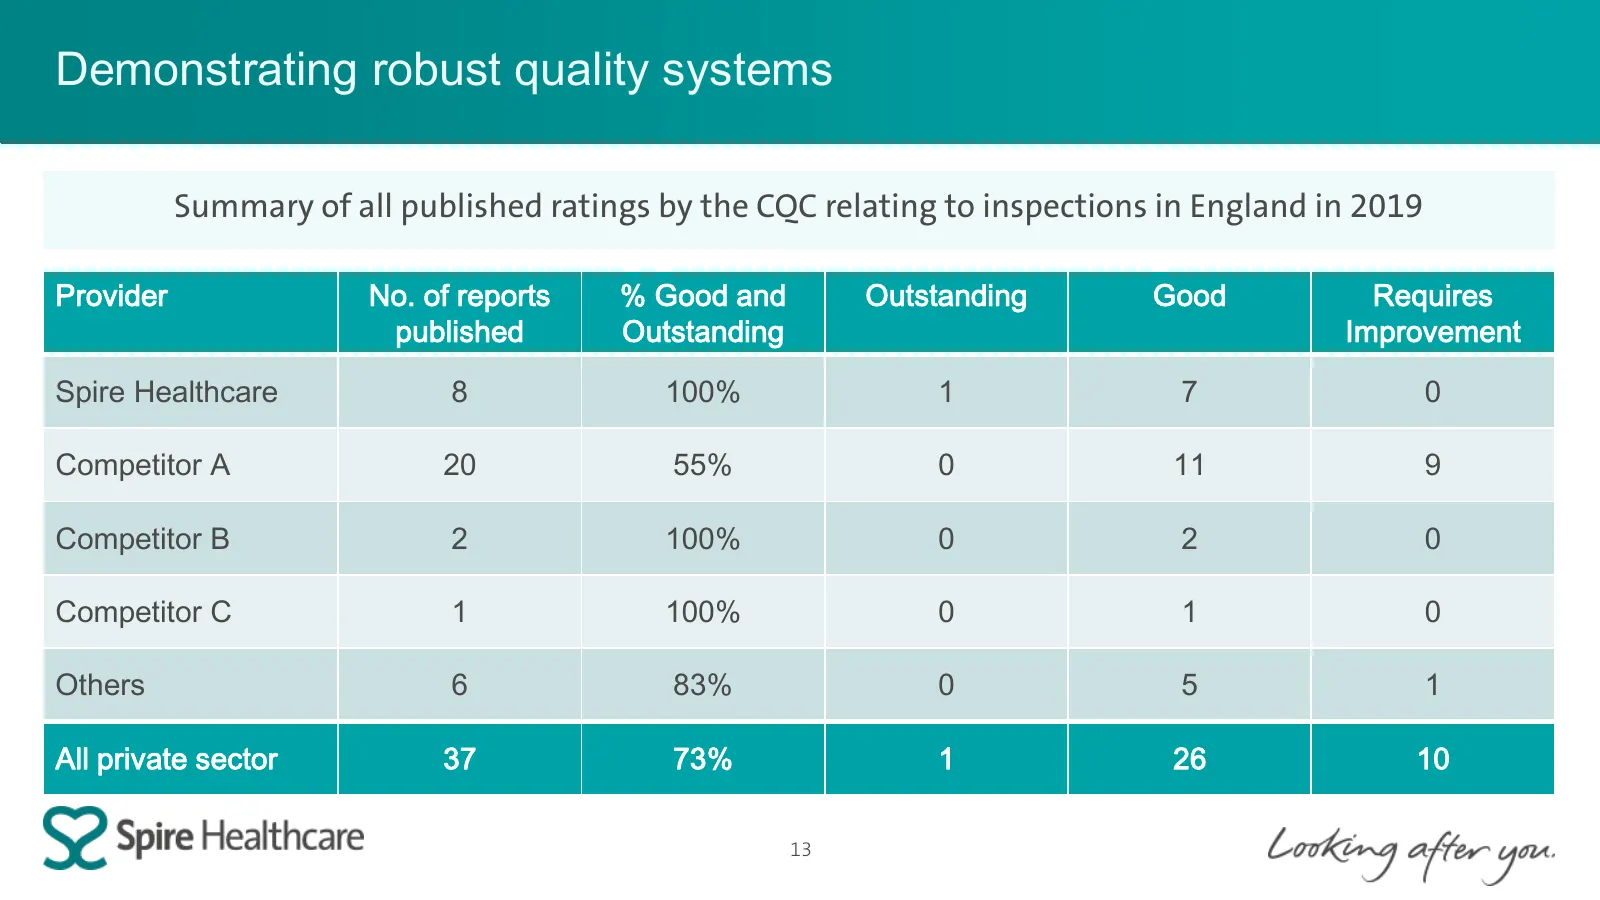
Demonstrating robust quality systems Summary of all published ratings by the CQC relating to inspections in England in 2019 Provider No. of reports % Good and Outstanding GoodRegulatory oversight Requires published Outstanding Improvement Spire Healthcare 8 100% 1 7 0 Competitor A 20 55% 0 11 9 Comp

Slide 14: FY19 Financial Review
FY 19 Financial Review Jitesh Sodha, Chief Financial Officer
Slide 15: FY19 highlights
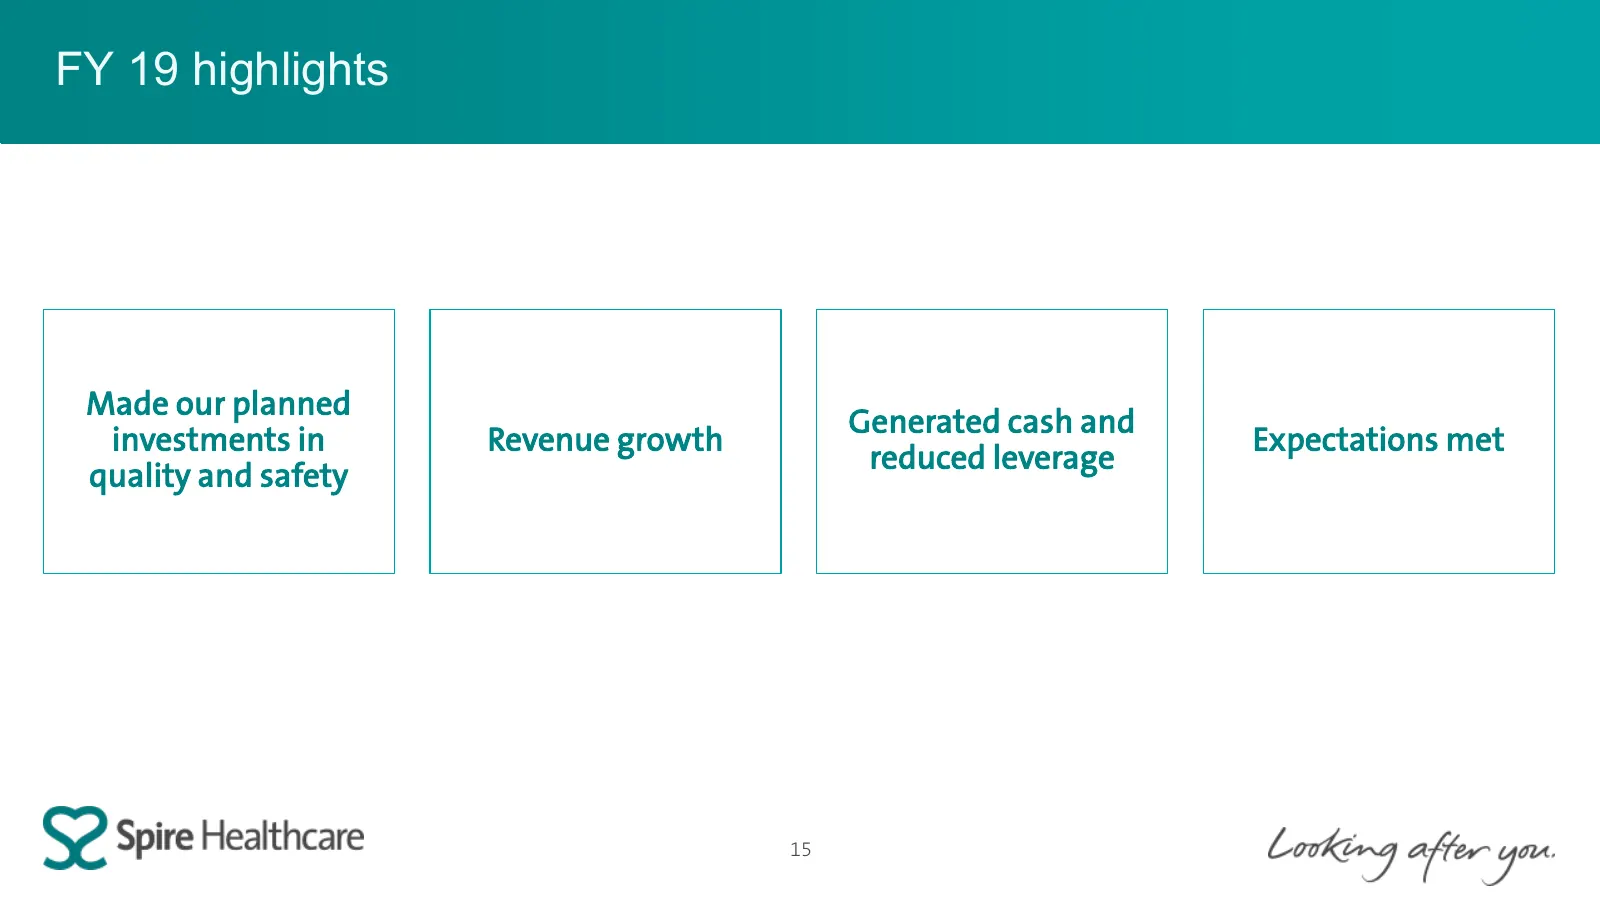
FY 19 highlights Made our planned Generated cash and investments in Revenue growth Expectations met reduced leverage quality and safety 15
Slide 16: Financial Headlines FY19: in-line with expectations
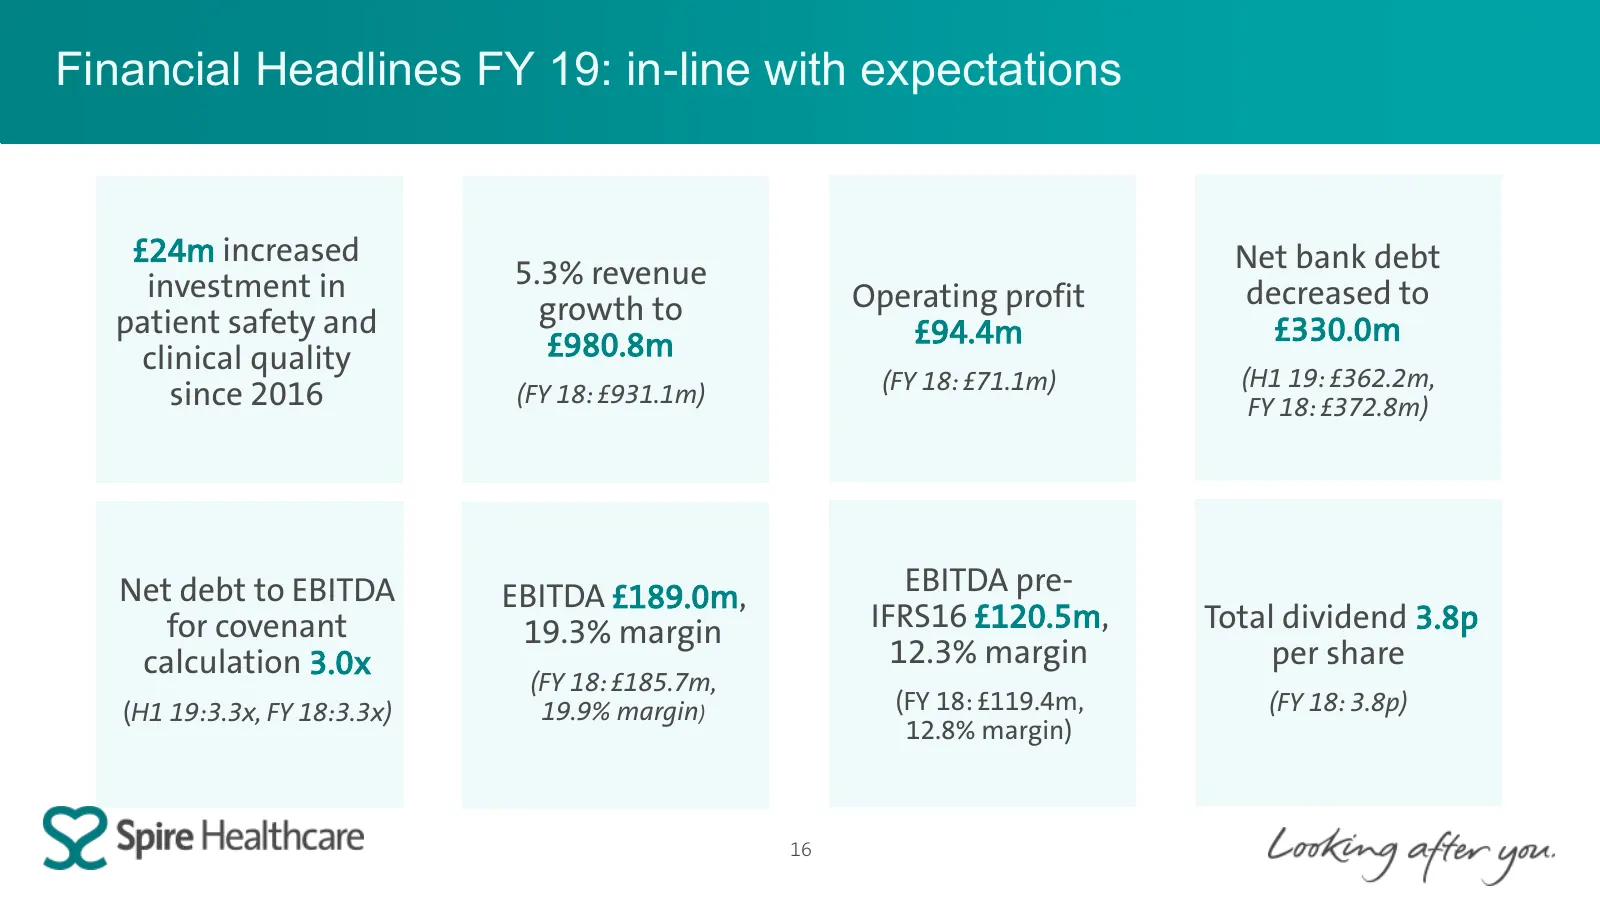
Financial Headlines FY 19: in-line with expectations £24m increased Net bank debt investment in 5.3% revenue growth to Operating profit decreased to patient safety and £94.4m £330.0m clinical quality £980.8m (FY 18: £71.1m) (H1 19: £362.2m, since 2016 (FY 18: £931.1m) FY 18: £372.8m) Net debt to EBI
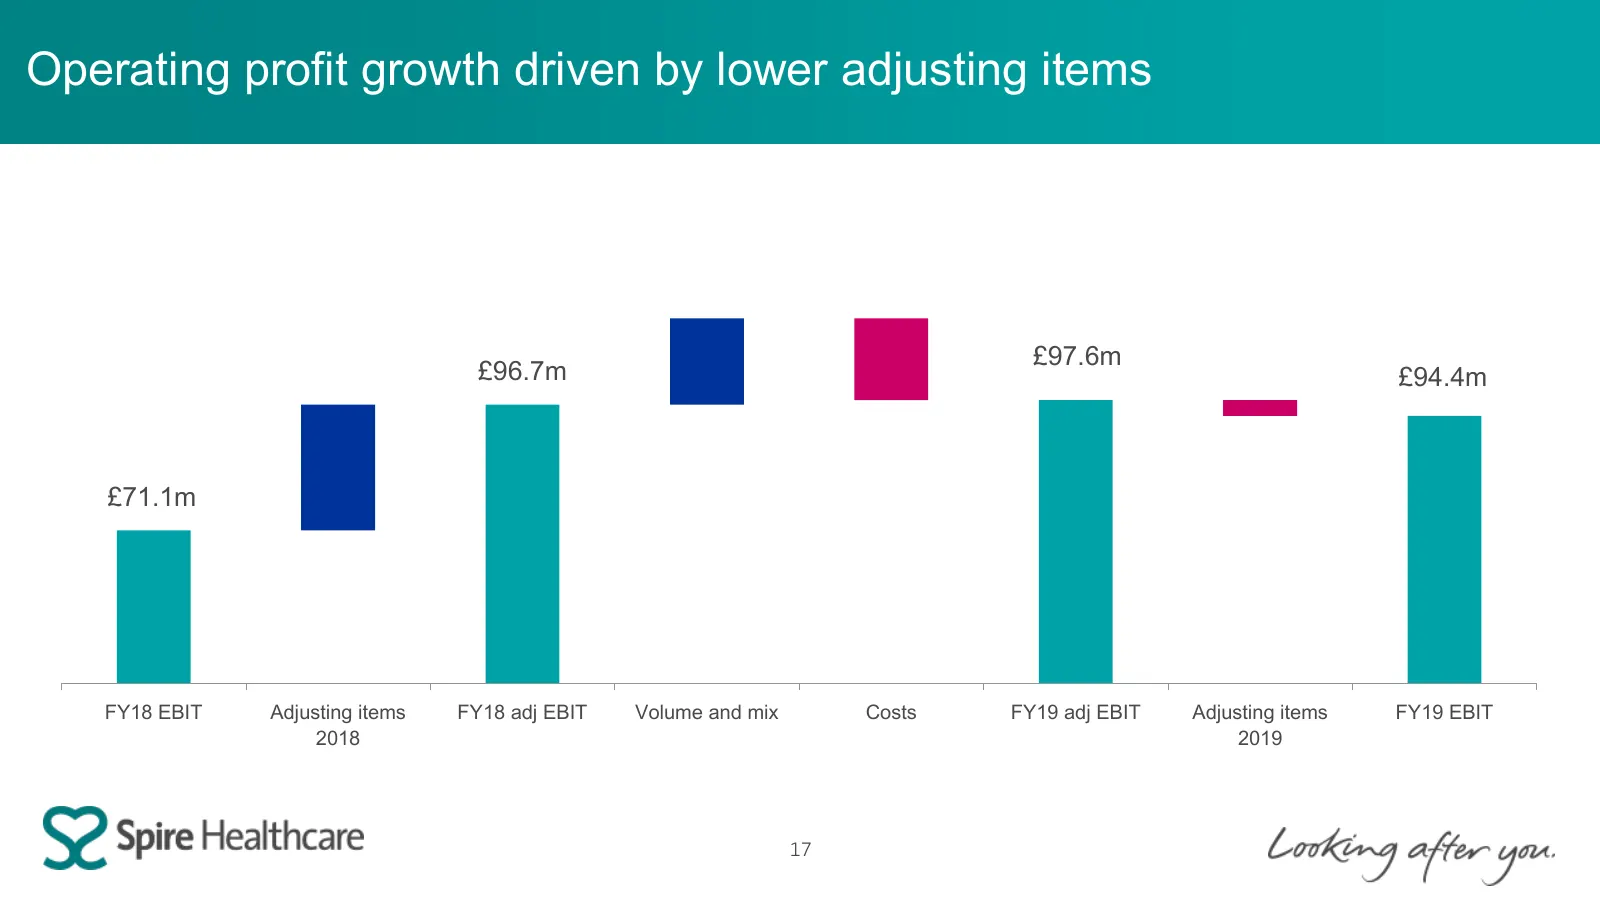
Slide 17: Operating profit growth driven by lower adjusting items
Operating profit growth driven by lower adjusting items £97.6m £96.7m £94.4m £71.1m FY18 EBIT Adjusting items FY18 adj EBIT Volume and mix Costs FY19 adj EBIT Adjusting items FY19 EBIT 2018 2019 17
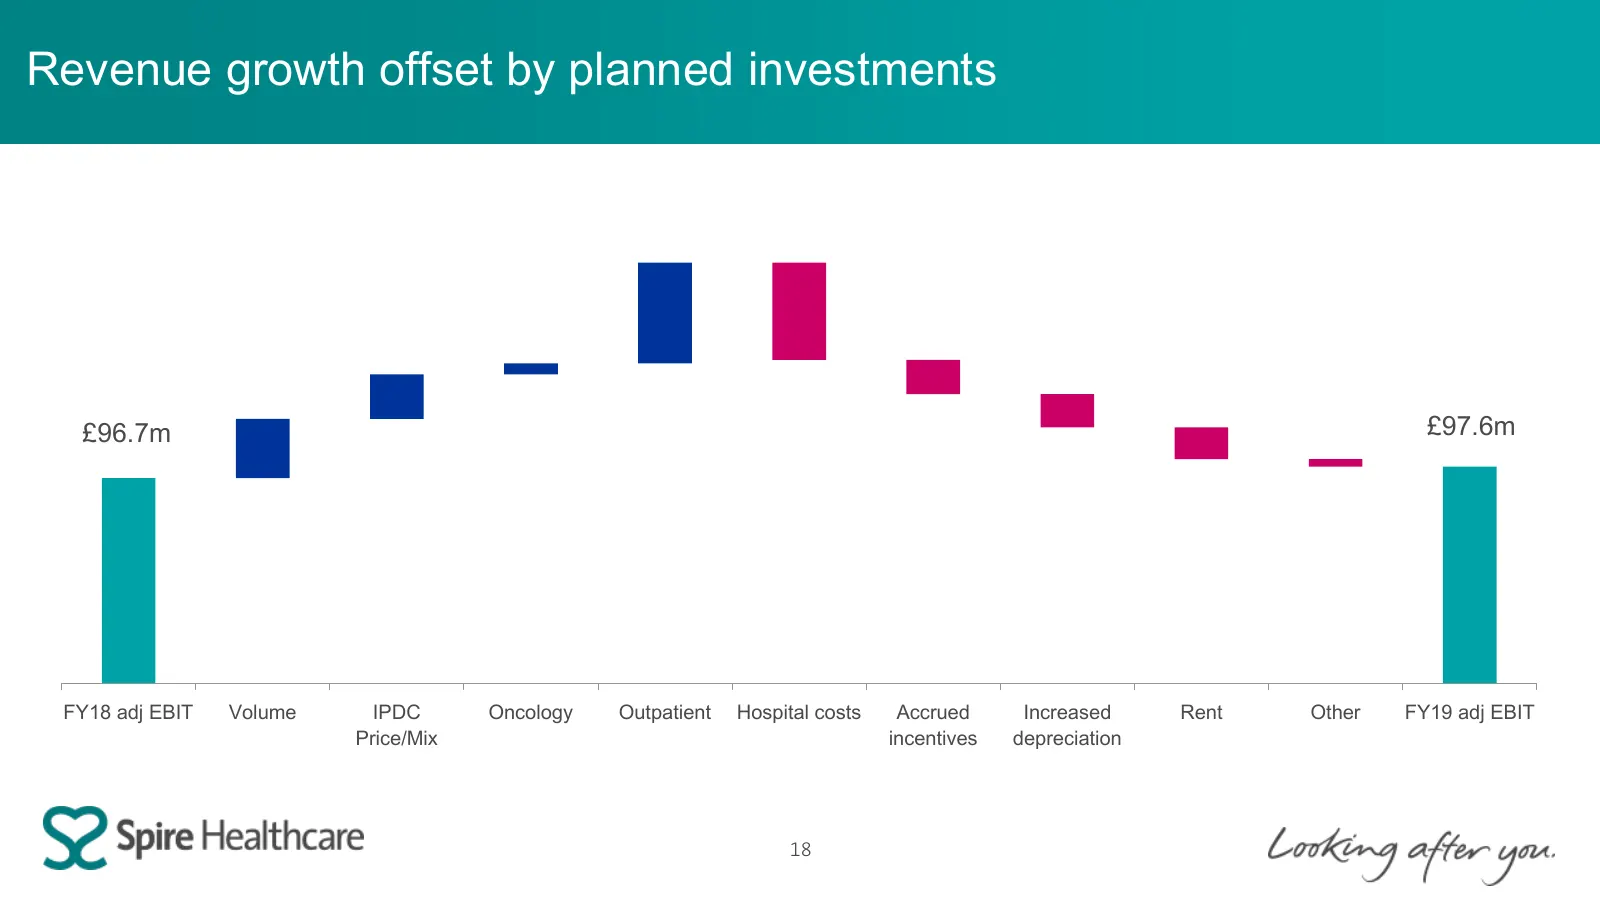
Slide 18: Revenue growth offset by planned investments
Revenue growth offset by planned investments £96.7m £97.6m FY18 adj EBIT Volume IPDC Oncology Outpatient Hospital costs Accrued Increased Rent Other FY19 adj EBIT Price/Mix incentives depreciation 18
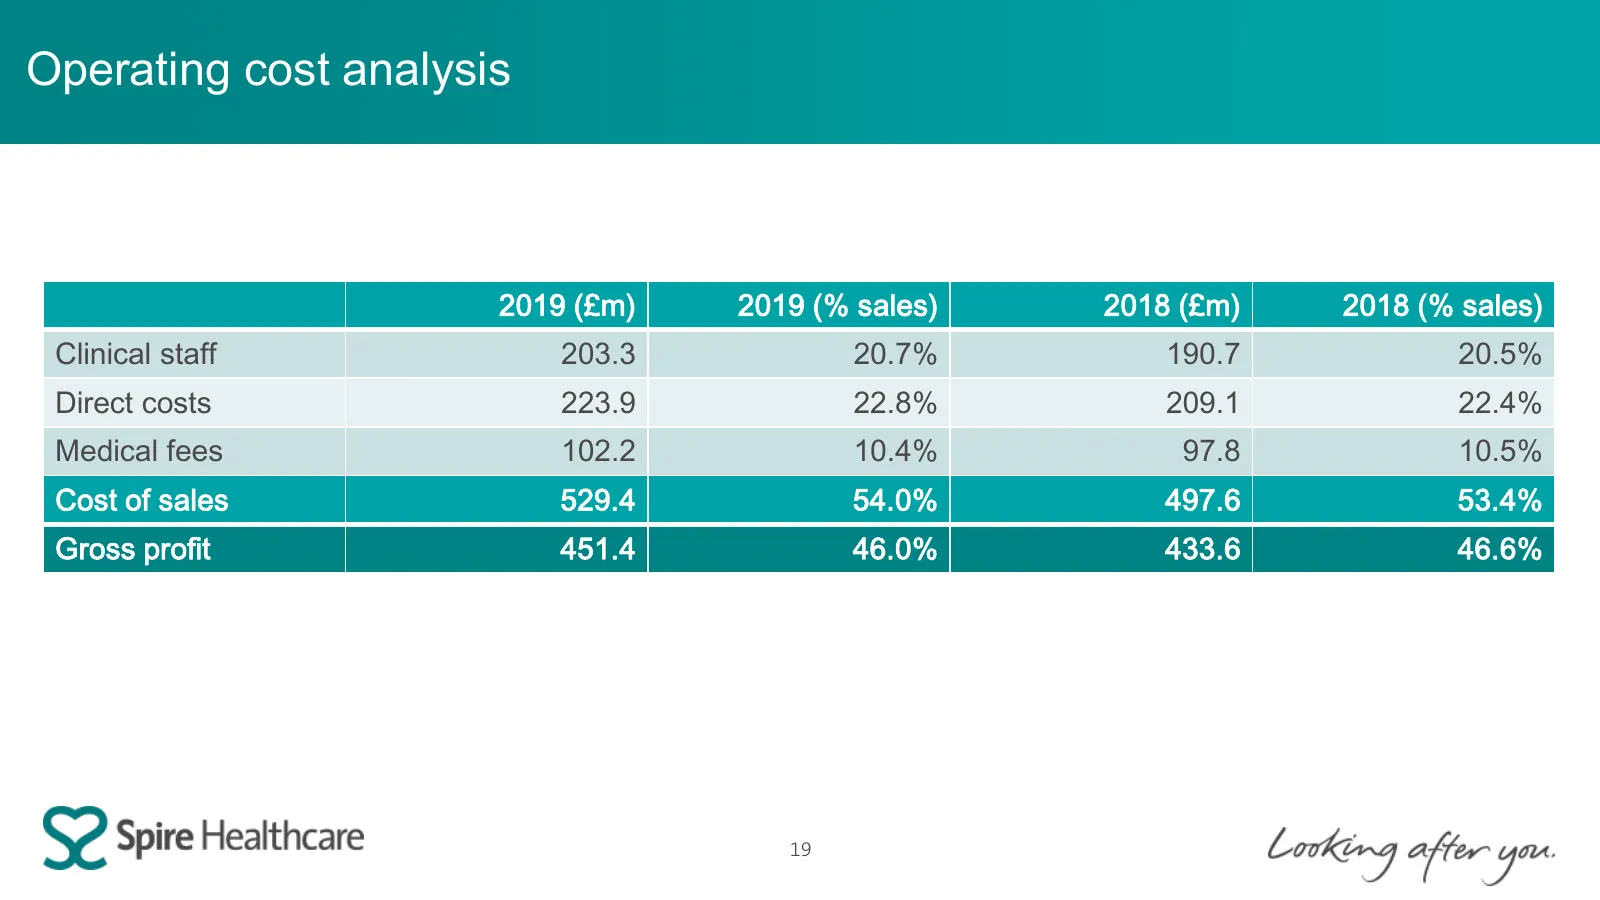
Slide 19: Operating cost analysis
Operating cost analysis 2019 (£m) 2019 (% sales) 2018 (£m) 2018 (% sales) Clinical staff 203.3 20.7% 190.7 20.5% Direct costs 223.9 22.8% 209.1 22.4% Medical fees 102.2 10.4% 97.8 10.5% Cost of sales 529.4 54.0% 497.6 53.4% Gross profit 451.4 46.0% 433.6 46.6% 19
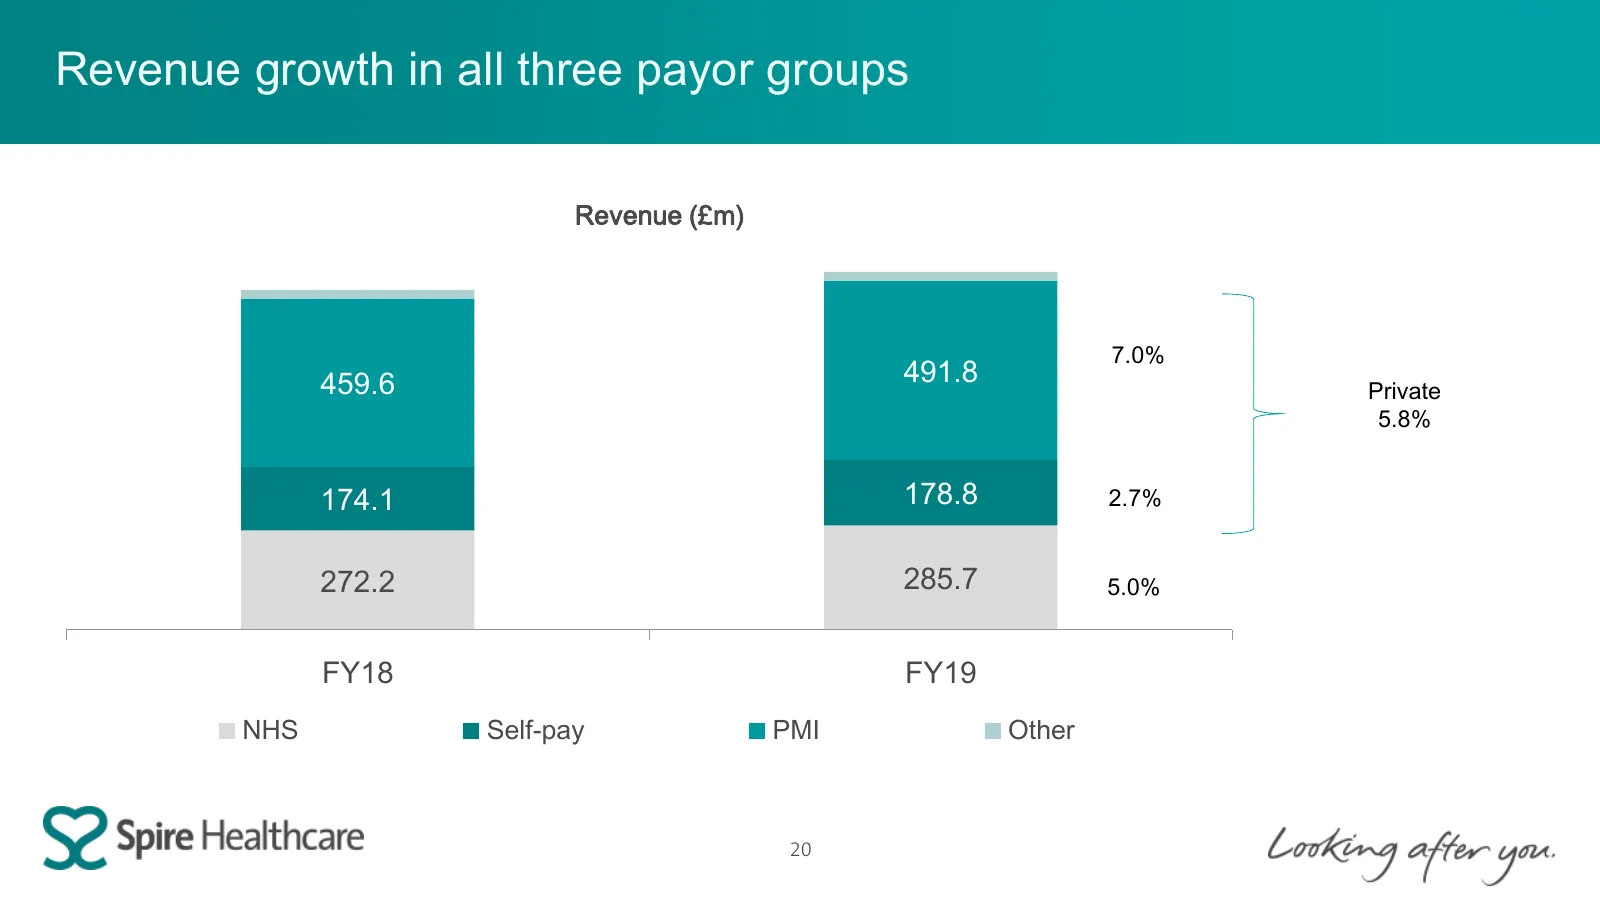
Slide 20: Revenue growth in all three payor groups
Revenue growth in all three payor groups Revenue (£m) 7.0% 459.6 491.8 Private 5.8% 174.1 178.8 2.7% 272.2 285.7 5.0% FY18 FY19 NHS Self-pay PMI Other 20
Slide 21: Revenue growth in all three payor groups, particularly in outpatients
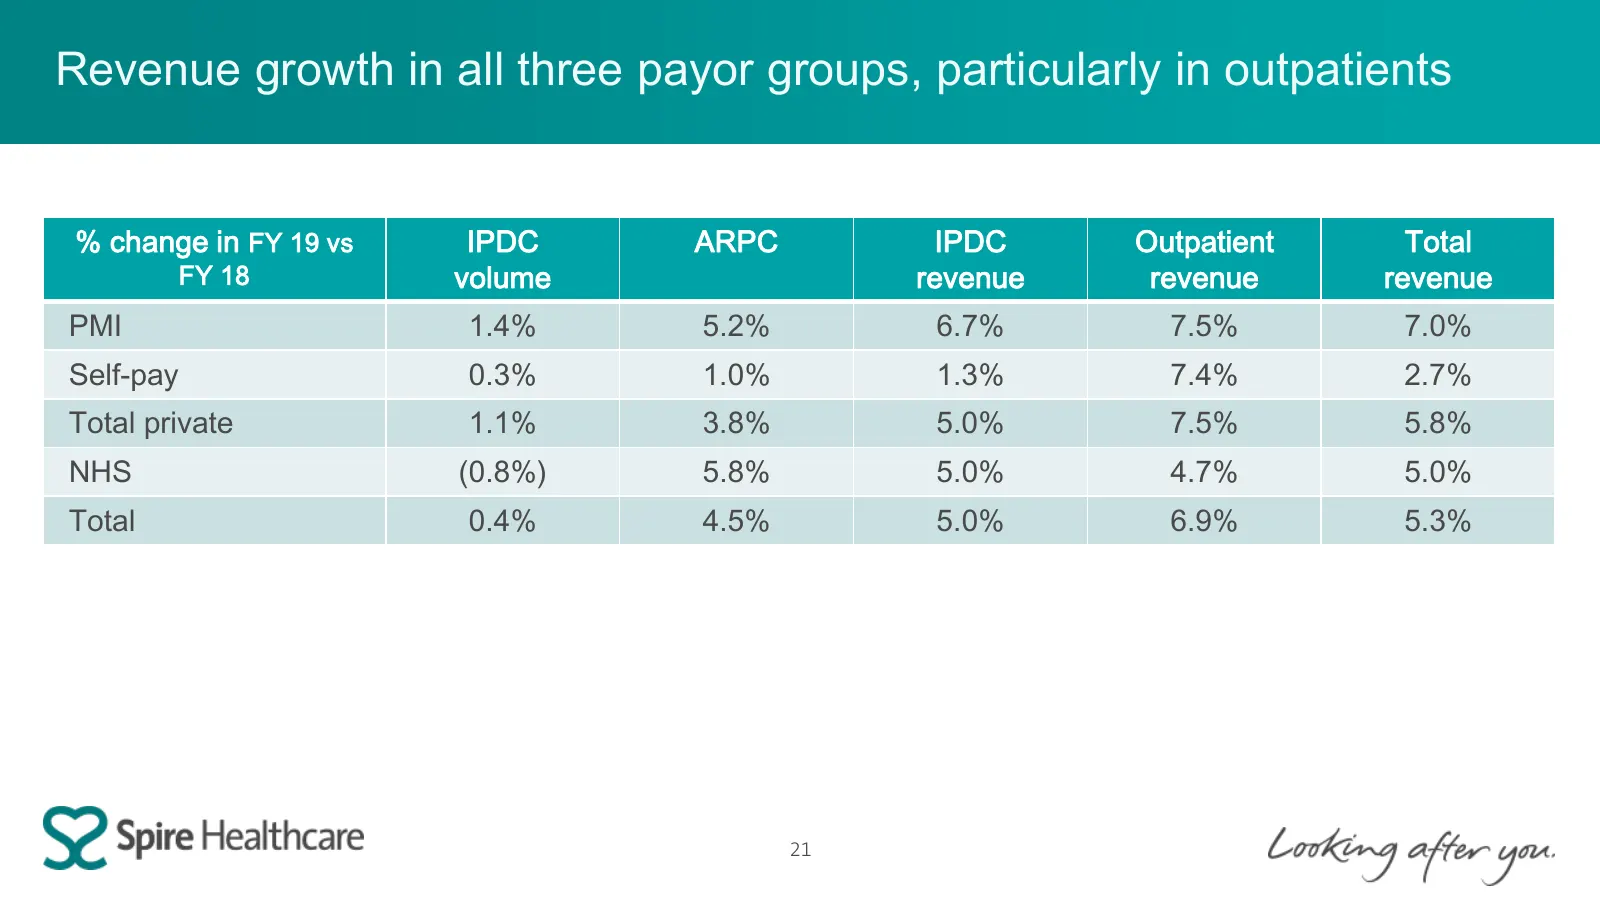
Revenue growth in all three payor groups, particularly in outpatients % change in FY 19 vs IPDC ARPC IPDC Outpatient Total FY 18 volume revenue revenue revenue PMI 1.4% 5.2% 6.7% 7.5% 7.0% Self-pay 0.3% 1.0% 1.3% 7.4% 2.7% Total private 1.1% 3.8% 5.0% 7.5% 5.8% NHS (0.8%) 5.8% 5.0% 4.7% 5.0% Total 0
Slide 22: Net debt reduction
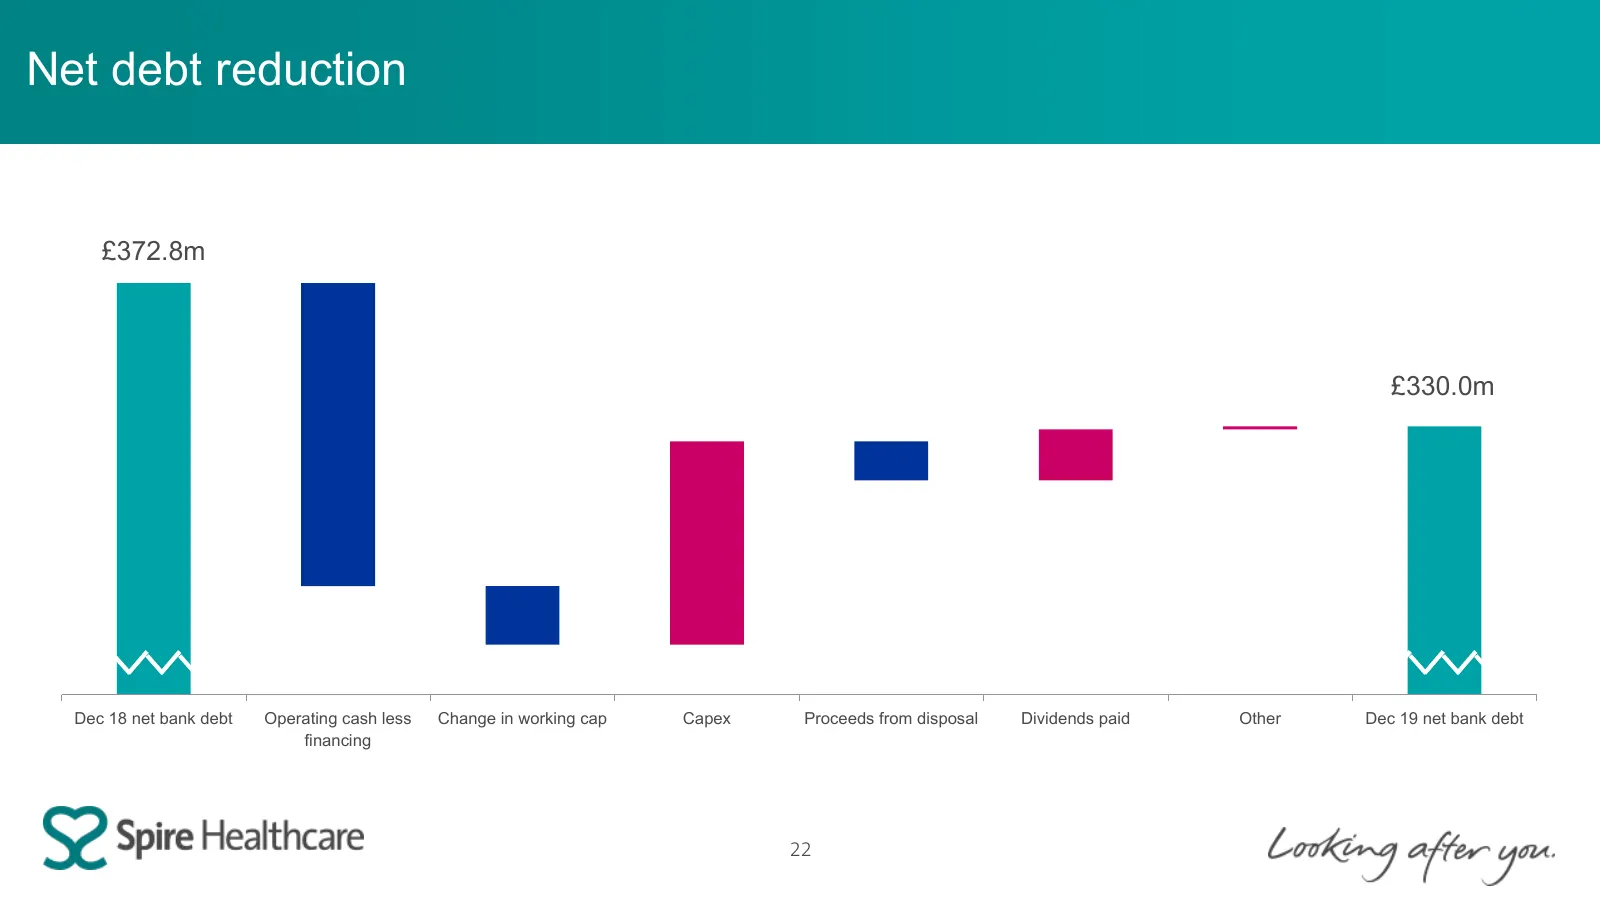
Net debt reduction £372.8m £330.0m Dec 18 net bank debt Operating cash less Change in working cap Capex Proceeds from disposal Dividends paid Other Dec 19 net bank debt financing 22
Slide 23: Continued focus on net bank debt reduction
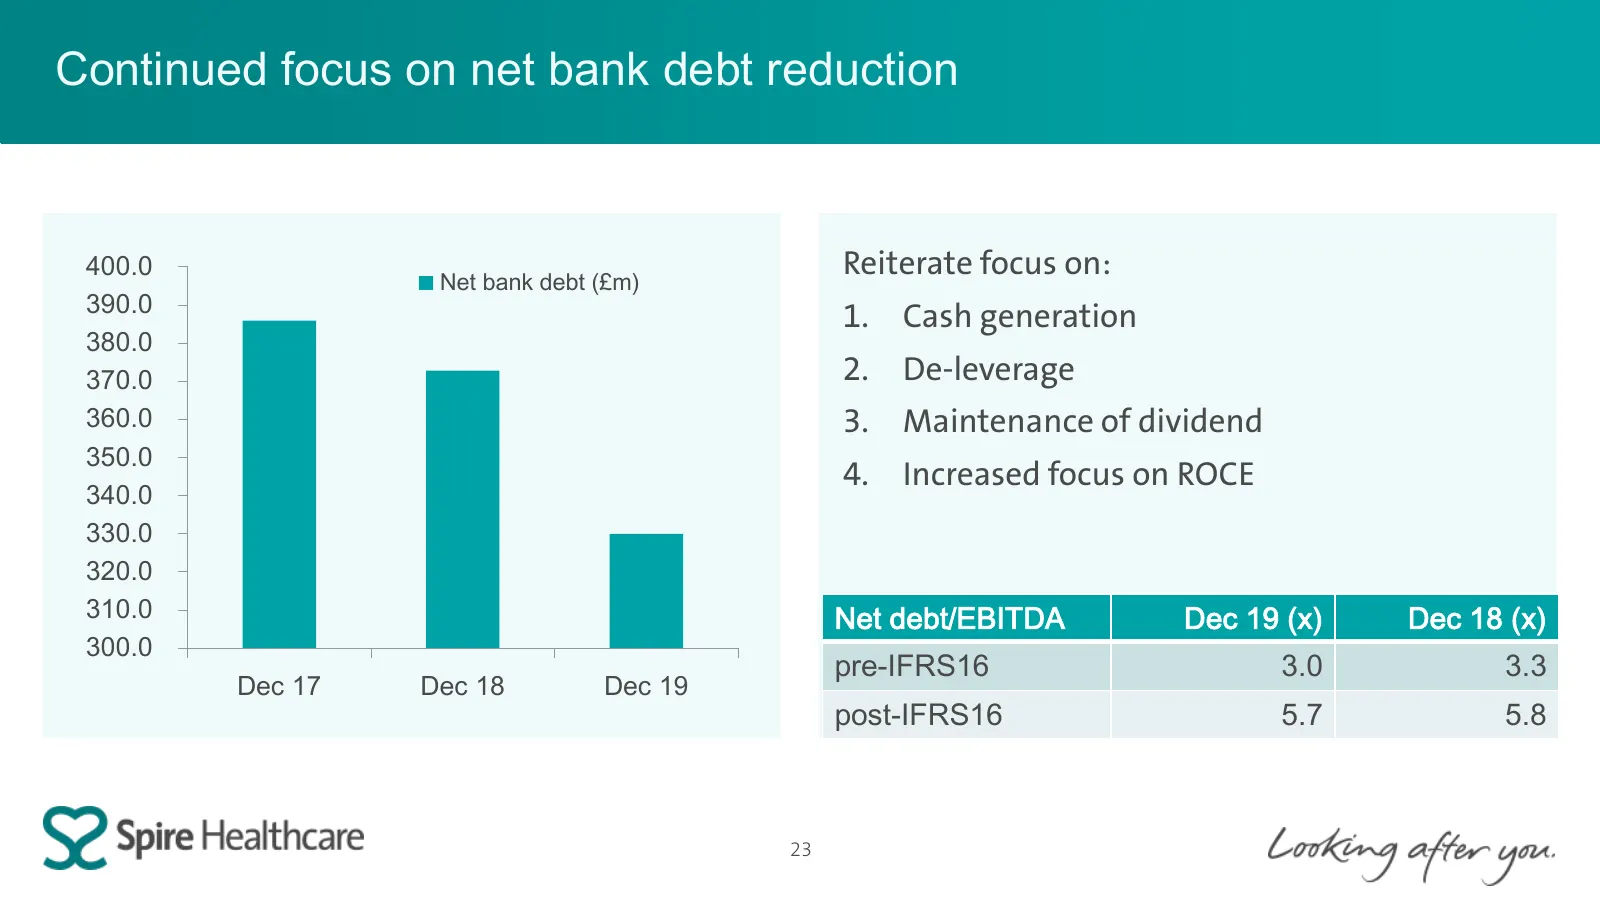
Continued focus on net bank debt reduction 400.0 Net bank debt (£m) Reiterate focus on: 390.0 1. Cash generation 380.0 370.0 2. De-leverage 360.0 3. Maintenance of dividend 350.0 4. Increased focus on ROCE 340.0 330.0 320.0 310.0 Net debt/EBITDA Dec 19 (x) Dec 18 (x) 300.0 pre-IFRS16 3.0 3.3 Dec 17
Slide 24: Medical inflation mitigated by efficiency programmes
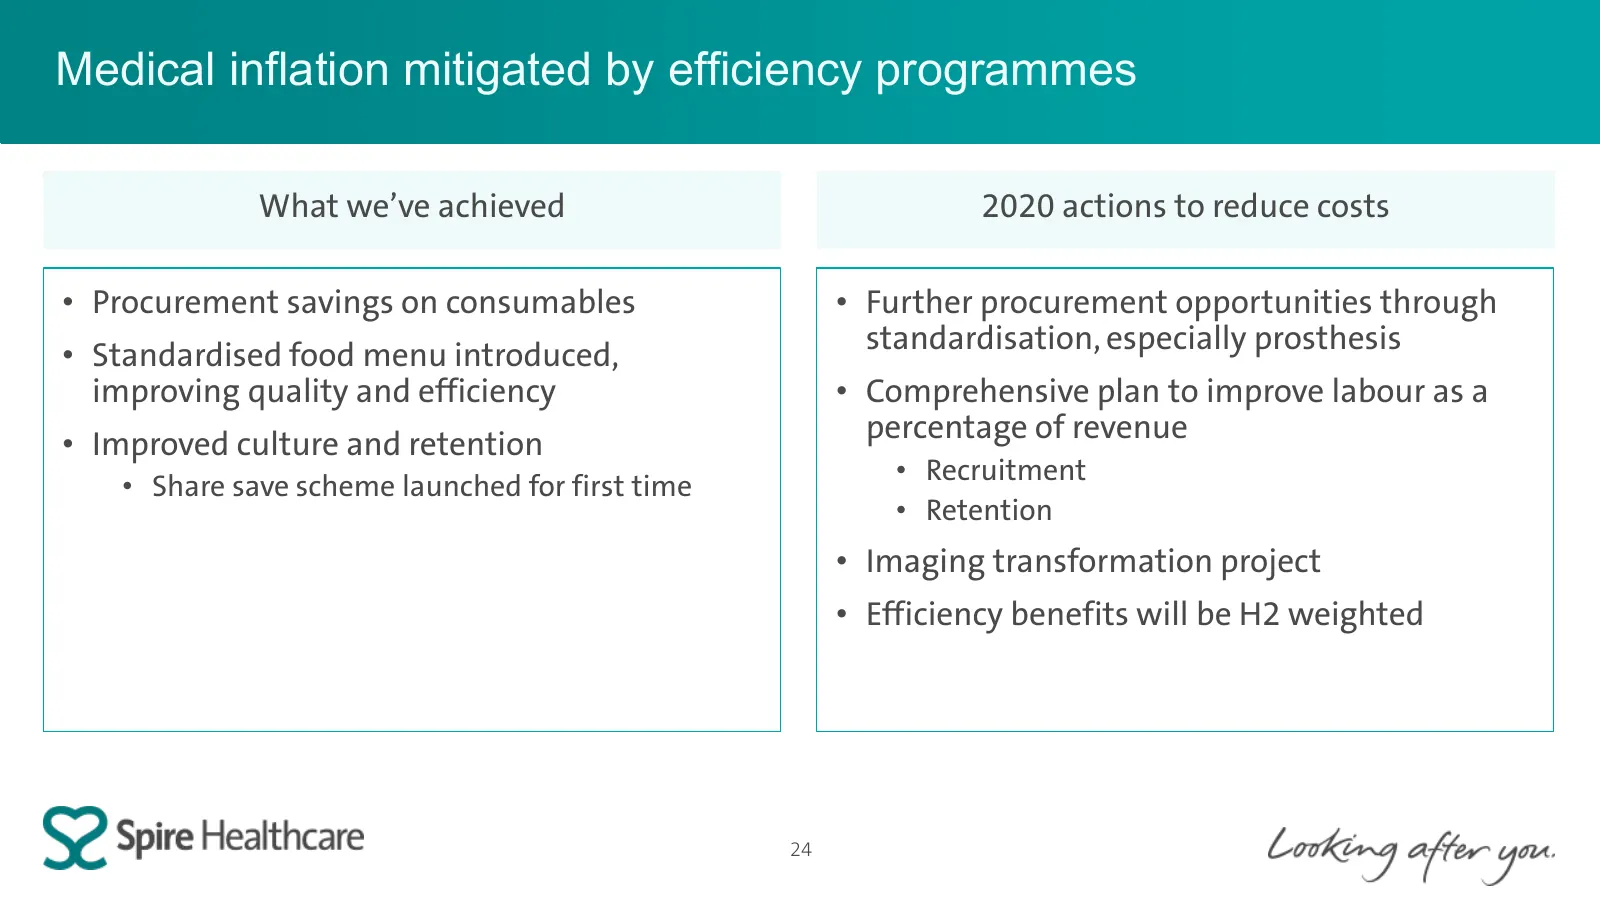
Medical inflation mitigated by efficiency programmes What we’ve achieved 2020 actions to reduce costs • Procurement savings on consumables • Further procurement opportunities through • Standardised food menu introduced, standardisation, especially prosthesis improving quality and efficiency • Compre
Slide 25: FY20 technical guidance
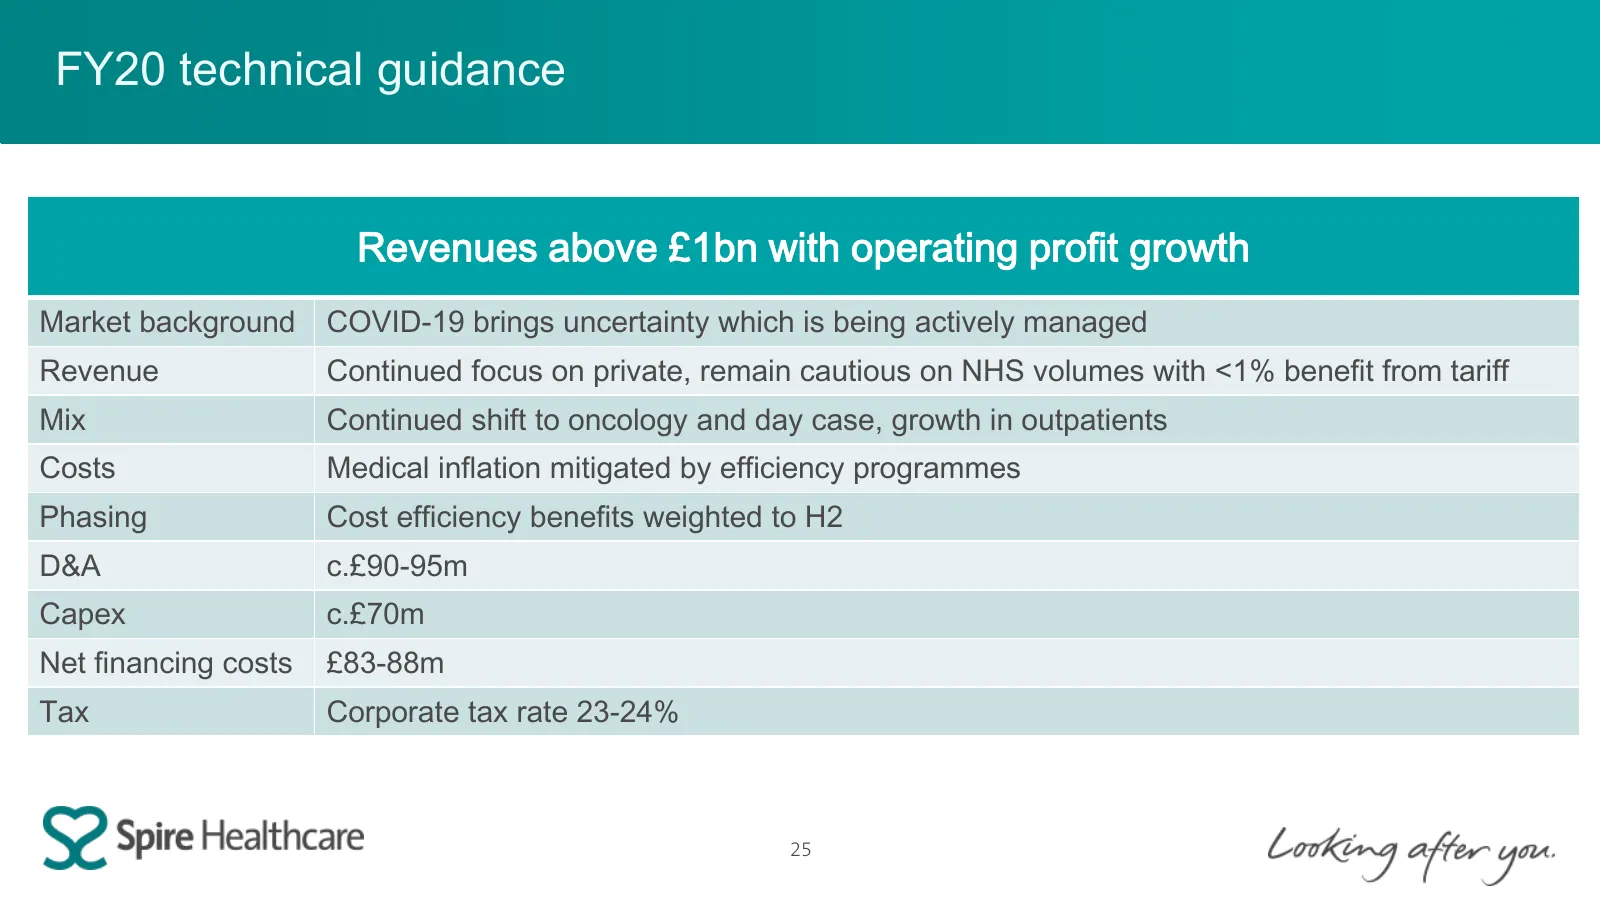
FY20 technical guidance Revenues above £1bn with operating profit growth Market background COVID-19 brings uncertainty which is being actively managed Revenue Continued focus on private, remain cautious on NHS volumes with <1% benefit from tariff Mix Continued shift to oncology and day case, growth
Slide 26: Operations and Strategy Review
Operations and Strategy Review John Forrest, Chief Operating Officer

Slide 27: Our Purpose defines our business
Our Purpose defines our business 27
Slide 28: Strategic focus
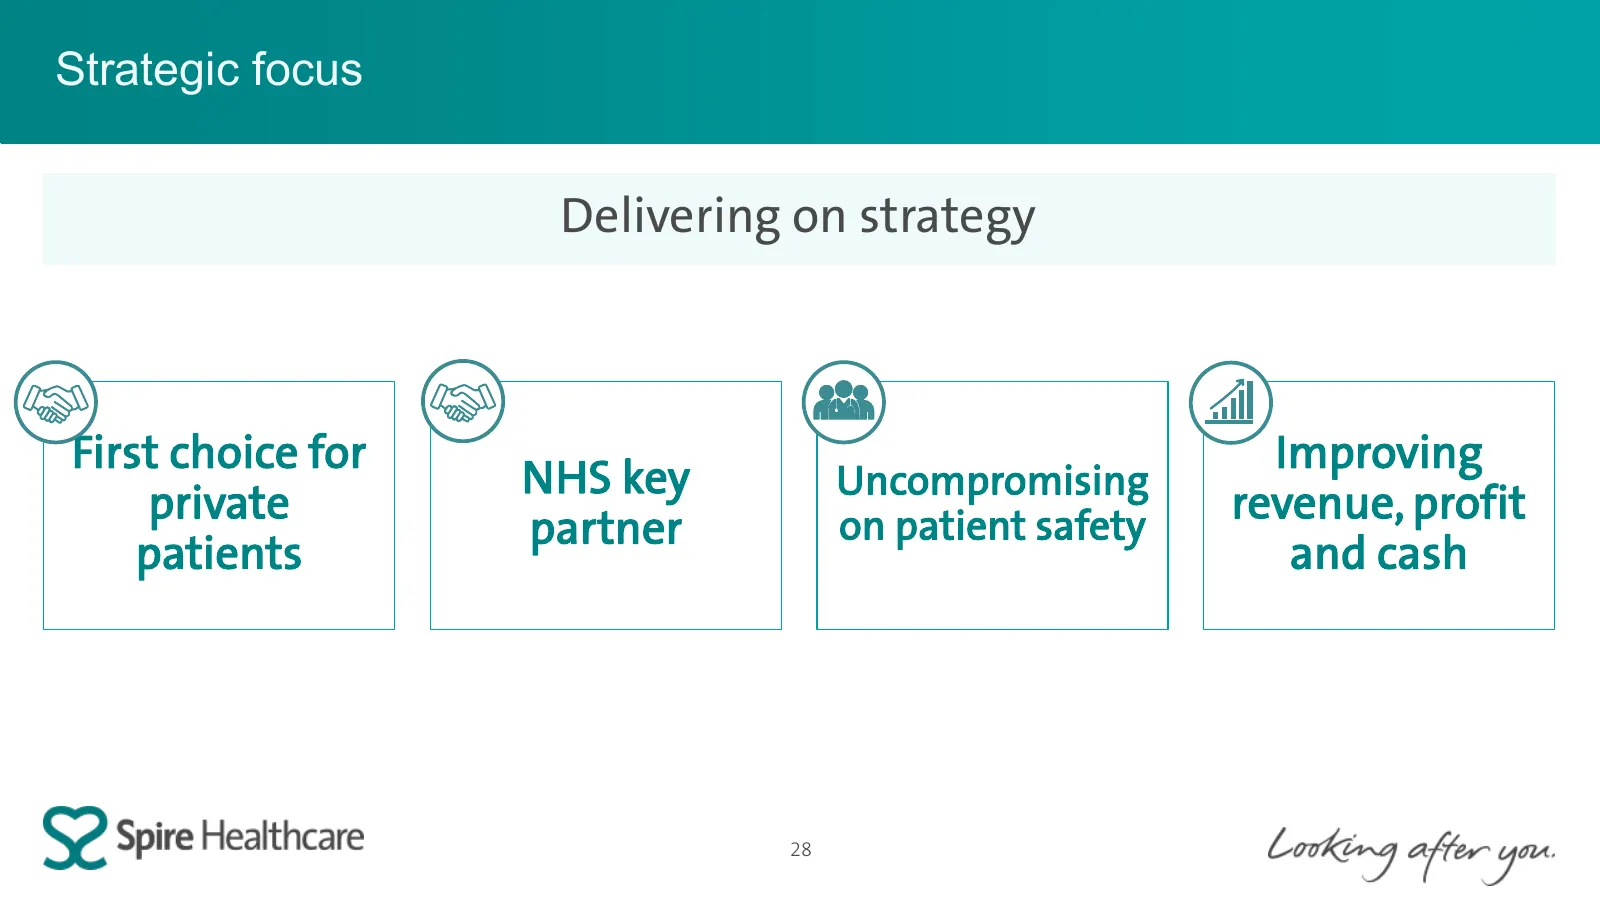
Strategic focus Delivering on strategy First choice for Improving NHS key Uncompromising private revenue, profit partner on patient safety patients and cash 28
Slide 29: First choice for private patients
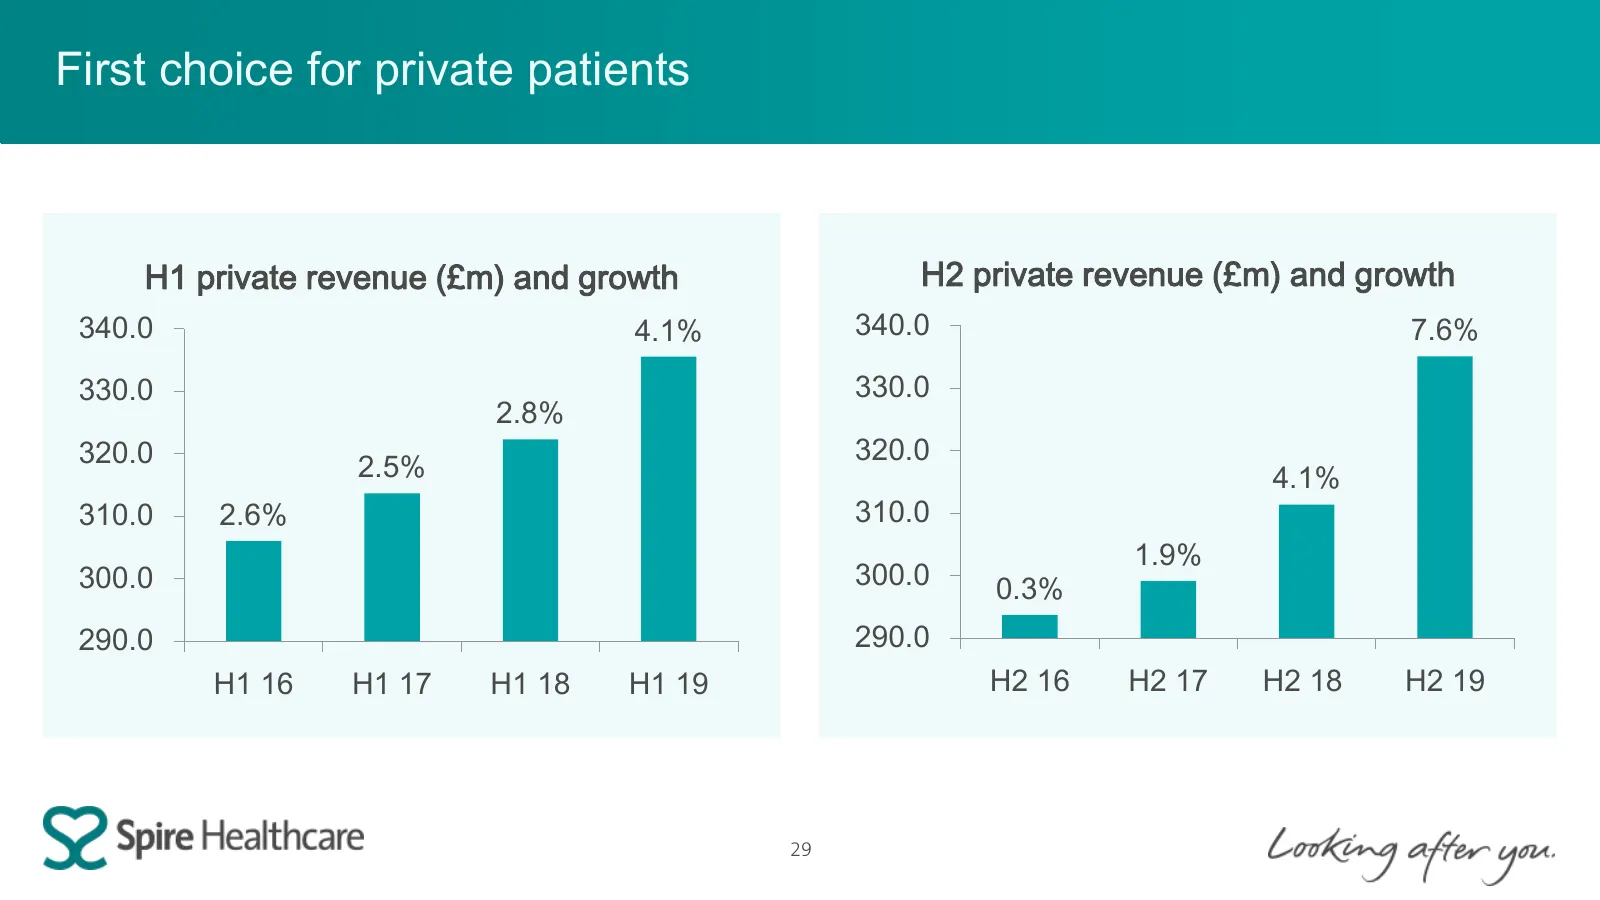
First choice for private patients H1 private revenue (£m) and growth H2 private revenue (£m) and growth 340.0 4.1% 340.0 7.6% 330.0 330.0 2.8% 320.0 320.0 2.5% 4.1% 310.0 2.6% 310.0 1.9% 300.0 300.0 0.3% 290.0 290.0 H1 16 H1 17 H1 18 H1 19 H2 16 H2 17 H2 18 H2 19 29
Slide 30: Growth in PMI and self-pay
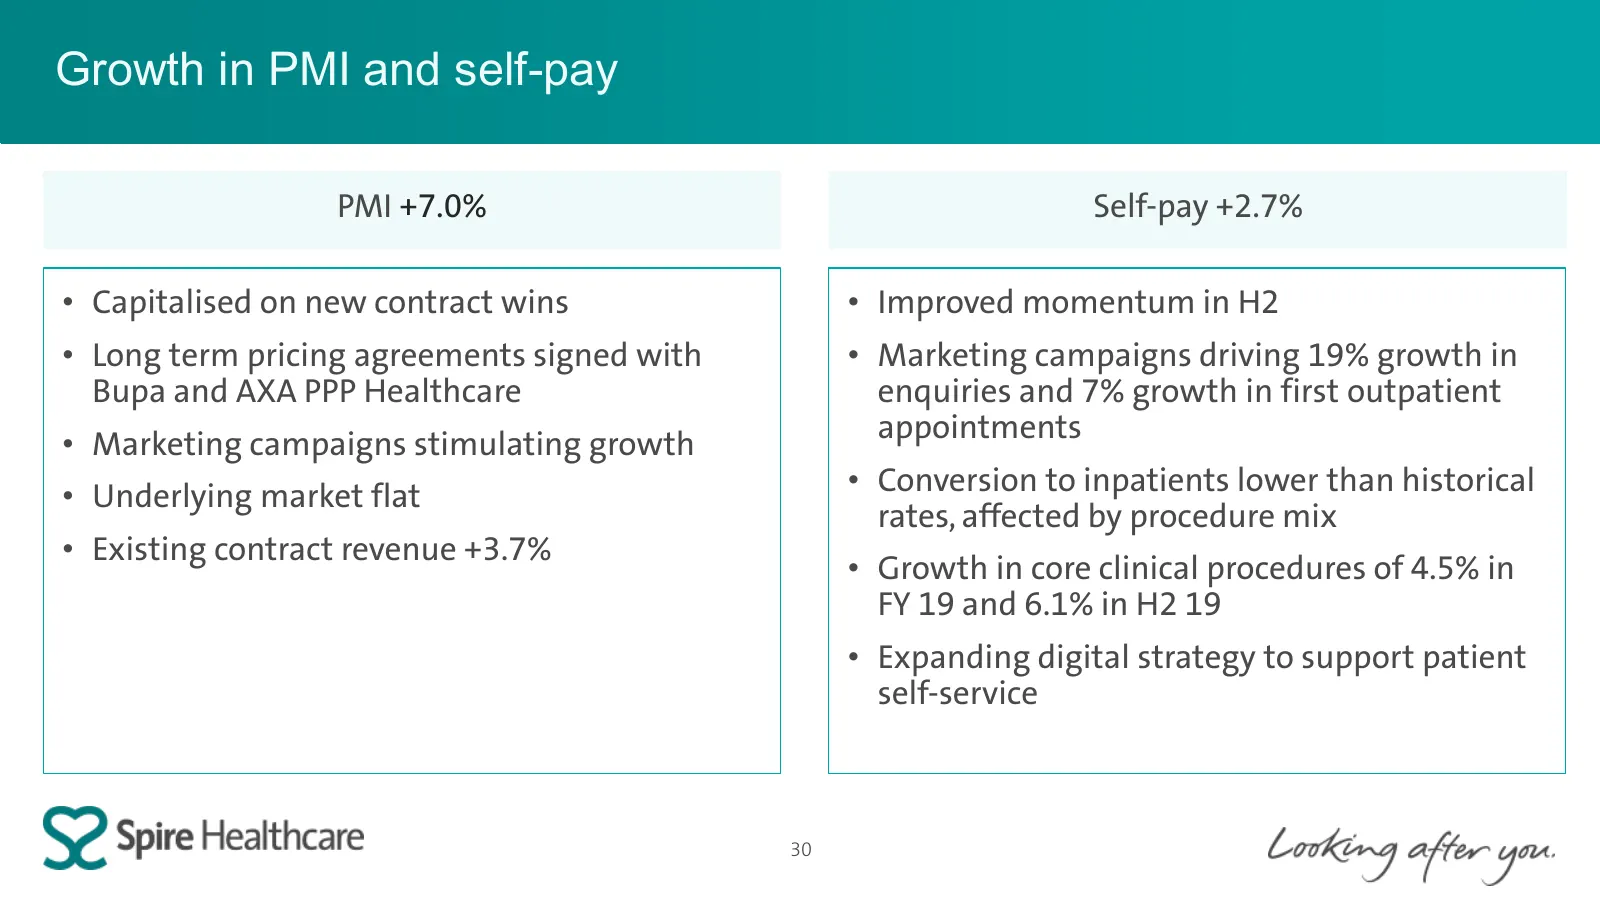
Growth in PMI and self-pay PMI +7.0% Self-pay +2.7% • Capitalised on new contract wins • Improved momentum in H2 • Long term pricing agreements signed with • Marketing campaigns driving 19% growth in Bupa and AXA PPP Healthcare enquiries and 7% growth in first outpatient appointments • Marketing cam
Slide 31: Advertising campaign elements
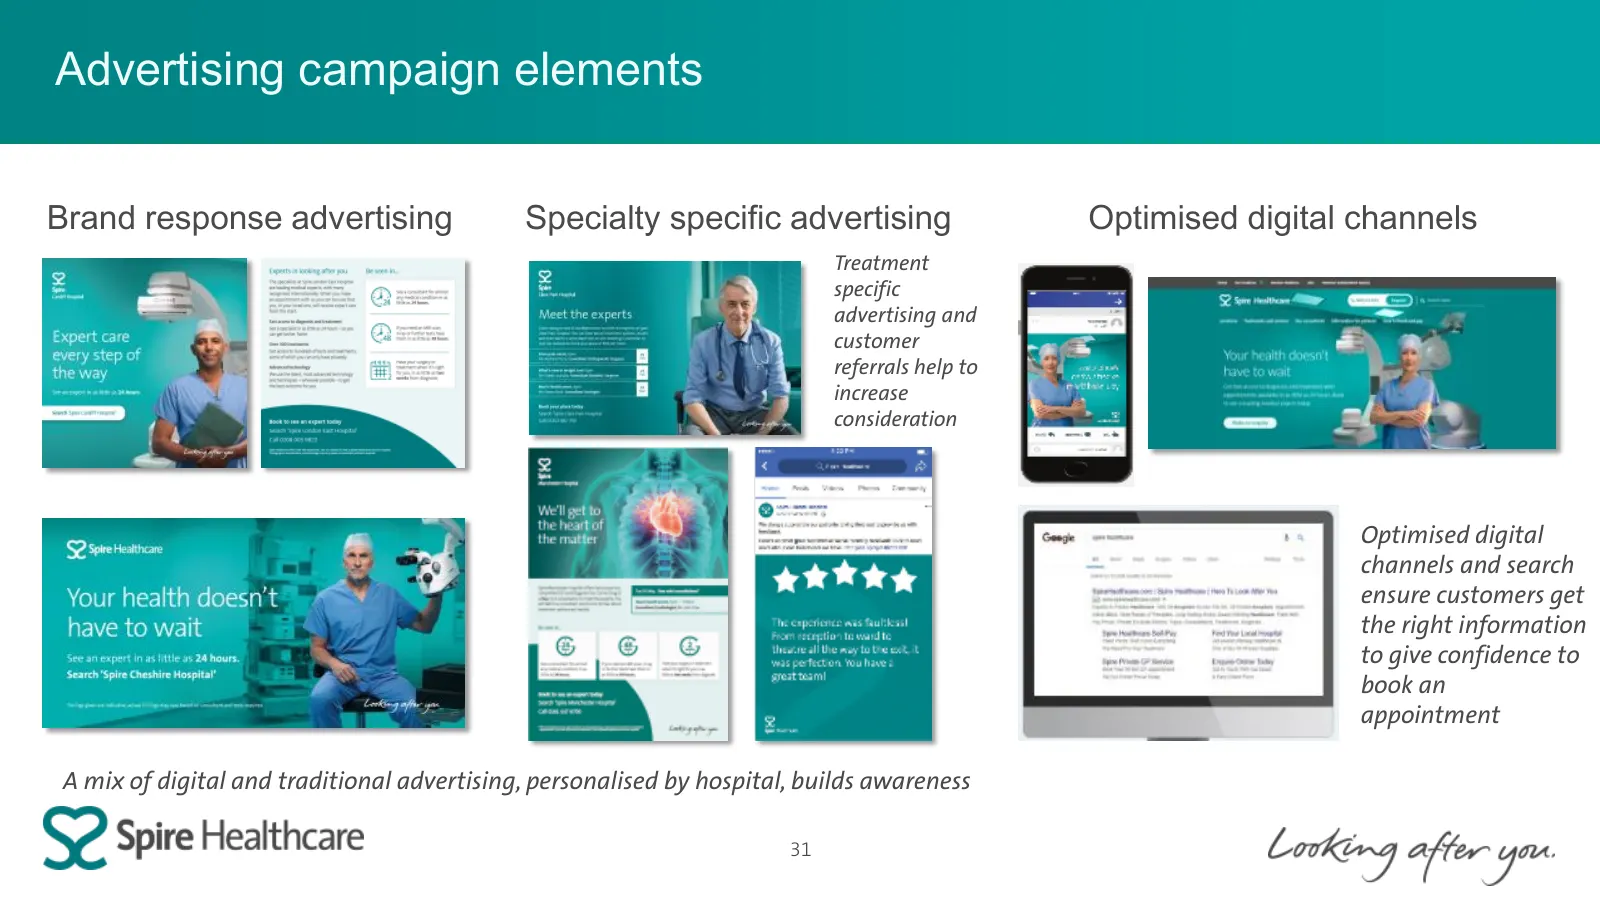
Advertising campaign elements Brand response advertising Specialty specific advertising Optimised digital channels Treatment specific advertising and customer referrals help to increase consideration Optimised digital channels and search ensure customers get the right information to give confidence
Slide 32: Growth in new outpatient consultations by payor
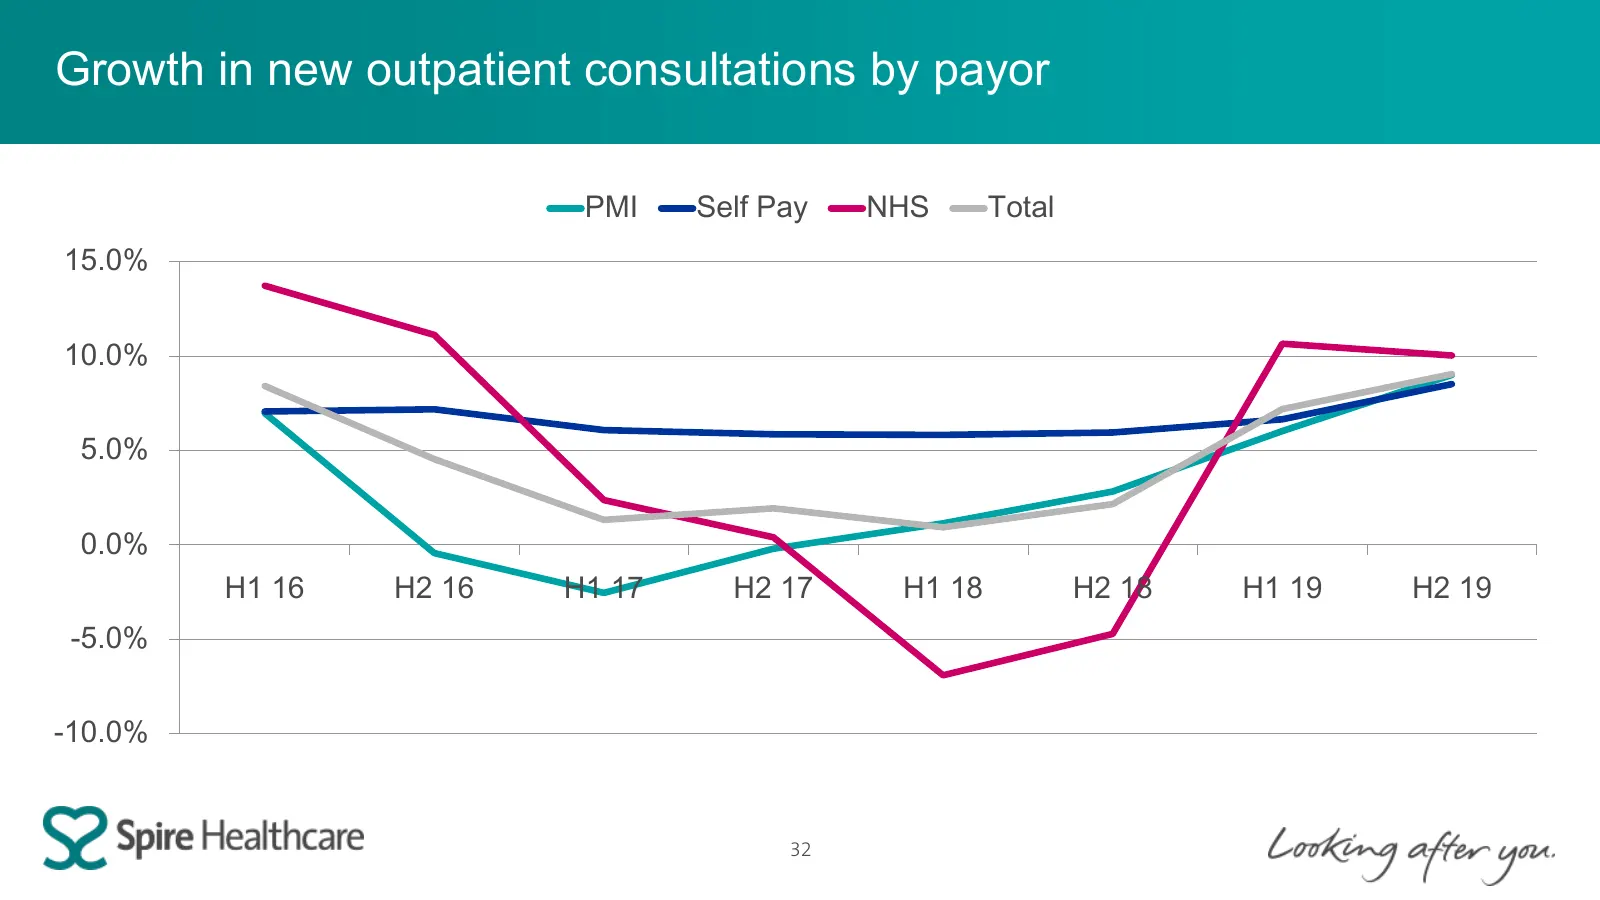
Growth in new outpatient consultations by payor PMI Self Pay NHS Total 15.0% 10.0% 5.0% 0.0% H1 16 H2 16 H1 17 H2 17 H1 18 H2 18 H1 19 H2 19 -5.0% -10.0% 32
Slide 33: Growth in outpatients
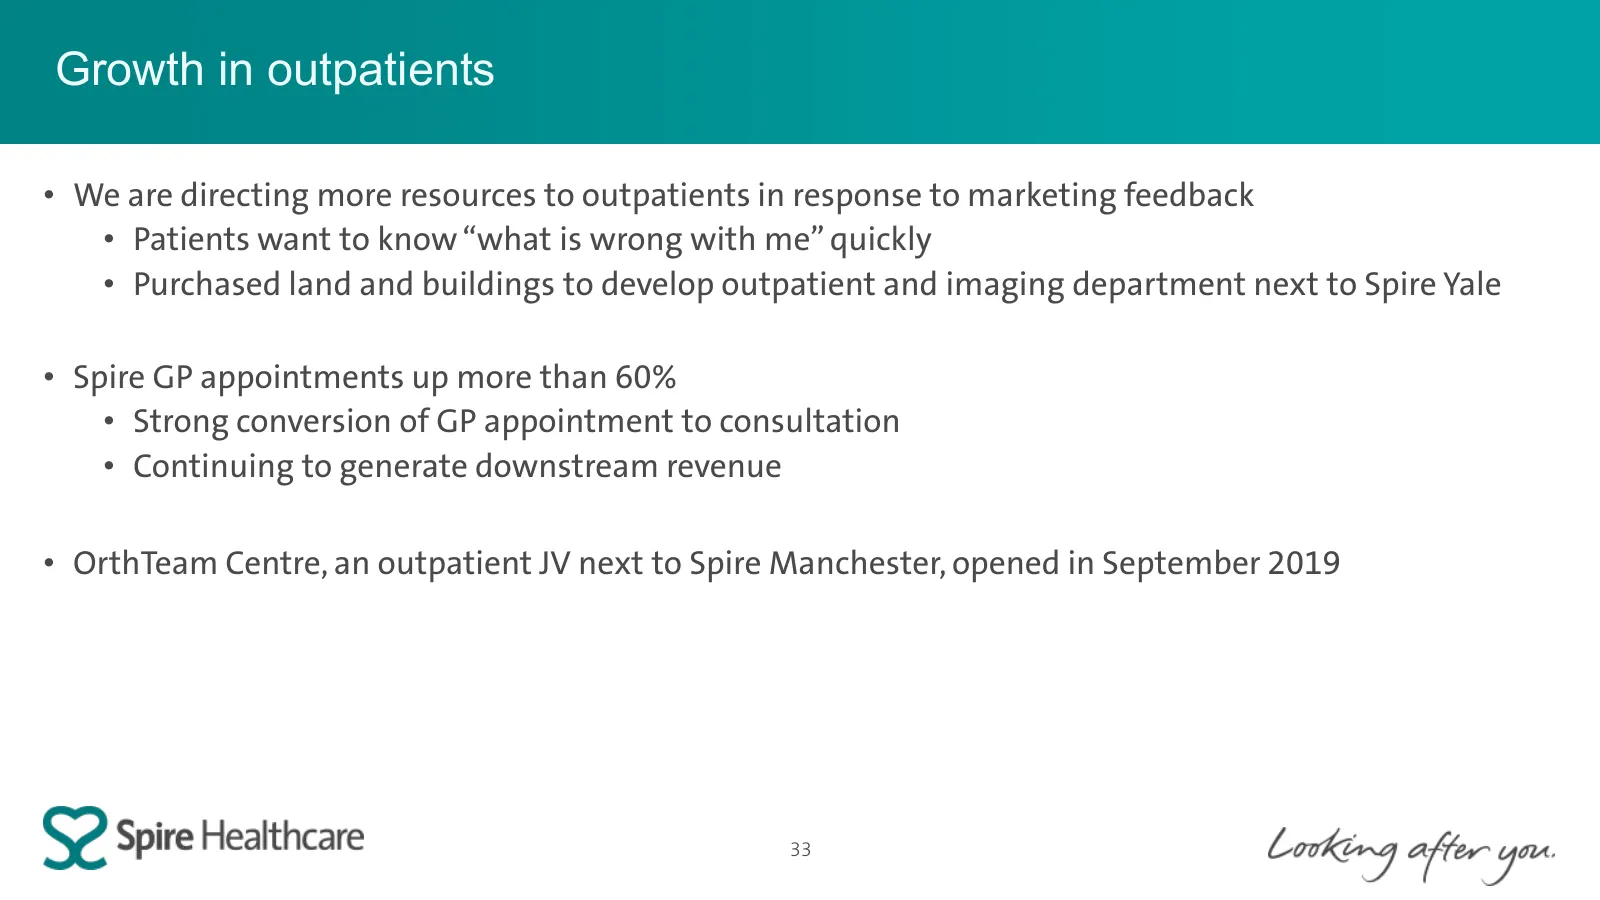
Growth in outpatients • We are directing more resources to outpatients in response to marketing feedback • Patients want to know “what is wrong with me” quickly • Purchased land and buildings to develop outpatient and imaging department next to Spire Yale • Spire GP appointments up more than 60% • S
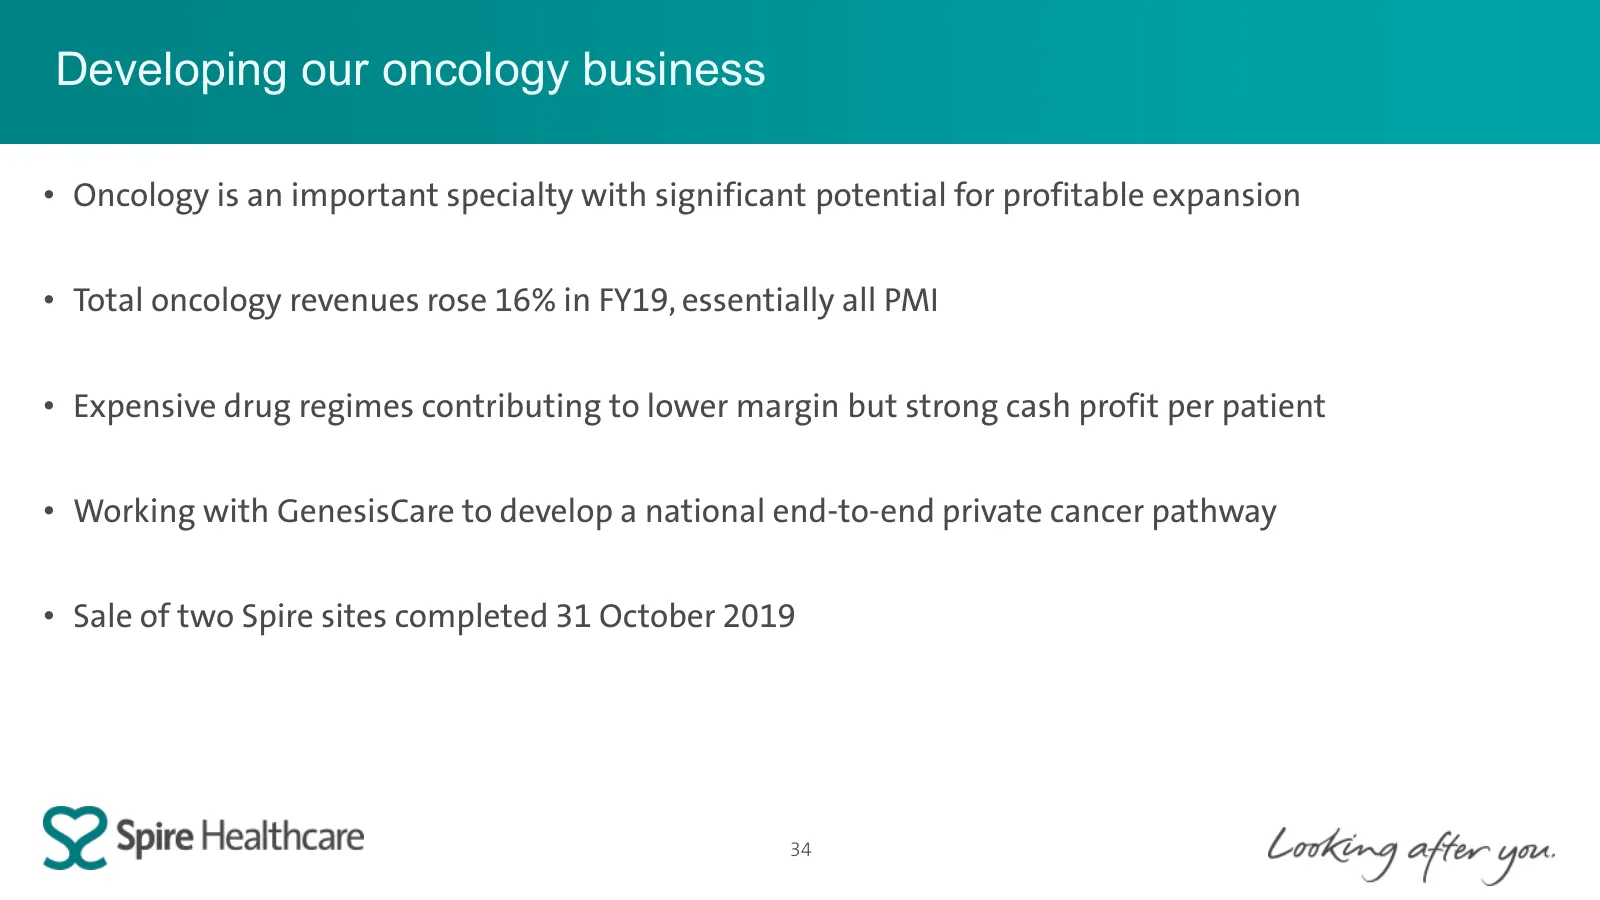
Slide 34: Developing our oncology business
Developing our oncology business • Oncology is an important specialty with significant potential for profitable expansion • Total oncology revenues rose 16% in FY19, essentially all PMI • Expensive drug regimes contributing to lower margin but strong cash profit per patient • Working with GenesisCar
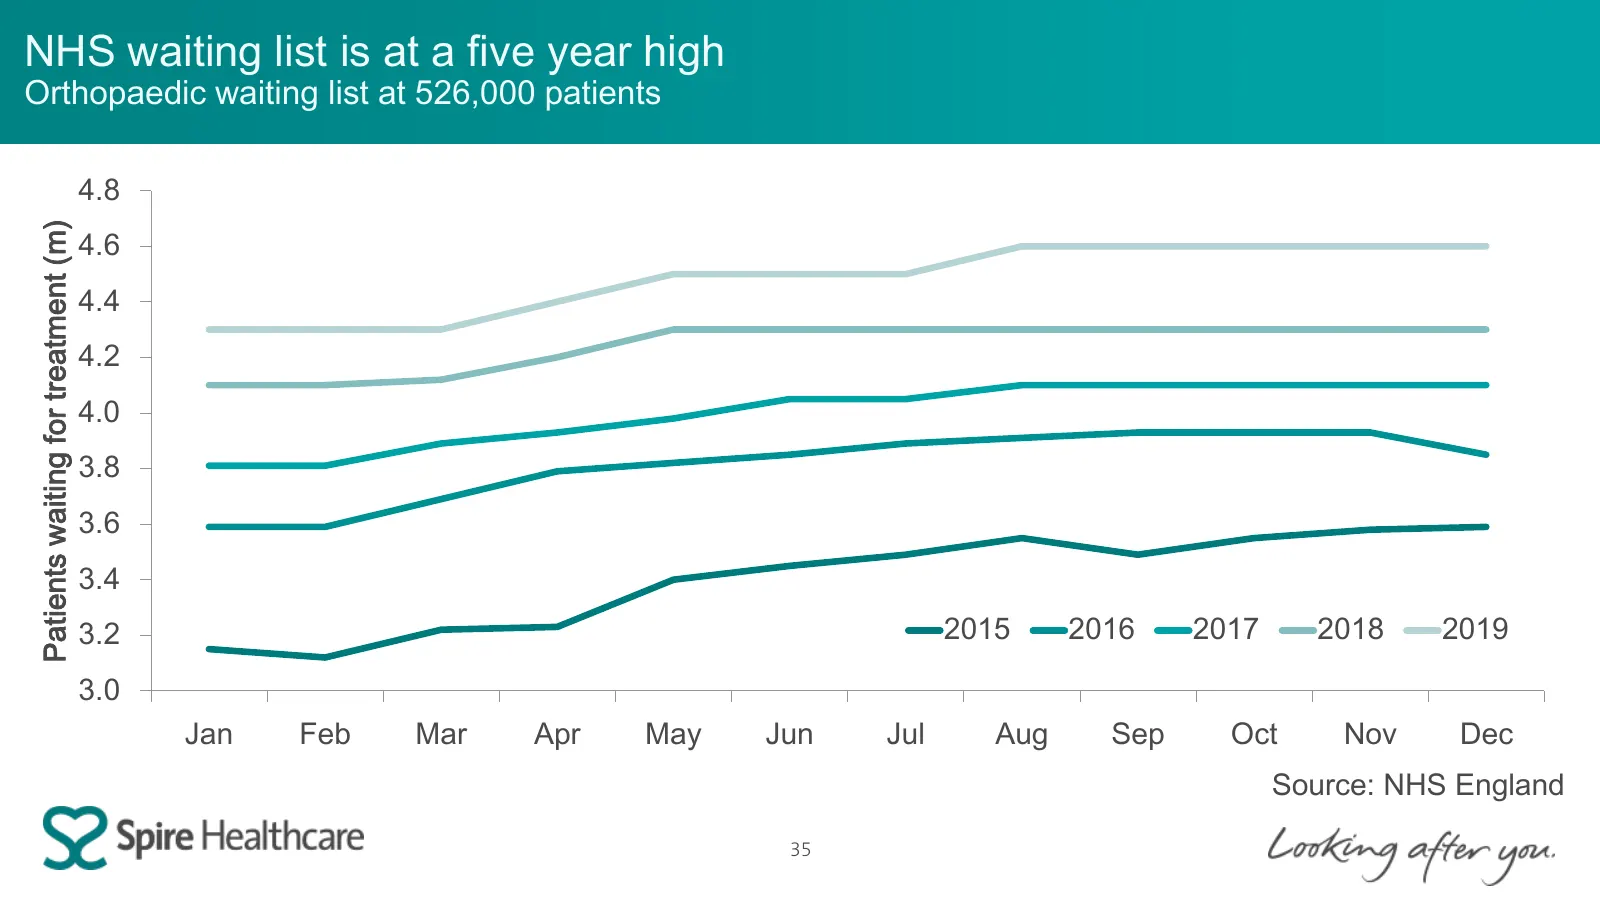
Slide 35: NHS waiting list is at a five year high
NHS waiting list is at a five year high Orthopaedic waiting list at 526,000 patients 4.8 Patients waiting for treatment (m) 4.6 4.4 4.2 4.0 3.8 3.6 3.4 3.2 2015 2016 2017 2018 2019 3.0 Jan Feb Mar Apr May Jun Jul Aug Sep Oct Nov Dec Source: NHS England 35
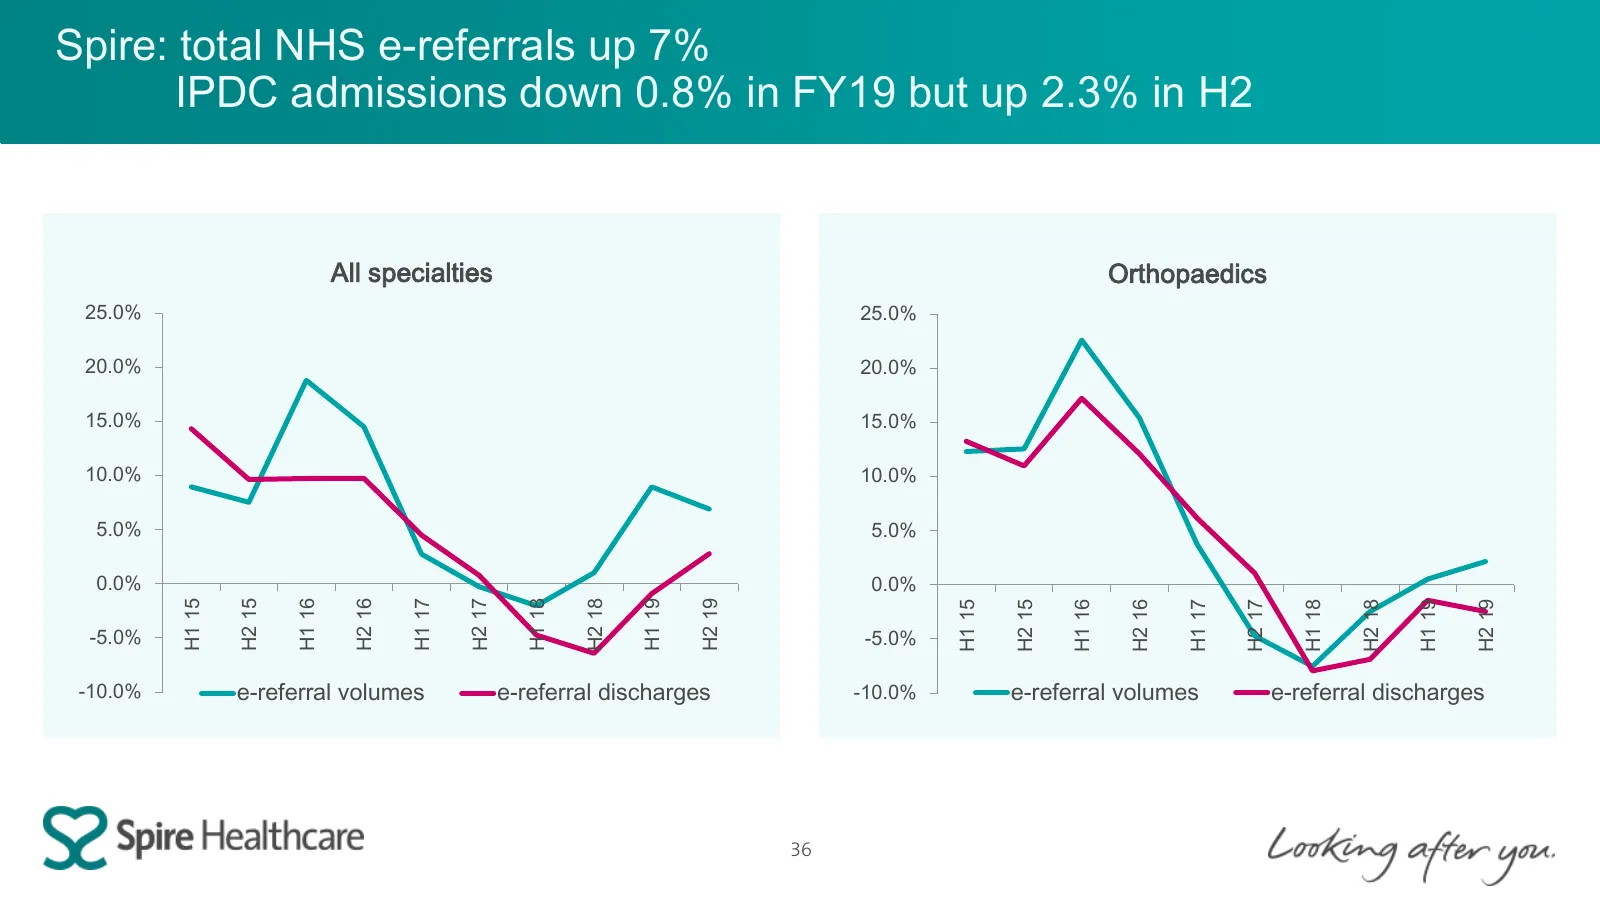
Slide 36: Spire: total NHS e-referrals up 7%
Spire: total NHS e-referrals up 7% IPDC admissions down 0.8% in FY19 but up 2.3% in H2 All specialties Orthopaedics 25.0% 25.0% 20.0% 20.0% 15.0% 15.0% 10.0% 10.0% 5.0% 5.0% 0.0% 0.0% H1 15 H2 15 H1 16 H2 16 H1 17 H2 17 H1 18 H2 18 H1 19 H2 19 H2 18 H1 15 H2 15 H1 16 H2 16 H1 17 H2 17 H1 18 H1 19 H2
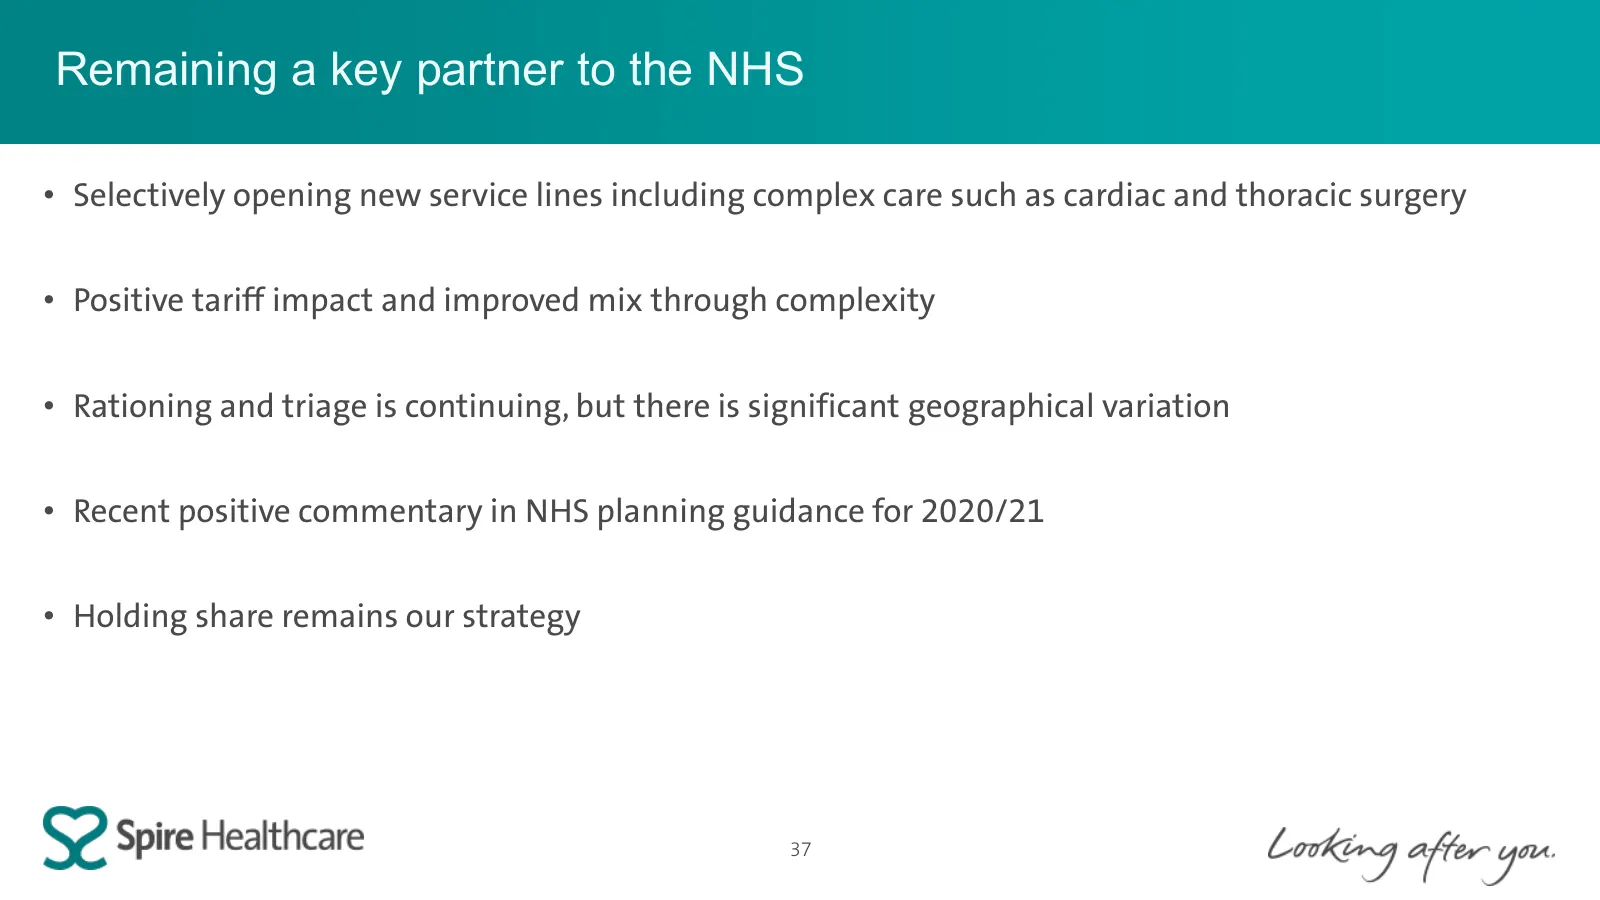
Slide 37: Remaining a key partner to the NHS
Remaining a key partner to the NHS • Selectively opening new service lines including complex care such as cardiac and thoracic surgery • Positive tariff impact and improved mix through complexity • Rationing and triage is continuing, but there is significant geographical variation • Recent positive
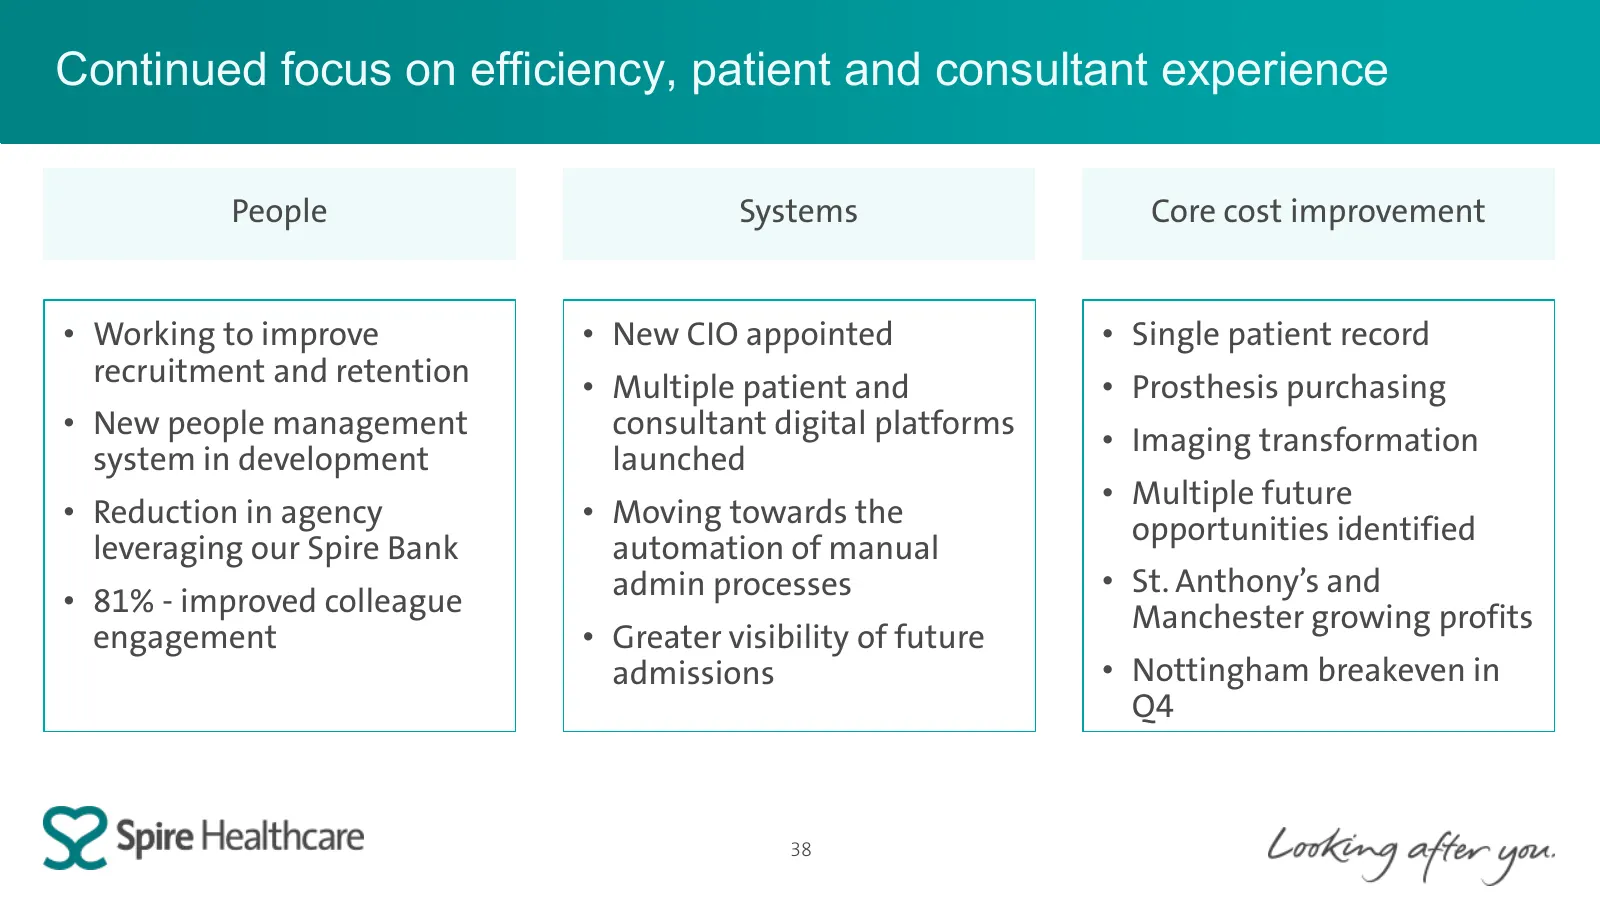
Slide 38: Continued focus on efficiency, patient and consultant experience
Continued focus on efficiency, patient and consultant experience People Systems Core cost improvement • Working to improve • New CIO appointed • Single patient record recruitment and retention • Multiple patient and • Prosthesis purchasing • New people management consultant digital platforms • Imagi
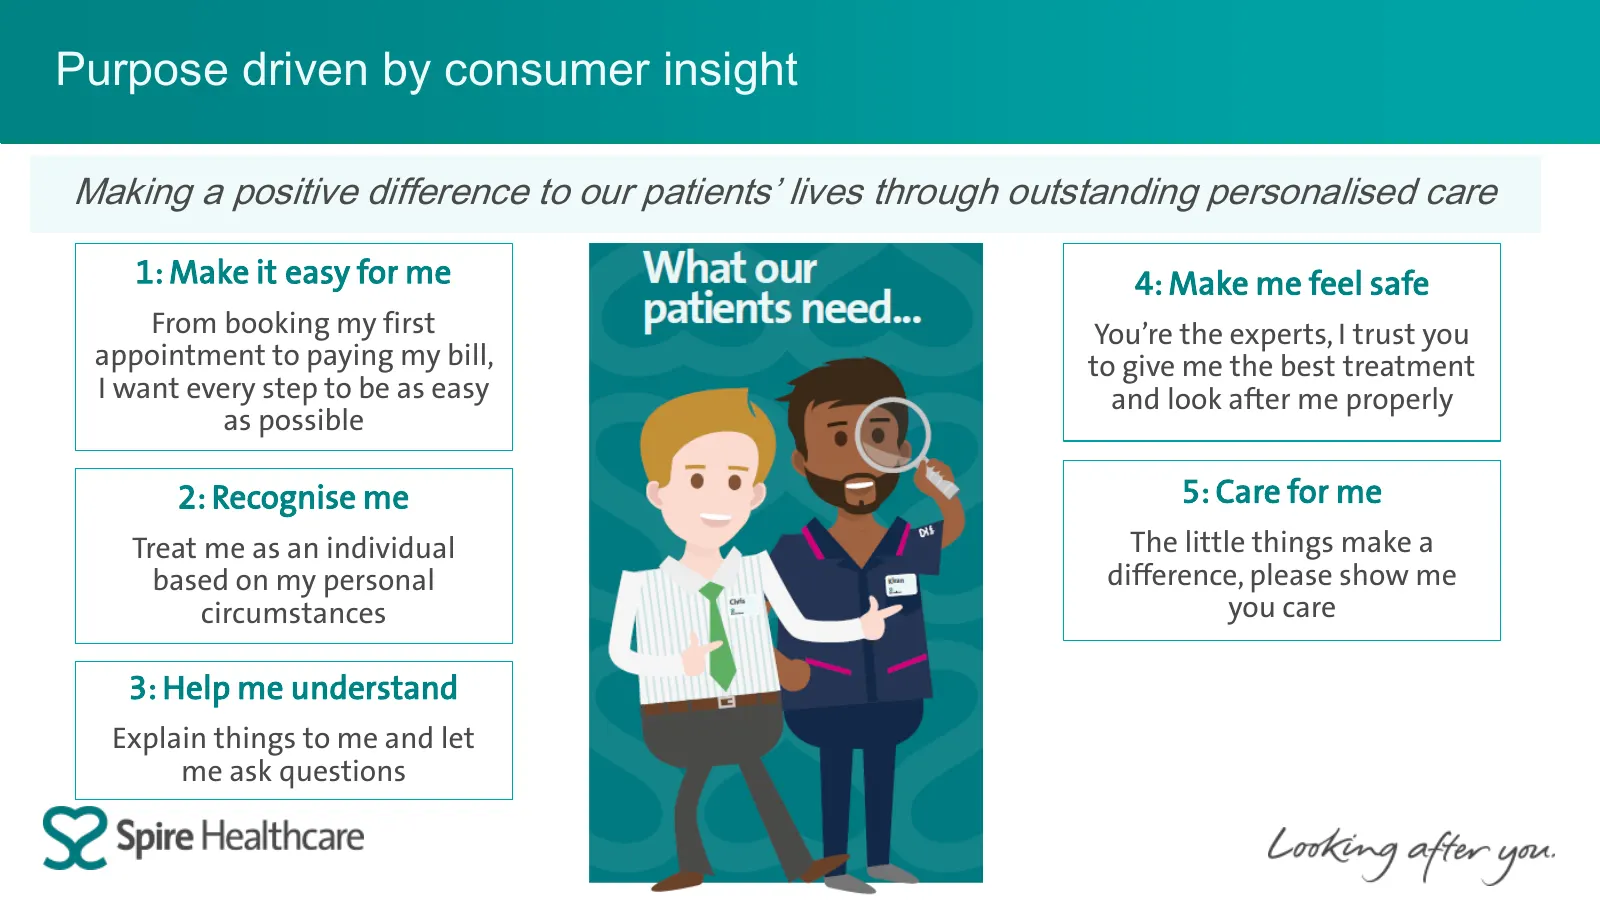
Slide 39: Purpose driven by consumer insight
Purpose driven by consumer insight Making a positive difference to our patients’ lives through outstanding personalised care 1: Make it easy for me 4: Make me feel safe From booking my first You’re the experts, I trust you appointment to paying my bill, to give me the best treatment I want every ste
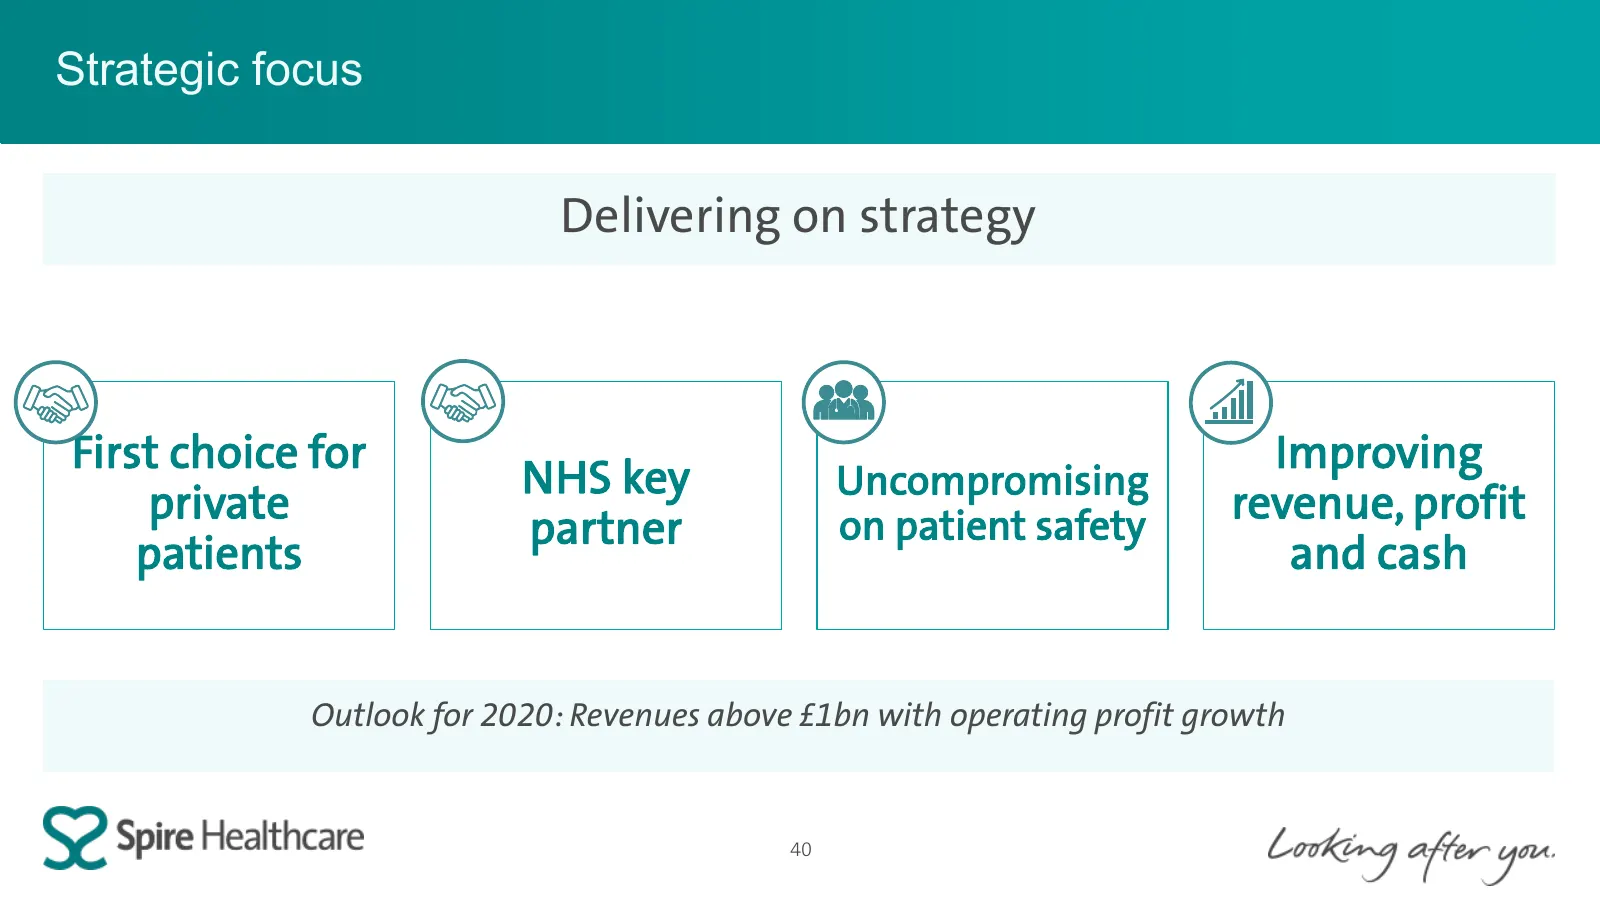
Slide 40: Strategic focus and 2020 outlook
Strategic focus Delivering on strategy First choice for Improving NHS key Uncompromising private revenue, profit partner on patient safety patients and cash Outlook for 2020: Revenues above £1bn with operating profit growth 40

Slide 41: Appendix
S2 Spire Healthcare Appendix Covking after yee
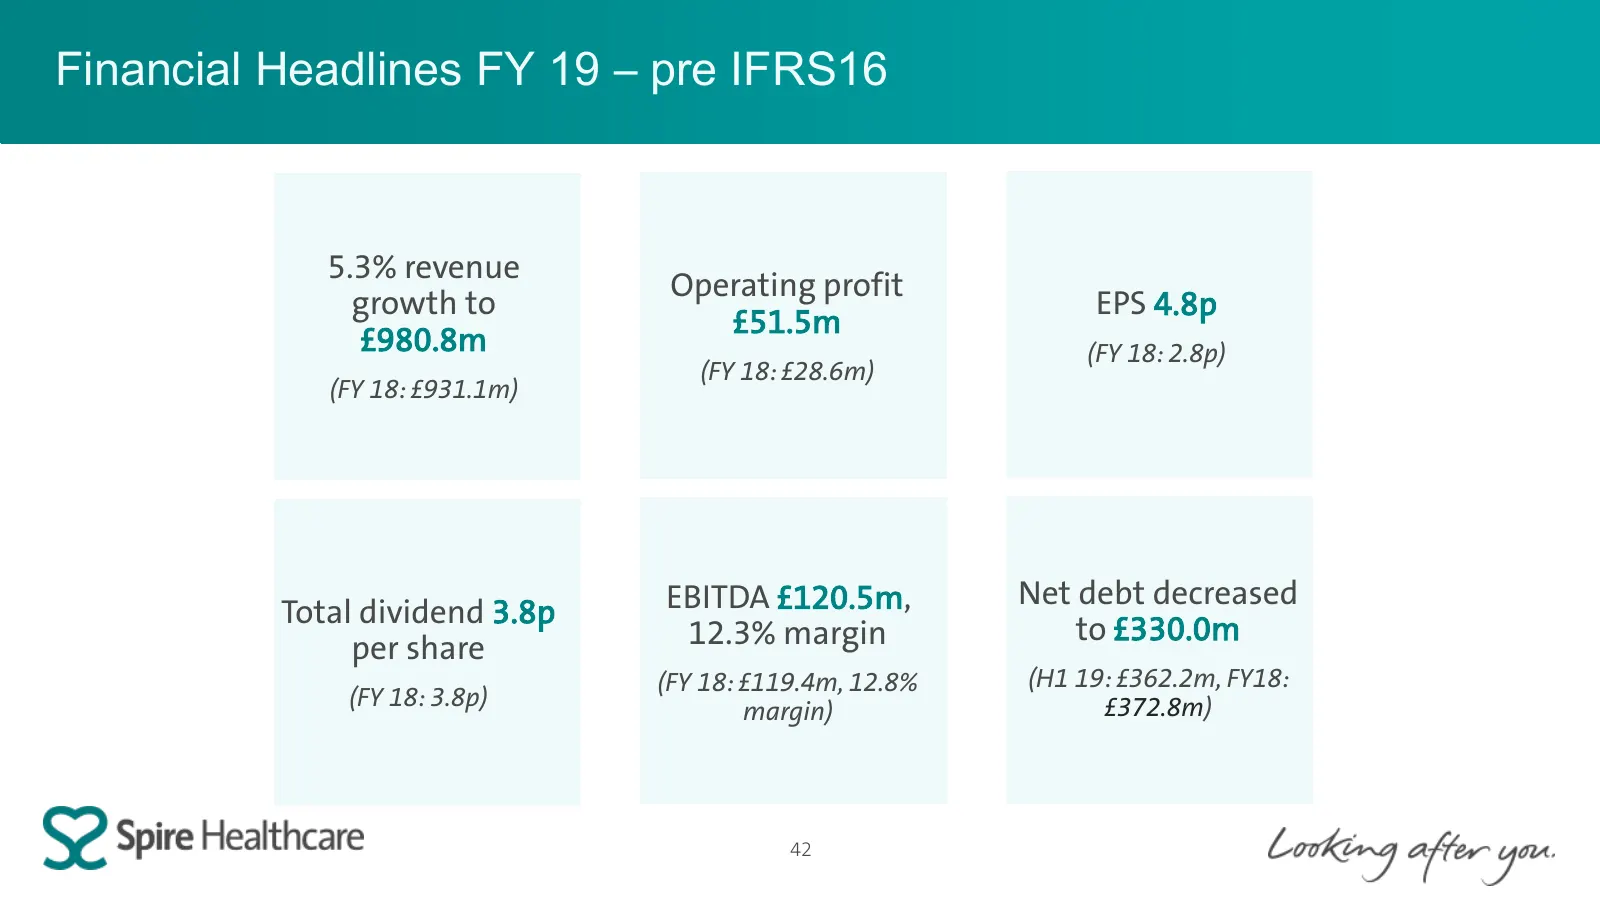
Slide 42: Financial Headlines FY19 – pre IFRS16
Financial Headlines FY 19 – pre IFRS16 5.3% revenue Operating profit growth to EPS 4.8p £51.5m £980.8m (FY 18: 2.8p) (FY 18: £28.6m) (FY 18: £931.1m) EBITDA £120.5m, Net debt decreased Total dividend 3.8p 12.3% margin to £330.0m per share (FY 18: £119.4m, 12.8% (H1 19: £362.2m, FY18: (FY 18: 3.8p) £
Slide 43: Private growth
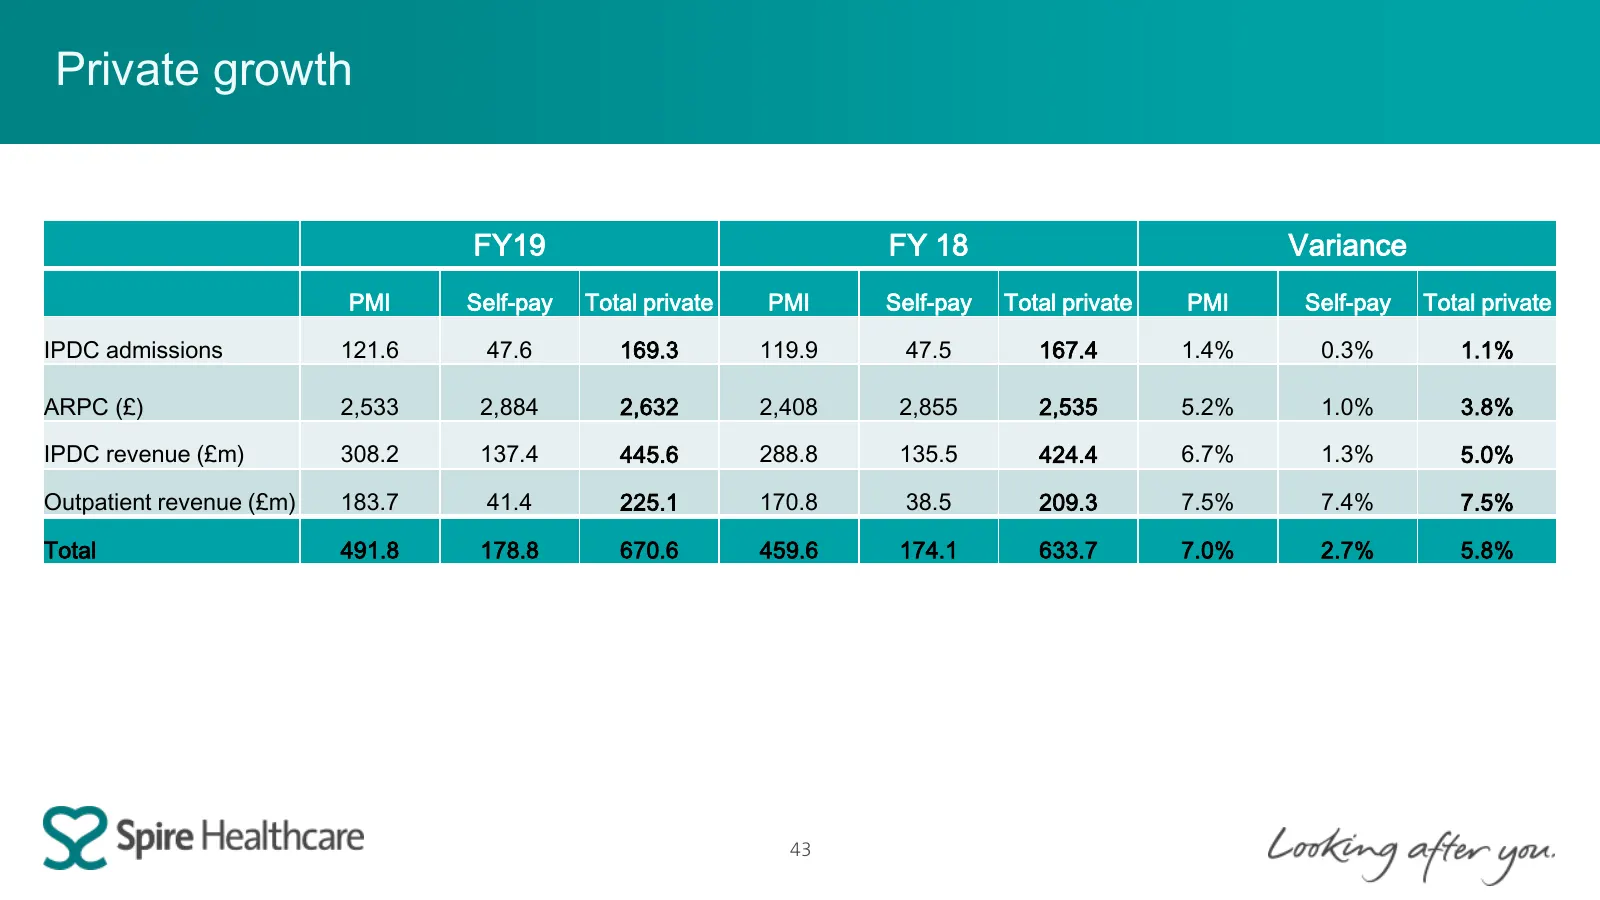
Private growth FY19 FY 18 Variance PMI Self-pay Total private PMI Self-pay Total private PMI Self-pay Total private IPDC admissions 121.6 47.6 169.3 119.9 47.5 167.4 1.4% 0.3% 1.1% ARPC (£) 2,533 2,884 2,632 2,408 2,855 2,535 5.2% 1.0% 3.8% IPDC revenue (£m) 308.2 137.4 445.6 288.8 135.5 424.4 6.7%
Slide 44: Total growth across all payor groups
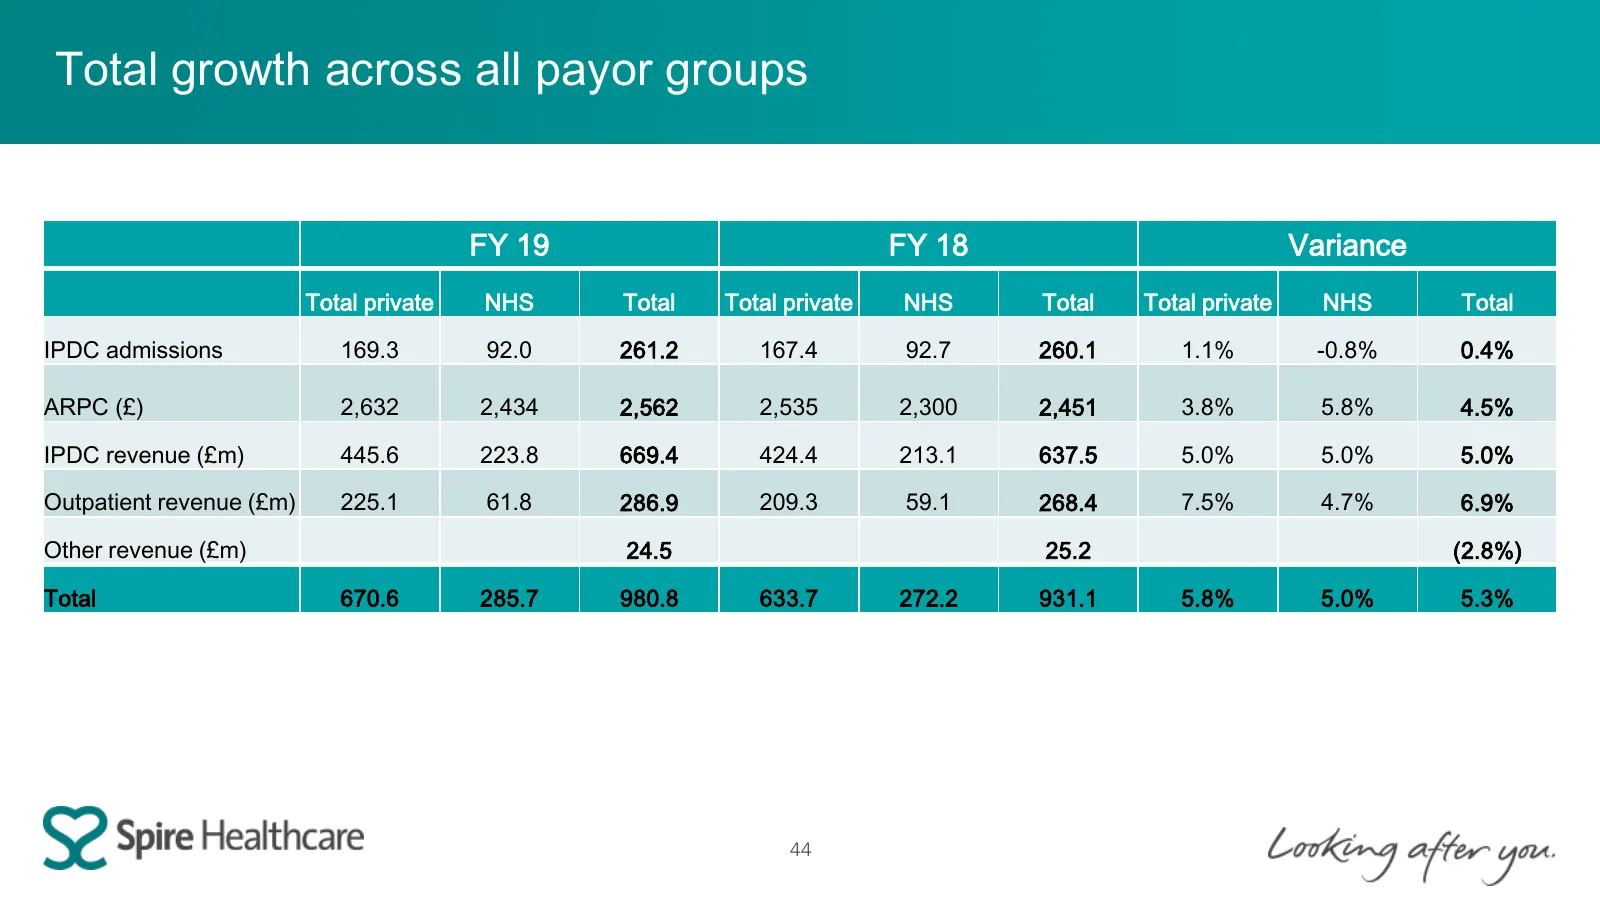
Total growth across all payor groups FY 19 FY 18 Variance Total private NHS Total Total private NHS Total Total private NHS Total IPDC admissions 169.3 92.0 261.2 167.4 92.7 260.1 1.1% -0.8% 0.4% ARPC (£) 2,632 2,434 2,562 2,535 2,300 2,451 3.8% 5.8% 4.5% IPDC revenue (£m) 445.6 223.8 669.4 424.4 21
Slide 45: NHS revenue in detail
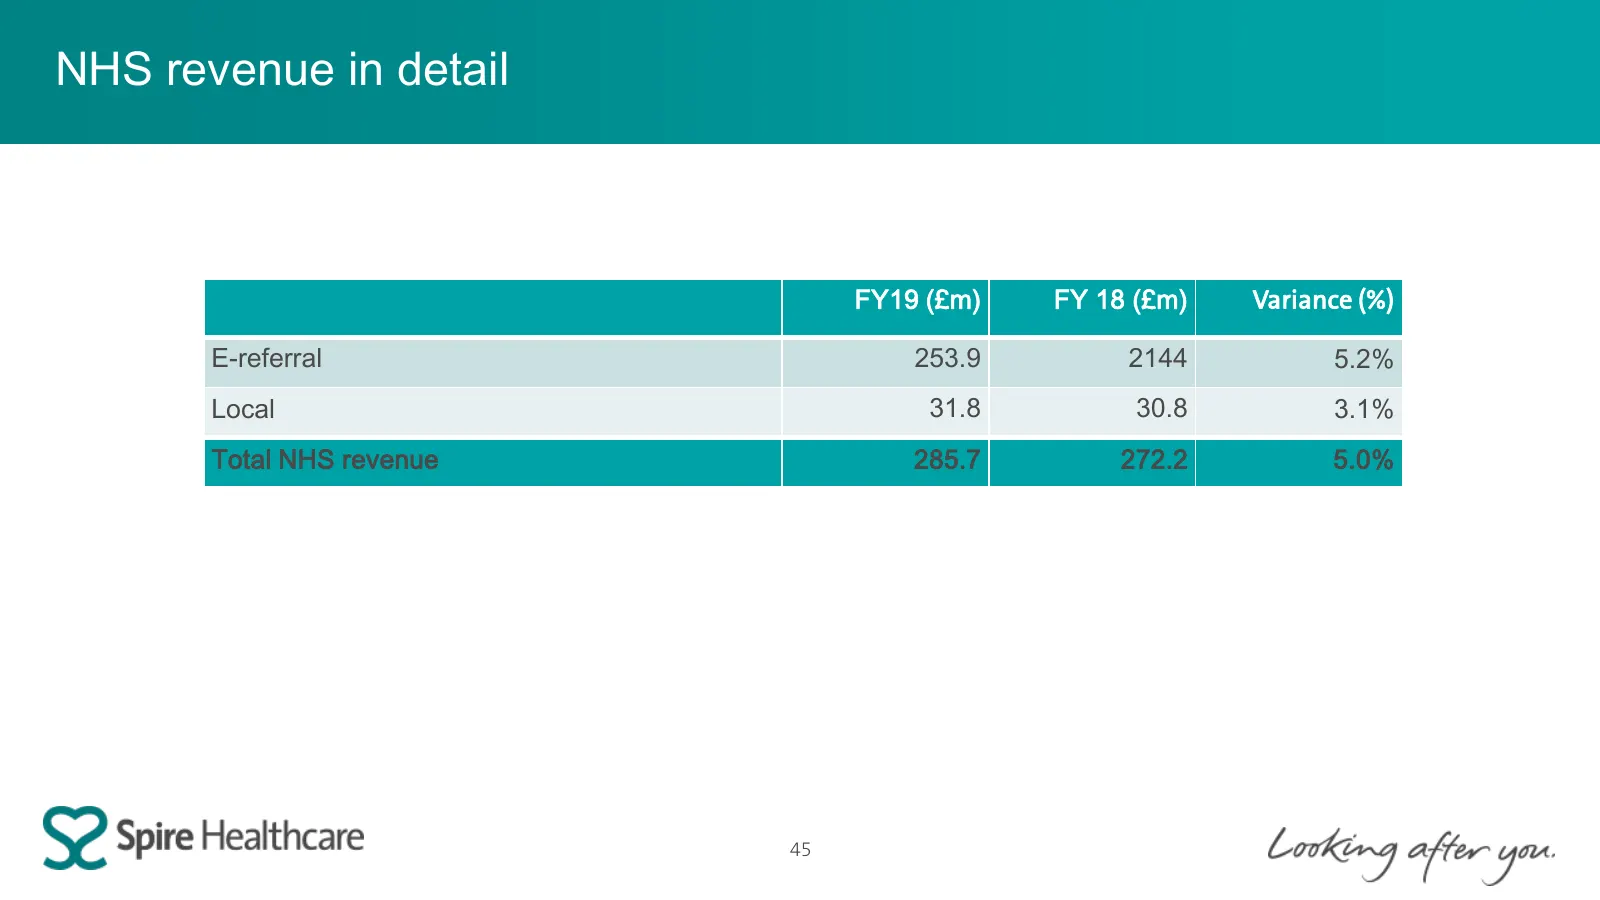
NHS revenue in detail FY19 (£m) FY 18 (£m) Variance (%) E-referral 253.9 2144 5.2% Local 31.8 30.8 3.1% Total NHS revenue 285.7 272.2 5.0% 45
Slide 46: EBITDA to Operating Profit
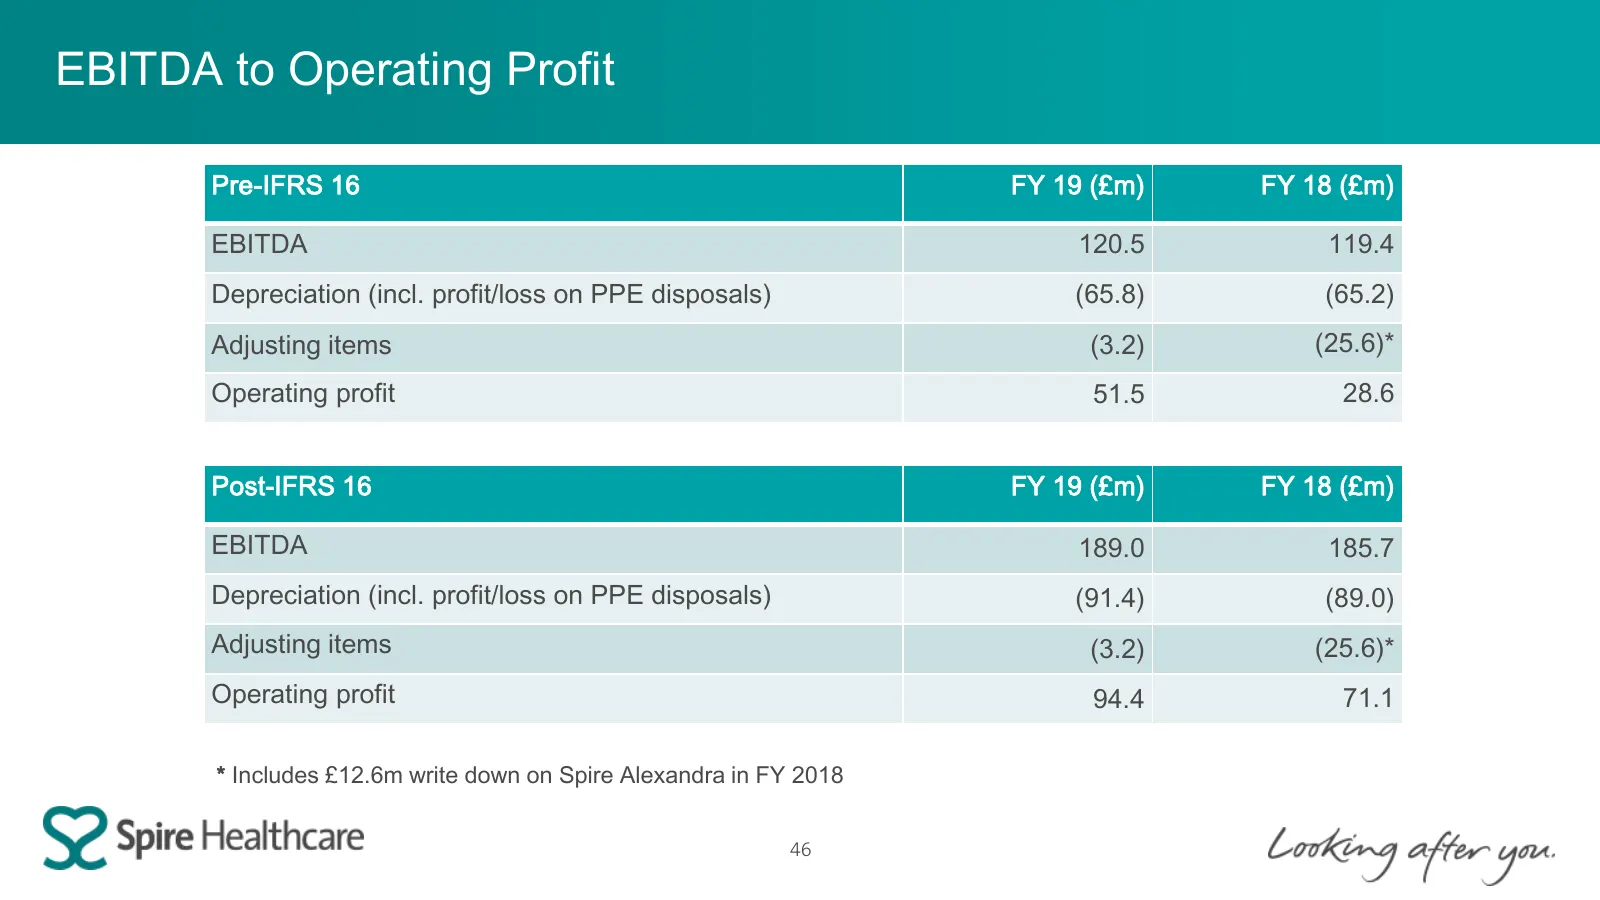
EBITDA to Operating Profit Pre-IFRS 16 FY 19 (£m) FY 18 (£m) EBITDA 120.5 119.4 Depreciation (incl. profit/loss on PPE disposals) (65.8) (65.2) Adjusting items (3.2) (25.6)* Operating profit 51.5 28.6 Post-IFRS 16 FY 19 (£m) FY 18 (£m) EBITDA 189.0 185.7 Depreciation (incl. profit/loss on PPE dispos
Slide 47: Cash surplus after capex and dividend – pre IFRS16
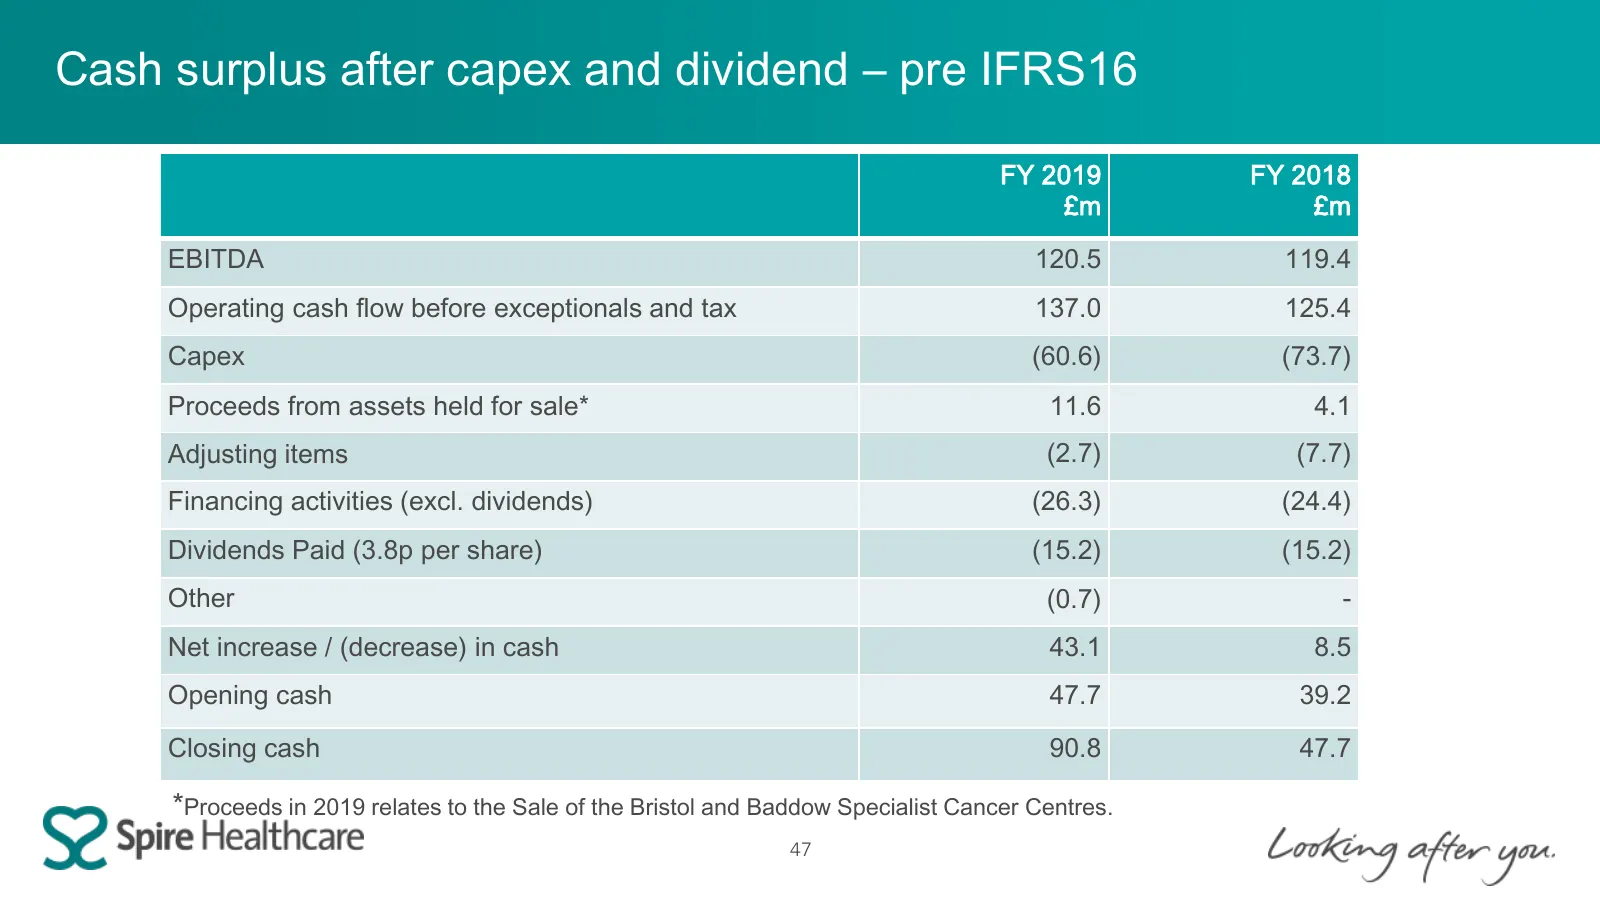
Cash surplus after capex and dividend – pre IFRS16 FY 2019 FY 2018 £m £m EBITDA 120.5 119.4 Operating cash flow before exceptionals and tax 137.0 125.4 Capex (60.6) (73.7) Proceeds from assets held for sale* 11.6 4.1 Adjusting items (2.7) (7.7) Financing activities (excl. dividends) (26.3) (24.4) Di
Slide 48: Exceptional costs and lower tax driving profit growth post IFRS 16
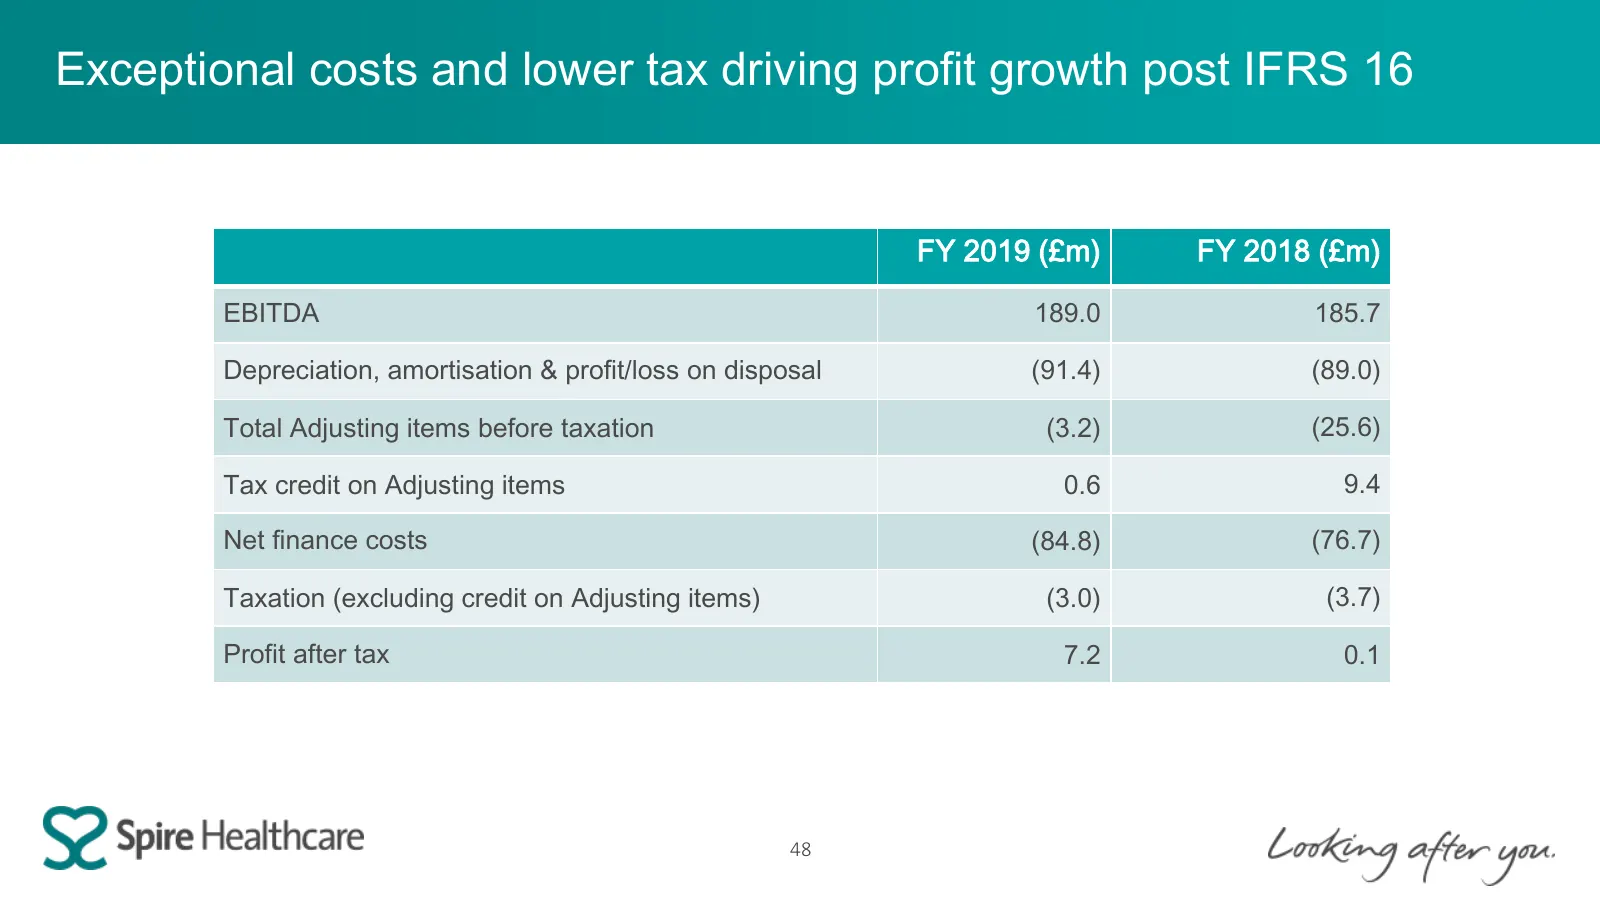
Exceptional costs and lower tax driving profit growth post IFRS 16 FY 2019 (£m) FY 2018 (£m) EBITDA 189.0 185.7 Depreciation, amortisation & profit/loss on disposal (91.4) (89.0) Total Adjusting items before taxation (3.2) (25.6) Tax credit on Adjusting items 0.6 9.4 Net finance costs (84.8) (76.7)
Slide 49: Cash positive (post IFRS16)
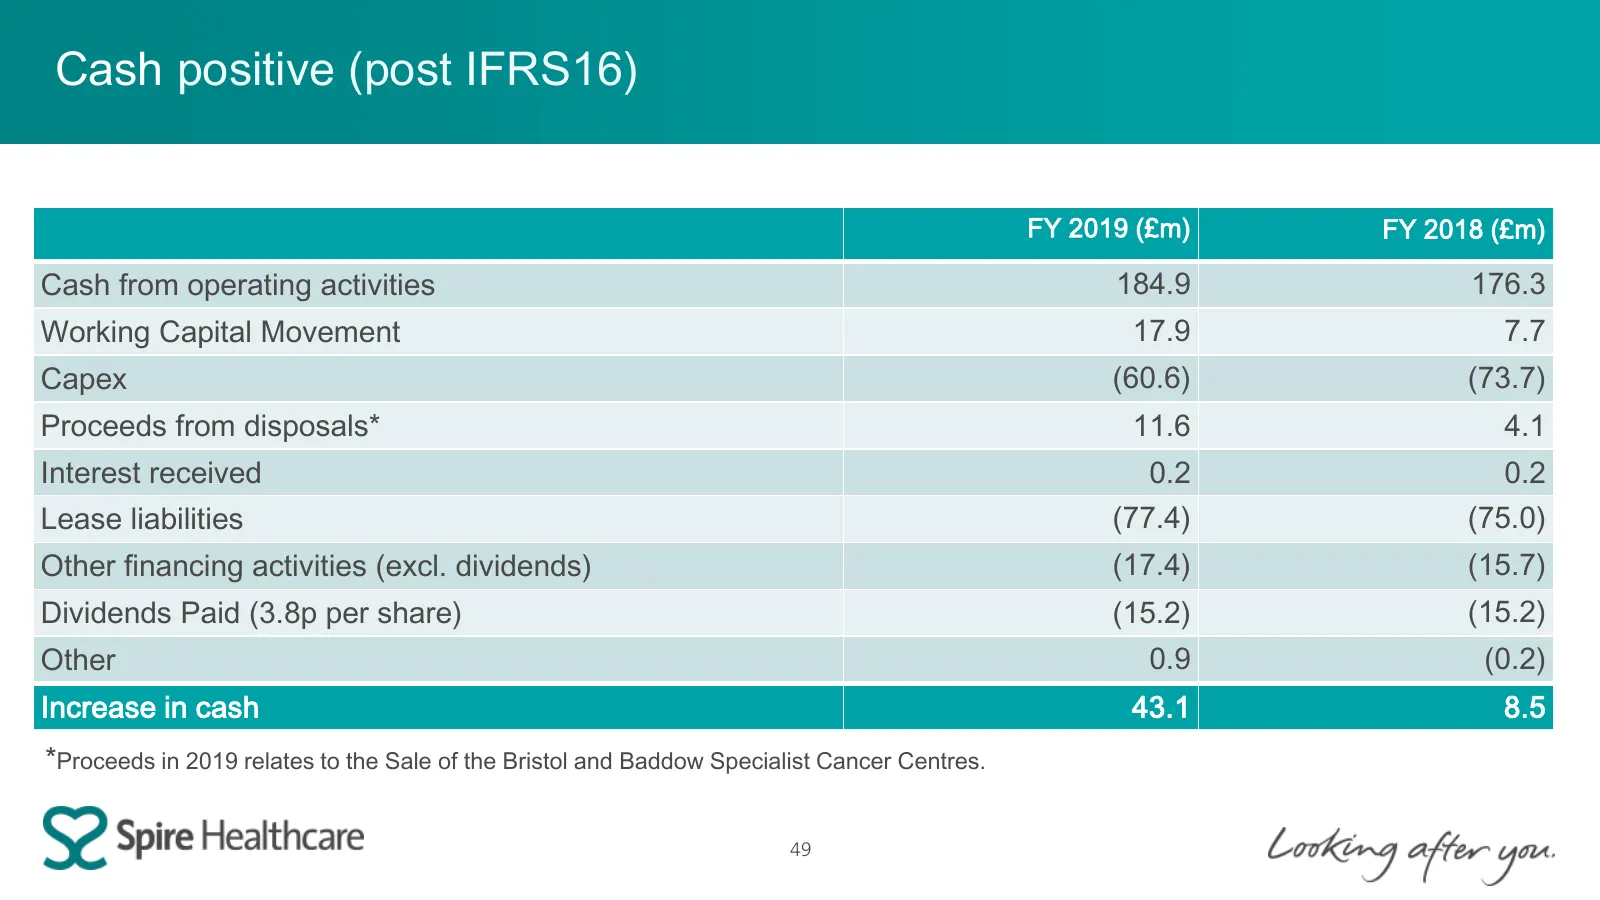
Cash positive (post IFRS16) FY 2019 (£m) FY 2018 (£m) Cash from operating activities 184.9 176.3 Working Capital Movement 17.9 7.7 Capex (60.6) (73.7) Proceeds from disposals* 11.6 4.1 Interest received 0.2 0.2 Lease liabilities (77.4) (75.0) Other financing activities (excl. dividends) (17.4) (15.7
Slide 50: Balance sheet
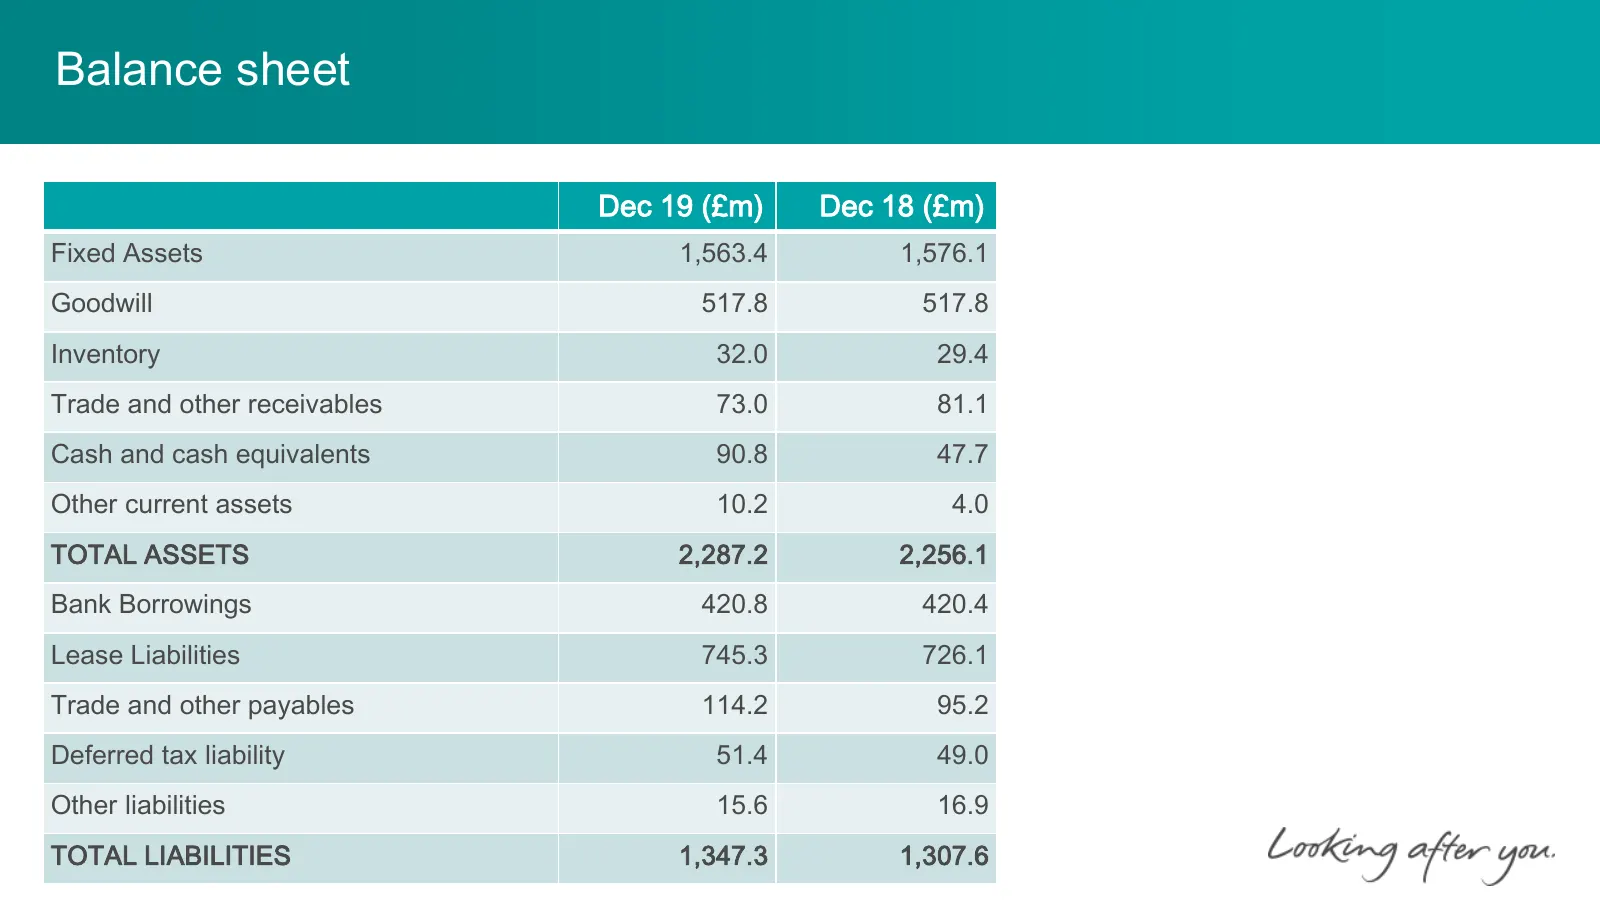
Balance sheet Dec 19 (£m) Dec 18 (£m) Fixed Assets 1,563.4 1,576.1 Goodwill 517.8 517.8 Inventory 32.0 29.4 Trade and other receivables 73.0 81.1 Cash and cash equivalents 90.8 47.7 Other current assets 10.2 4.0 TOTAL ASSETS 2,287.2 2,256.1 Bank Borrowings 420.8 420.4 Lease Liabilities 745.3 726.1 T
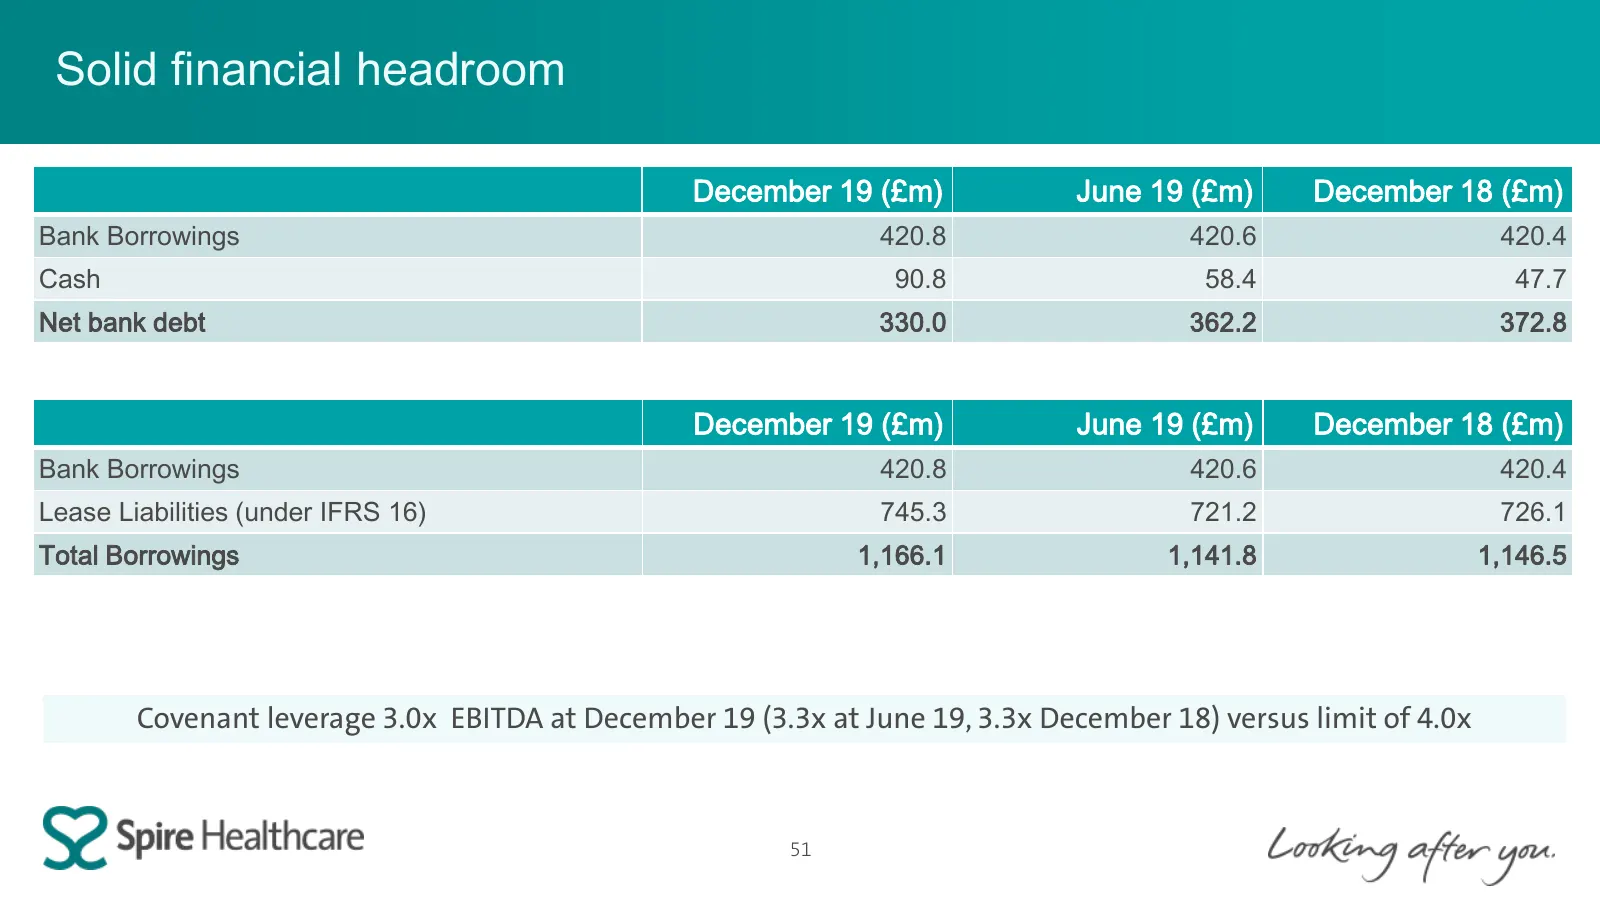
Slide 51: Solid financial headroom
Solid financial headroom December 19 (£m) June 19 (£m) December 18 (£m) Bank Borrowings 420.8 420.6 420.4 Cash 90.8 58.4 47.7 Net bank debt 330.0 362.2 372.8 December 19 (£m) June 19 (£m) December 18 (£m) Bank Borrowings 420.8 420.6 420.4 Lease Liabilities (under IFRS 16) 745.3 721.2 726.1 Total Bor
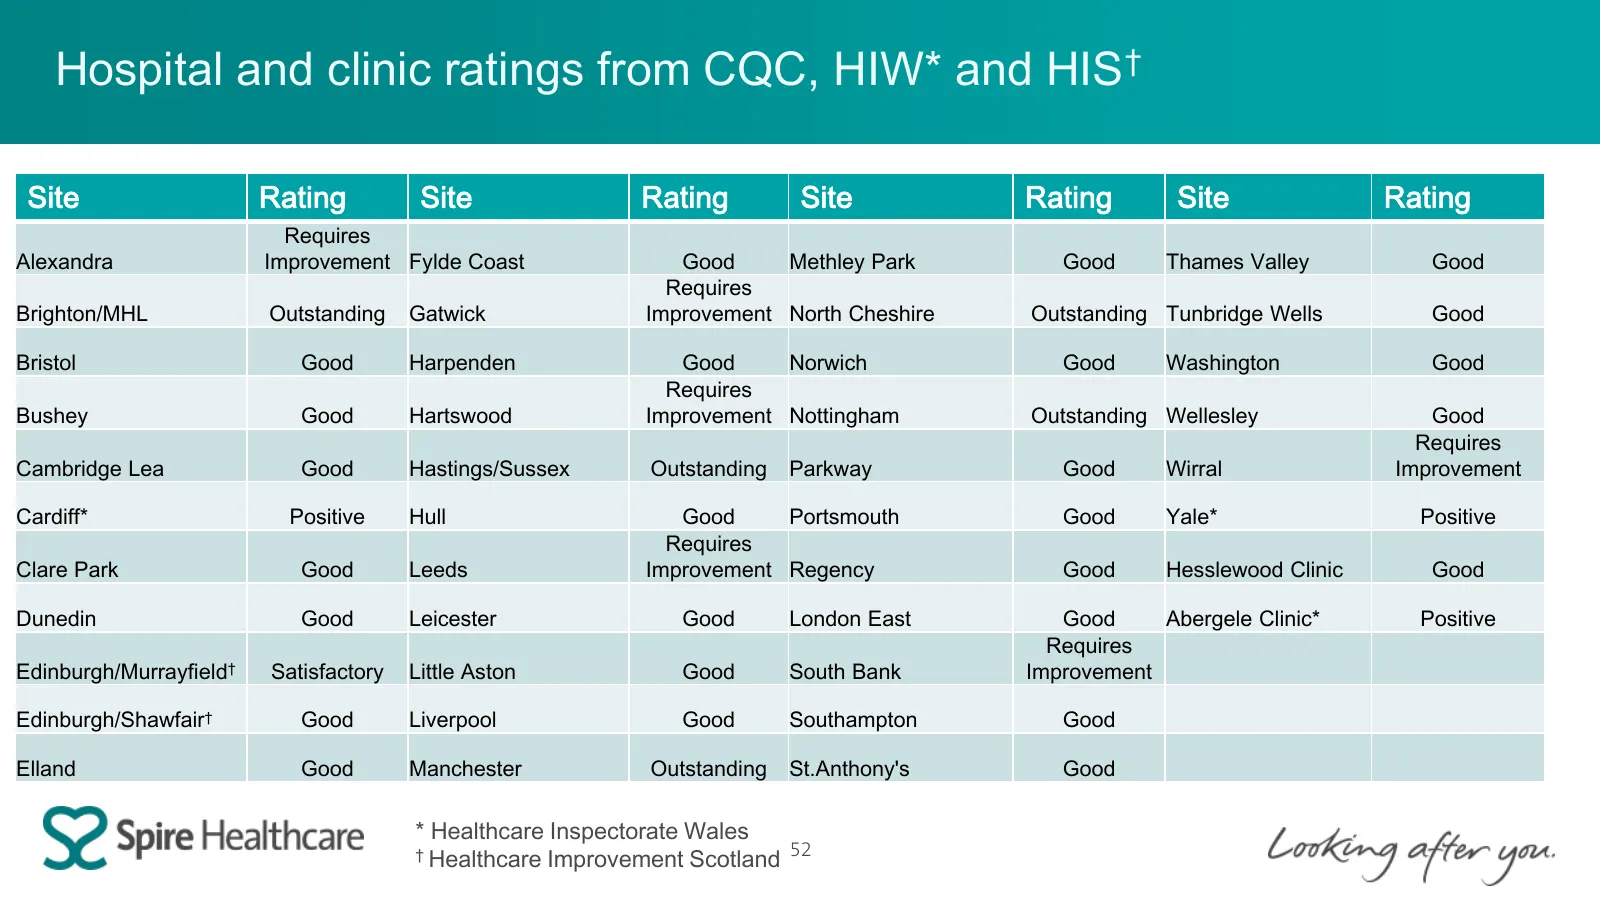
Slide 52: Hospital and clinic ratings from CQC, HIW and HIS
Hospital and clinic ratings from CQC, HIW* and HIS† Site Rating Site Rating Site Rating Site Rating Requires Alexandra Improvement Fylde Coast Good Methley Park Good Thames Valley Good Requires Brighton/MHL Outstanding Gatwick Improvement North Cheshire Outstanding Tunbridge Wells Good Bristol Good
Source: Internet Archive copy of investors.spirehealthcare.com
More decks from Spire Healthcare Group PLC
 FY2025 Earnings Presentation37 slides · Mar 5, 2026
 H1 2025 Earnings Presentation39 slides · Jul 31, 2025
 Investor Presentation (June 2025)34 slides · June 2025
 FY2024 Earnings Presentation36 slides · Mar 6, 2025
 dbAccess UK & Ireland Conference 202512 slides · Jan 21, 2025
 H1 2024 Earnings Presentation42 slides · Sep 12, 2024