Avaya — Q2 FY2021 Earnings Presentation
38 slides from Avaya's earnings presentation, May 6, 2021

Slide 1: Investor Presentation 2Q FY21
© 2021 Avaya Inc. All rights reserved Investor Presentation 2Q FY21 May 6, 2021 Exhibit 99.2
Slide 2: Cautionary Note Regarding Forward-Looking Statements
204-0-0 127-127-127 17-114-210 80-200-74 86-183-242 247-150-70 0 – 0 – 0 TEXT © 2021 Avaya Inc. All rights reserved 2 Cautionary Note Regarding Forward-Looking Statements This release contains certain “forward-looking statements.” All statements other than statements of historical fact are “forward-
Slide 3: Use of non-GAAP (Adjusted) Financial Measures
204-0-0 127-127-127 17-114-210 80-200-74 86-183-242 247-150-70 0 – 0 – 0 TEXT © 2021 Avaya Inc. All rights reserved 3 Use of non-GAAP (Adjusted) Financial Measures The information furnished in this presentation includes non-GAAP financial measures that differ from measures calculated in accordance w
Slide 4: Avaya's Q2 at a Glance
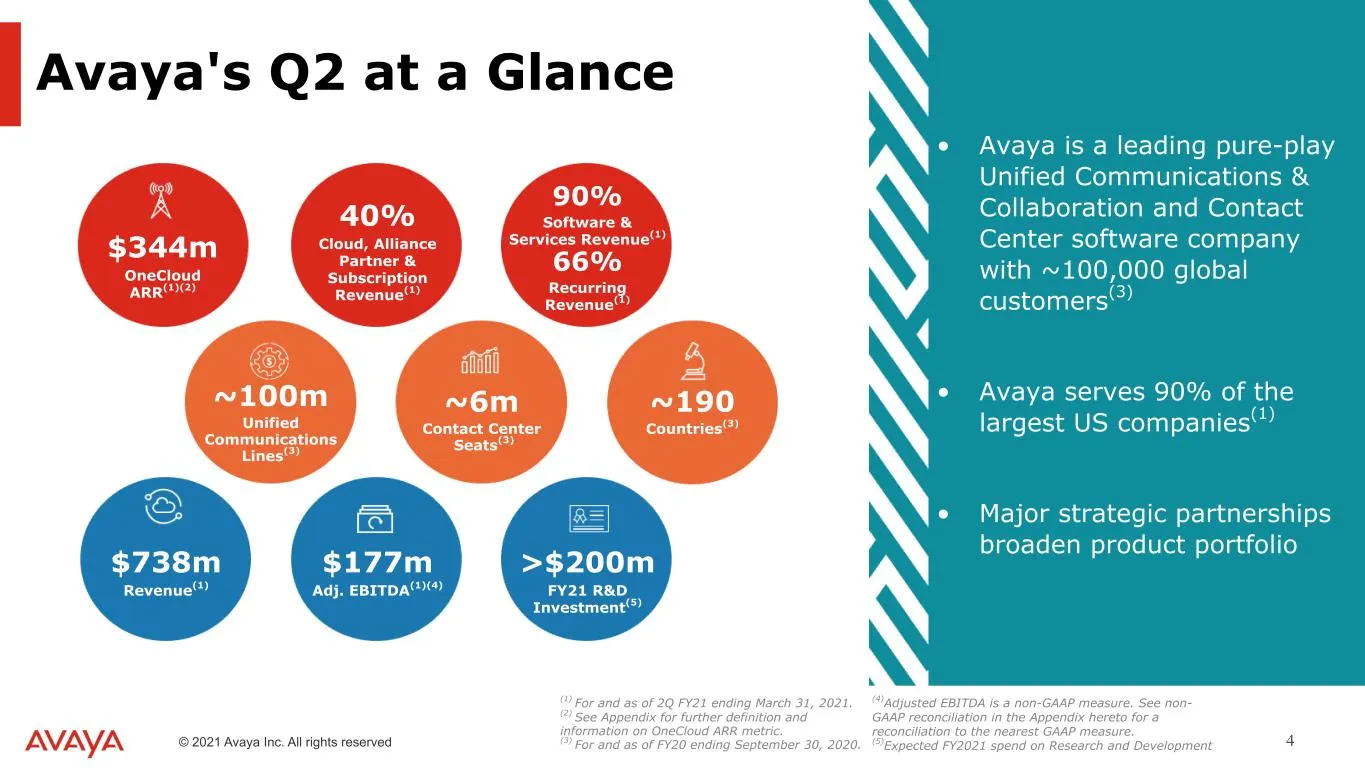
204-0-0 127-127-127 17-114-210 80-200-74 86-183-242 247-150-70 0 – 0 – 0 TEXT © 2021 Avaya Inc. All rights reserved 4 $177m Adj. EBITDA(1)(4) ~100m Unified Communications Lines(3) ~190 Countries(3) ~6m Contact Center Seats(3) (1) For and as of 2Q FY21 ending March 31, 2021. (2) See Appendix for furt
Slide 5: Arc of Avaya's Journey
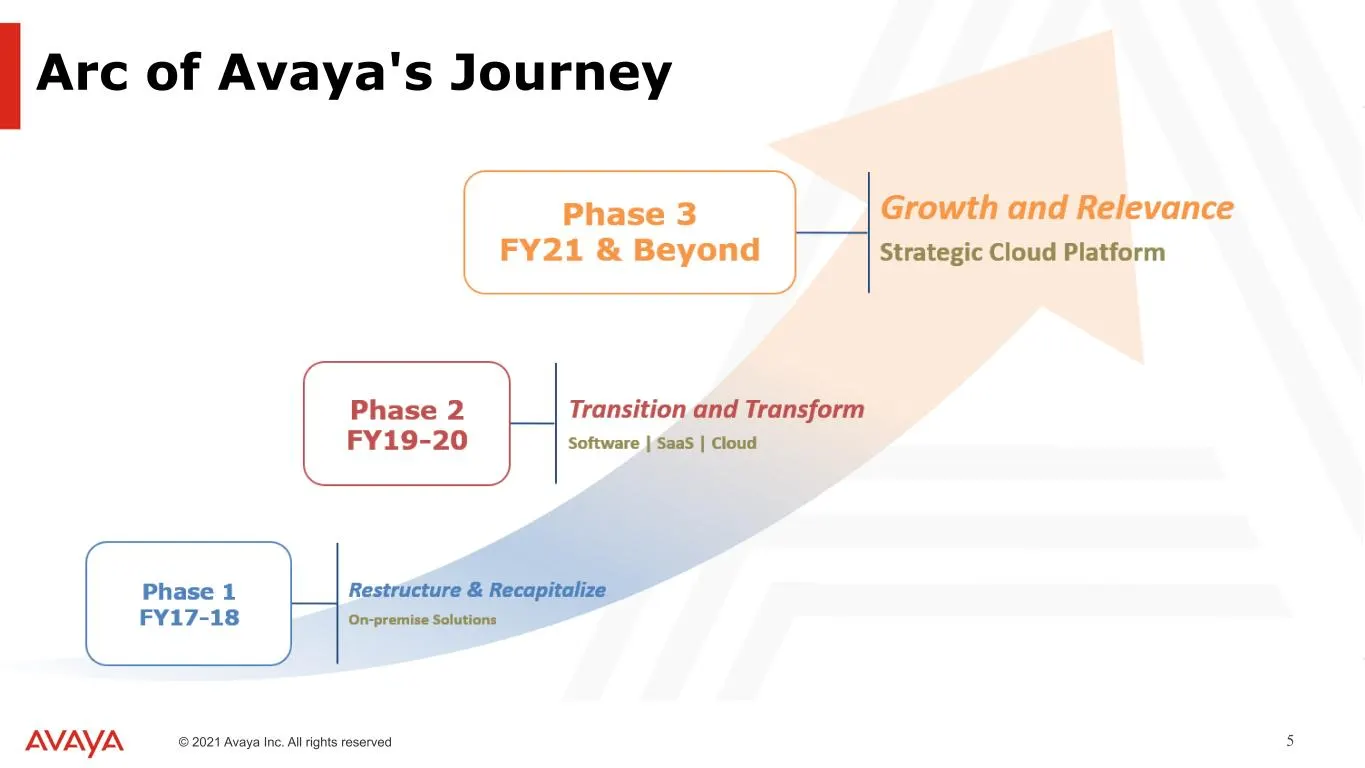
204-0-0 127-127-127 17-114-210 80-200-74 86-183-242 247-150-70 0 – 0 – 0 TEXT © 2021 Avaya Inc. All rights reserved 5 Arc of Avaya's Journey
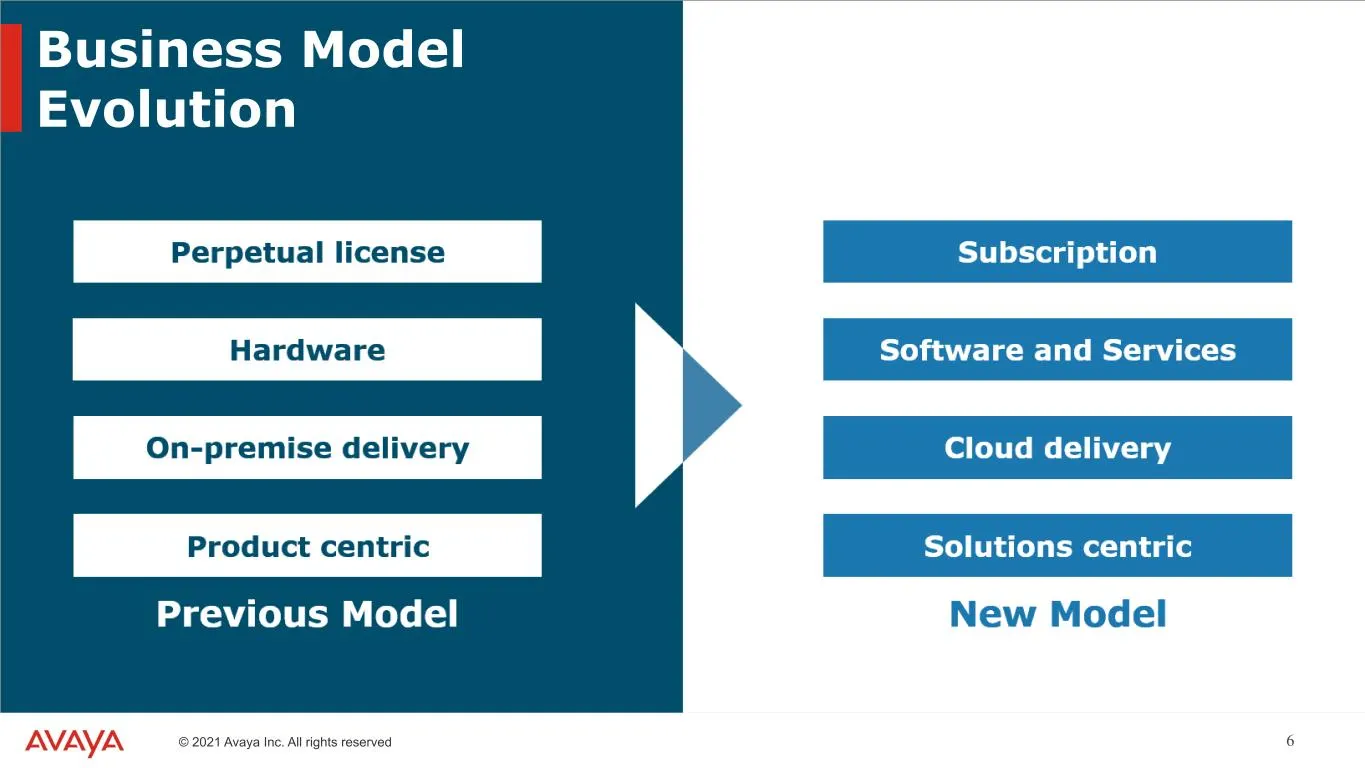
Slide 6: Business Model Evolution
204-0-0 127-127-127 17-114-210 80-200-74 86-183-242 247-150-70 0 – 0 – 0 TEXT © 2021 Avaya Inc. All rights reserved 6 Business Model Evolution
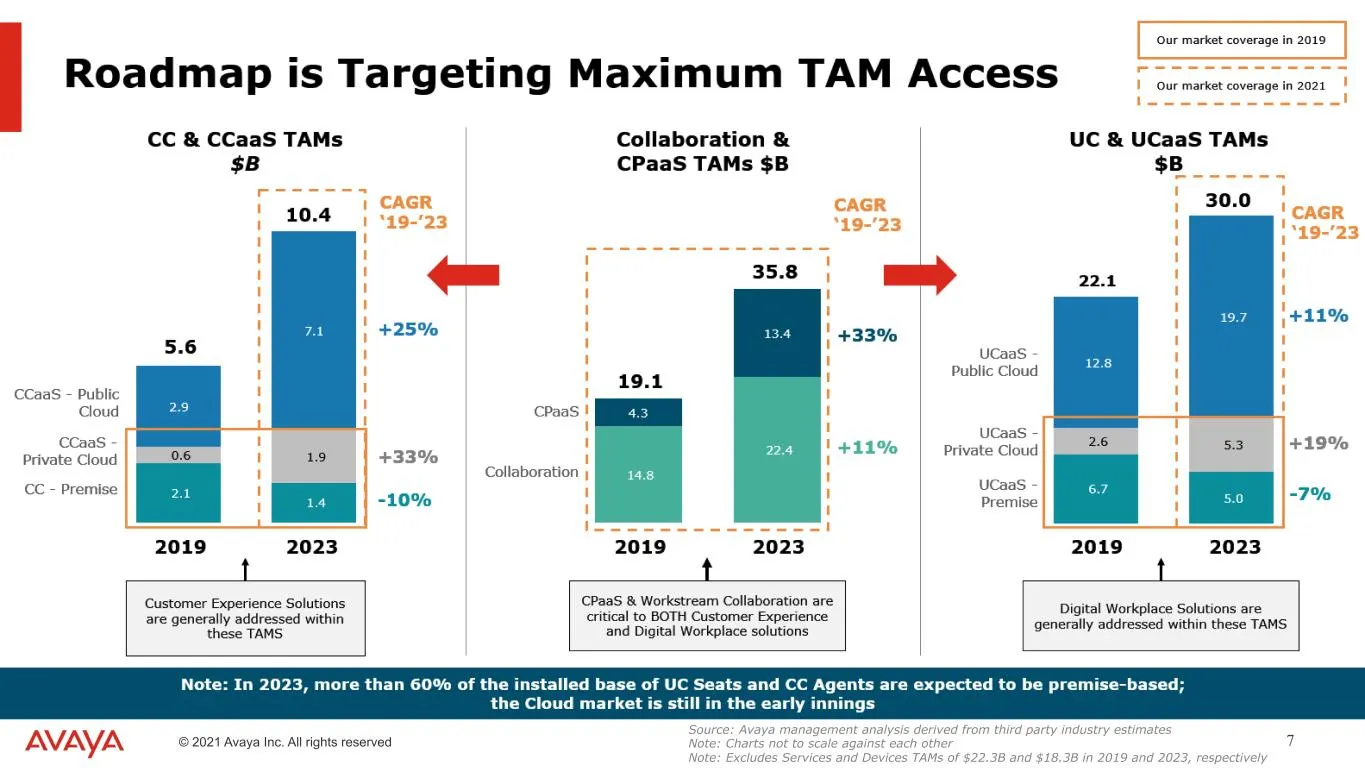
Slide 7: Source: Avaya management analysis derived from third party industry estimates Note: Charts not to
204-0-0 127-127-127 17-114-210 80-200-74 86-183-242 247-150-70 0 – 0 – 0 TEXT © 2021 Avaya Inc. All rights reserved 7 Source: Avaya management analysis derived from third party industry estimates Note: Charts not to scale against each other Note: Excludes Services and Devices TAMs of $22.3B and $18.
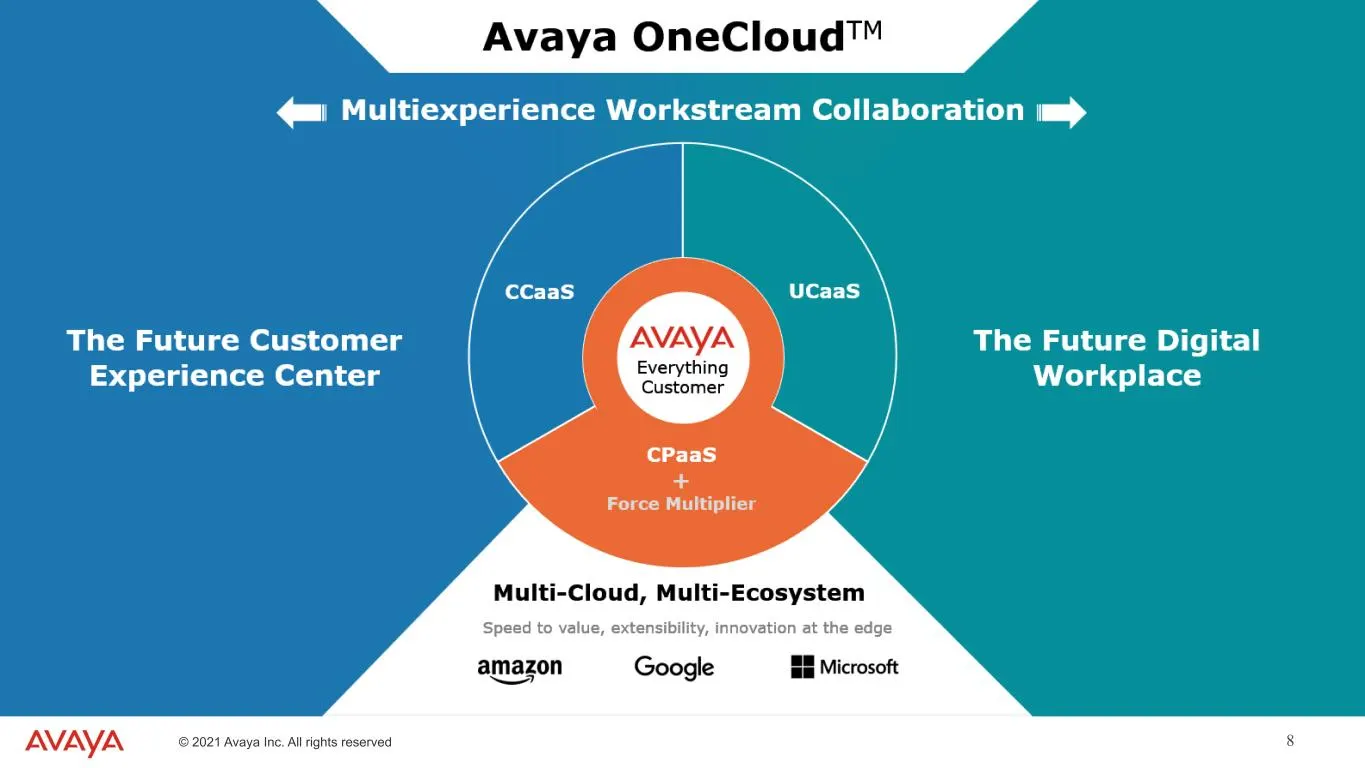
Slide 8: 204-0-0 127-127-127 17-114-210 80-200-74 86-183-242 247-150-70 0 – 0 – 0 TEXT © 2021 Avaya Inc. All rights reserved 8
204-0-0 127-127-127 17-114-210 80-200-74 86-183-242 247-150-70 0 – 0 – 0 TEXT © 2021 Avaya Inc. All rights reserved 8
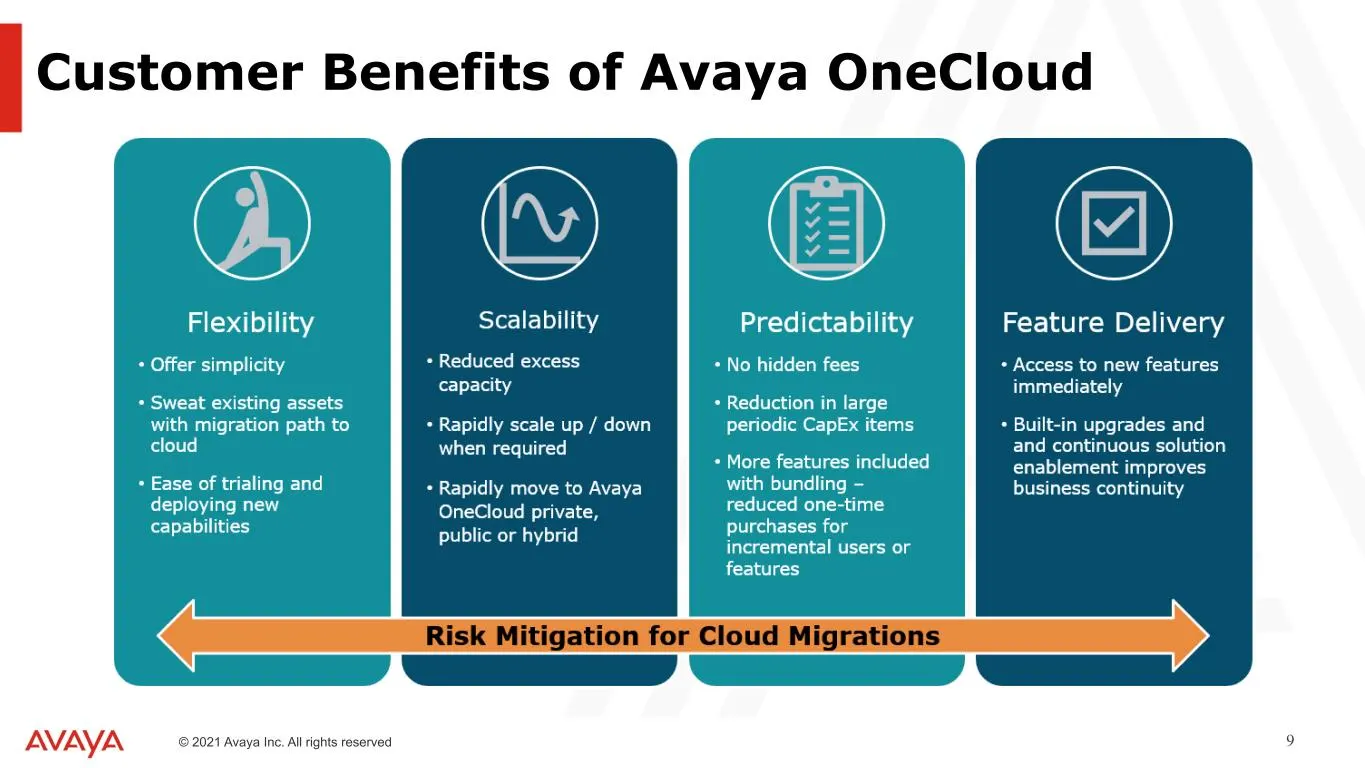
Slide 9: Customer Benefits of Avaya OneCloud
204-0-0 127-127-127 17-114-210 80-200-74 86-183-242 247-150-70 0 – 0 – 0 TEXT © 2021 Avaya Inc. All rights reserved 9 Customer Benefits of Avaya OneCloud
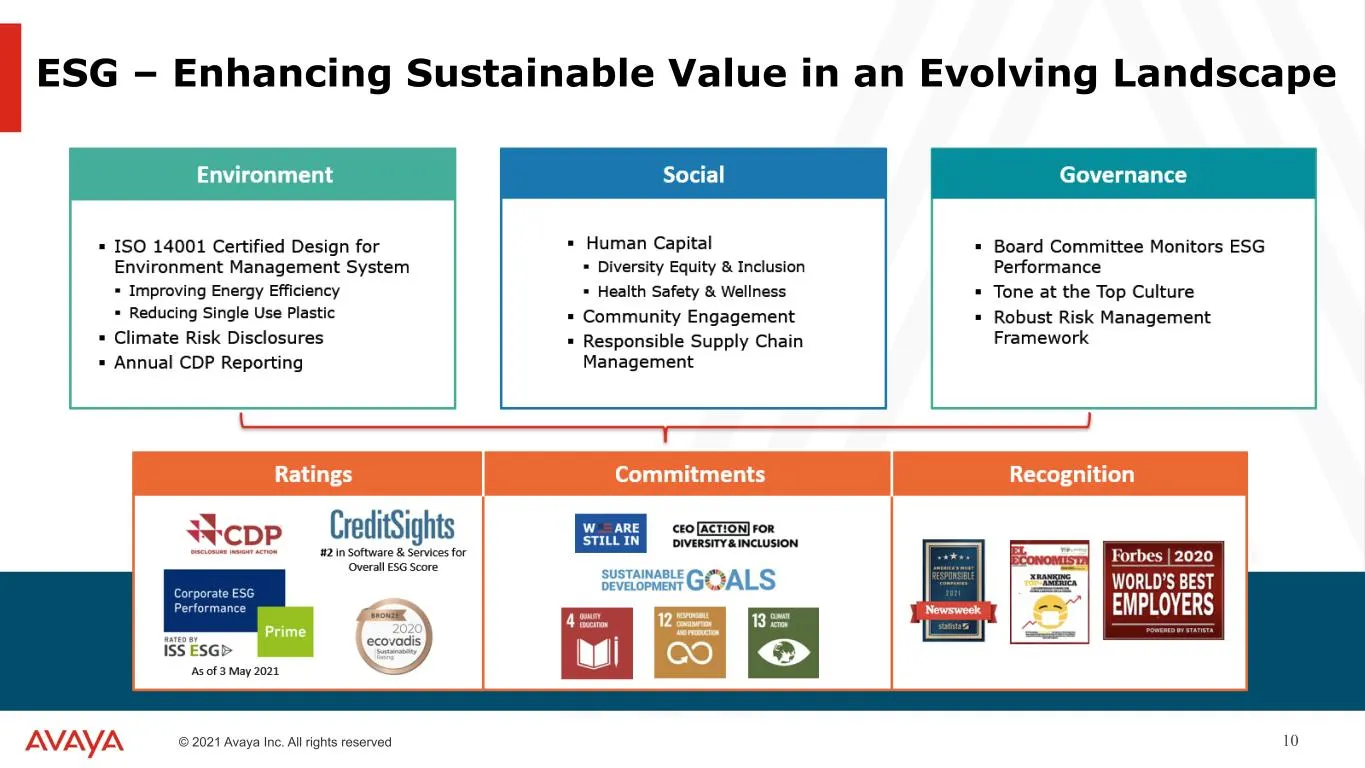
Slide 10: ESG – Enhancing Sustainable Value in an Evolving Landscape
204-0-0 127-127-127 17-114-210 80-200-74 86-183-242 247-150-70 0 – 0 – 0 TEXT © 2021 Avaya Inc. All rights reserved 10 ESG – Enhancing Sustainable Value in an Evolving Landscape
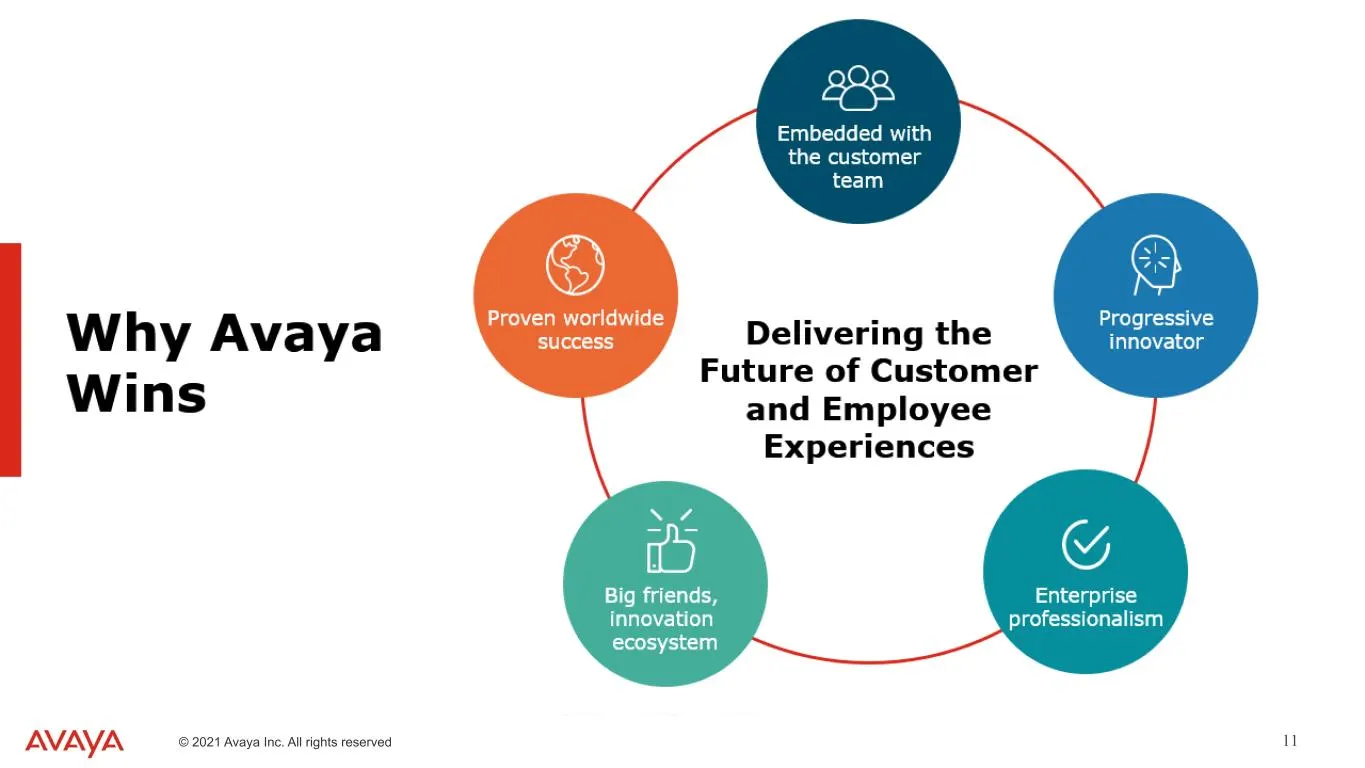
Slide 11: 204-0-0 127-127-127 17-114-210 80-200-74 86-183-242 247-150-70 0 – 0 – 0 TEXT © 2021 Avaya Inc. All rights reserved 11
204-0-0 127-127-127 17-114-210 80-200-74 86-183-242 247-150-70 0 – 0 – 0 TEXT © 2021 Avaya Inc. All rights reserved 11

Slide 12: Financial Overview 2Q FY21
204-0-0 127-127-127 17-114-210 80-200-74 86-183-242 247-150-70 0 – 0 – 0 TEXT © 2021 Avaya Inc. All rights reserved 12 Financial Overview 2Q FY21
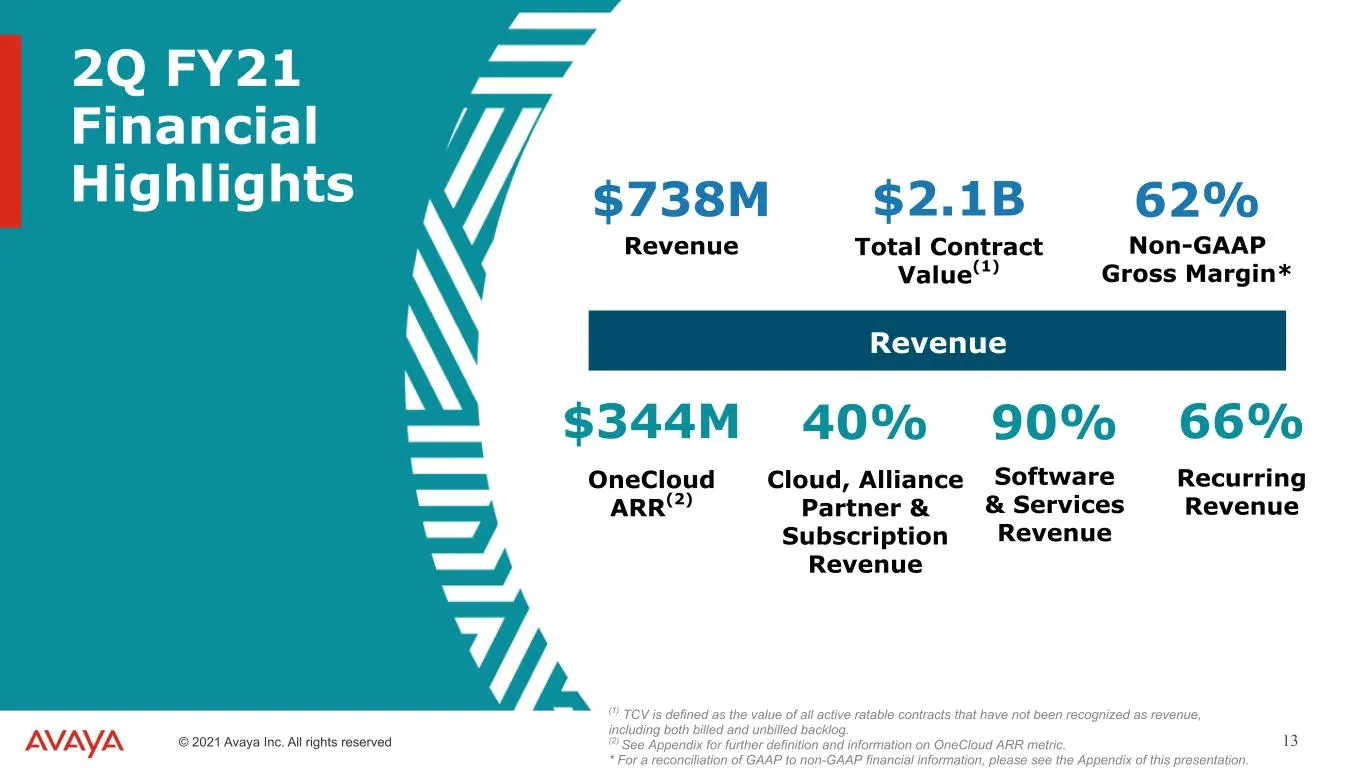
Slide 13: 2Q FY21 Financial Highlights
204-0-0 127-127-127 17-114-210 80-200-74 86-183-242 247-150-70 0 – 0 – 0 TEXT © 2021 Avaya Inc. All rights reserved 13 2Q FY21 Financial Highlights OneCloud ARR(2) Recurring Revenue Cloud, Alliance Partner & Subscription Revenue $344M 66%40% Revenue Total Contract Value(1) Non-GAAP Gross Margin* 62%
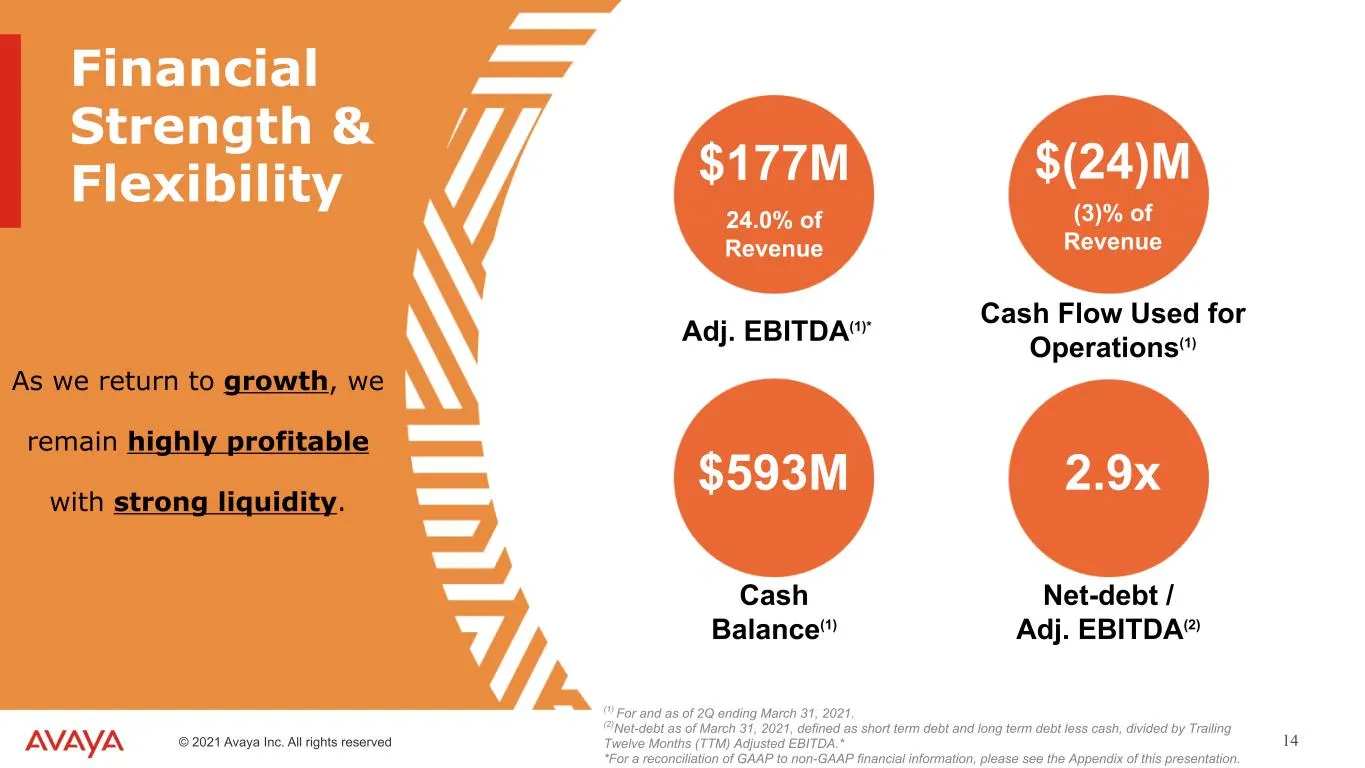
Slide 14: Financial Strength & Flexibility
204-0-0 127-127-127 17-114-210 80-200-74 86-183-242 247-150-70 0 – 0 – 0 TEXT © 2021 Avaya Inc. All rights reserved 14 $177M 24.0% of Revenue $593M 2.9x As we return to growth, we remain highly profitable with strong liquidity. (1) For and as of 2Q ending March 31, 2021. (2)Net-debt as of March 31,
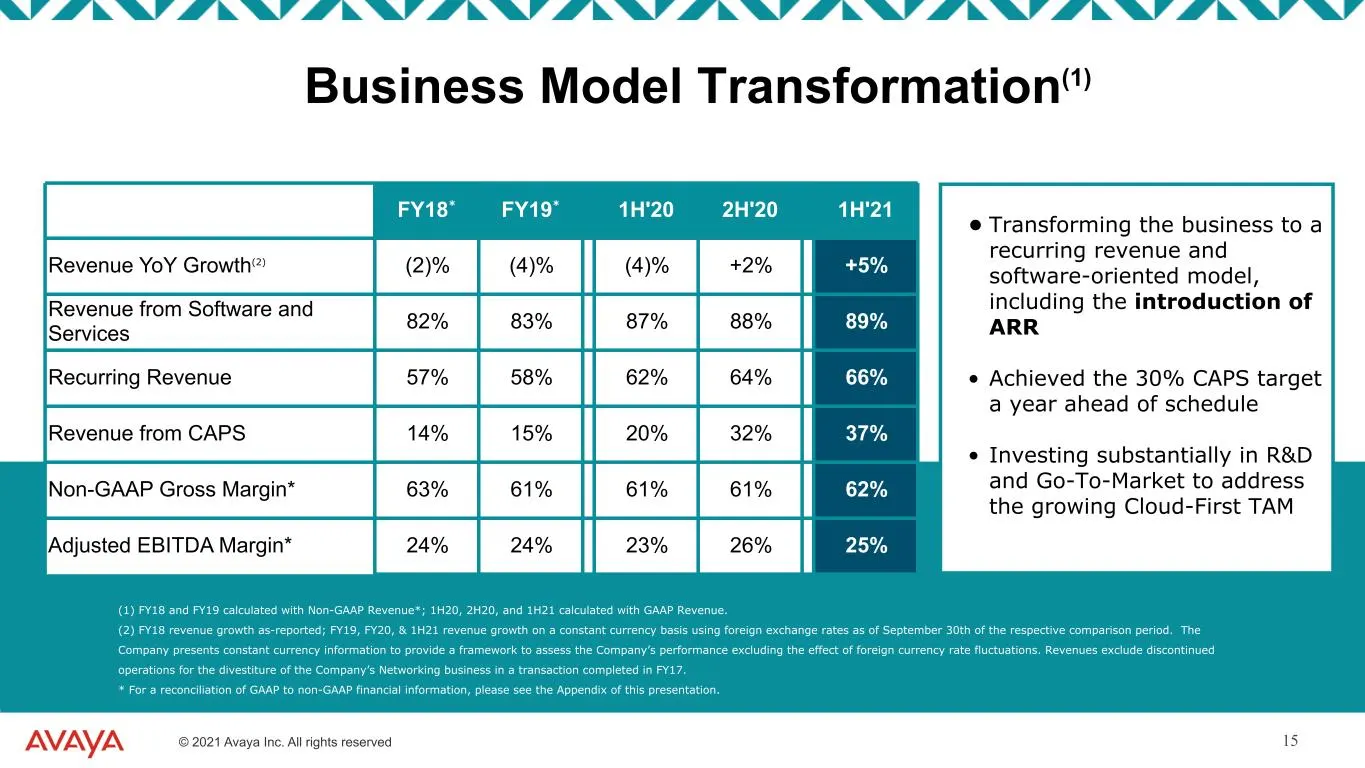
Slide 15: Business Model Transformation
204-0-0 127-127-127 17-114-210 80-200-74 86-183-242 247-150-70 0 – 0 – 0 TEXT © 2021 Avaya Inc. All rights reserved 15 • Transforming the business to a recurring revenue and software-oriented model, including the introduction of ARR • Achieved the 30% CAPS target a year ahead of schedule • Investing
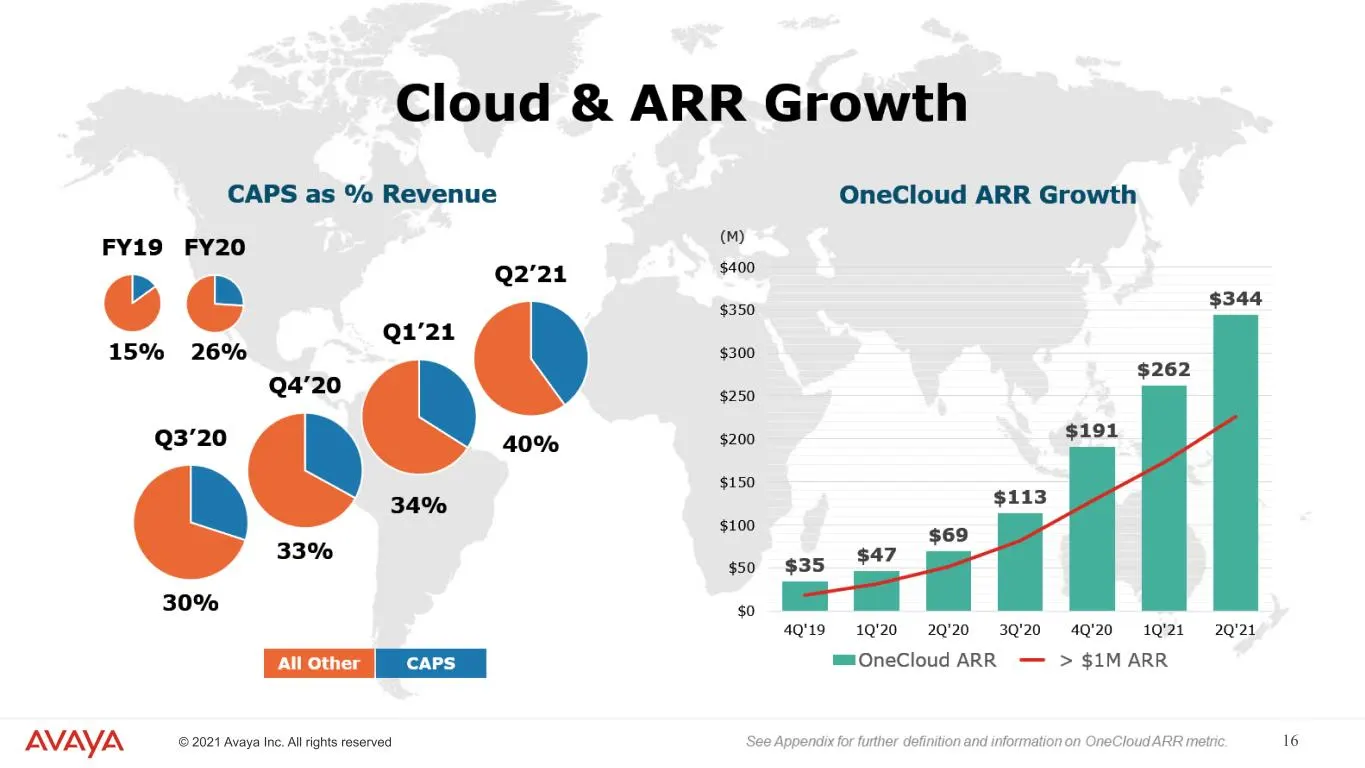
Slide 16: Cloud & ARR Growth
204-0-0 127-127-127 17-114-210 80-200-74 86-183-242 247-150-70 0 – 0 – 0 TEXT © 2021 Avaya Inc. All rights reserved 16 Cloud & ARR Growth
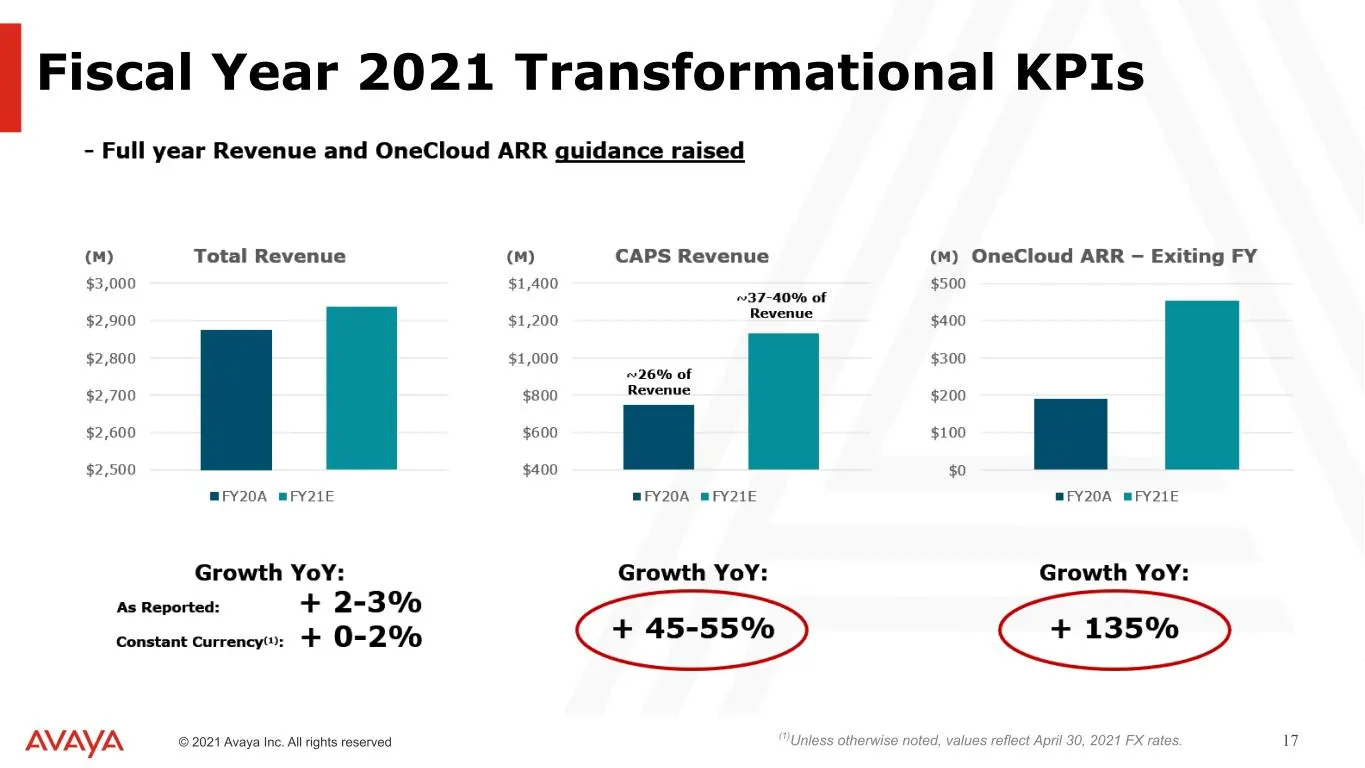
Slide 17: Fiscal Year 2021 Transformational KPIs
204-0-0 127-127-127 17-114-210 80-200-74 86-183-242 247-150-70 0 – 0 – 0 TEXT © 2021 Avaya Inc. All rights reserved 17 Fiscal Year 2021 Transformational KPIs (1)Unless otherwise noted, values reflect April 30, 2021 FX rates.
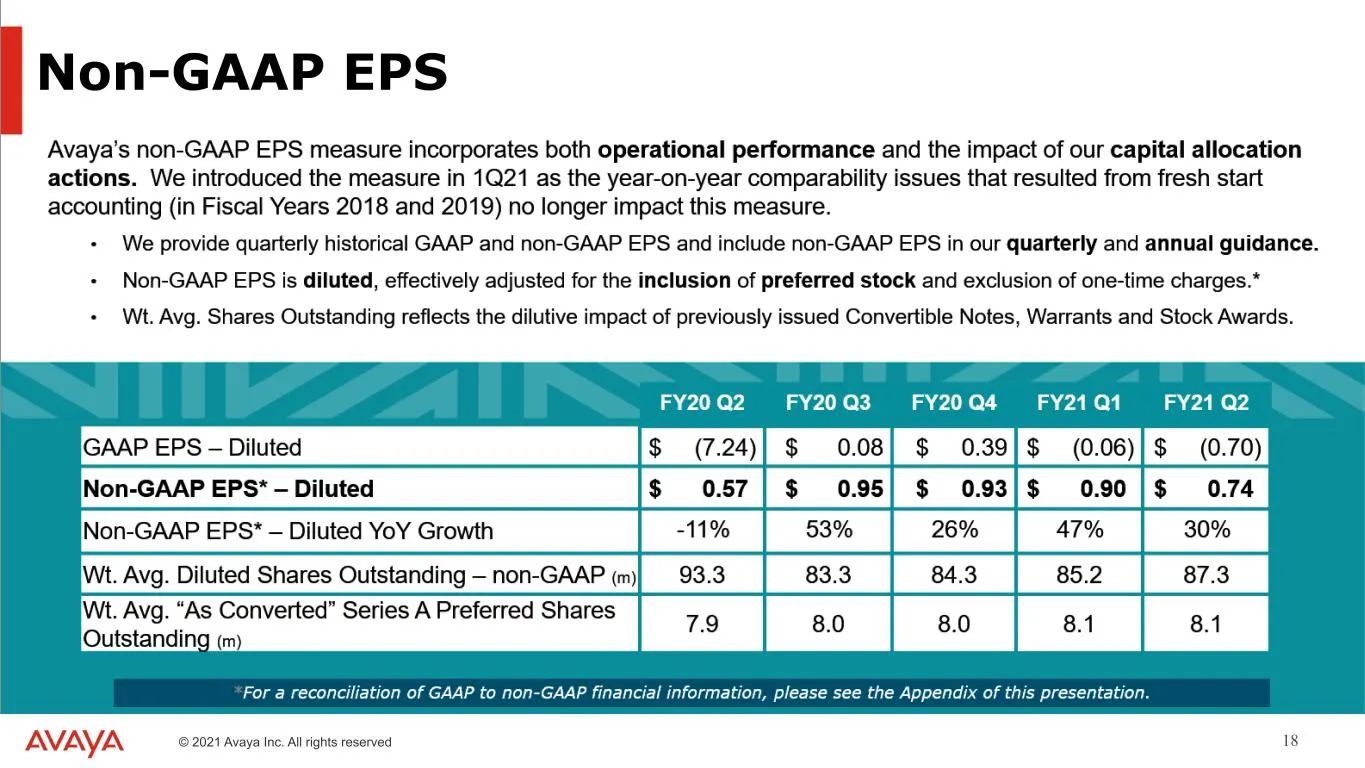
Slide 18: Non-GAAP EPS
204-0-0 127-127-127 17-114-210 80-200-74 86-183-242 247-150-70 0 – 0 – 0 TEXT © 2021 Avaya Inc. All rights reserved 18 Non-GAAP EPS
Slide 19: Long Term Financial Policy Targets
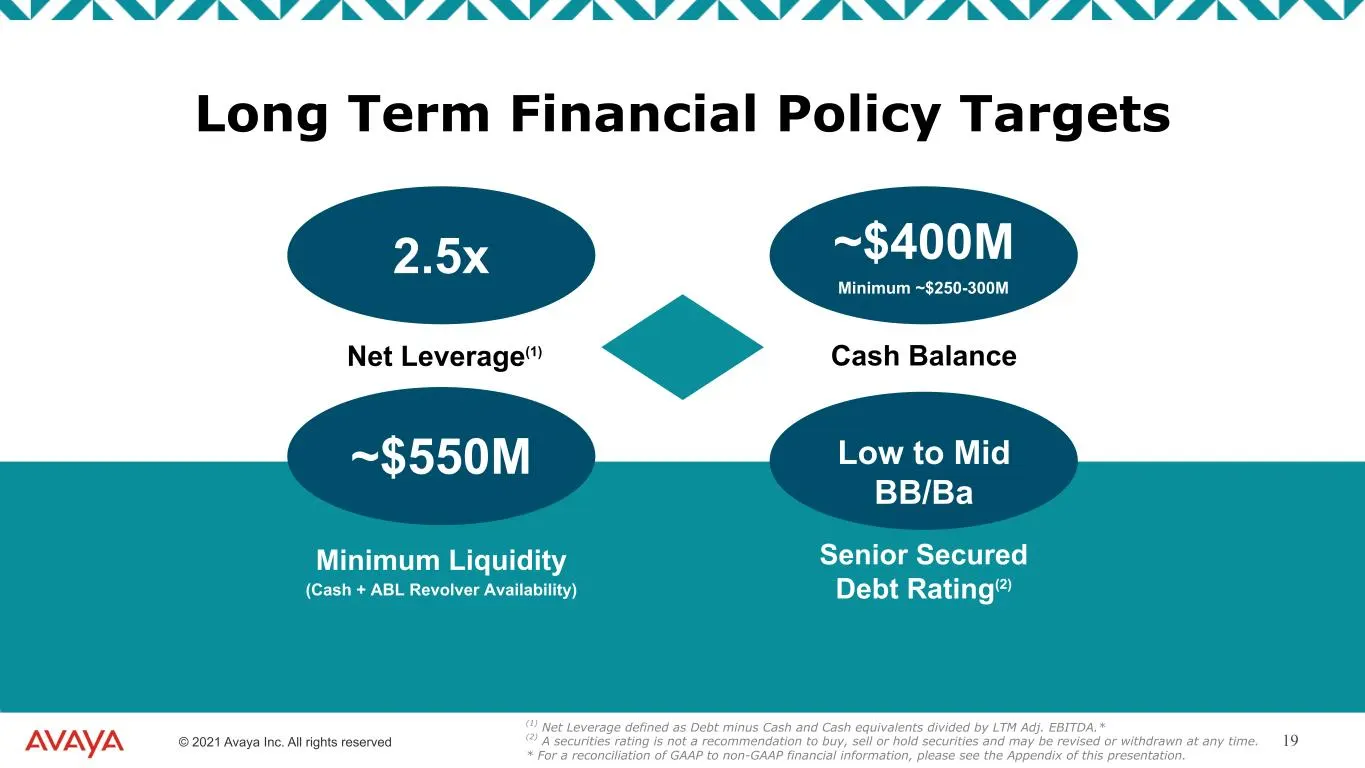
204-0-0 127-127-127 17-114-210 80-200-74 86-183-242 247-150-70 0 – 0 – 0 TEXT © 2021 Avaya Inc. All rights reserved 19 2.5x ~$550M Low to Mid BB/Ba ~$400M Net Leverage(1) Cash Balance Minimum Liquidity (Cash + ABL Revolver Availability) Senior Secured Debt Rating(2) Minimum ~$250-300M (1) Net Levera
Slide 20: 2Q FY21 Update
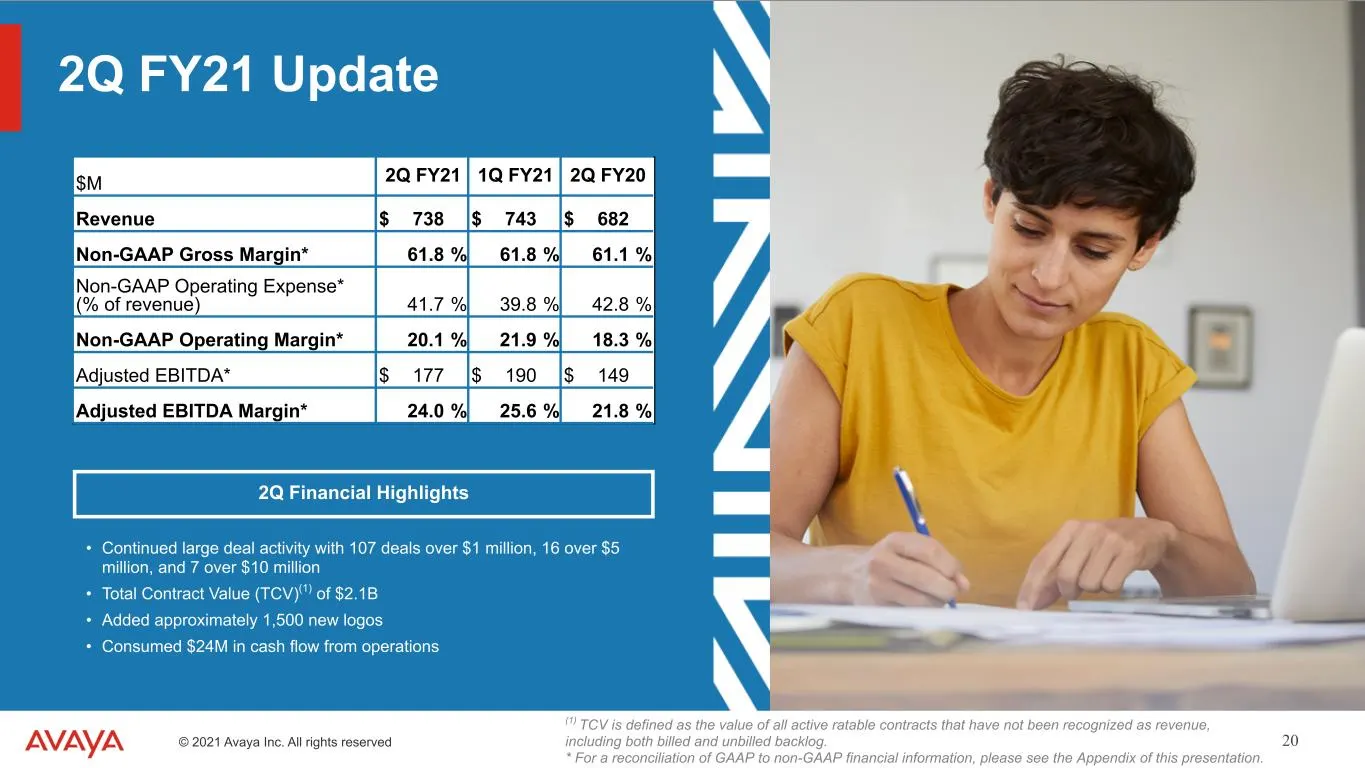
204-0-0 127-127-127 17-114-210 80-200-74 86-183-242 247-150-70 0 – 0 – 0 TEXT © 2021 Avaya Inc. All rights reserved 20 2Q Financial Highlights $M 2Q FY21 1Q FY21 2Q FY20 Revenue $ 738 $ 743 $ 682 Non-GAAP Gross Margin* 61.8 % 61.8 % 61.1 % Non-GAAP Operating Expense* (% of revenue) 41.7 % 39.8 % 42.
Slide 21: Business Highlights
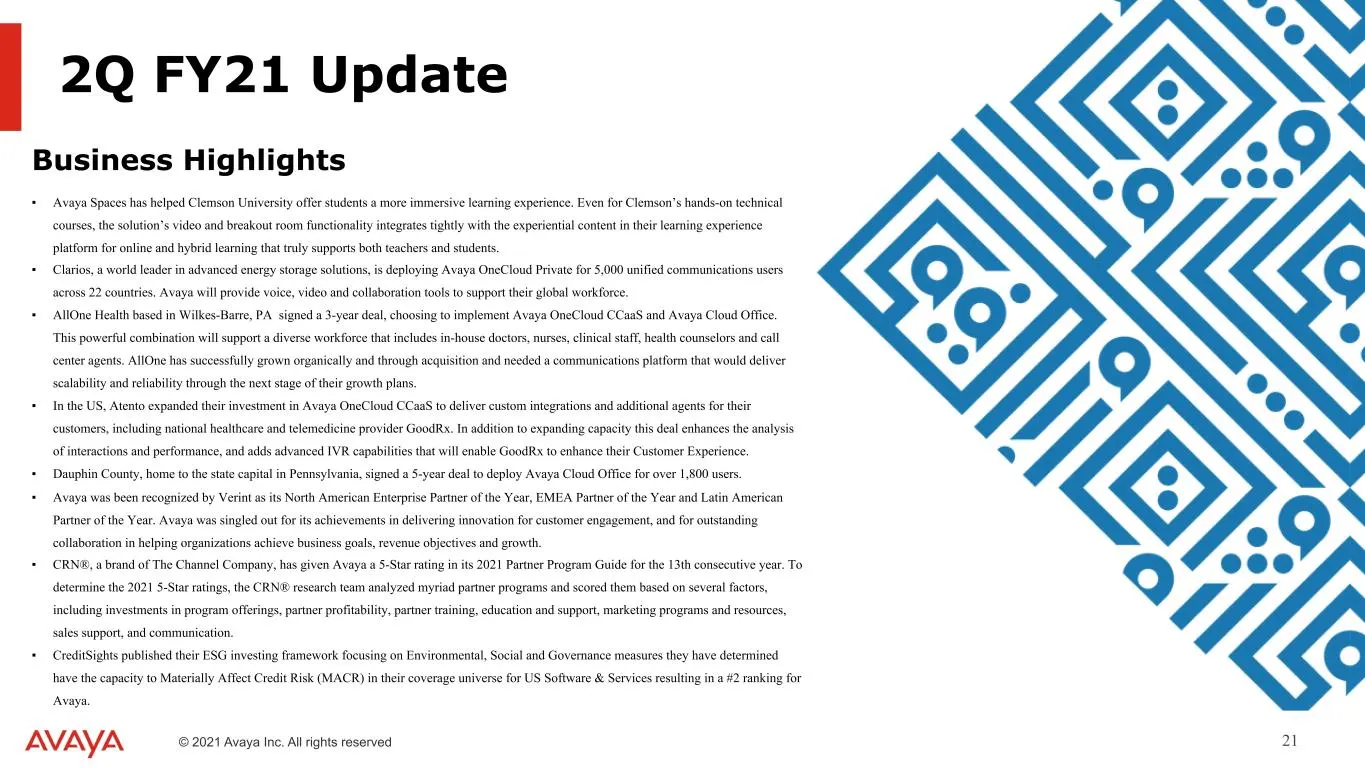
204-0-0 127-127-127 17-114-210 80-200-74 86-183-242 247-150-70 0 – 0 – 0 TEXT © 2021 Avaya Inc. All rights reserved 21 Business Highlights ▪ Avaya Spaces has helped Clemson University offer students a more immersive learning experience. Even for Clemson’s hands-on technical courses, the solution’s v
Slide 22: Quarterly Income Statement
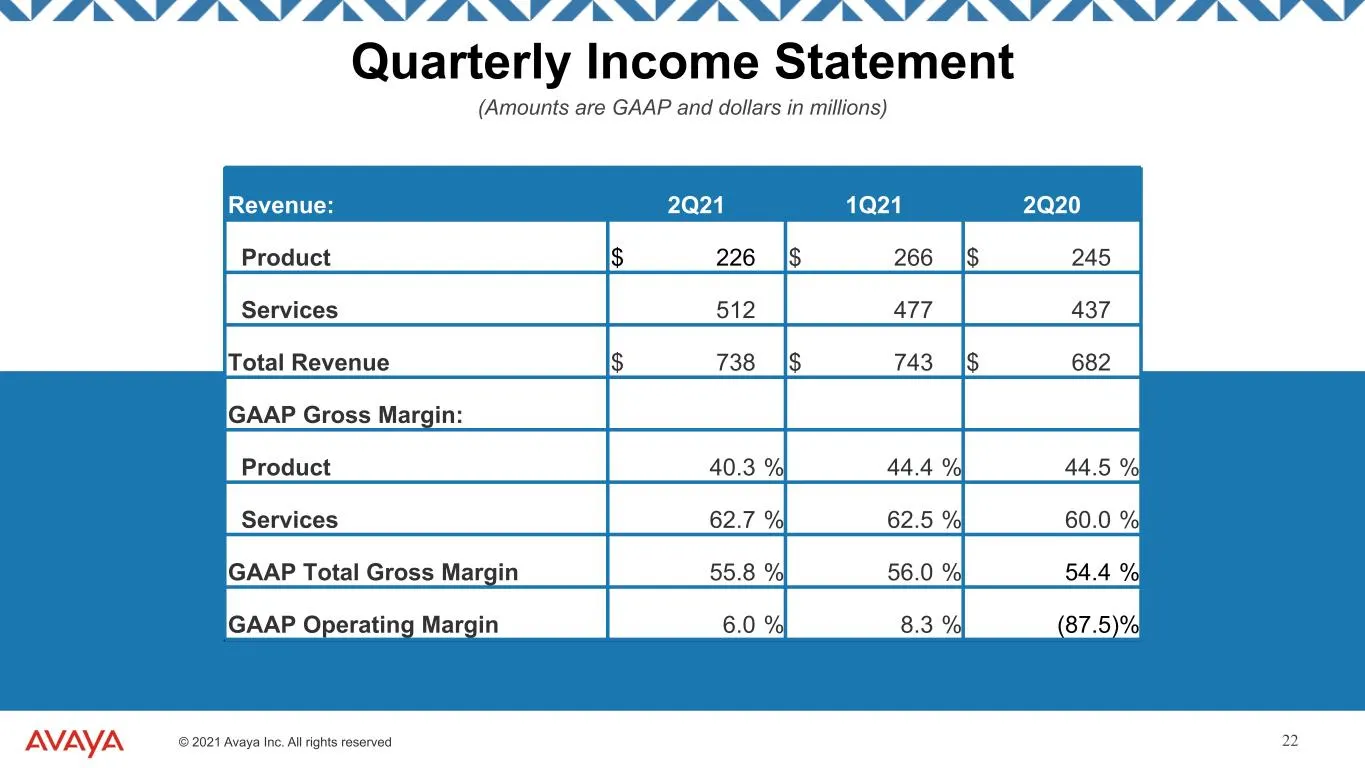
204-0-0 127-127-127 17-114-210 80-200-74 86-183-242 247-150-70 0 – 0 – 0 TEXT © 2021 Avaya Inc. All rights reserved 22 Revenue: 2Q21 1Q21 2Q20 Product $ 226 $ 266 $ 245 Services 512 477 437 Total Revenue $ 738 $ 743 $ 682 GAAP Gross Margin: Product 40.3 % 44.4 % 44.5 % Services 62.7 % 62.5 % 60.0 %
Slide 23: Uses of Cash
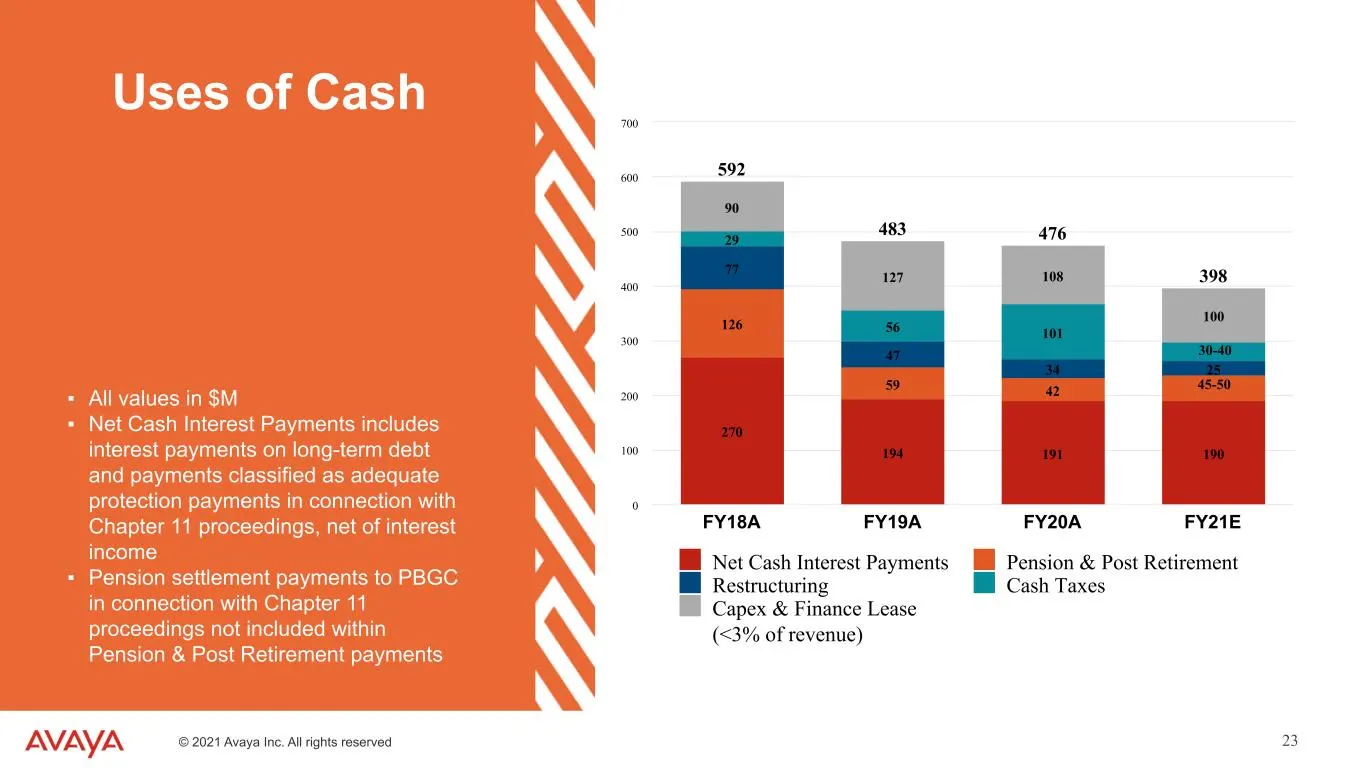
204-0-0 127-127-127 17-114-210 80-200-74 86-183-242 247-150-70 0 – 0 – 0 TEXT © 2021 Avaya Inc. All rights reserved 23 Uses of Cash 592 483 476 398 270 194 191 190 126 59 42 77 47 34 25 29 56 101 90 127 108 100 Net Cash Interest Payments Pension & Post Retirement Restructuring Cash Taxes Capex & Fin
Slide 24: Quarterly Non-GAAP Income Statement Information
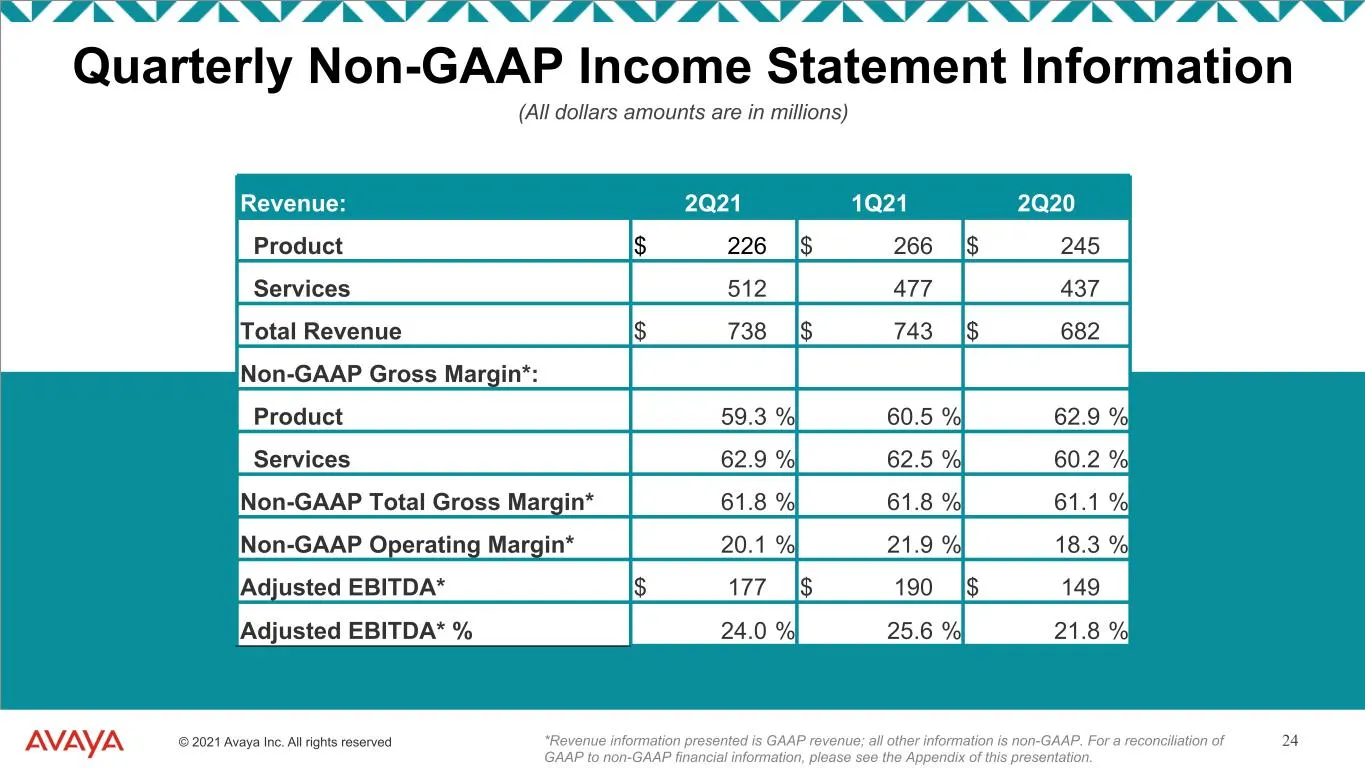
204-0-0 127-127-127 17-114-210 80-200-74 86-183-242 247-150-70 0 – 0 – 0 TEXT © 2021 Avaya Inc. All rights reserved 24 Revenue: 2Q21 1Q21 2Q20 Product $ 226 $ 266 $ 245 Services 512 477 437 Total Revenue $ 738 $ 743 $ 682 Non-GAAP Gross Margin*: Product 59.3 % 60.5 % 62.9 % Services 62.9 % 62.5 % 60
Slide 25: Quarterly Revenue by Region
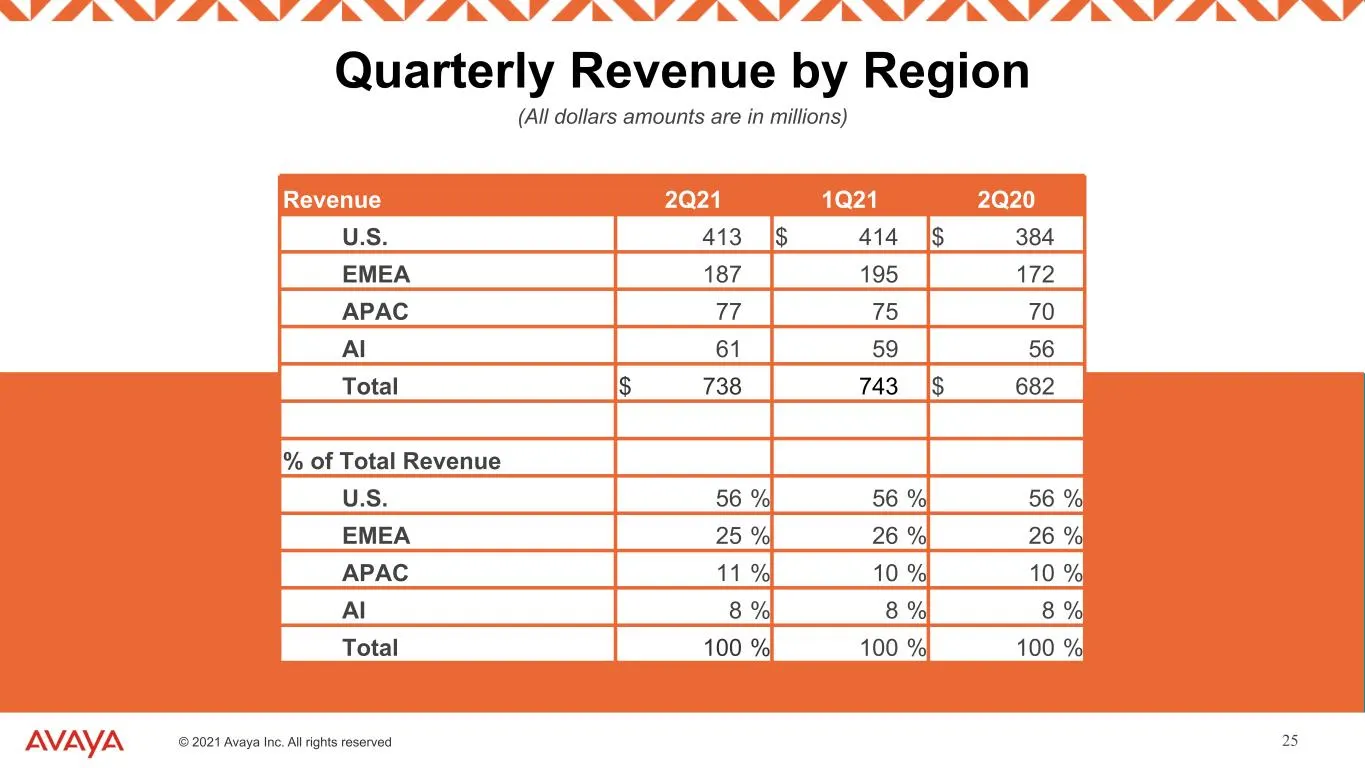
204-0-0 127-127-127 17-114-210 80-200-74 86-183-242 247-150-70 0 – 0 – 0 TEXT © 2021 Avaya Inc. All rights reserved 25 Quarterly Revenue by Region (All dollars amounts are in millions) Revenue 2Q21 1Q21 2Q20 U.S. 413 $ 414 $ 384 EMEA 187 195 172 APAC 77 75 70 AI 61 59 56 Total $ 738 743 $ 682 % of T
Slide 26: Balance Sheet and Operating Metrics
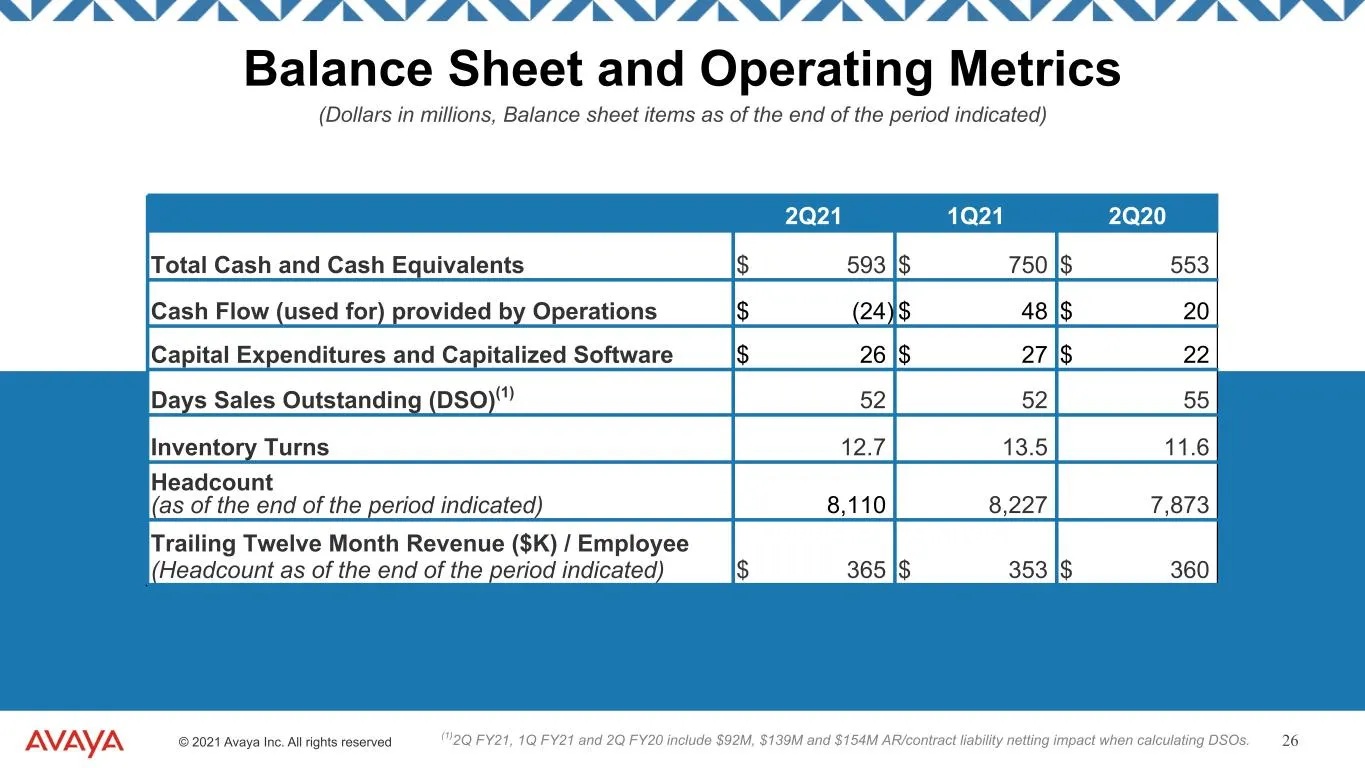
204-0-0 127-127-127 17-114-210 80-200-74 86-183-242 247-150-70 0 – 0 – 0 TEXT © 2021 Avaya Inc. All rights reserved 26 Balance Sheet and Operating Metrics (Dollars in millions, Balance sheet items as of the end of the period indicated) 2Q21 1Q21 2Q20 Total Cash and Cash Equivalents $ 593 $ 750 $ 553

Slide 27: Appendix
© 2021 Avaya Inc. All rights reserved Appendix
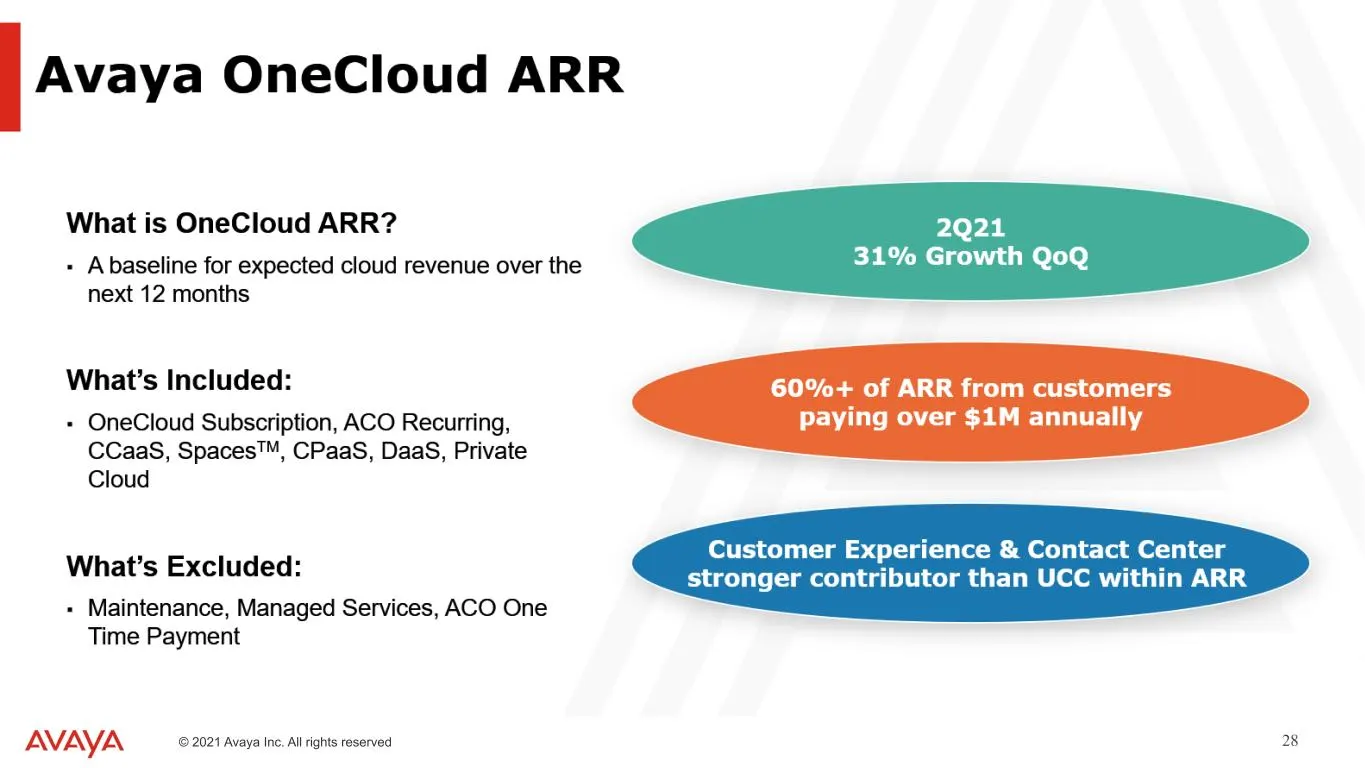
Slide 28: 204-0-0 127-127-127 17-114-210 80-200-74 86-183-242 247-150-70 0 – 0 – 0 TEXT © 2021 Avaya Inc. All rights reserved 28
204-0-0 127-127-127 17-114-210 80-200-74 86-183-242 247-150-70 0 – 0 – 0 TEXT © 2021 Avaya Inc. All rights reserved 28
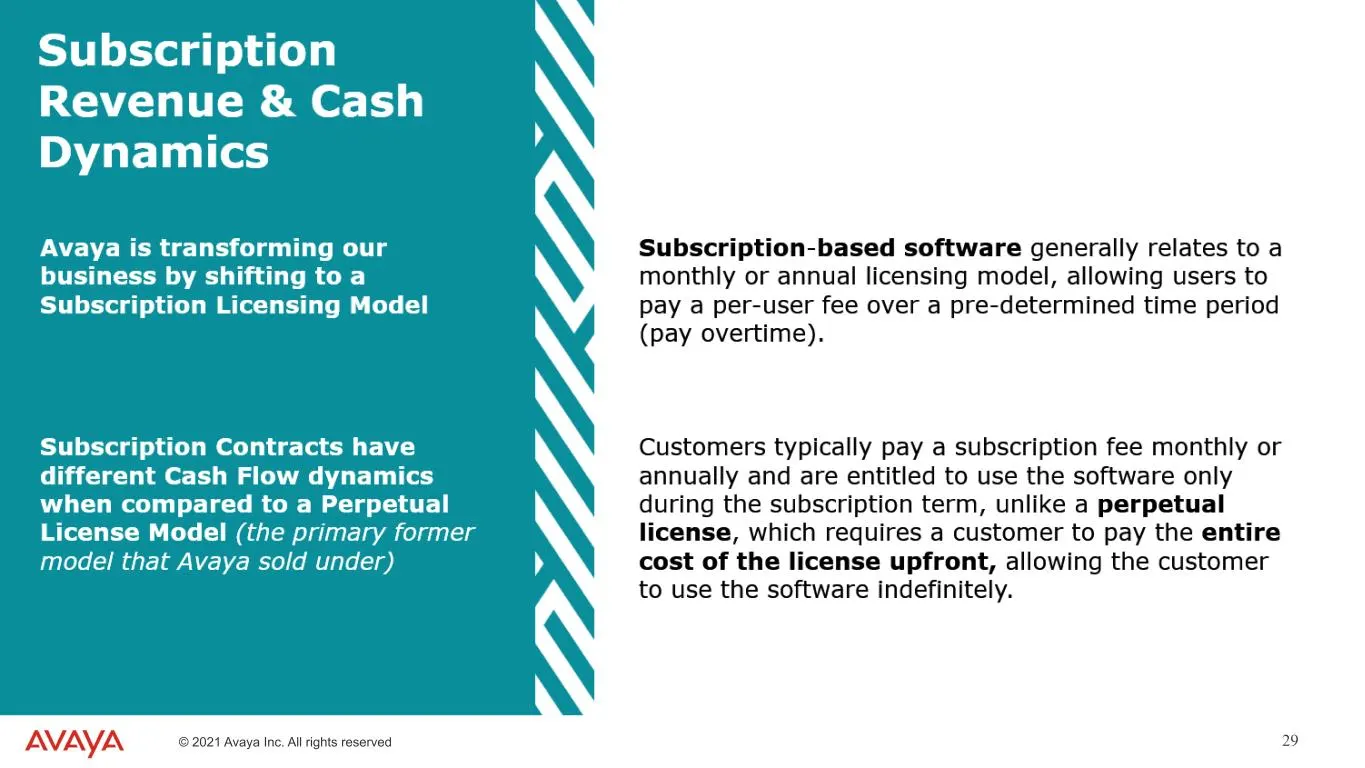
Slide 29: Subscription Revenue & Cash Dynamics
204-0-0 127-127-127 17-114-210 80-200-74 86-183-242 247-150-70 0 – 0 – 0 TEXT © 2021 Avaya Inc. All rights reserved 29 Subscription Revenue & Cash Dynamics
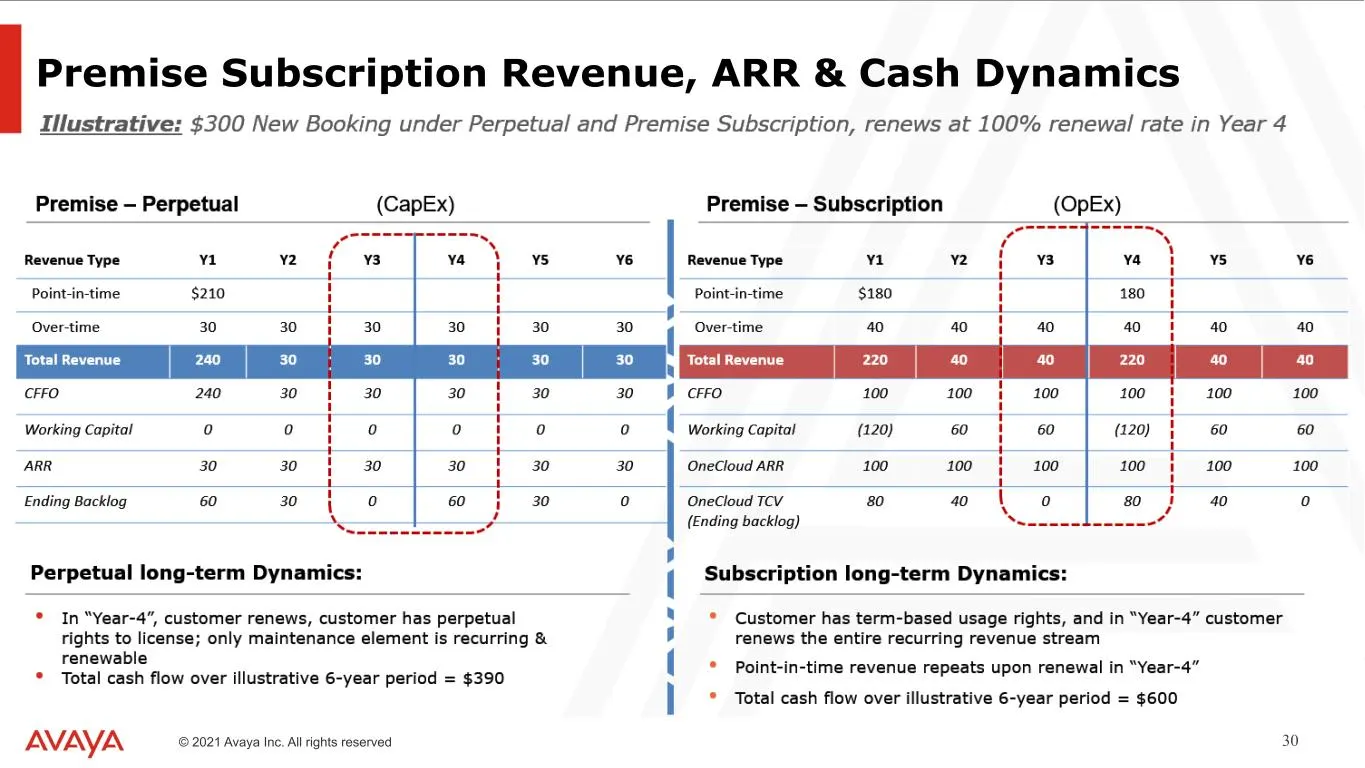
Slide 30: Premise Subscription Revenue, ARR & Cash Dynamics
204-0-0 127-127-127 17-114-210 80-200-74 86-183-242 247-150-70 0 – 0 – 0 TEXT © 2021 Avaya Inc. All rights reserved 30 Premise Subscription Revenue, ARR & Cash Dynamics
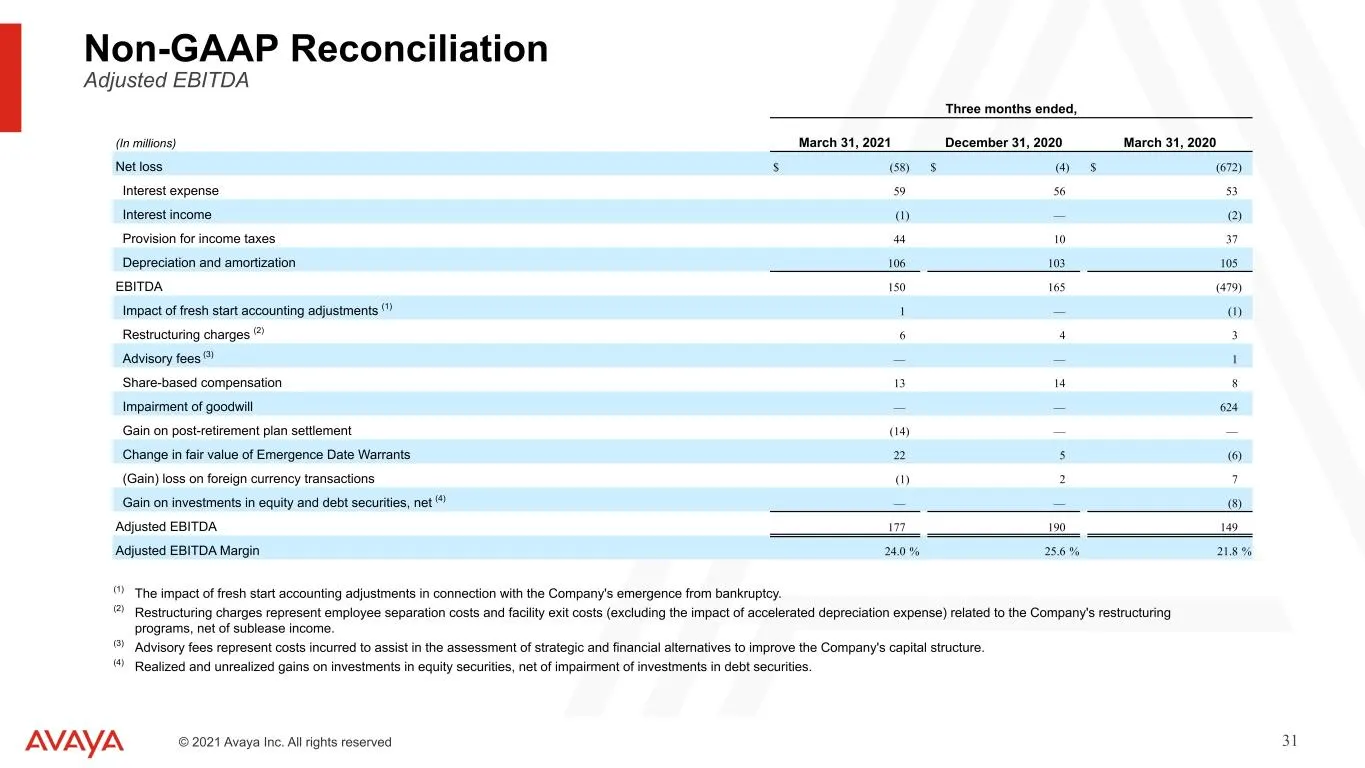
Slide 31: Non-GAAP Reconciliation Adjusted EBITDA
204-0-0 127-127-127 17-114-210 80-200-74 86-183-242 247-150-70 0 – 0 – 0 TEXT © 2021 Avaya Inc. All rights reserved 31 Three months ended, (In millions) March 31, 2021 December 31, 2020 March 31, 2020 Net loss $ (58) $ (4) $ (672) Interest expense 59 56 53 Interest income (1) — (2) Provision for inc
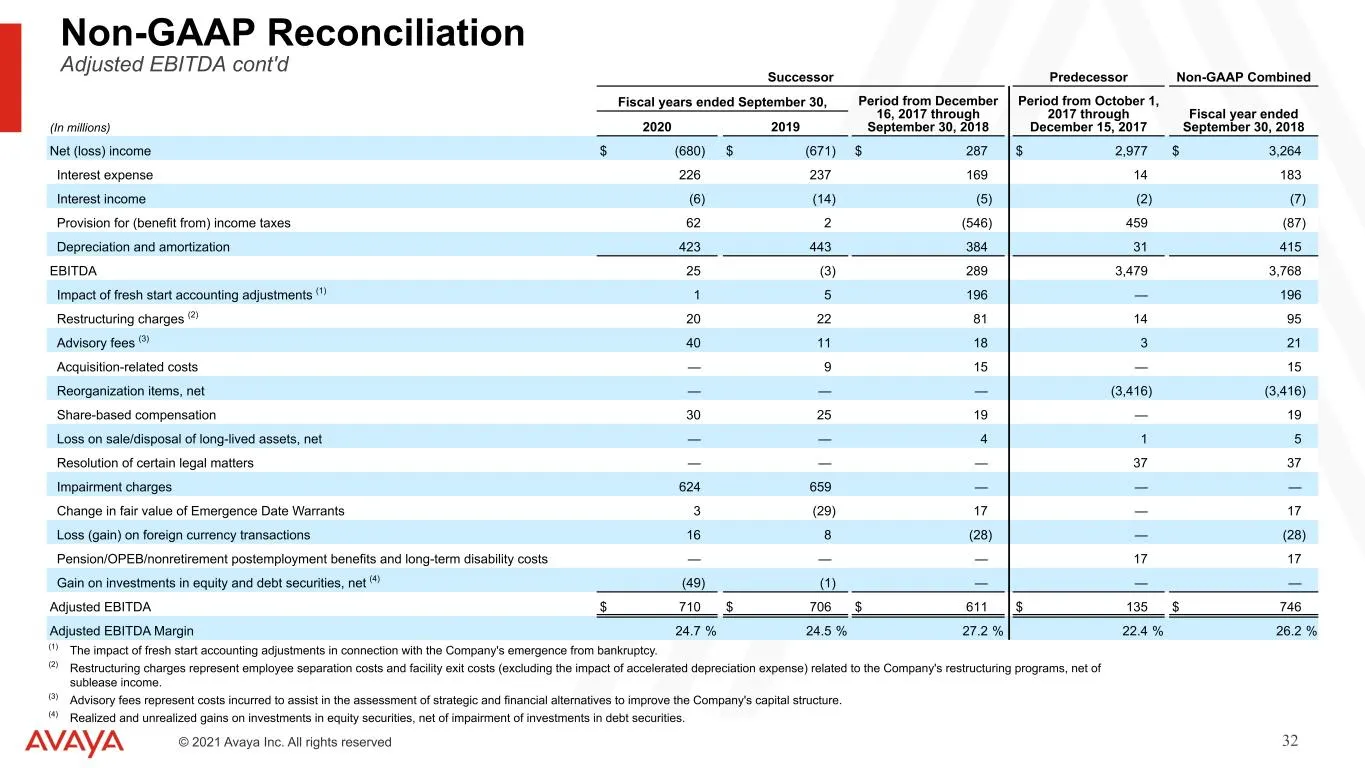
Slide 32: Non-GAAP Reconciliation Adjusted EBITDA (Fiscal Years)
204-0-0 127-127-127 17-114-210 80-200-74 86-183-242 247-150-70 0 – 0 – 0 TEXT © 2021 Avaya Inc. All rights reserved 32 Successor Predecessor Non-GAAP Combined Fiscal years ended September 30, Period from December 16, 2017 through September 30, 2018 Period from October 1, 2017 through December 15, 20
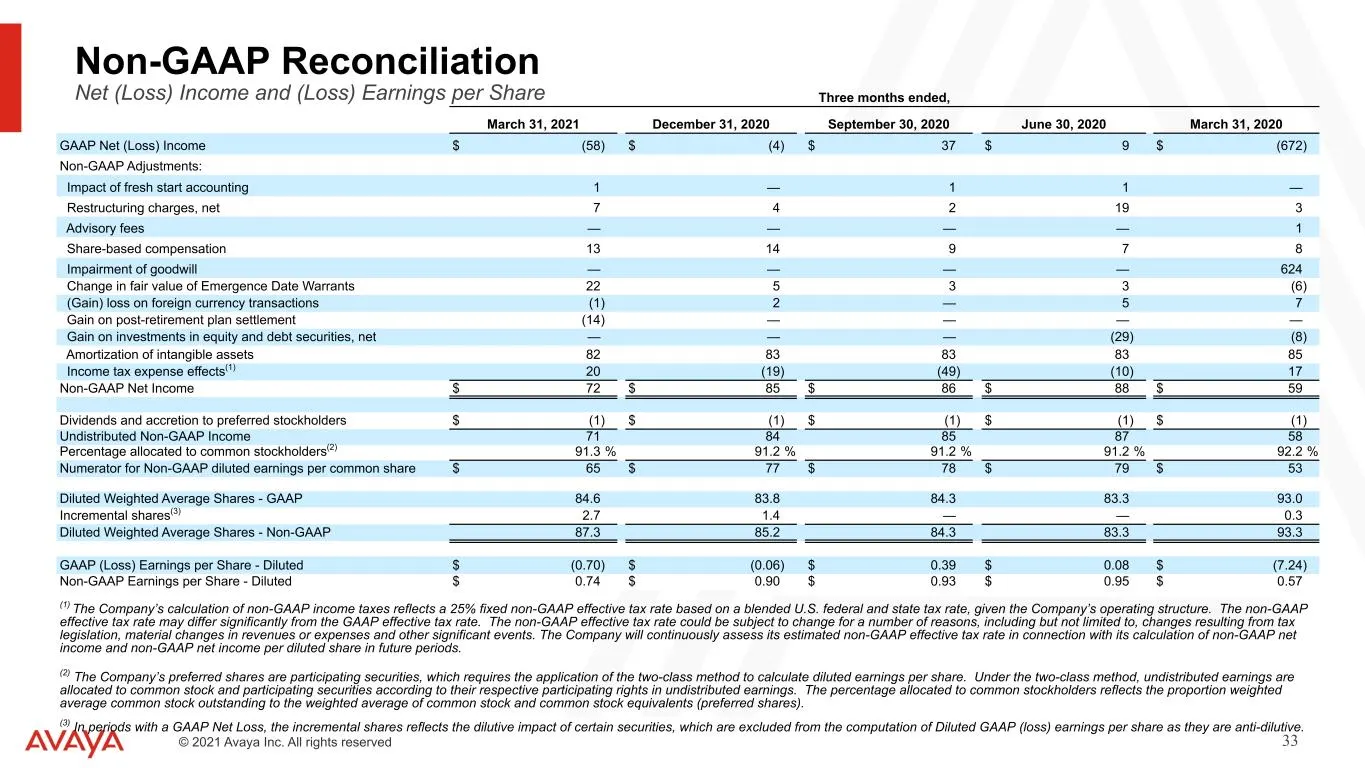
Slide 33: Non-GAAP Reconciliation Net (Loss) Income and EPS
204-0-0 127-127-127 17-114-210 80-200-74 86-183-242 247-150-70 0 – 0 – 0 TEXT © 2021 Avaya Inc. All rights reserved 33 Non-GAAP Reconciliation Net (Loss) Income and (Loss) Earnings per Share Three months ended, March 31, 2021 December 31, 2020 September 30, 2020 June 30, 2020 March 31, 2020 GAAP Net
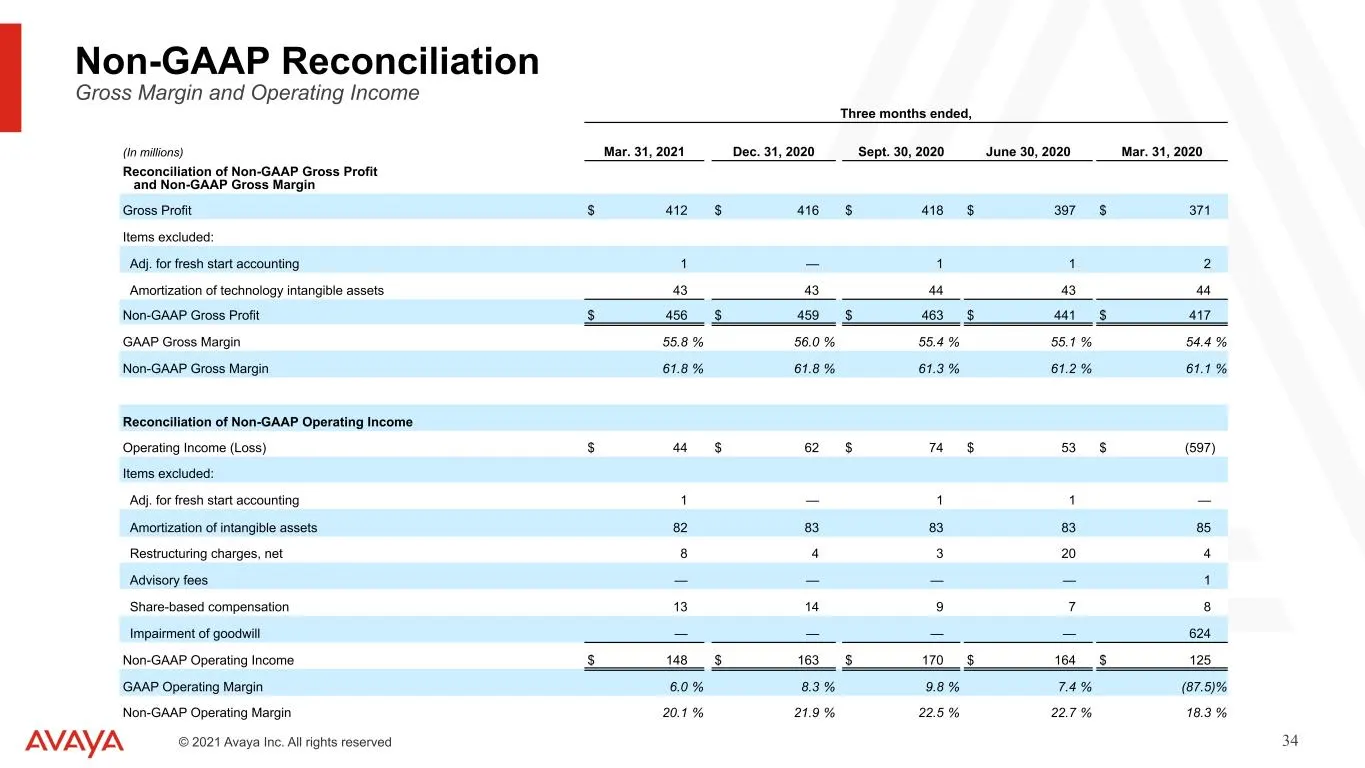
Slide 34: Non-GAAP Reconciliation Gross Margin and Operating Income
204-0-0 127-127-127 17-114-210 80-200-74 86-183-242 247-150-70 0 – 0 – 0 TEXT © 2021 Avaya Inc. All rights reserved 34 Non-GAAP Reconciliation Gross Margin and Operating Income Three months ended, (In millions) Mar. 31, 2021 Dec. 31, 2020 Sept. 30, 2020 June 30, 2020 Mar. 31, 2020 Reconciliation of
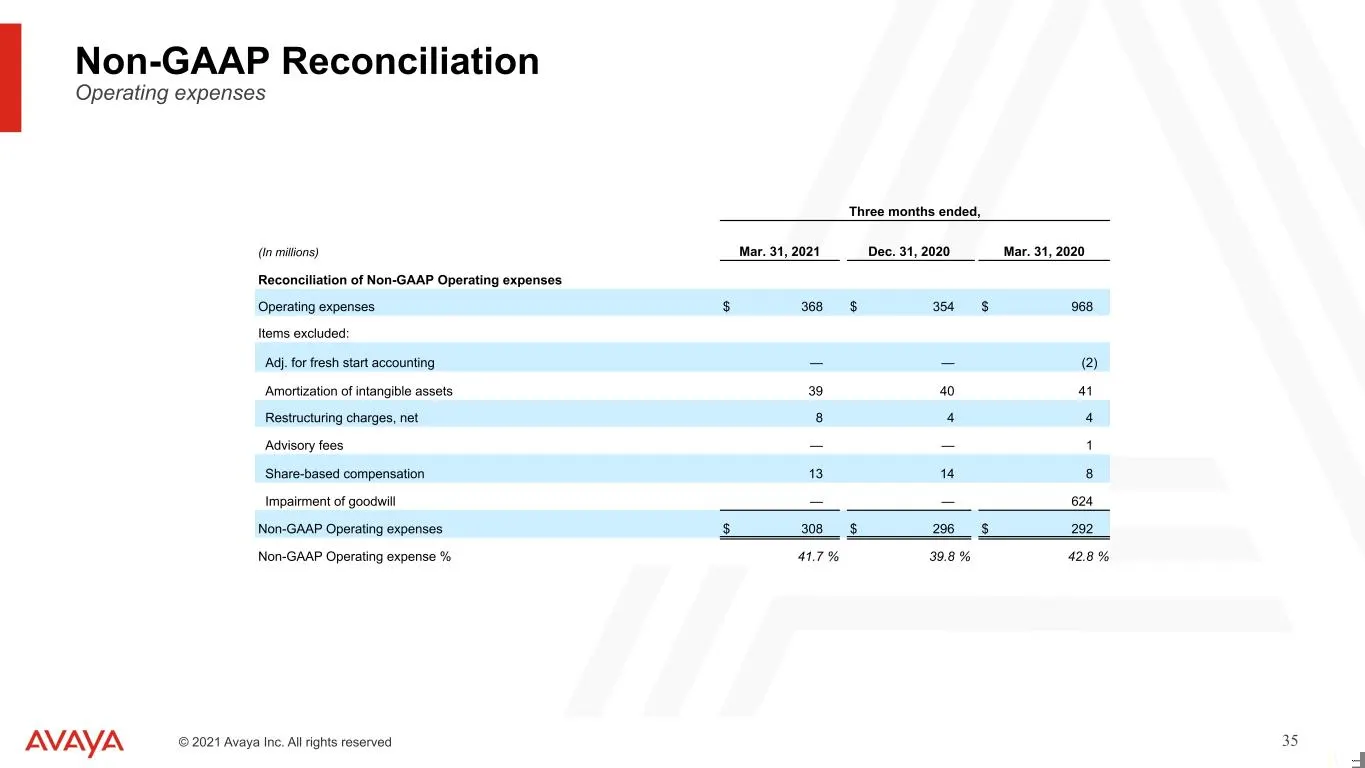
Slide 35: Non-GAAP Reconciliation Operating expenses
204-0-0 127-127-127 17-114-210 80-200-74 86-183-242 247-150-70 0 – 0 – 0 TEXT © 2021 Avaya Inc. All rights reserved 35 Non-GAAP Reconciliation Operating expenses Three months ended, (In millions) Mar. 31, 2021 Dec. 31, 2020 Mar. 31, 2020 Reconciliation of Non-GAAP Operating expenses Operating expens
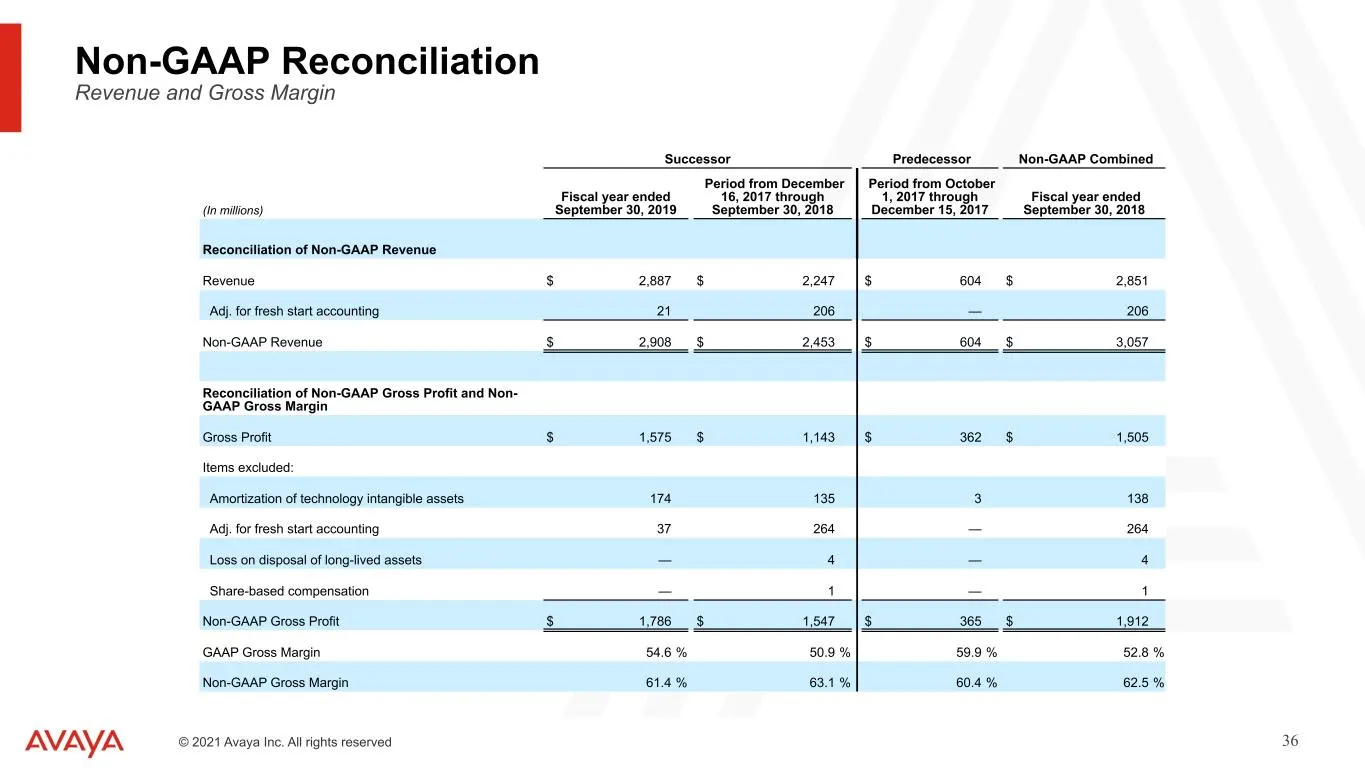
Slide 36: Non-GAAP Reconciliation Revenue and Gross Margin
204-0-0 127-127-127 17-114-210 80-200-74 86-183-242 247-150-70 0 – 0 – 0 TEXT © 2021 Avaya Inc. All rights reserved 36 Non-GAAP Reconciliation Revenue and Gross Margin Successor Predecessor Non-GAAP Combined Fiscal year ended September 30, 2019 Period from December 16, 2017 through September 30, 201
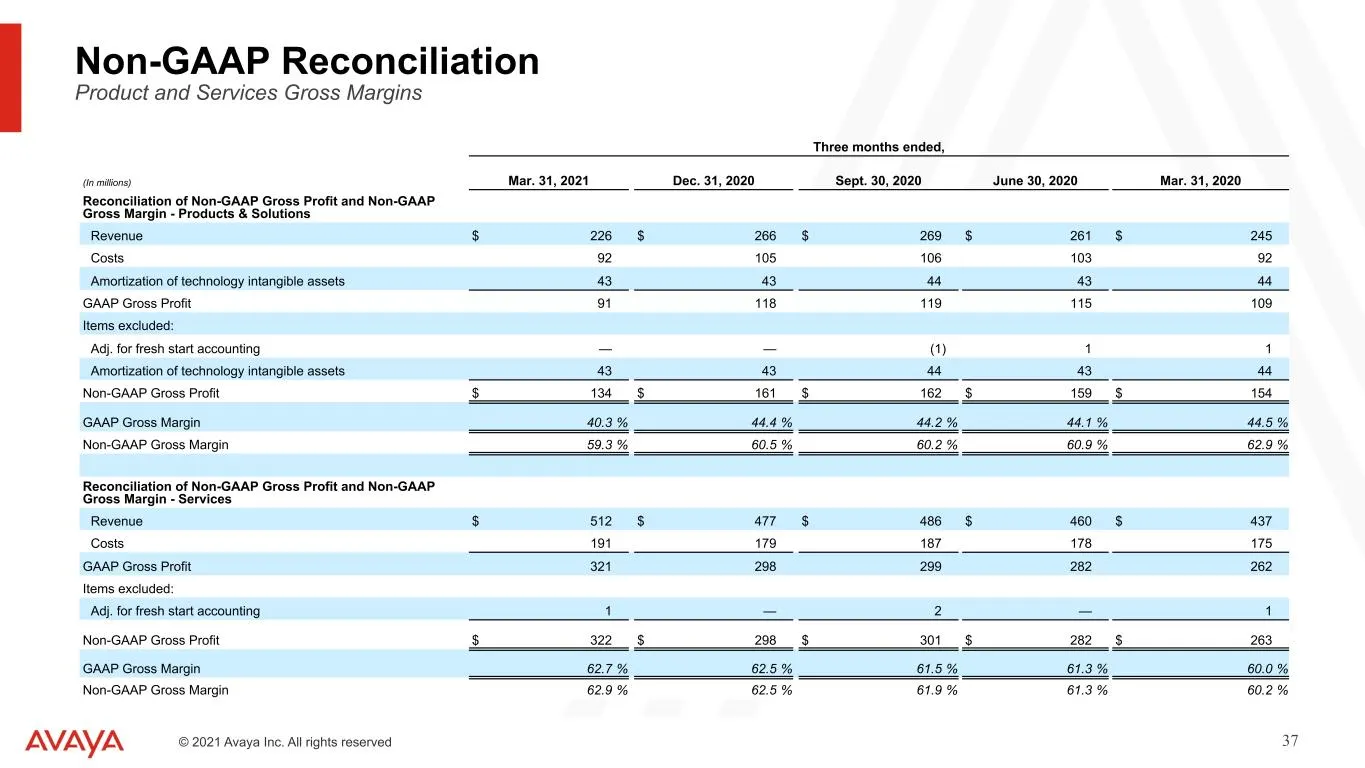
Slide 37: Non-GAAP Reconciliation Product and Services Gross Margins
204-0-0 127-127-127 17-114-210 80-200-74 86-183-242 247-150-70 0 – 0 – 0 TEXT © 2021 Avaya Inc. All rights reserved 37 Non-GAAP Reconciliation Product and Services Gross Margins Three months ended, (In millions) Mar. 31, 2021 Dec. 31, 2020 Sept. 30, 2020 June 30, 2020 Mar. 31, 2020 Reconciliation of
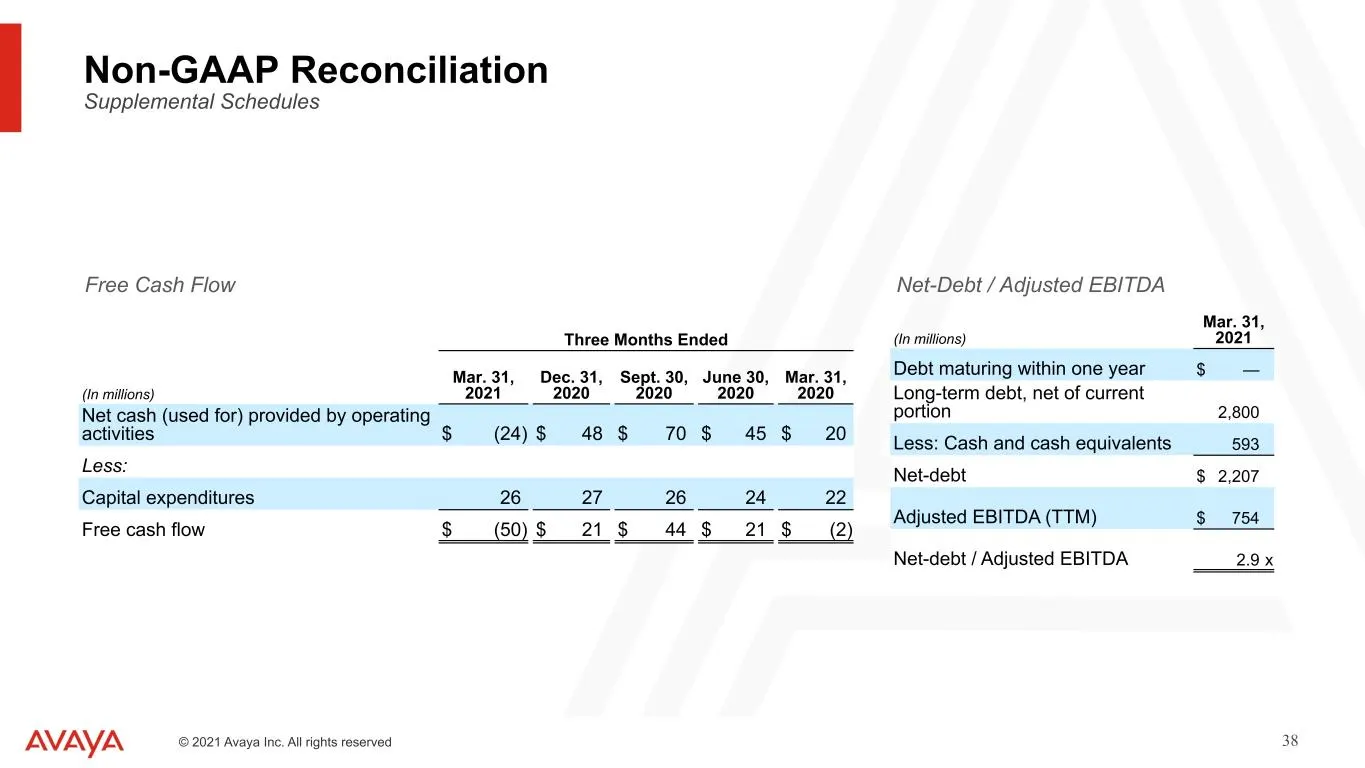
Slide 38: Free Cash Flow and Net-Debt / Adjusted EBITDA
204-0-0 127-127-127 17-114-210 80-200-74 86-183-242 247-150-70 0 – 0 – 0 TEXT © 2021 Avaya Inc. All rights reserved 38 Three Months Ended (In millions) Mar. 31, 2021 Dec. 31, 2020 Sept. 30, 2020 June 30, 2020 Mar. 31, 2020 Net cash (used for) provided by operating activities $ (24) $ 48 $ 70 $ 45 $
Source: SEC EDGAR · 8-K filed May 6, 2021
More decks from Avaya Inc
 Corporate Update (February 2023)11 slides · Feb 14, 2023
 Q3 FY2022 Earnings Presentation26 slides · Aug 9, 2022
 Q2 FY2022 Earnings Presentation36 slides · May 10, 2022
 Q1 FY2022 Earnings Presentation36 slides · Feb 9, 2022
 Investor Day (December 2021)103 slides · December 2021
 Q4 2021 Earnings Presentation38 slides · Nov 22, 2021