AGL Resources — American Gas Association Financial Forum 2006
19 slides from AGL Resources's conference presentation, May 8, 2006
Slide 1: American Gas Association Financial Forum
NYSE: ATG www.aglresources.com American Gas Association Financial Forum Scottsdale, Arizona May 2006

Slide 2: Important Note to Investors: Forward-Looking Statements
Important Note to Investors: Forward-Looking Statements Statements in this presentation that are not historical facts, including statements regarding our estimates, beliefs, expectations, intentions, strategies or projections, may be “forward-looking statements” as defined in the Private Securities

Slide 3: Important Note to Investors: Non-GAAP Measures
Important Note to Investors: Non-GAAP Measures Company management evaluates segment financial performance based on earnings before interest and taxes (EBIT), which includes the effects of corporate expense allocations. EBIT is a non-GAAP (accounting principles generally accepted in the <?xml:namespa
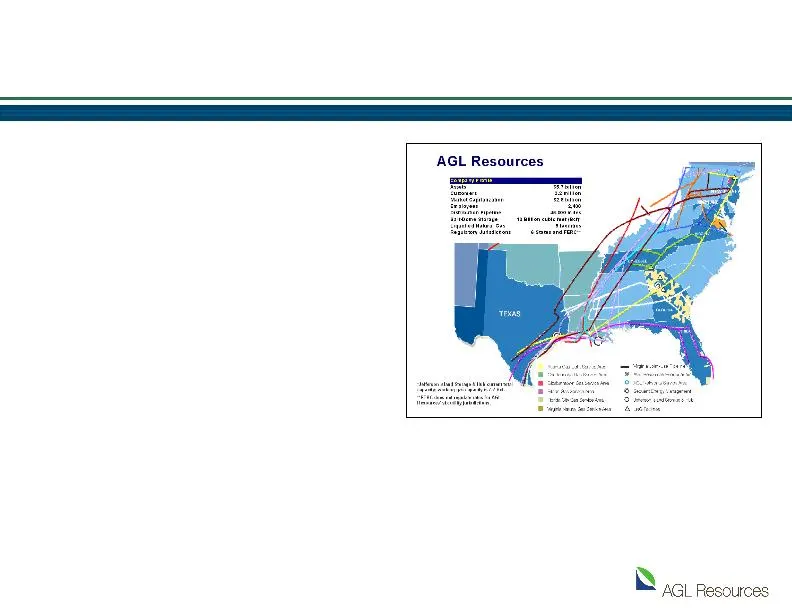
Slide 4: AGL Resources footprint and assets
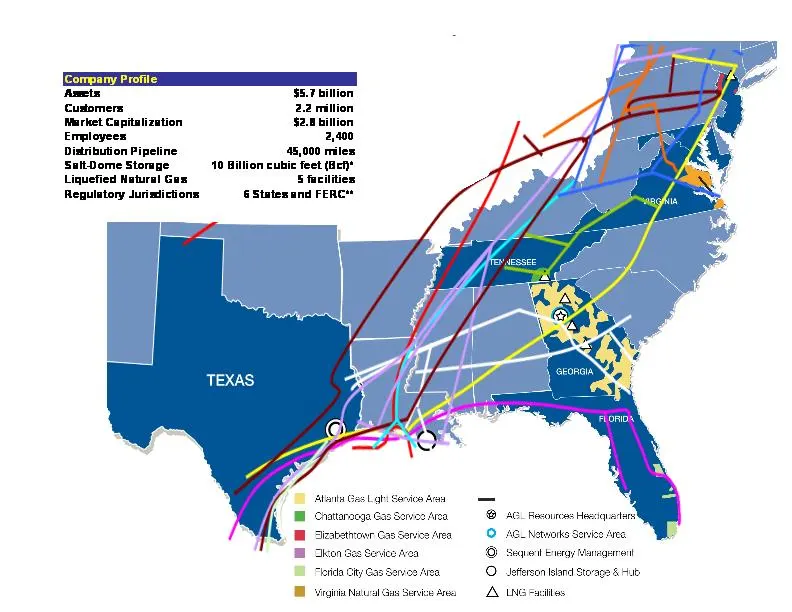
MARYLAND NEW JERSEY Virginia Joint-Use Pipeline AGL Resources *Jefferson Island Storage & Hub current total capacity; working gas capacity is 7.2 Bcf. **FERC does not regulate rates for AGL Resources’ six utility jurisdictions.
Slide 5: Strong Base of Regulated Earnings and Assets
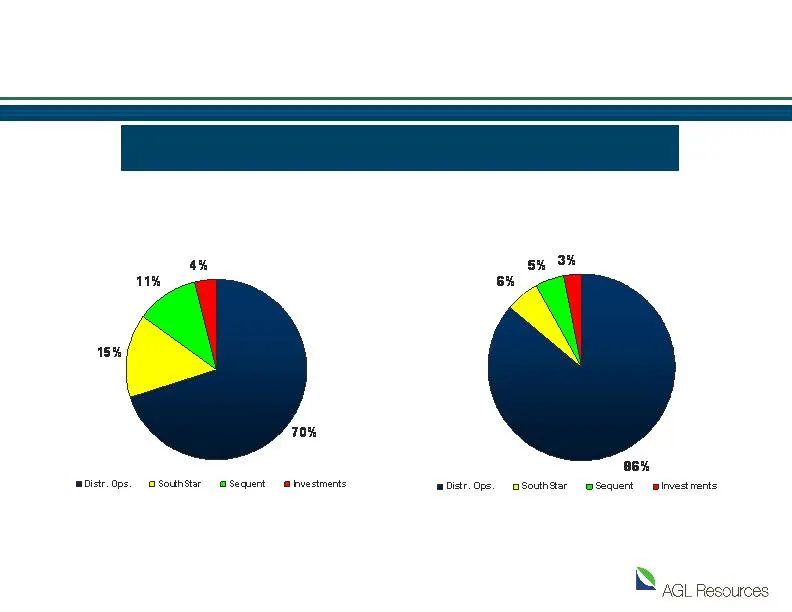
If SouthStar is considered part of the regulated business, 85% of earnings, and more than 90% of assets, are in regulated operations EBIT Assets* *As of December 31, 2005. Strong Base of Regulated Earnings and Assets
Slide 6: Consistent Track Record of Growing Earnings
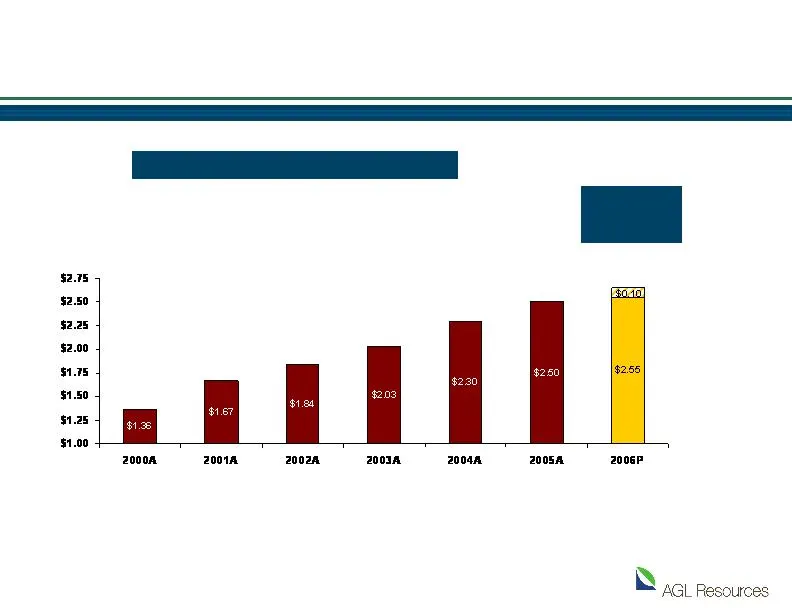
2006 Guidance: $2.55 - $2.65 CAGR EPS 2000-2005: 12.3% – EPS (Calendar Year) Consistent Track Record of Growing Earnings
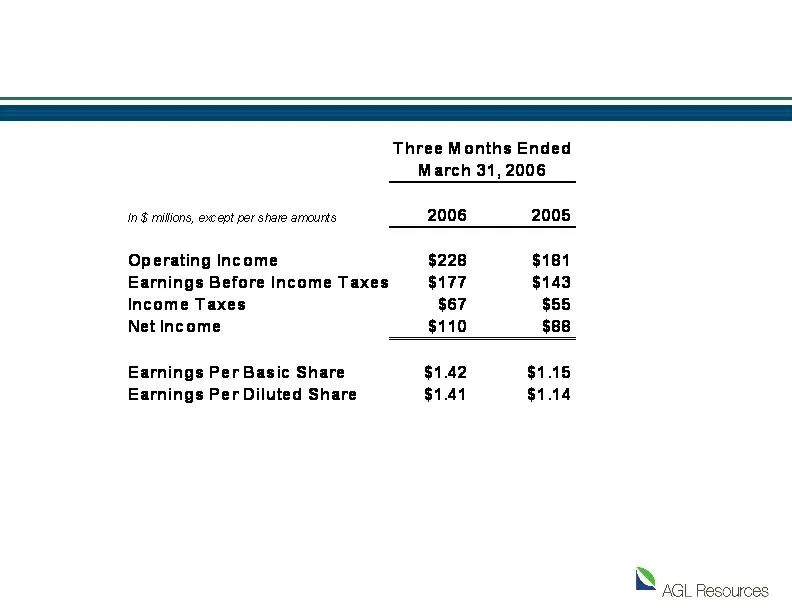
Slide 7: Strong 1Q 2006 Performance
• 25% net income increase • 1-million share increase in weighted average basic shares outstanding • Increase driven by strong contributions from Wholesale Services and Retail Energy Operations segments Strong 1Q 2006 Performance
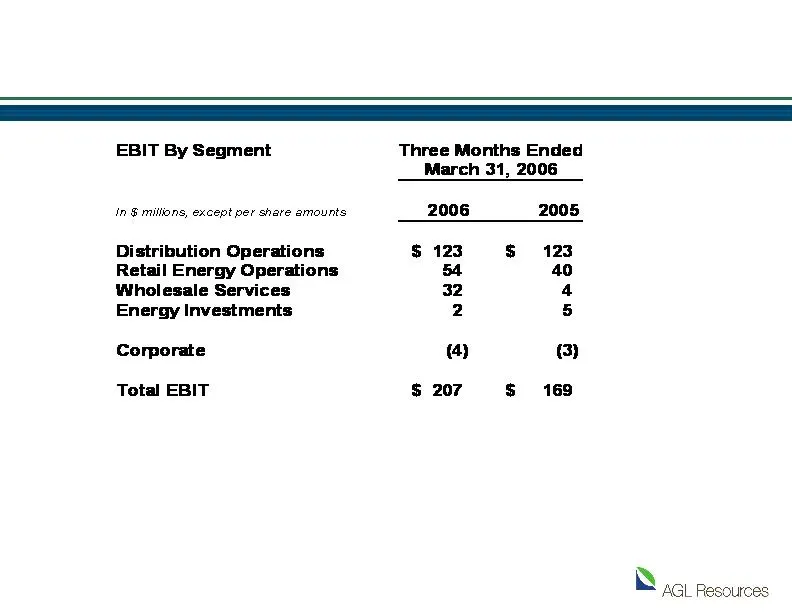
Slide 8: 1Q Earnings Contribution By Segment
• Distribution Operations – lower expenses helped offset impacts of bad debt and conservation (O&M per customer declined 10%) • Retail Energy Operations – strong asset management results • Wholesale Services – significant margin-capture opportunities in volatile market Note: EBIT is a non-GAAP measu
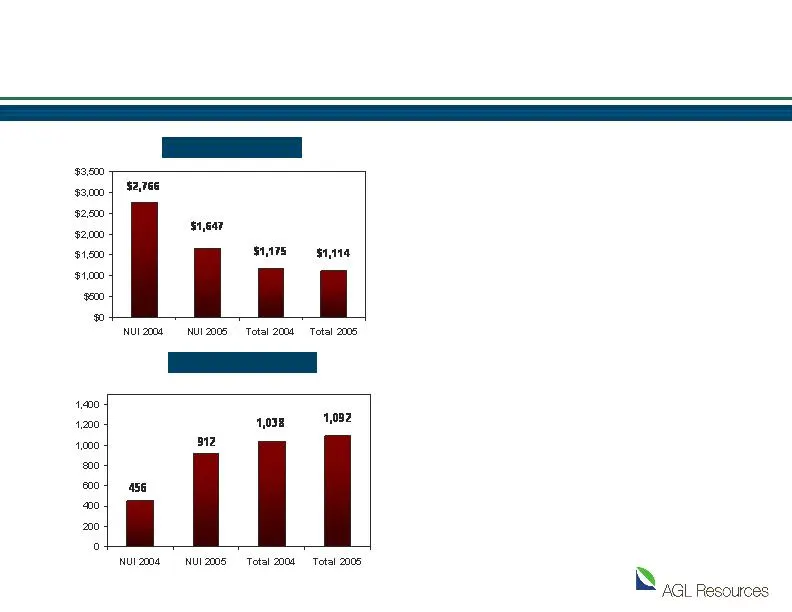
Slide 9: Track Record of Business Process Improvement and Integration Success
Net Cost Per New Meter Customers Per Employee NUI Acquisition Results • Accretive to earnings within 9 months • Consolidated all primary corporate (HR, finance/accounting, etc.) and operational functions (call center, dispatch, etc.) • Divested appliance businesses in New Jersey and Florida • Sold S

Slide 10: Continued Regulatory Stability
Atlanta Gas Light Company Virginia Natural Gas Elizabethtown Gas Company Florida City Gas Chattanooga Gas Company Elkton Gas Most Recent Decision 04/29/05 10/25/96 11/22/02 02/19/04 10/01/04 06/04/92 Authorized ROE 10.9% 10.9% 10% 11.25% 10.20% 12.5% PBR years Proposed PBR years Traditional Traditio
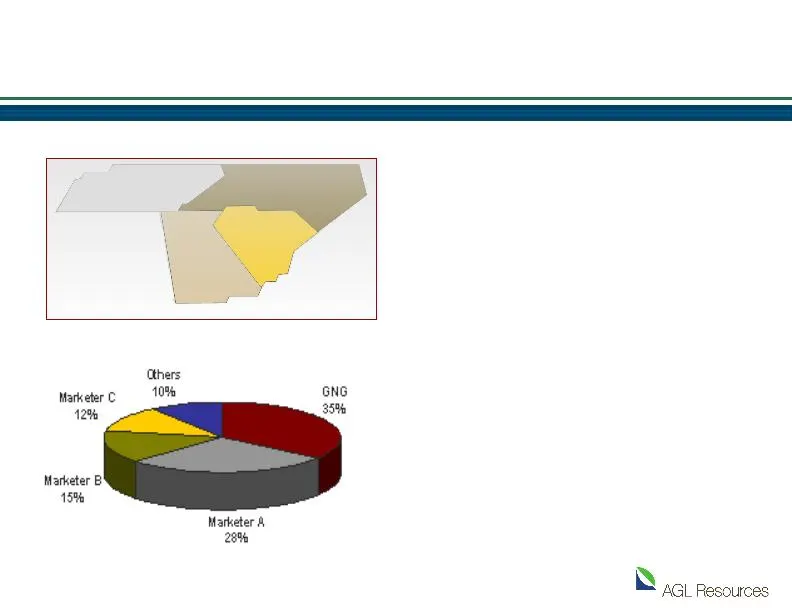
Slide 11: SouthStar Energy Services
• One of the largest deregulated retail natural gas companies in the U.S., with a strong portfolio of pipeline and storage assets in the Southeast • Serves more than one-half million (536,000) residential, commercial and industrial customers • Largest Georgia marketer with 35% market share • Consist
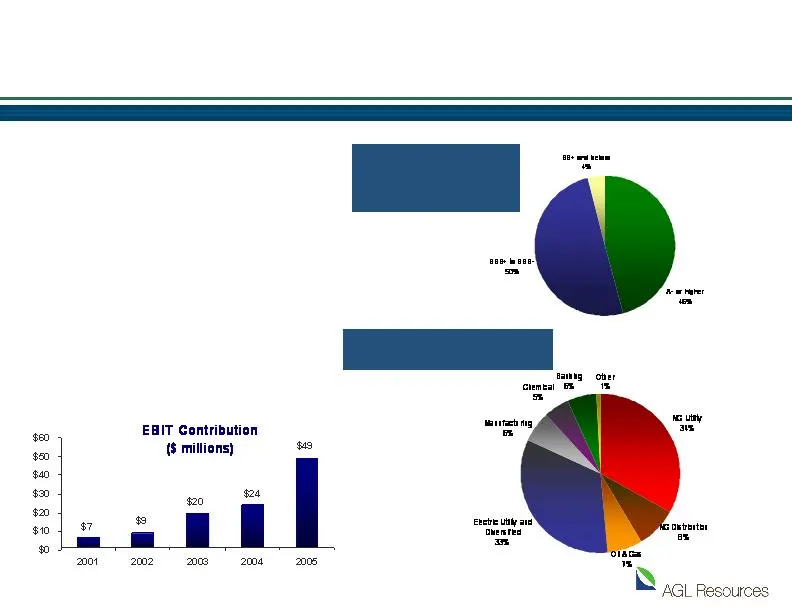
Slide 12: Sequent Energy Management
Counterparty Credit Ratings As a Percent of Credit Exposure Credit Exposure by Counterparty Type Business Focus • Asset Management/Origination • Trading/Marketing • Producer Services Market Focus • Primary markets include the Southeast, Mid-West, Mid-Atlantic and Northeast regions Key Characteristic
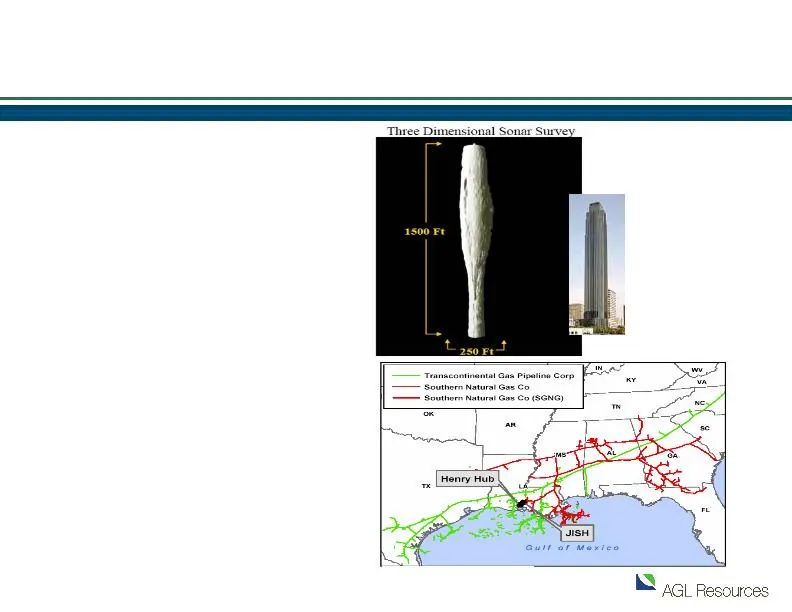
Slide 13: Jefferson Island Expansion on Track
Jefferson Island Expansion on Track Jefferson Island Storage & Hub (JISH) • Acquired October • Salt-cavern storage facility 10 miles NE of Henry Hub • Working gas capacity of 7.2 MMDth • Accretive to earnings immediately • Fully subscribed – diverse portfolio • Expanding to 19.2 MMDth through constr
Slide 14: Where Are the Growth Opportunities?
Where Are the Growth Opportunities? • Medium- to large-scale urban LDC franchises – Scalable operations (customer density) – Significant operational improvement opportunities – Regulatory bias is toward under-earning companies – Reasonable regulatory environment – Geographic fit • Peaking/storage in
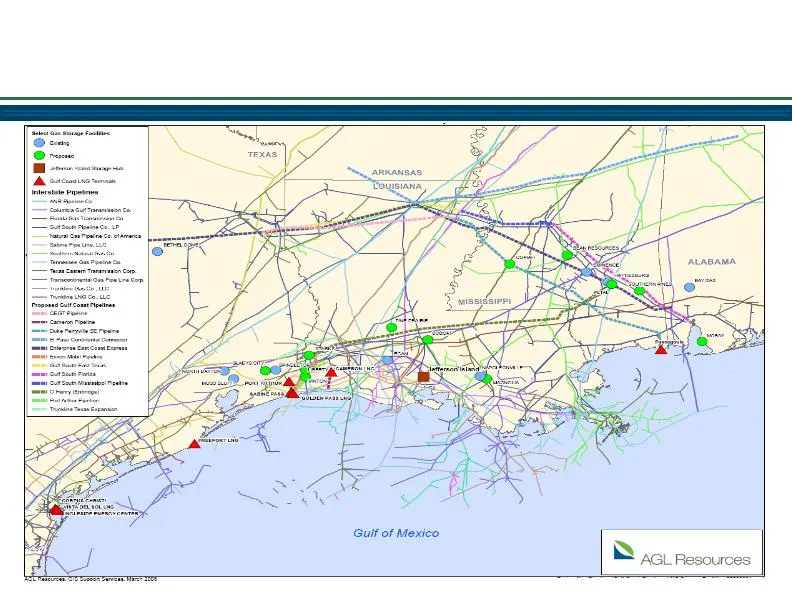
Slide 15: Gulf Coast Infrastructure Opportunities
Gulf Coast Infrastructure Opportunities
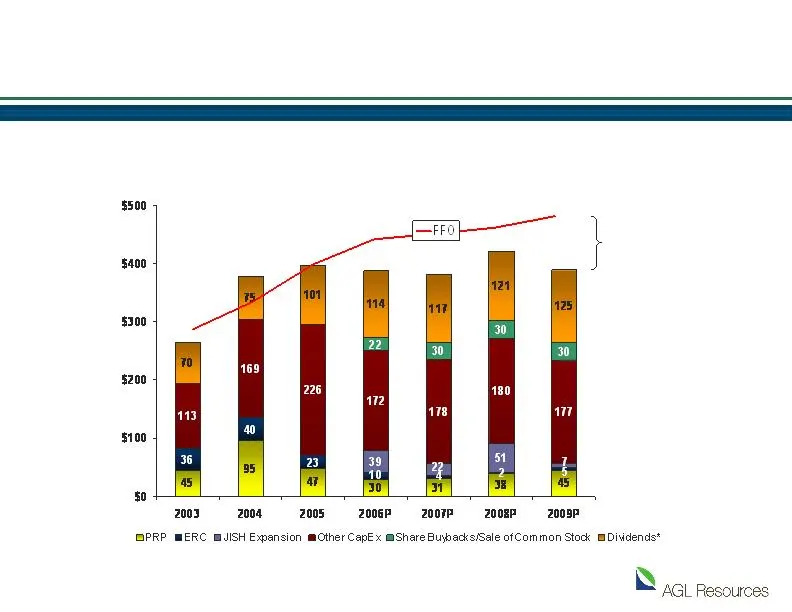
Slide 16: Significant Future Cash Flow Generation
Excess cash available for growth, dividend increases or debt pay-down 2005-2009P FFO CAGR = 4.6% *Assumes $0.04 dividend increase 2007-2009 ($MM) Significant Future Cash Flow Generation
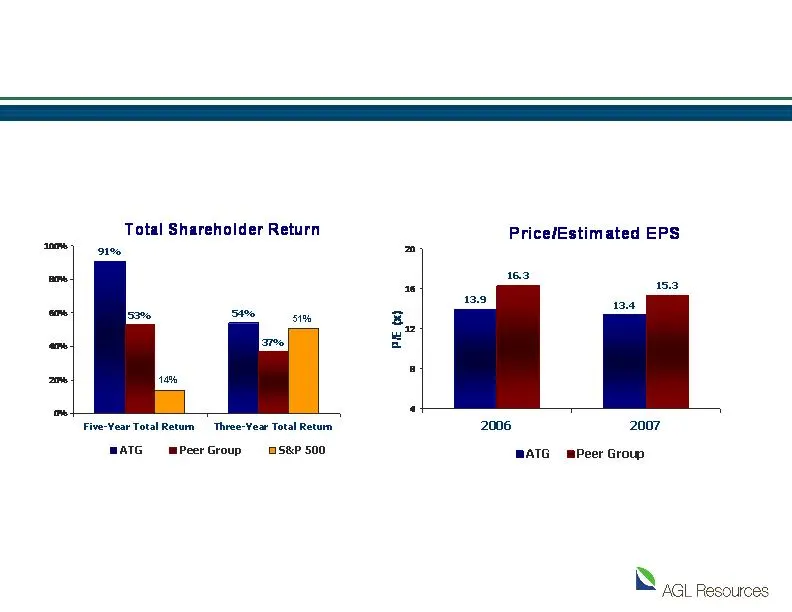
Slide 17: Strong Performance … Still Undervalued
Source: Thomson Financial and Bloomberg; P/E data as of May 5, 2006; total return data as of April 30, 2006. Strong Performance … Still Undervalued

Slide 18: AGL Resources in 2006
AGL Resources in 2006 • Low-risk platform provides strong foundation for growth • Track record of performance through superior execution • Constructive regulatory and legislative environments • Solid, stable and sustainable earnings growth • Future earnings and cash flow visibility • Value-oriented
Slide 19: AGL Resources
IN AGL Resources
Source: SEC EDGAR · 8-K filed May 8, 2006
More decks from AGL Resources Inc
 Merger or Acquisition (August 2015)12 slides · Aug 24, 2015
 Investor Day (March 2015)89 slides · Mar 25, 2015
 Q4 2014 Earnings Presentation26 slides · Feb 12, 2015
 Q3 2014 Earnings Presentation24 slides · Nov 10, 2014
 Q2 2014 Earnings Presentation19 slides · Jul 30, 2014
 Q1 2014 Earnings Presentation19 slides · Apr 29, 2014