Carrols Restaurant — Investor Presentation (September 2023)
19 slides from Carrols Restaurant's investor presentation, Sep 14, 2023
Slide 1: Carrols Restaurant Group Overview, September 2023
CARROLS RESTAURANT GROUP, INC. (NASDAQ: TAST) September 2023 Overview Exhibit 99.1
Slide 2: Safe Harbor Statement
Source: Carrols Restaurant Group, Inc. Safe Harbor Statement 2 Under the Private Securities Litigation Reform Act of 1995 • Our presentation includes, and our response to various questions may include, forward-looking statements. Statements that are predictive in nature or that depend upon or refer
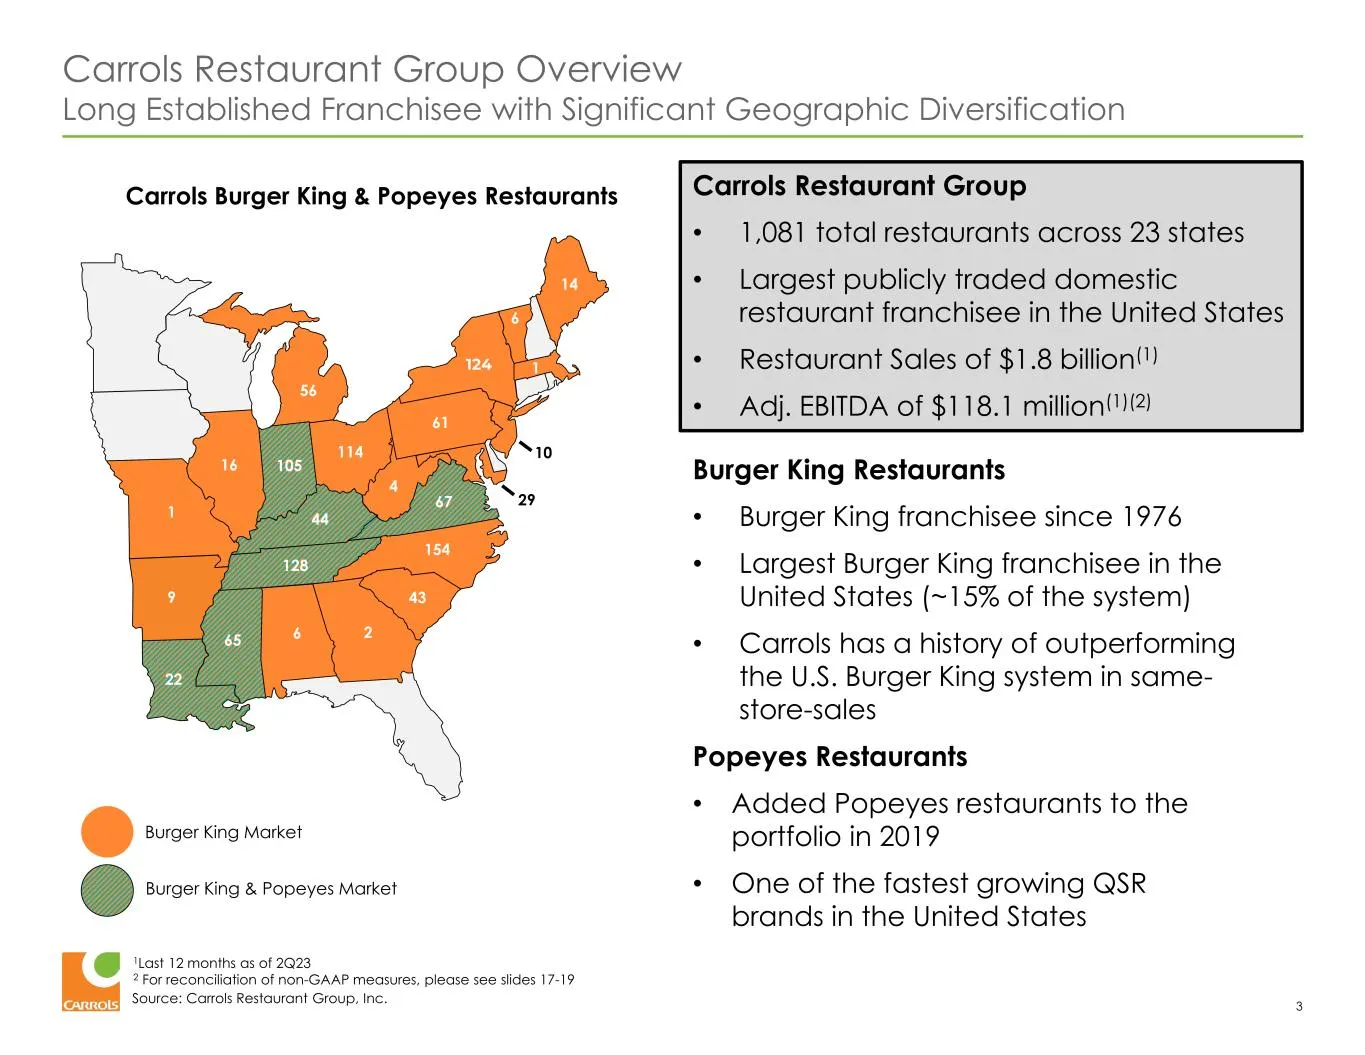
Slide 3: Carrols Restaurant Group Overview
Source: Carrols Restaurant Group, Inc. Carrols Restaurant Group Overview Long Established Franchisee with Significant Geographic Diversification 3 1Last 12 months as of 2Q23 2 For reconciliation of non-GAAP measures, please see slides 17-19 Burger King Market Burger King & Popeyes Market 154 124 114
Slide 4: Diversified Burger King Restaurant Portfolio
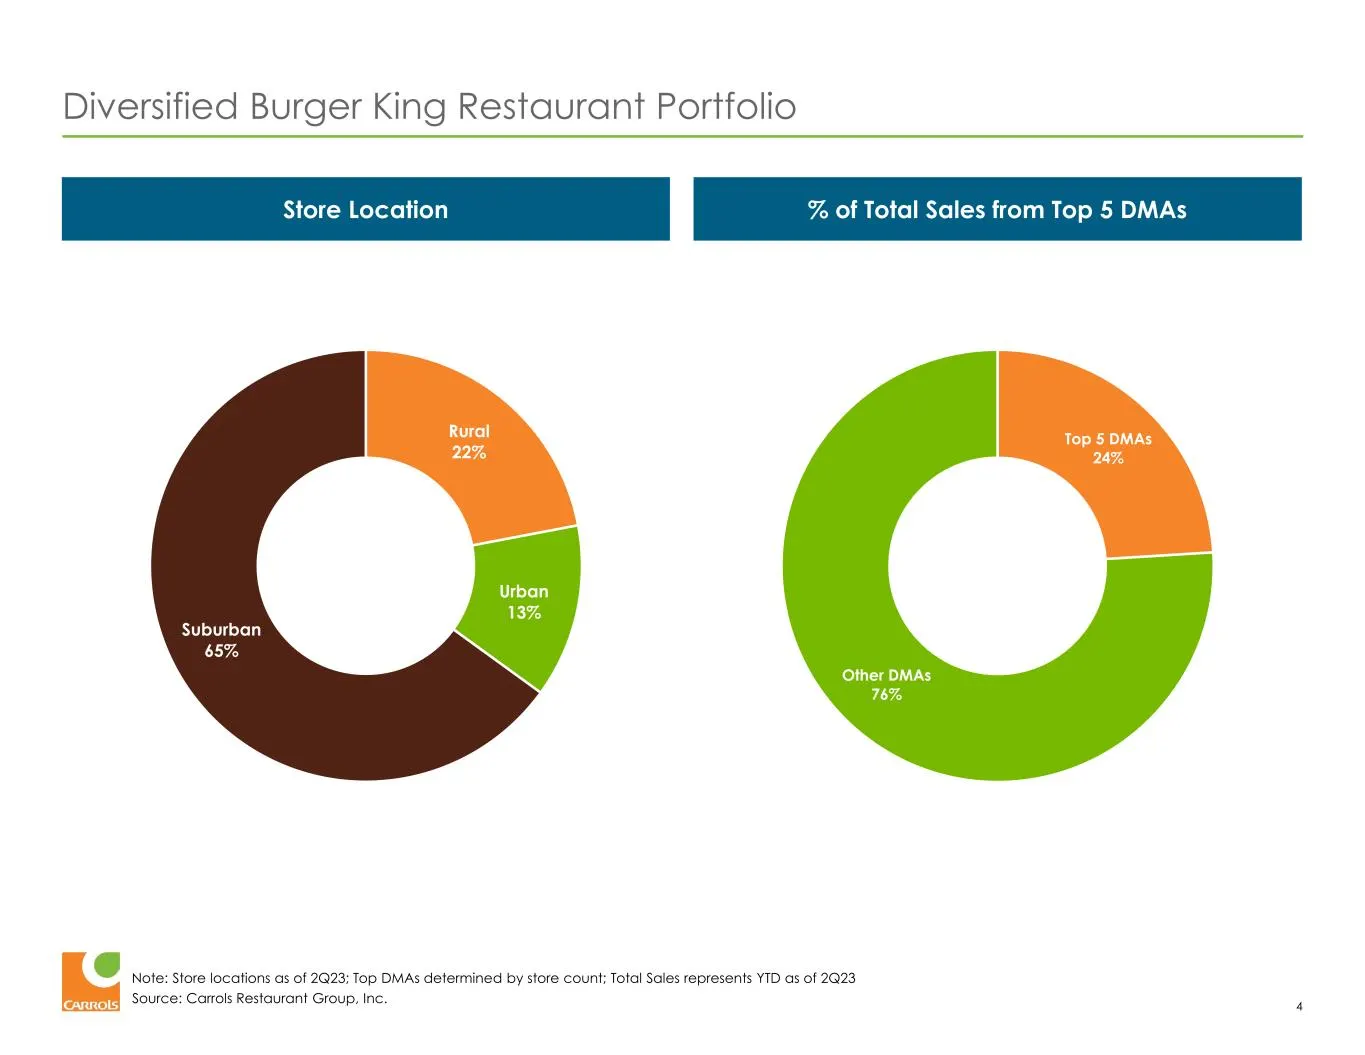
Source: Carrols Restaurant Group, Inc. Diversified Burger King Restaurant Portfolio 4 % of Total Sales from Top 5 DMAsStore Location Rural 22% Urban 13% Suburban 65% Top 5 DMAs 24% Other DMAs 76% Note: Store locations as of 2Q23; Top DMAs determined by store count; Total Sales represents YTD as of 2
Slide 5: Consistent Outperformance
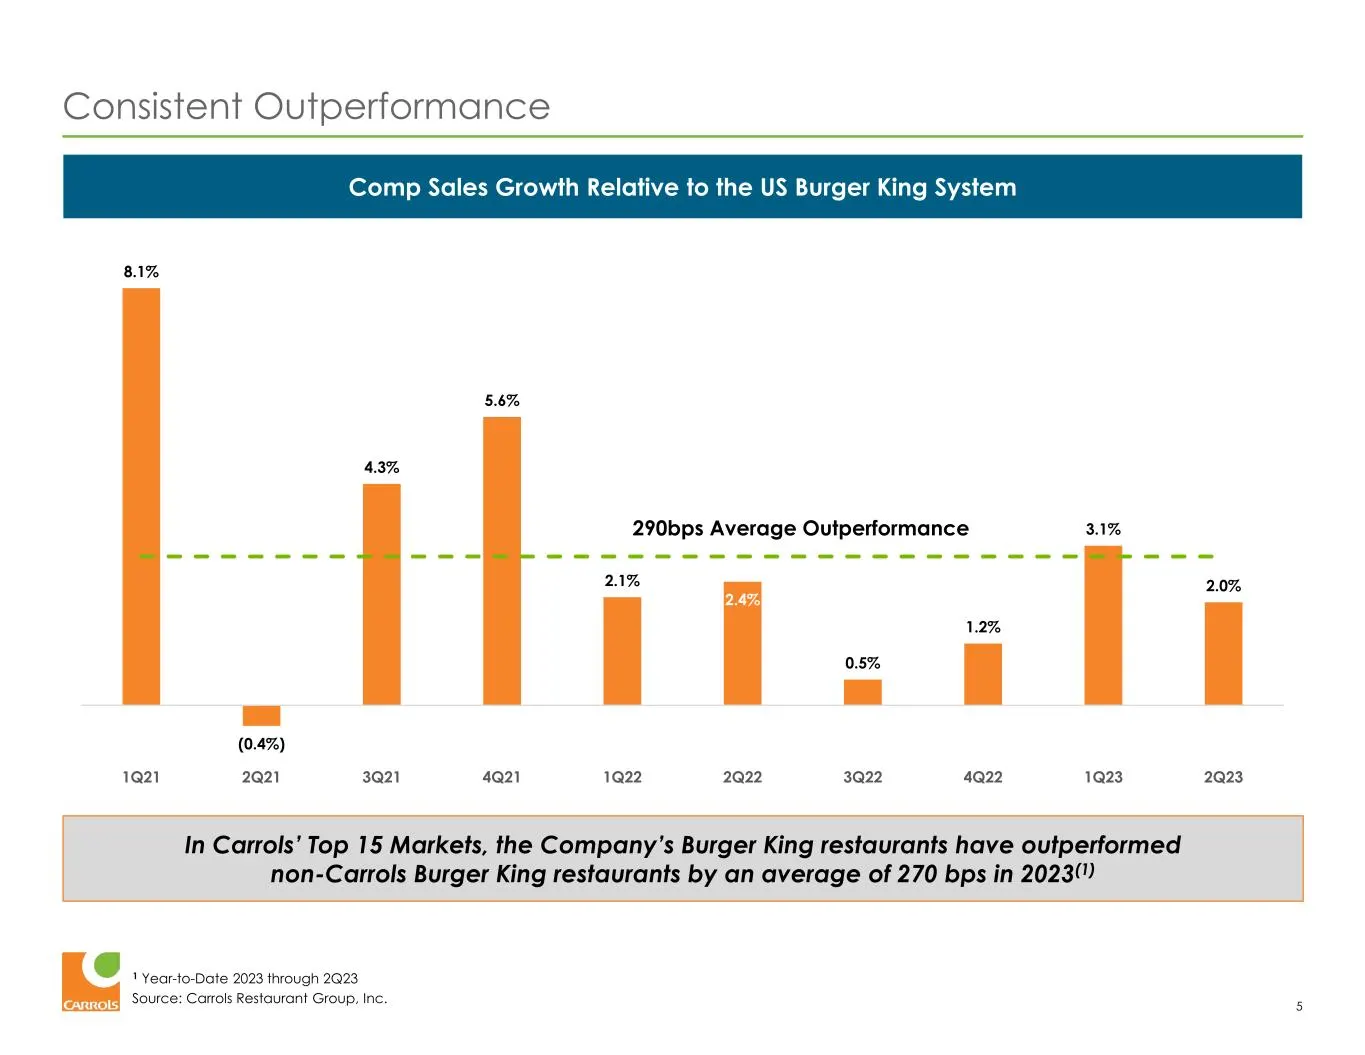
Source: Carrols Restaurant Group, Inc. Consistent Outperformance 5 Comp Sales Growth Relative to the US Burger King System 1 Year-to-Date 2023 through 2Q23 8.1% (0.4%) 4.3% 5.6% 2.1% 2.4% 0.5% 1.2% 3.1% 2.0% (1.0%) 0.0% 1.0% 2.0% 3.0% 4.0% 5.0% 6.0% 7.0% 8.0% 9.0% 1Q21 2Q21 3Q21 4Q21 1Q22 2Q22 3Q22
Slide 6: Recent Performance Overview
RECENT PERFORMANCE OVERVIEW 6
Slide 7: Recent Record of Strong Same-Store Sales Growth
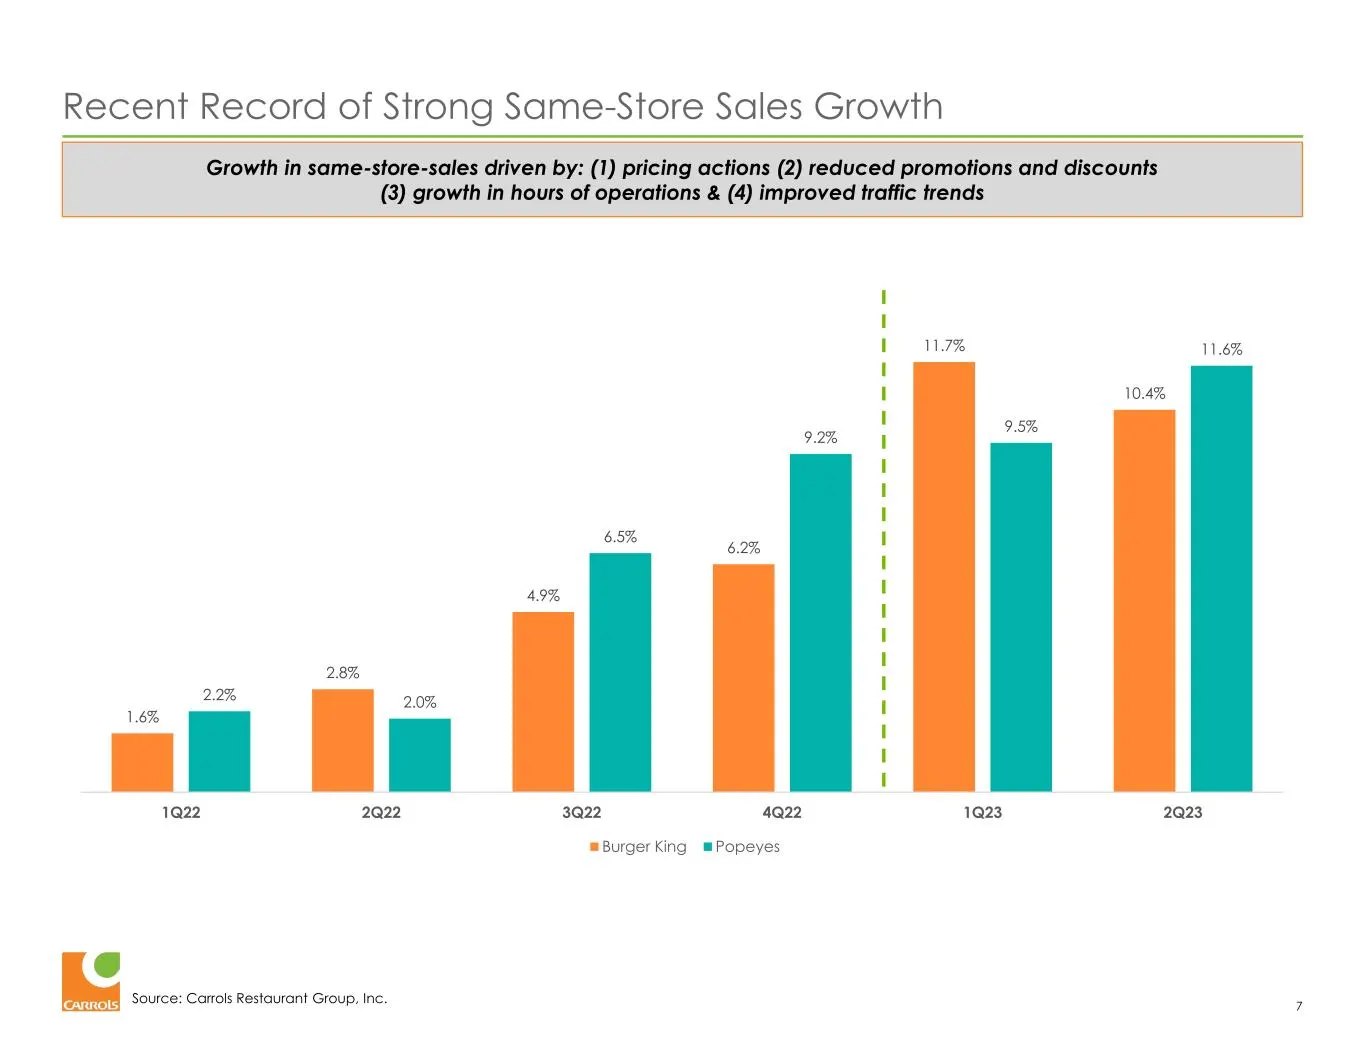
Source: Carrols Restaurant Group, Inc. Recent Record of Strong Same-Store Sales Growth 7 Growth in same-store-sales driven by: (1) pricing actions (2) reduced promotions and discounts (3) growth in hours of operations & (4) improved traffic trends 1.6% 2.8% 4.9% 6.2% 11.7% 10.4% 2.2% 2.0% 6.5% 9.2%
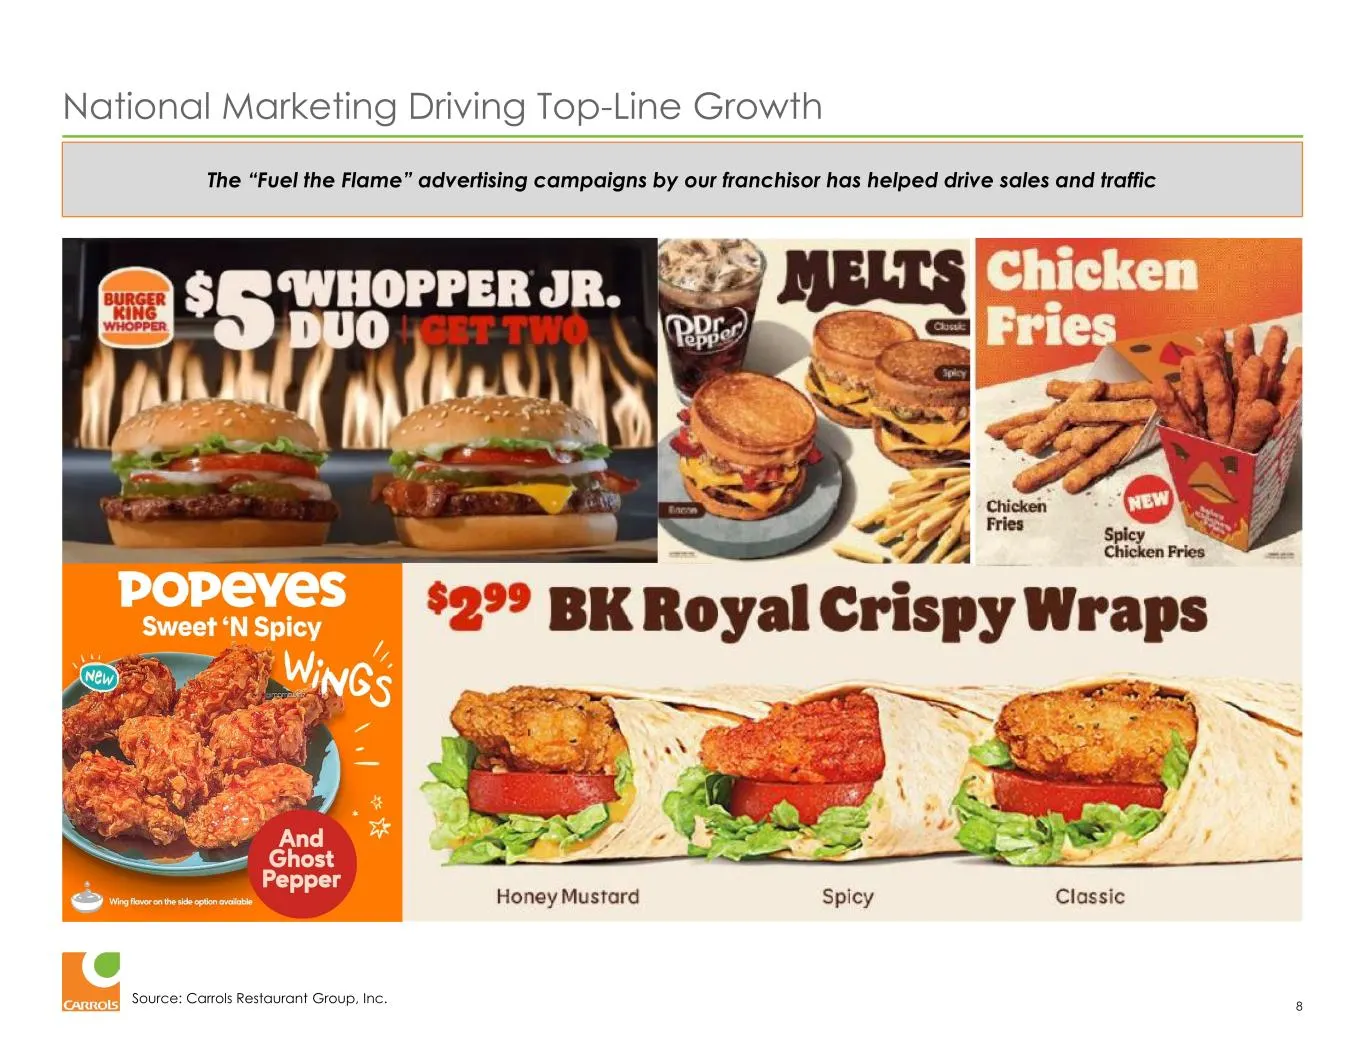
Slide 8: National Marketing Driving Top-Line Growth
Source: Carrols Restaurant Group, Inc. National Marketing Driving Top-Line Growth 8 The “Fuel the Flame” advertising campaigns by our franchisor has helped drive sales and traffic
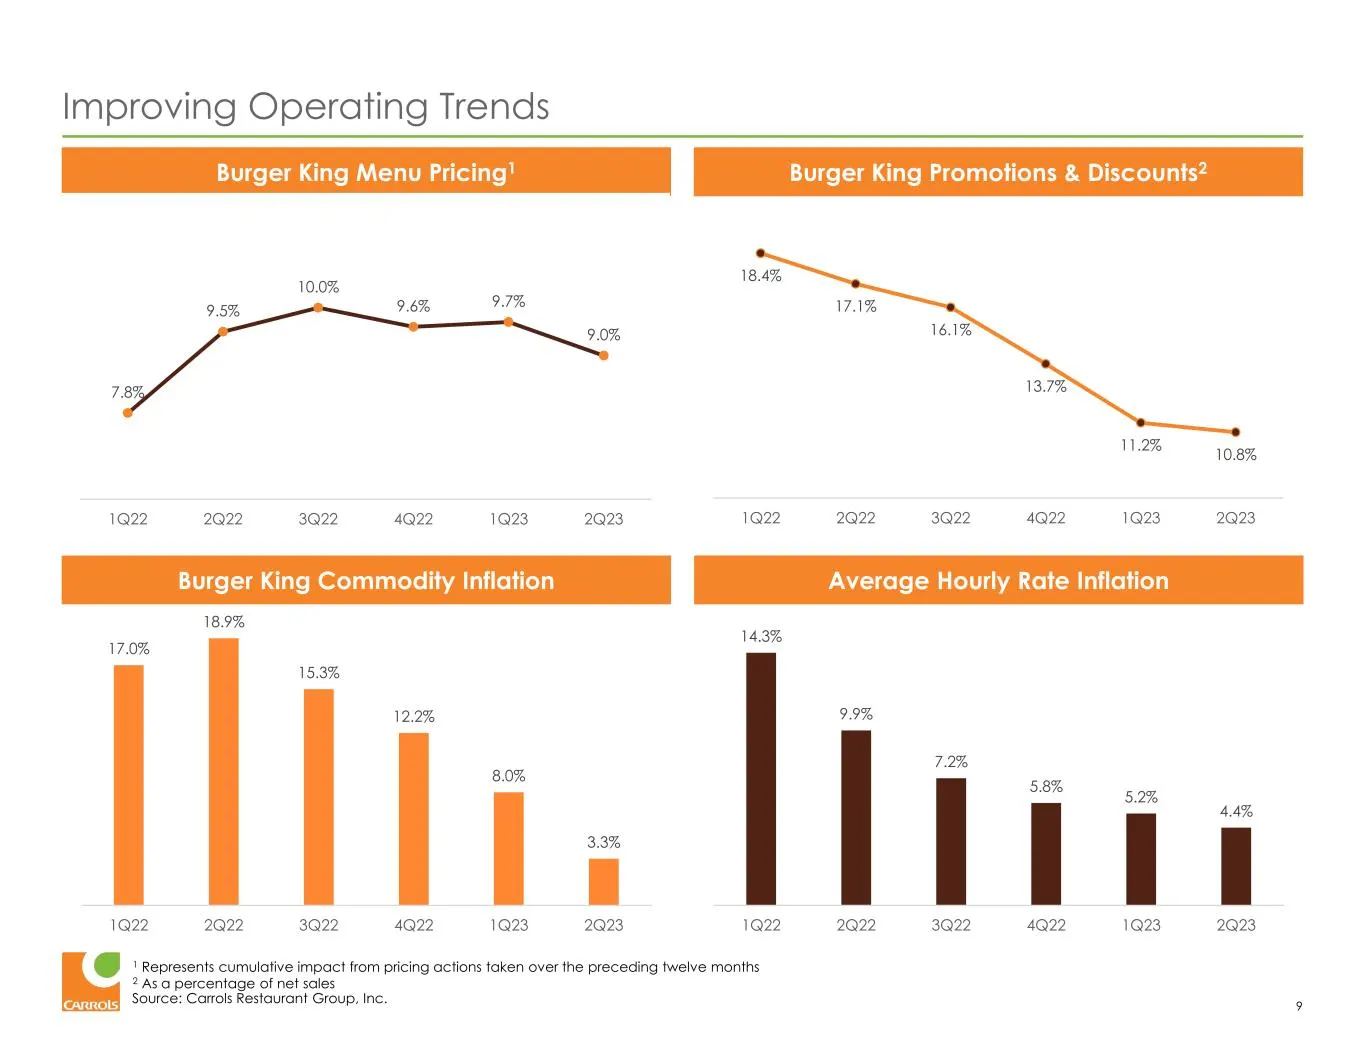
Slide 9: Improving Operating Trends
Source: Carrols Restaurant Group, Inc. 18.4% 17.1% 16.1% 13.7% 11.2% 10.8% 8.0% 10.0% 12.0% 14.0% 16.0% 18.0% 20.0% 1Q22 2Q22 3Q22 4Q22 1Q23 2Q23 Improving Operating Trends 9 Burger King Menu Pricing1 Burger King Promotions & Discounts2 Burger King Commodity Inflation Average Hourly Rate Inflation 1
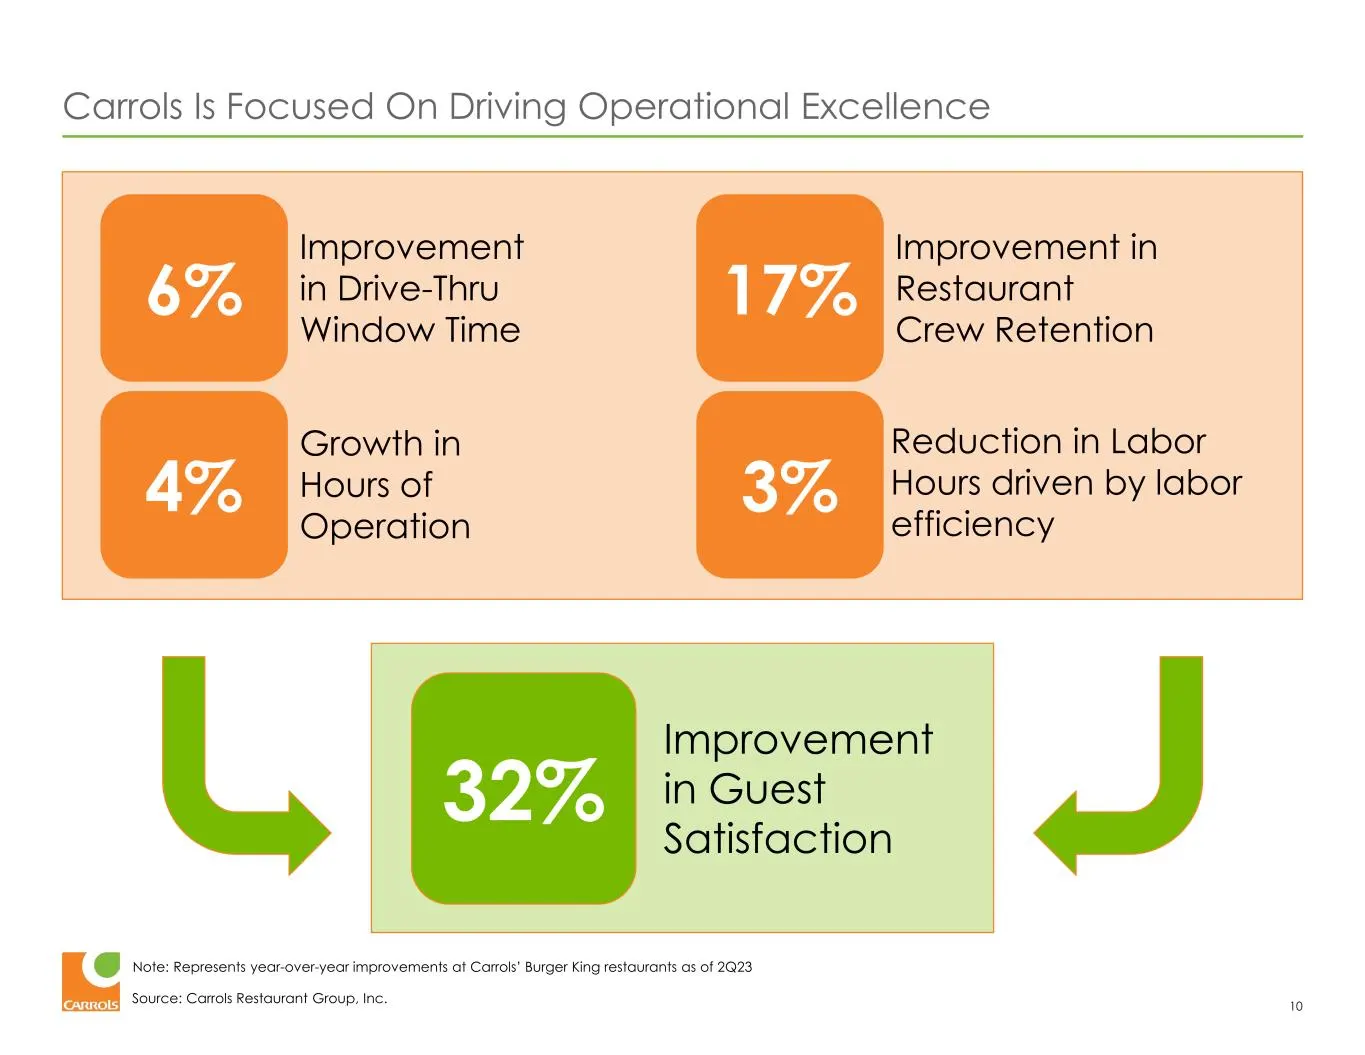
Slide 10: Carrols Is Focused On Driving Operational Excellence
Source: Carrols Restaurant Group, Inc. Carrols Is Focused On Driving Operational Excellence 10 Note: Represents year-over-year improvements at Carrols’ Burger King restaurants as of 2Q23 Improvement in Drive-Thru Window Time Growth in Hours of Operation Reduction in Labor Hours driven by labor effic
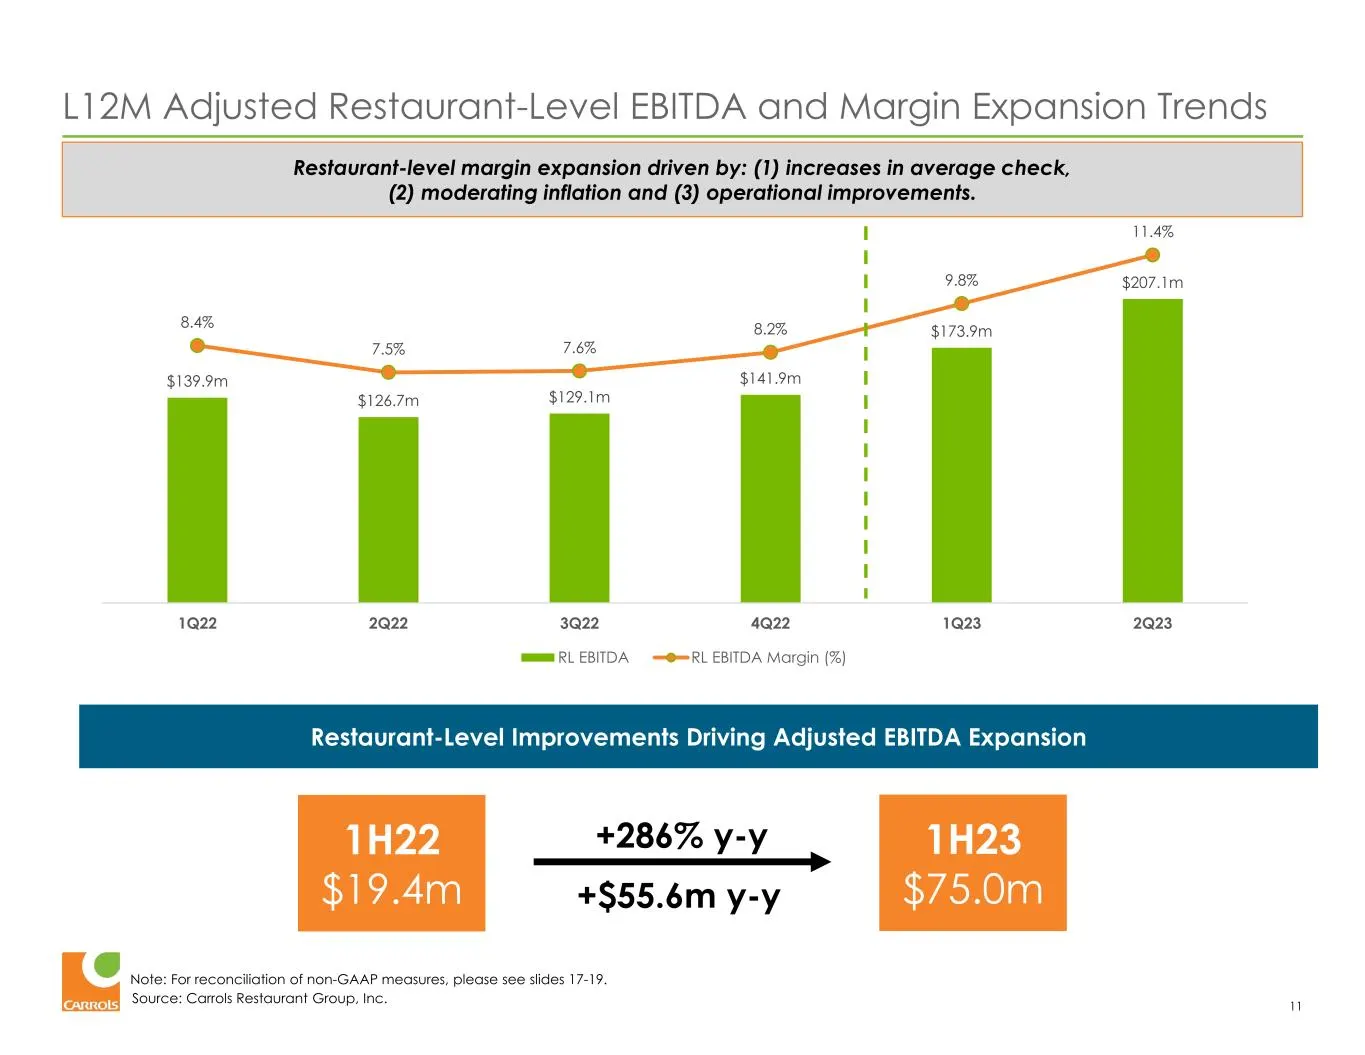
Slide 11: L12M Adjusted Restaurant-Level EBITDA and Margin Expansion Trends
Source: Carrols Restaurant Group, Inc. L12M Adjusted Restaurant-Level EBITDA and Margin Expansion Trends 11 Restaurant-level margin expansion driven by: (1) increases in average check, (2) moderating inflation and (3) operational improvements. $139.9m $126.7m $129.1m $141.9m $173.9m $207.1m 8.4% 7.5
Slide 12: Organic Balance Sheet Strengthening Over Past Six Quarters
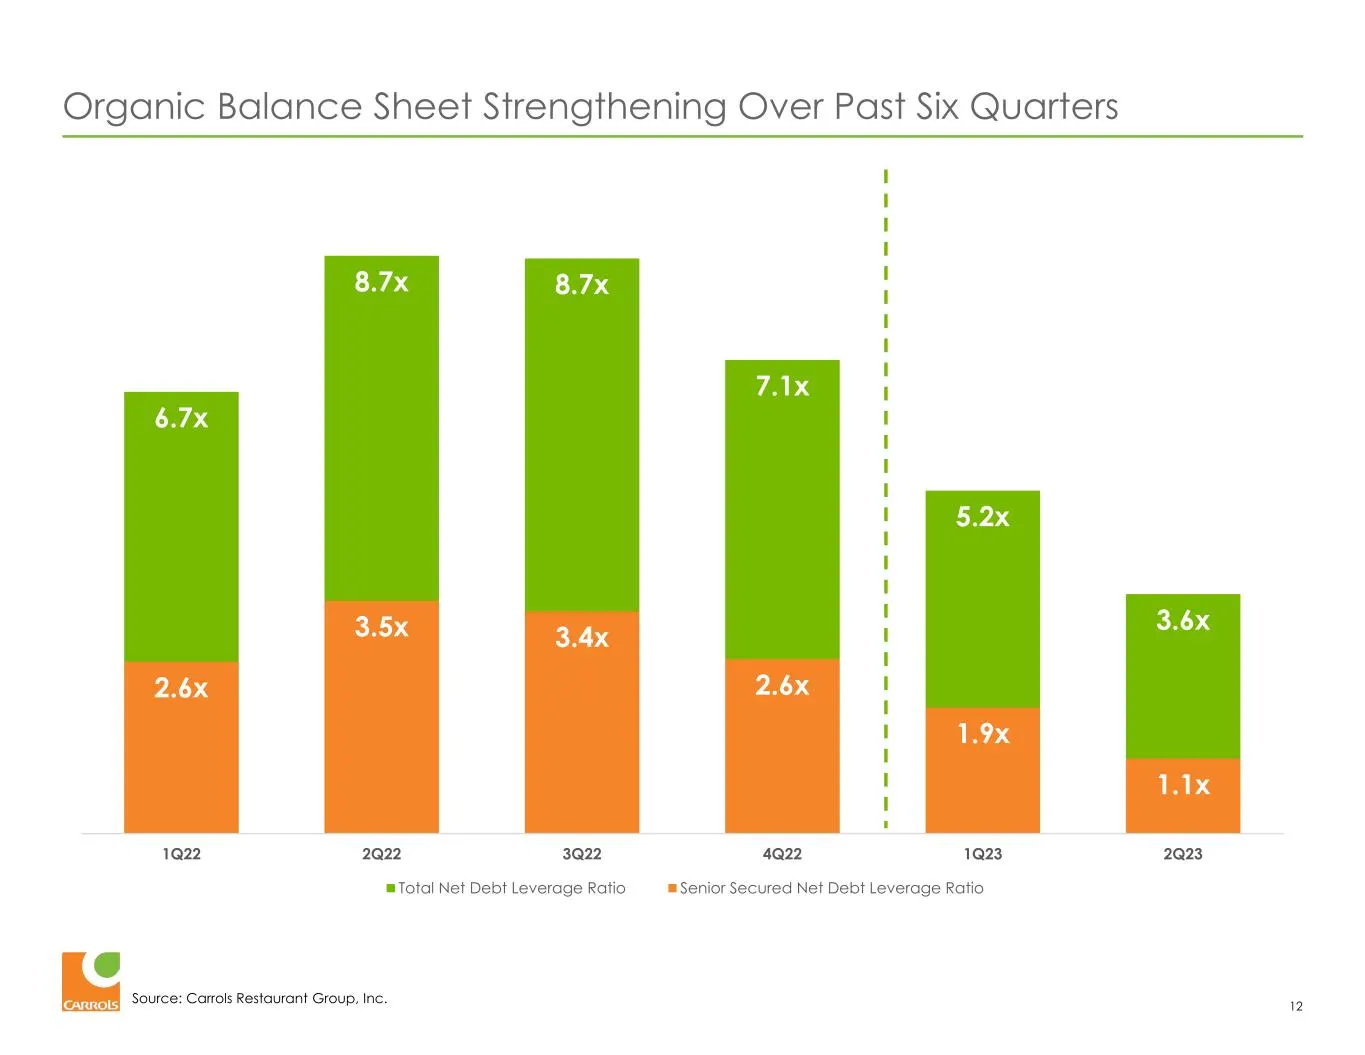
Source: Carrols Restaurant Group, Inc. Organic Balance Sheet Strengthening Over Past Six Quarters 12 6.7x 8.7x 8.7x 7.1x 5.2x 3.6x 2.6x 3.5x 3.4x 2.6x 1.9x 1.1x 1Q22 2Q22 3Q22 4Q22 1Q23 2Q23 Total Net Debt Leverage Ratio Senior Secured Net Debt Leverage Ratio
Slide 13: Capitalization Overview
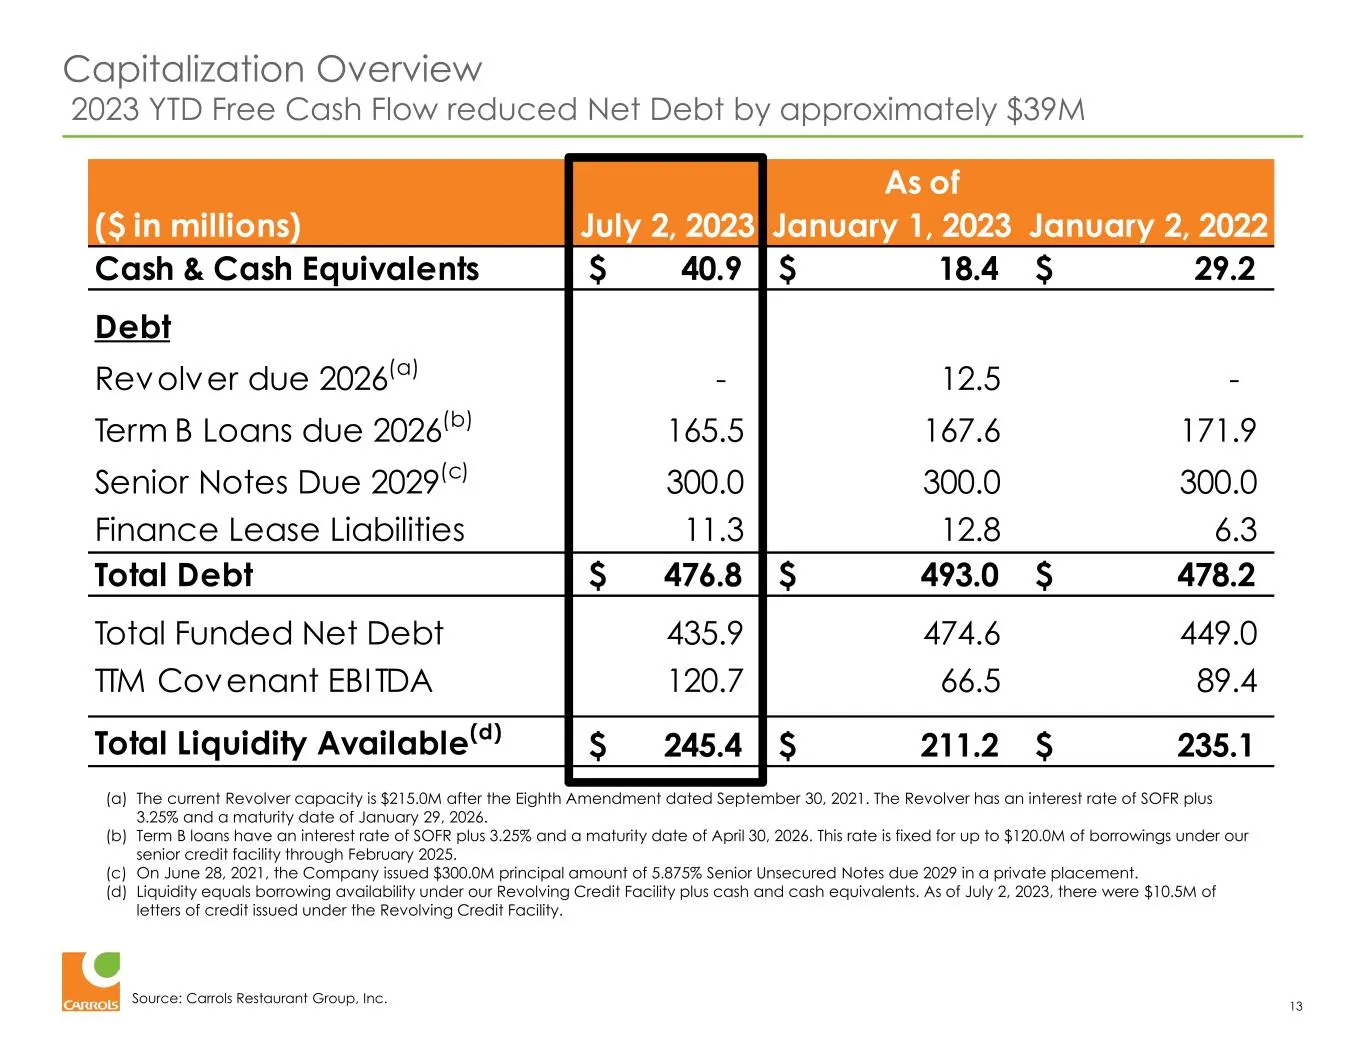
Source: Carrols Restaurant Group, Inc. Capitalization Overview 2023 YTD Free Cash Flow reduced Net Debt by approximately $39M 13 ($ in millions) July 2, 2023 January 1, 2023 January 2, 2022 Cash & Cash Equivalents 40.9$ 18.4$ 29.2$ Debt Revolver due 2026(a) - 12.5 - Term B Loans due 2026(b) 165.5 16
Slide 14: Looking Ahead
LOOKING AHEAD 14
Slide 15: Looking Ahead
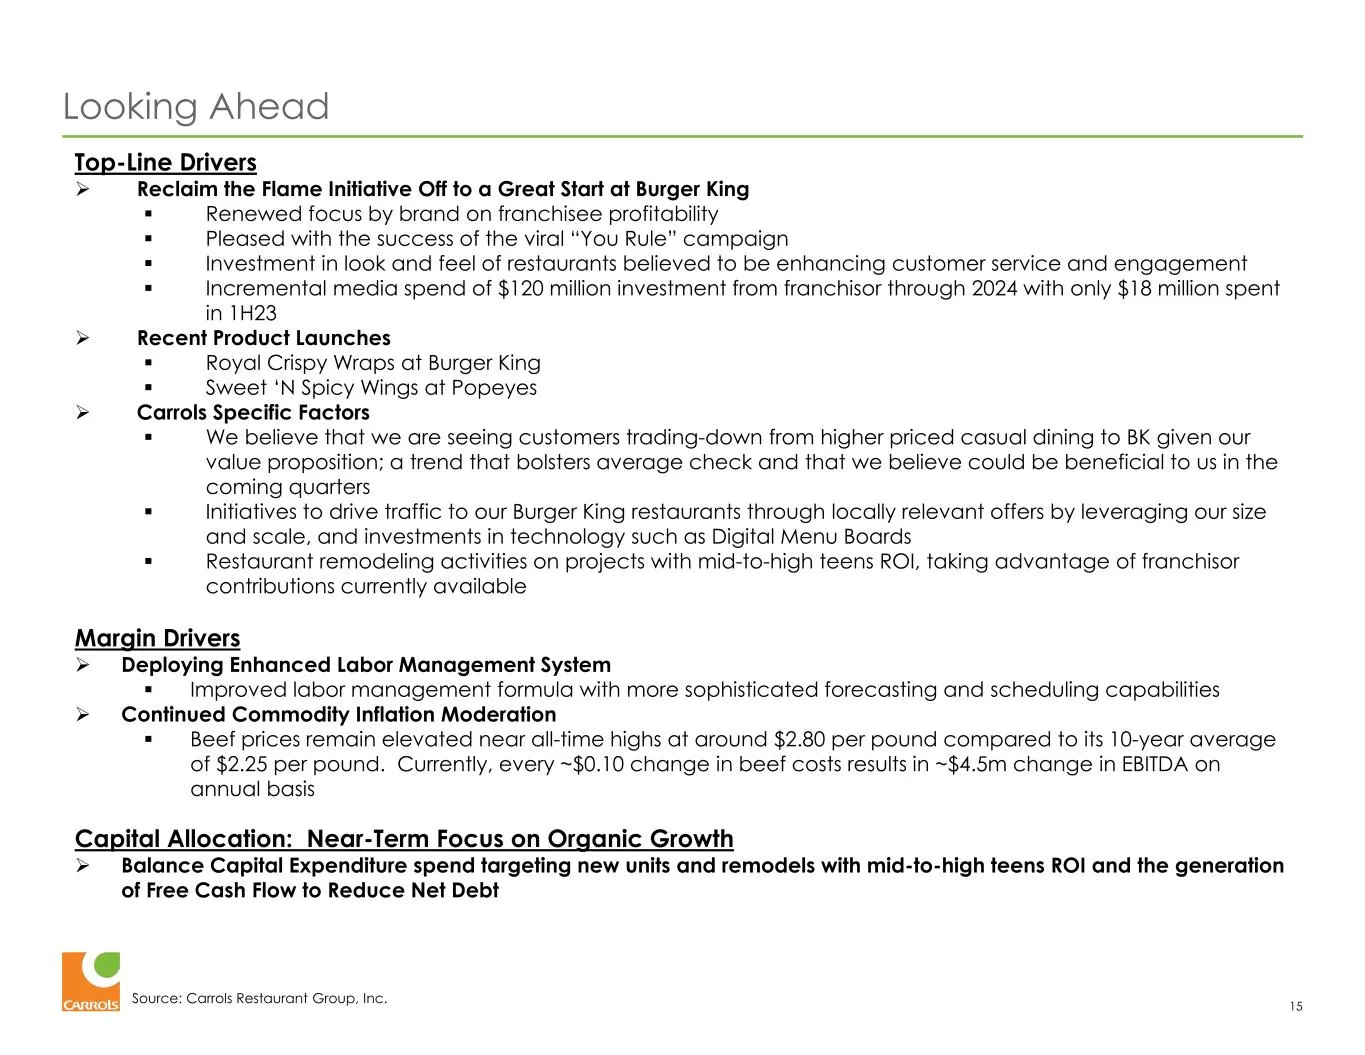
Source: Carrols Restaurant Group, Inc. Looking Ahead 15 Top-Line Drivers Reclaim the Flame Initiative Off to a Great Start at Burger King Renewed focus by brand on franchisee profitability Pleased with the success of the viral “You Rule” campaign Investment in look and feel of restaurants be
Slide 16: Appendix
APPENDIX 16
Slide 17: Reconciliation of Quarterly EBITDA and Quarterly Adjusted EBITDA
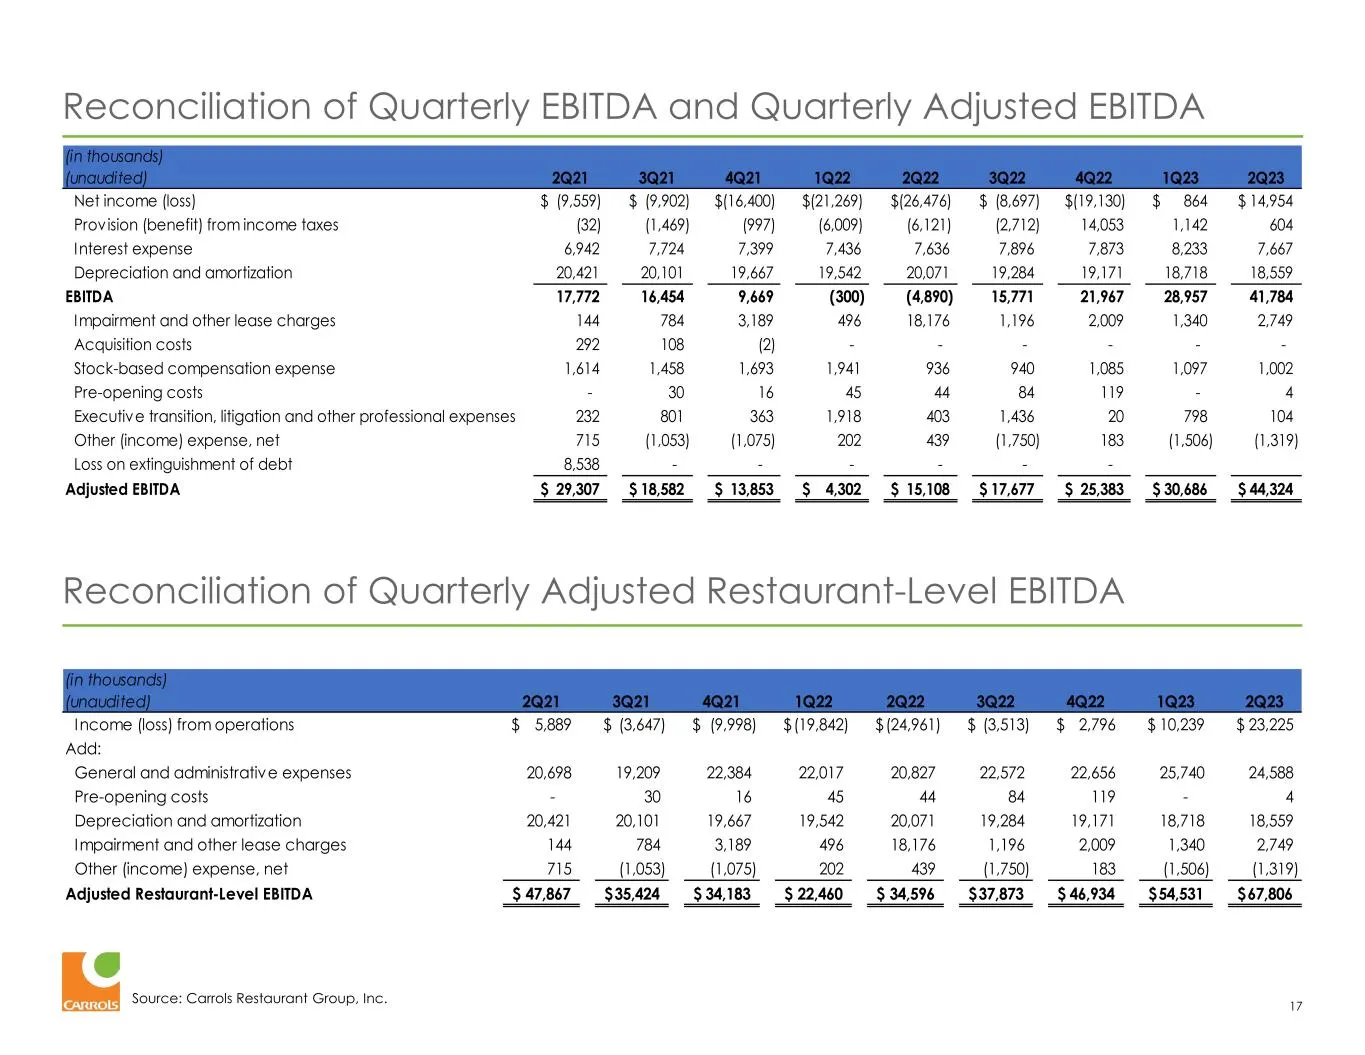
Source: Carrols Restaurant Group, Inc. Reconciliation of Quarterly EBITDA and Quarterly Adjusted EBITDA 17 Reconciliation of Quarterly Adjusted Restaurant-Level EBITDA (in thousands) (unaudited) 2Q21 3Q21 4Q21 1Q22 2Q22 3Q22 4Q22 1Q23 2Q23 Income (loss) from operations 5,889$ (3,647)$ (9,998)$ (19,8
Slide 18: Reconciliation of LTM EBITDA and LTM Adjusted EBITDA
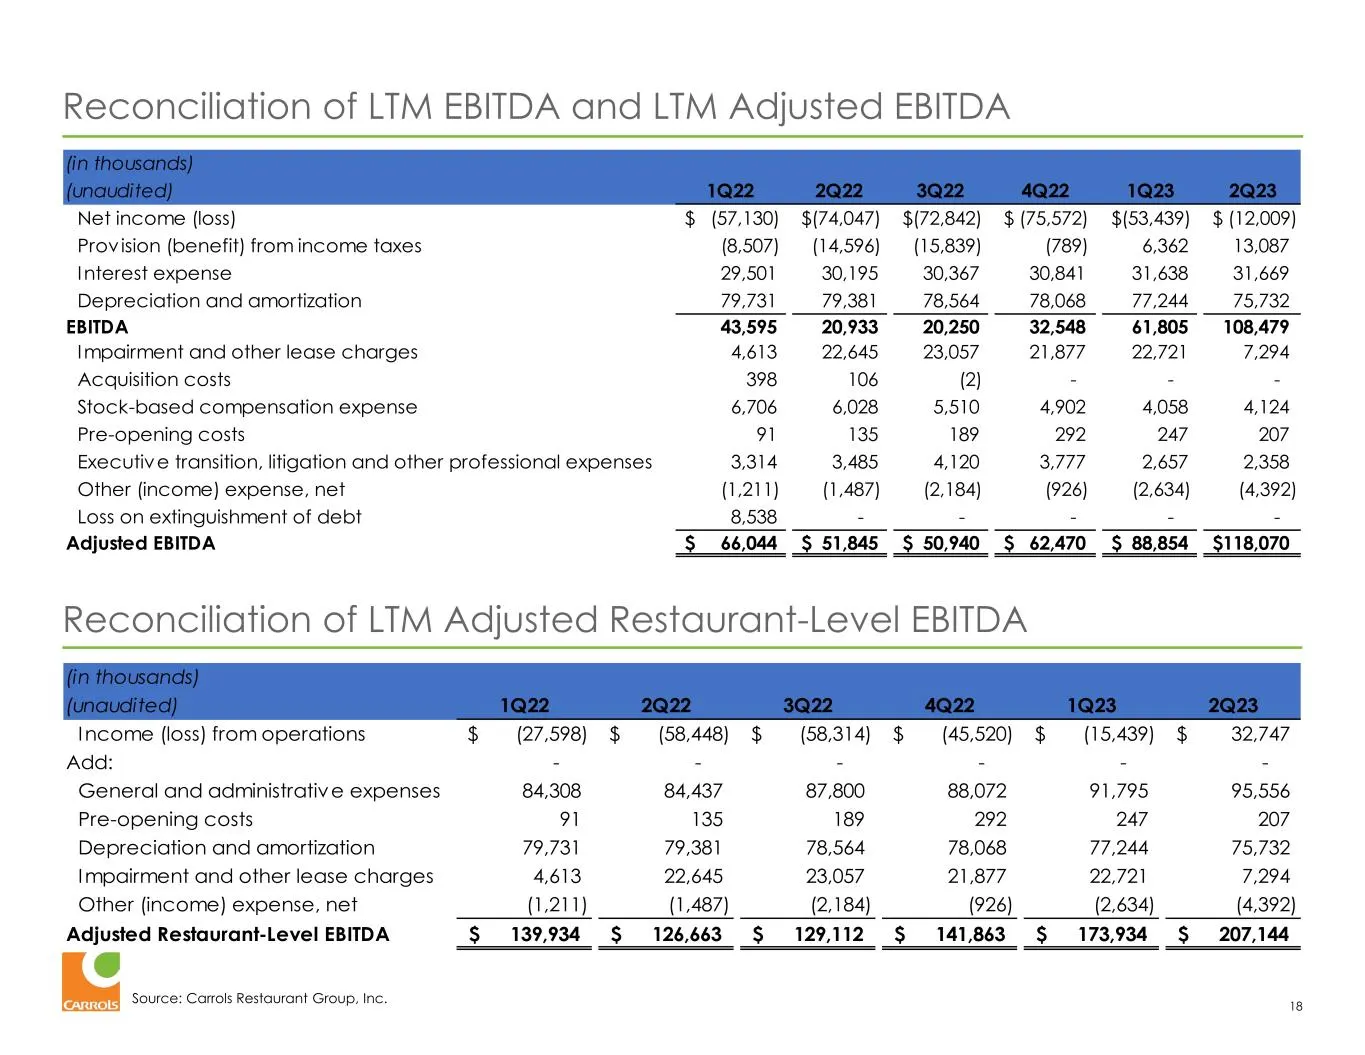
Source: Carrols Restaurant Group, Inc. Reconciliation of LTM EBITDA and LTM Adjusted EBITDA 18 Reconciliation of LTM Adjusted Restaurant-Level EBITDA (in thousands) (unaudited) 1Q22 2Q22 3Q22 4Q22 1Q23 2Q23 Income (loss) from operations (27,598)$ (58,448)$ (58,314)$ (45,520)$ (15,439)$ 32,747$ Add:
Slide 19: Reconciliation of 2023 YTD Free Cash Flow
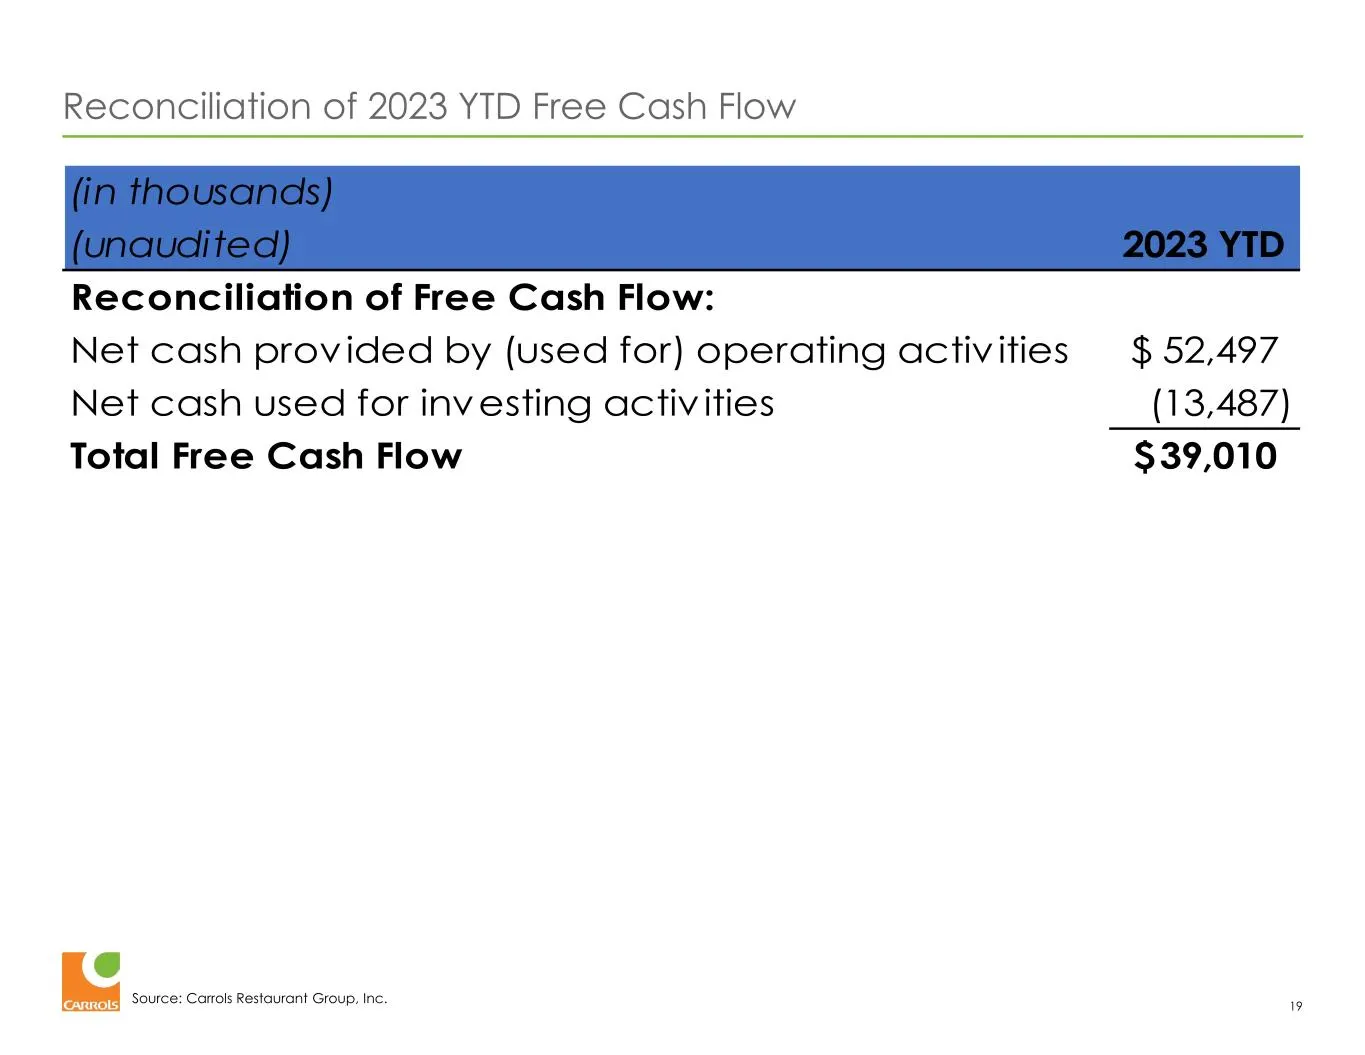
Source: Carrols Restaurant Group, Inc. Reconciliation of 2023 YTD Free Cash Flow 19 (in thousands) (unaudited) 2023 YTD Reconciliation of Free Cash Flow: Net cash prov ided by (used for) operating activ ities 52,497$ Net cash used for investing activ ities (13,487) Total Free Cash Flow 39,010$
Source: SEC EDGAR · 8-K filed Sep 14, 2023