OUTsurance Group Limited · JSE:OUT
OUTsurance — FY2022 Earnings Presentation
34 slides from OUTsurance's earnings presentation, September 2022

Slide 1: Financial Results – 30 June 2022
OUTsurance Holdings Limited Financial Results – 30 June 2022
Slide 2: Contents
Contents • Strategic update – Marthinus Visser • Operational review – Marthinus Visser • Financial review – Jan Hofmeyr • Outlook – Marthinus Visser OUTsurance Holdings Limited 2
Slide 3: Strategic update
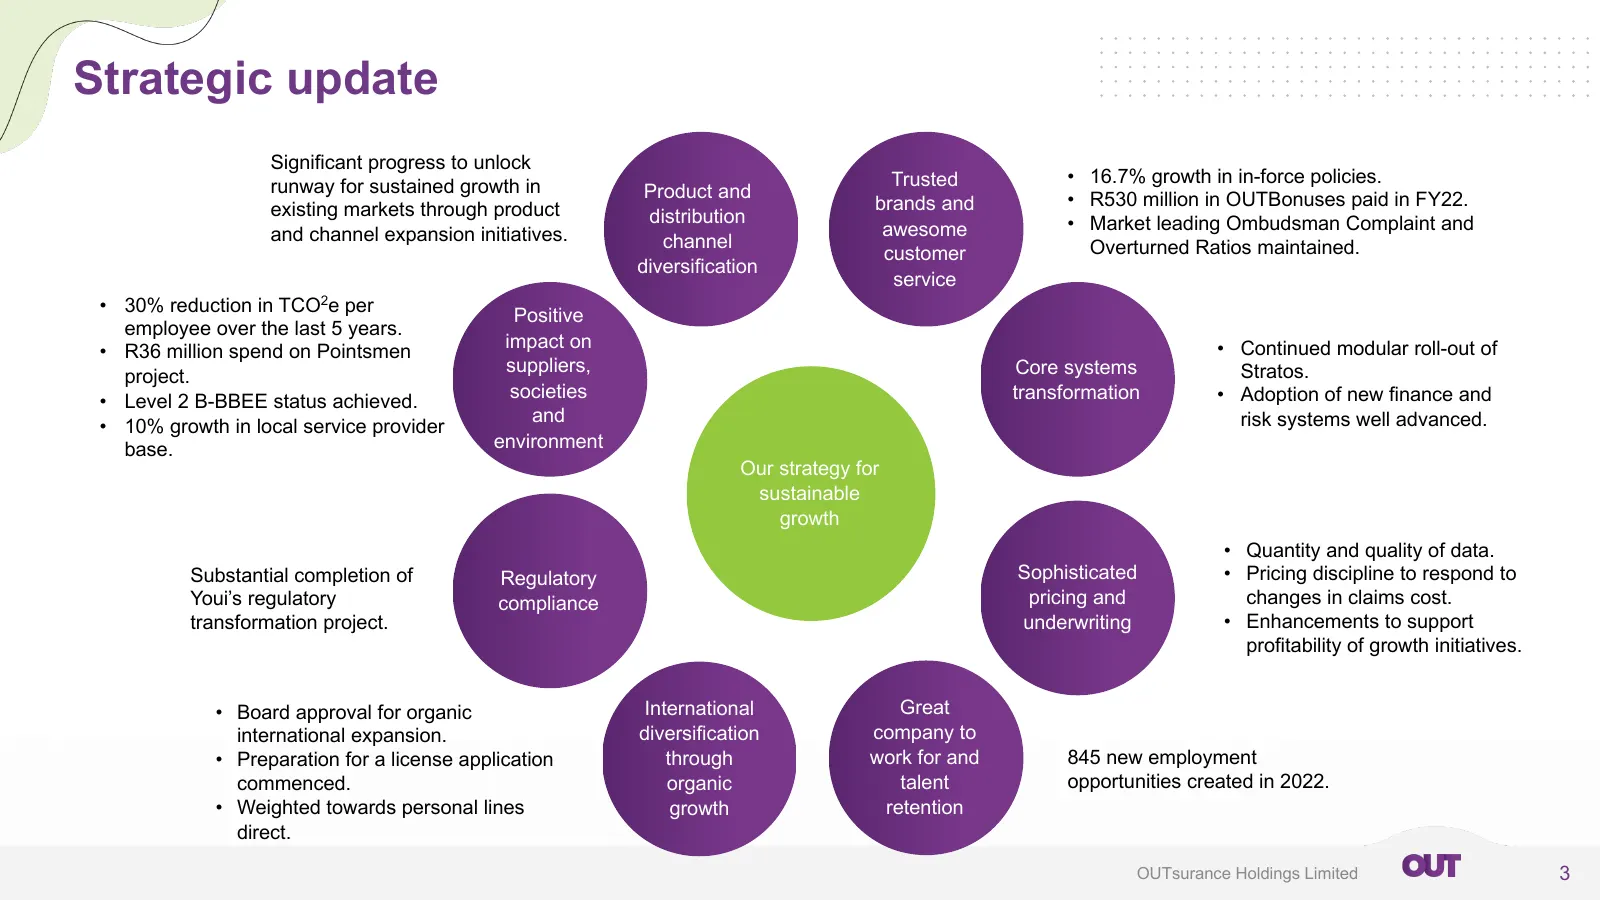
Strategic update Significant progress to unlock runway for sustained growth in Trusted • 16.7% growth in in-force policies. Product and • R530 million in OUTBonuses paid in FY22. existing markets through product brands and distribution • Market leading Ombudsman Complaint and and channel expansion i
Slide 4: Product and distribution initiatives
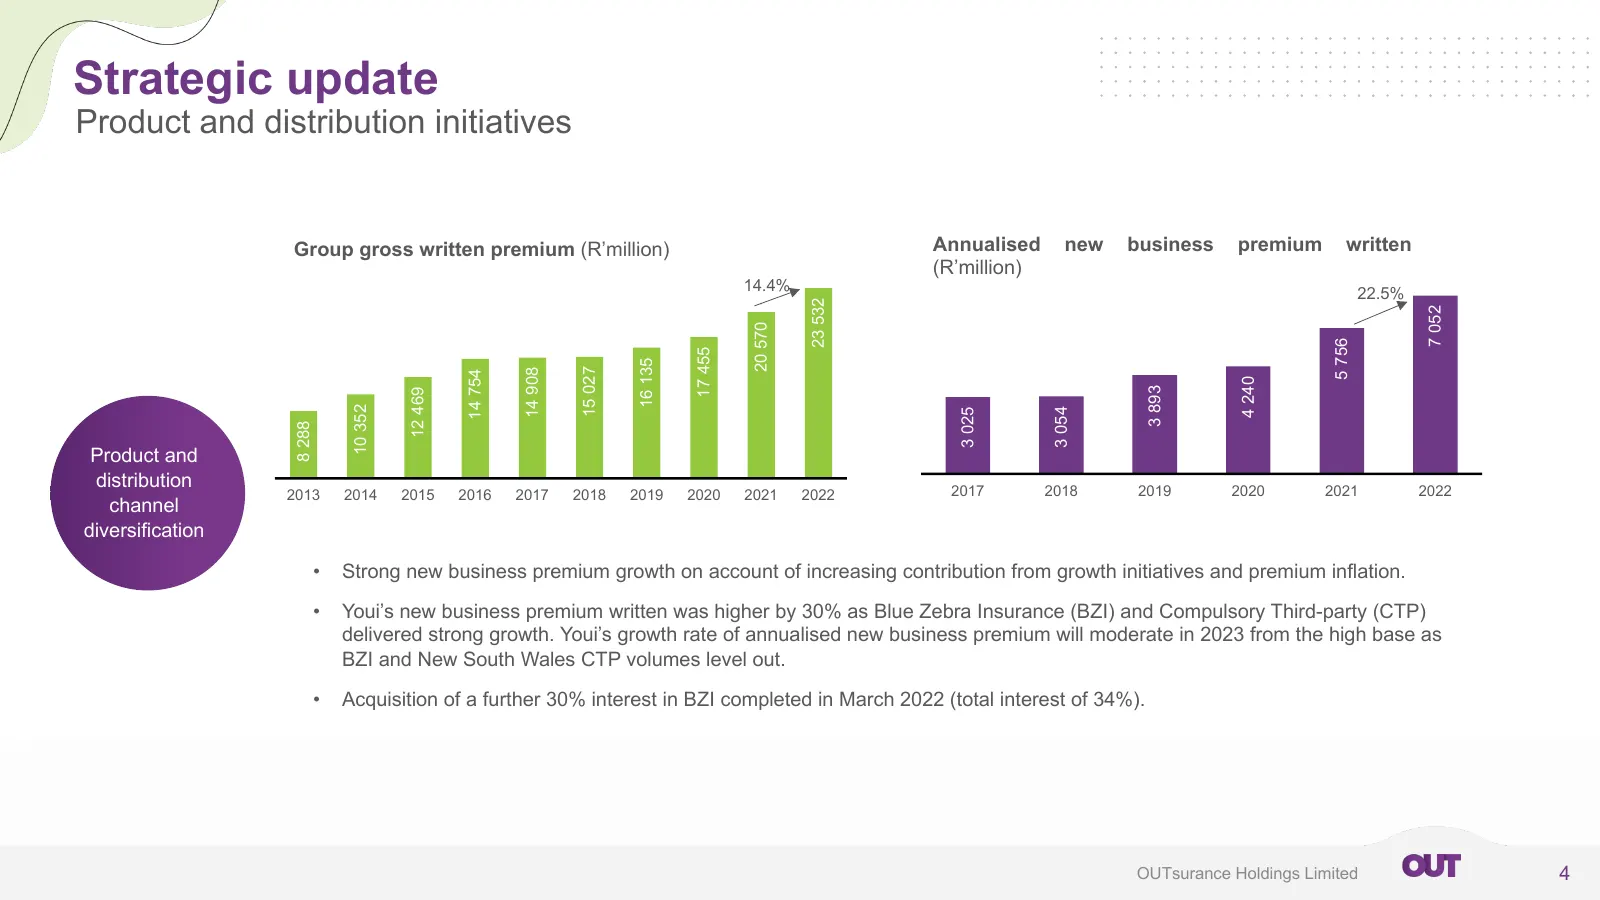
Strategic update Product and distribution initiatives Group gross written premium (R’million) Annualised new business premium written (R’million) 14.4% 22.5% 23 532 7 052 20 570 5 756 17 455 16 135 15 027 14 908 14 754 4 240 3 893 12 469 10 352 3 054 3 025 8 288 Product and distribution 2017 2018 20
Slide 5: Earnings profile – impact of investment and natural perils losses
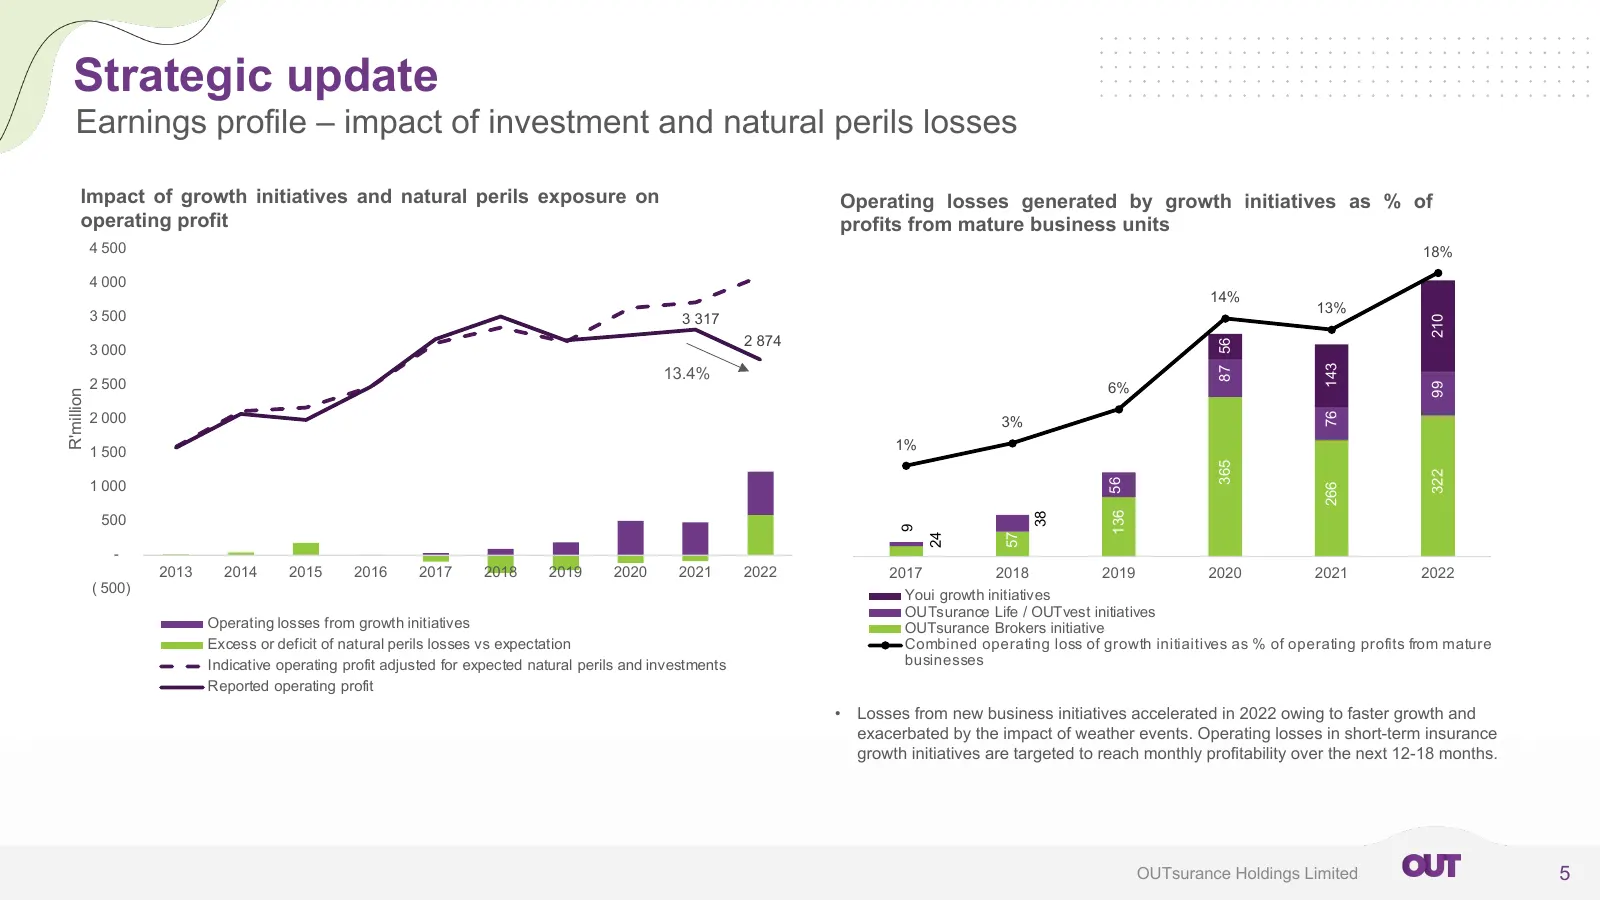
Strategic update Earnings profile – impact of investment and natural perils losses Impact of growth initiatives and natural perils exposure on Operating losses generated by growth initiatives as % of operating profit profits from mature business units 4 500 700 18% 18% 4 000 600 14% 3 500 13% 3 317
Slide 6: Premium revenue diversification
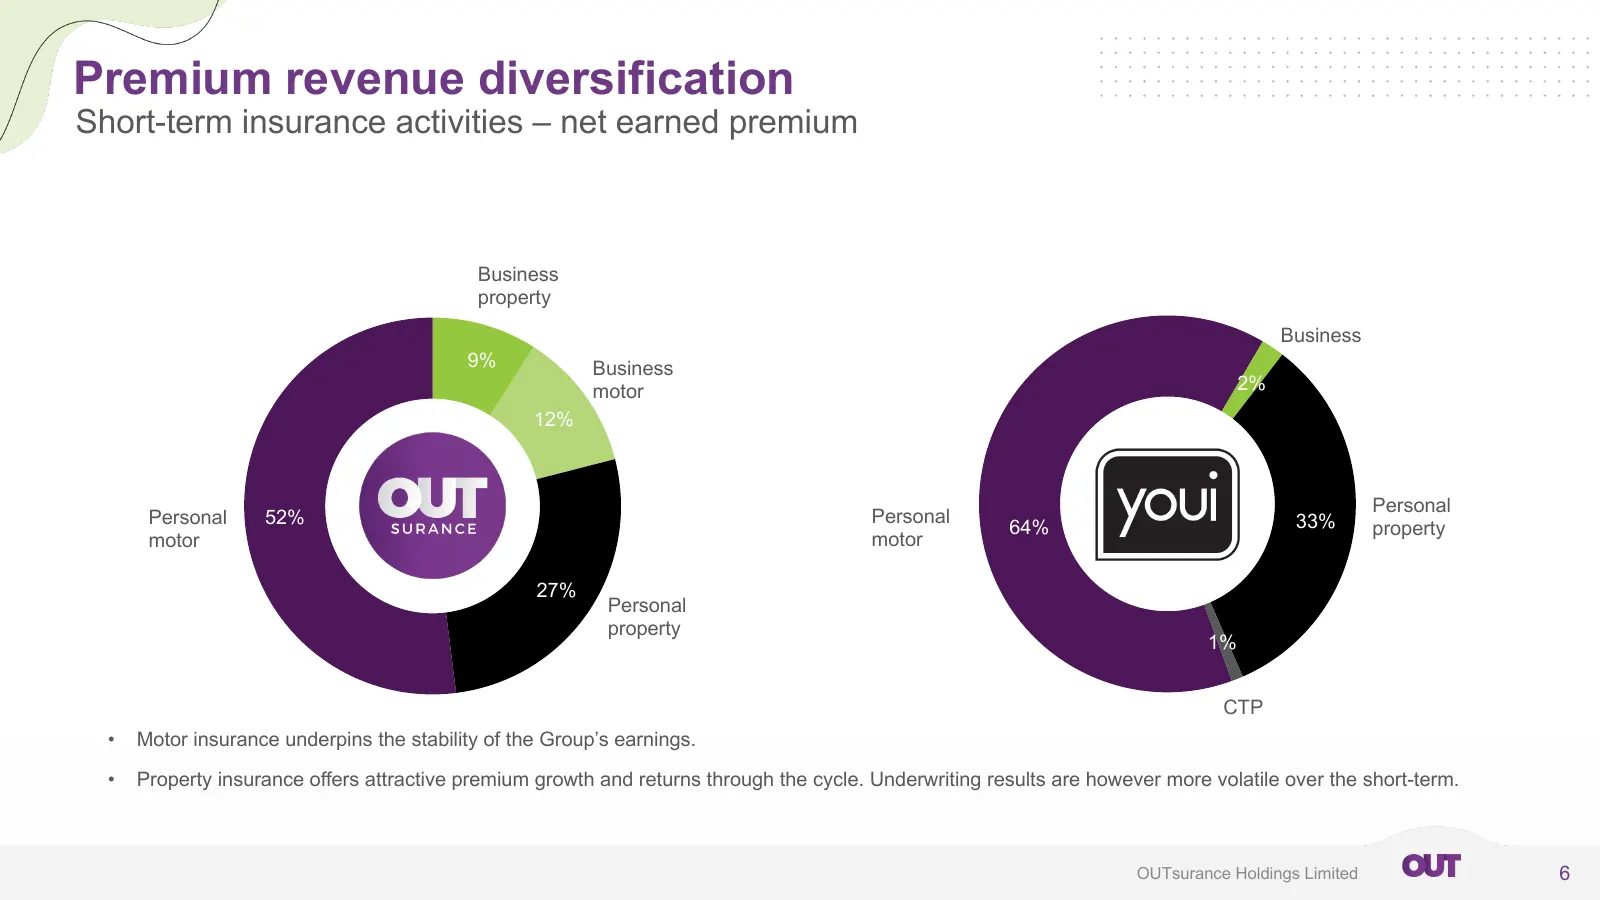
Premium revenue diversification Short-term insurance activities – net earned premium Business property Business 9% Business motor 2% 12% Sales Sales Personal Personal 52% Personal 33% 64% property motor motor 27% Personal property 1% CTP • Motor insurance underpins the stability of the Group’s earni

Slide 7: Operational review
Operational review You always get something out.
Slide 8: Overview of key operational themes
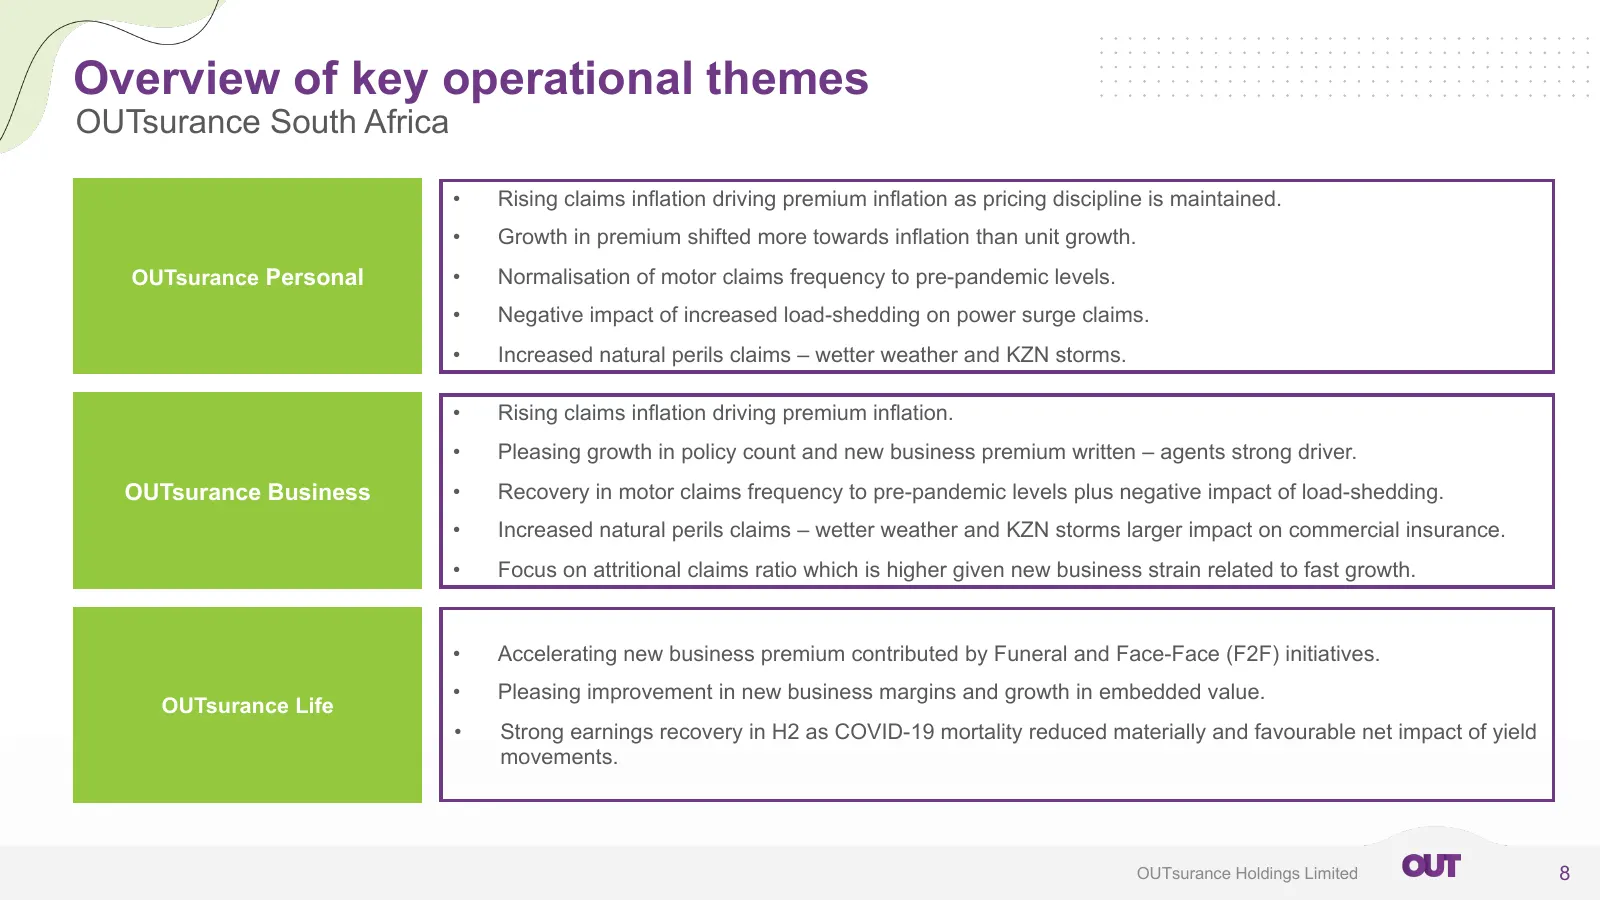
Overview of key operational themes OUTsurance South Africa • Rising claims inflation driving premium inflation as pricing discipline is maintained. • Growth in premium shifted more towards inflation than unit growth. OUTsurance Personal • Normalisation of motor claims frequency to pre-pandemic level
Slide 9: Overview of key operational themes
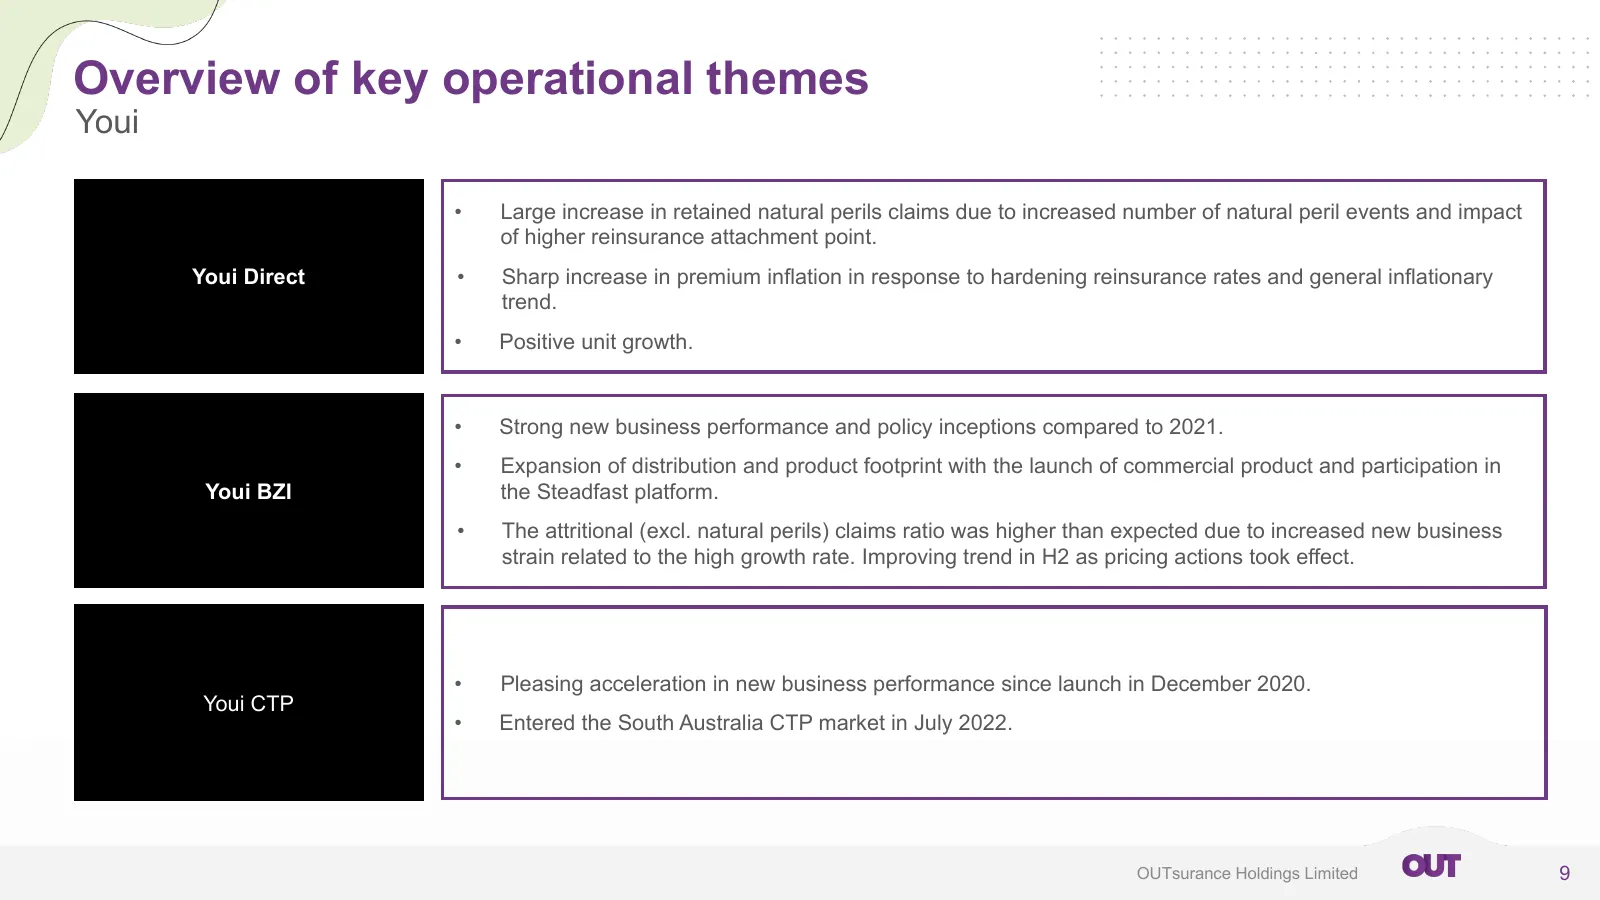
Overview of key operational themes Youi • Large increase in retained natural perils claims due to increased number of natural peril events and impact of higher reinsurance attachment point. Youi Direct • Sharp increase in premium inflation in response to hardening reinsurance rates and general infla

Slide 10: Financial review
Financial review You always get something out.
Slide 11: Financial Review
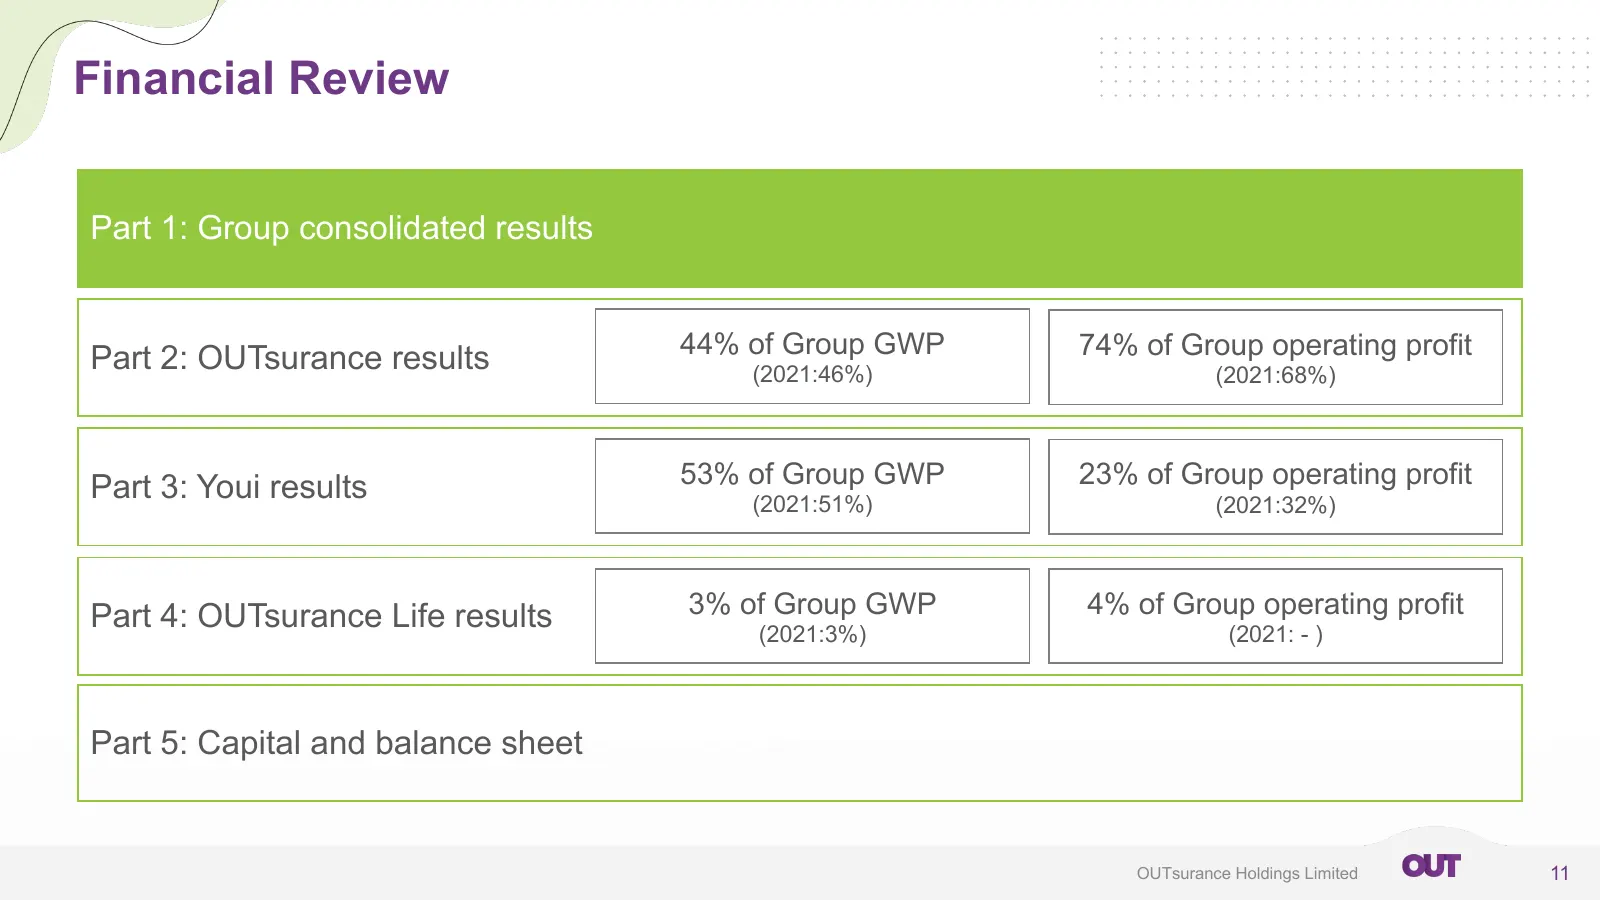
Financial Review Part 1: Group consolidated results 44% of Group GWP 74% of Group operating profit Part 2: OUTsurance results (2021:46%) (2021:68%) Part 3: Youi results 53% of Group GWP 23% of Group operating profit (2021:51%) (2021:32%) Part 4: OUTsurance Life results 3% of Group GWP 4% of Group op
Slide 12: Group consolidated results overview
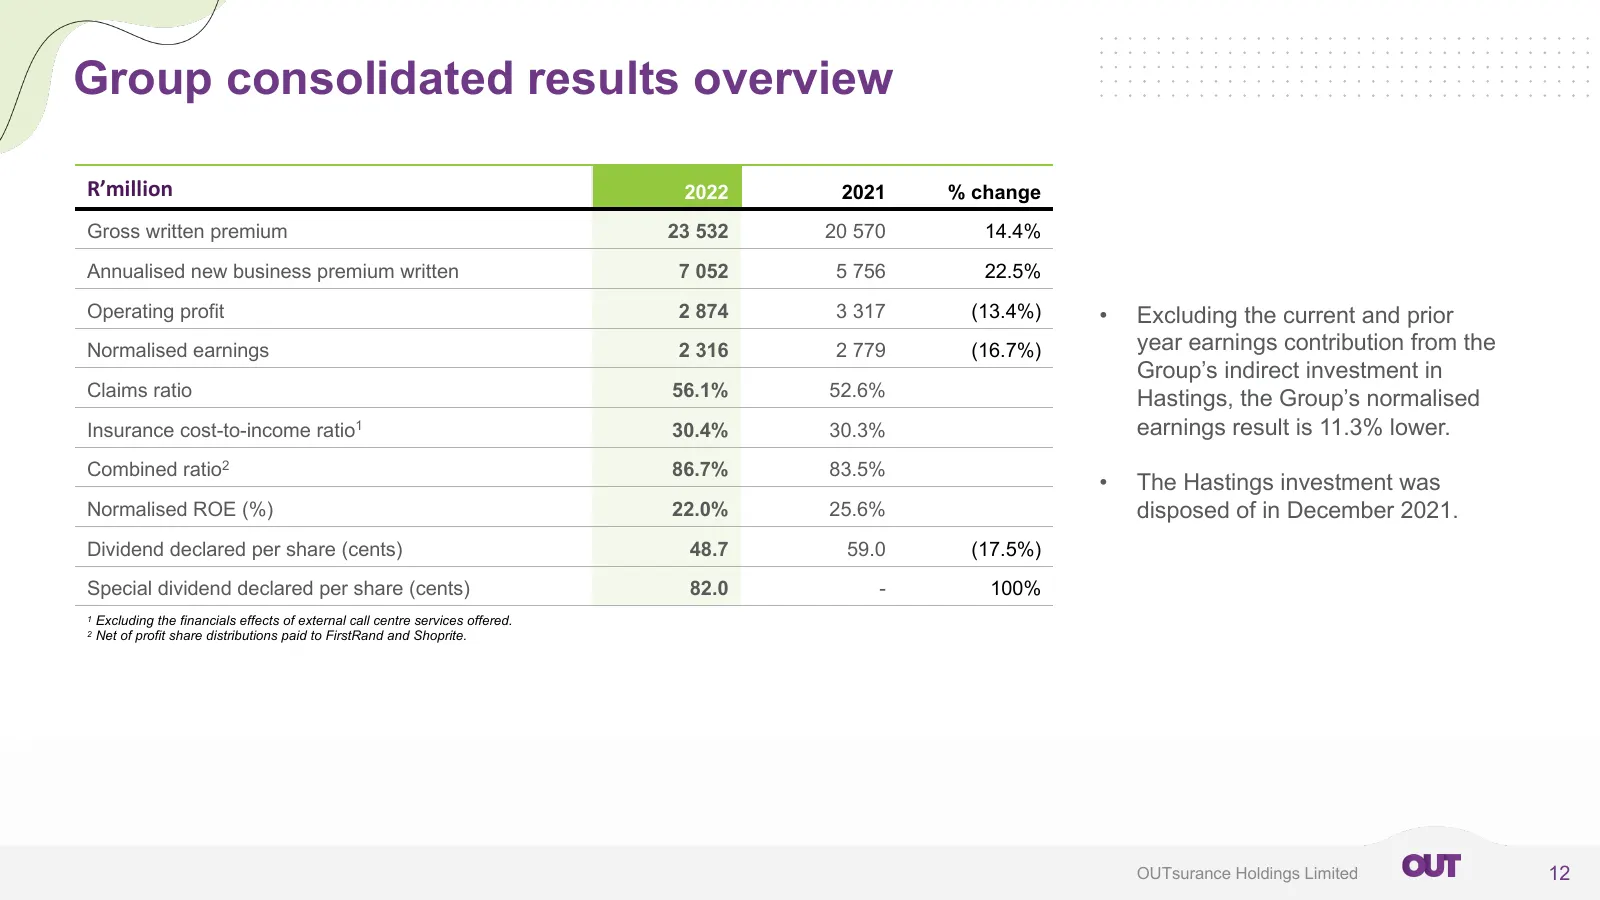
Group consolidated results overview R’million 2022 2021 % change Gross written premium 23 532 20 570 14.4% Annualised new business premium written 7 052 5 756 22.5% Operating profit 2 874 3 317 (13.4%) • Excluding the current and prior Normalised earnings 2 316 2 779 (16.7%) year earnings contributi
Slide 13: Group consolidated results overview – normalised earnings movement
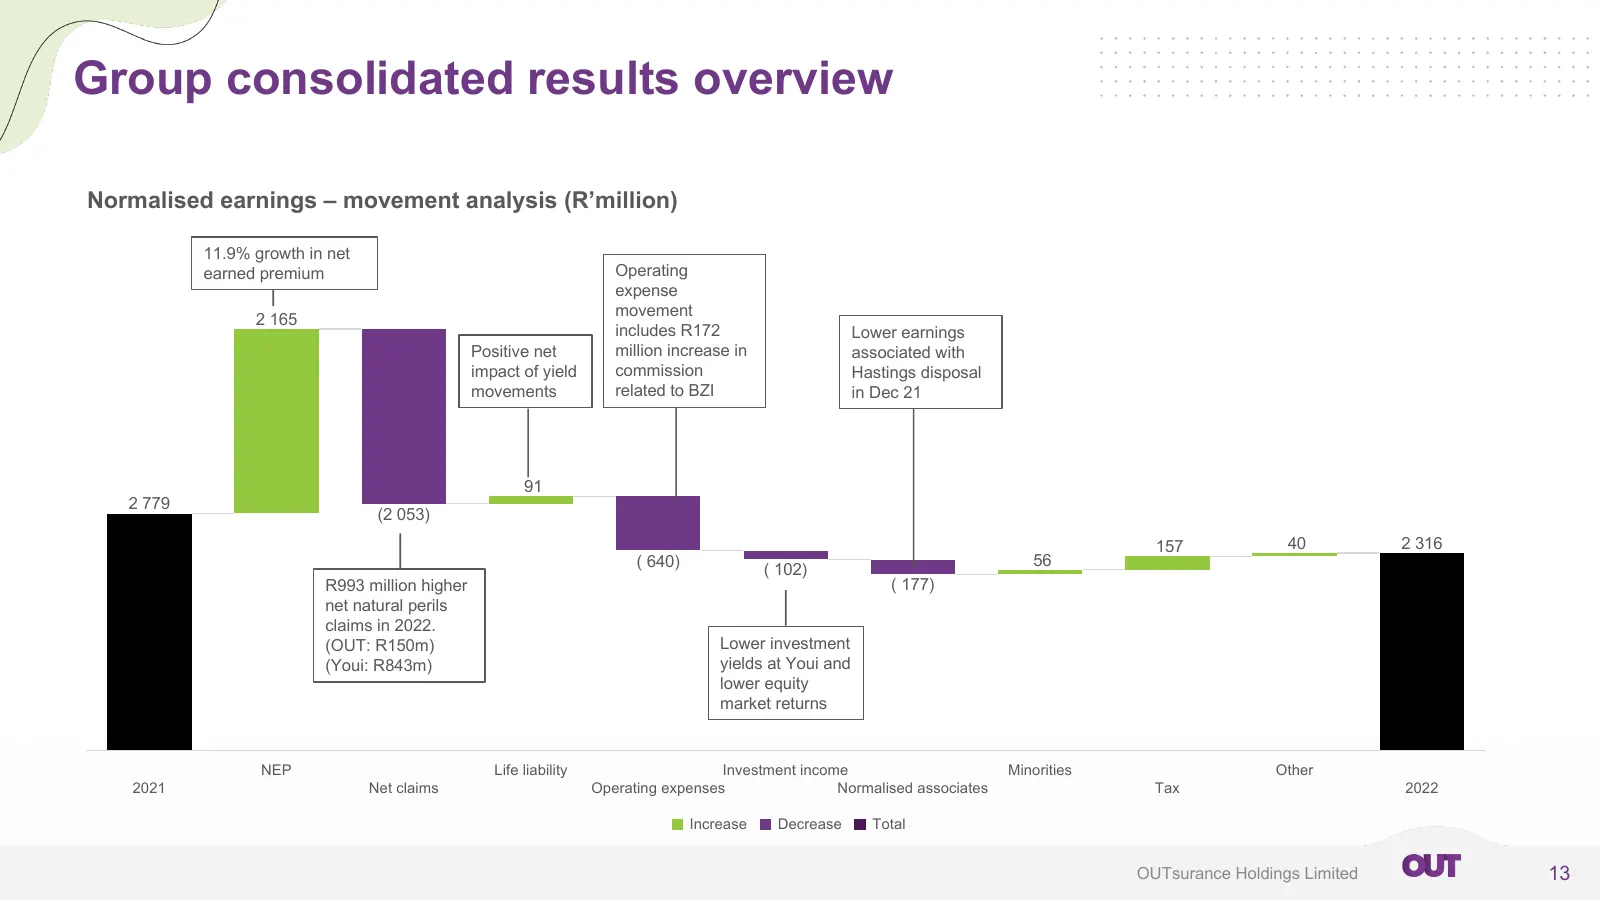
Group consolidated results overview Normalised earnings – movement analysis (R’million) 11.9% growth in net earned premium Operating expense movement 2 165 includes R172 Lower earnings Positive net million increase in associated with impact of yield commission Hastings disposal movements related to
Slide 14: Group consolidated results overview
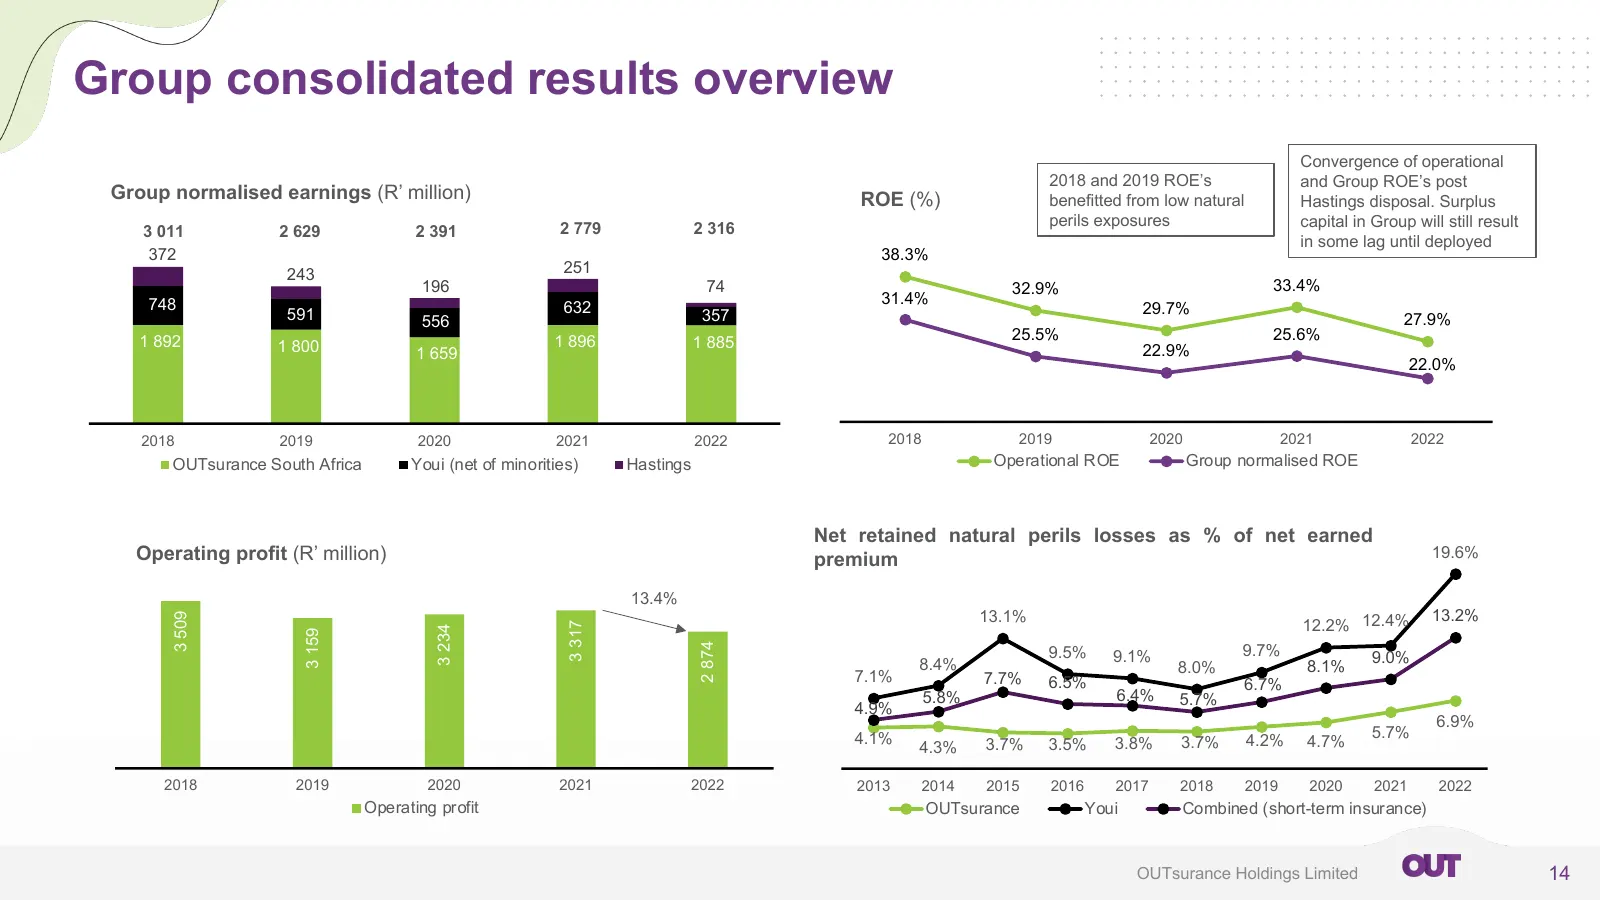
Group consolidated results overview Convergence of operational 2018 and 2019 ROE’s and Group ROE’s post Group normalised earnings (R’ million) ROE (%) benefitted from low natural Hastings disposal. Surplus 2 779 2 316 perils exposures capital in Group will still result 3 011 2 629 2 391 in some lag
Slide 15: Financial Review
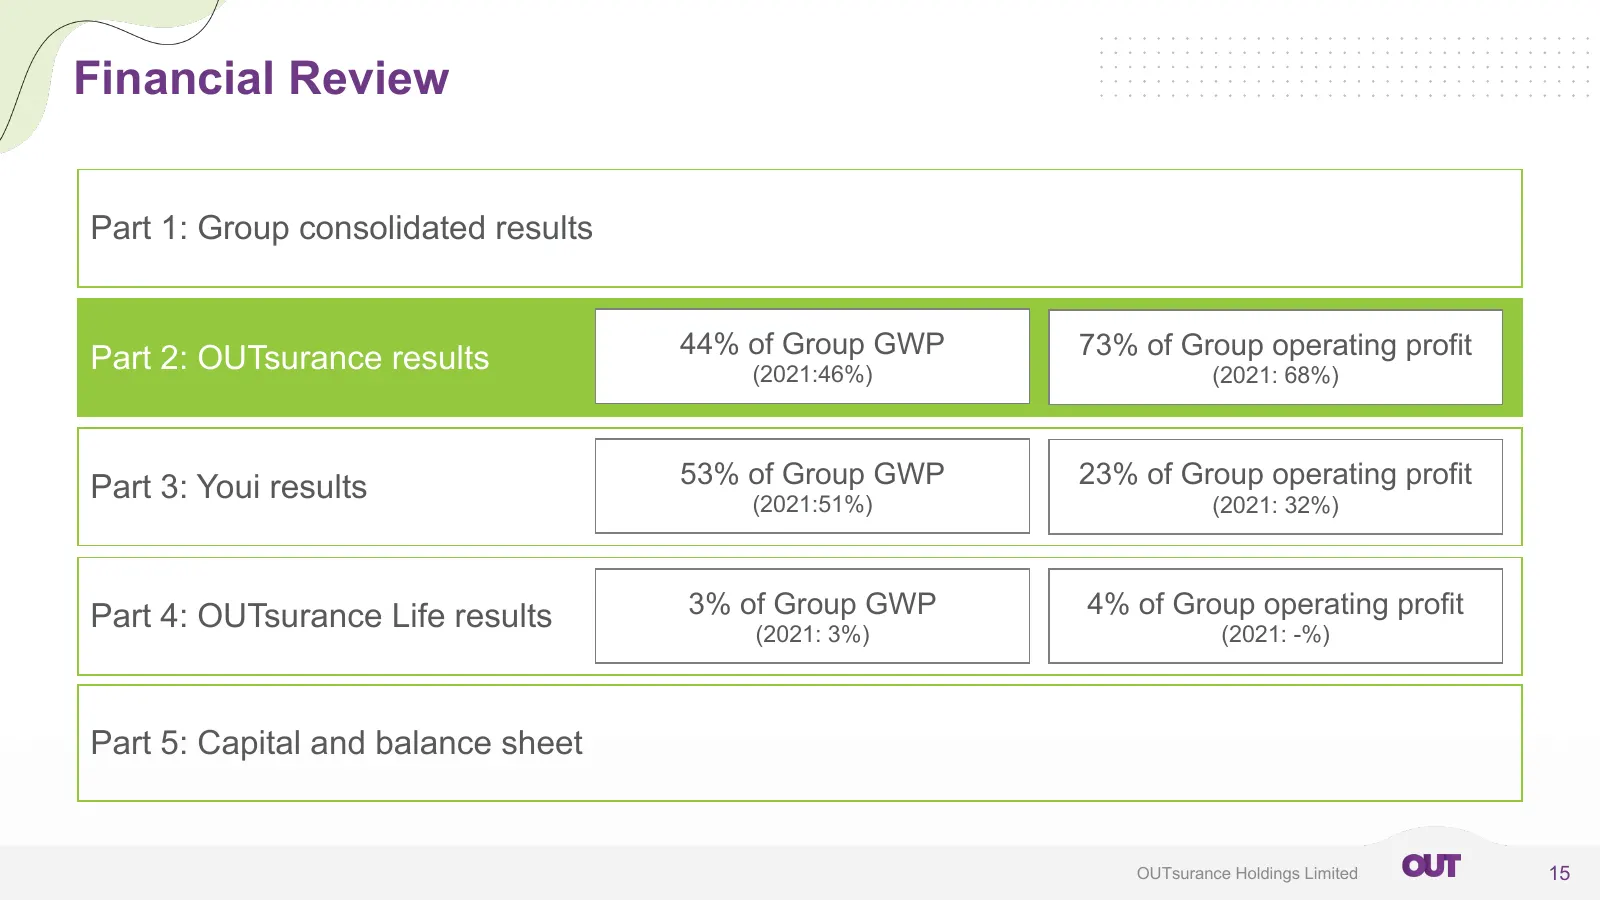
Financial Review Part 1: Group consolidated results 44% of Group GWP 73% of Group operating profit Part 2: OUTsurance results (2021:46%) (2021: 68%) Part 3: Youi results 53% of Group GWP 23% of Group operating profit (2021:51%) (2021: 32%) Part 4: OUTsurance Life results 3% of Group GWP 4% of Group
Slide 16: OUTsurance key financial outcomes
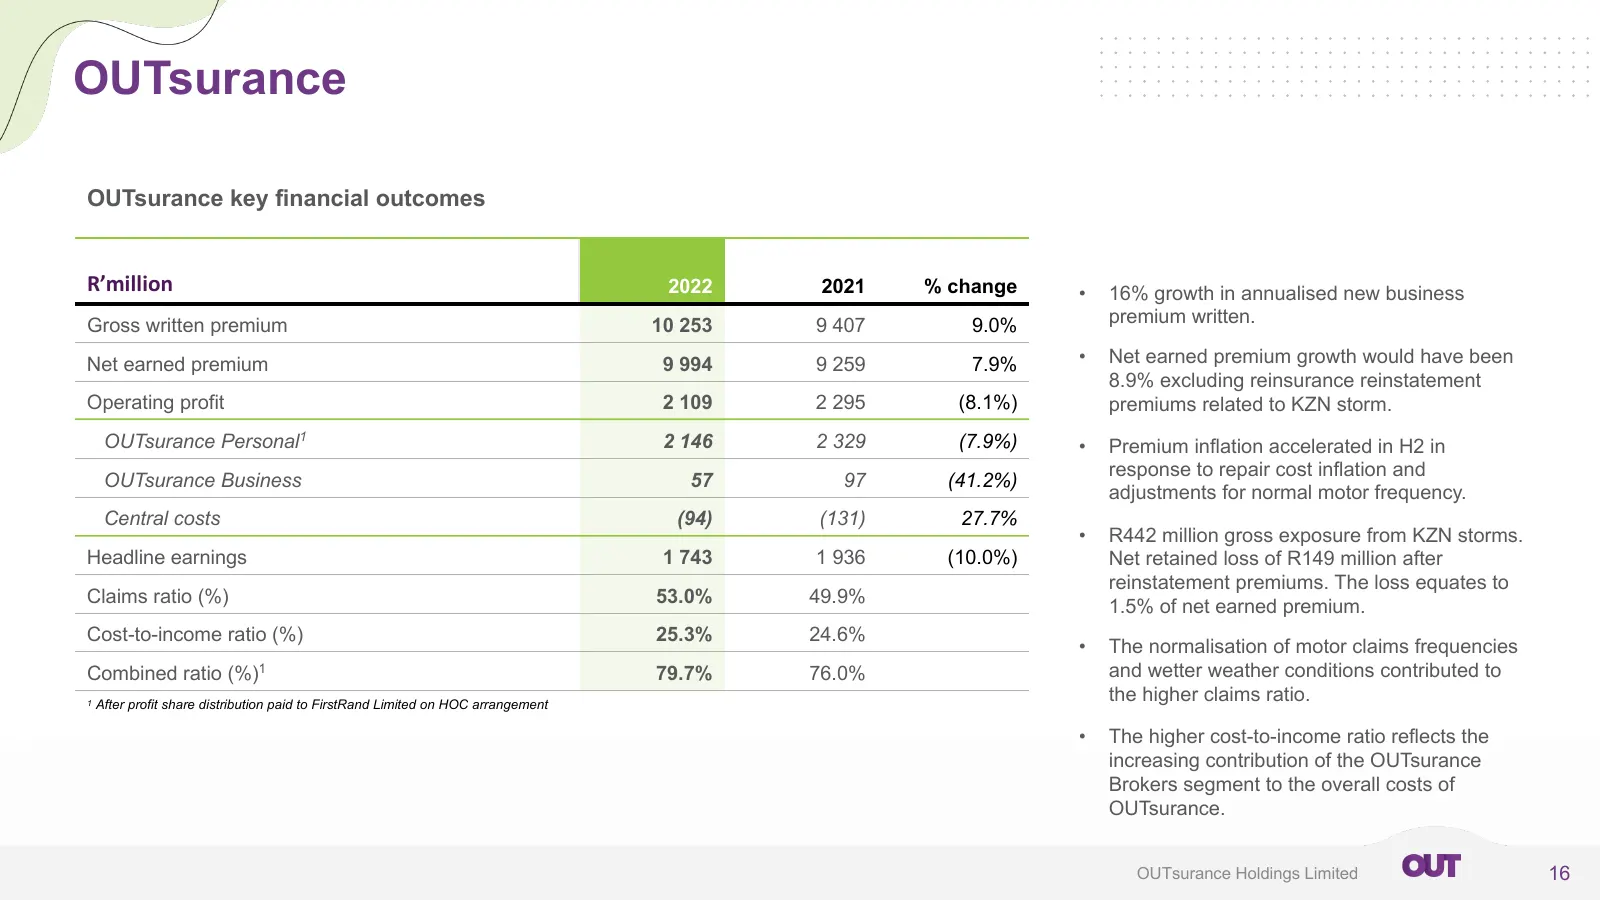
OUTsurance OUTsurance key financial outcomes R’million 2022 2021 % change • 16% growth in annualised new business Gross written premium 10 253 9 407 9.0% premium written. Net earned premium 9 994 9 259 7.9% • Net earned premium growth would have been 8.9% excluding reinsurance reinstatement Operatin
Slide 17: OUTsurance
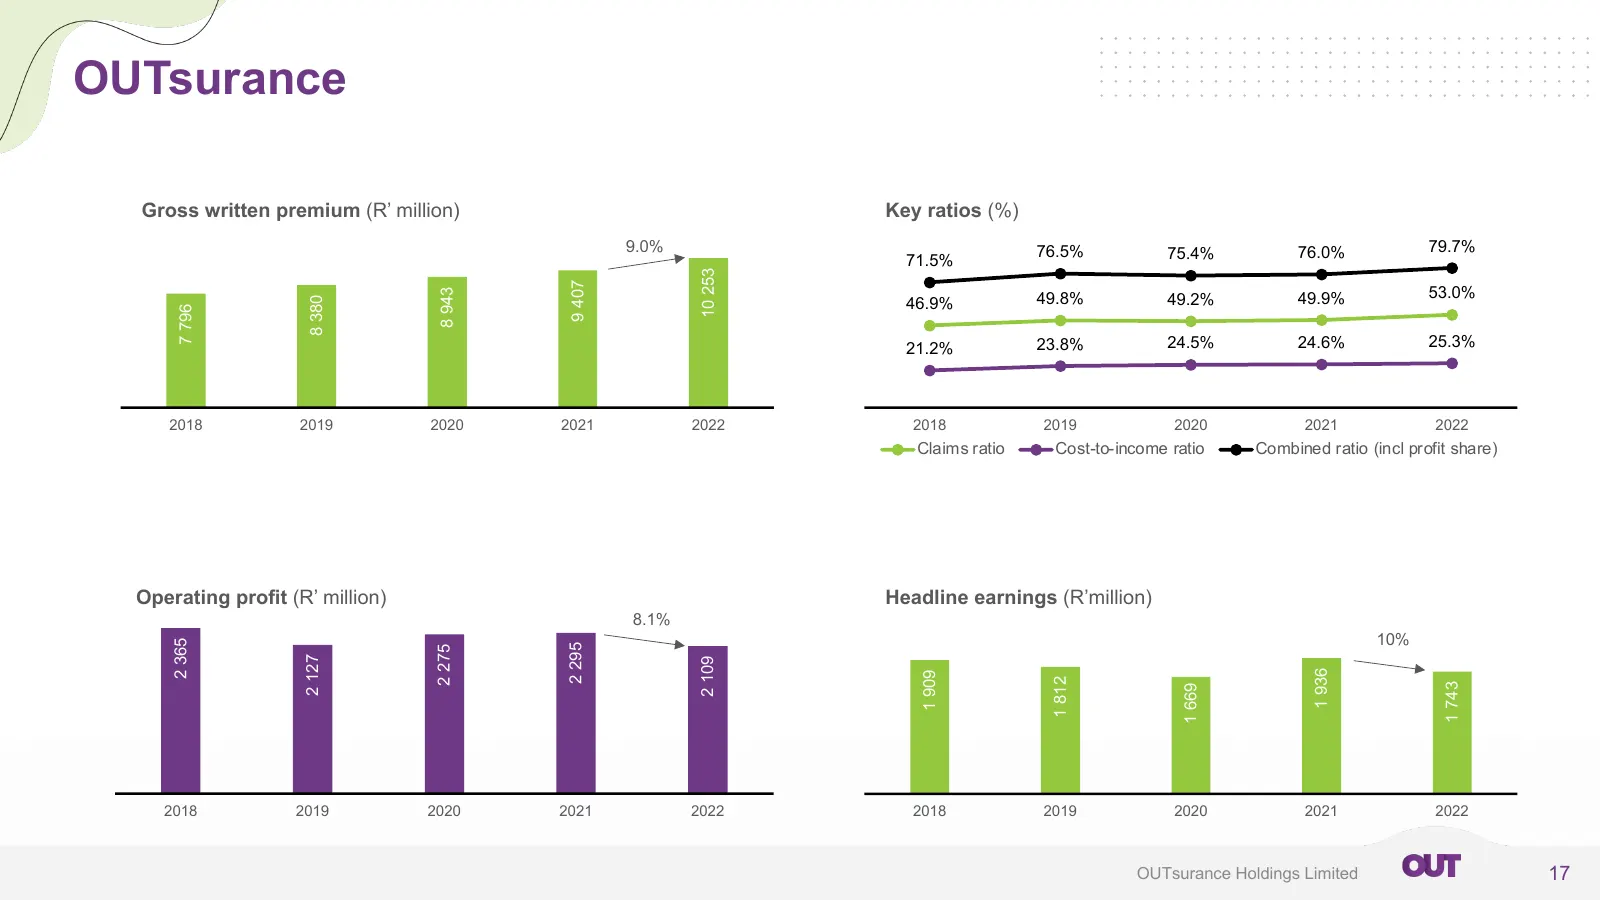
OUTsurance Gross written premium (R’ million) Key ratios (%) 9.0% 76.5% 75.4% 76.0% 79.7% 71.5% 10 253 9 407 53.0% 8 943 46.9% 49.8% 49.2% 49.9% 8 380 7 796 21.2% 23.8% 24.5% 24.6% 25.3% 2018 2019 2020 2021 2022 2018 2019 2020 2021 2022 Claims ratio Cost-to-income ratio Combined ratio (incl profit s
Slide 18: OUTsurance Personal key financial outcomes
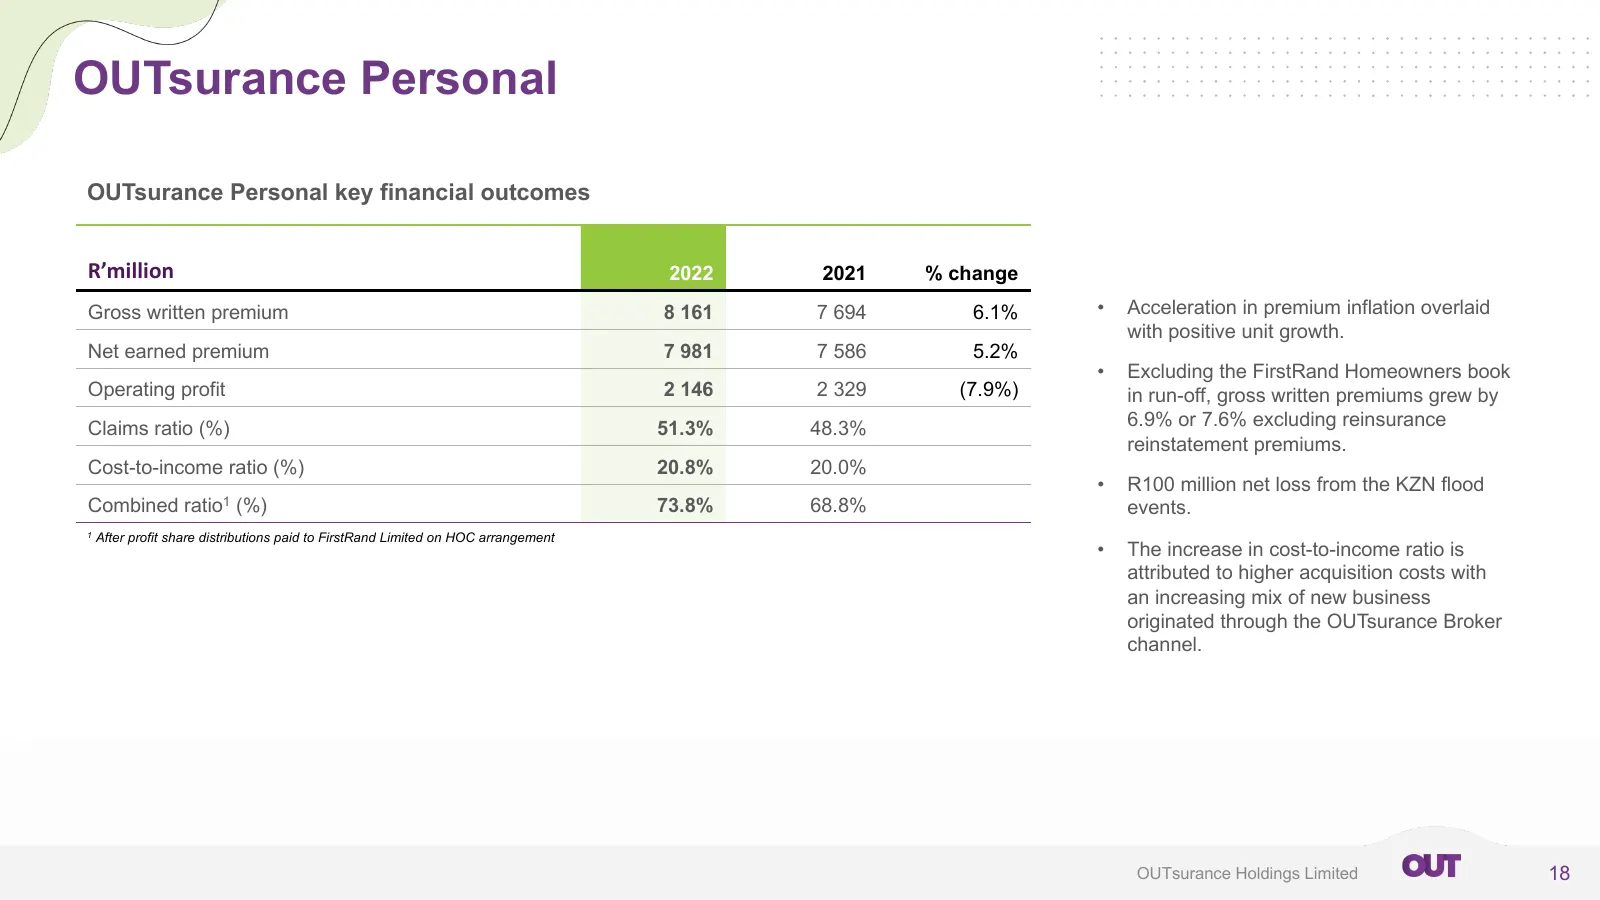
OUTsurance Personal OUTsurance Personal key financial outcomes R’million 2022 2021 % change Gross written premium 8 161 7 694 6.1% • Acceleration in premium inflation overlaid with positive unit growth. Net earned premium 7 981 7 586 5.2% • Excluding the FirstRand Homeowners book Operating profit 2
Slide 19: OUTsurance Personal
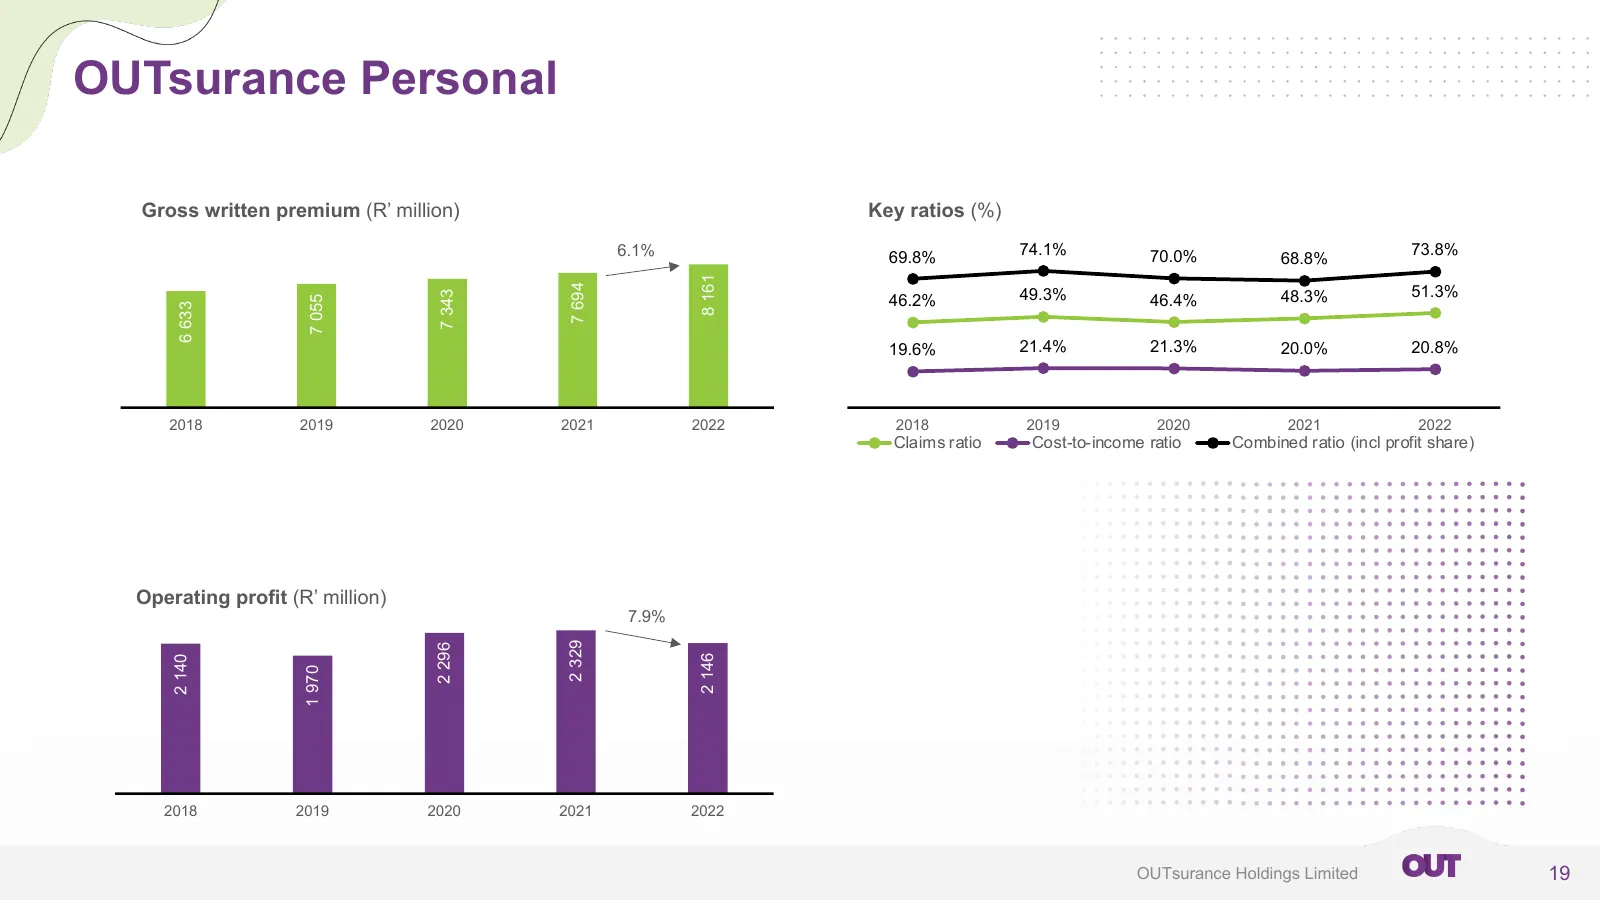
OUTsurance Personal Gross written premium (R’ million) Key ratios (%) 6.1% 69.8% 74.1% 70.0% 73.8% 68.8% 8 161 51.3% 7 694 49.3% 48.3% 7 343 46.2% 46.4% 7 055 6 633 19.6% 21.4% 21.3% 20.0% 20.8% 2018 2019 2020 2021 2022 2018 2019 2020 2021 2022 Claims ratio Cost-to-income ratio Combined ratio (incl
Slide 20: OUTsurance Business key financial outcomes
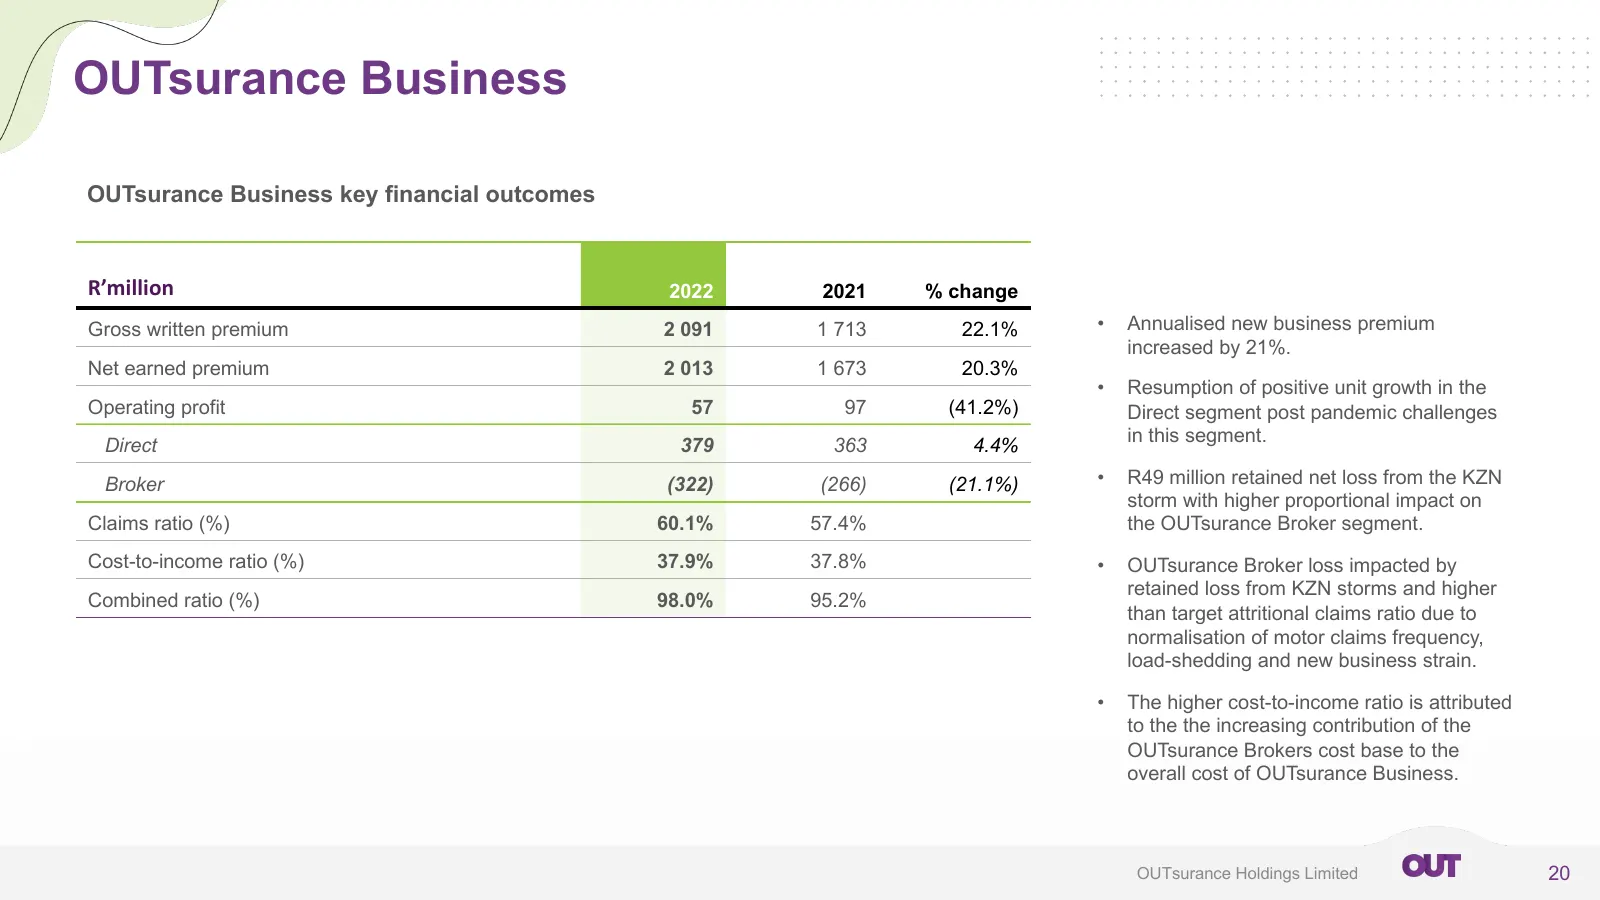
OUTsurance Business OUTsurance Business key financial outcomes R’million 2022 2021 % change Gross written premium 2 091 1 713 22.1% • Annualised new business premium increased by 21%. Net earned premium 2 013 1 673 20.3% • Resumption of positive unit growth in the Operating profit 57 97 (41.2%) Dire
Slide 21: OUTsurance Business
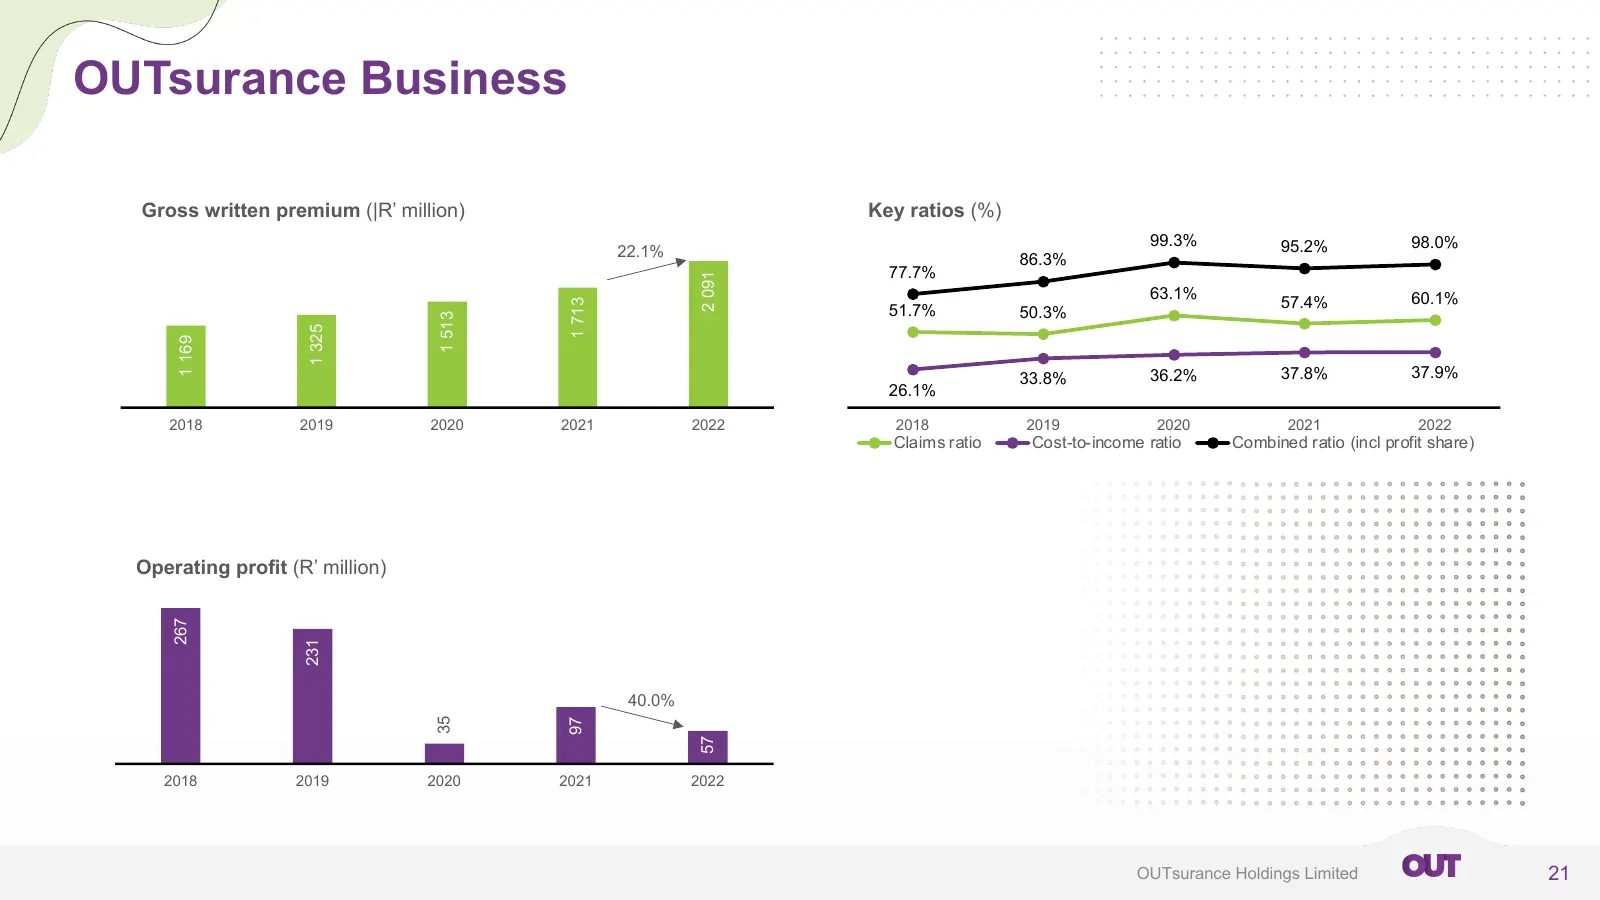
OUTsurance Business Gross written premium (|R’ million) Key ratios (%) 99.3% 95.2% 98.0% 22.1% 86.3% 77.7% 2 091 63.1% 60.1% 57.4% 1 713 51.7% 50.3% 1 513 1 325 1 169 33.8% 36.2% 37.8% 37.9% 26.1% 2018 2019 2020 2021 2022 2018 2019 2020 2021 2022 Claims ratio Cost-to-income ratio Combined ratio (inc
Slide 22: Financial Review
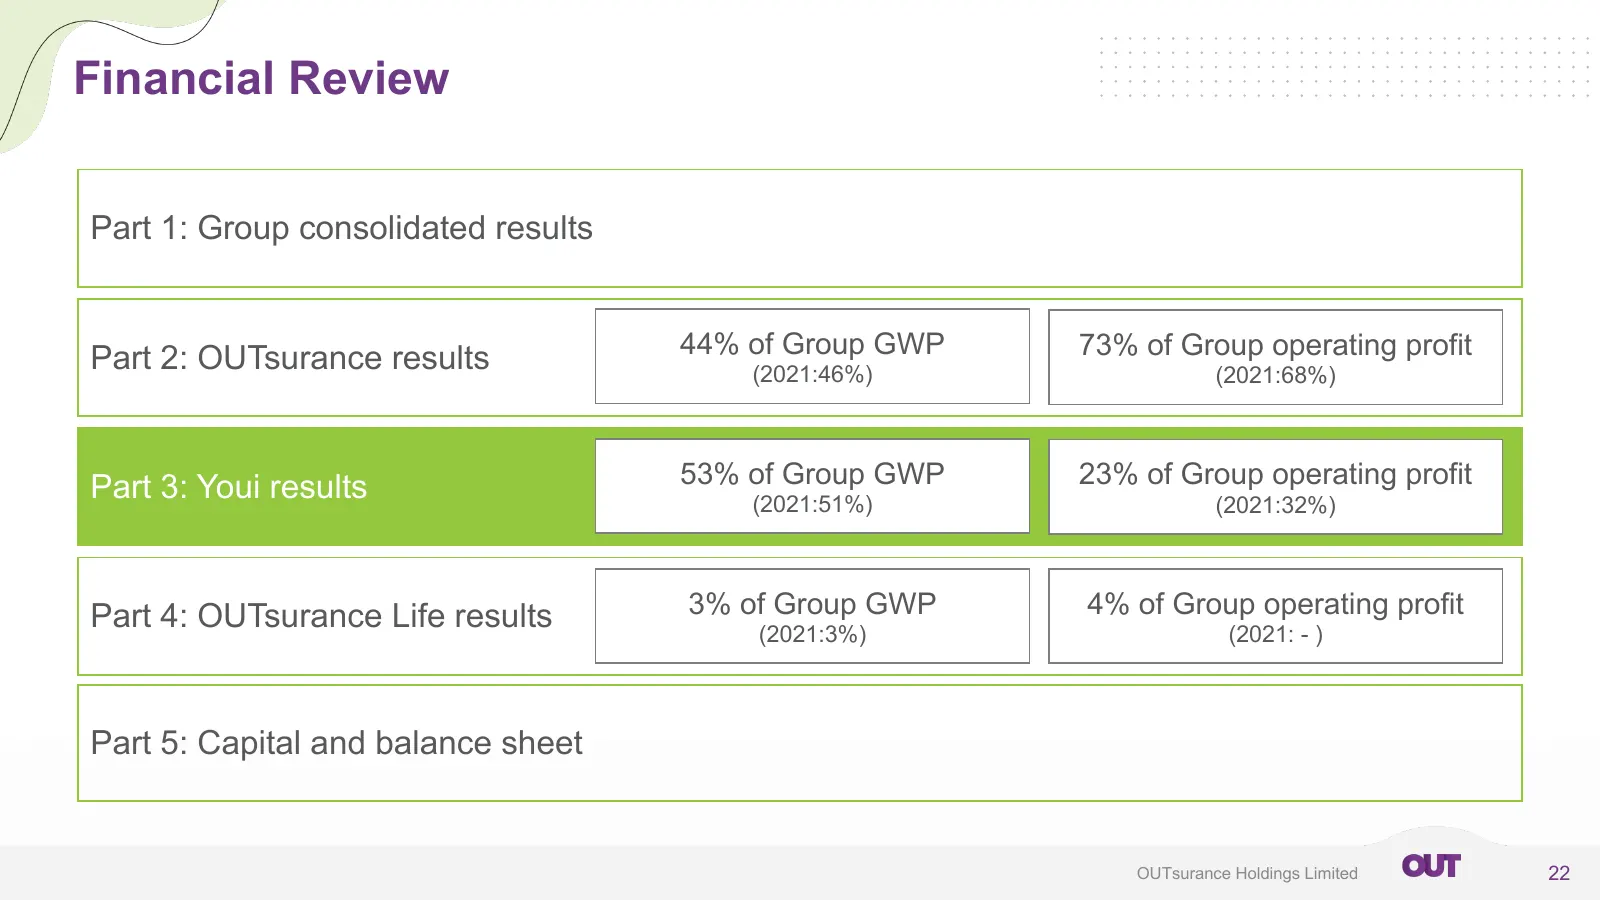
Financial Review Part 1: Group consolidated results 44% of Group GWP 73% of Group operating profit Part 2: OUTsurance results (2021:46%) (2021:68%) Part 3: Youi results 53% of Group GWP 23% of Group operating profit (2021:51%) (2021:32%) Part 4: OUTsurance Life results 3% of Group GWP 4% of Group op
Slide 23: Youi Australia key financial outcomes
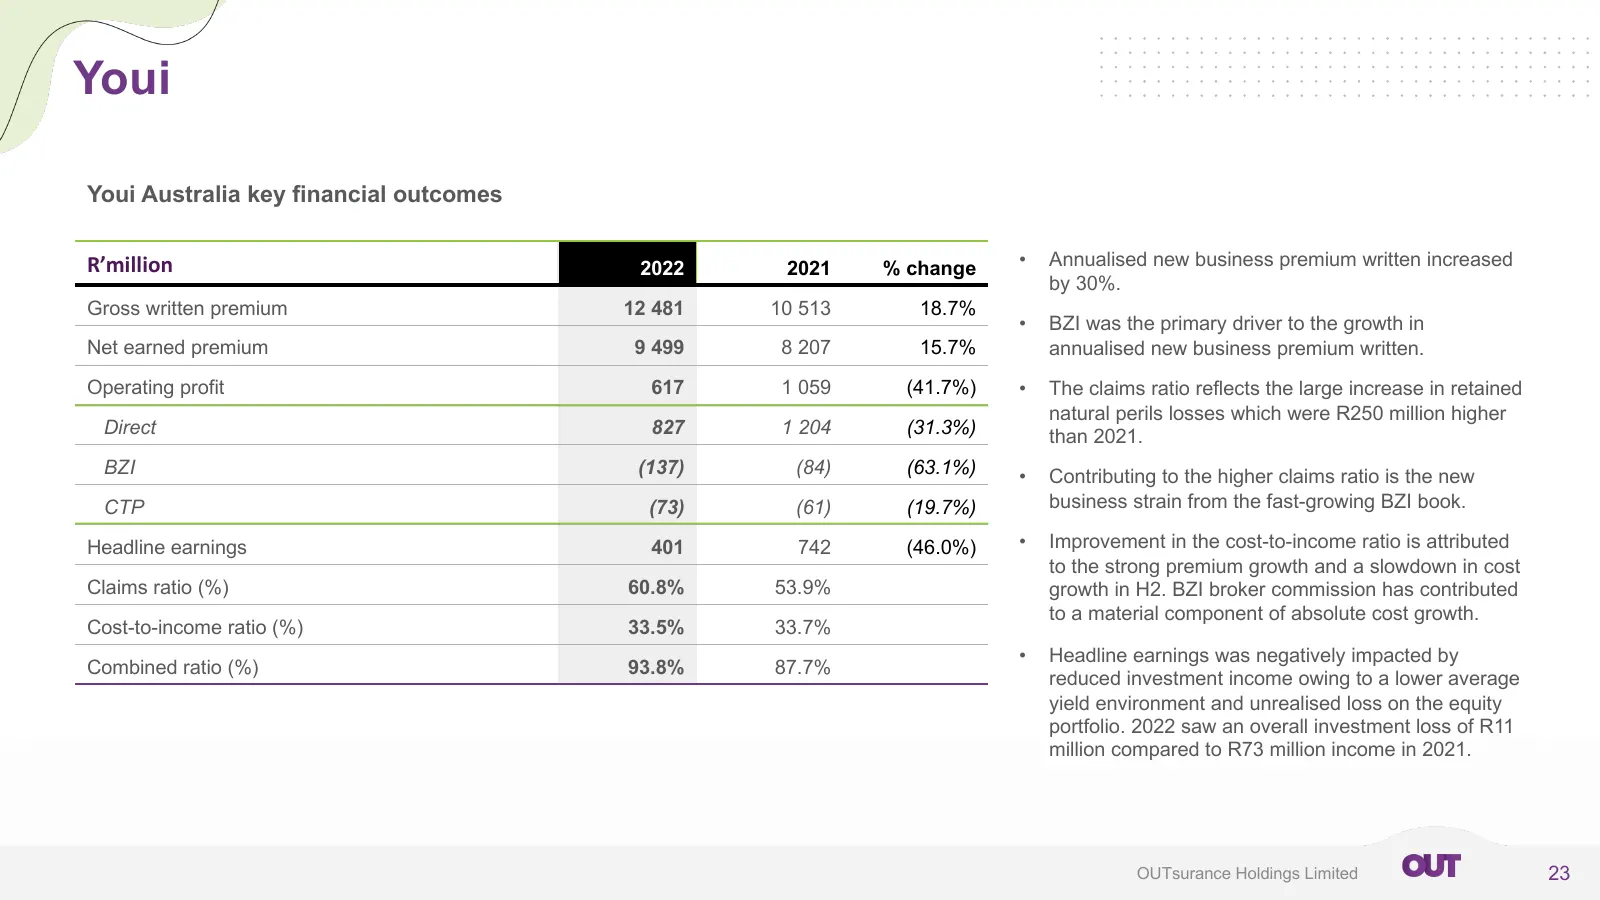
Youi Youi Australia key financial outcomes R’million 2022 2021 % change • Annualised new business premium written increased by 30%. Gross written premium 12 481 10 513 18.7% • BZI was the primary driver to the growth in Net earned premium 9 499 8 207 15.7% annualised new business premium written. Op
Slide 24: Youi Australia
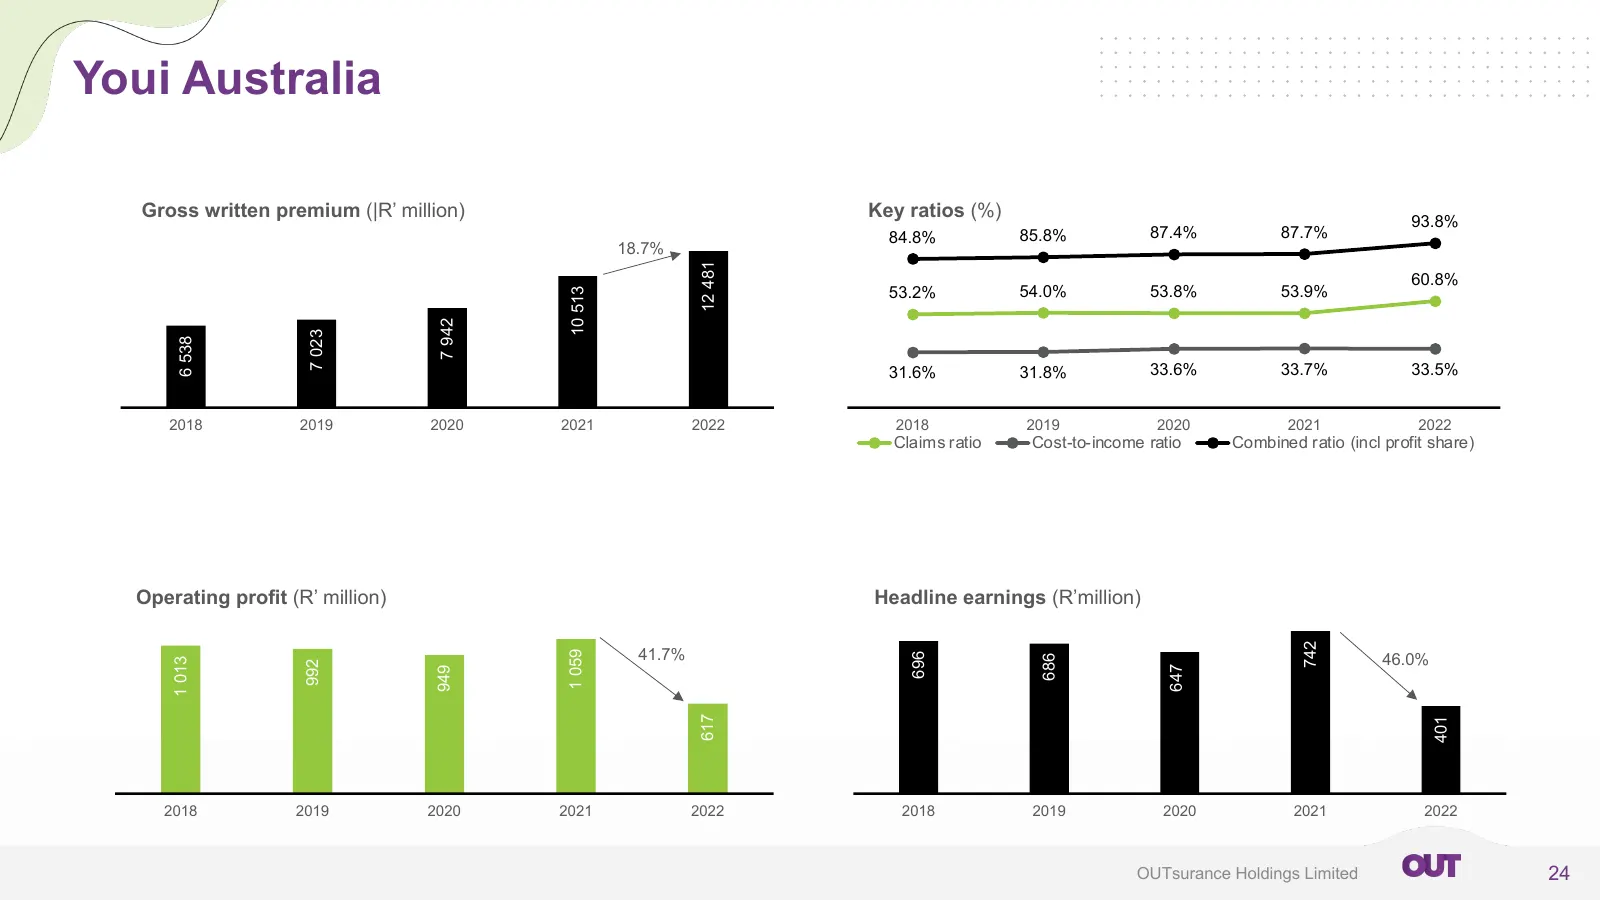
Youi Australia Gross written premium (|R’ million) Key ratios (%) 93.8% 84.8% 85.8% 87.4% 87.7% 18.7% 12 481 60.8% 53.2% 54.0% 53.8% 53.9% 10 513 7 942 7 023 6 538 31.6% 31.8% 33.6% 33.7% 33.5% 2018 2019 2020 2021 2022 2018 2019 2020 2021 2022 Claims ratio Cost-to-income ratio Combined ratio (incl p
Slide 25: Financial Review
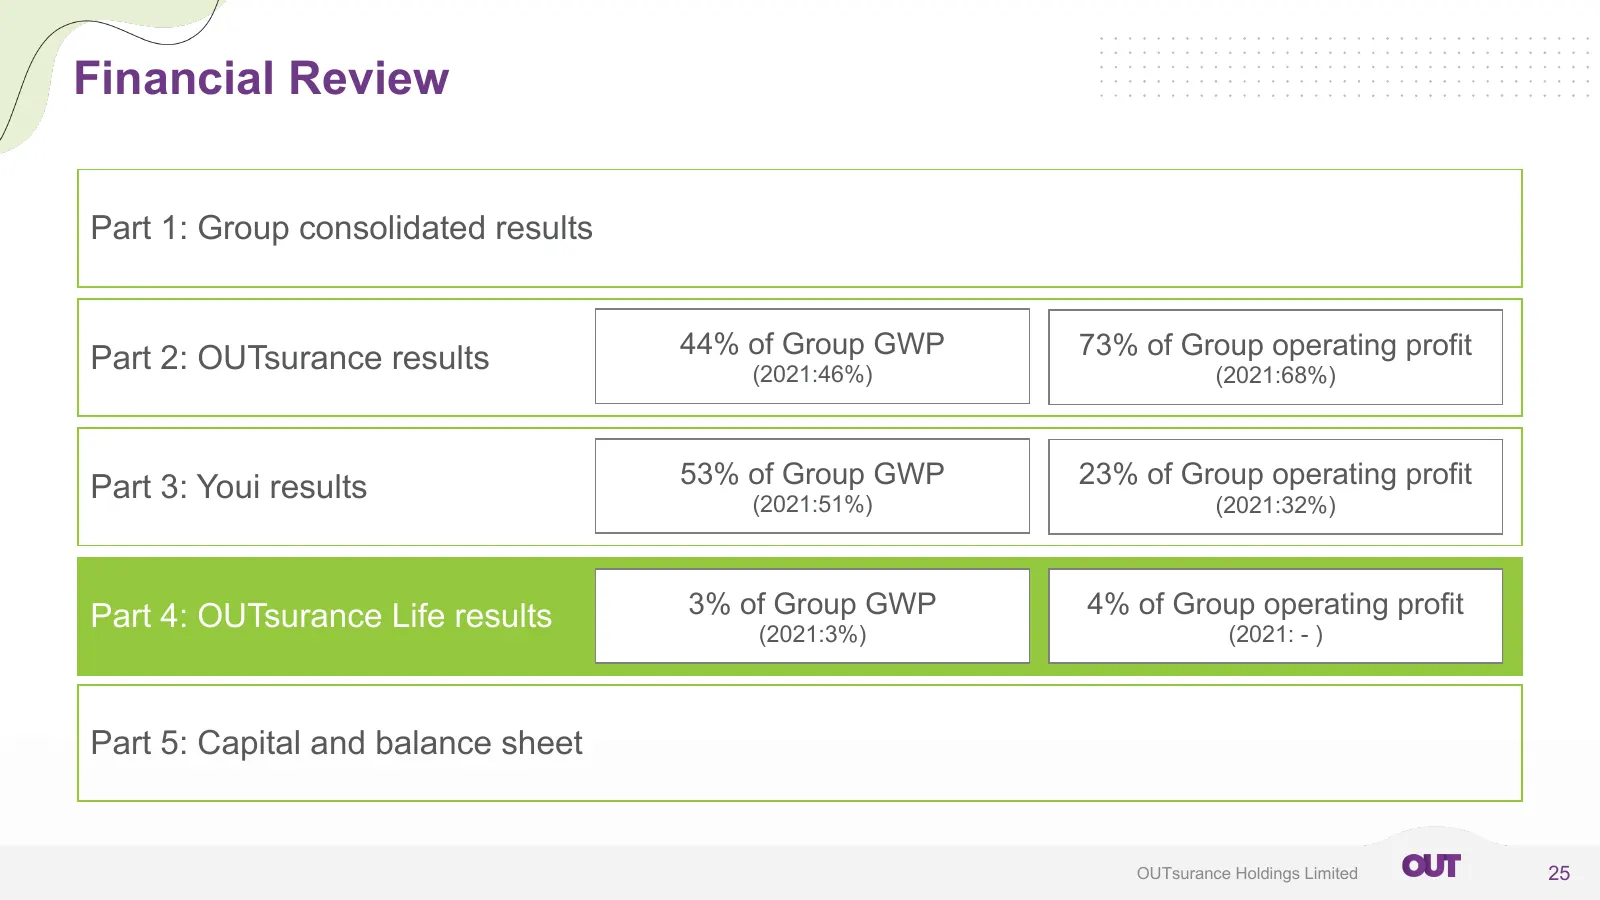
Financial Review Part 1: Group consolidated results 44% of Group GWP 73% of Group operating profit Part 2: OUTsurance results (2021:46%) (2021:68%) Part 3: Youi results 53% of Group GWP 23% of Group operating profit (2021:51%) (2021:32%) Part 4: OUTsurance Life results 3% of Group GWP 4% of Group op
Slide 26: OUTsurance Life
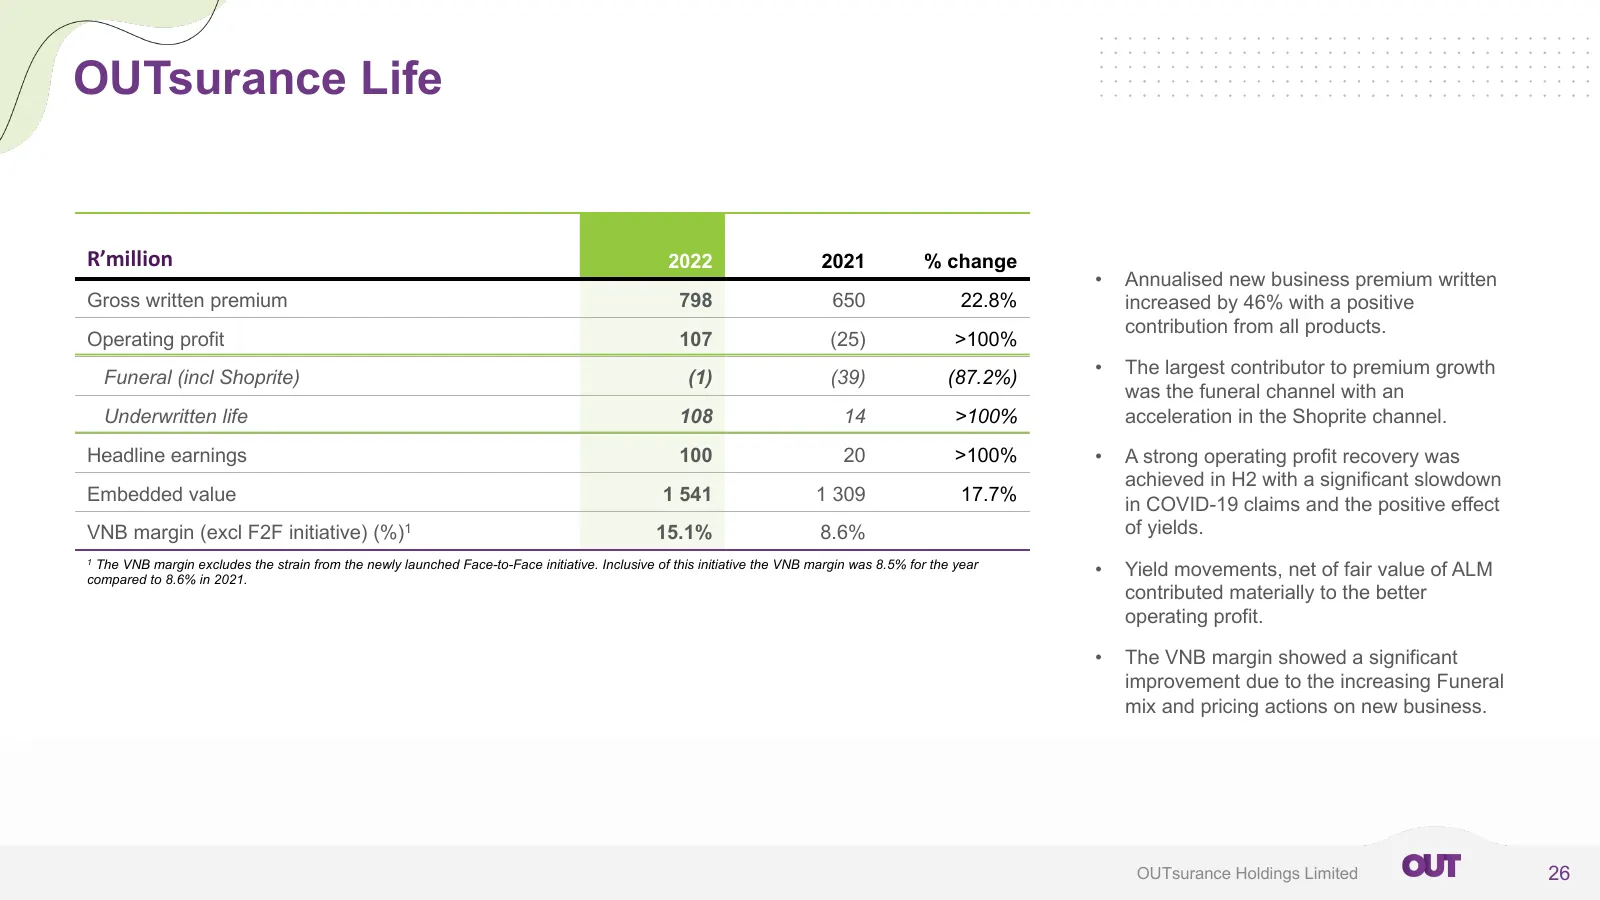
OUTsurance Life R’million 2022 2021 % change • Annualised new business premium written Gross written premium 798 650 22.8% increased by 46% with a positive contribution from all products. Operating profit 107 (25) >100% Funeral (incl Shoprite) (1) (39) (87.2%) • The largest contributor to premium gr
Slide 27: OUTsurance Life
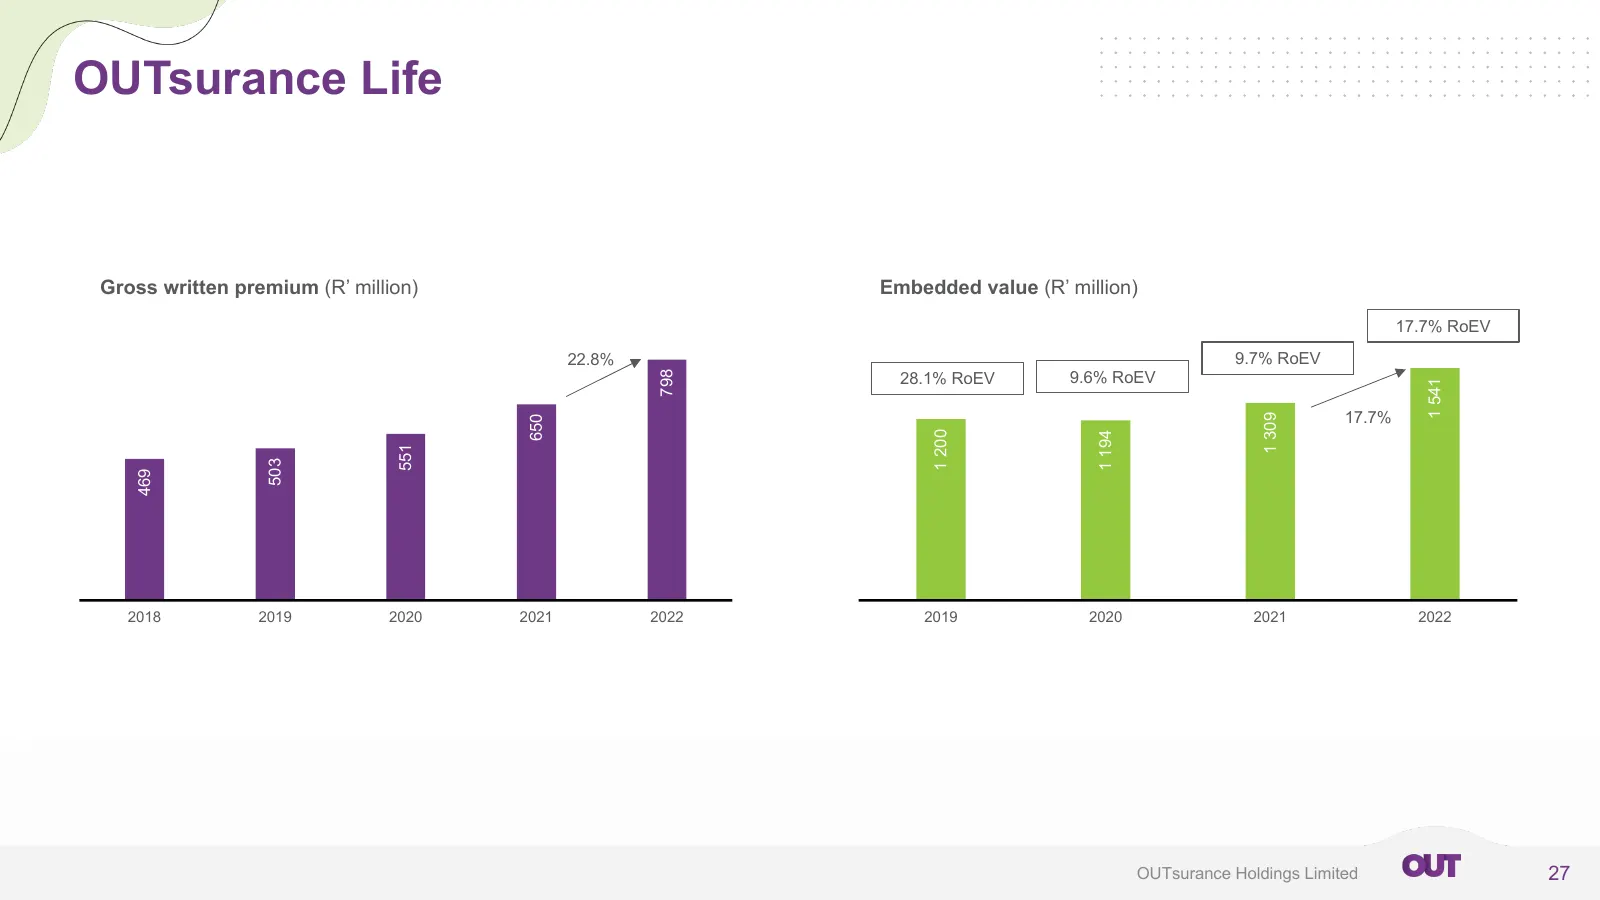
OUTsurance Life Gross written premium (R’ million) Embedded value (R’ million) 17.7% RoEV 22.8% 9.7% RoEV 9.6% RoEV 798 28.1% RoEV 1 541 17.7% 1 309 650 1 200 1 194 551 503 469 2018 2019 2020 2021 2022 2019 2020 2021 2022 OUTsurance Holdings Limited 27
Slide 28: Financial Review
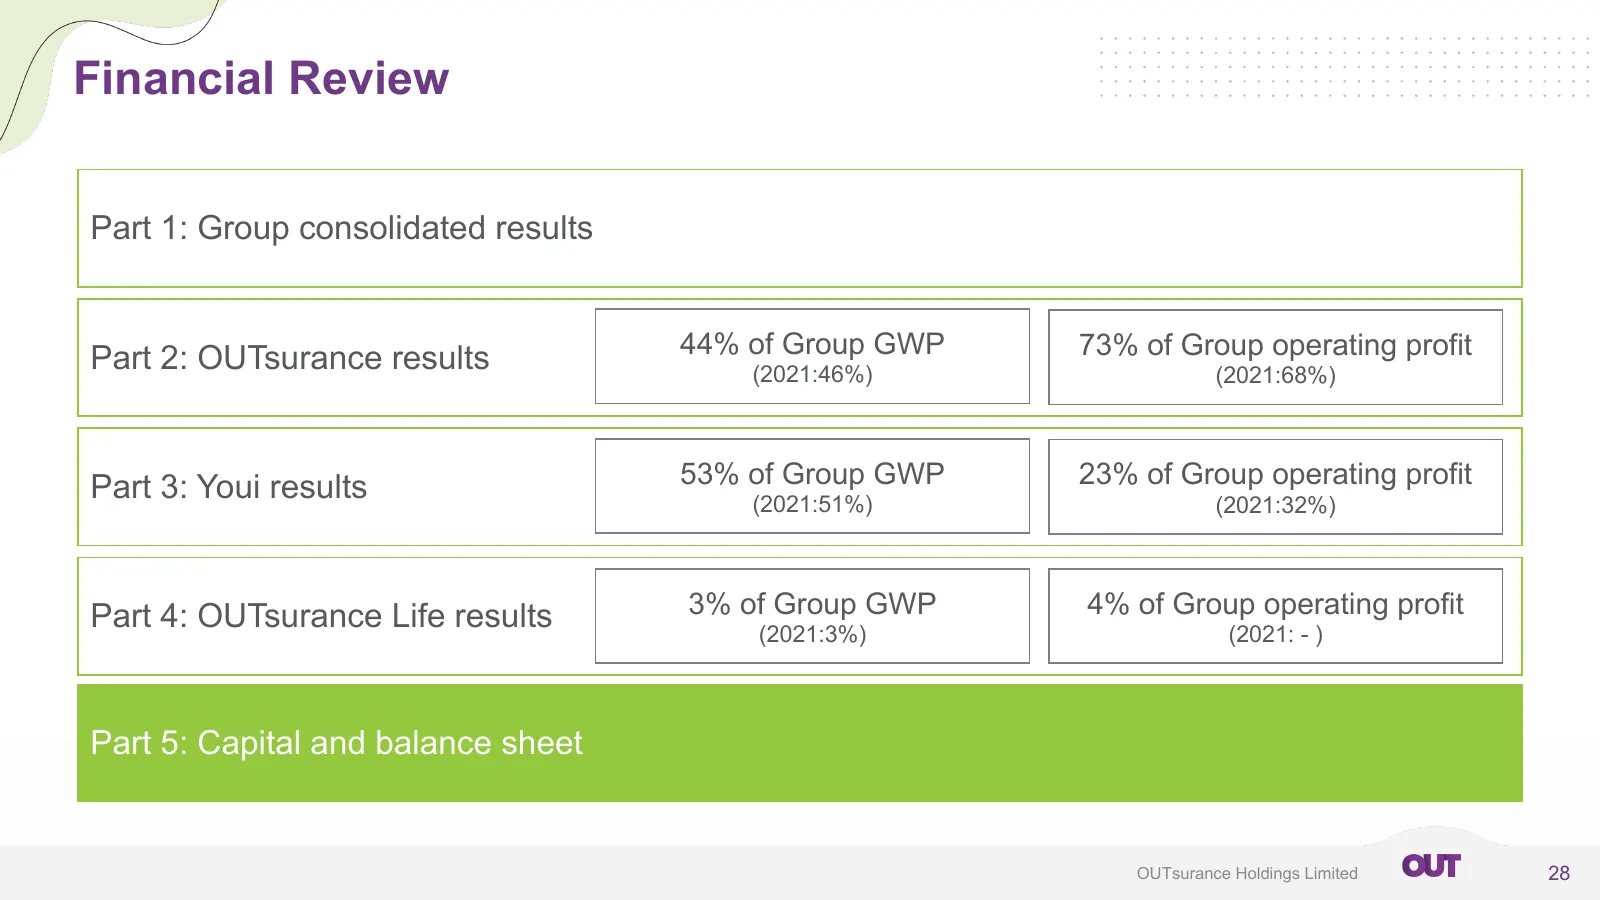
Financial Review Part 1: Group consolidated results 44% of Group GWP 73% of Group operating profit Part 2: OUTsurance results (2021:46%) (2021:68%) Part 3: Youi results 53% of Group GWP 23% of Group operating profit (2021:51%) (2021:32%) Part 4: OUTsurance Life results 3% of Group GWP 4% of Group op
Slide 29: Capital and balance sheet – solvency ratios
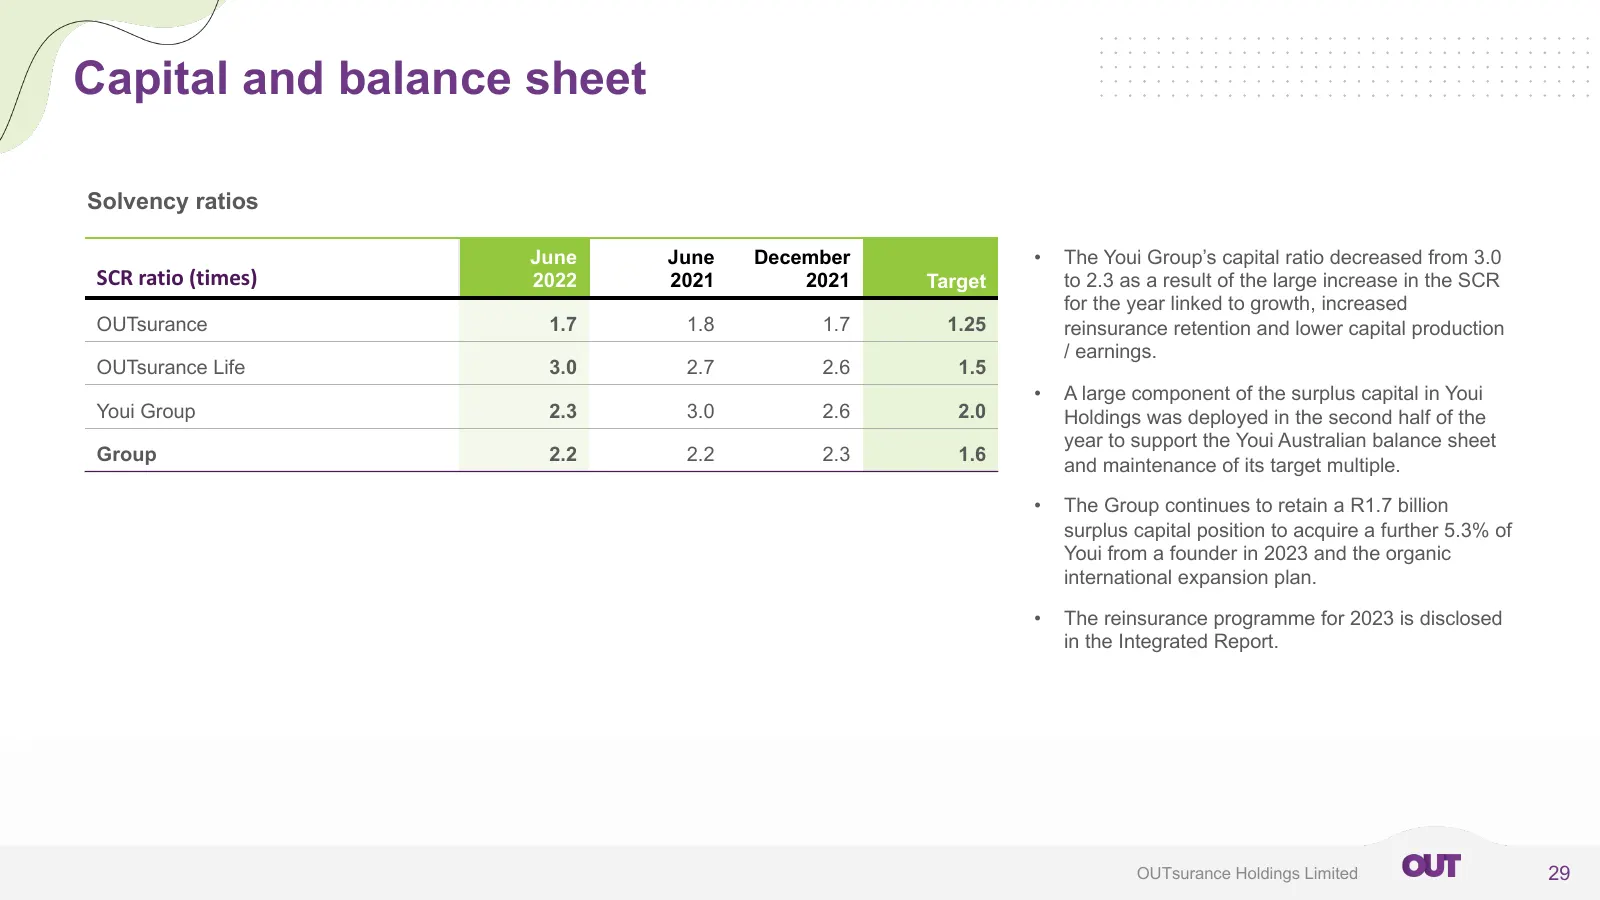
Capital and balance sheet Solvency ratios June June December • The Youi Group’s capital ratio decreased from 3.0 SCR ratio (times) 2022 2021 2021 Target to 2.3 as a result of the large increase in the SCR for the year linked to growth, increased OUTsurance 1.7 1.8 1.7 1.25 reinsurance retention and
Slide 30: Capital and balance sheet – dividend per share
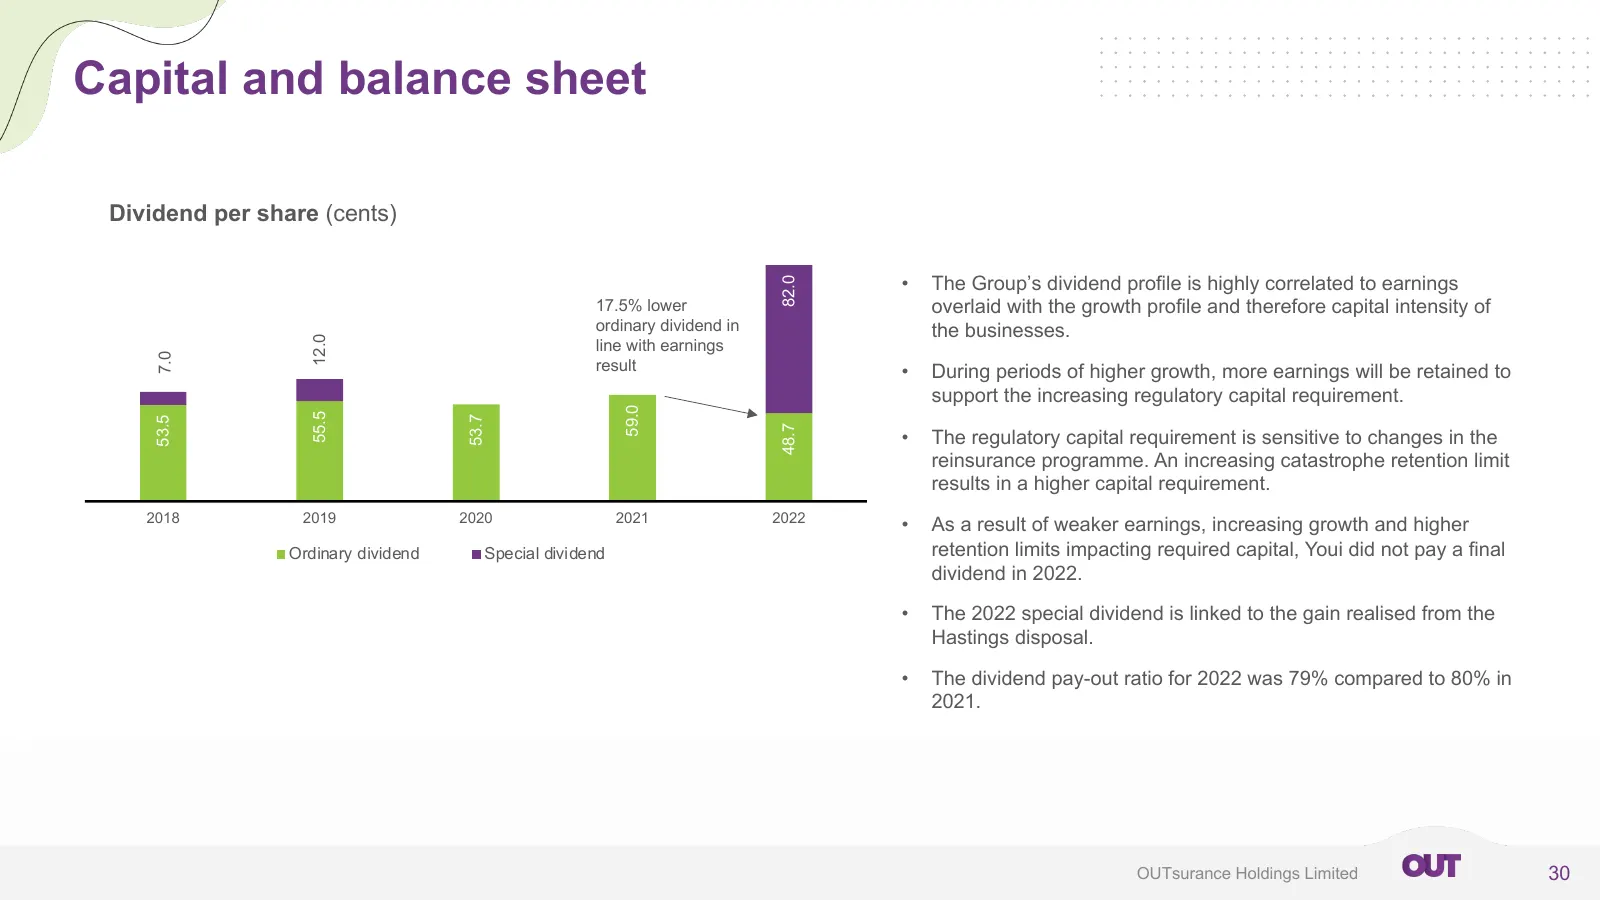
Capital and balance sheet Dividend per share (cents) • The Group’s dividend profile is highly correlated to earnings 82.0 17.5% lower overlaid with the growth profile and therefore capital intensity of 12.0 ordinary dividend in the businesses. line with earnings 7.0 result • During periods of higher

Slide 31: Outlook
Outlook You always get something out.
Slide 32: Group outlook
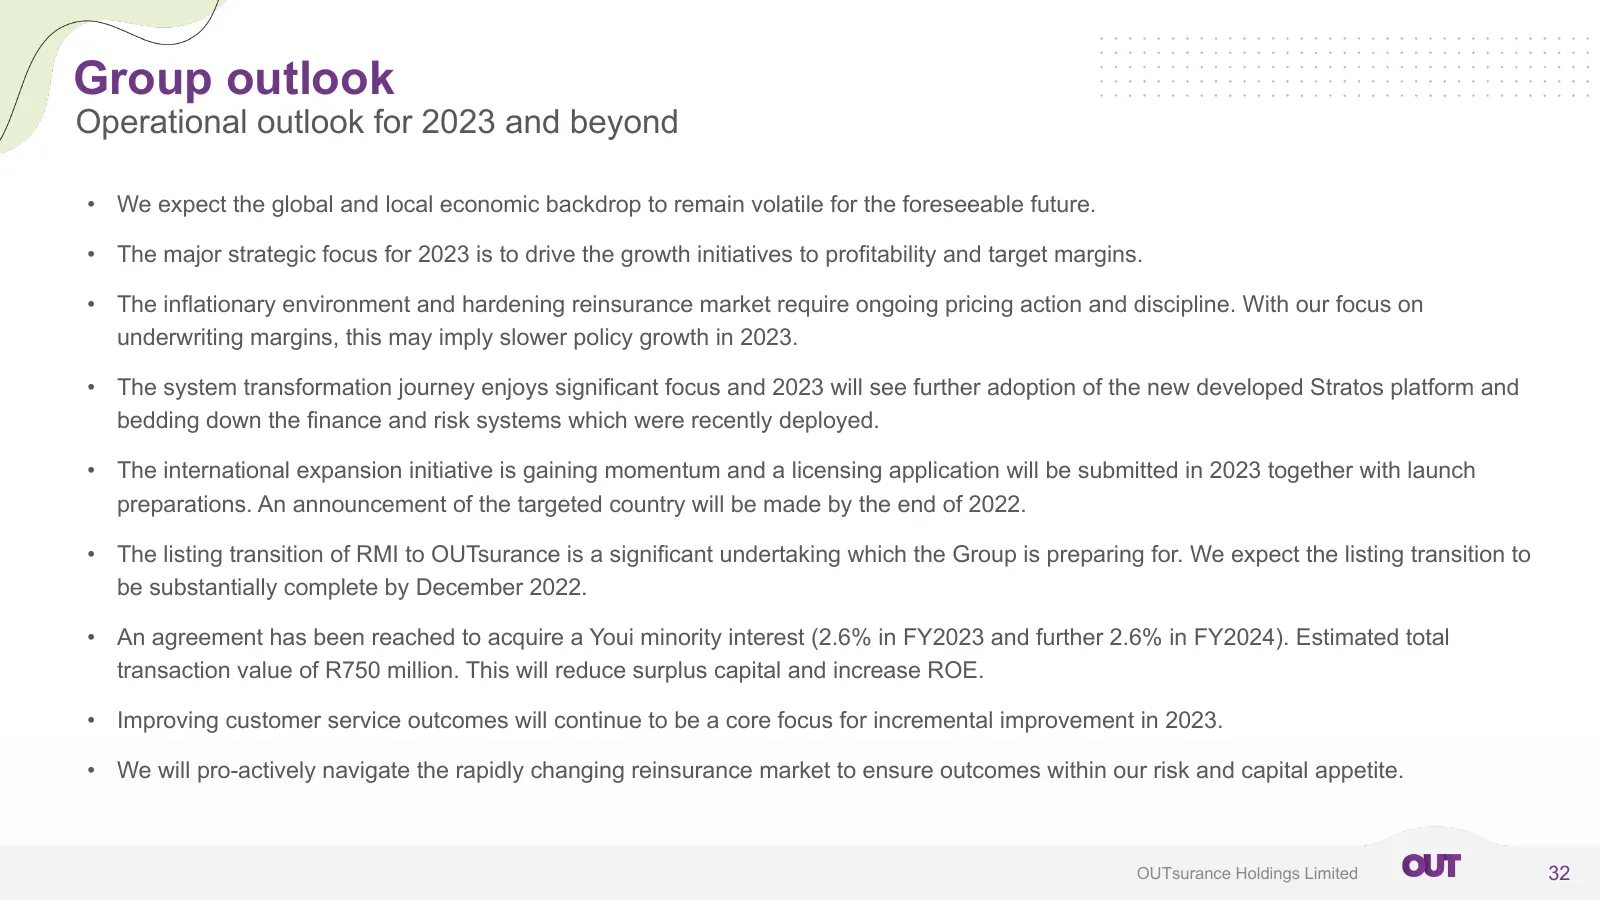
Group outlook Operational outlook for 2023 and beyond • We expect the global and local economic backdrop to remain volatile for the foreseeable future. • The major strategic focus for 2023 is to drive the growth initiatives to profitability and target margins. • The inflationary environment and hard

Slide 33: Thank you
Thank you Contact: InvestorRelations@out.co.za www.outsurance.co.za/group
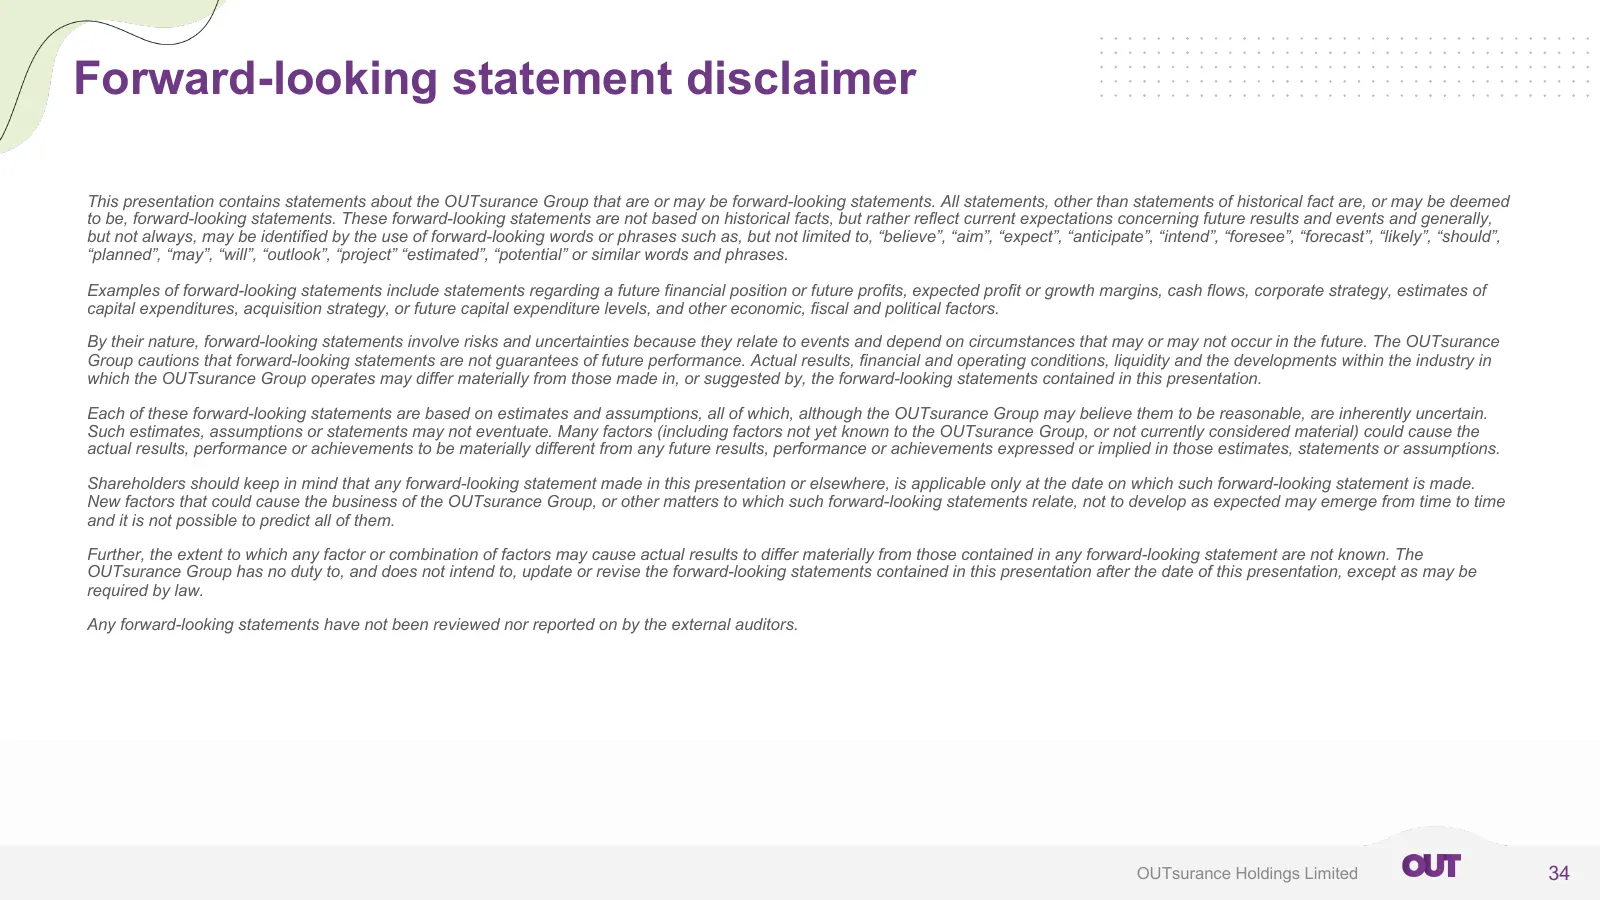
Slide 34: Forward-looking statement disclaimer
Forward-looking statement disclaimer This presentation contains statements about the OUTsurance Group that are or may be forward-looking statements. All statements, other than statements of historical fact are, or may be deemed to be, forward-looking statements. These forward-looking statements are
Source: Internet Archive copy of group.outsurance.co.za
More decks from OUTsurance Group Limited
 FY2026 Earnings Presentation46 slides · June 2026
 FY2025 Earnings Presentation46 slides · Sep 14, 2025
 H1 FY2025 Earnings Presentation43 slides · March 2025
 H1 2024 Earnings Presentation31 slides · February 2024
 FY2024 Earnings Presentation40 slides · 2024
 FY2023 Earnings Presentation37 slides · June 2023