Arcosa, Inc. · NYSE:ACA
Arcosa — Investor Presentation (March 2024)
35 slides from Arcosa's investor presentation, March 2024

Slide 1: Investor Presentation
INVESTOR PRESENTATION MOVING INFRASTRUCTURE FORWARD | MARCH 2024
Slide 2: Forward Looking Statements
FORWARD LOOKING STATEMENTS Some statements in this presentation, which are not historical facts, are “forward-looking statements” as defined by the Private Securities Litigation Reform Act of 1995. Forward-looking statements include statements about Arcosa’s estimates, expectations, beliefs, intenti
Slide 3: Table of Contents
TABLE OF CONTENTS 01 02 03 04 OVERVIEW RECENT FINANCIAL ESG 2024 OUTLOOK HIGHLIGHTS ACCOMPLISHMENTS 3 I MOVING INFRASTRUCTURE FORWARD I 2024
Slide 4: How to Find Us
HOW TO FIND US OUR WEBSITE NYSE TICKER www.arcosa.com ACA HEADQUARTERS Arcosa, Inc. INVESTOR CONTACT 500 North Akard Street, Suite 400 InvestorResources@arcosa.com Dallas, TX 75201 4 I MOVING INFRASTRUCTURE FORWARD I 2024

Slide 5: Overview
01 OVERVIEW
Slide 6: Arcosa's Value Proposition
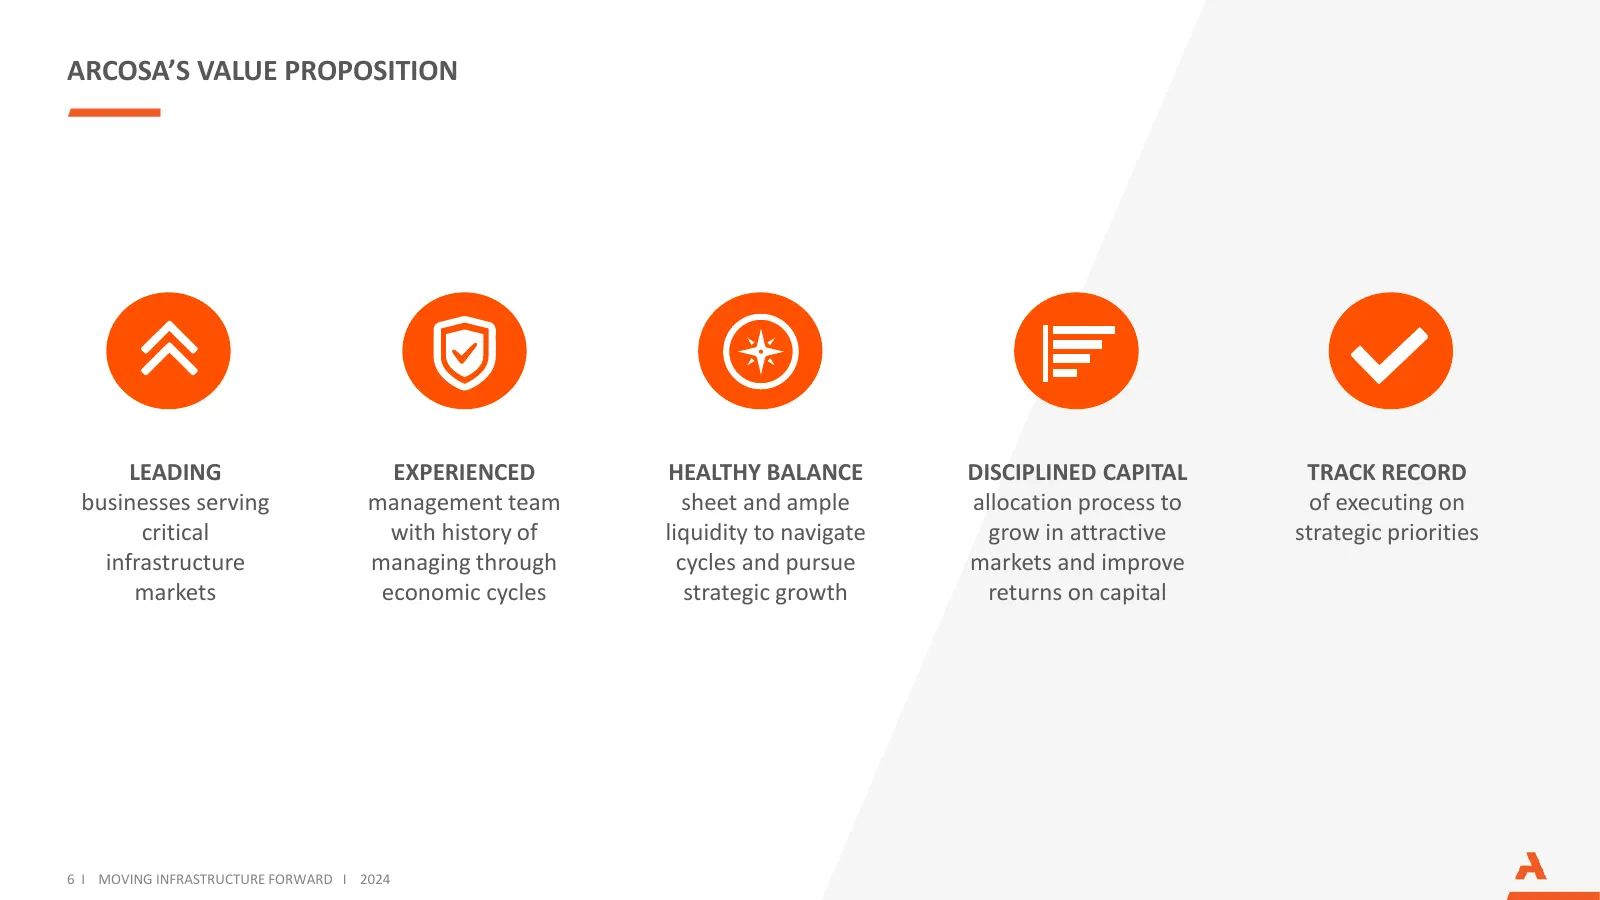
ARCOSA’S VALUE PROPOSITION LEADING EXPERIENCED HEALTHY BALANCE DISCIPLINED CAPITAL TRACK RECORD businesses serving management team sheet and ample allocation process to of executing on critical with history of liquidity to navigate grow in attractive strategic priorities infrastructure managing thro
Slide 7: Arcosa at a Glance
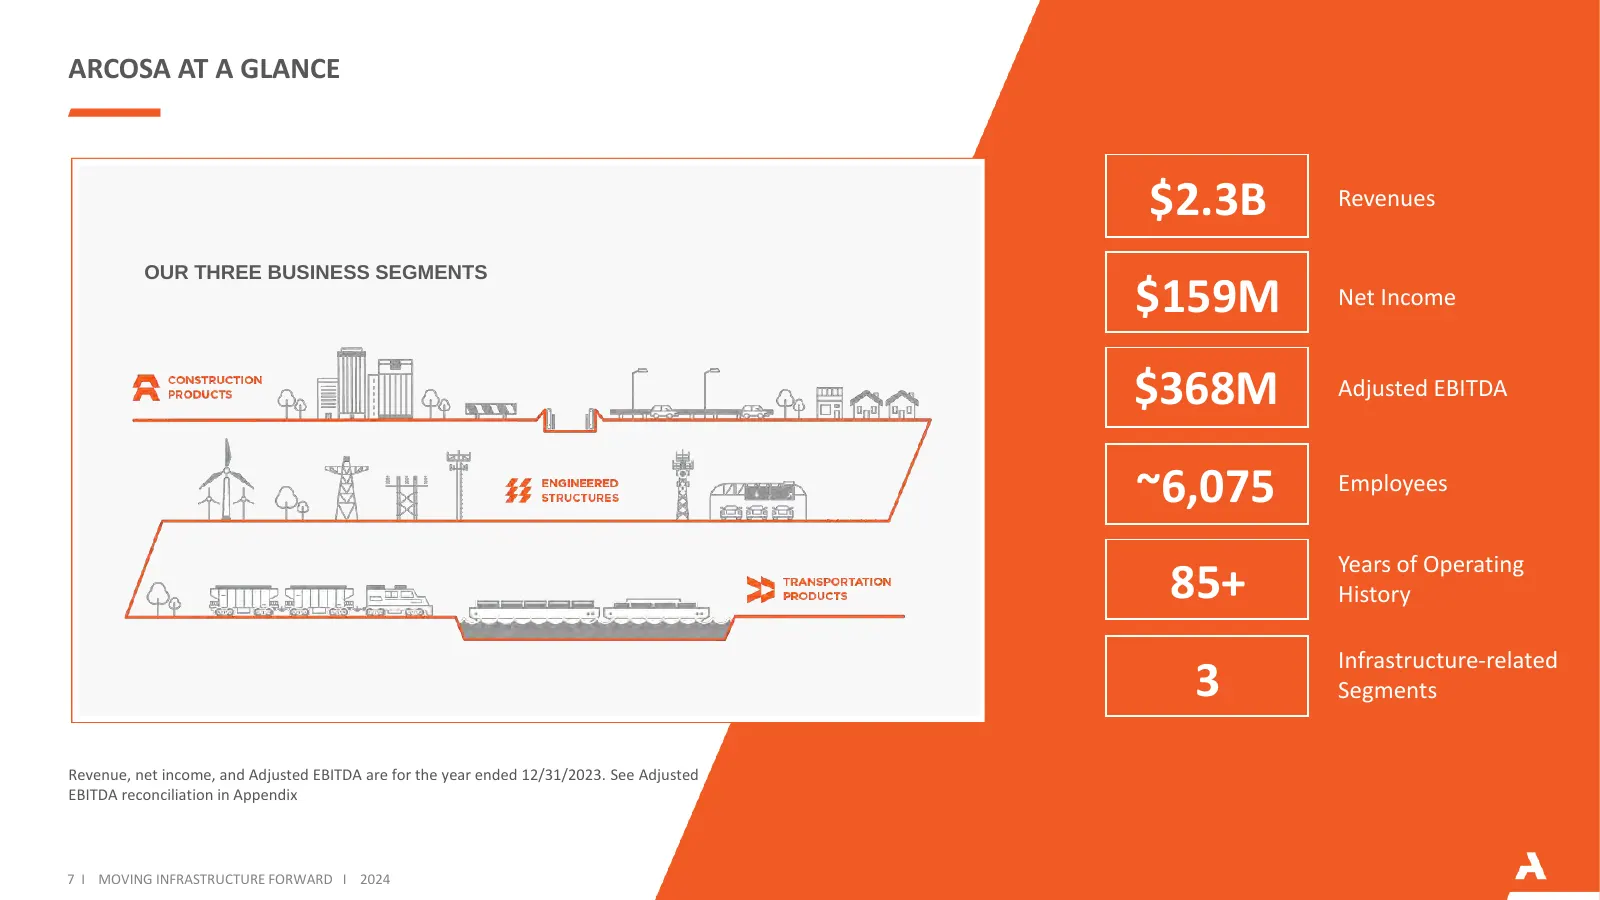
ARCOSA AT A GLANCE $2.3B Revenues $159M OUR THREE BUSINESS SEGMENTS Net Income $368M Adjusted EBITDA ~6,075 Employees 85+ Years of Operating History Infrastructure-related 3 Segments Revenue, net income, and Adjusted EBITDA are for the year ended 12/31/2023. See Adjusted EBITDA reconciliation in App
Slide 8: Business Overview
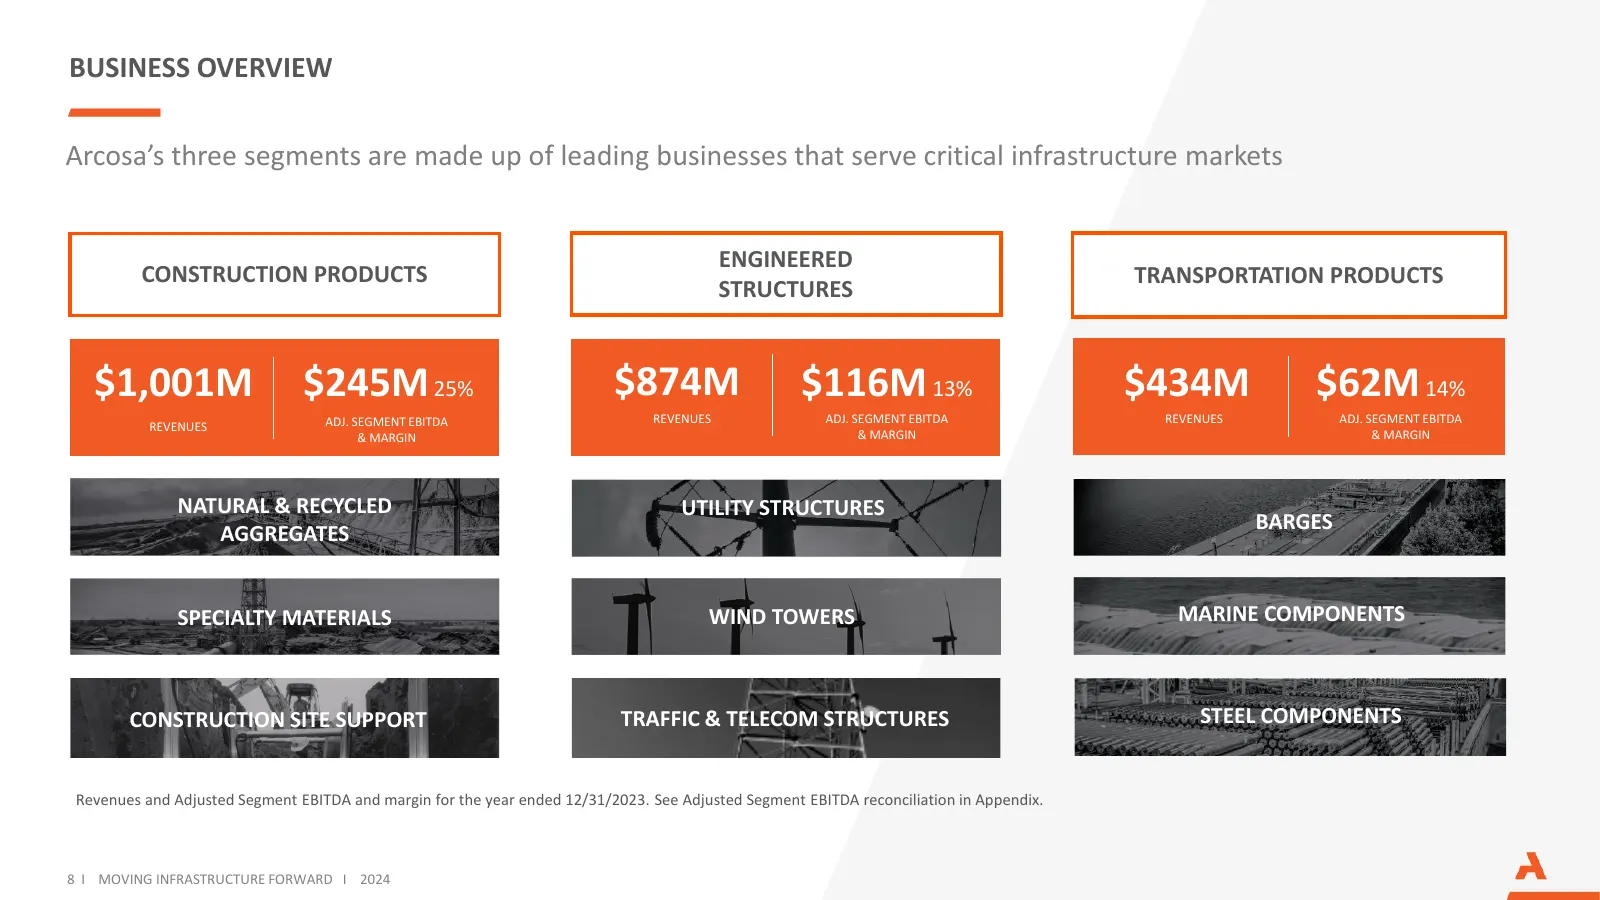
BUSINESS OVERVIEW Arcosa’s three segments are made up of leading businesses that serve critical infrastructure markets ENGINEERED CONSTRUCTION PRODUCTS TRANSPORTATION PRODUCTS STRUCTURES $1,001M $245M 25% $874M $116M 13% $434M $62M 14% ADJ. SEGMENT EBITDA REVENUES ADJ. SEGMENT EBITDA REVENUES ADJ. S
Slide 9: Arcosa's Long-Term Vision
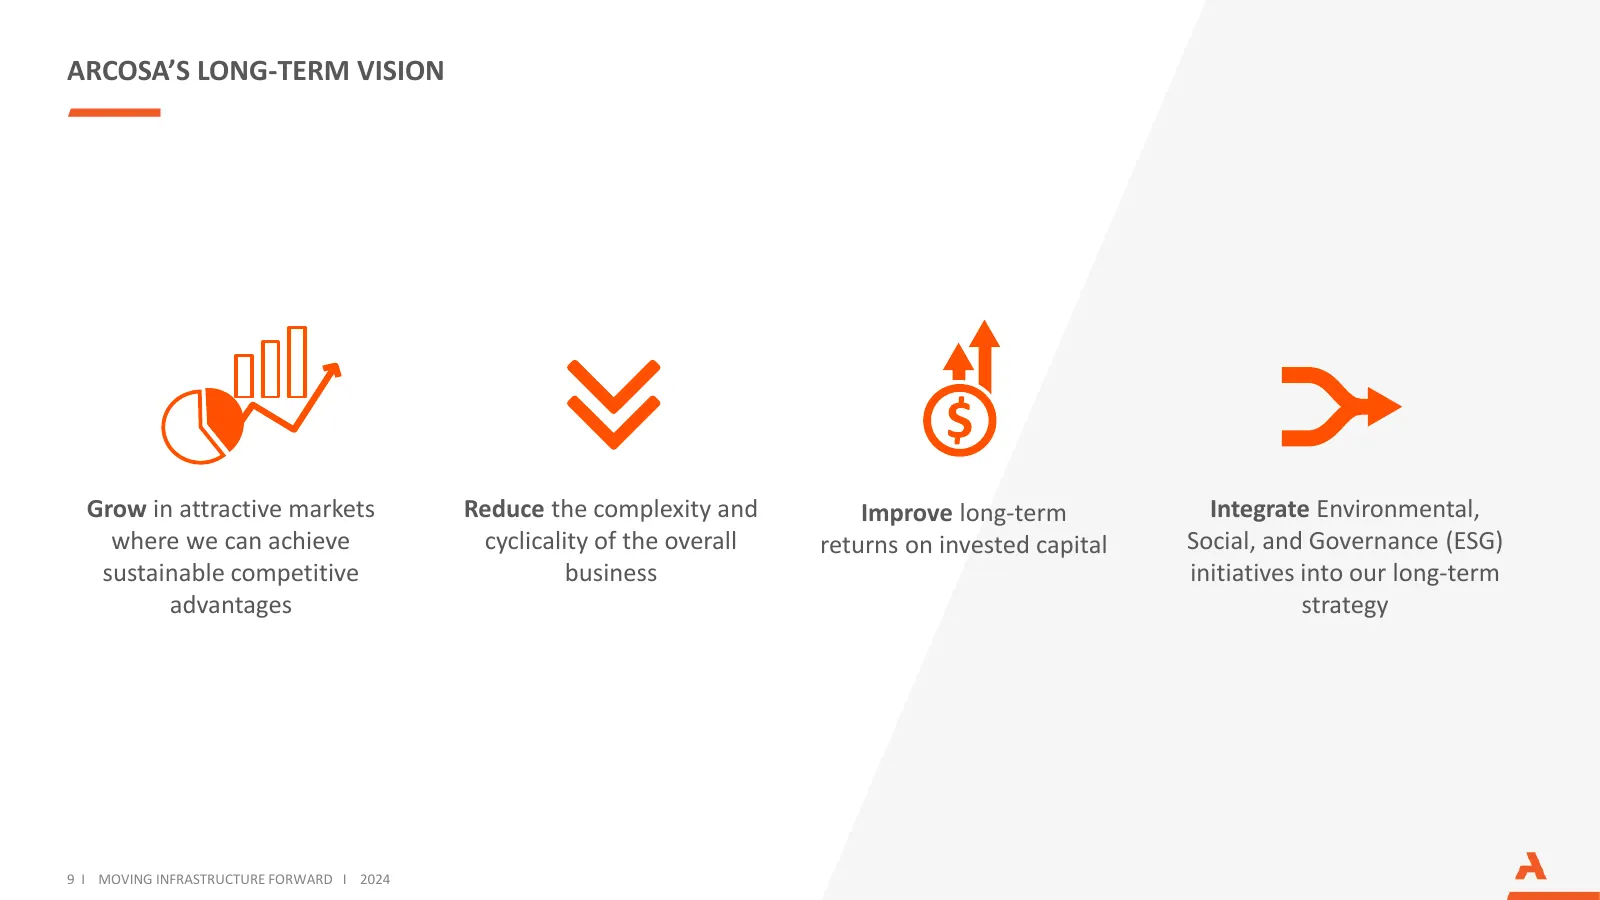
ARCOSA’S LONG-TERM VISION Grow in attractive markets Reduce the complexity and Improve long-term Integrate Environmental, where we can achieve cyclicality of the overall returns on invested capital Social, and Governance (ESG) sustainable competitive business initiatives into our long-term advantage
Slide 10: Strategic Transformation
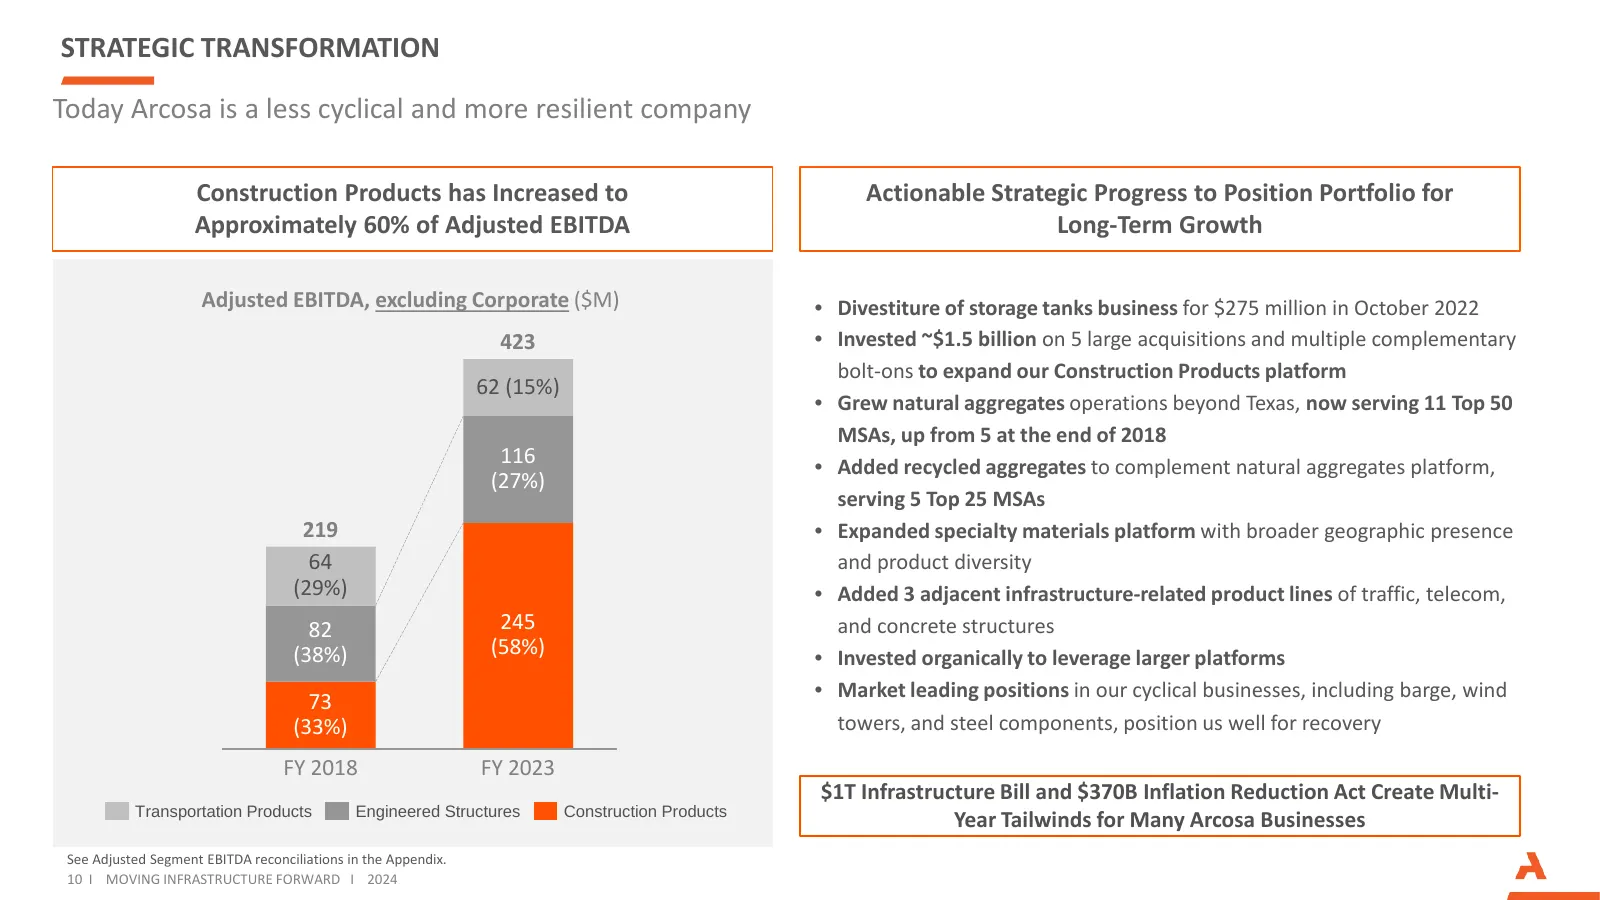
STRATEGIC TRANSFORMATION Today Arcosa is a less cyclical and more resilient company Construction Products has Increased to Actionable Strategic Progress to Position Portfolio for Approximately 60% of Adjusted EBITDA Long-Term Growth Adjusted EBITDA, excluding Corporate ($M) • Divestiture of storage
Slide 11: Investing in Our Construction Products Platform
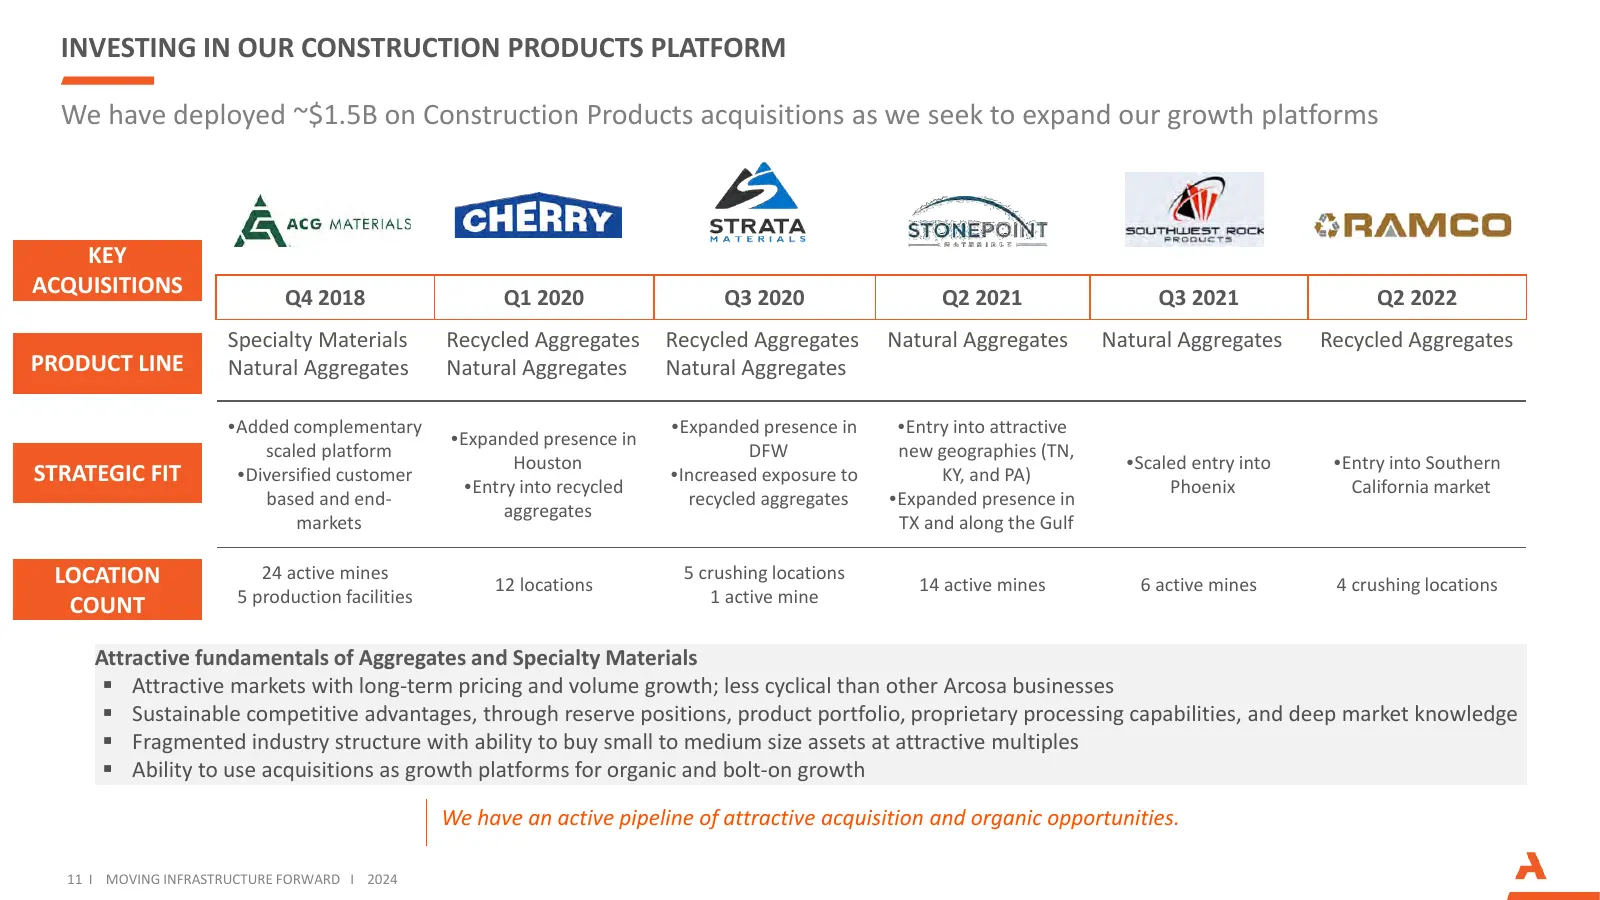
INVESTING IN OUR CONSTRUCTION PRODUCTS PLATFORM We have deployed ~$1.5B on Construction Products acquisitions as we seek to expand our growth platforms KEY ACQUISITIONS Q4 2018 Q1 2020 Q3 2020 Q2 2021 Q3 2021 Q2 2022 Specialty Materials Recycled Aggregates Recycled Aggregates Natural Aggregates Natu
Slide 12: Announced Agreement to Acquire Ameron Pole Products for $180 Million
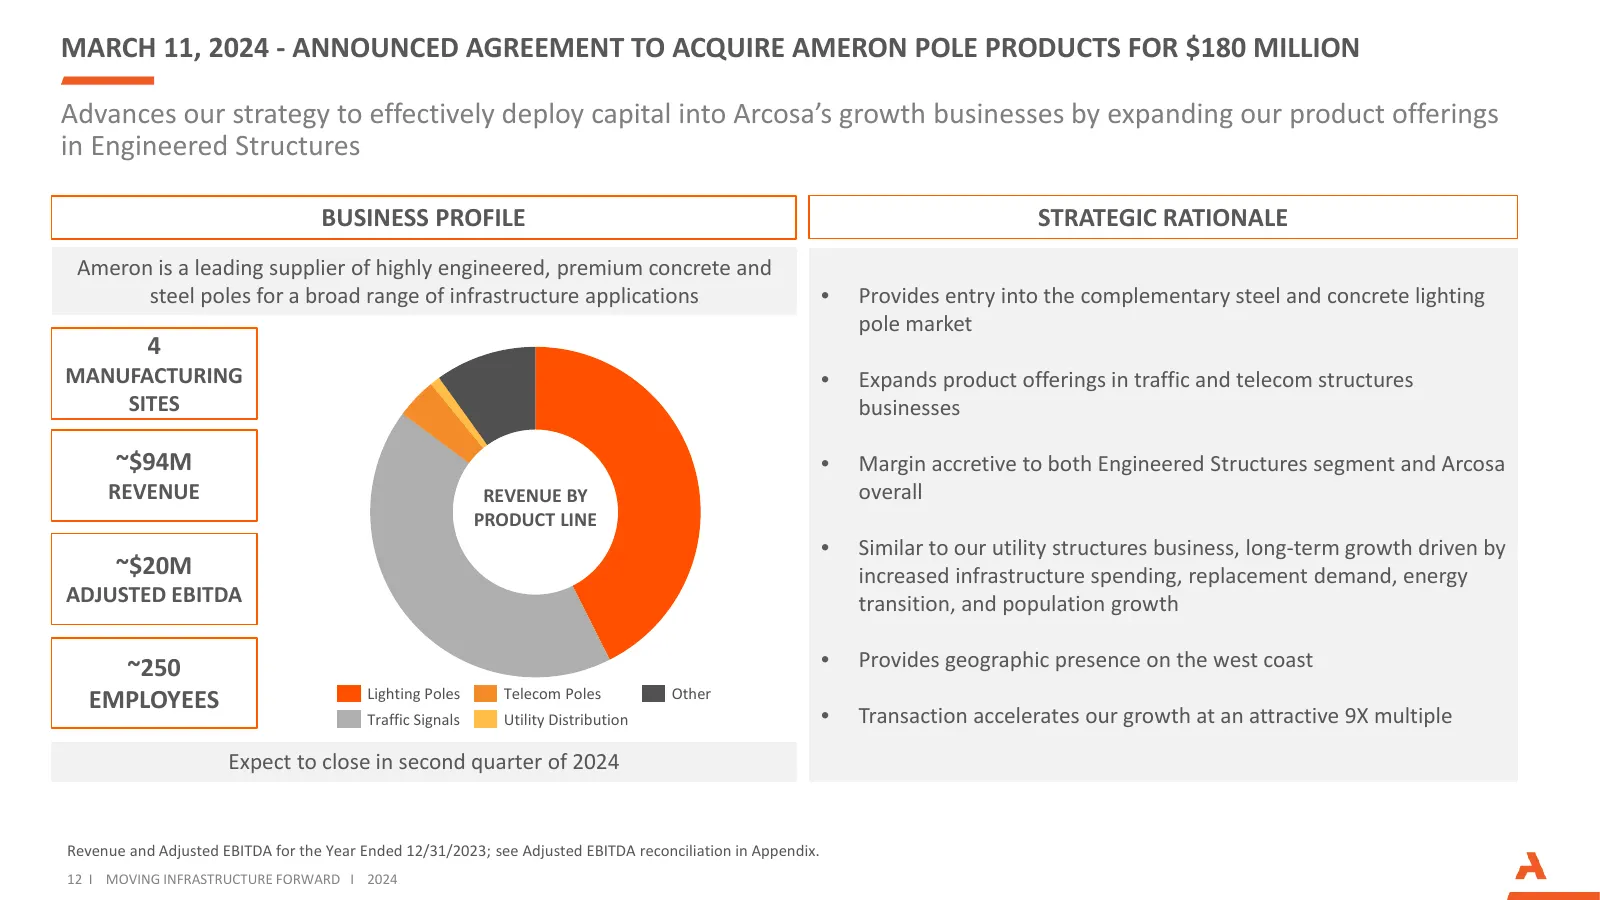
MARCH 11, 2024 - ANNOUNCED AGREEMENT TO ACQUIRE AMERON POLE PRODUCTS FOR $180 MILLION Advances our strategy to effectively deploy capital into Arcosa’s growth businesses by expanding our product offerings in Engineered Structures BUSINESS PROFILE STRATEGIC RATIONALE Ameron is a leading supplier of h
Slide 13: Infrastructure Spending
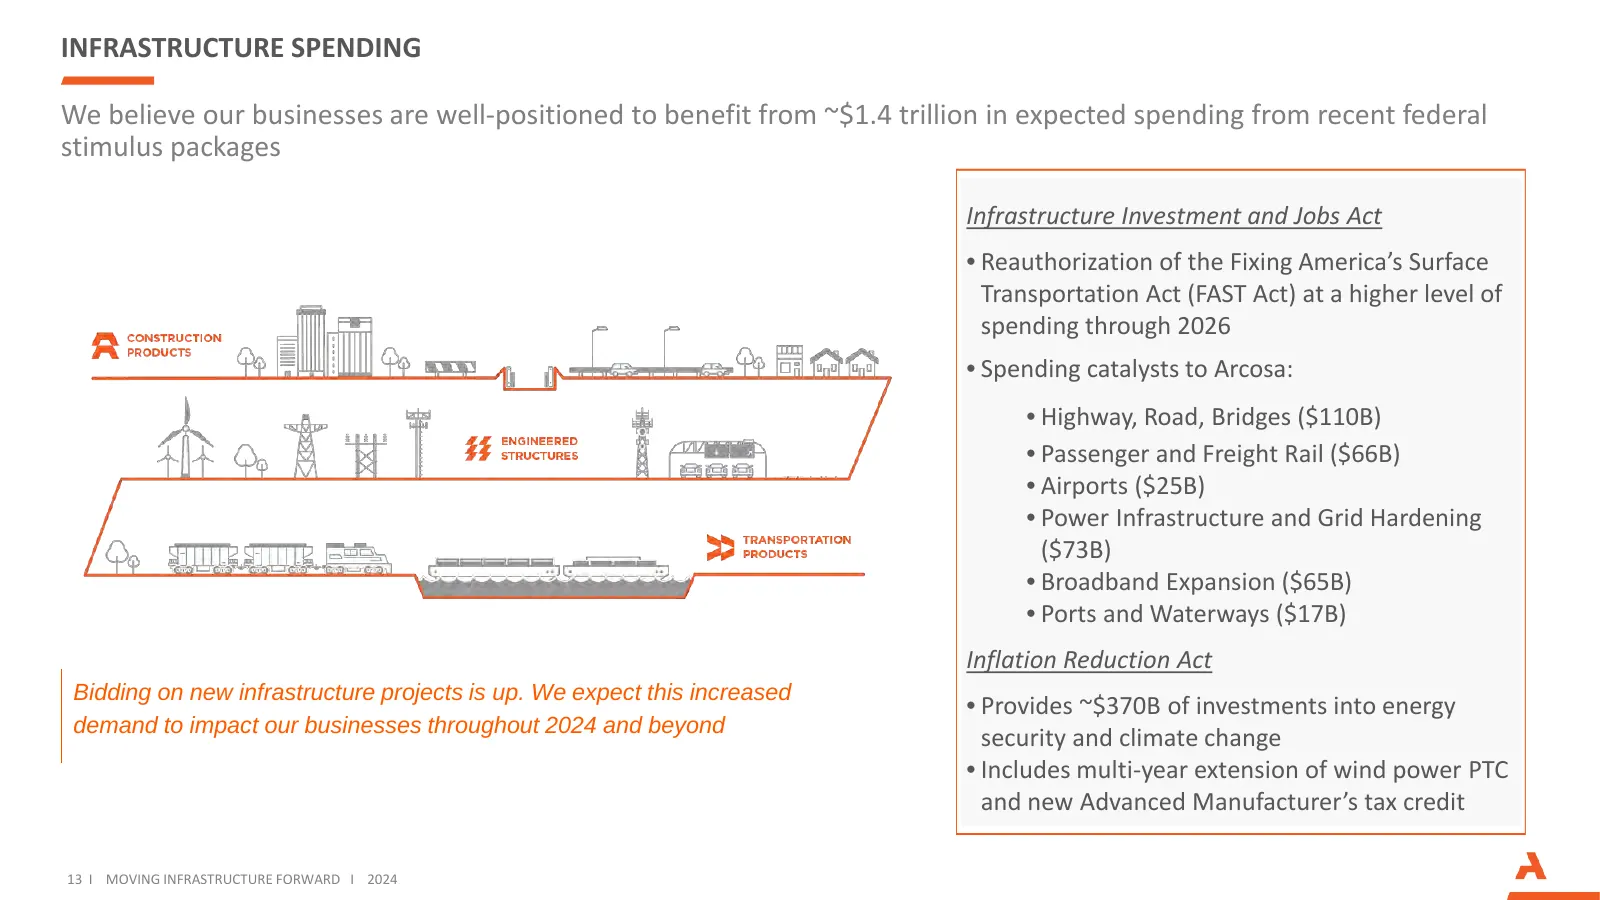
INFRASTRUCTURE SPENDING We believe our businesses are well-positioned to benefit from ~$1.4 trillion in expected spending from recent federal stimulus packages Infrastructure Investment and Jobs Act • Reauthorization of the Fixing America’s Surface Transportation Act (FAST Act) at a higher level of
Slide 14: Divestiture of Storage Tanks Business on October 3, 2022
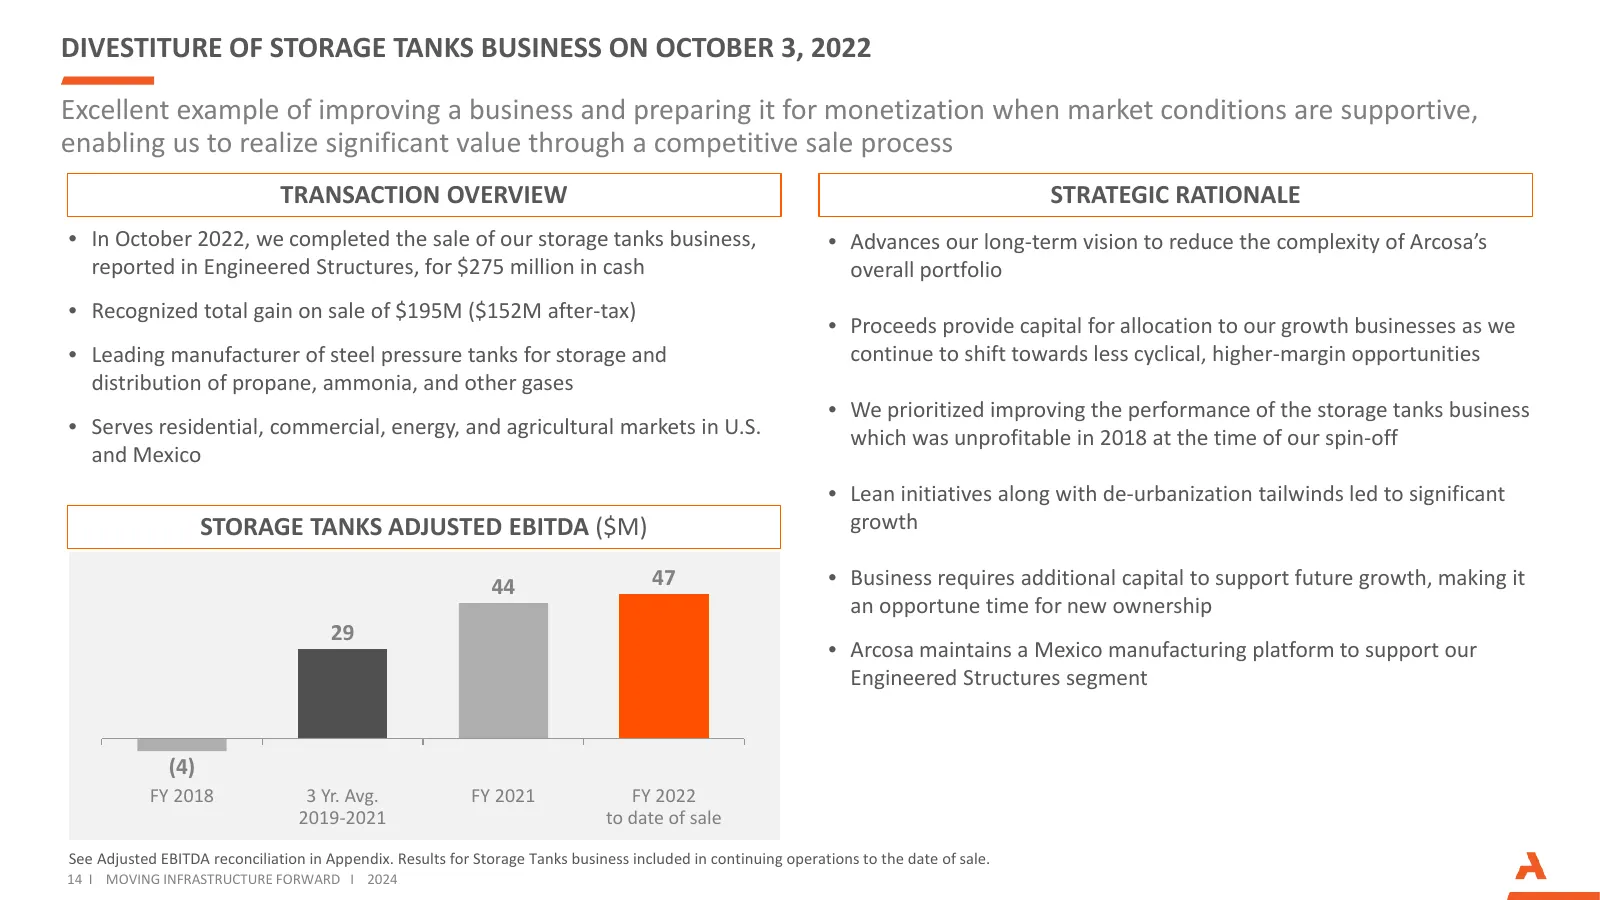
DIVESTITURE OF STORAGE TANKS BUSINESS ON OCTOBER 3, 2022 Excellent example of improving a business and preparing it for monetization when market conditions are supportive, enabling us to realize significant value through a competitive sale process TRANSACTION OVERVIEW STRATEGIC RATIONALE • In Octobe

Slide 15: 2024 Outlook
02 2024 OUTLOOK
Slide 16: 2024 Guidance
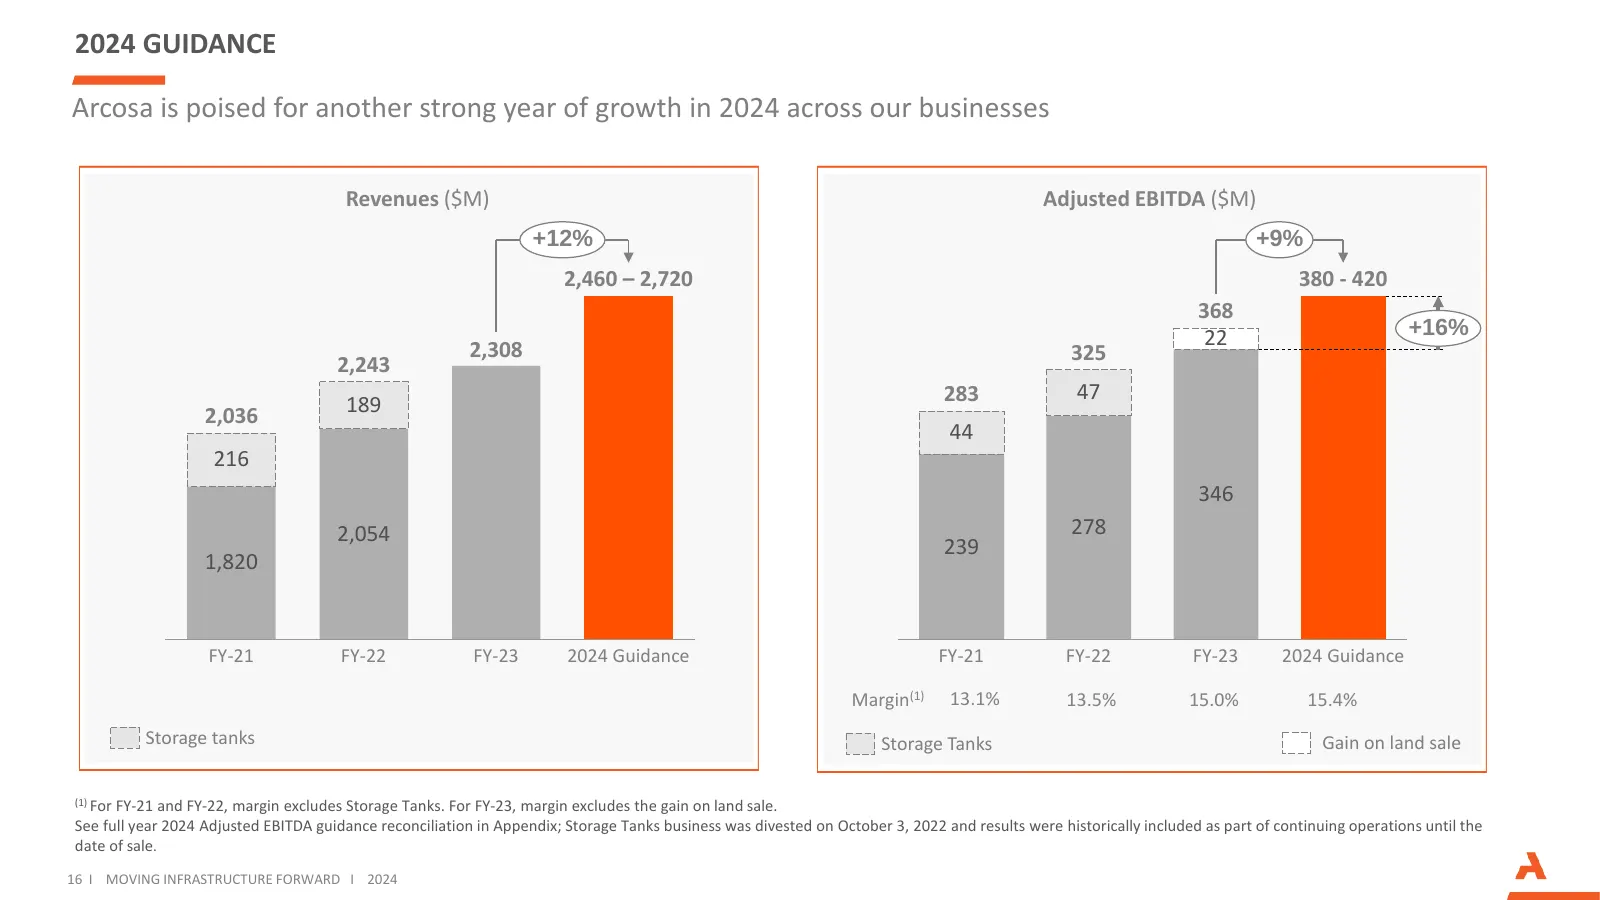
2024 GUIDANCE Arcosa is poised for another strong year of growth in 2024 across our businesses Revenues ($M) Adjusted EBITDA ($M) +12% +9% 2,460 – 2,720 380 - 420 368 22 +16% 2,308 325 2,243 283 47 2,036 189 44 216 346 2,054 278 239 1,820 FY-21 FY-22 FY-23 2024 Guidance FY-21 FY-22 FY-23 2024 Guidan
Slide 17: Growth Businesses Outlook
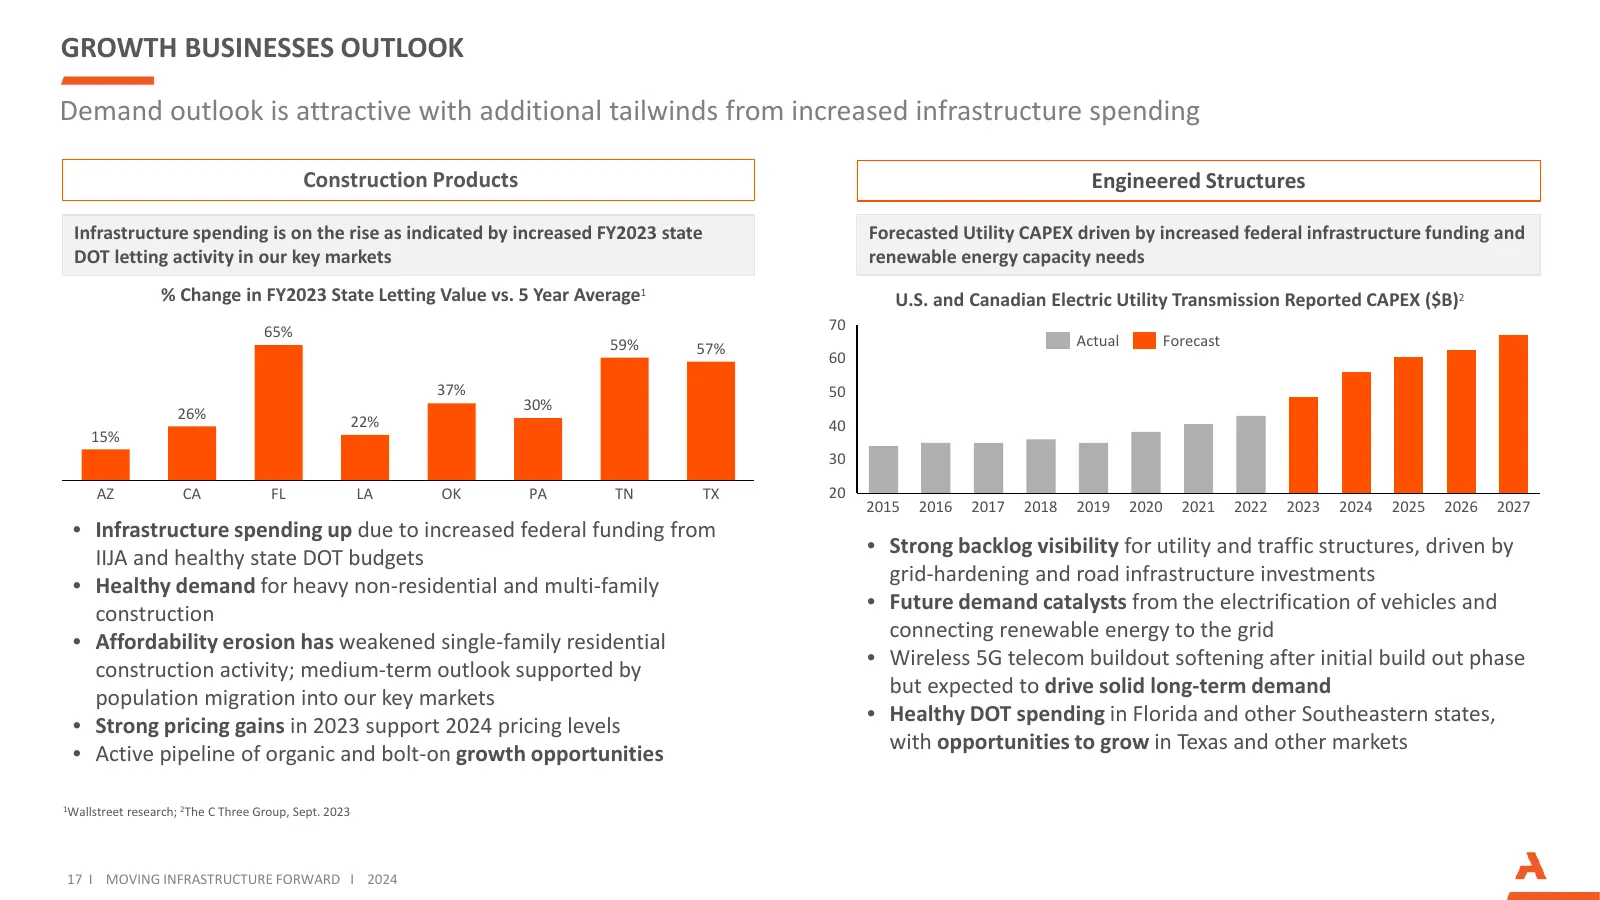
GROWTH BUSINESSES OUTLOOK Demand outlook is attractive with additional tailwinds from increased infrastructure spending Construction Products Engineered Structures Infrastructure spending is on the rise as indicated by increased FY2023 state Forecasted Utility CAPEX driven by increased federal infra
Slide 18: Wind Towers Outlook
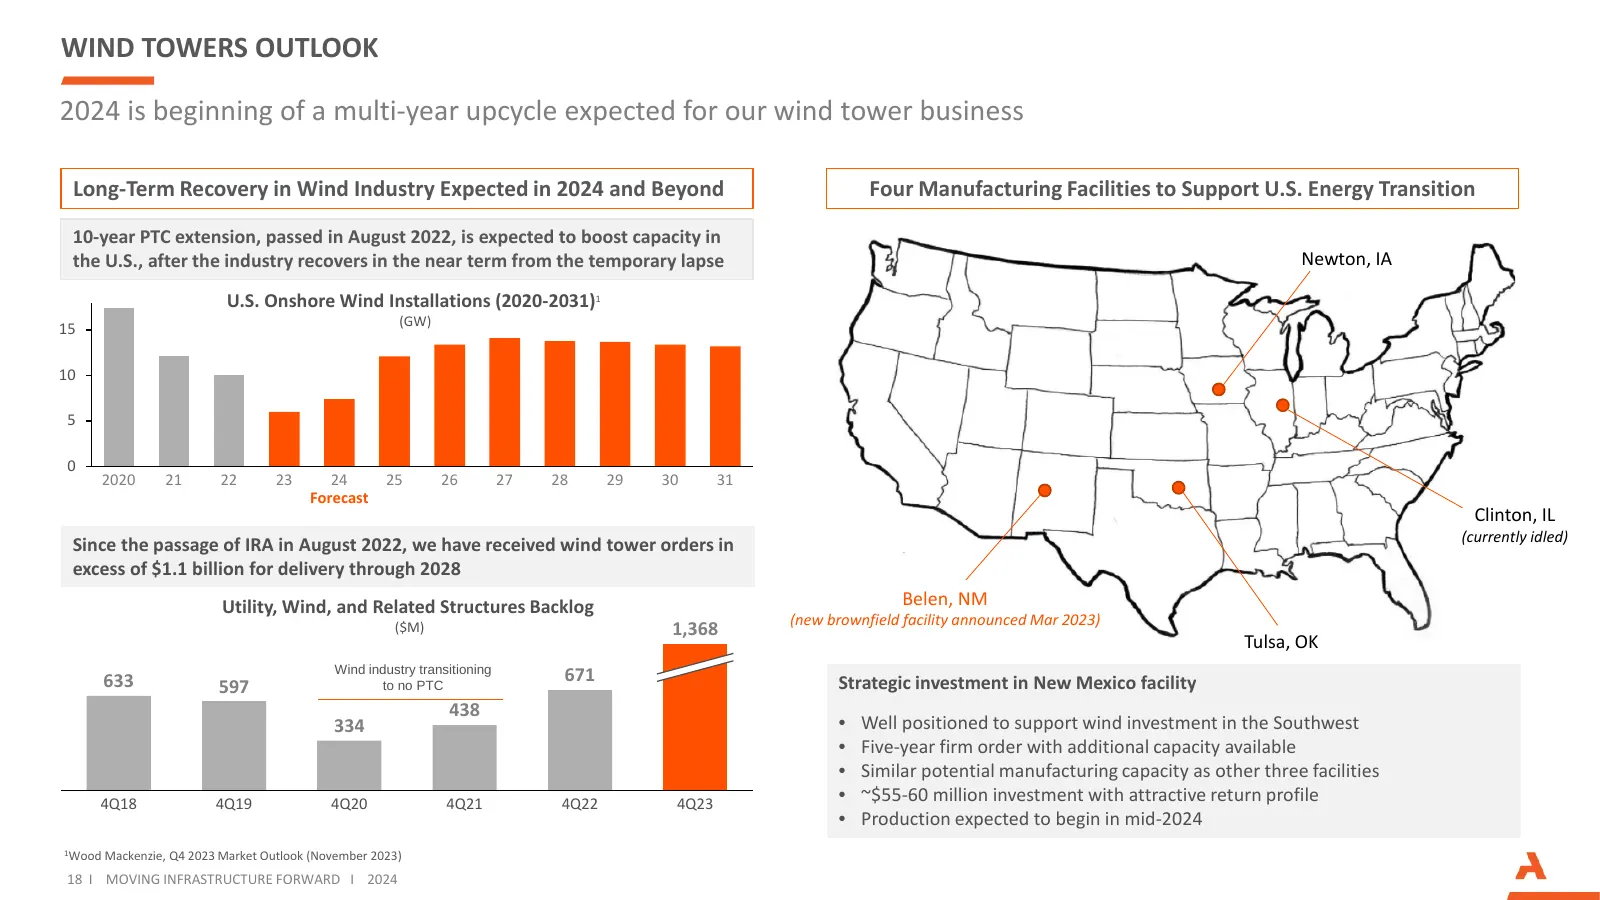
WIND TOWERS OUTLOOK 2024 is beginning of a multi-year upcycle expected for our wind tower business Long-Term Recovery in Wind Industry Expected in 2024 and Beyond Four Manufacturing Facilities to Support U.S. Energy Transition 10-year PTC extension, passed in August 2022, is expected to boost capaci
Slide 19: Inland Barge Outlook
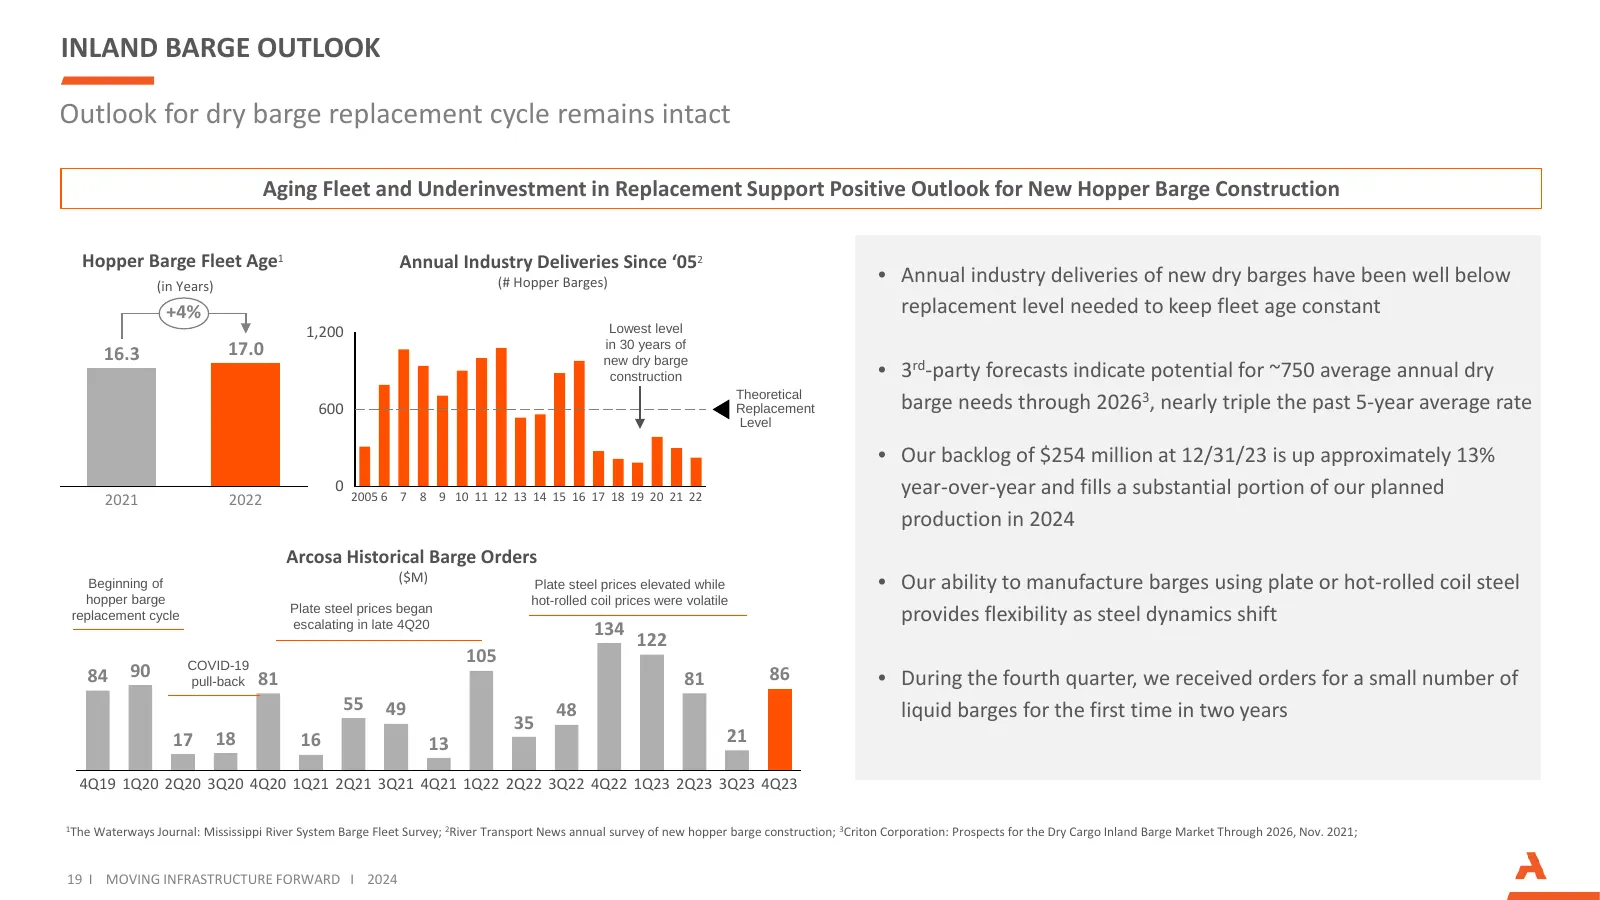
INLAND BARGE OUTLOOK Outlook for dry barge replacement cycle remains intact Aging Fleet and Underinvestment in Replacement Support Positive Outlook for New Hopper Barge Construction Hopper Barge Fleet Age1 Annual Industry Deliveries Since ‘052 (in Years) (# Hopper Barges) • Annual industry deliverie
Slide 20: Recent Financial Highlights
03 RECENT FINANCIAL HIGHLIGHTS
Slide 21: FY 2023 Consolidated Results
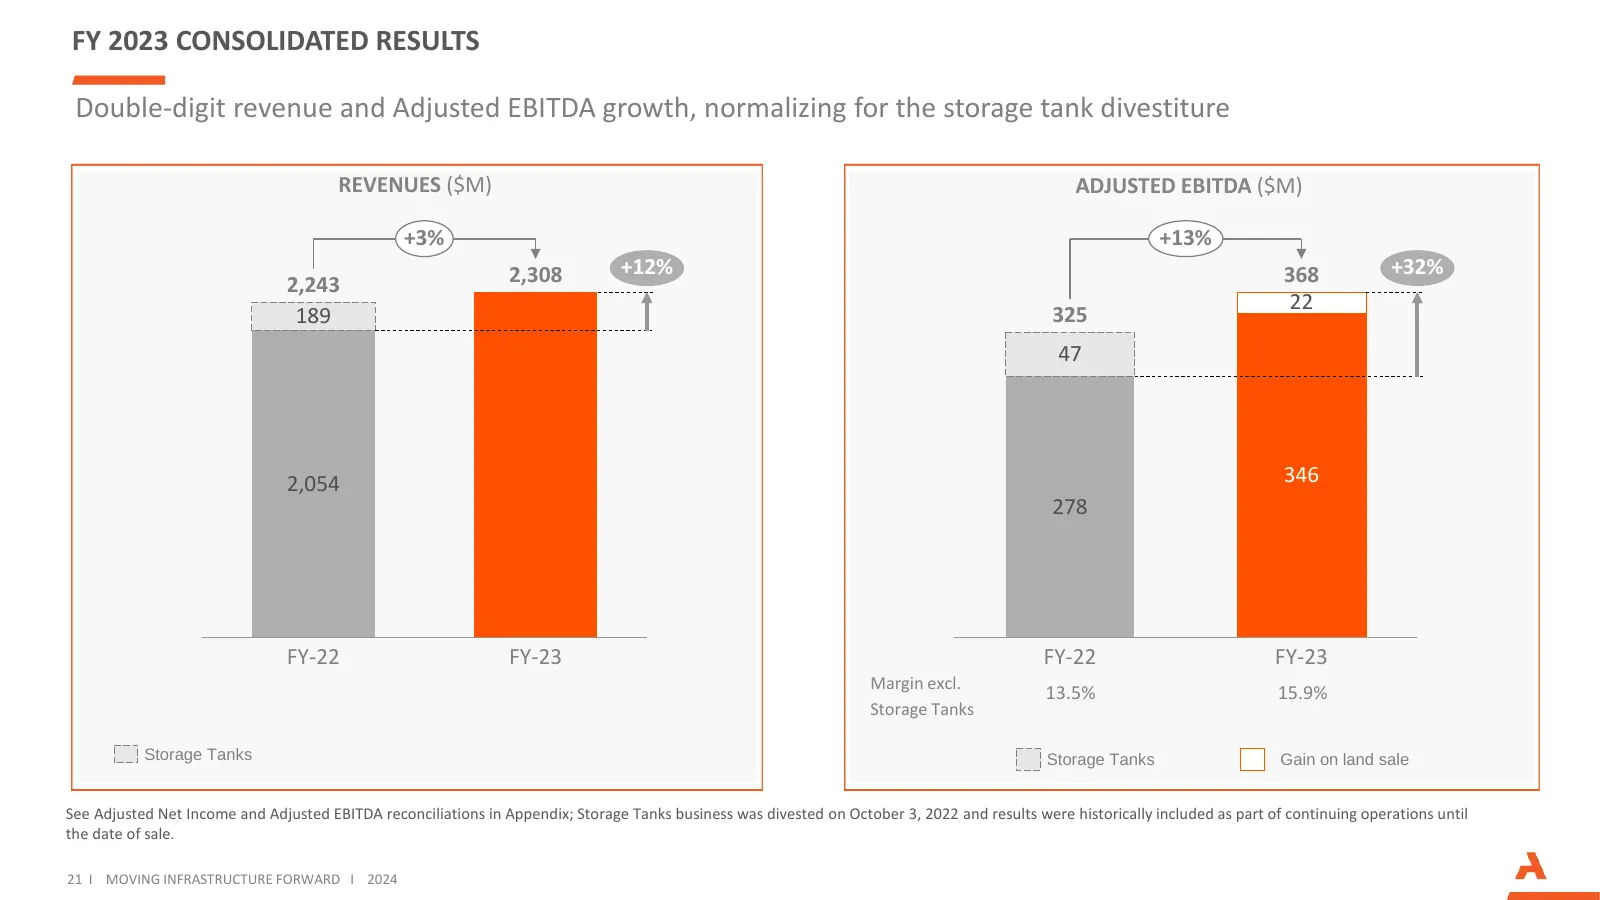
FY 2023 CONSOLIDATED RESULTS Double-digit revenue and Adjusted EBITDA growth, normalizing for the storage tank divestiture REVENUES ($M) ADJUSTED EBITDA ($M) +3% +13% 2,308 +12% 368 +32% 2,243 22 189 325 47 2,054 346 278 FY-22 FY-23 FY-22 FY-23 Margin excl. 13.5% 15.9% Storage Tanks Storage Tanks St
Slide 22: Q4 2023 Consolidated Results
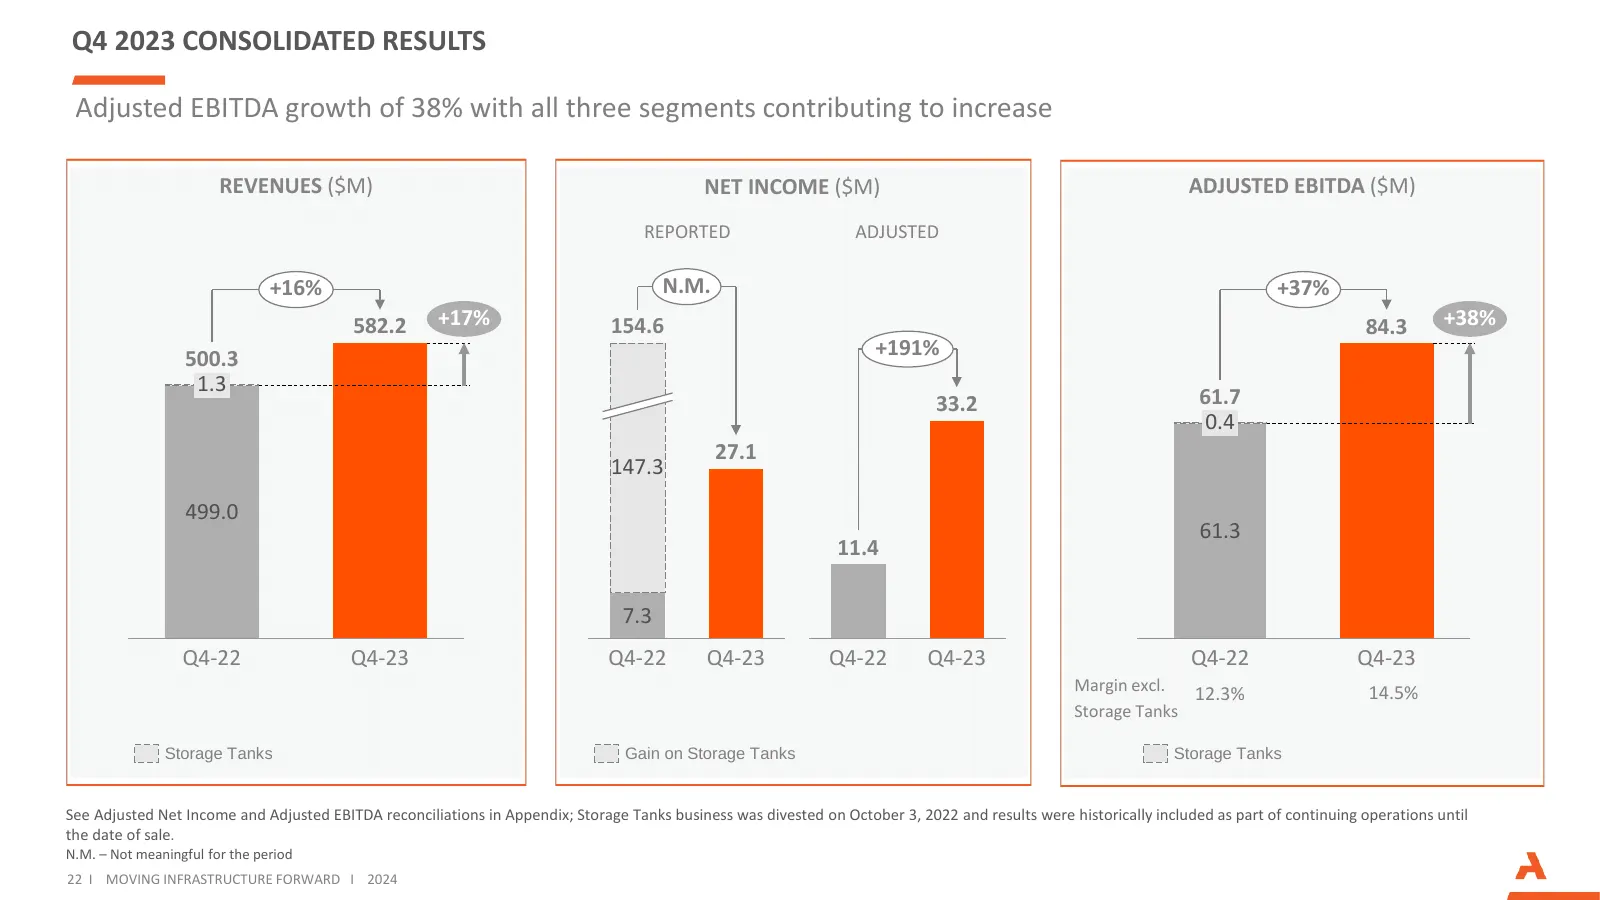
Q4 2023 CONSOLIDATED RESULTS Adjusted EBITDA growth of 38% with all three segments contributing to increase REVENUES ($M) NET INCOME ($M) ADJUSTED EBITDA ($M) REPORTED ADJUSTED +16% N.M. +37% 582.2 +17% 154.6 84.3 +38% 500.3 +191% 1.3 33.2 61.7 0.4 27.1 147.3 499.0 61.3 11.4 7.3 Q4-22 Q4-23 Q4-22 Q4
Slide 23: Cash Flow and Balance Sheet
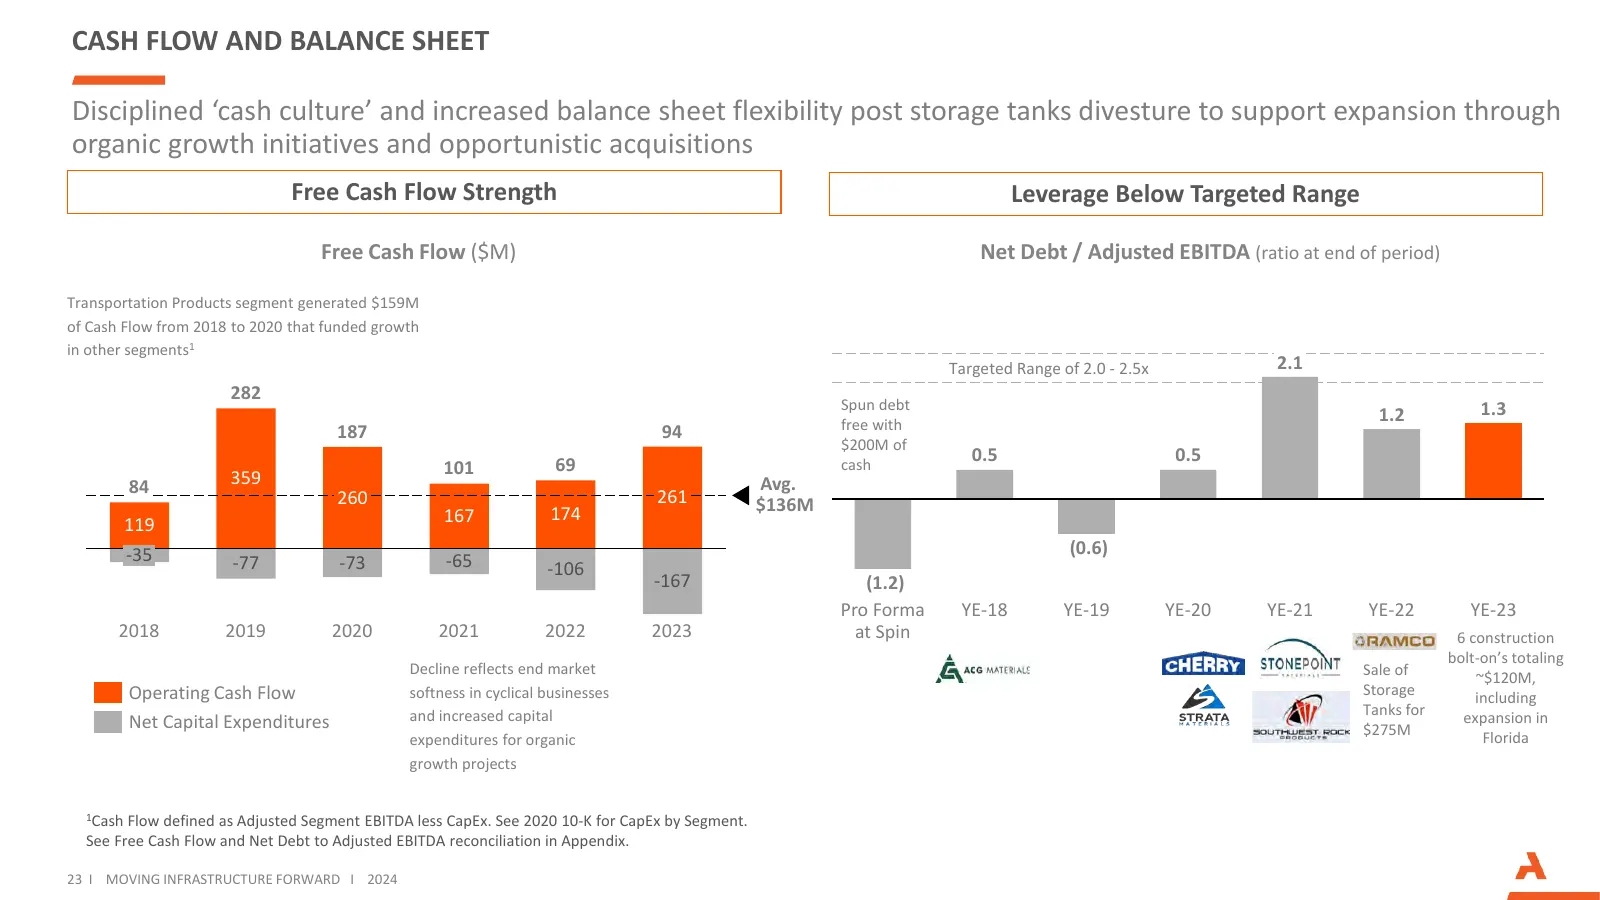
CASH FLOW AND BALANCE SHEET Disciplined ‘cash culture’ and increased balance sheet flexibility post storage tanks divesture to support expansion through organic growth initiatives and opportunistic acquisitions Free Cash Flow Strength Leverage Below Targeted Range Free Cash Flow ($M) Net Debt / Adju

Slide 24: ESG Accomplishments
04 ESG ACCOMPLISHMENTS
Slide 25: ESG Accomplishments
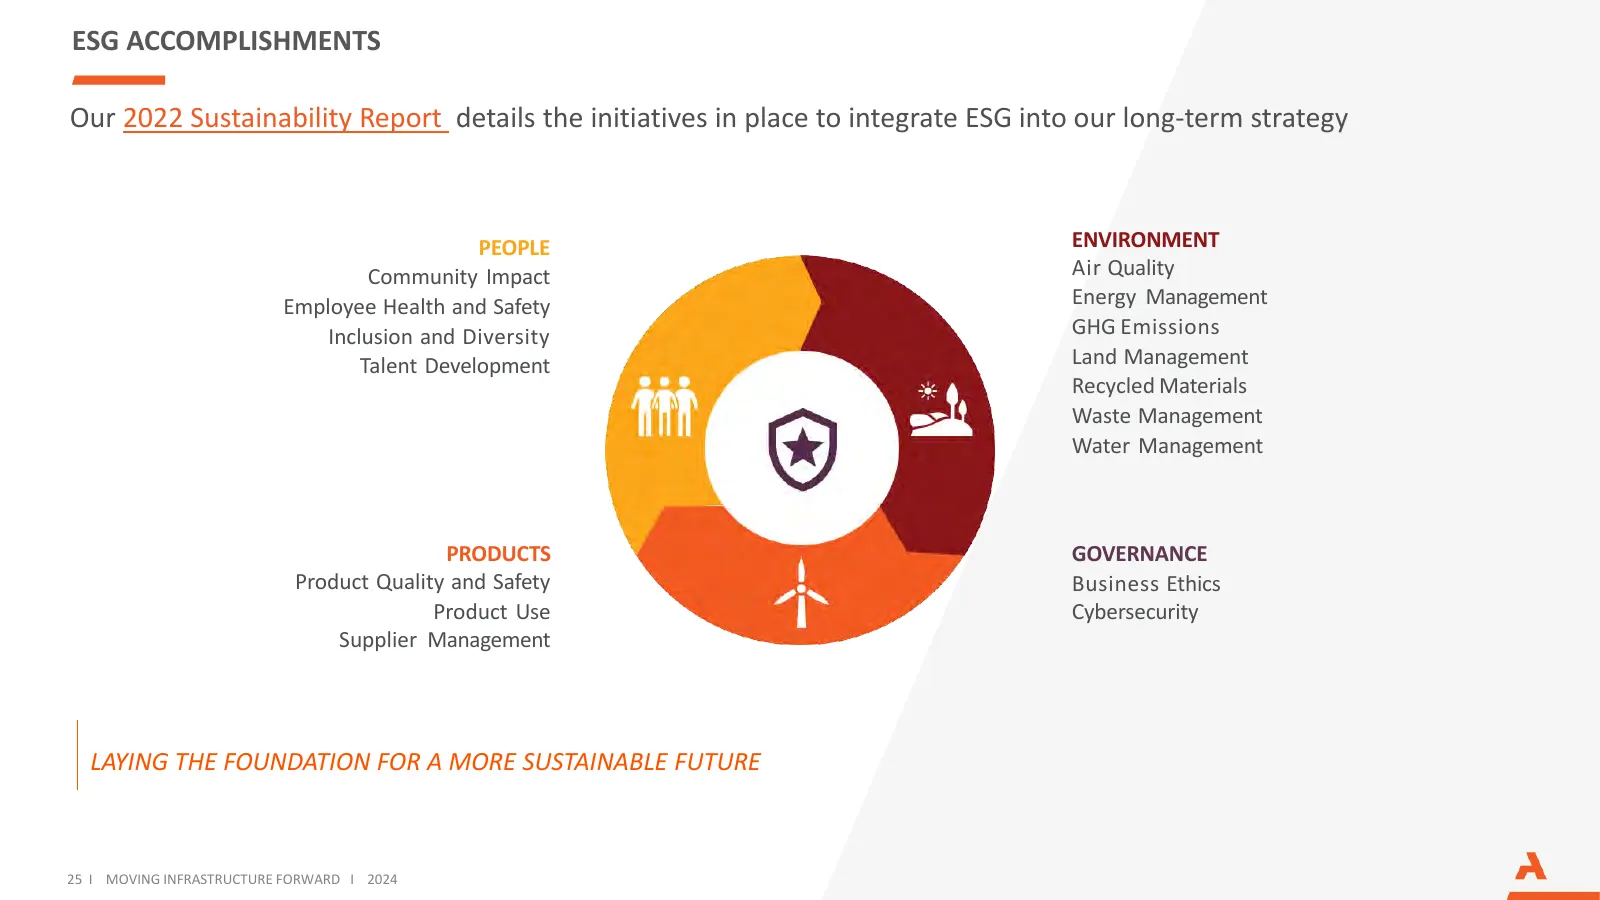
ESG ACCOMPLISHMENTS Our 2022 Sustainability Report details the initiatives in place to integrate ESG into our long-term strategy PEOPLE ENVIRONMENT Community Impact Air Quality Employee Health and Safety Energy Management Inclusion and Diversity GHG Emissions Talent Development Land Management Recyc
Slide 26: Employee Health and Safety
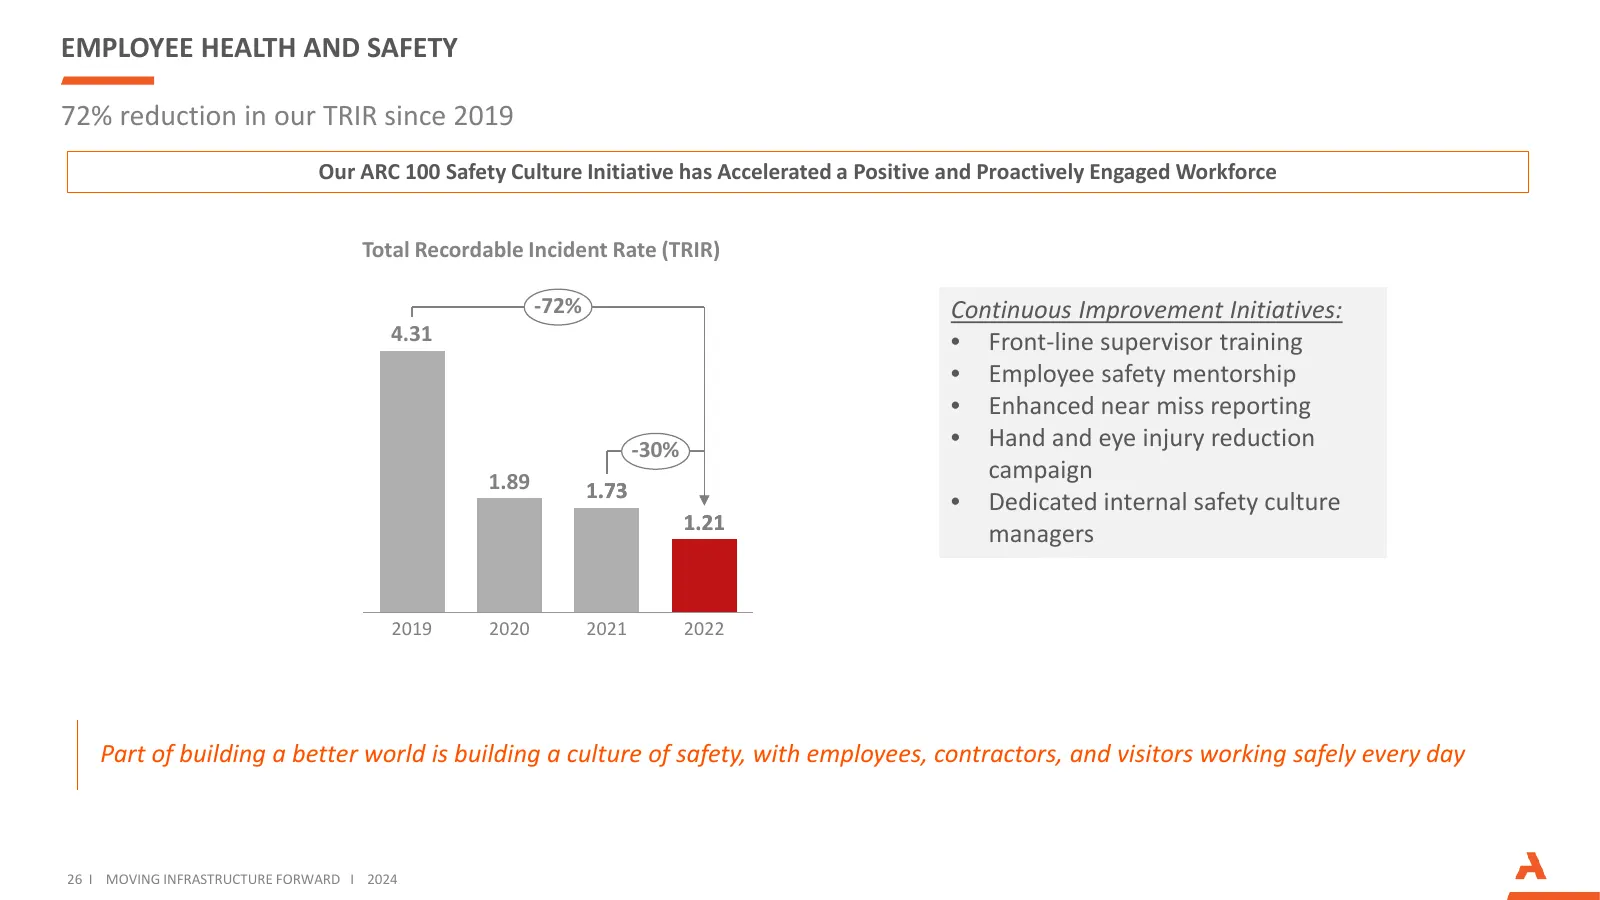
EMPLOYEE HEALTH AND SAFETY 72% reduction in our TRIR since 2019 Our ARC 100 Safety Culture Initiative has Accelerated a Positive and Proactively Engaged Workforce Total Recordable Incident Rate (TRIR) -72% Continuous Improvement Initiatives: 4.31 • Front-line supervisor training • Employee safety me
Slide 27: Greenhouse Gas (GHG) Emissions
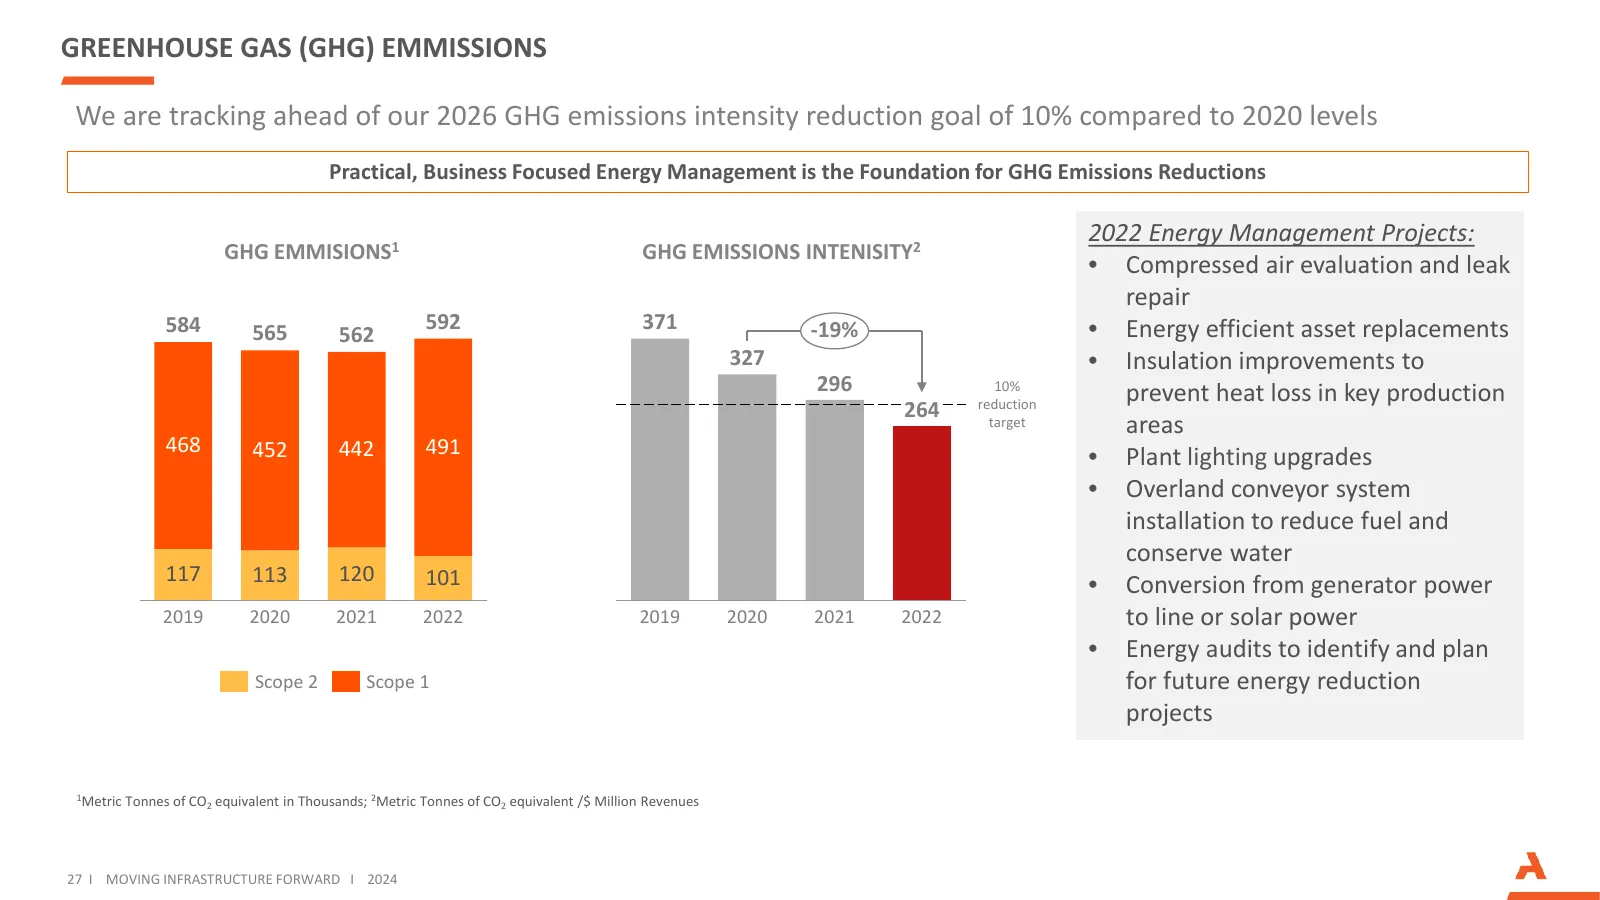
GREENHOUSE GAS (GHG) EMMISSIONS We are tracking ahead of our 2026 GHG emissions intensity reduction goal of 10% compared to 2020 levels Practical, Business Focused Energy Management is the Foundation for GHG Emissions Reductions 2022 Energy Management Projects: GHG EMMISIONS1 GHG EMISSIONS INTENISIT

Slide 28: Appendix
APPENDIX
Slide 29: Guidance Summary for 2024
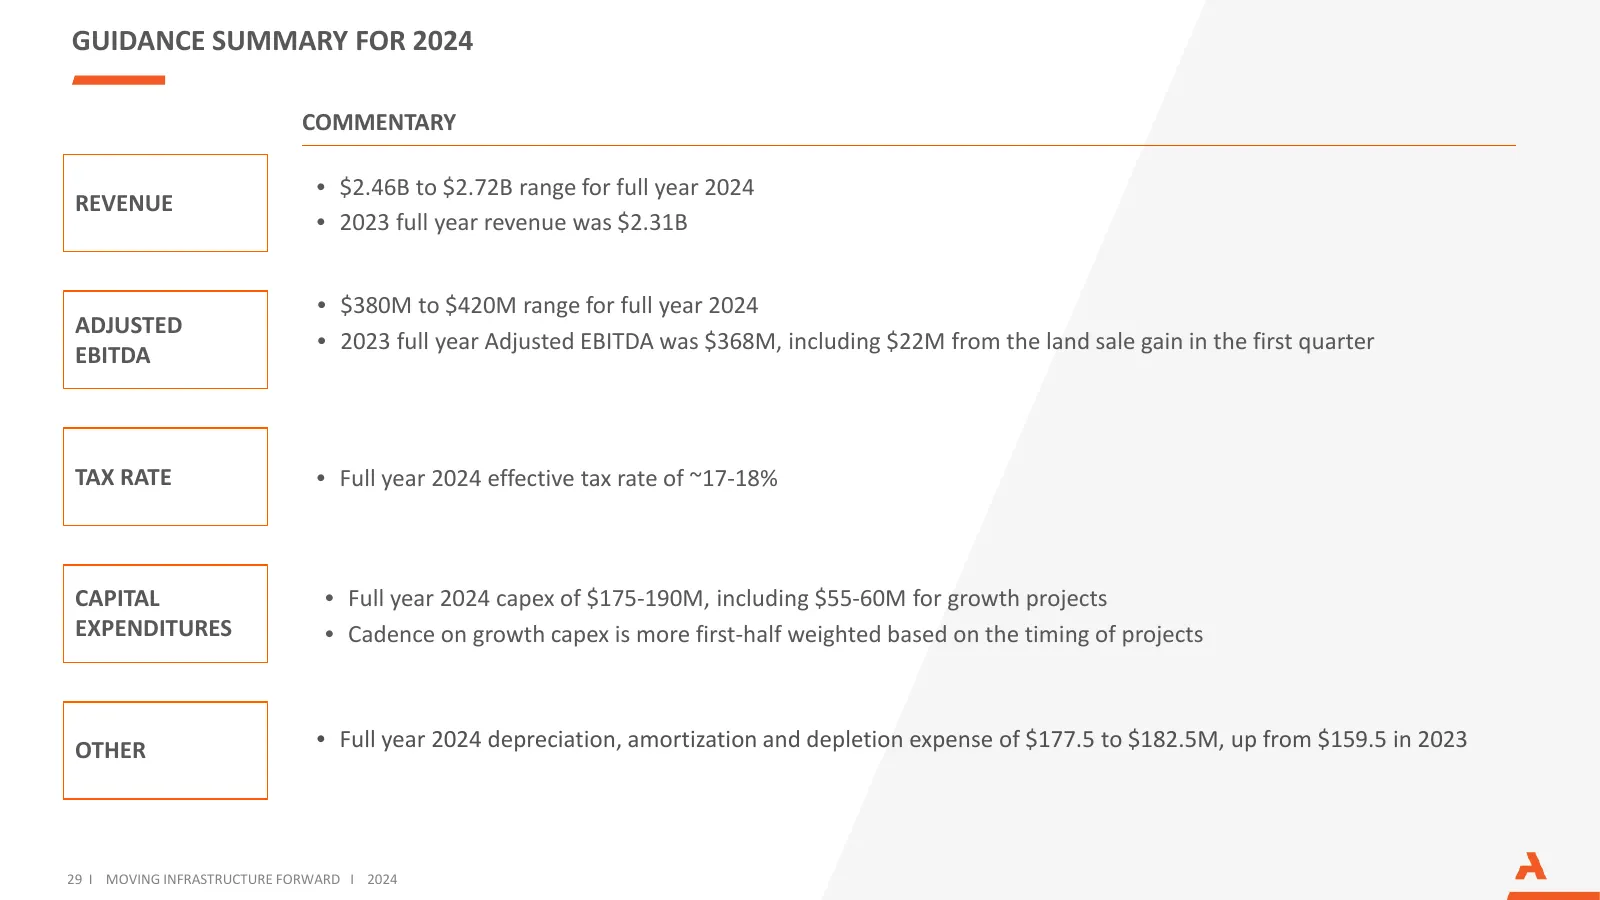
GUIDANCE SUMMARY FOR 2024 COMMENTARY • $2.46B to $2.72B range for full year 2024 REVENUE • 2023 full year revenue was $2.31B • $380M to $420M range for full year 2024 ADJUSTED • 2023 full year Adjusted EBITDA was $368M, including $22M from the land sale gain in the first quarter EBITDA TAX RATE • Fu
Slide 30: Non-GAAP Measures
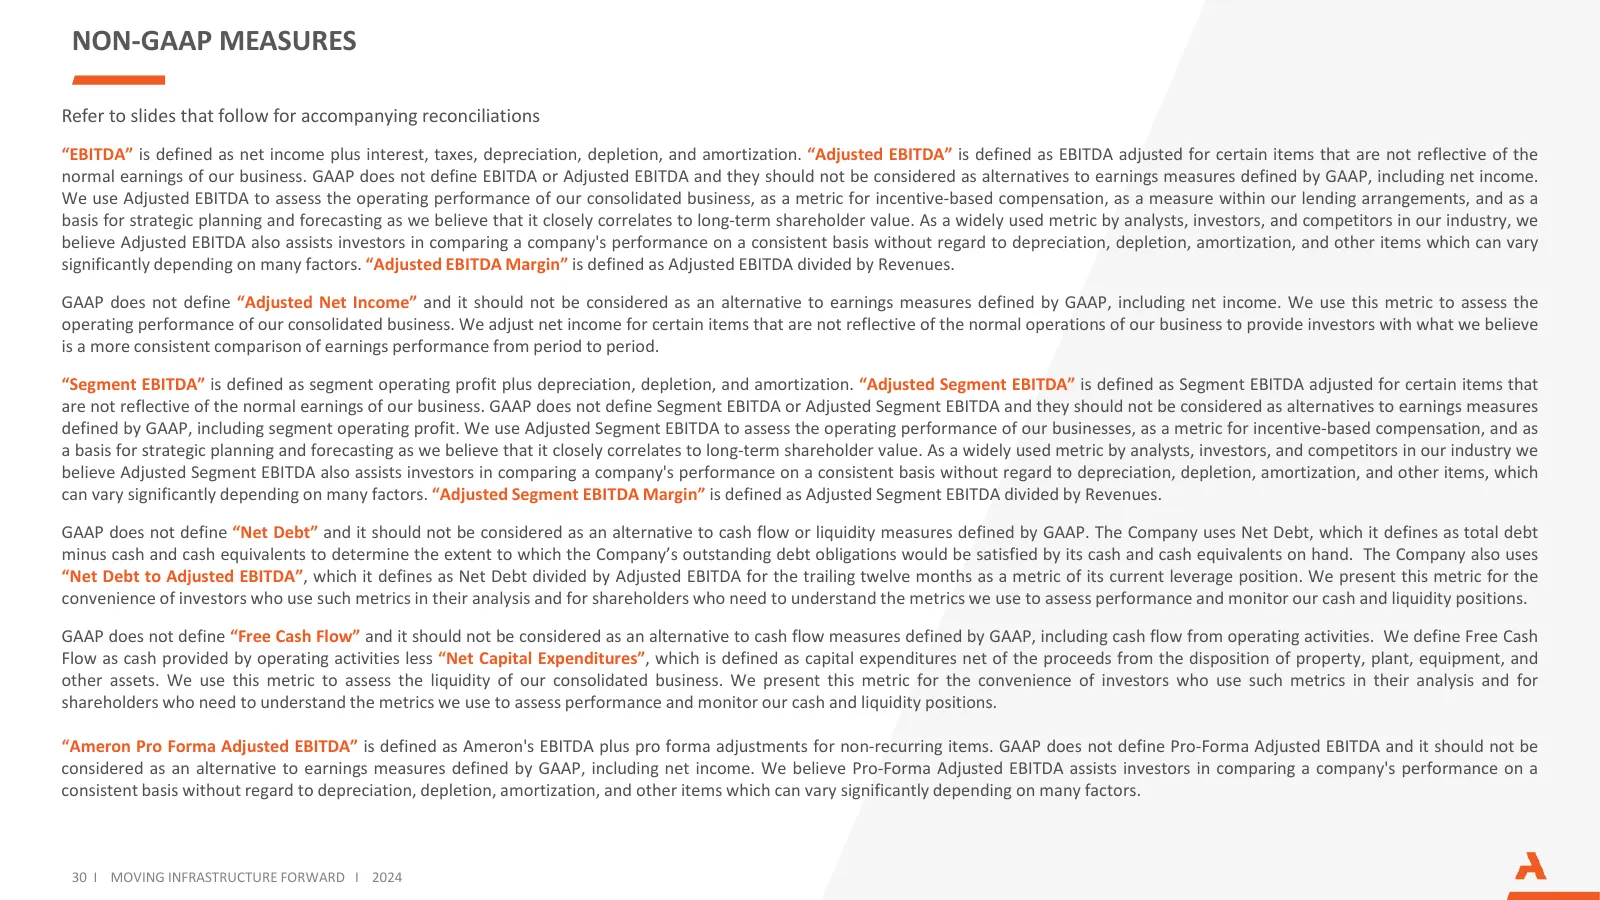
NON-GAAP MEASURES Refer to slides that follow for accompanying reconciliations “EBITDA” is defined as net income plus interest, taxes, depreciation, depletion, and amortization. “Adjusted EBITDA” is defined as EBITDA adjusted for certain items that are not reflective of the normal earnings of our bu
Slide 31: Reconciliation of Adjusted EBITDA and Adjusted Net Income
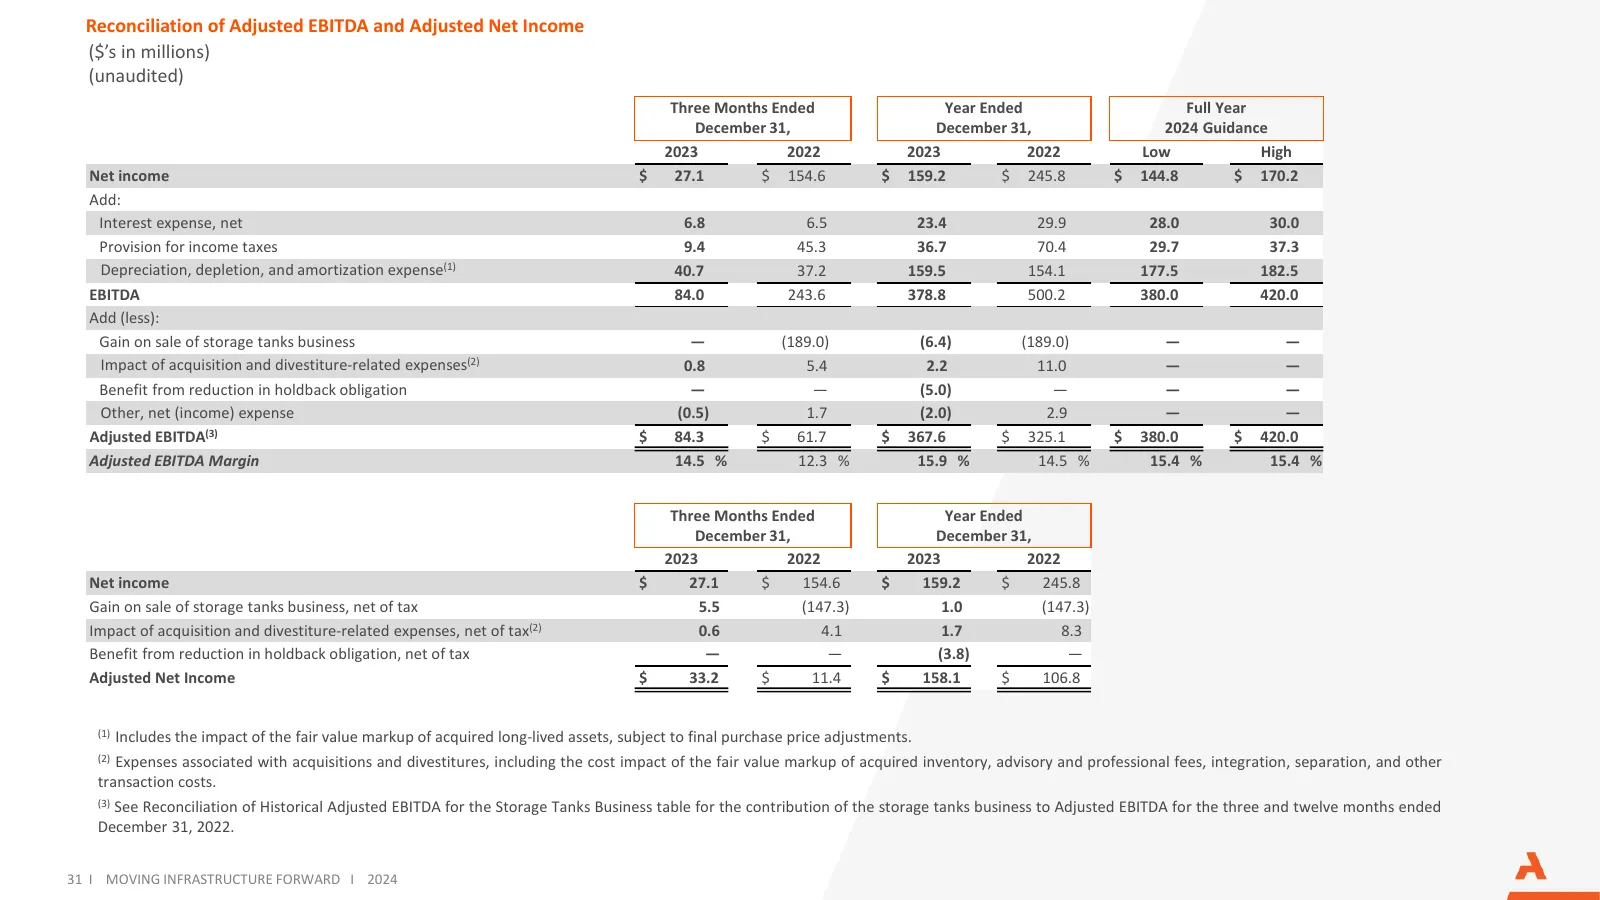
Reconciliation of Adjusted EBITDA and Adjusted Net Income ($’s in millions) (unaudited) Three Months Ended Year Ended Full Year December 31, December 31, 2024 Guidance 2023 2022 2023 2022 Low High Net income $ 27.1 $ 154.6 $ 159.2 $ 245.8 $ 144.8 $ 170.2 Add: Interest expense, net 6.8 6.5 23.4 29.9
Slide 32: Reconciliation of Adjusted Segment EBITDA
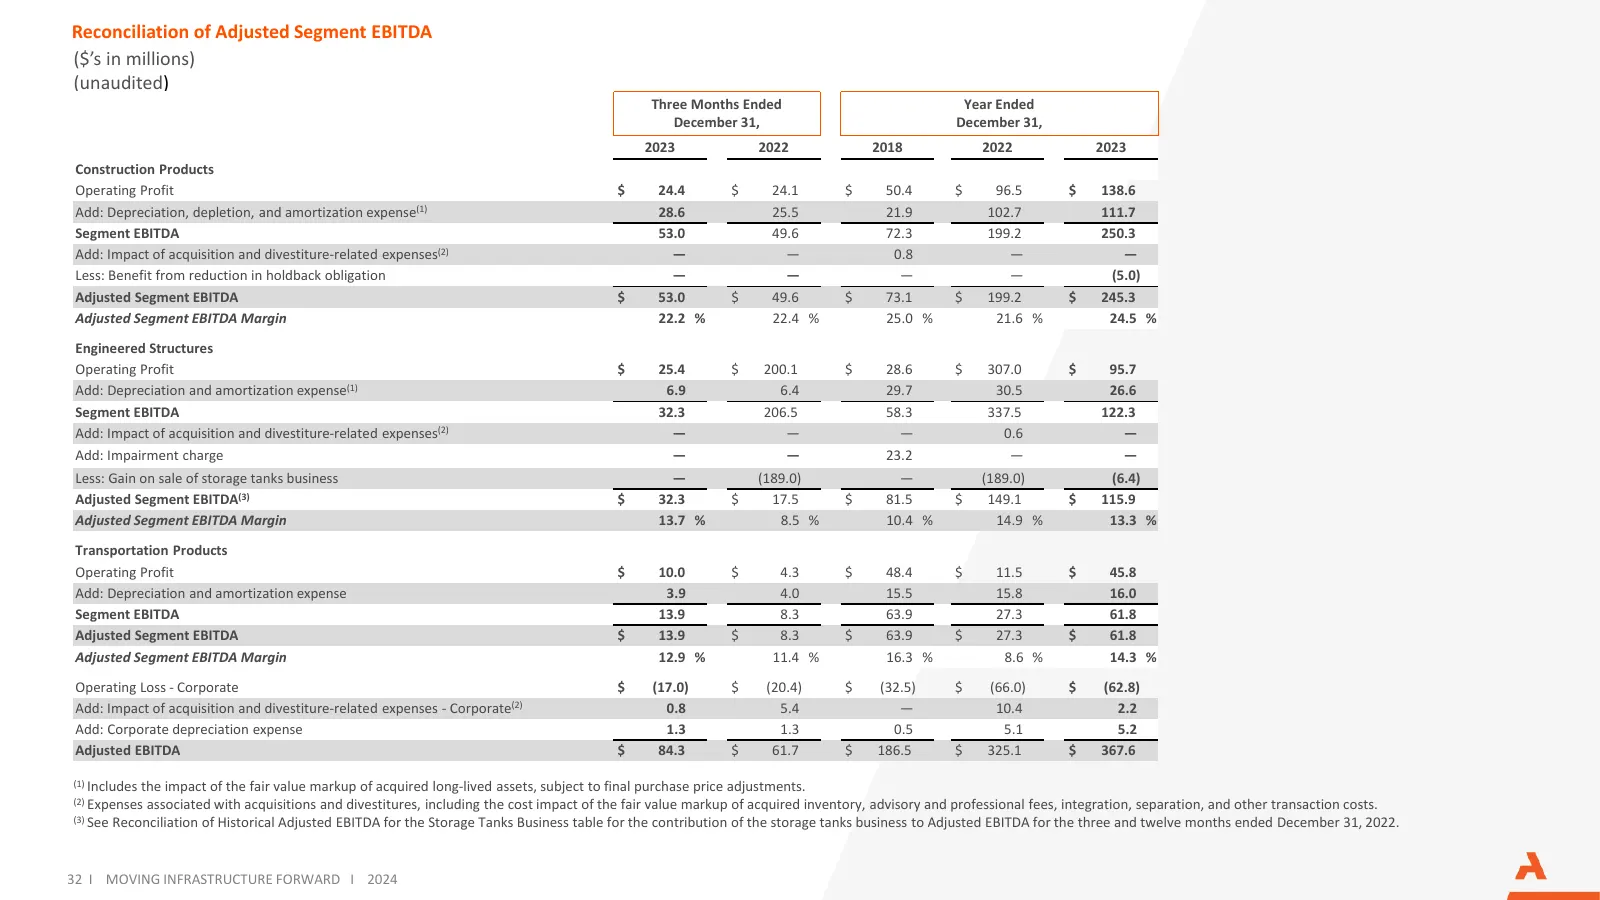
Reconciliation of Adjusted Segment EBITDA ($’s in millions) (unaudited) Three Months Ended Year Ended December 31, December 31, 2023 2022 2018 2022 2023 Construction Products Operating Profit $ 24.4 $ 24.1 $ 50.4 $ 96.5 $ 138.6 Add: Depreciation, depletion, and amortization expense(1) 28.6 25.5 21.9
Slide 33: Reconciliation of Net Debt to Adjusted EBITDA and Free Cash Flow
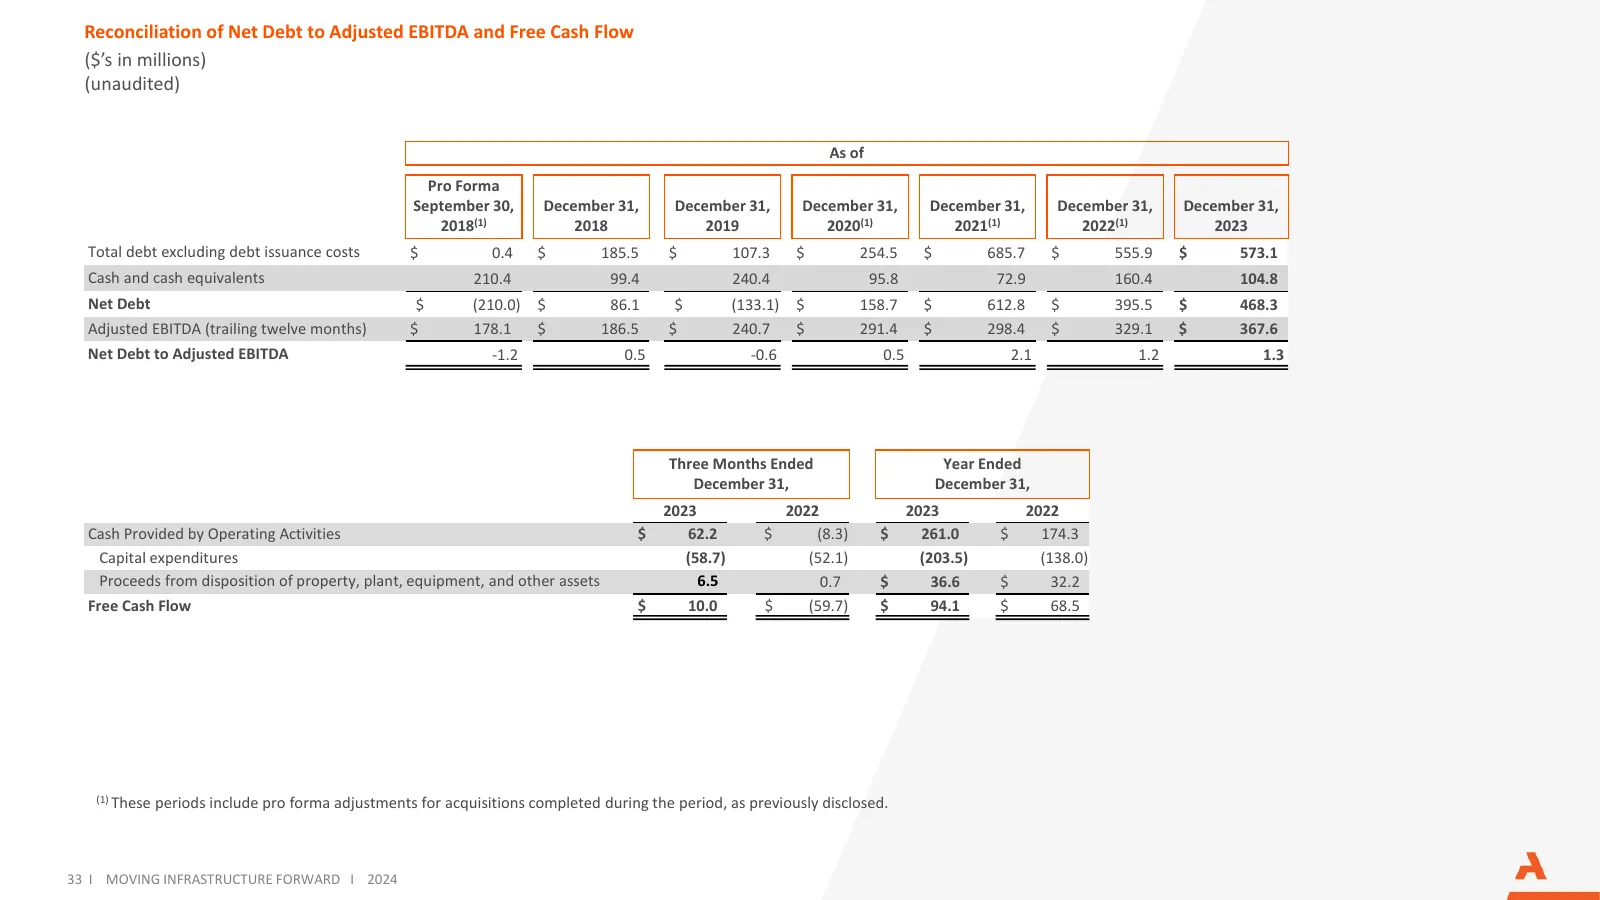
Reconciliation of Net Debt to Adjusted EBITDA and Free Cash Flow ($’s in millions) (unaudited) As of Pro Forma September 30, December 31, December 31, December 31, December 31, December 31, December 31, 2018(1) 2018 2019 2020(1) 2021(1) 2022(1) 2023 Total debt excluding debt issuance costs $ 0.4 $ 1
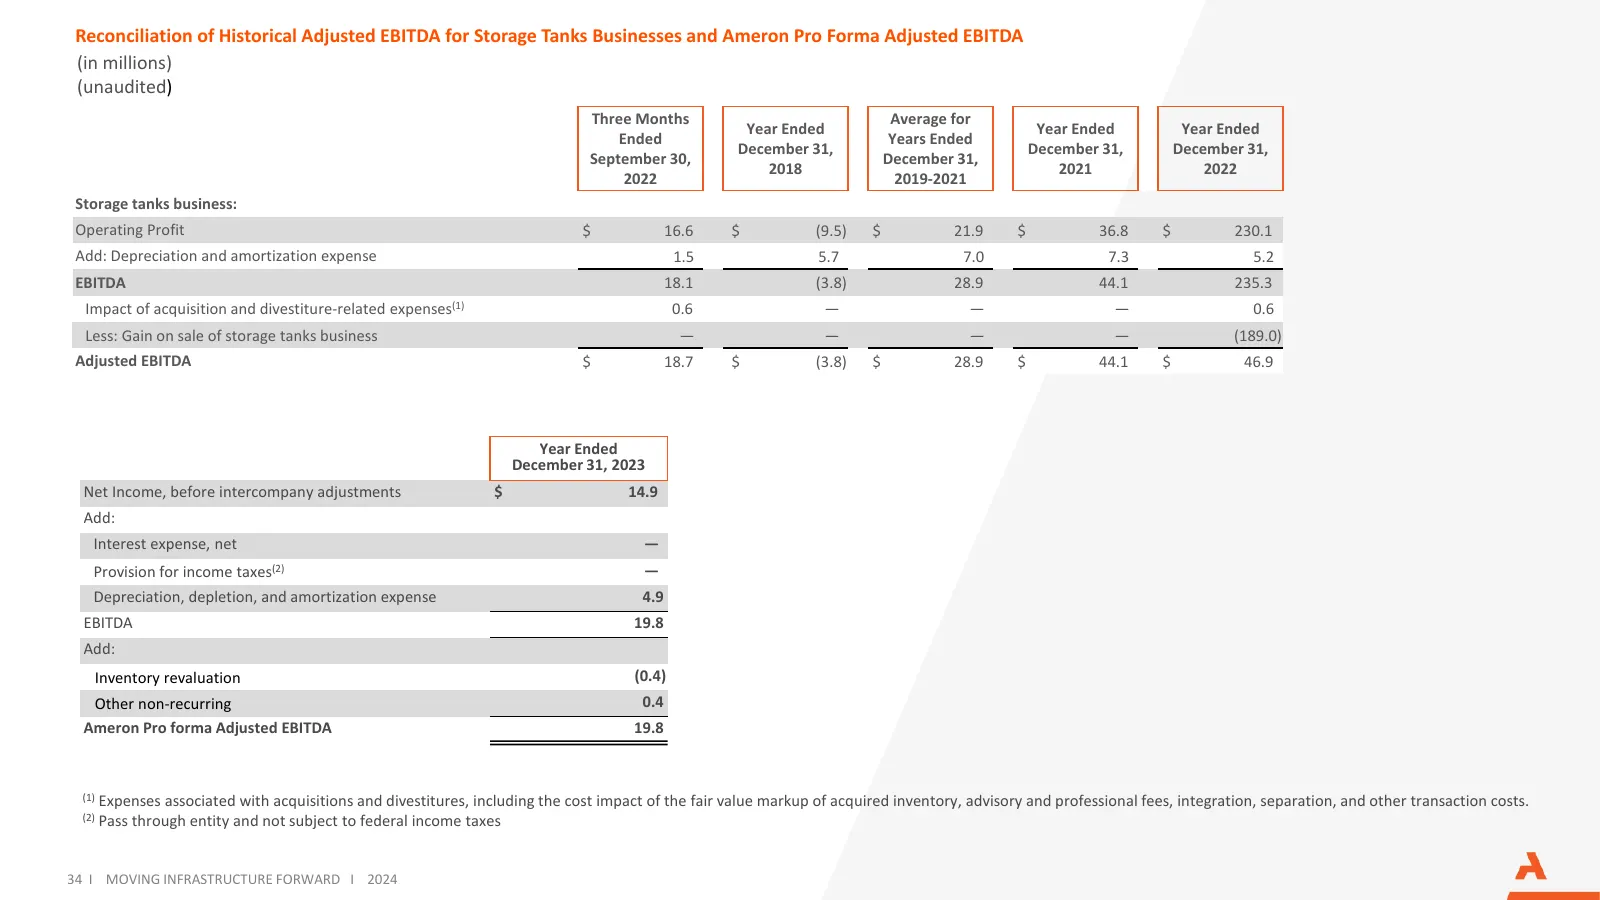
Slide 34: Reconciliation of Historical Adjusted EBITDA for Storage Tanks and Ameron Pro Forma
Reconciliation of Historical Adjusted EBITDA for Storage Tanks Businesses and Ameron Pro Forma Adjusted EBITDA (in millions) (unaudited) Three Months Average for Year Ended Year Ended Year Ended Ended Years Ended December 31, December 31, December 31, September 30, December 31, 2018 2021 2022 2022 2

Slide 35: Arcosa Contact Information
500 N. Akard Street, Suite 400 Dallas, Texas 75201 (972) 942-6500 ir.arcosa.com
Source: Internet Archive copy of s2.q4cdn.com
More decks from Arcosa, Inc.
 Investor Presentation (June 2026)23 slides · Jun 5, 2026
 Q1 2026 Earnings Presentation25 slides · May 1, 2026
 Q4 2025 Earnings Presentation27 slides · Feb 27, 2026
 Investor Presentation (November 2025)35 slides · Nov 10, 2025
 Q3 2025 Earnings Presentation24 slides · Oct 31, 2025
 Investor Presentation (September 2025)37 slides · Sep 12, 2025