PT Sarana Menara Nusantara Tbk · IDX:TOWR
PT Sarana Menara Nusantara Tbk — Q3 2017 Earnings Presentation
24 slides from PT Sarana Menara Nusantara Tbk's earnings presentation, October 2017
Slide 1: Indonesia's Premier Telecommunication Infrastructure Company: 3Q 2017 Results Presentation
PROTELINDO PT. SARANA MENARA NUSANTARA, TBK. (TOWR) Indonesia’s Premier Telecommunication Infrastructure Company 3Q 2017 Results Presentation
Slide 2: Disclaimer
Disclaimer These materials have been prepared by PT Sarana Menara Nusantara, Tbk. (the “Company”) and have not been independently verified. No representation or warranty, expressed or implied, is made and no reliance should be placed on the accuracy, fairness or completeness of the information prese
Slide 3: Agenda
Agenda Strategy Market Overview Summary Financial Results 2
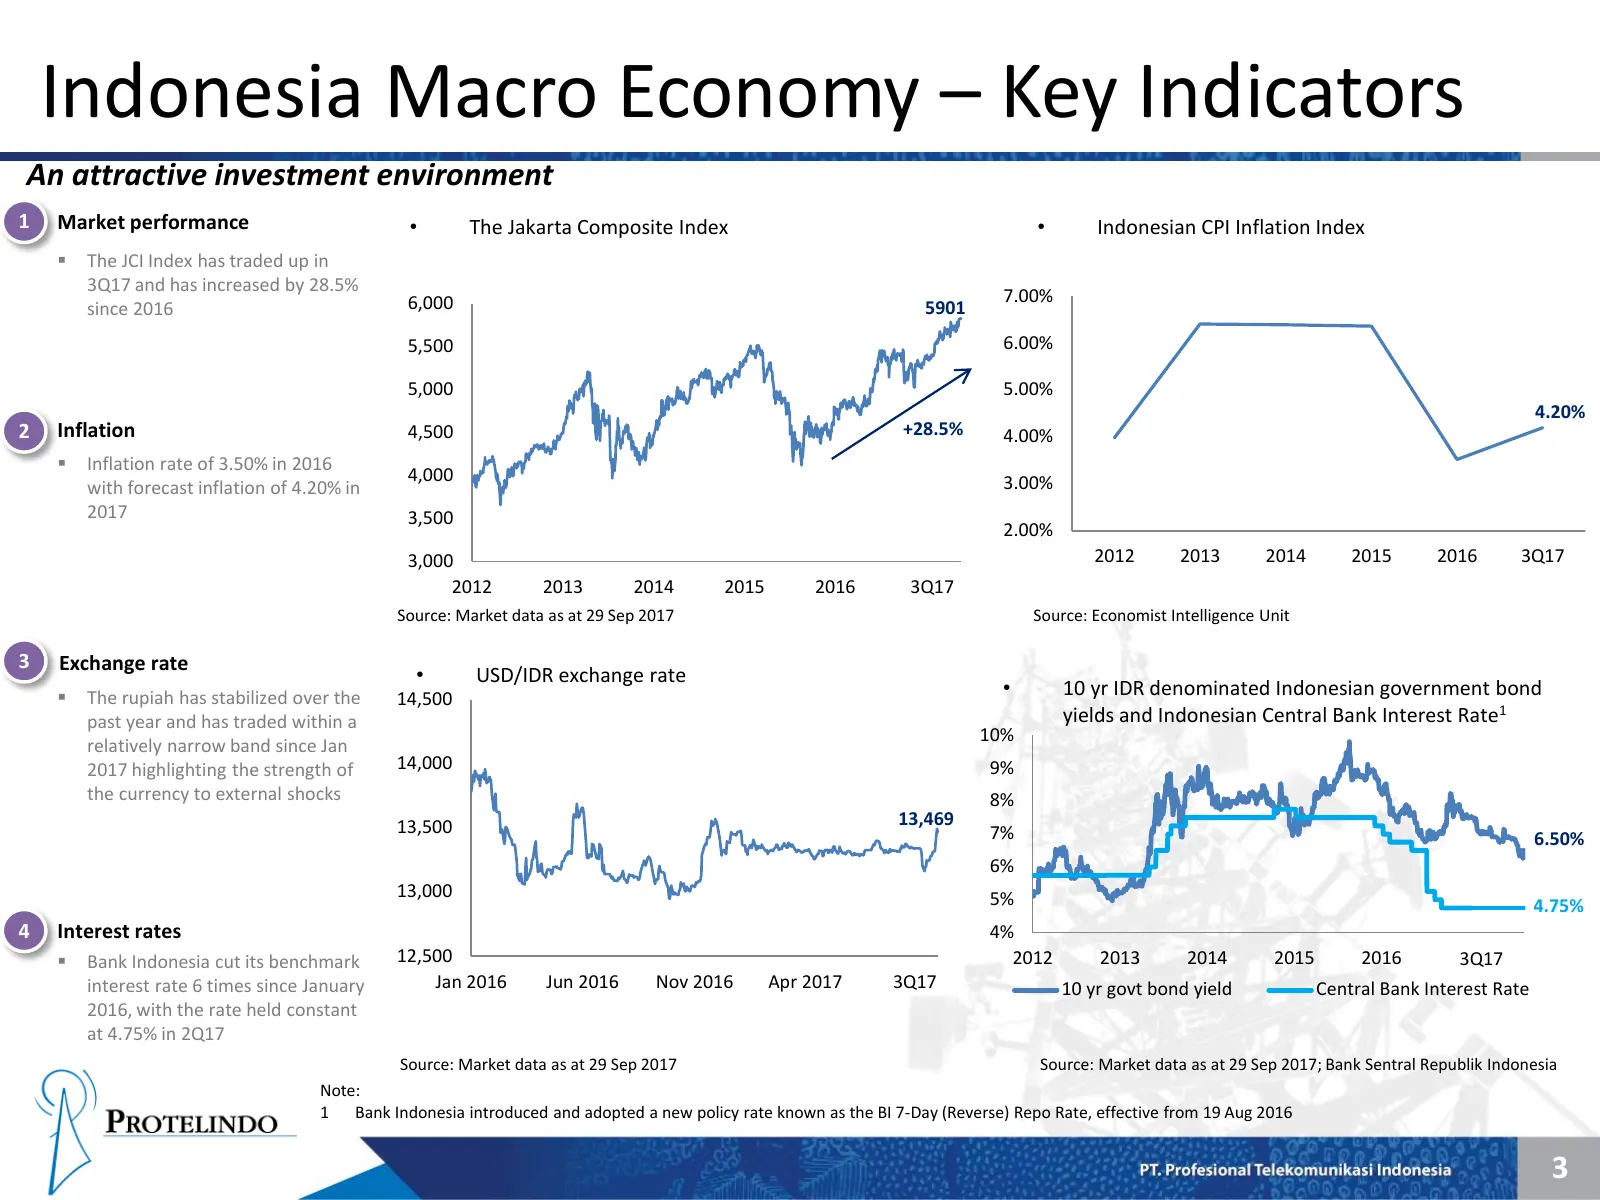
Slide 4: Indonesia Macro Economy – Key Indicators
Indonesia Macro Economy – Key Indicators An attractive investment environment 1 Market performance • The Jakarta Composite Index • Indonesian CPI Inflation Index The JCI Index has traded up in 3Q17 and has increased by 28.5% 6,000 7.00% since 2016 5901 5,500 6.00% 5,000 5.00% 4.20% 2 Inflation 4,5
Slide 5: Indonesia Telecom Industry – Outlook
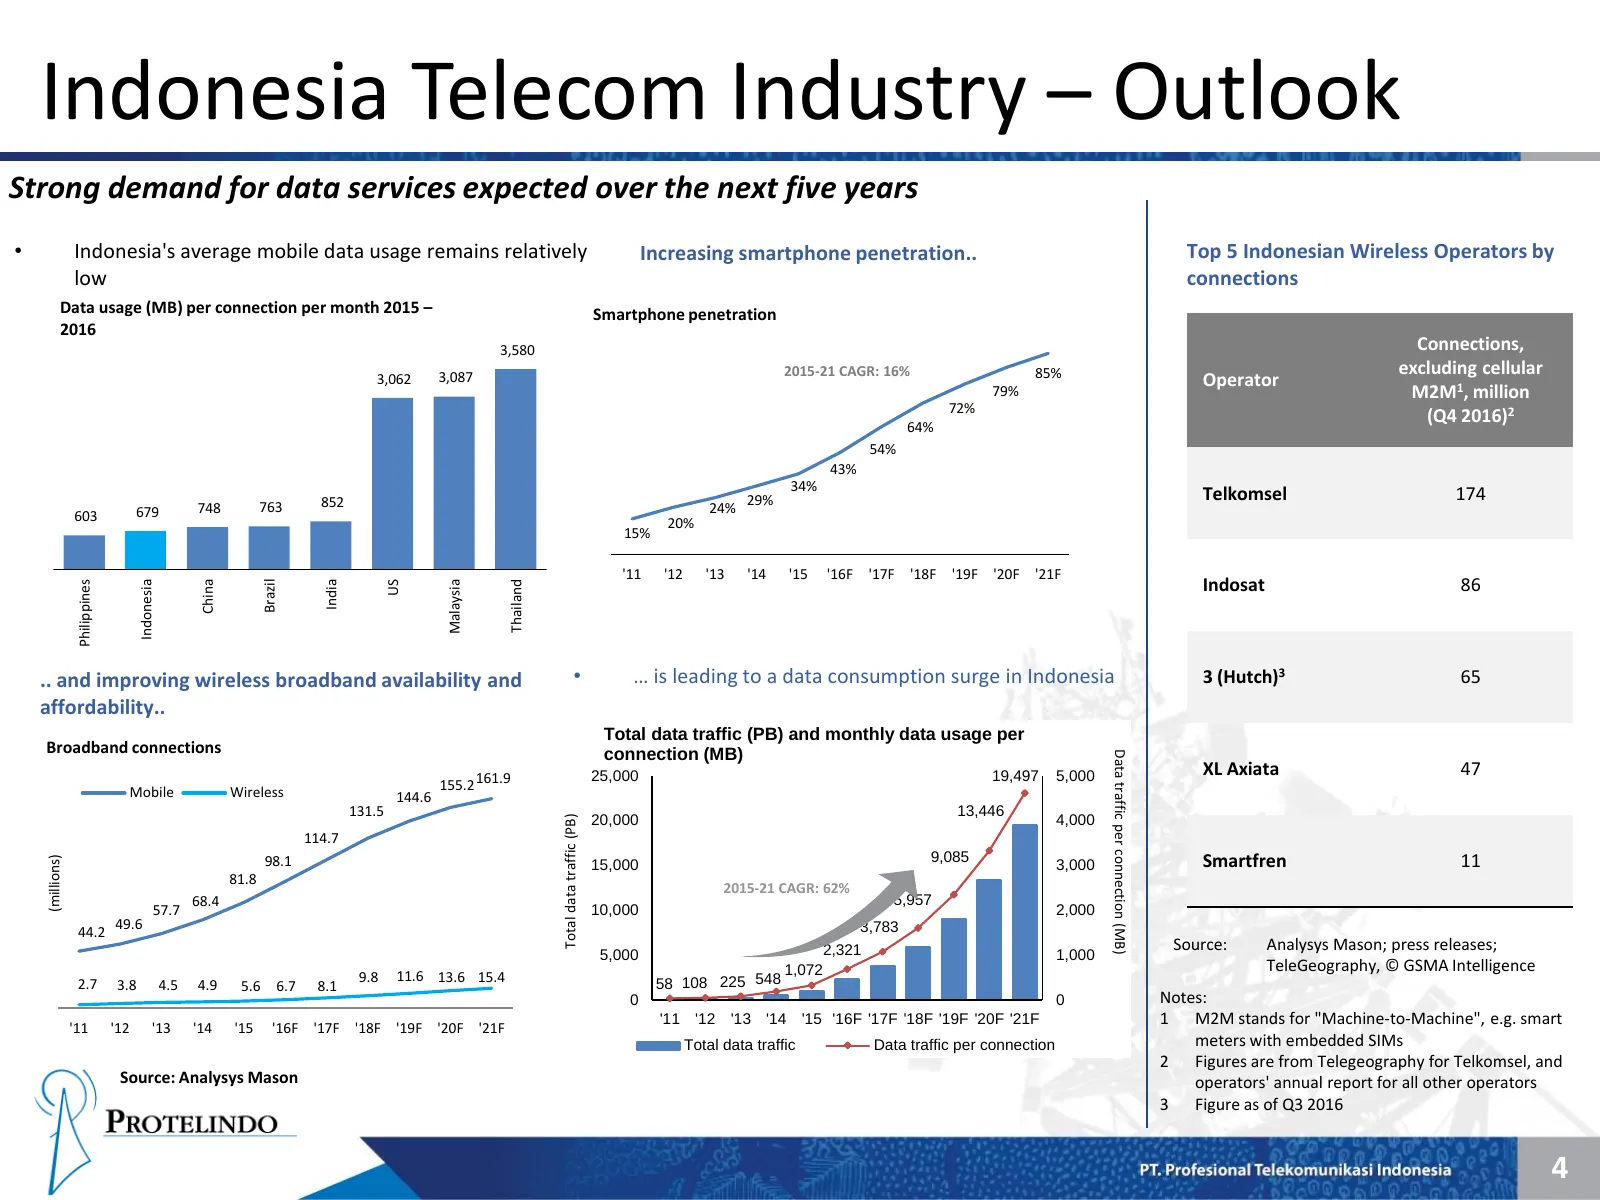
Indonesia Telecom Industry – Outlook Strong demand for data services expected over the next five years • Indonesia's average mobile data usage remains relatively Increasing smartphone penetration.. Top 5 Indonesian Wireless Operators by low connections Data usage (MB) per connection per month 2015 –
Slide 6: Indonesian Tower Industry – Key Growth Drivers
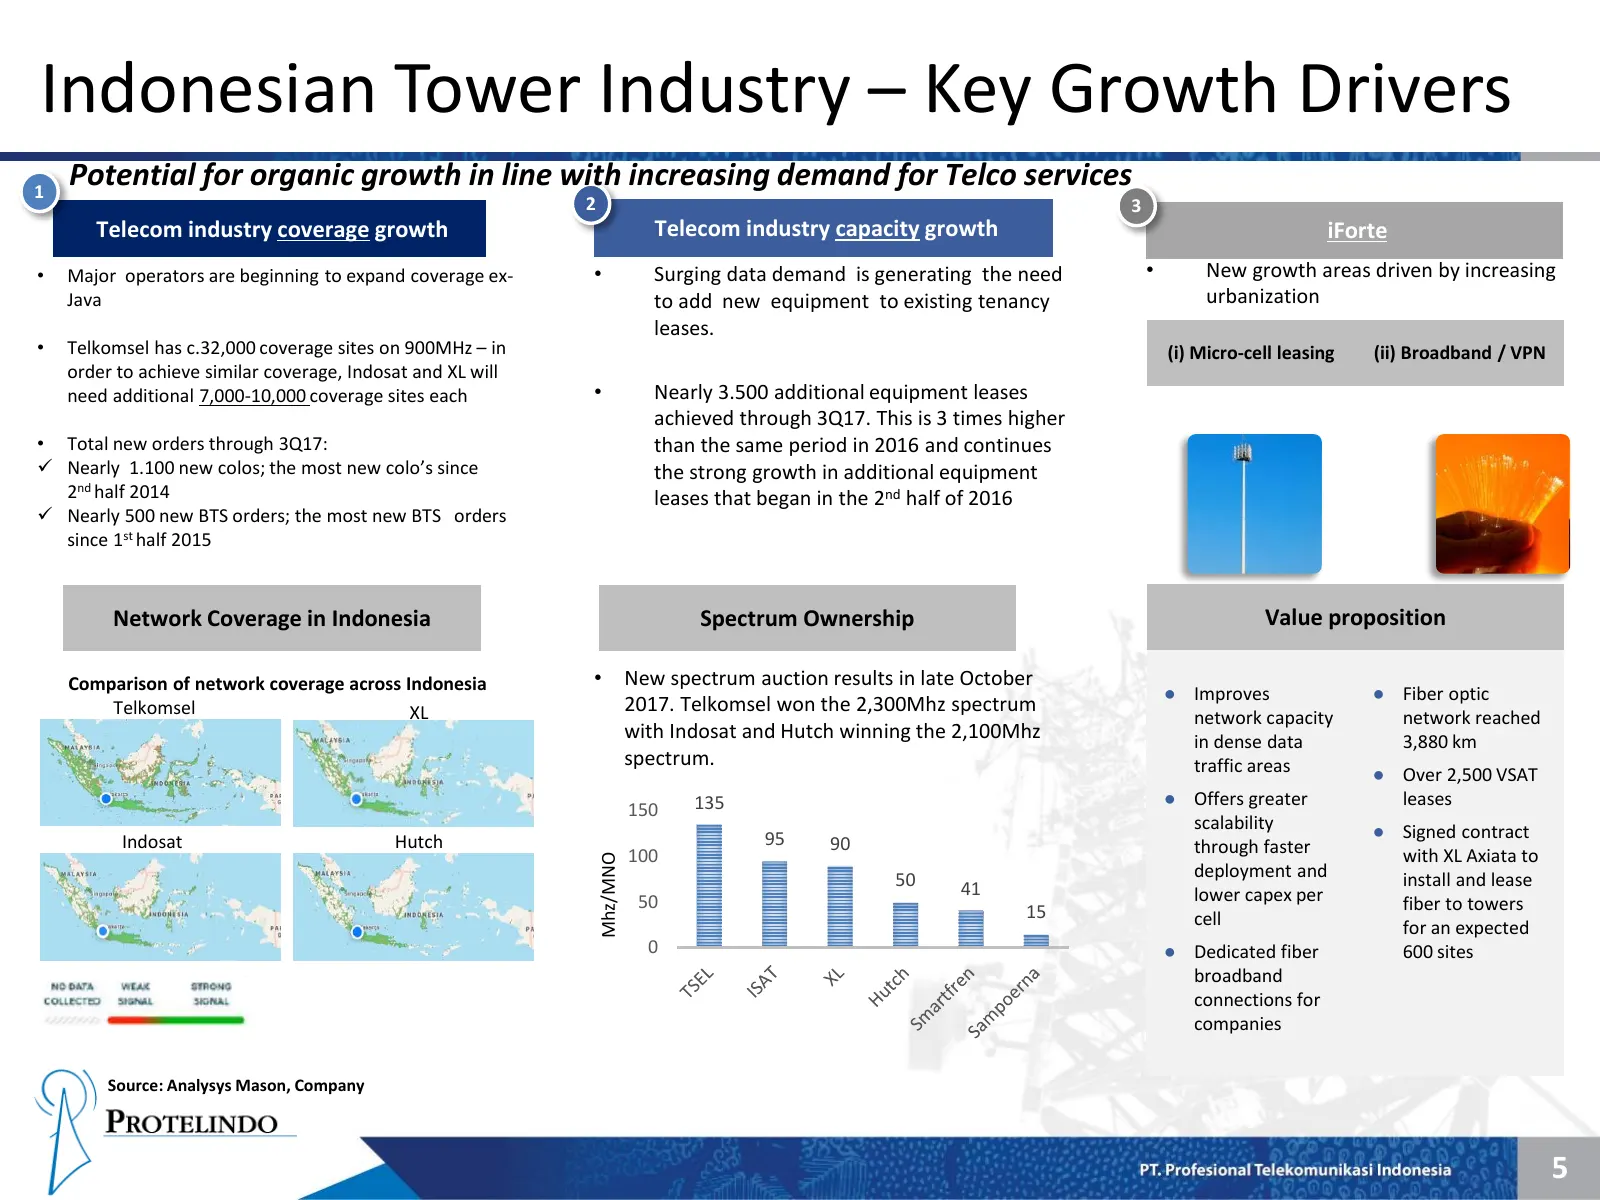
Indonesian Tower Industry – Key Growth Drivers 1 Potential for organic growth in line with increasing demand for Telco services 2 3 Telecom industry coverage growth Telecom industry capacity growth iForte • Major operators are beginning to expand coverage ex- • Surging data demand is generating the
Slide 7: Work Orders Received Through Oct 2017
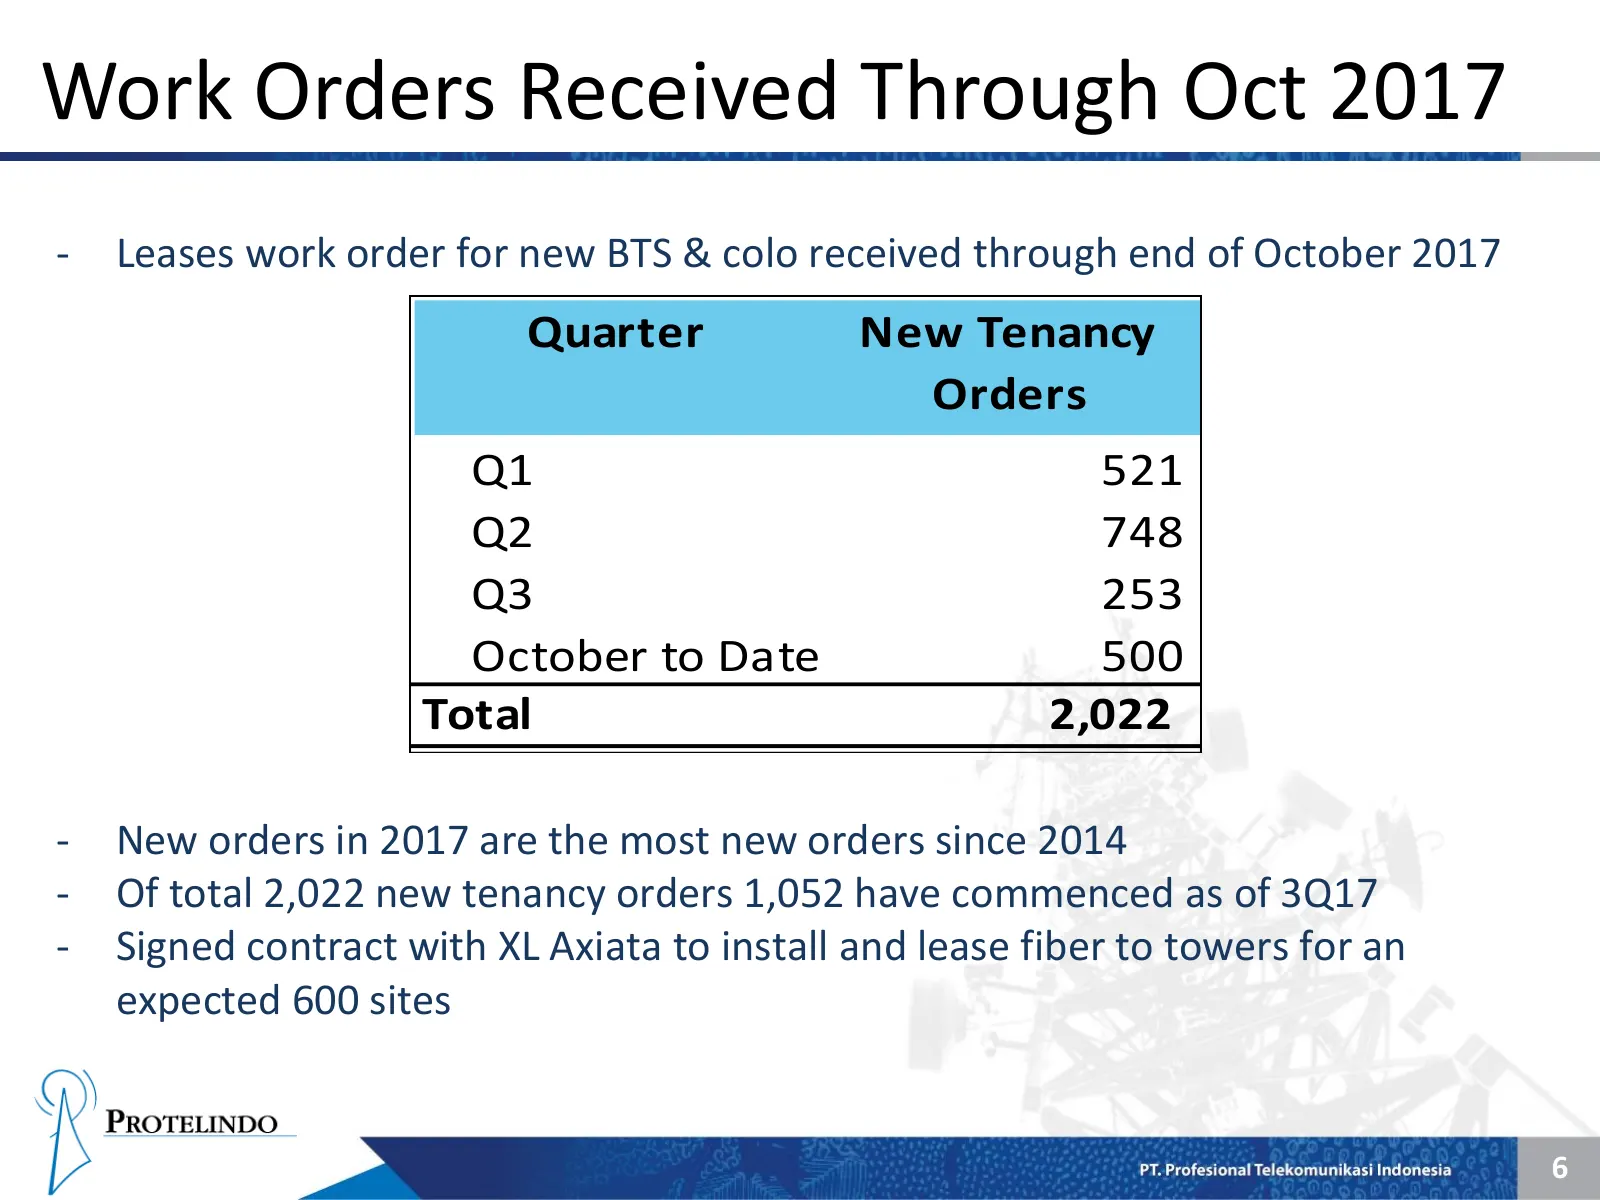
Work Orders Received Through Oct 2017 - Leases work order for new BTS & colo received through end of October 2017 Quarter New Tenancy Orders Q1 521 Q2 748 Q3 253 October to Date 500 Total 2,022 - New orders in 2017 are the most new orders since 2014 - Of total 2,022 new tenancy orders 1,052 have com
Slide 8: Indonesian Tower Industry – Key Growth Drivers
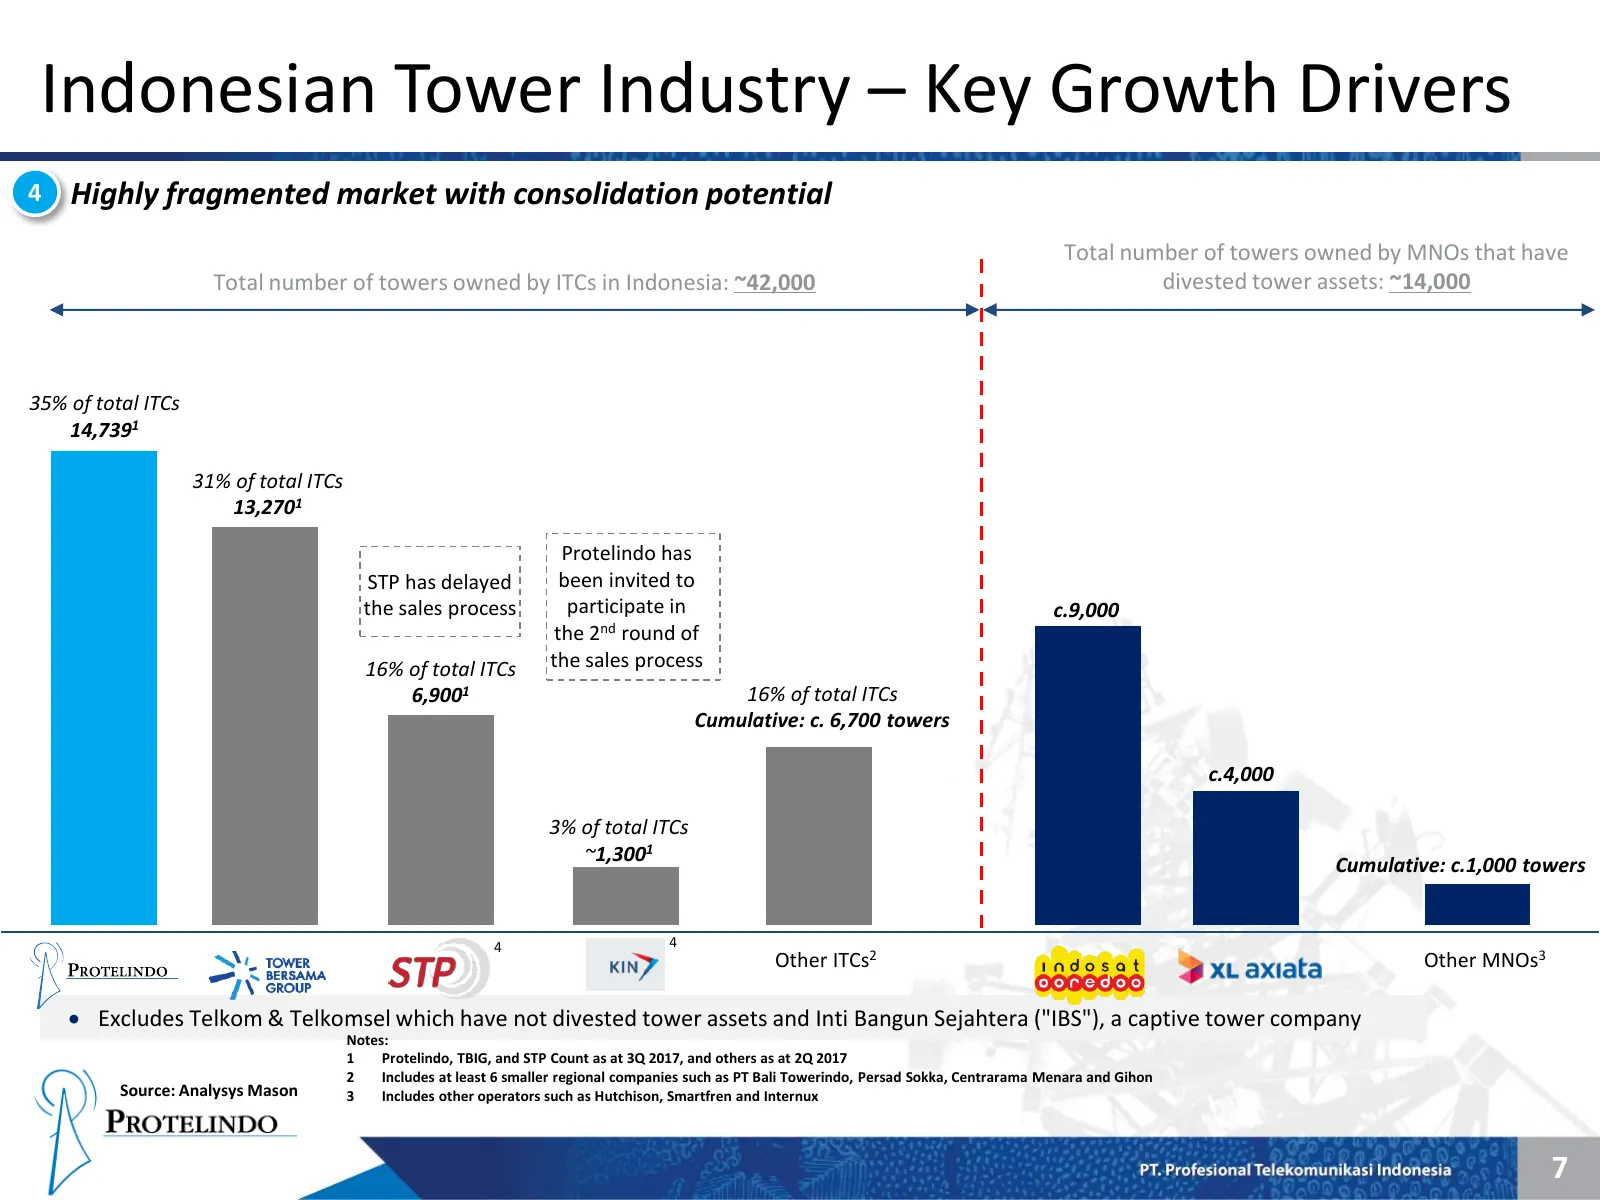
Indonesian Tower Industry – Key Growth Drivers 4 Highly fragmented market with consolidation potential Total number of towers owned by MNOs that have Total number of towers owned by ITCs in Indonesia: ~42,000 divested tower assets: ~14,000 35% of total ITCs 14,7391 31% of total ITCs 13,2701 Protelin
Slide 9: Indonesia's Tower Company Comparison
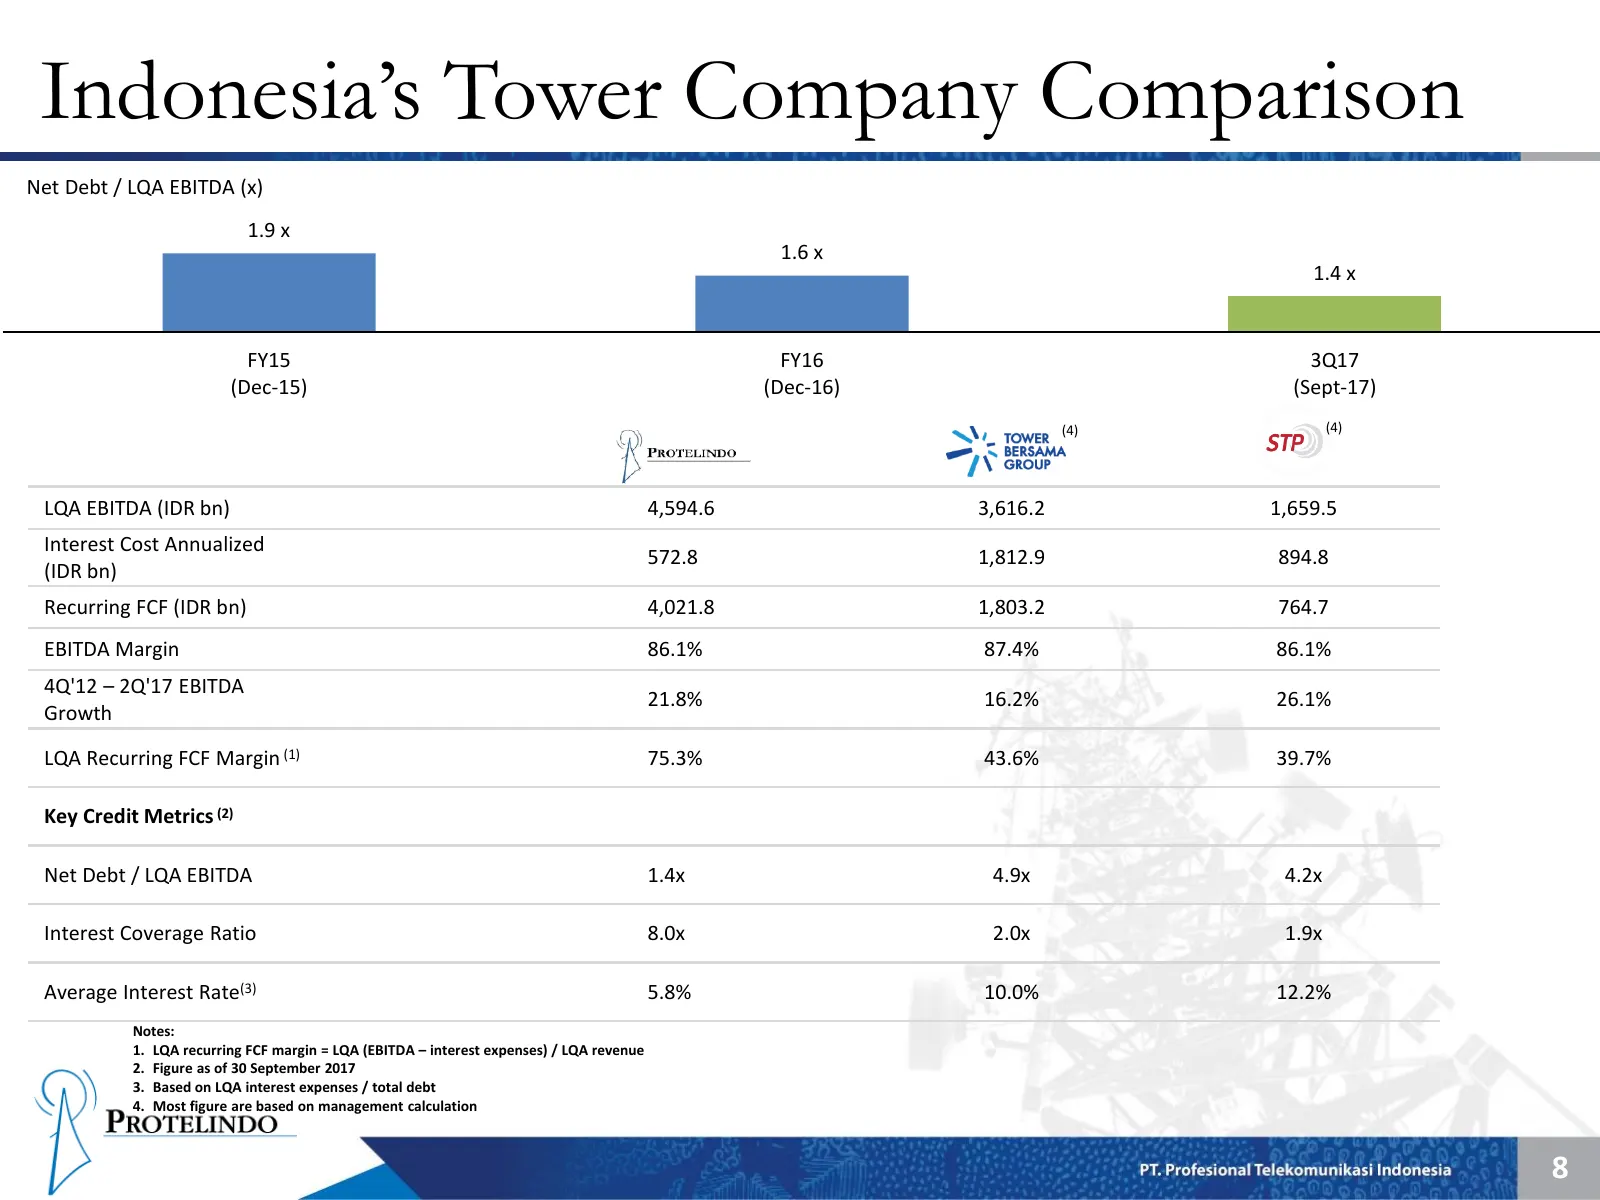
Indonesia’s Tower Company Comparison Net Debt / LQA EBITDA (x) 1.9 x 1.6 x 1.4 x FY15 FY16 3Q17 (Dec-15) (Dec-16) (Sept-17) (4) (4) LQA EBITDA (IDR bn) 4,594.6 3,616.2 1,659.5 Interest Cost Annualized 572.8 1,812.9 894.8 (IDR bn) Recurring FCF (IDR bn) 4,021.8 1,803.2 764.7 EBITDA Margin 86.1% 87.4%
Slide 10: Improved Stock Liquidity and Valuation Post re-IPO
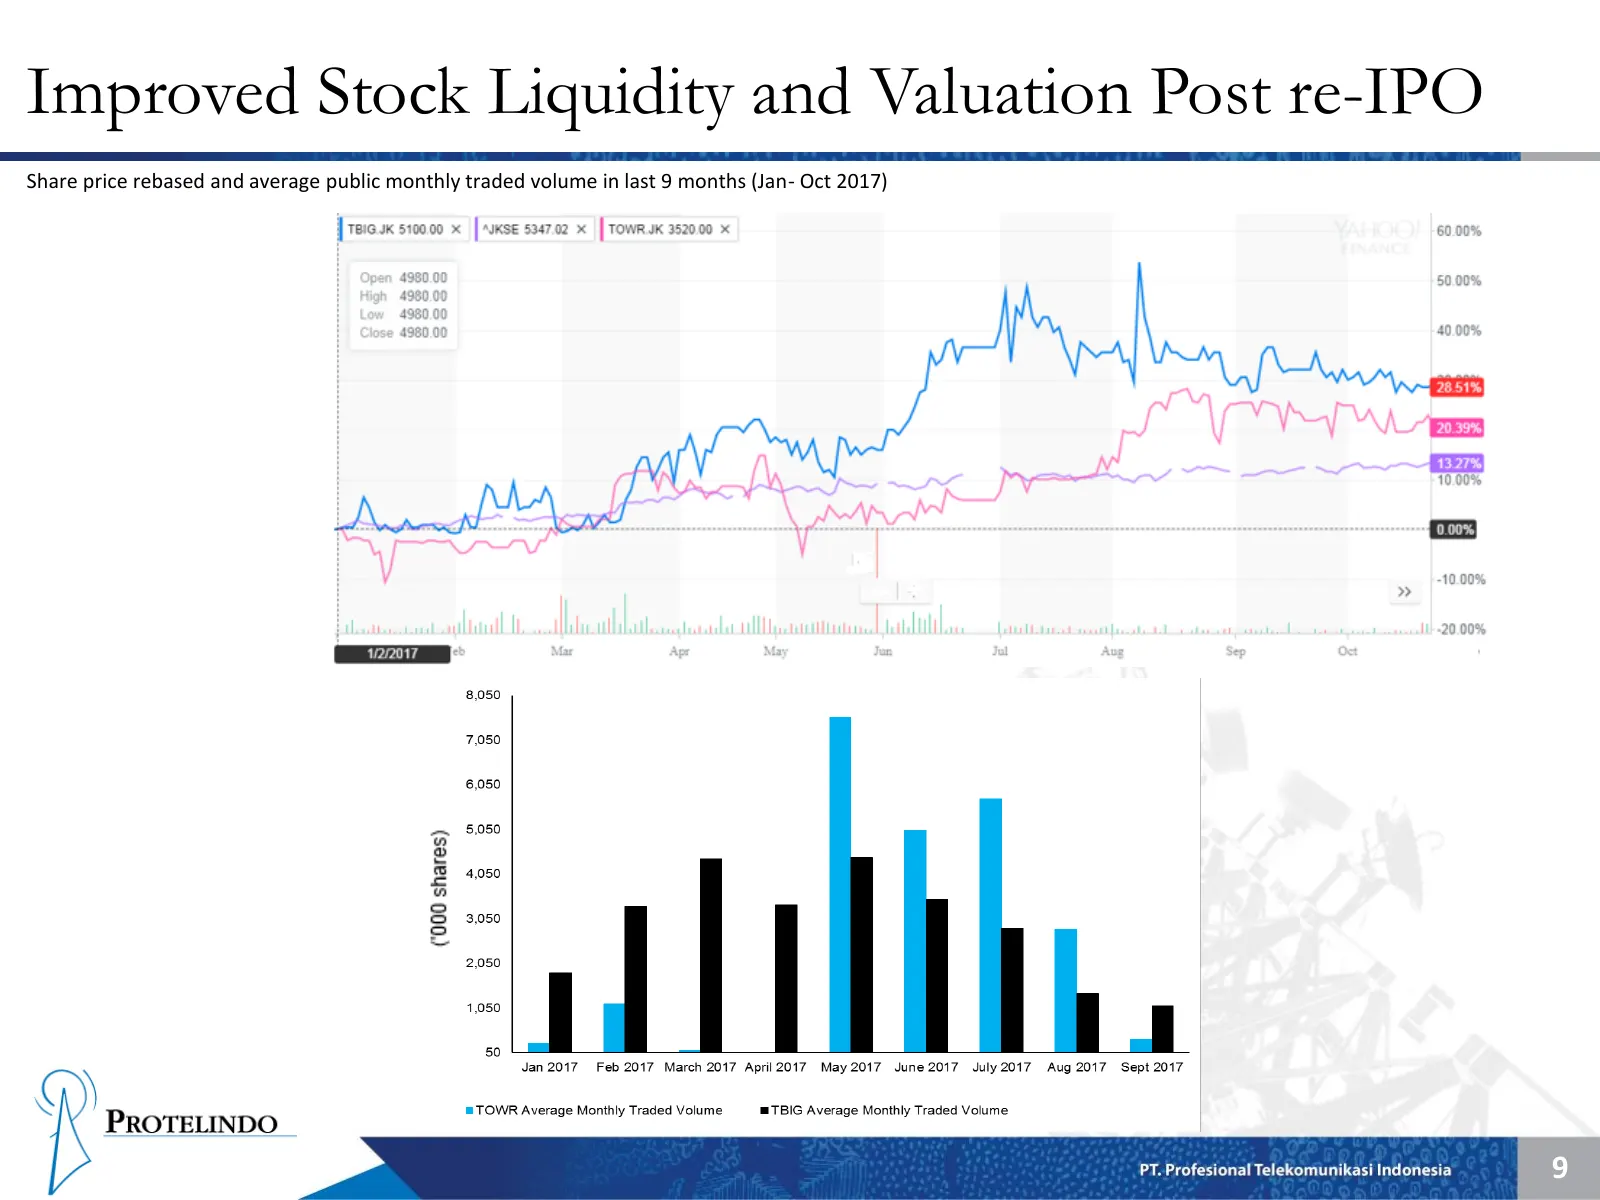
Improved Stock Liquidity and Valuation Post re-IPO Share price rebased and average public monthly traded volume in last 9 months (Jan- Oct 2017) 9
Slide 11: Debt Profile
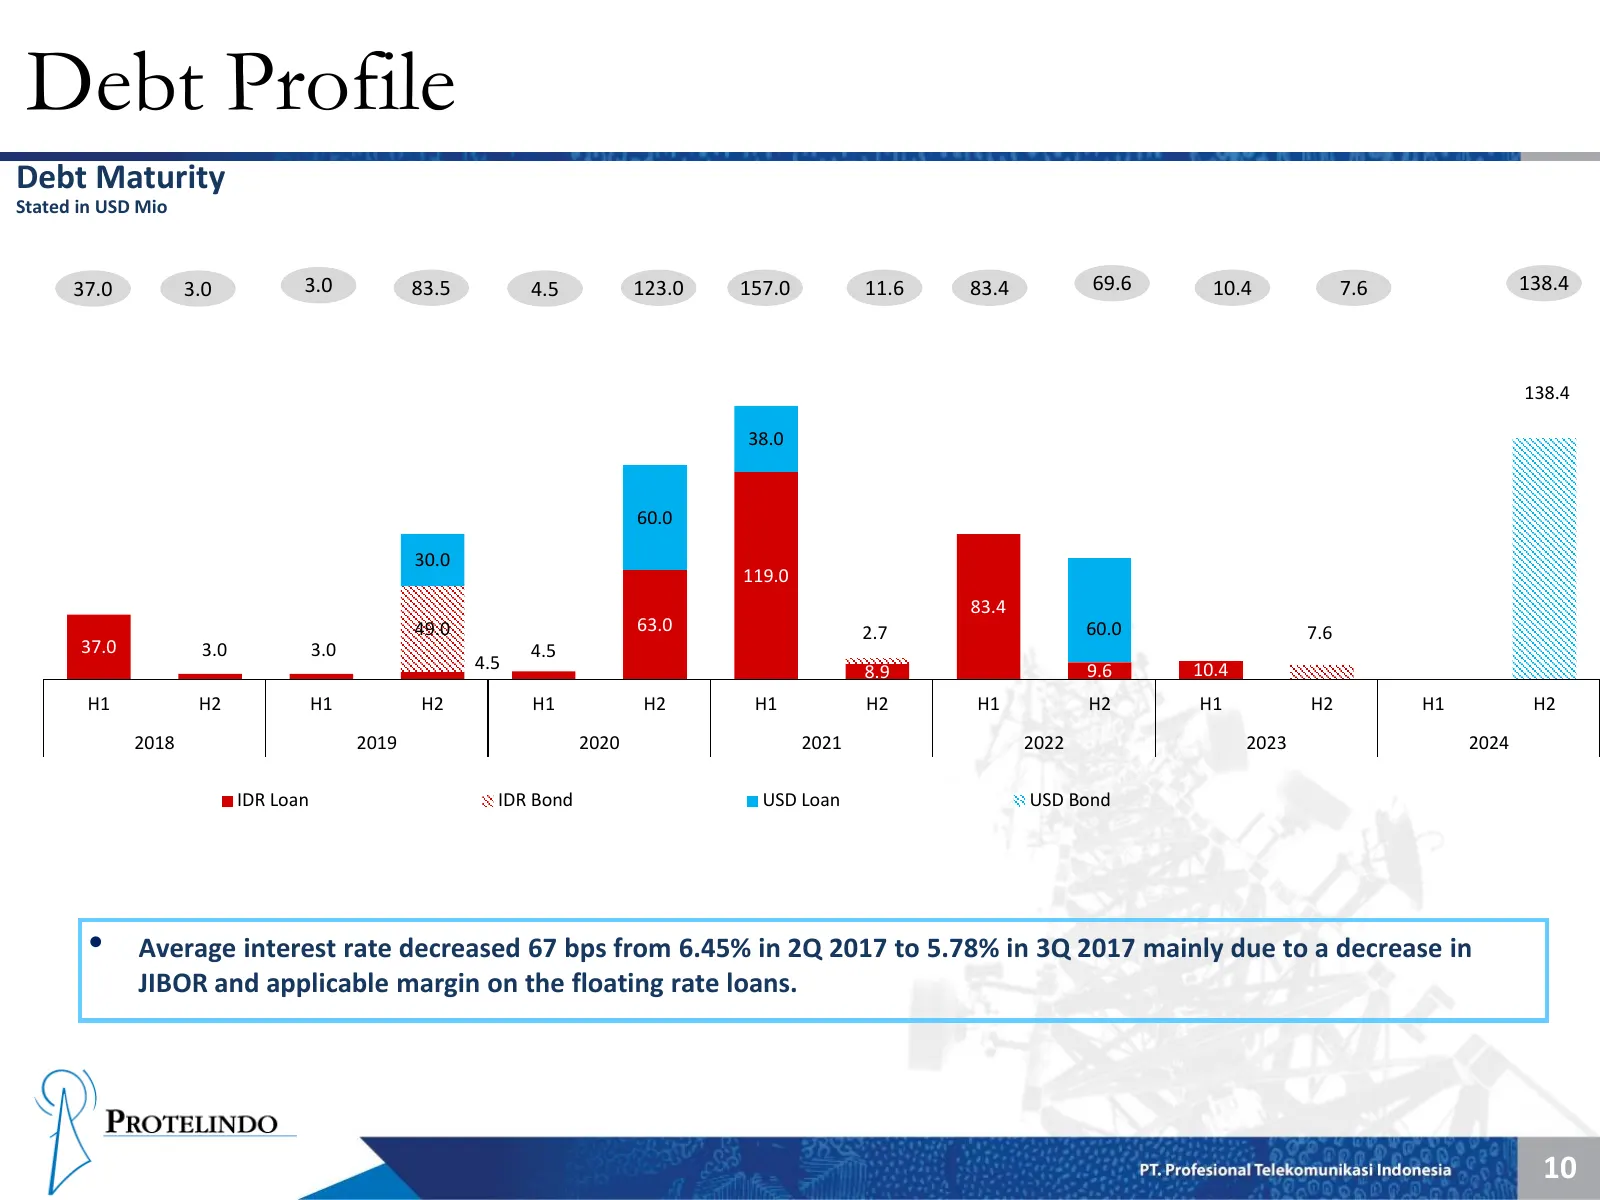
Debt Profile Debt Maturity Stated in USD Mio 37.0 3.0 3.0 83.5 4.5 123.0 157.0 11.6 83.4 69.6 10.4 7.6 138.4 138.4 38.0 60.0 30.0 119.0 83.4 49.0 63.0 2.7 60.0 7.6 37.0 3.0 3.0 4.5 4.5 8.9 9.6 10.4 H1 H2 H1 H2 H1 H2 H1 H2 H1 H2 H1 H2 H1 H2 2018 2019 2020 2021 2022 2023 2024 IDR Loan IDR Bond USD Loa
Slide 12: And History of Strong Growth
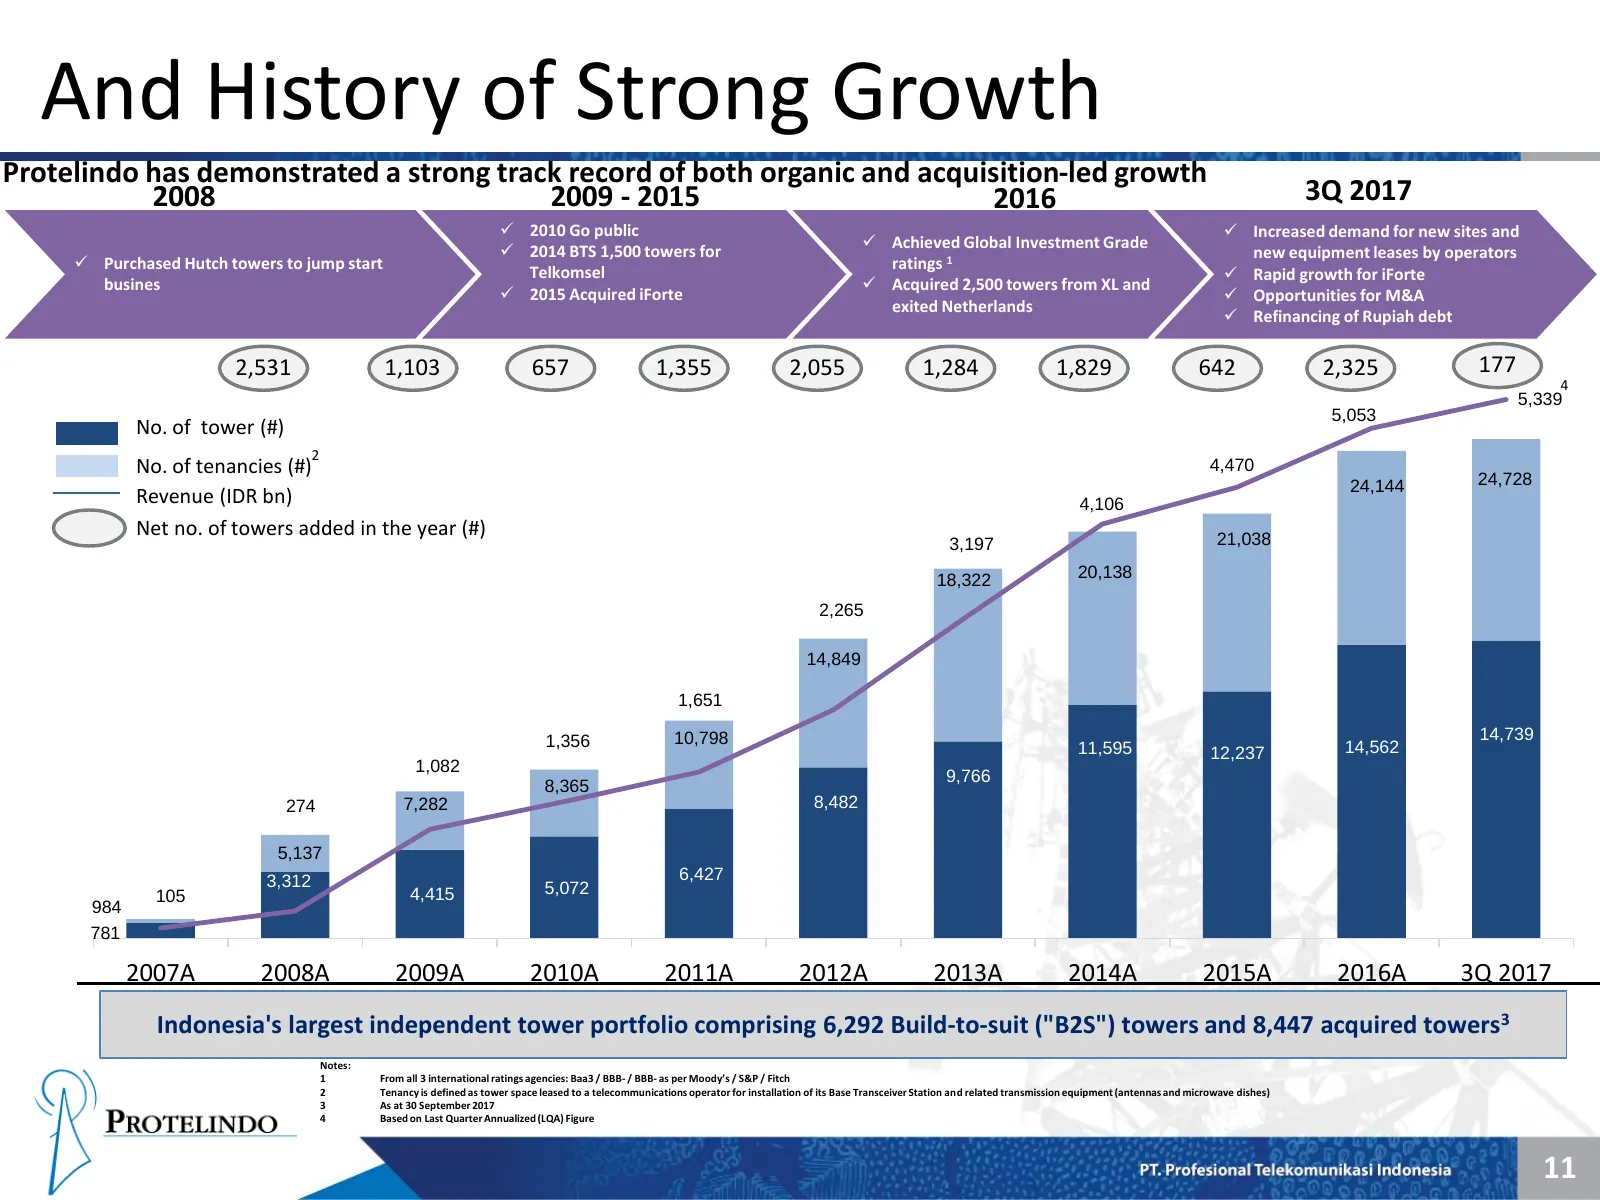
And History of Strong Growth Protelindo has demonstrated a strong track record of both organic and acquisition-led growth 2008 2009 - 2015 2016 3Q 2017 2010 Go public Increased demand for new sites and Achieved Global Investment Grade 2014 BTS 1,500 towers for new equipment leases by operato
Slide 13: Protelindo Snapshot
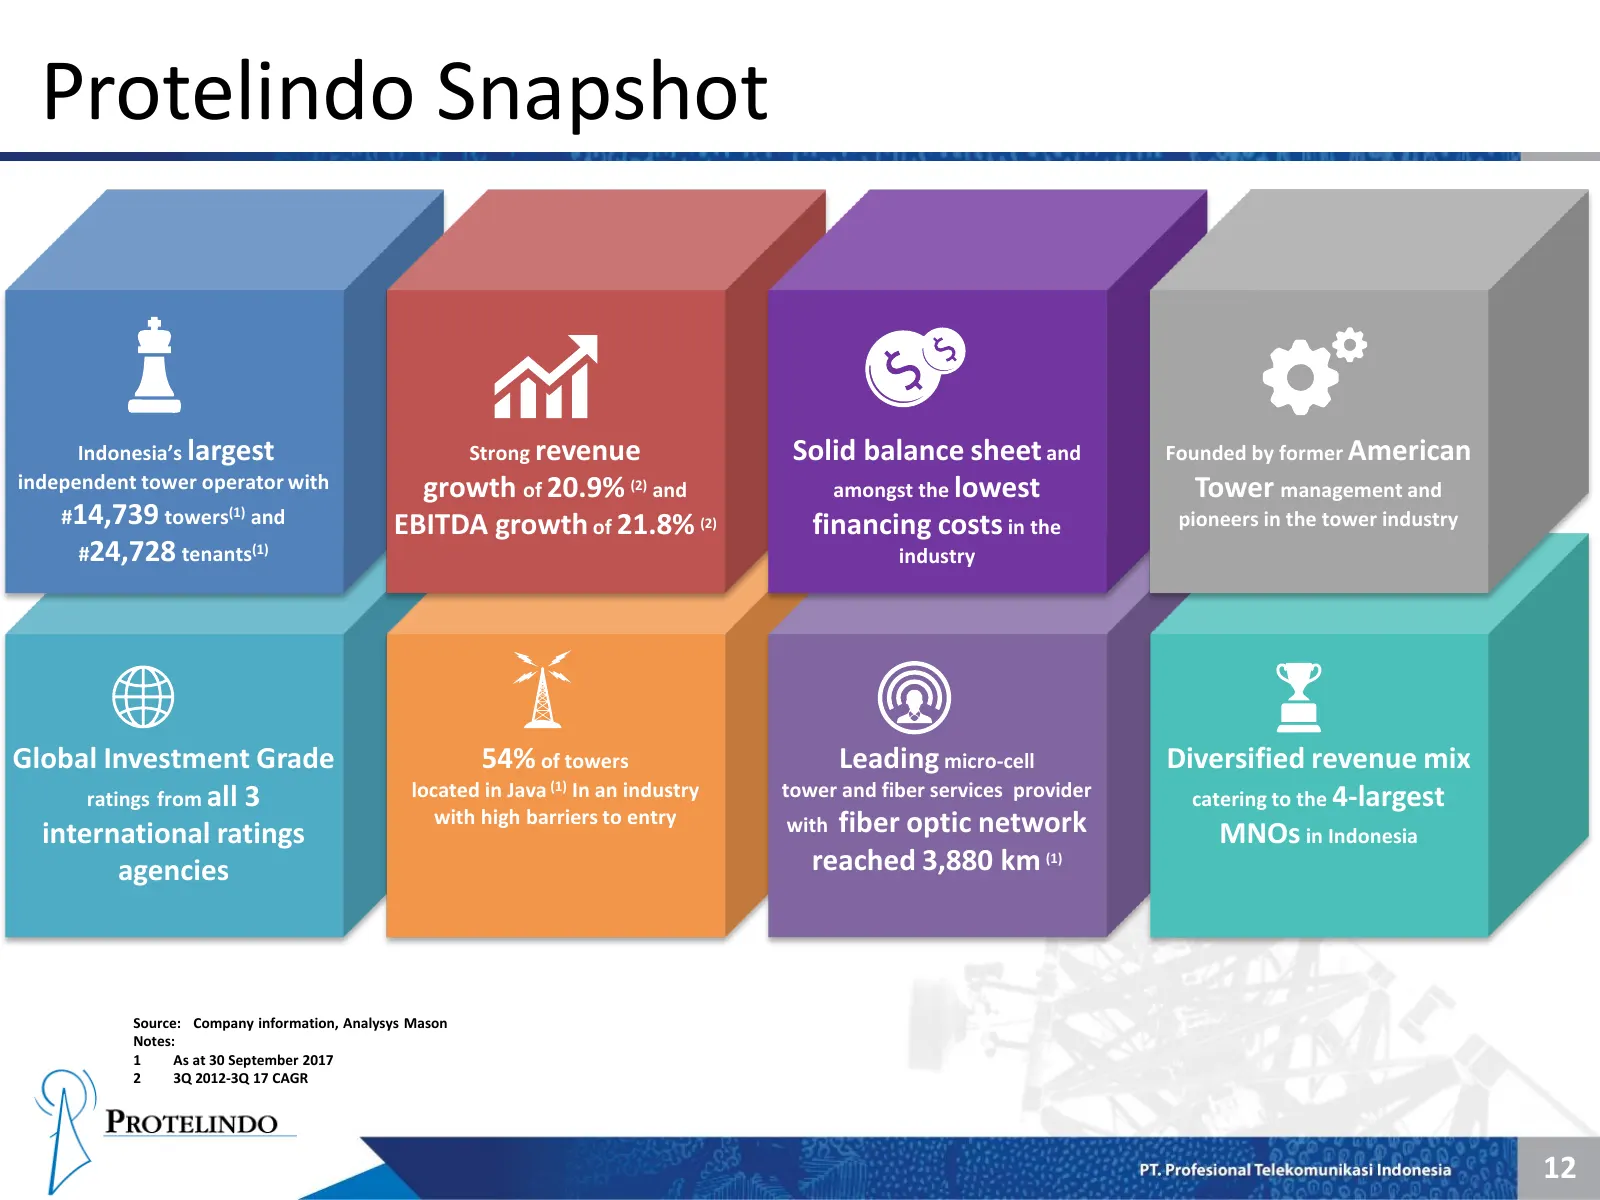
Protelindo Snapshot Indonesia’s largest Strong revenue Solid balance sheet and Founded by former American independent tower operator with growth of 20.9% (2) and amongst the lowest Tower management and #14,739 towers(1) and EBITDA growth of 21.8% (2) financing costs in the pioneers in the tower indu
Slide 14: Summary Financial Results
Summary Financial Results h PROTELINDO
Slide 15: 3Q 2017 Financial Results: Revenue
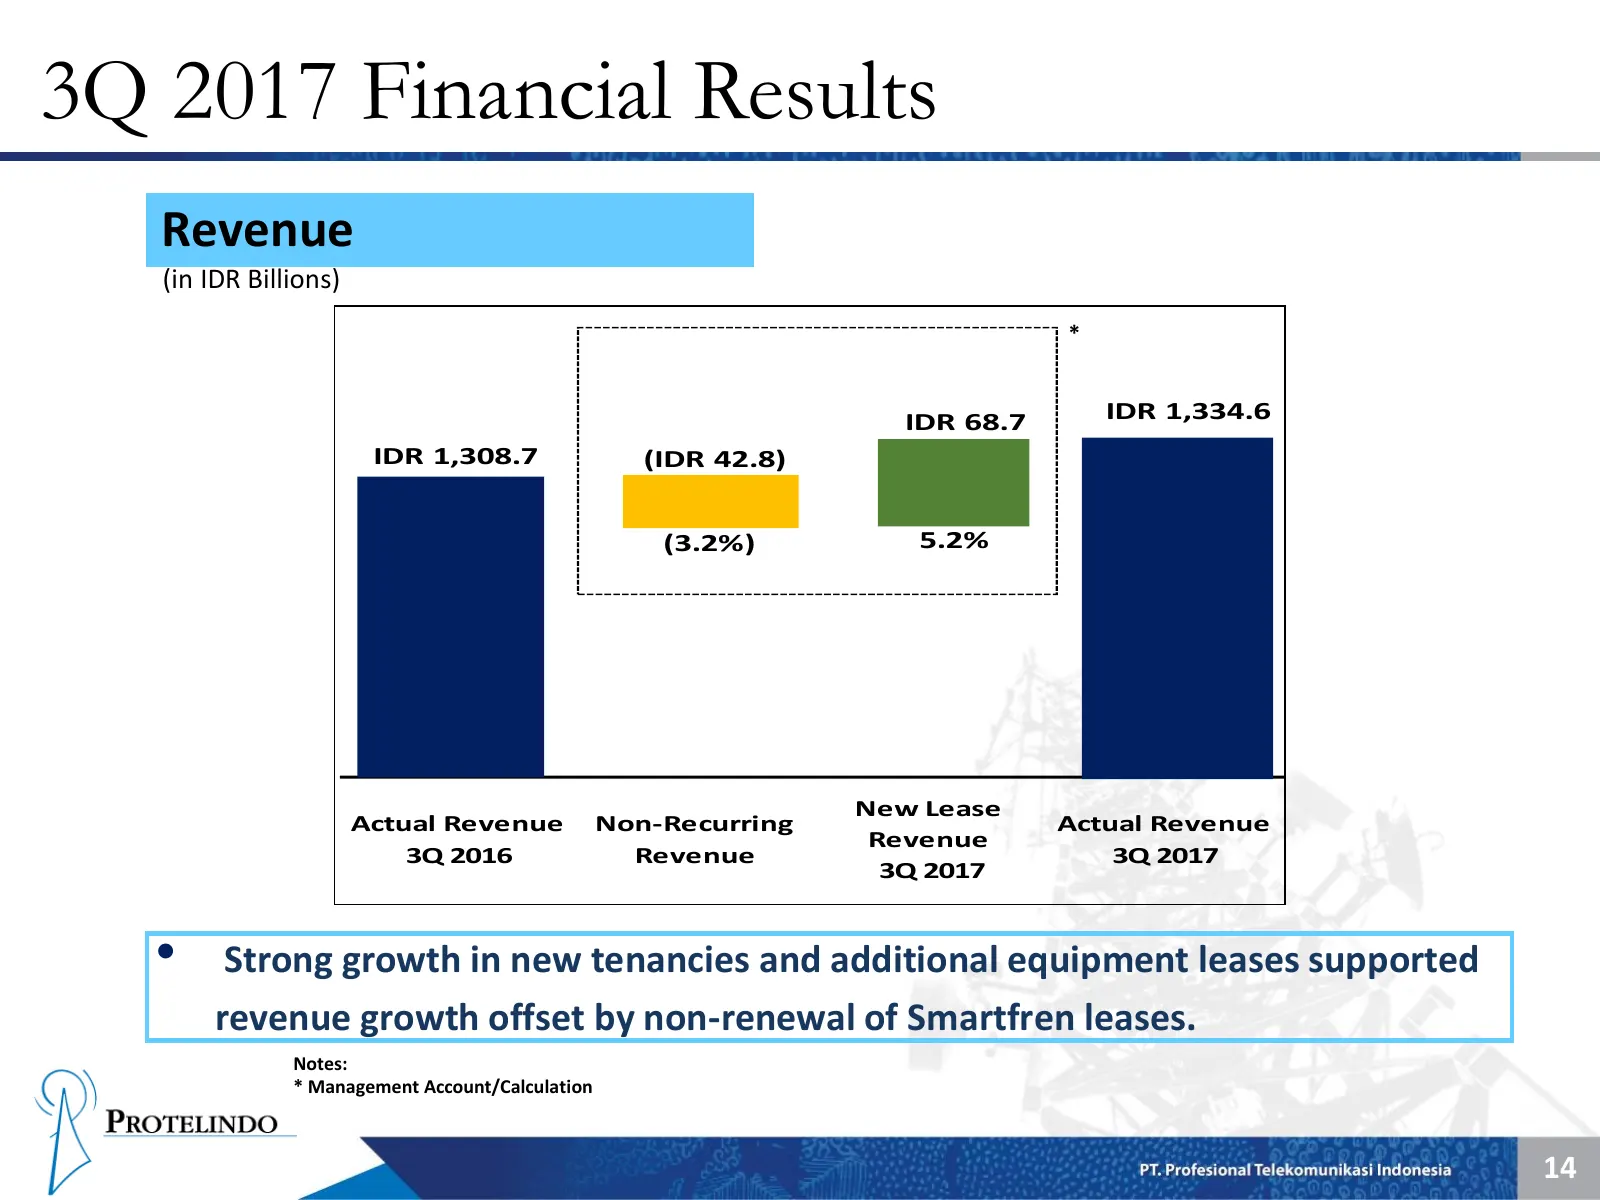
3Q 2017 Financial Results Revenue (in IDR Billions) * IDR 68.7 IDR 1,334.6 IDR 1,308.7 (IDR 42.8) (3.2%) 5.2% New Lease Actual Revenue Non-Recurring Actual Revenue Revenue 3Q 2016 Revenue 3Q 2017 3Q 2017 • Strong growth in new tenancies and additional equipment leases supported revenue growth offset
Slide 16: 3Q 2017 Financial Results: EBITDA
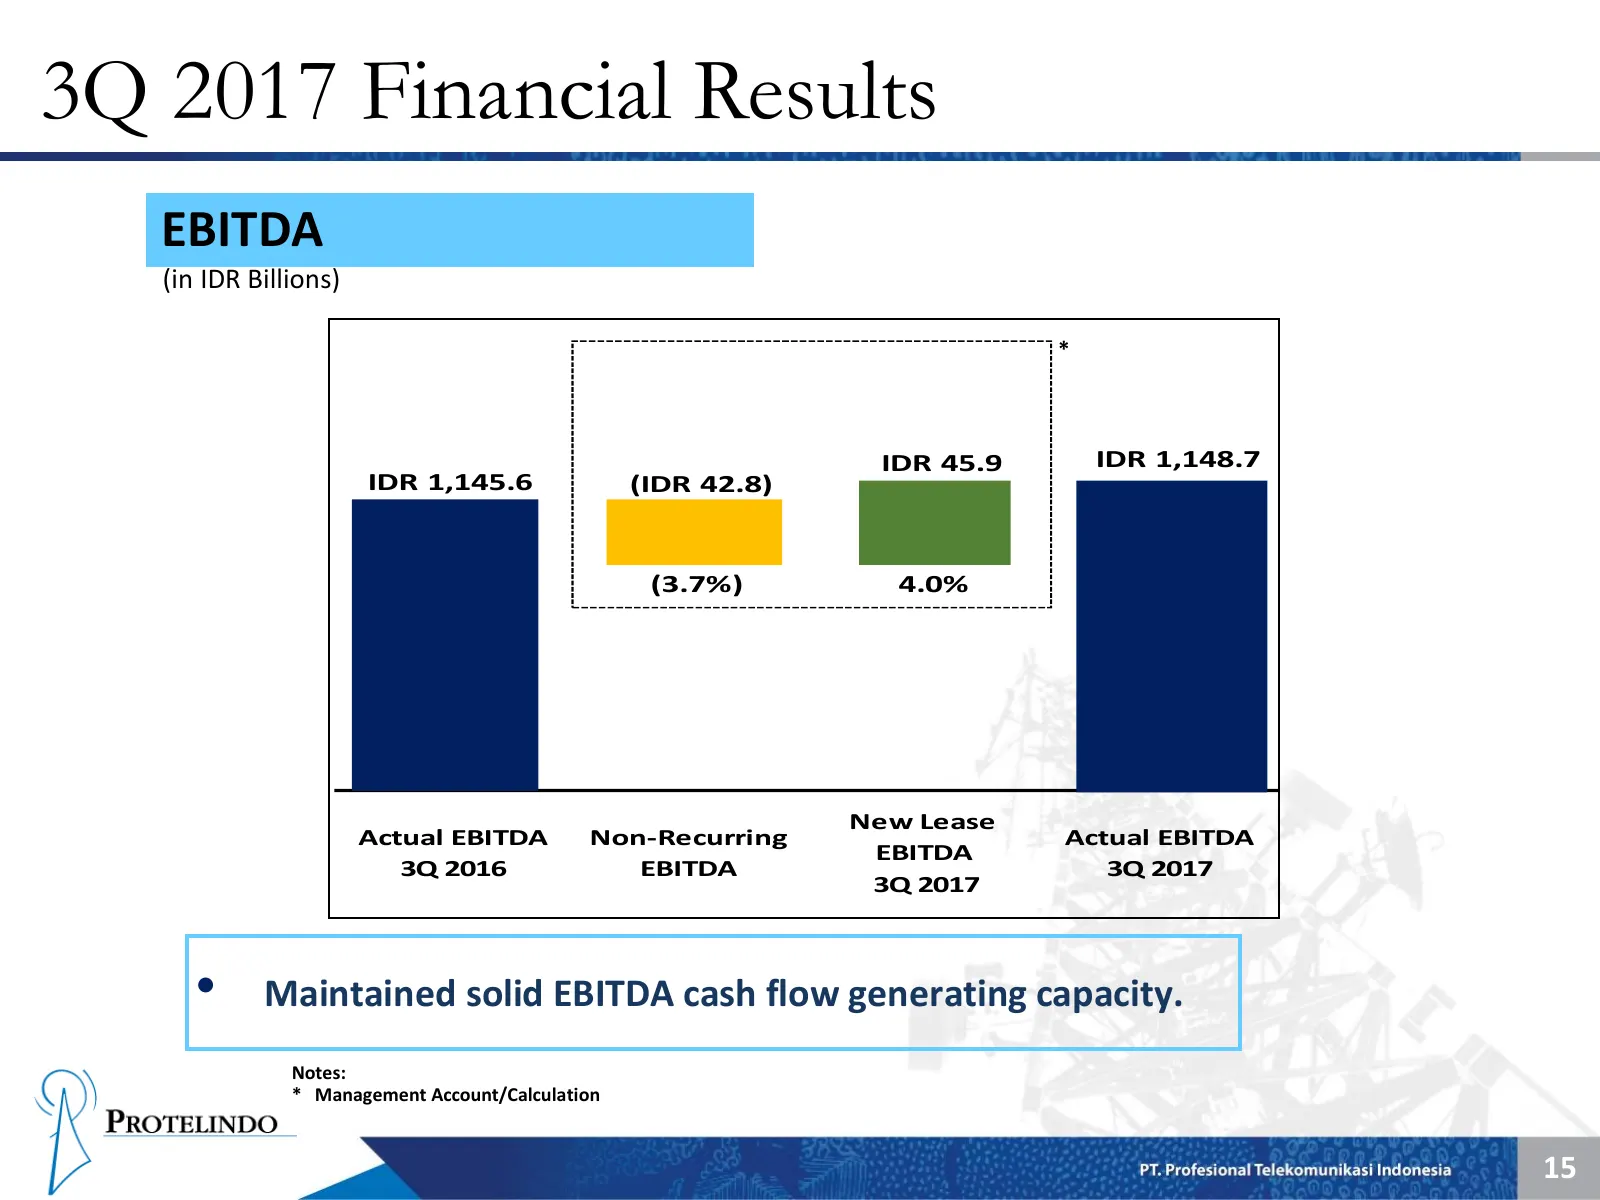
3Q 2017 Financial Results EBITDA (in IDR Billions) * IDR 45.9 IDR 1,148.7 IDR 1,145.6 (IDR 42.8) (3.7%) 4.0% New Lease Actual EBITDA Non-Recurring Actual EBITDA EBITDA 3Q 2016 EBITDA 3Q 2017 3Q 2017 • Maintained solid EBITDA cash flow generating capacity. Notes: * Management Account/Calculation 15
Slide 17: Tower Growth
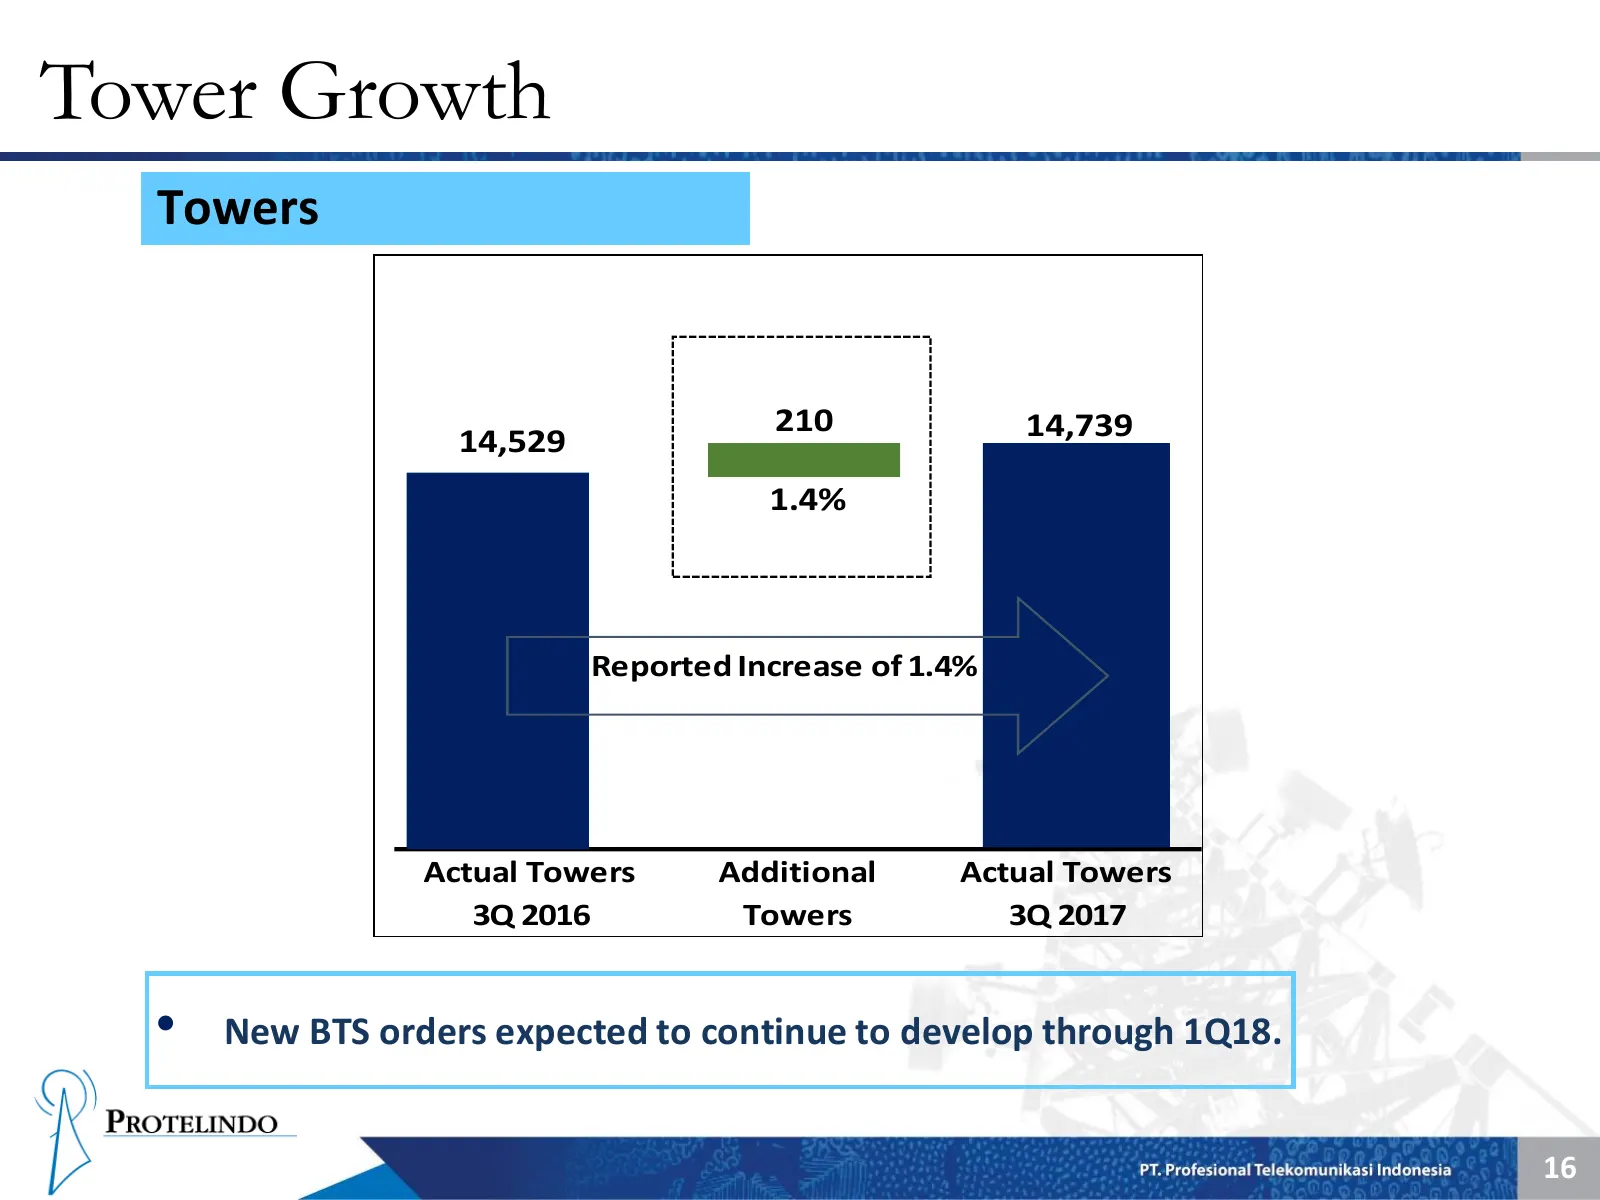
Tower Growth Towers 210 14,739 14,529 1.4% Reported Increase of 1.4% Actual Towers Additional Actual Towers 3Q 2016 Towers 3Q 2017 • New BTS orders expected to continue to develop through 1Q18. 16
Slide 18: Tenant Growth
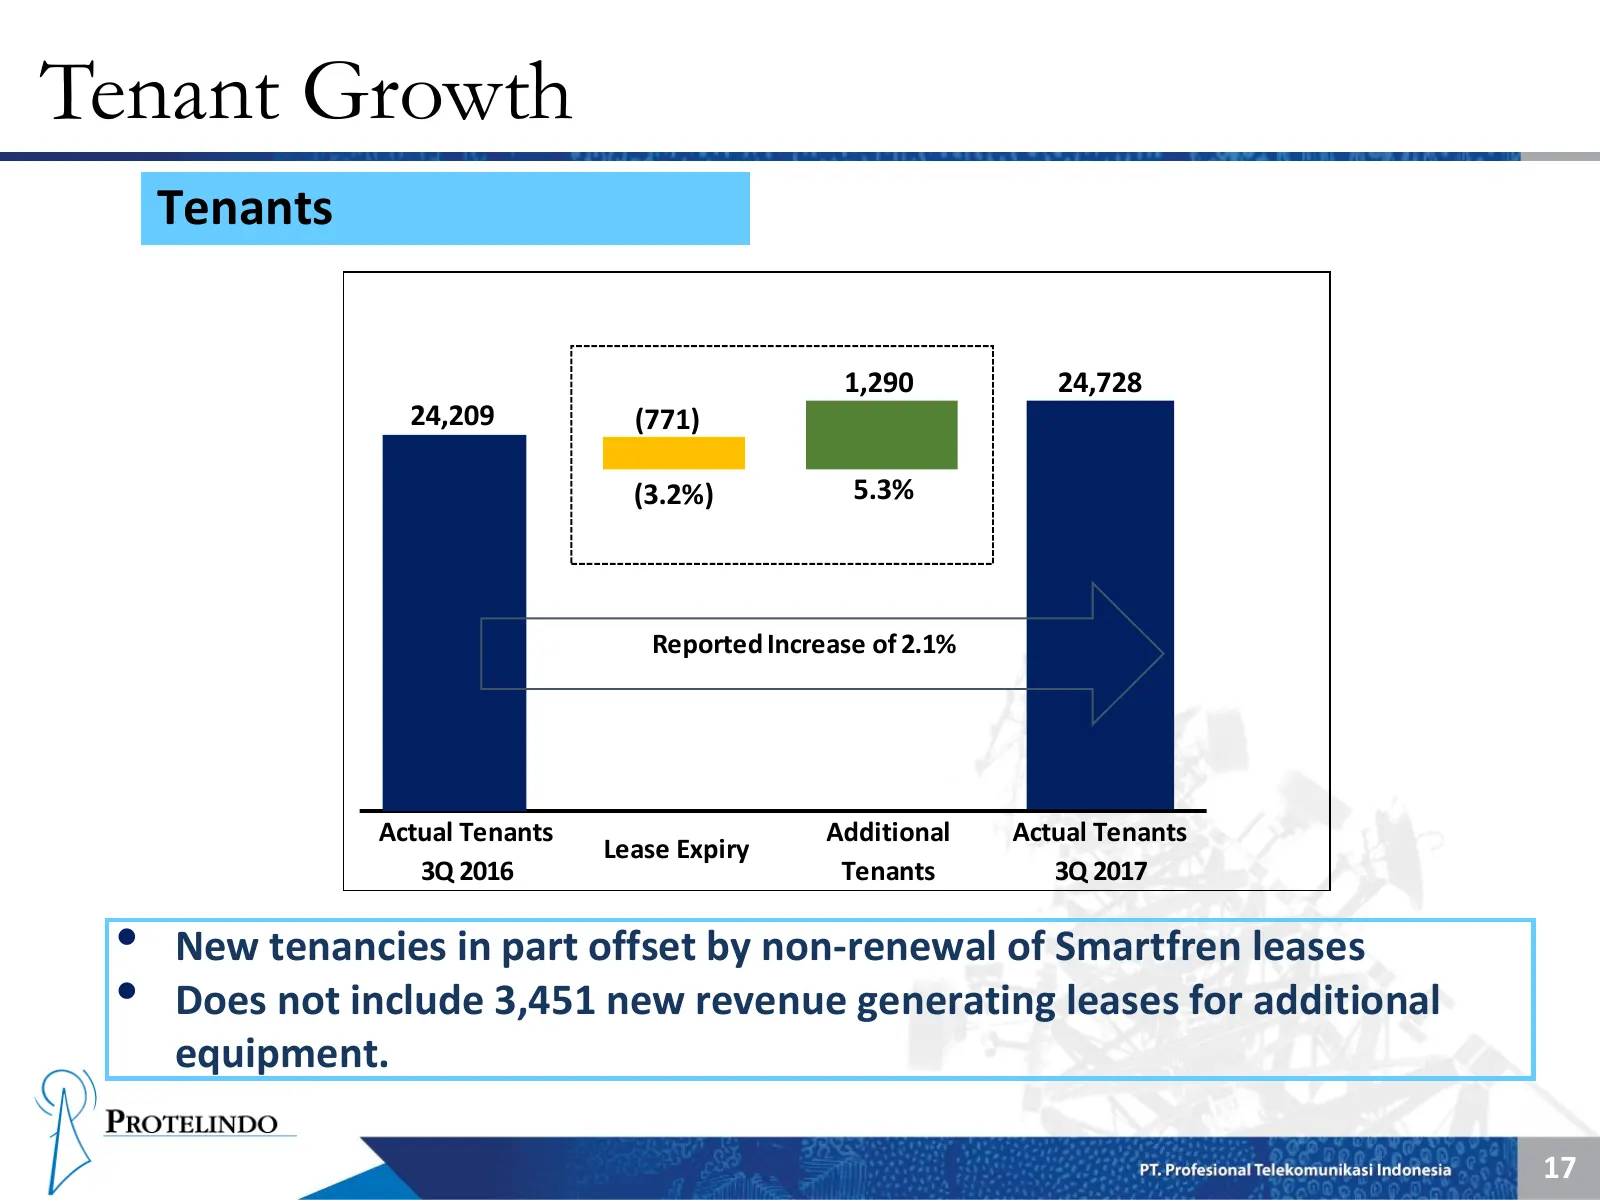
Tenant Growth Tenants 1,290 24,728 24,209 (771) (3.2%) 5.3% Reported Increase of 2.1% Actual Tenants Additional Actual Tenants Lease Expiry 3Q 2016 Tenants 3Q 2017 • New tenancies in part offset by non-renewal of Smartfren leases • Does not include 3,451 new revenue generating leases for additional
Slide 19: Balance Sheet and Income Statement Snapshot
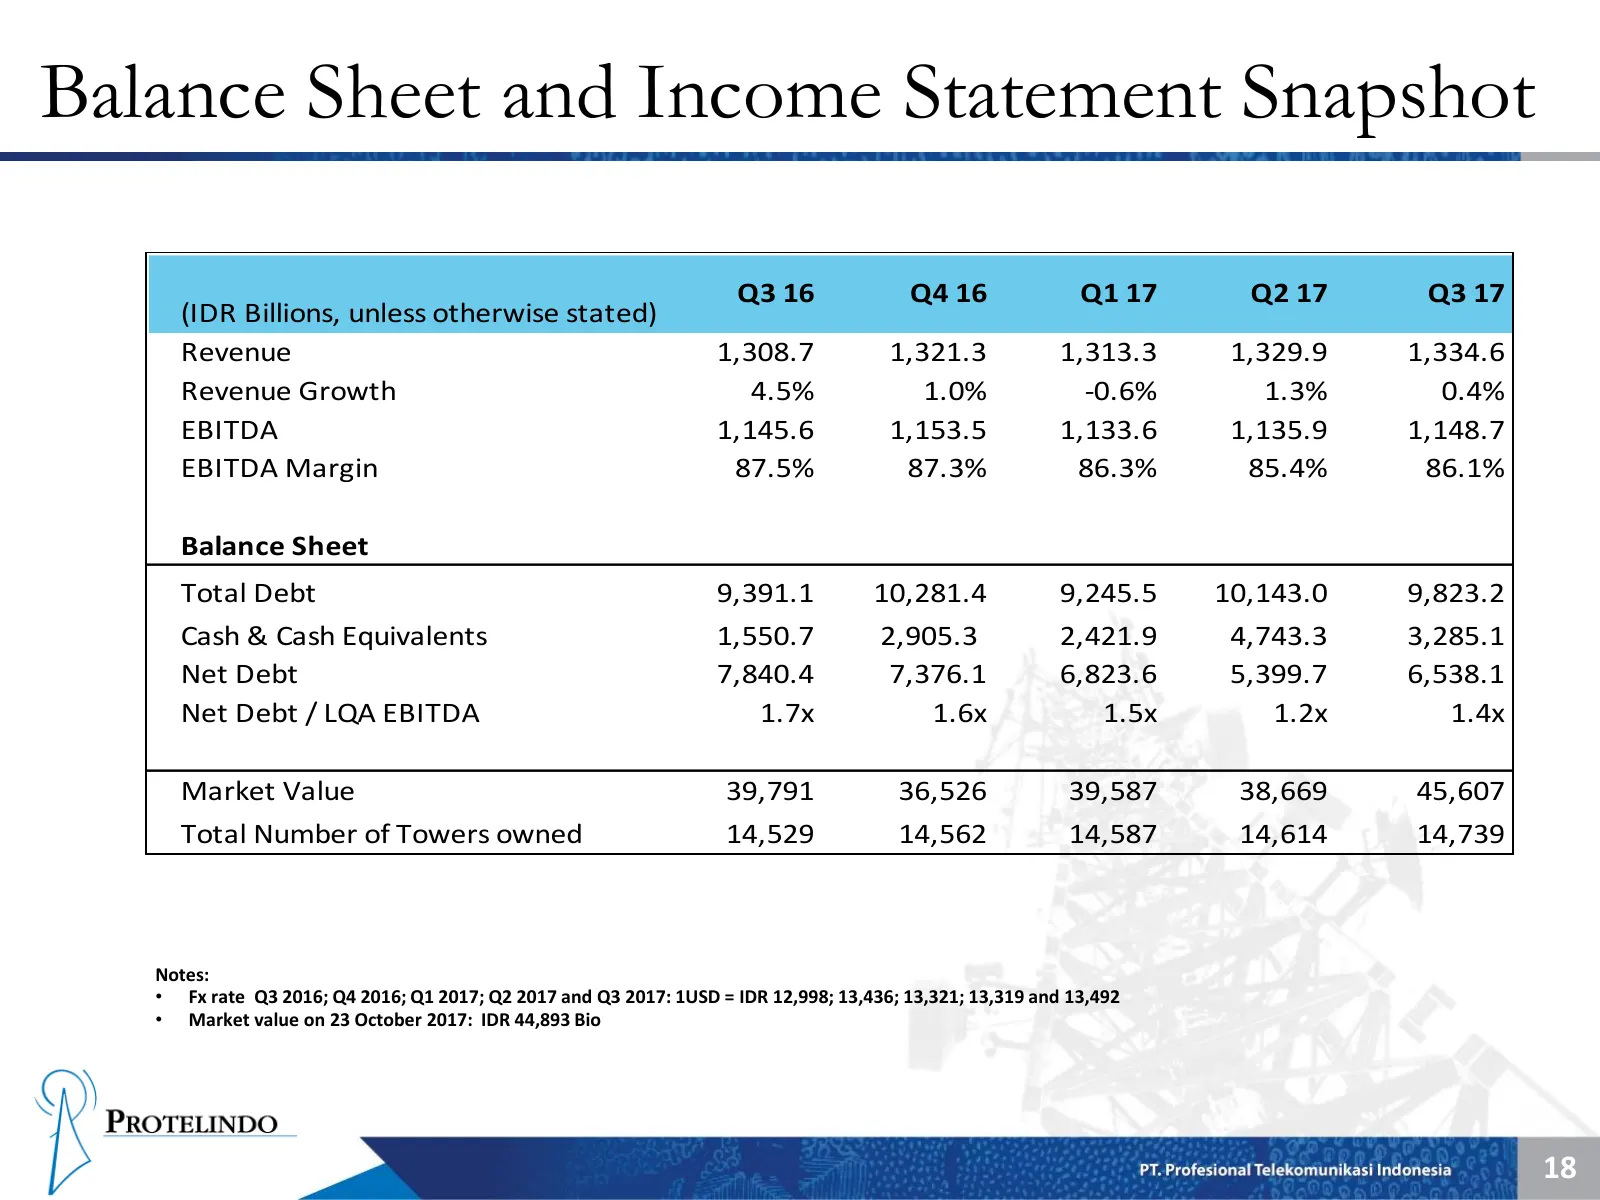
Balance Sheet and Income Statement Snapshot Q3 16 Q4 16 Q1 17 Q2 17 Q3 17 (IDR Billions, unless otherwise stated) Revenue 1,308.7 1,321.3 1,313.3 1,329.9 1,334.6 Revenue Growth 4.5% 1.0% -0.6% 1.3% 0.4% EBITDA 1,145.6 1,153.5 1,133.6 1,135.9 1,148.7 EBITDA Margin 87.5% 87.3% 86.3% 85.4% 86.1% Balanc
Slide 20: Change in Accounting on Protelindo
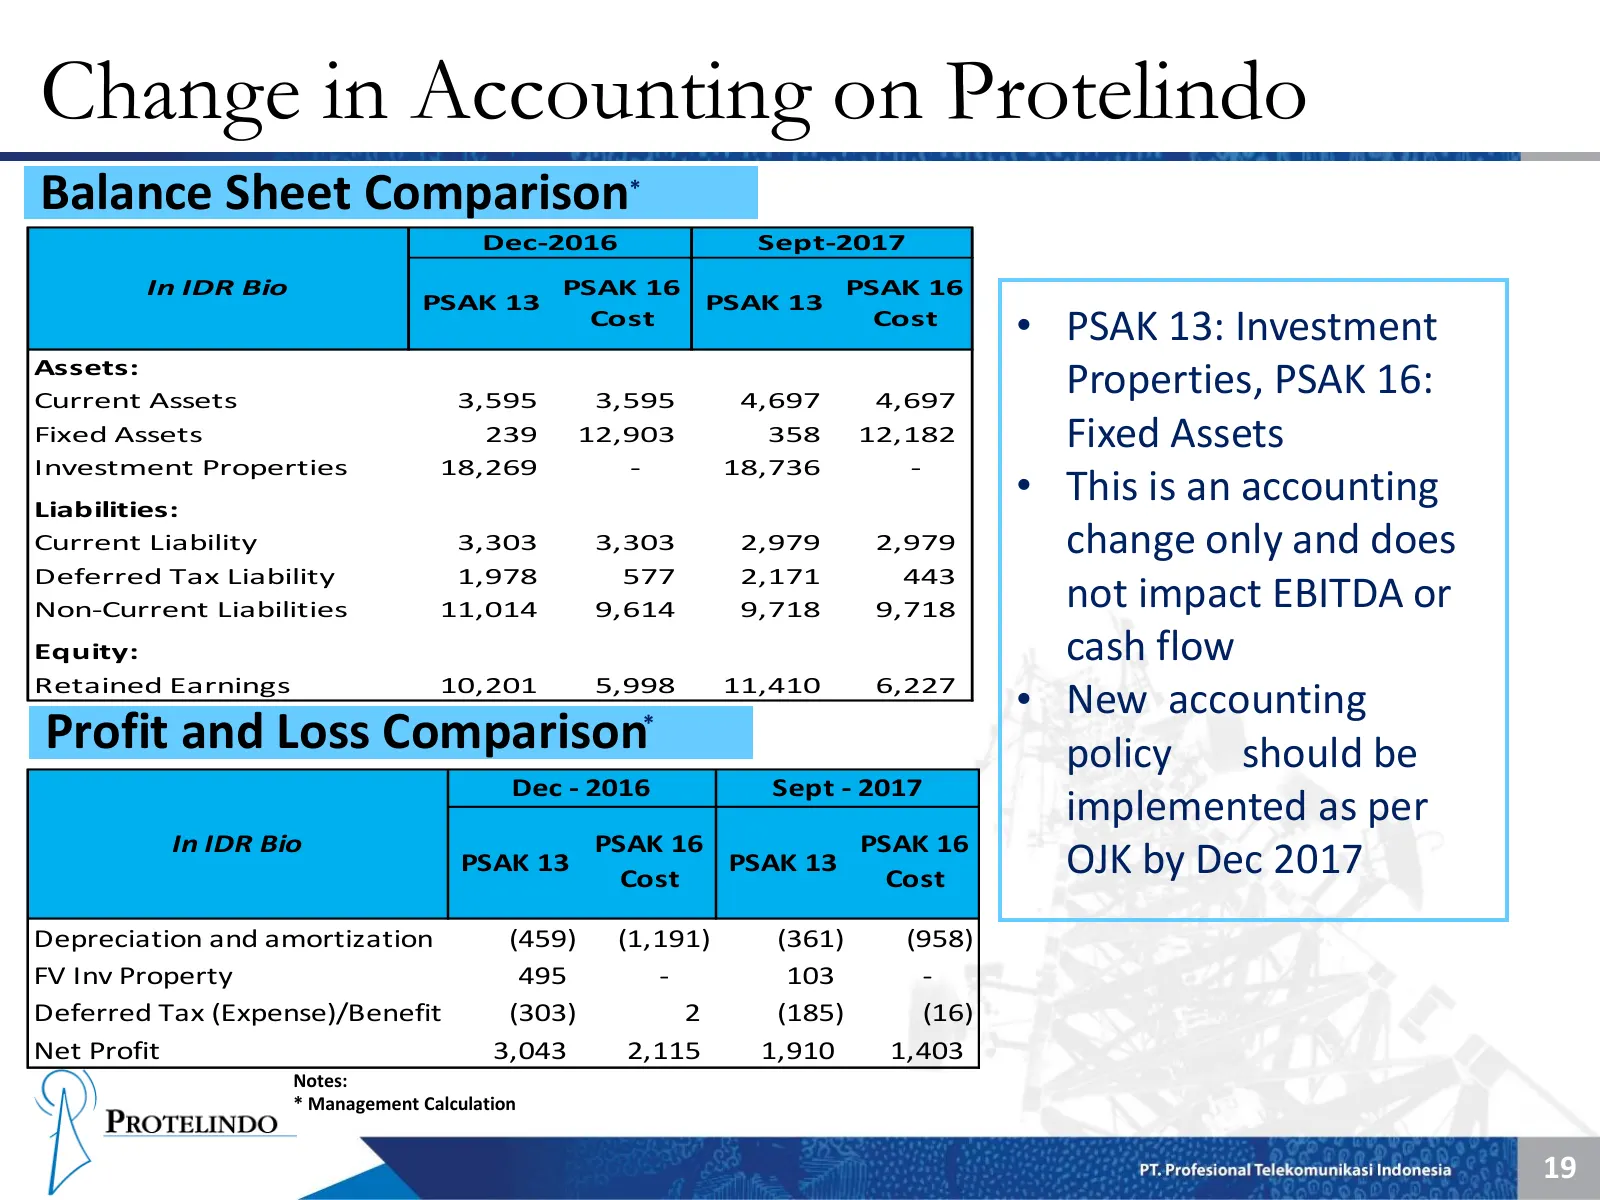
Change in Accounting on Protelindo Balance Sheet Comparison* Dec-2016 Sept-2017 In IDR Bio PSAK 16 PSAK 16 PSAK 13 PSAK 13 Cost Cost • PSAK 13: Investment Assets: Current Assets 3,595 3,595 4,697 4,697 Properties, PSAK 16: Fixed Assets 239 12,903 358 12,182 Fixed Assets Investment Properties 18,269
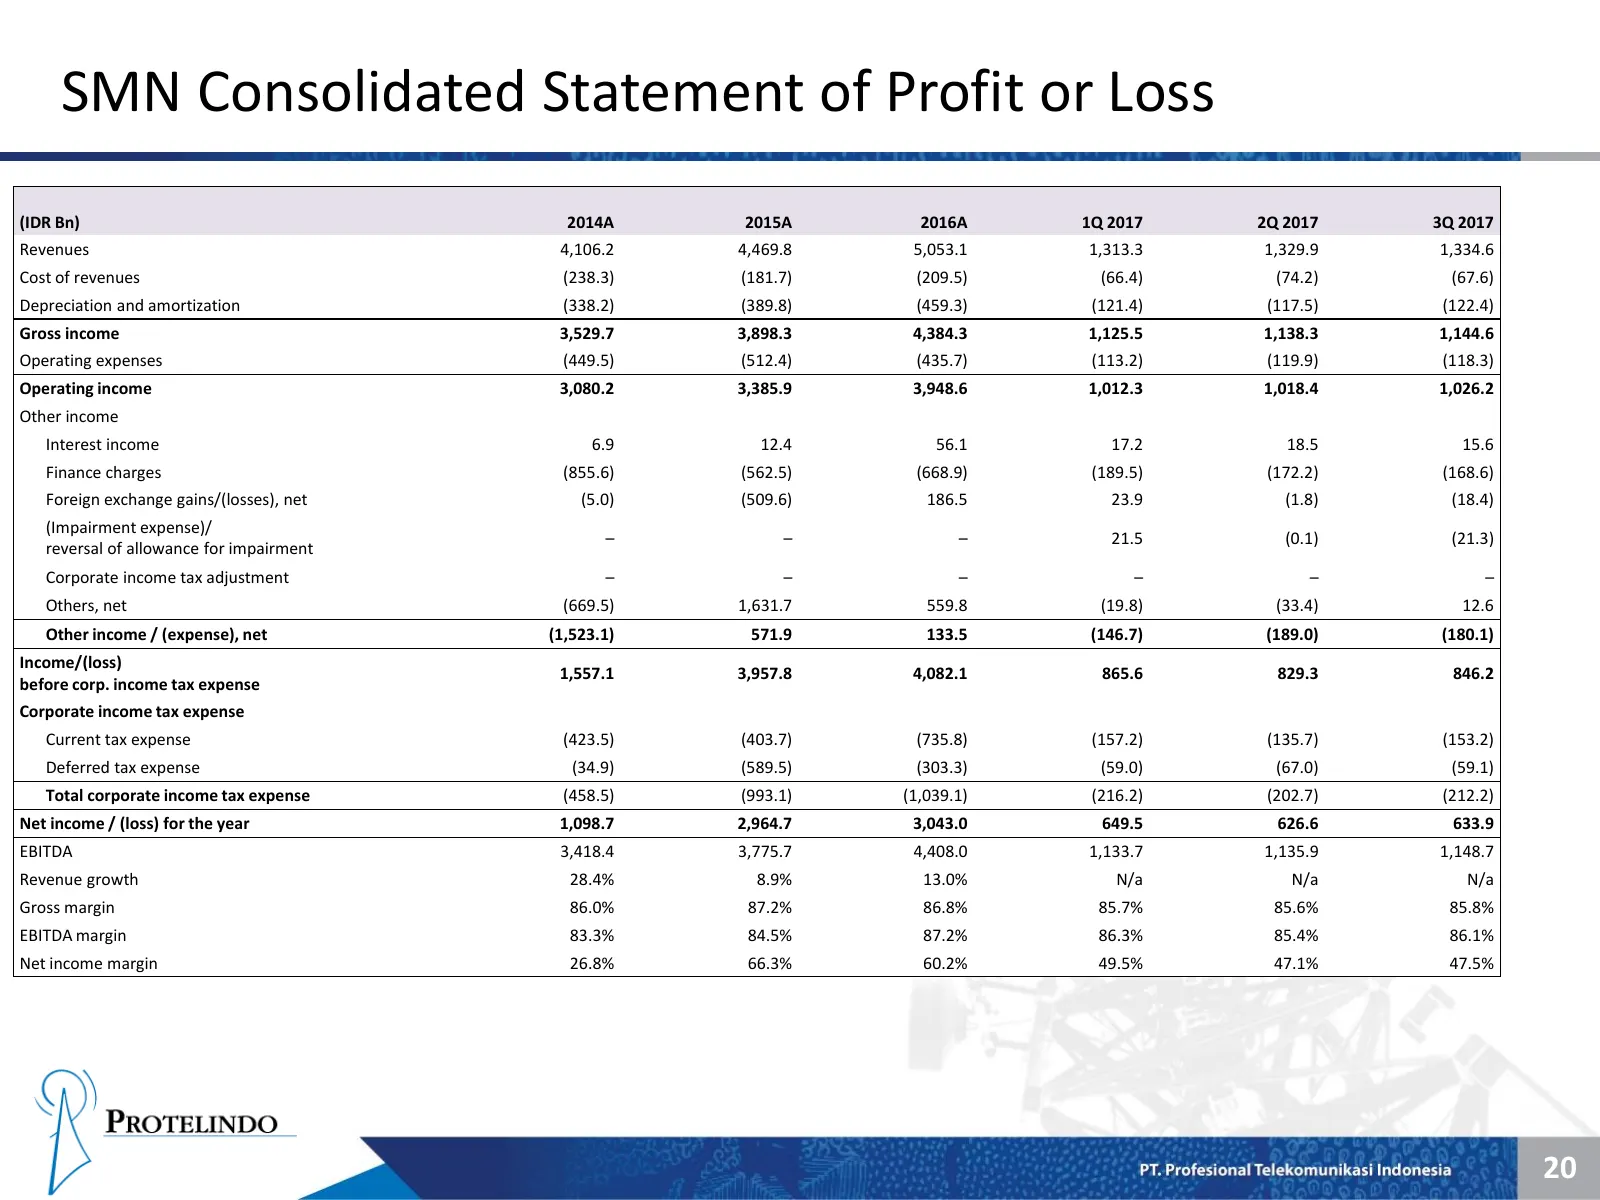
Slide 21: SMN Consolidated Statement of Profit or Loss
SMN Consolidated Statement of Profit or Loss (IDR Bn) 2014A 2015A 2016A 1Q 2017 2Q 2017 3Q 2017 Revenues 4,106.2 4,469.8 5,053.1 1,313.3 1,329.9 1,334.6 Cost of revenues (238.3) (181.7) (209.5) (66.4) (74.2) (67.6) Depreciation and amortization (338.2) (389.8) (459.3) (121.4) (117.5) (122.4) Gross i
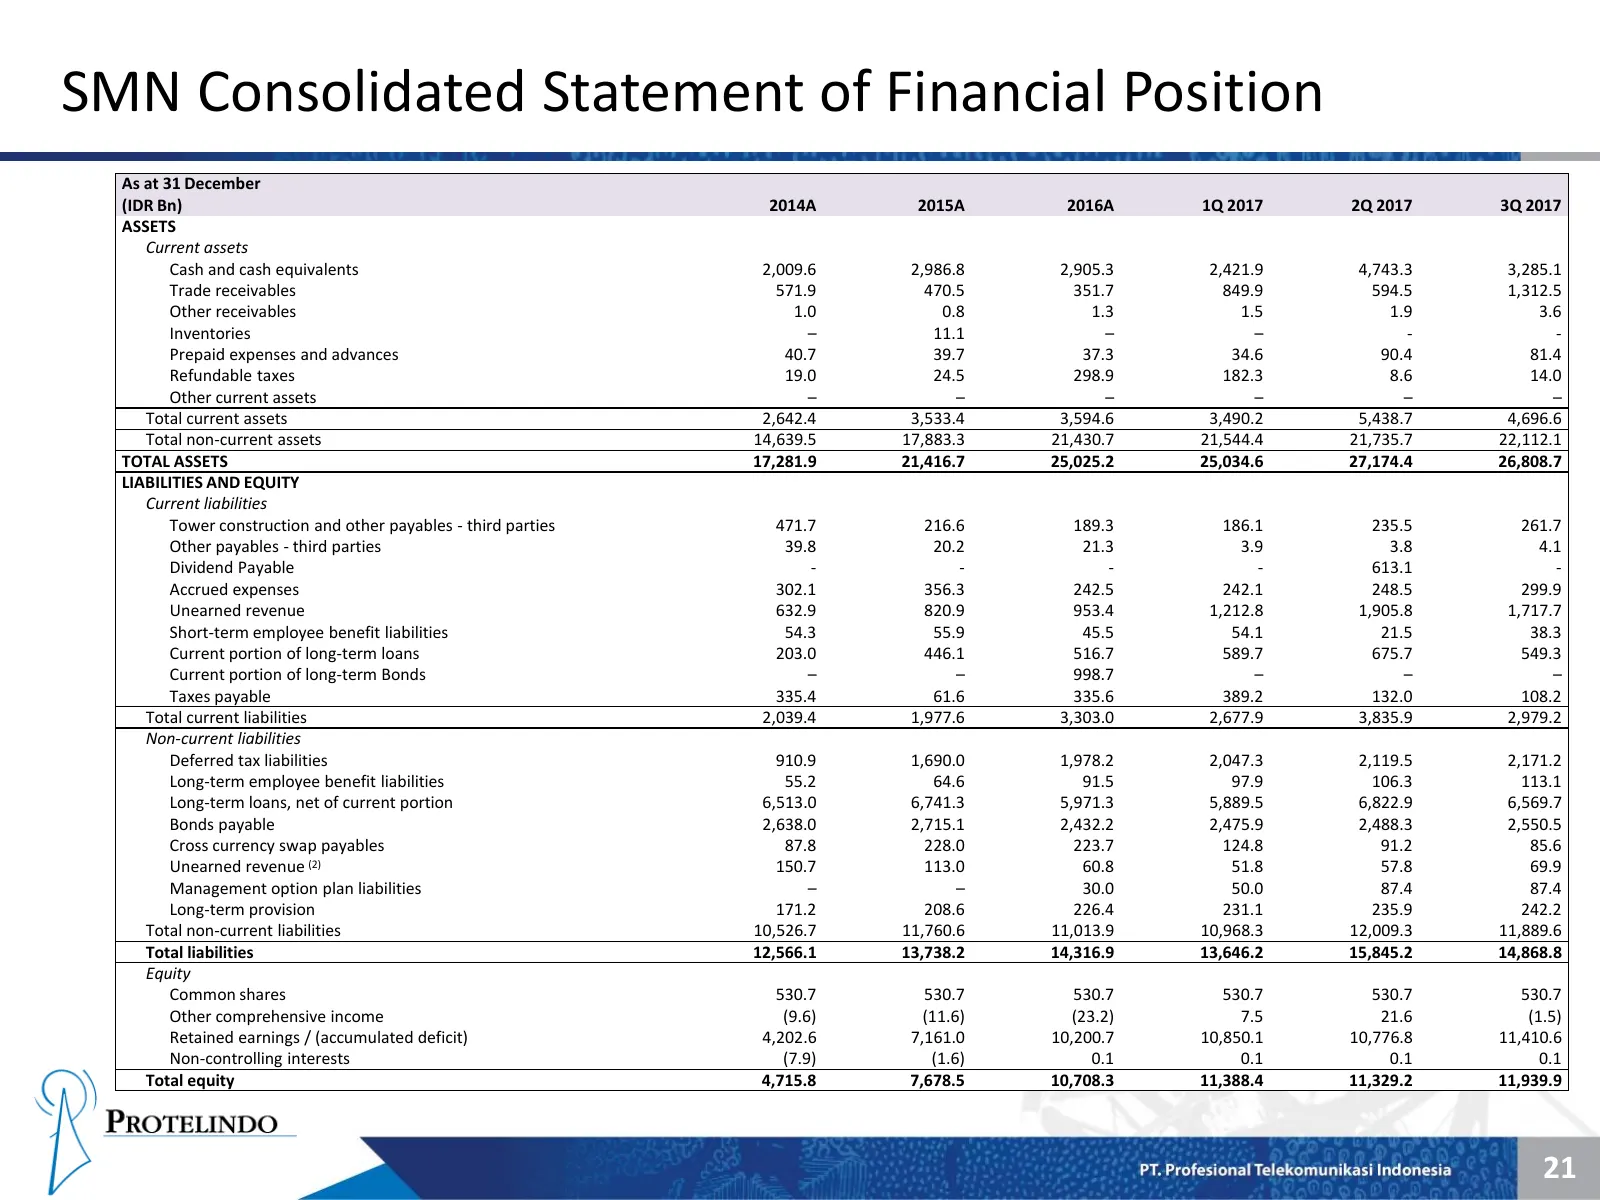
Slide 22: SMN Consolidated Statement of Financial Position
SMN Consolidated Statement of Financial Position As at 31 December (IDR Bn) 2014A 2015A 2016A 1Q 2017 2Q 2017 3Q 2017 ASSETS Current assets Cash and cash equivalents 2,009.6 2,986.8 2,905.3 2,421.9 4,743.3 3,285.1 Trade receivables 571.9 470.5 351.7 849.9 594.5 1,312.5 Other receivables 1.0 0.8 1.3
Slide 23: Strategy
Strategy q)) PROTELINDO
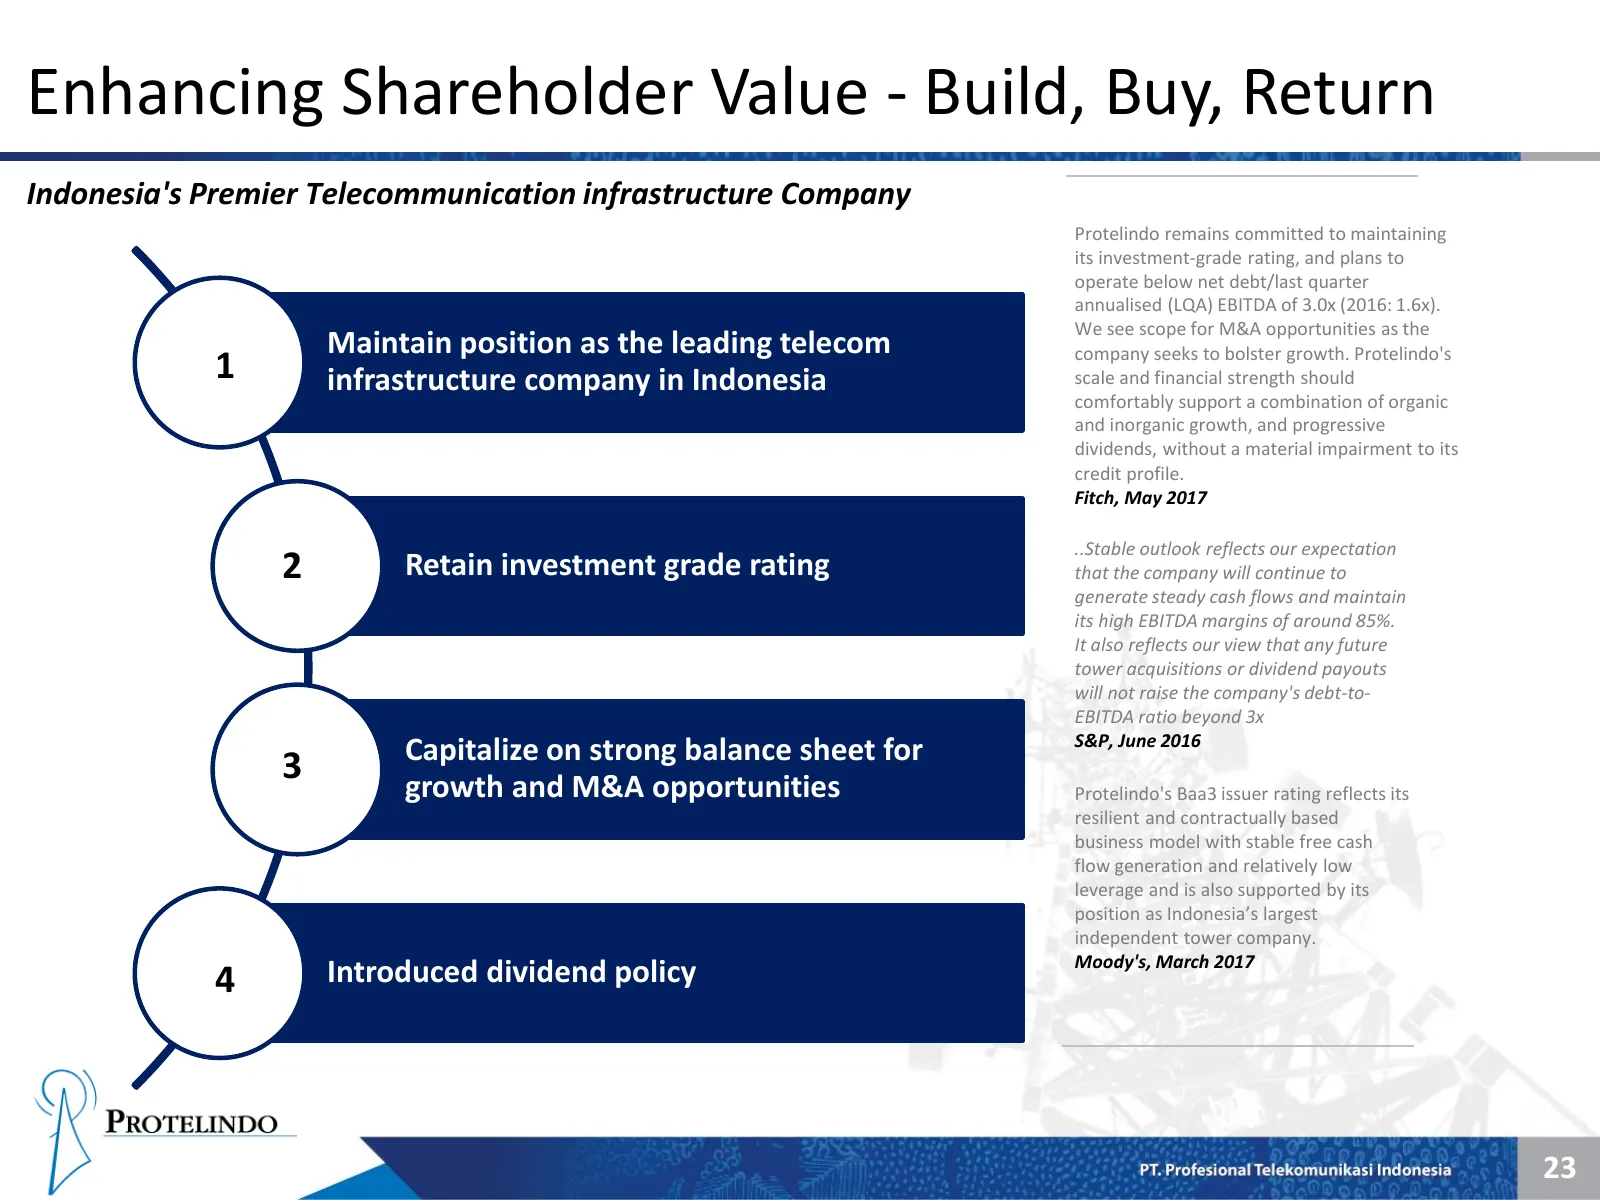
Slide 24: Enhancing Shareholder Value - Build, Buy, Return
Enhancing Shareholder Value - Build, Buy, Return Indonesia's Premier Telecommunication infrastructure Company Protelindo remains committed to maintaining its investment-grade rating, and plans to operate below net debt/last quarter annualised (LQA) EBITDA of 3.0x (2016: 1.6x). We see scope for M&A o
Source: Internet Archive copy of media.ptsmn.co.id
More decks from PT Sarana Menara Nusantara Tbk
 Q2 2026 Earnings Presentation25 slides · Aug 14, 2026
 Q1 2026 Earnings Presentation25 slides · Jun 3, 2026
 Q4 2025 Earnings Presentation24 slides · Apr 6, 2026
 Q2 2023 Earnings Presentation26 slides · Sep 28, 2023
 Q1 2023 Earnings Presentation26 slides · May 2023
 FY2022 Earnings Presentation26 slides · Apr 6, 2023