PT Bank Negara Indonesia (Persero) Tbk Class B · IDX:BBNI
PT Bank Negara Indonesia (Persero) Tbk Class B — FY2021 Earnings Presentation
63 slides from PT Bank Negara Indonesia (Persero) Tbk Class B's earnings presentation, Jan 26, 2022
Slide 1: Corporate Presentation FY2021
CORPORATE PRESENTATION FY2021 PT. Bank Negara Indonesia (Persero) Tbk. #BUMNUntukIndonesia
Slide 2: Table of Content
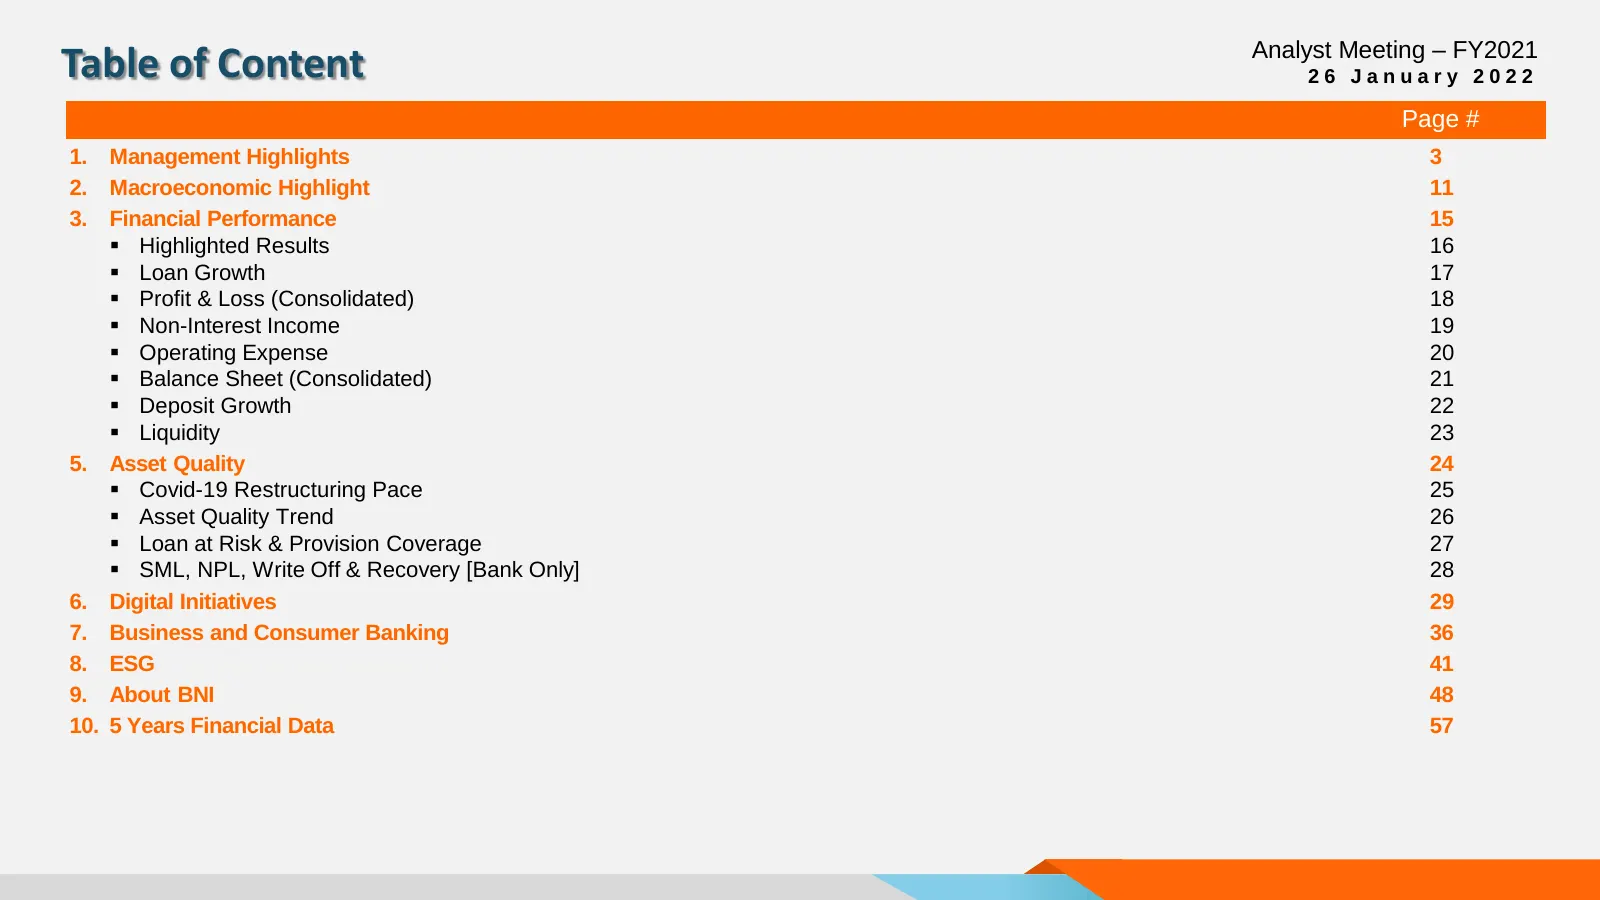
Analyst Meeting – FY2021 Table of Content 26 January 2022 Page # 1. Management Highlights 3 2. Macroeconomic Highlight 11 3. Financial Performance 15 ▪ Highlighted Results 16 ▪ Loan Growth 17 ▪ Profit & Loss (Consolidated) 18 ▪ Non-Interest Income 19 ▪ Operating Expense 20 ▪ Balance Sheet (Consolida
Slide 3: Management Highlights
FY2021 Management Highlights 3
Slide 4: Above consensus NPAT with all guidance met
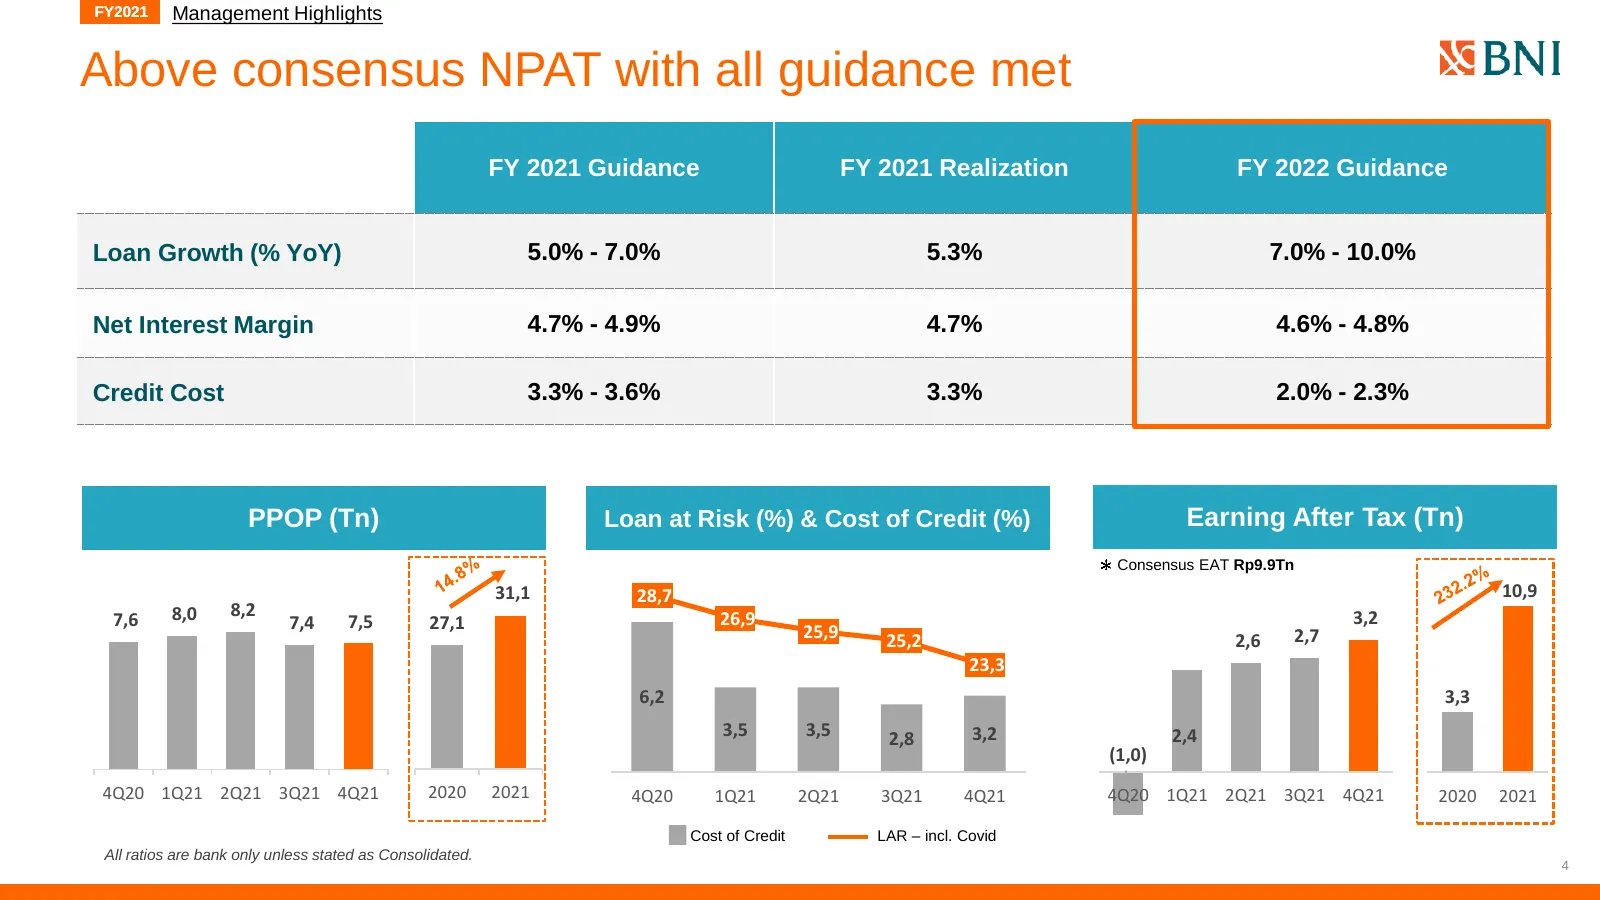
FY2021 Management Highlights Above consensus NPAT with all guidance met FY 2021 Guidance FY 2021 Realization FY 2022 Guidance Loan Growth (% YoY) 5.0% - 7.0% 5.3% 7.0% - 10.0% Net Interest Margin 4.7% - 4.9% 4.7% 4.6% - 4.8% Credit Cost 3.3% - 3.6% 3.3% 2.0% - 2.3% PPOP (Tn) Loan at Risk (%) & Cost
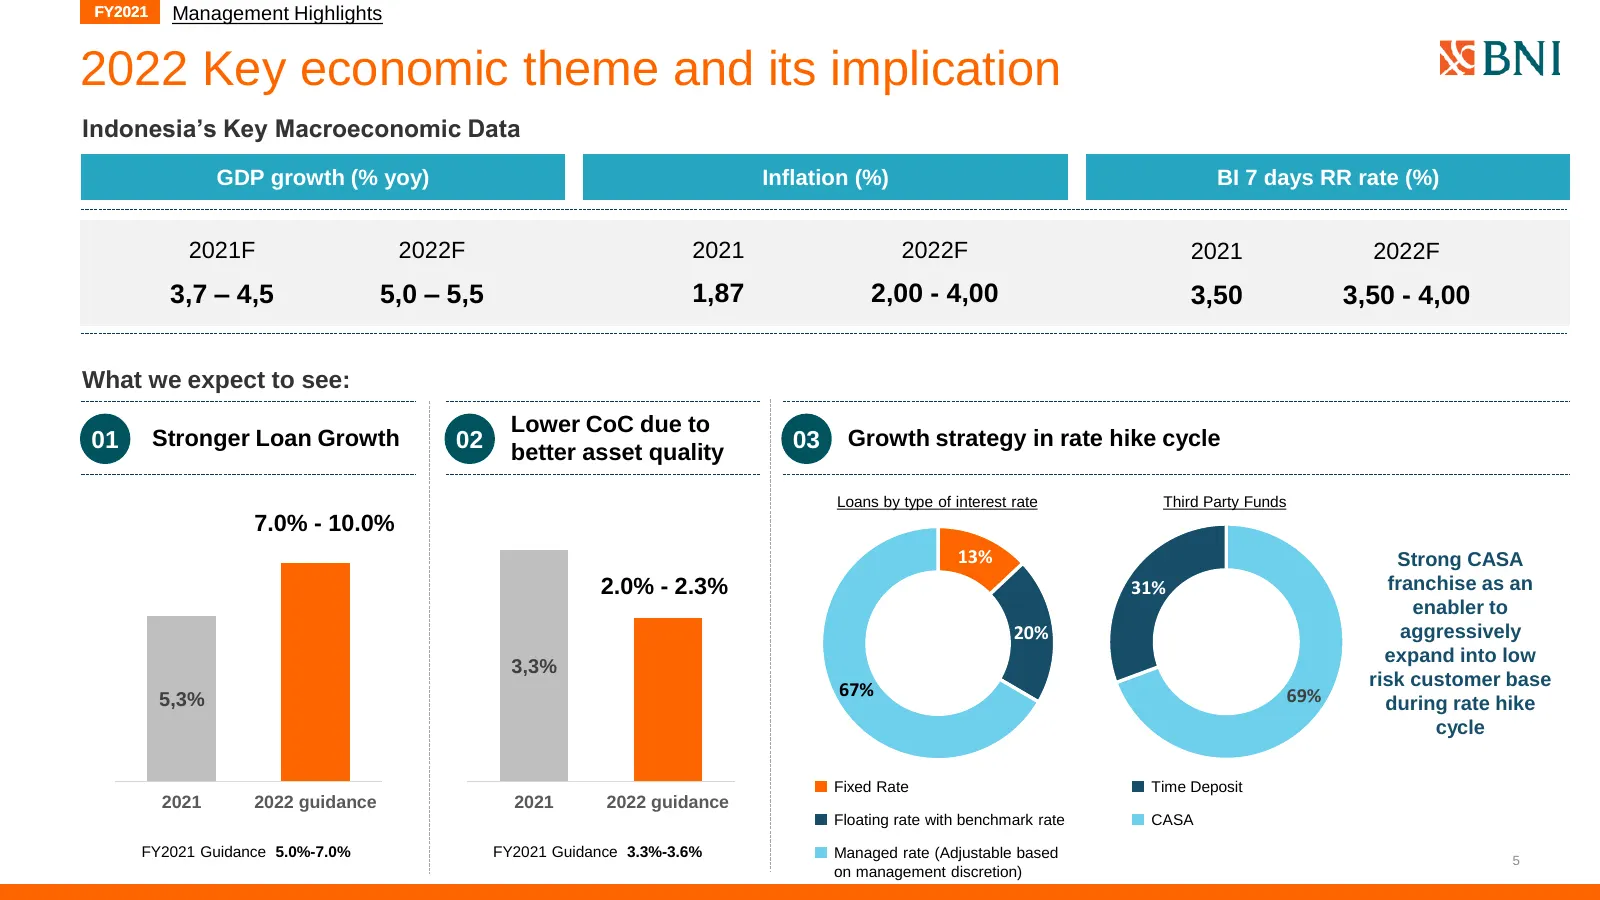
Slide 5: 2022 Key economic theme and its implication
FY2021 Management Highlights 2022 Key economic theme and its implication Indonesia’s Key Macroeconomic Data GDP growth (% yoy) Inflation (%) BI 7 days RR rate (%) 2021F 2022F 2021 2022F 2021 2022F 3,7 – 4,5 5,0 – 5,5 1,87 2,00 - 4,00 3,50 3,50 - 4,00 What we expect to see: Lower CoC due to 01 Strong
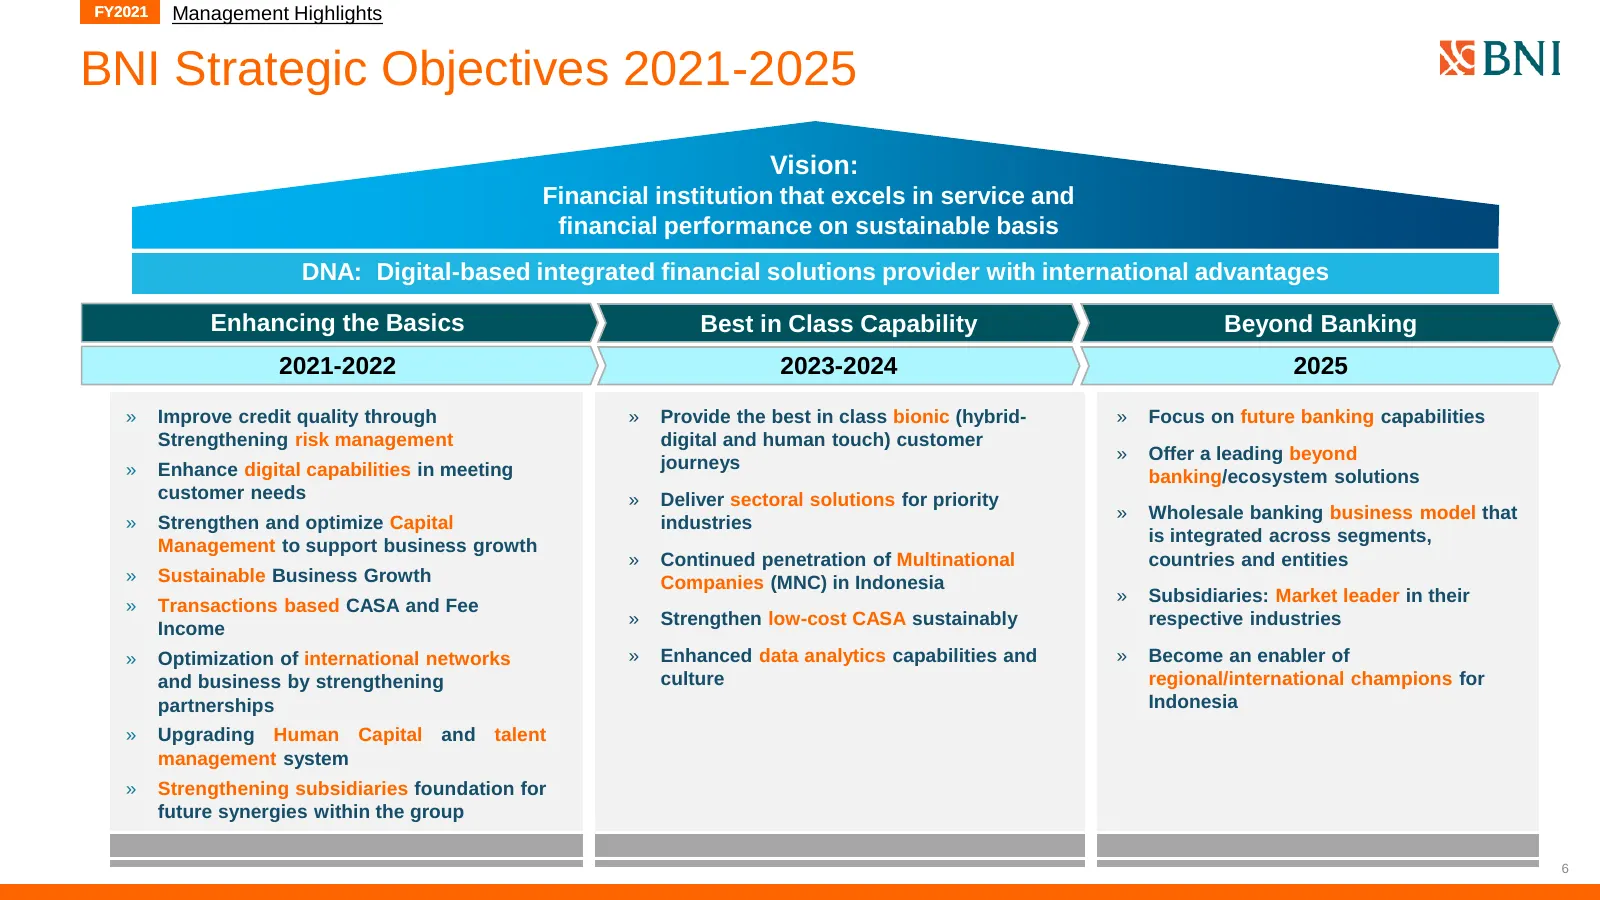
Slide 6: BNI Strategic Objectives 2021-2025
FY2021 Management Highlights BNI Strategic Objectives 2021-2025 Vision: Financial institution that excels in service and financial performance on sustainable basis DNA: Digital-based integrated financial solutions provider with international advantages Enhancing the Basics Best in Class Capability B
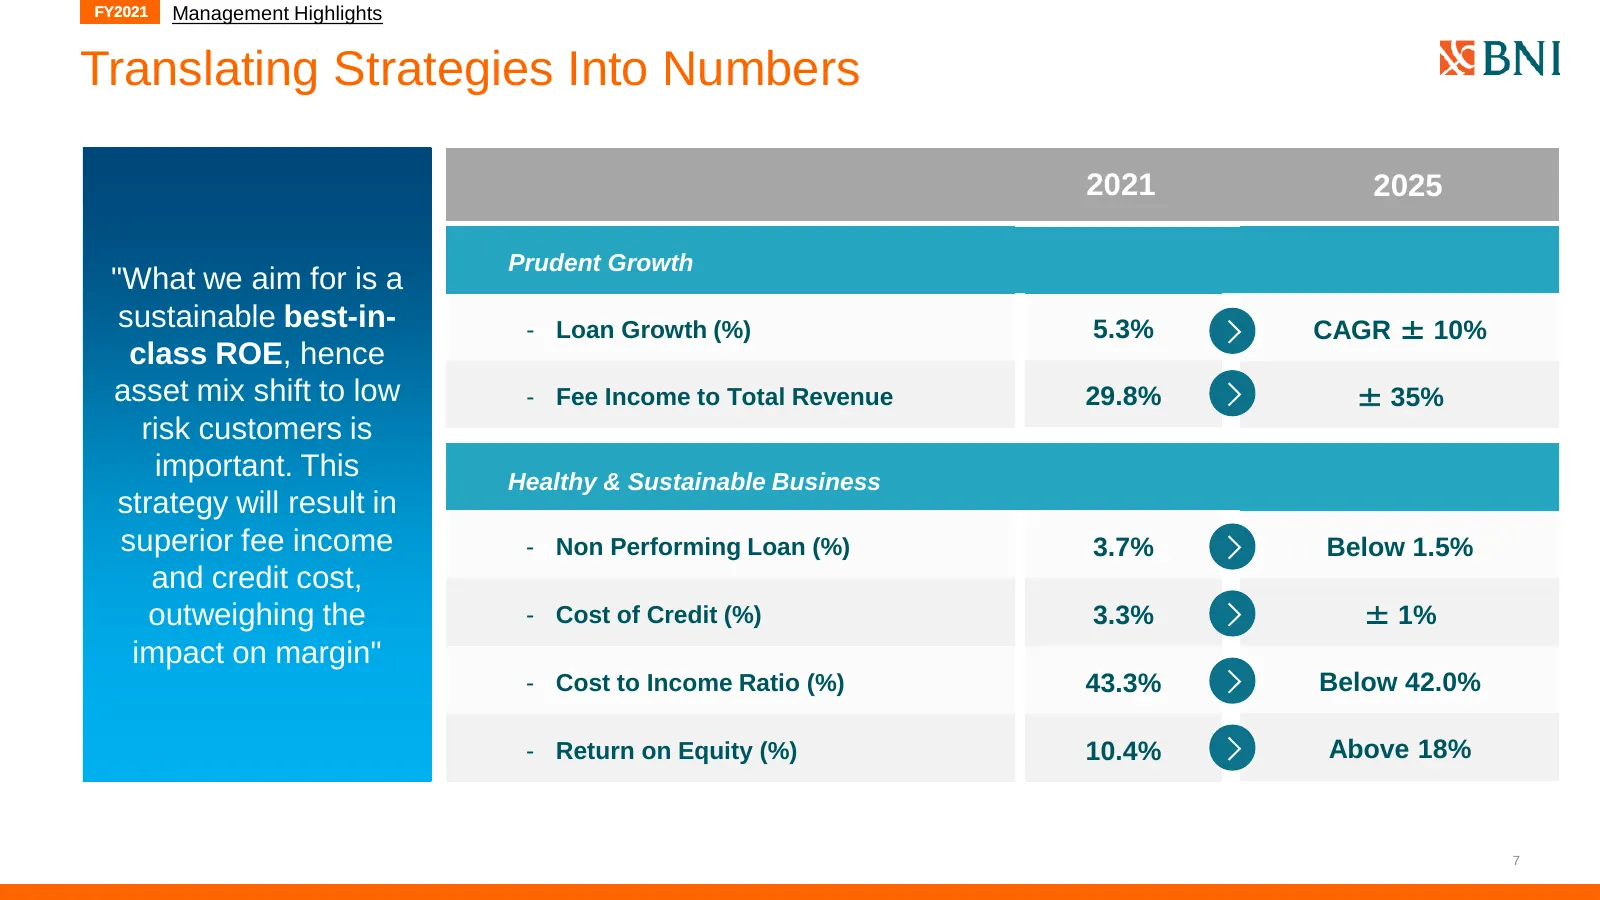
Slide 7: Translating Strategies Into Numbers
FY2021 Management Highlights Translating Strategies Into Numbers 2021 2025 Prudent Growth "What we aim for is a sustainable best-in- - Loan Growth (%) 5.3% CAGR ± 10% class ROE, hence asset mix shift to low - Fee Income to Total Revenue 29.8% ± 35% risk customers is important. This Healthy & Sustain
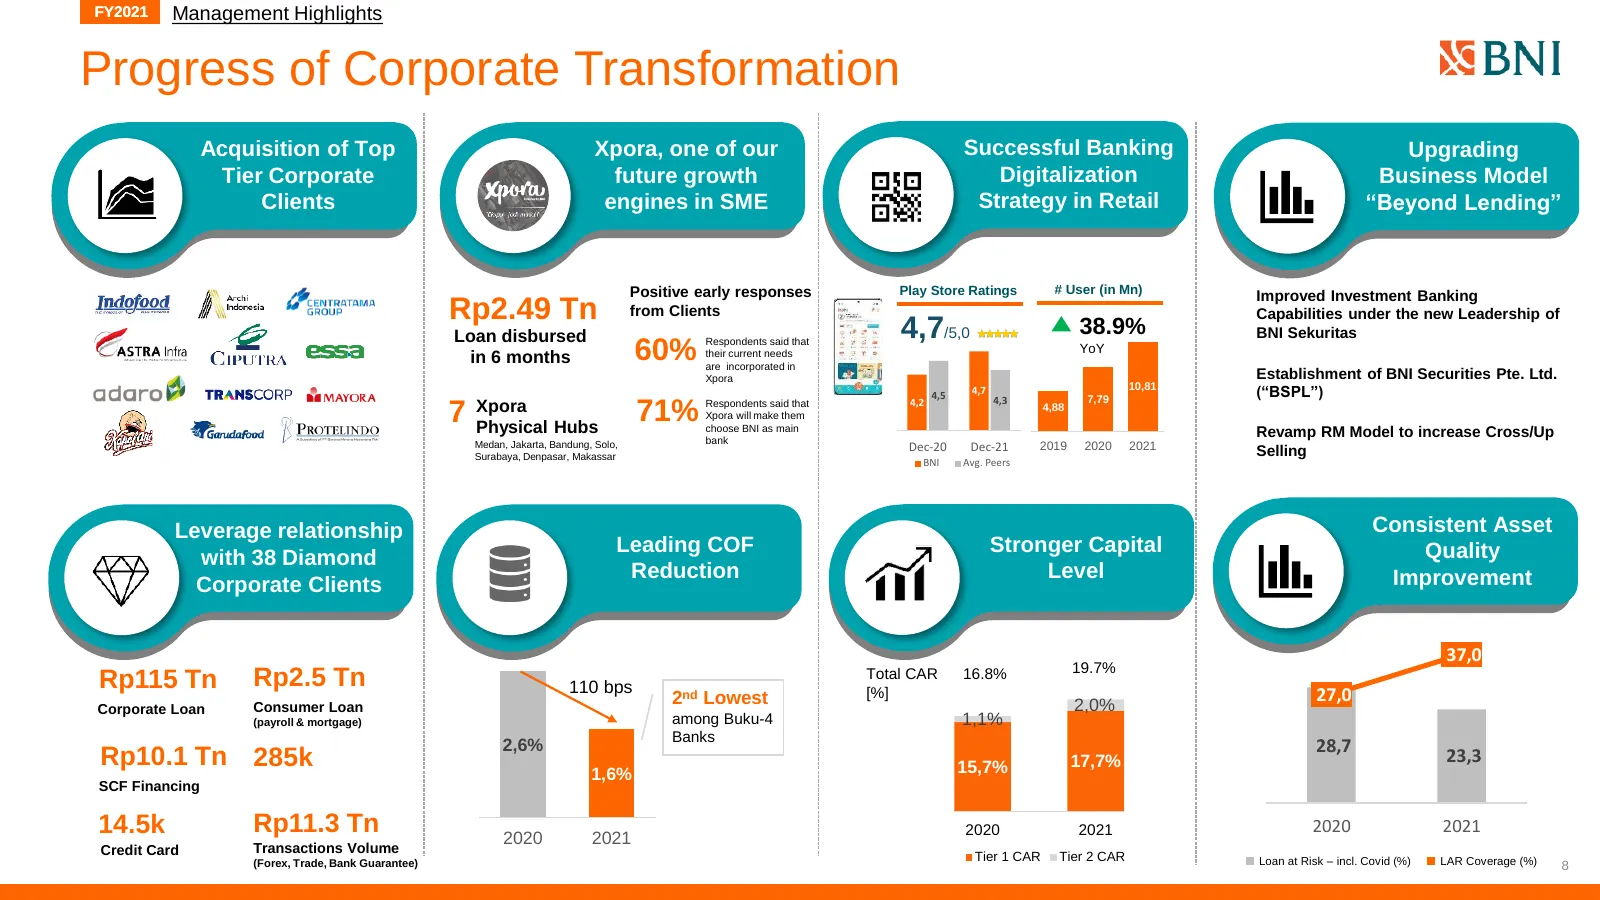
Slide 8: Progress of Corporate Transformation
FY2021 Management Highlights Progress of Corporate Transformation Acquisition of Top Xpora, one of our Successful Banking Upgrading Tier Corporate future growth Digitalization Business Model Clients engines in SME Strategy in Retail “Beyond Lending” Positive early responses Play Store Ratings # User
Slide 9: Best in Class ESG
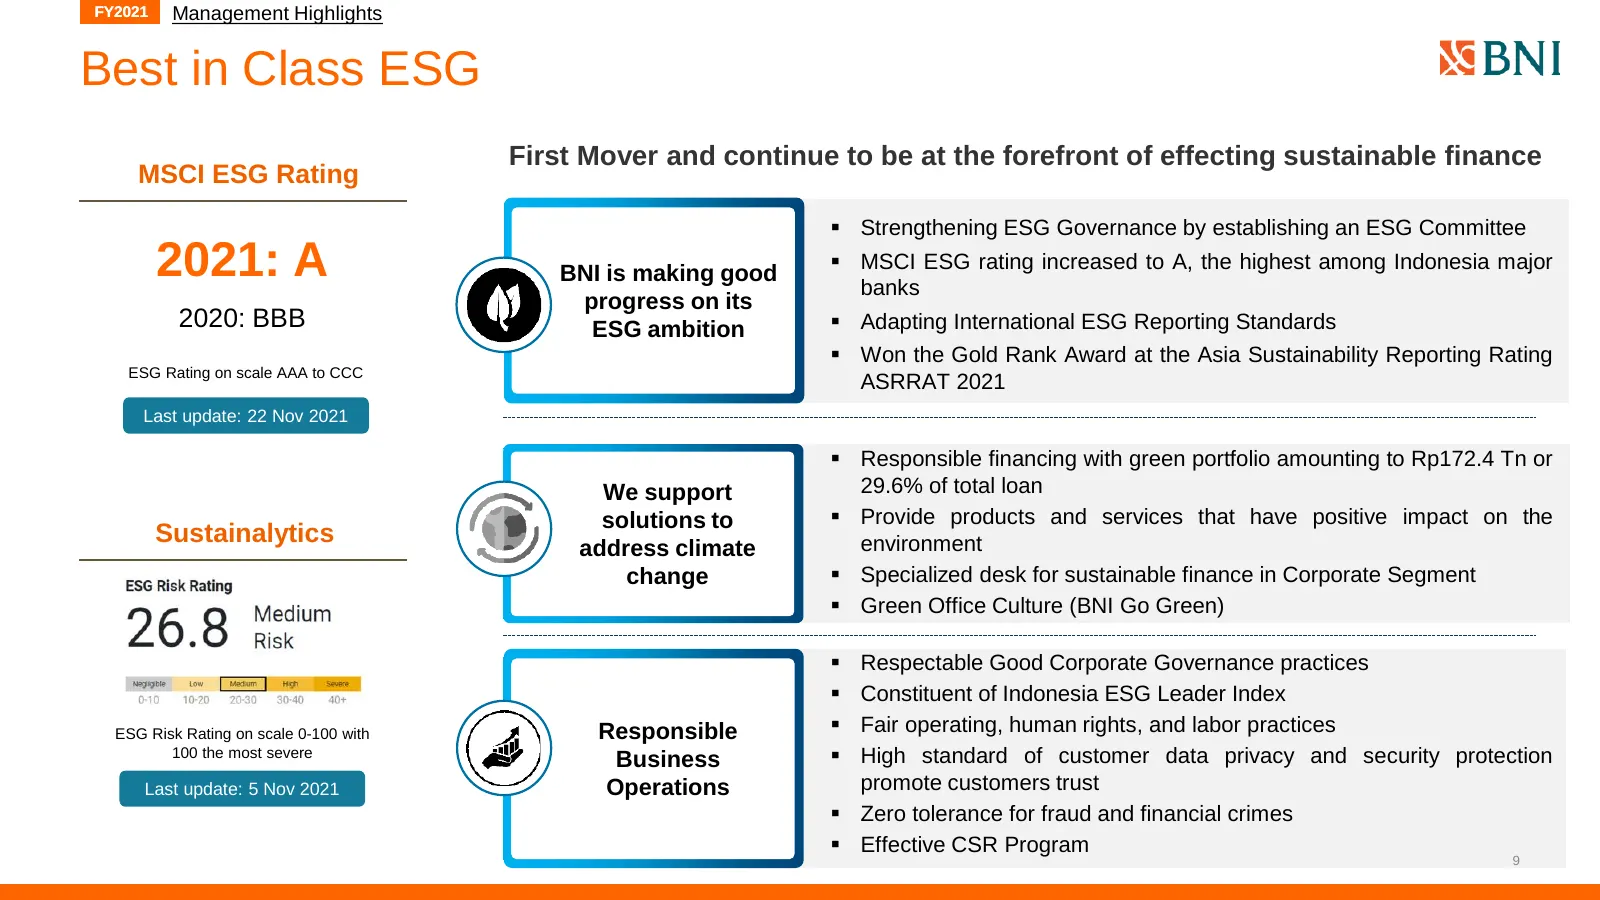
FY2021 Management Highlights Best in Class ESG First Mover and continue to be at the forefront of effecting sustainable finance MSCI ESG Rating ▪ Strengthening ESG Governance by establishing an ESG Committee 2021: A BNI is making good ▪ MSCI ESG rating increased to A, the highest among Indonesia maj
Slide 10: Revamp Our Competitive Edge in Wholesale Banking
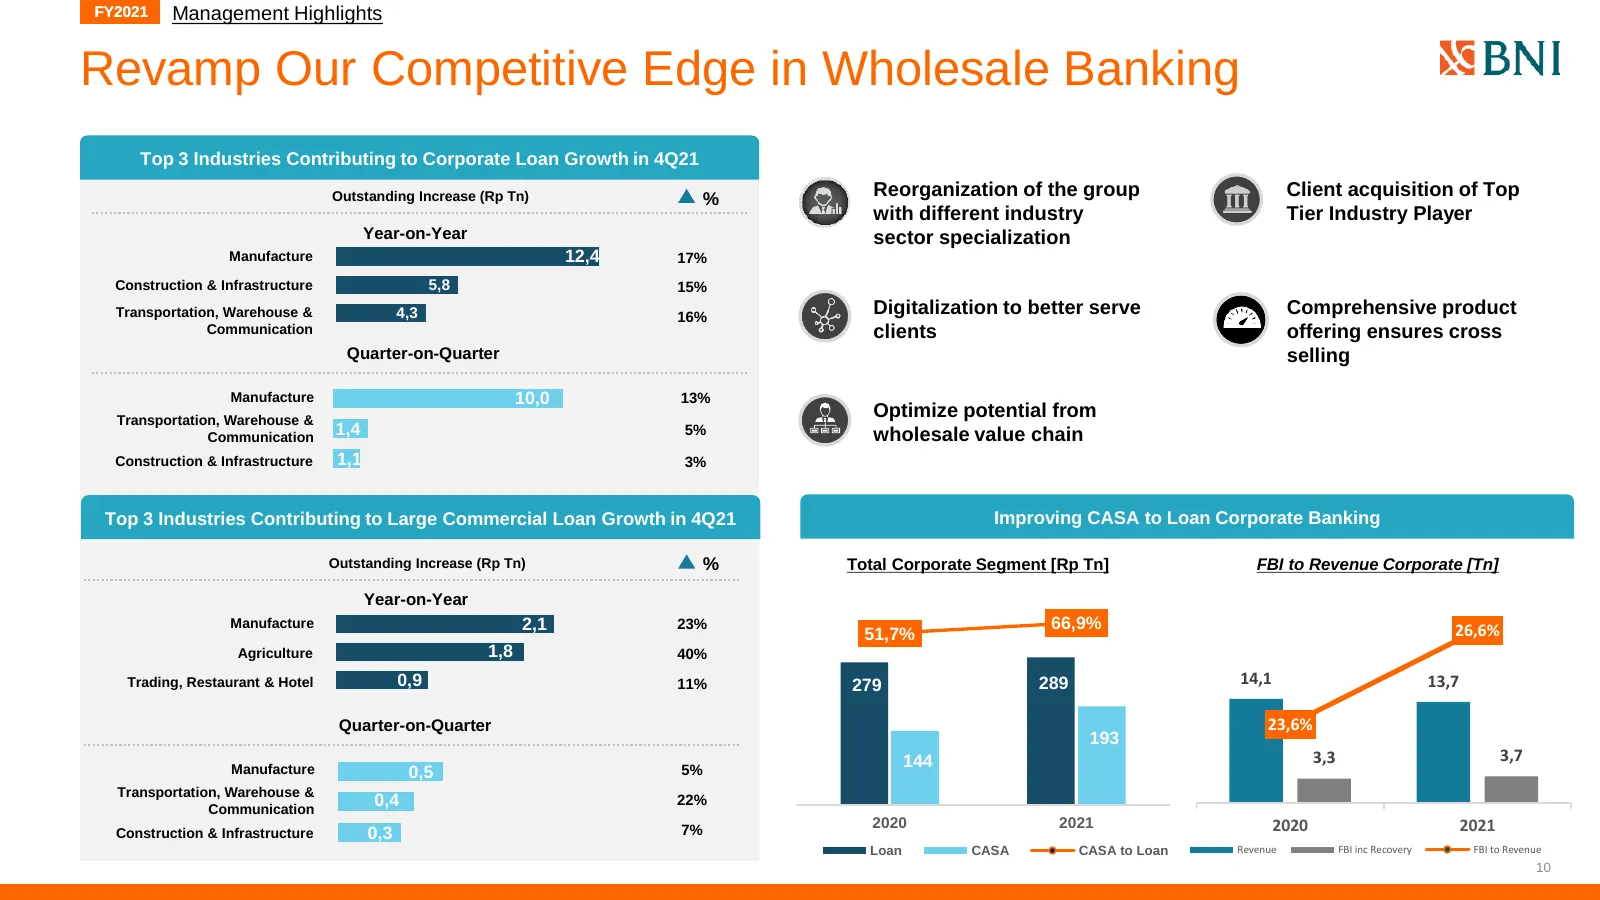
FY2021 Management Highlights Revamp Our Competitive Edge in Wholesale Banking Top 3 Industries Contributing to Corporate Loan Growth in 4Q21 Outstanding Increase (Rp Tn) % Reorganization of the group Client acquisition of Top with different industry Tier Industry Player Year-on-Year sector specializ
Slide 11: Macroeconomic Highlight
FY2021 Macroeconomic Highlight
Slide 12: Macroeconomic Highlight
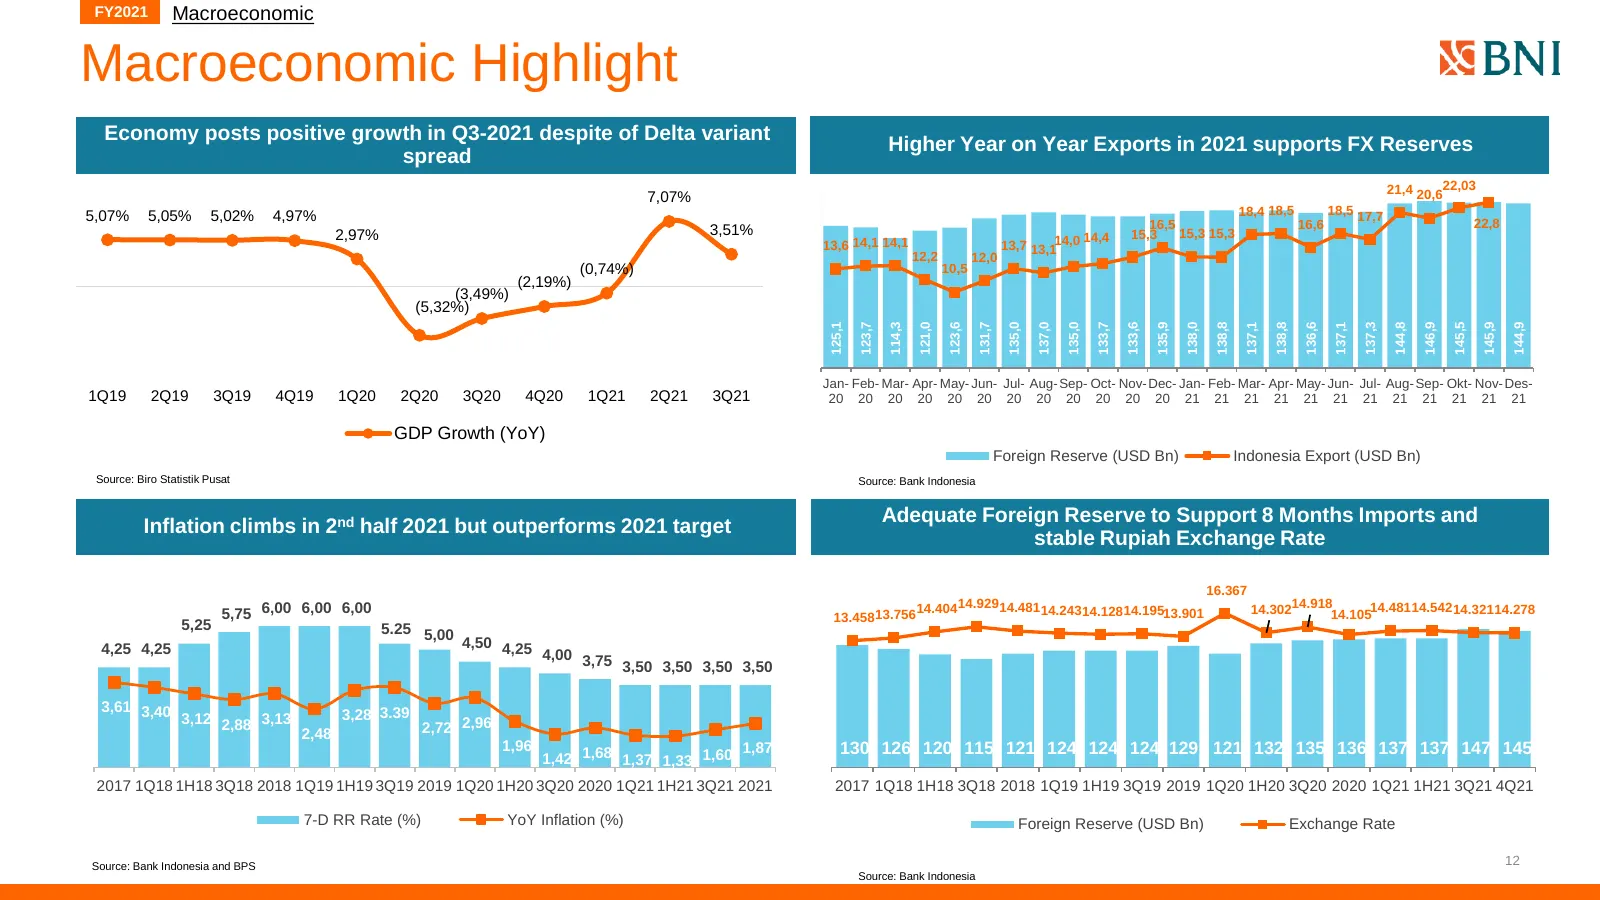
FY2021 Macroeconomic Macroeconomic Highlight Economy posts positive growth in Q3-2021 despite of Delta variant Higher Year on Year Exports in 2021 supports FX Reserves spread 21,4 20,622,03 7,07% 5,07% 5,05% 5,02% 4,97% 18,4 18,5 18,5 17,7 16,5 16,6 22,8 2,97% 3,51% 14,4 15,3 15,3 15,3 13,6 14,1 14,
Slide 13: Expecting a recovery this year
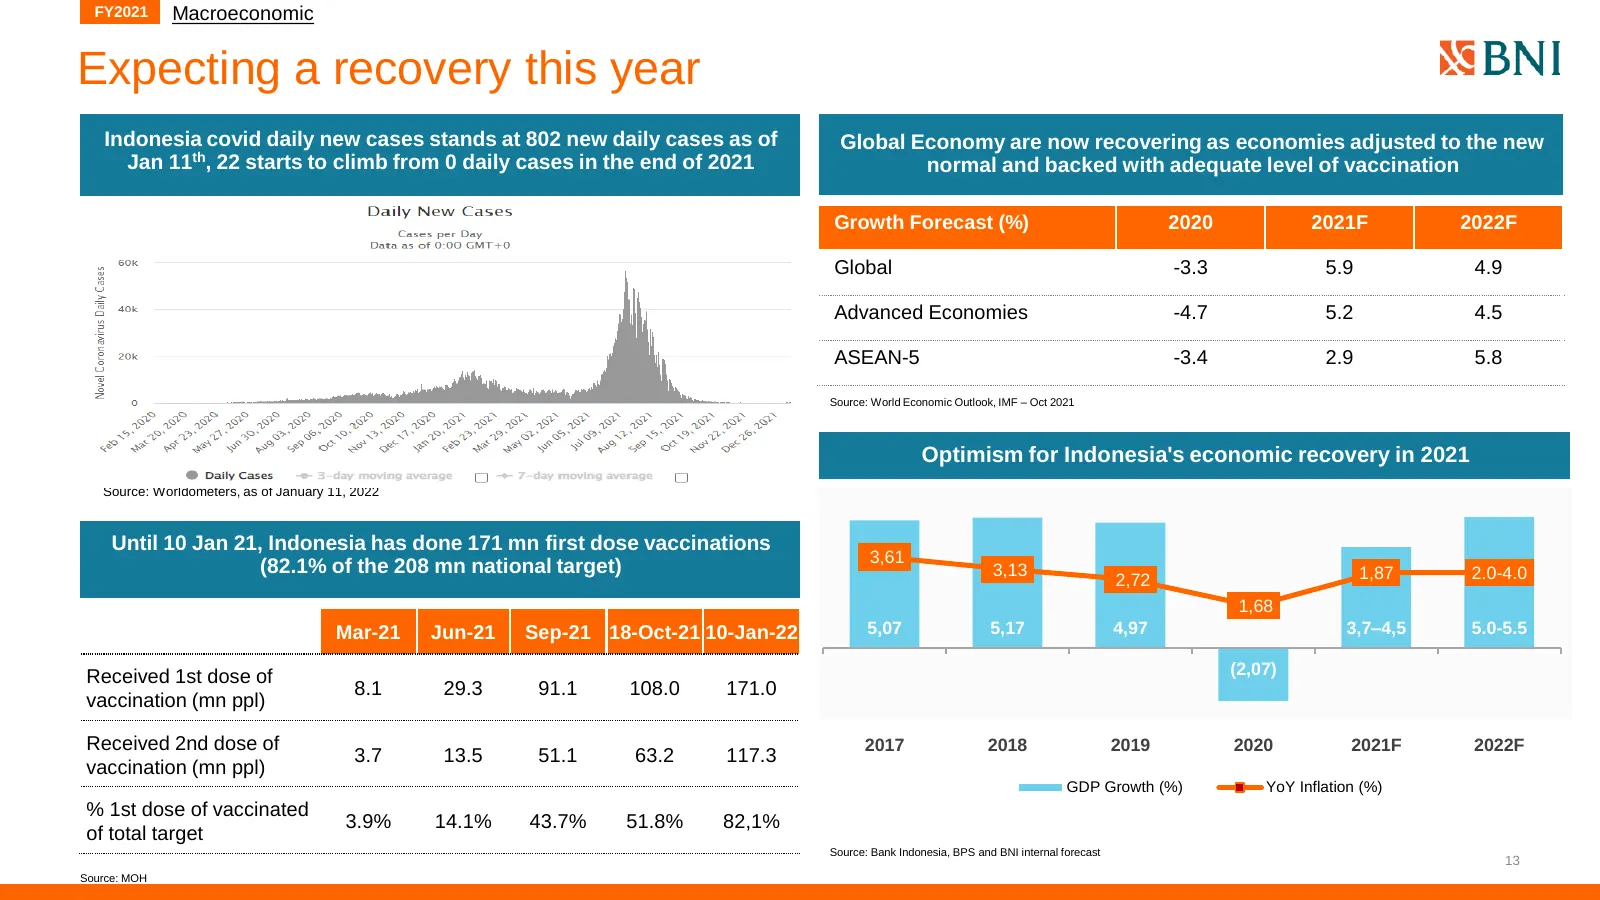
FY2021 Macroeconomic Expecting a recovery this year Indonesia covid daily new cases stands at 802 new daily cases as of Global Economy are now recovering as economies adjusted to the new Jan 11th, 22 starts to climb from 0 daily cases in the end of 2021 normal and backed with adequate level of vacci
Slide 14: Leading Economic Indicators
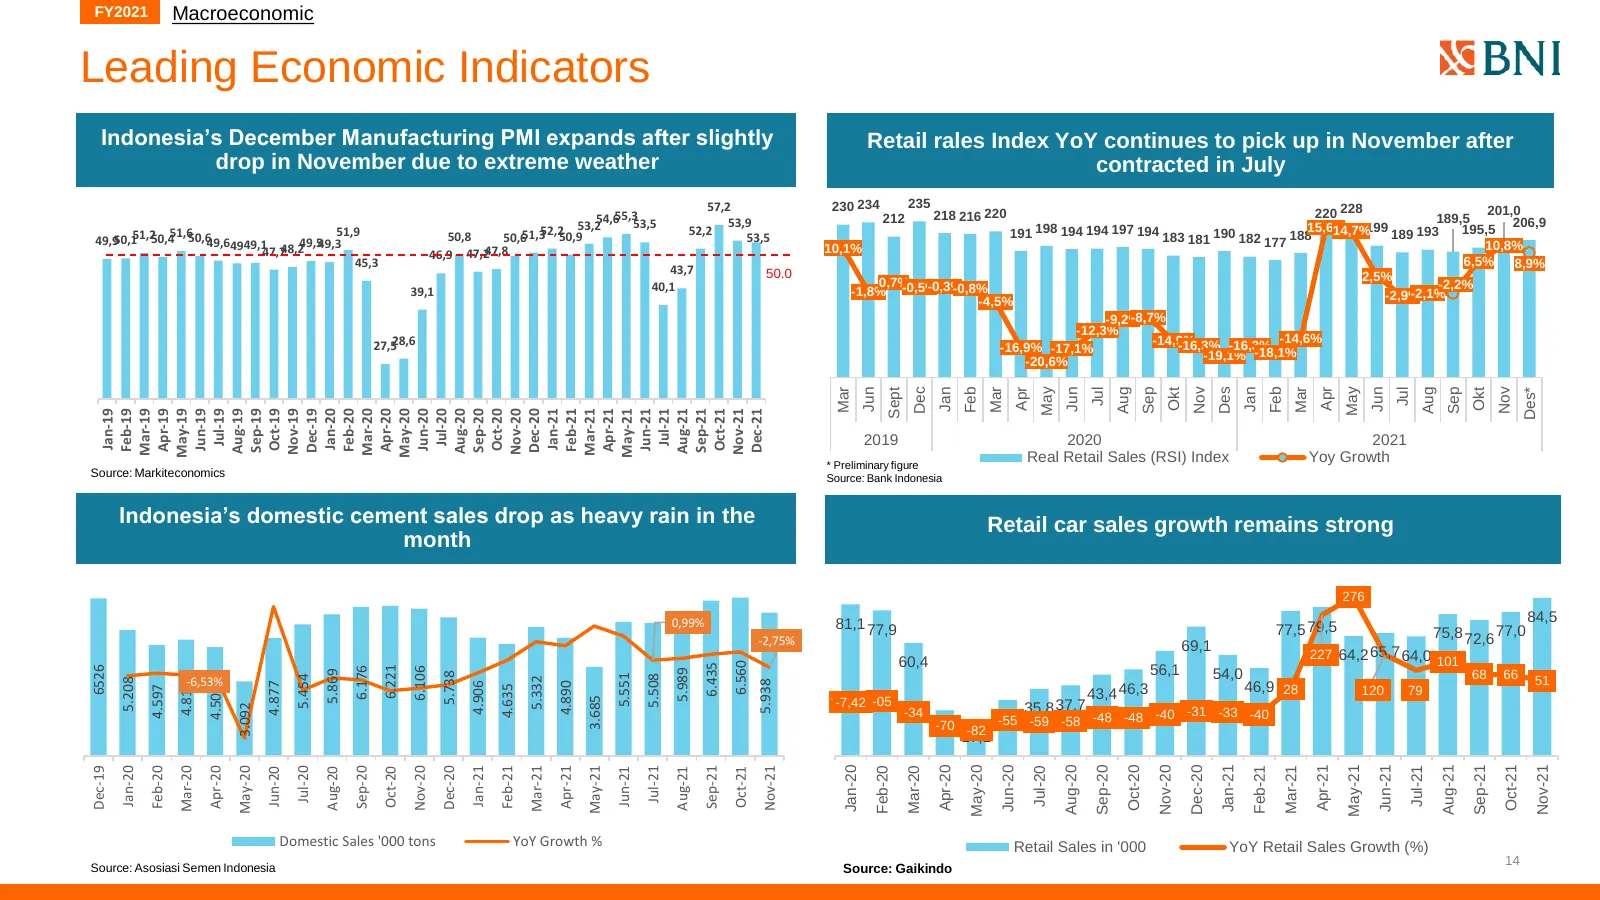
FY2021 Macroeconomic Leading Economic Indicators Indonesia’s December Manufacturing PMI expands after slightly Retail rales Index YoY continues to pick up in November after drop in November due to extreme weather contracted in July 57,2 230 234 235 54,655,353,5 250 212 218 216 220 220 228 189,5 201,
Slide 15: Financial Performance
FY2021 Financial Performance
Slide 16: Highlighted Results
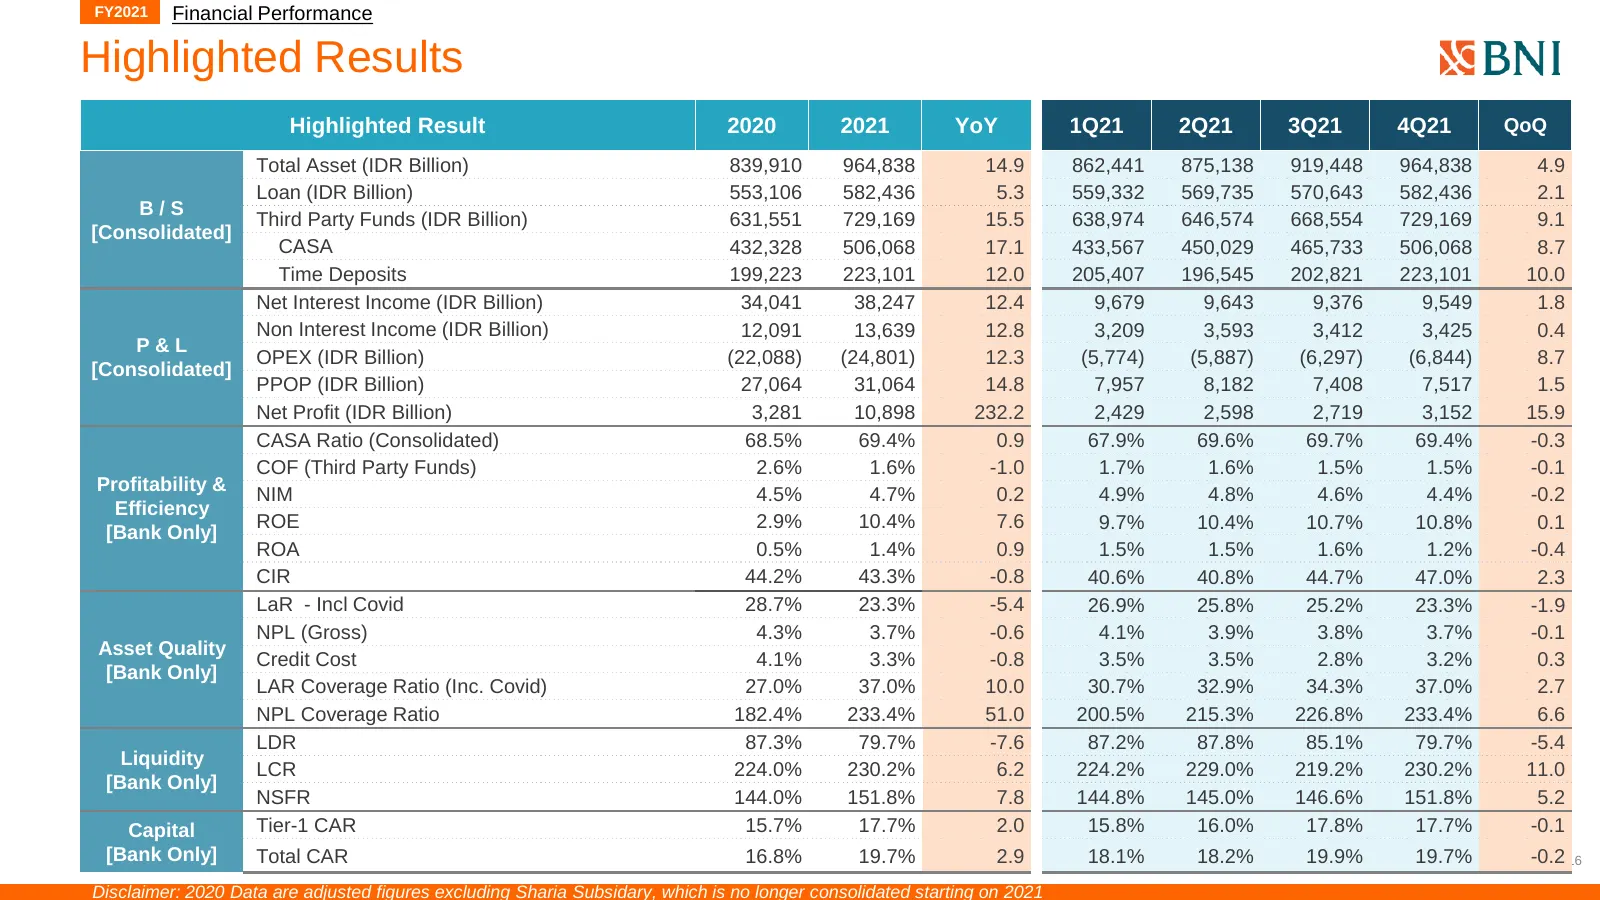
FY2021 Financial Performance Highlighted Results Highlighted Result 2020 2021 YoY 1Q21 2Q21 3Q21 4Q21 QoQ Total Asset (IDR Billion) 839,910 964,838 14.9 862,441 875,138 919,448 964,838 4.9 Loan (IDR Billion) 553,106 582,436 5.3 559,332 569,735 570,643 582,436 2.1 B/S Third Party Funds (IDR Billion)
Slide 17: Healthy Growth From Lower Risk Segments
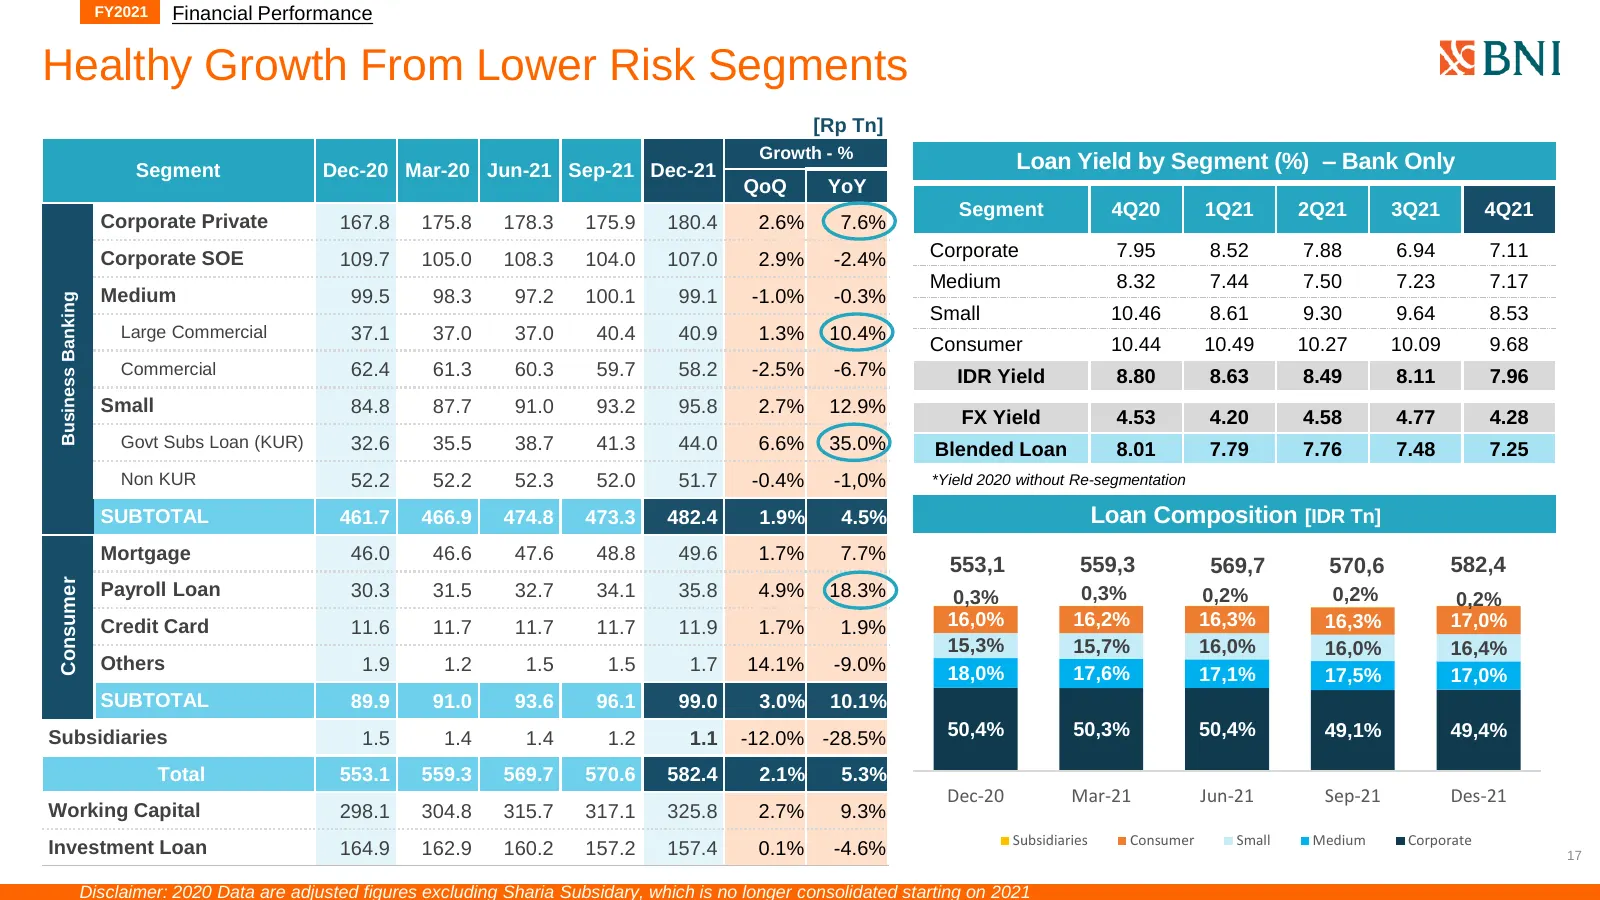
FY2021 Financial Performance Healthy Growth From Lower Risk Segments [Rp Tn] Growth - % Segment Dec-20 Mar-20 Jun-21 Sep-21 Dec-21 Loan Yield by Segment (%) – Bank Only QoQ YoY Segment 4Q20 1Q21 2Q21 3Q21 4Q21 Corporate Private 167.8 175.8 178.3 175.9 180.4 2.6% 7.6% Corporate SOE 109.7 105.0 108.3
Slide 18: All time high annual PPOP coupled by smaller loan loss provision
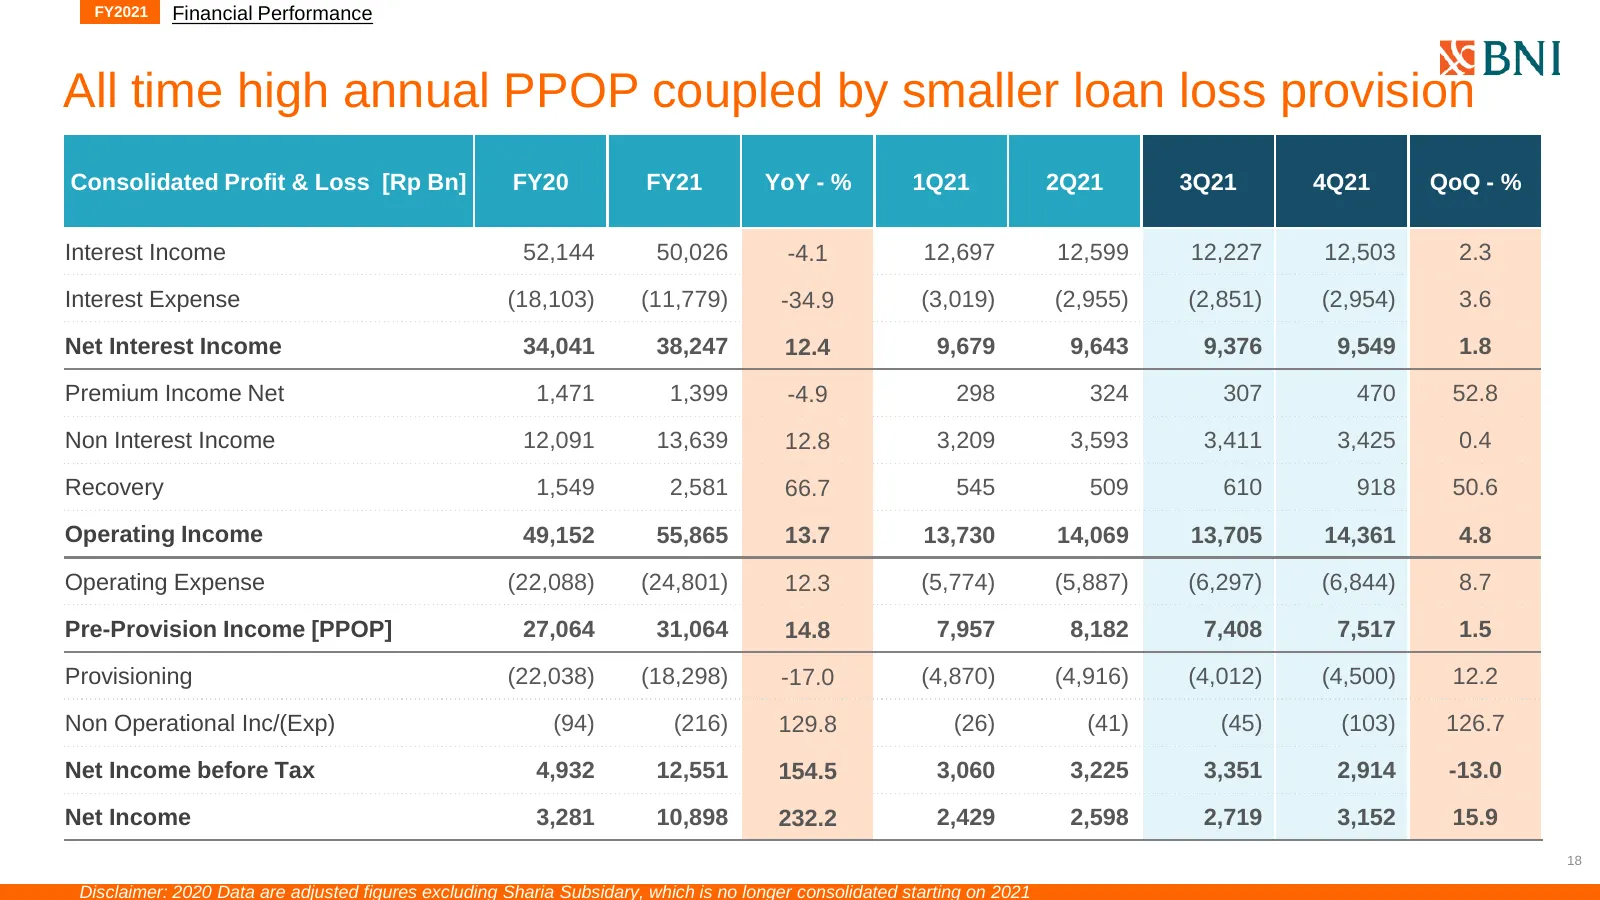
FY2021 Financial Performance All time high annual PPOP coupled by smaller loan loss provision Consolidated Profit & Loss [Rp Bn] FY20 FY21 YoY - % 1Q21 2Q21 3Q21 4Q21 QoQ - % Interest Income 52,144 50,026 -4.1 12,697 12,599 12,227 12,503 2.3 Interest Expense (18,103) (11,779) -34.9 (3,019) (2,955) (
Slide 19: Most of the Fee Income Sources Rebounded Strongly YoY
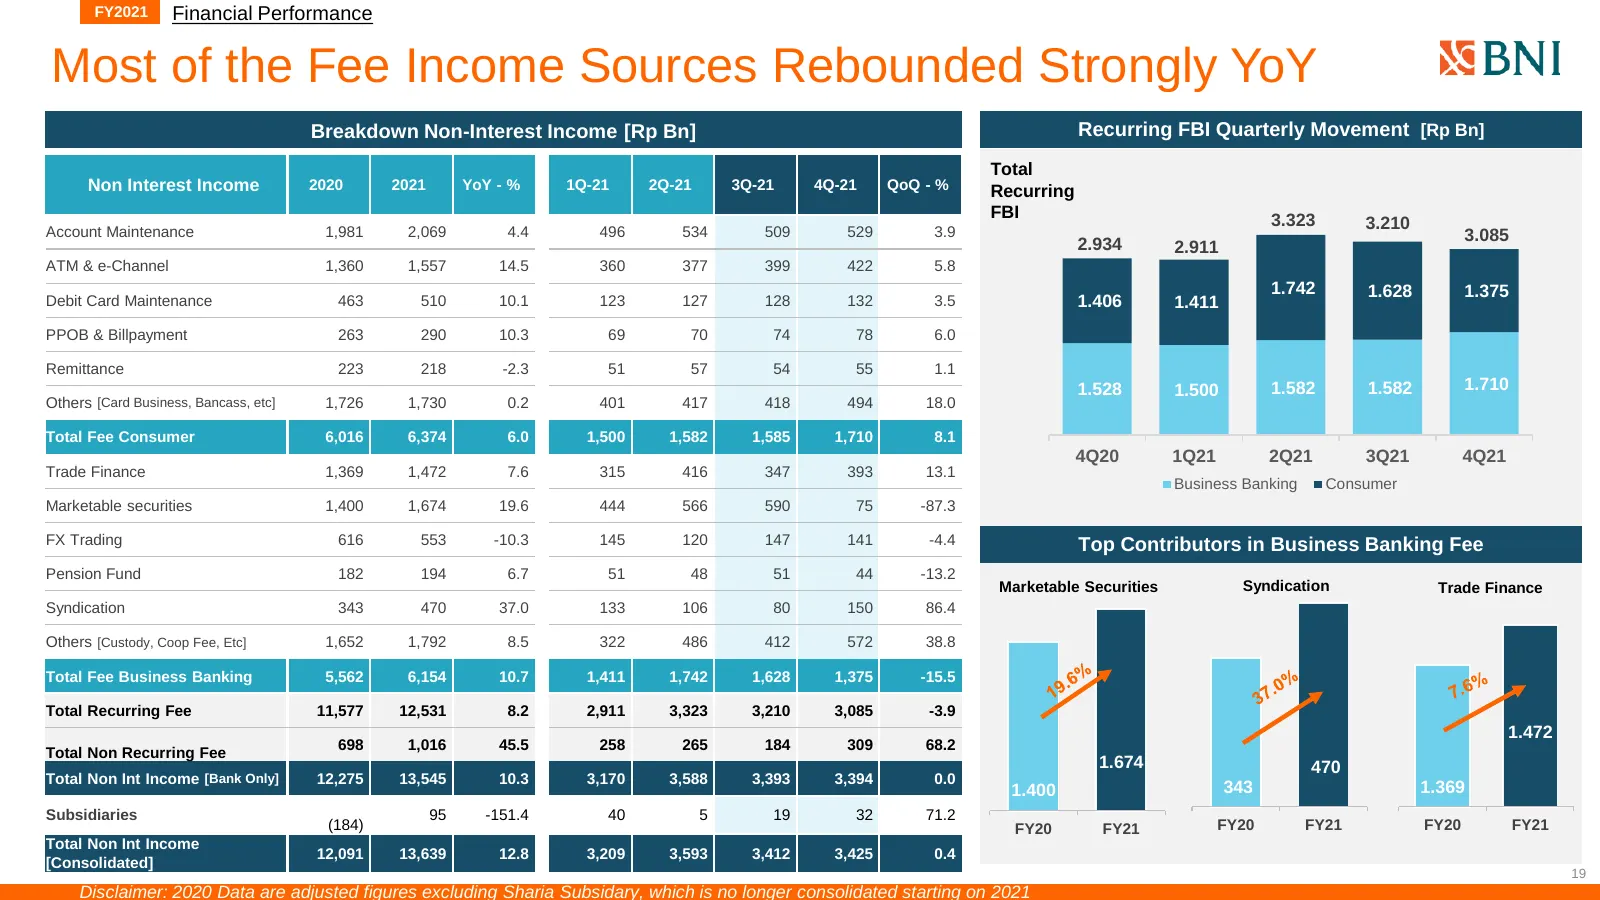
FY2021 Financial Performance Most of the Fee Income Sources Rebounded Strongly YoY Breakdown Non-Interest Income [Rp Bn] Recurring FBI Quarterly Movement [Rp Bn] Total Non Interest Income 2020 2021 YoY - % 1Q-21 2Q-21 3Q-21 4Q-21 QoQ - % Recurring FBI 3.323 Account Maintenance 1,981 2,069 4.4 496 53
Slide 20: Opex realignment to support transformation agenda
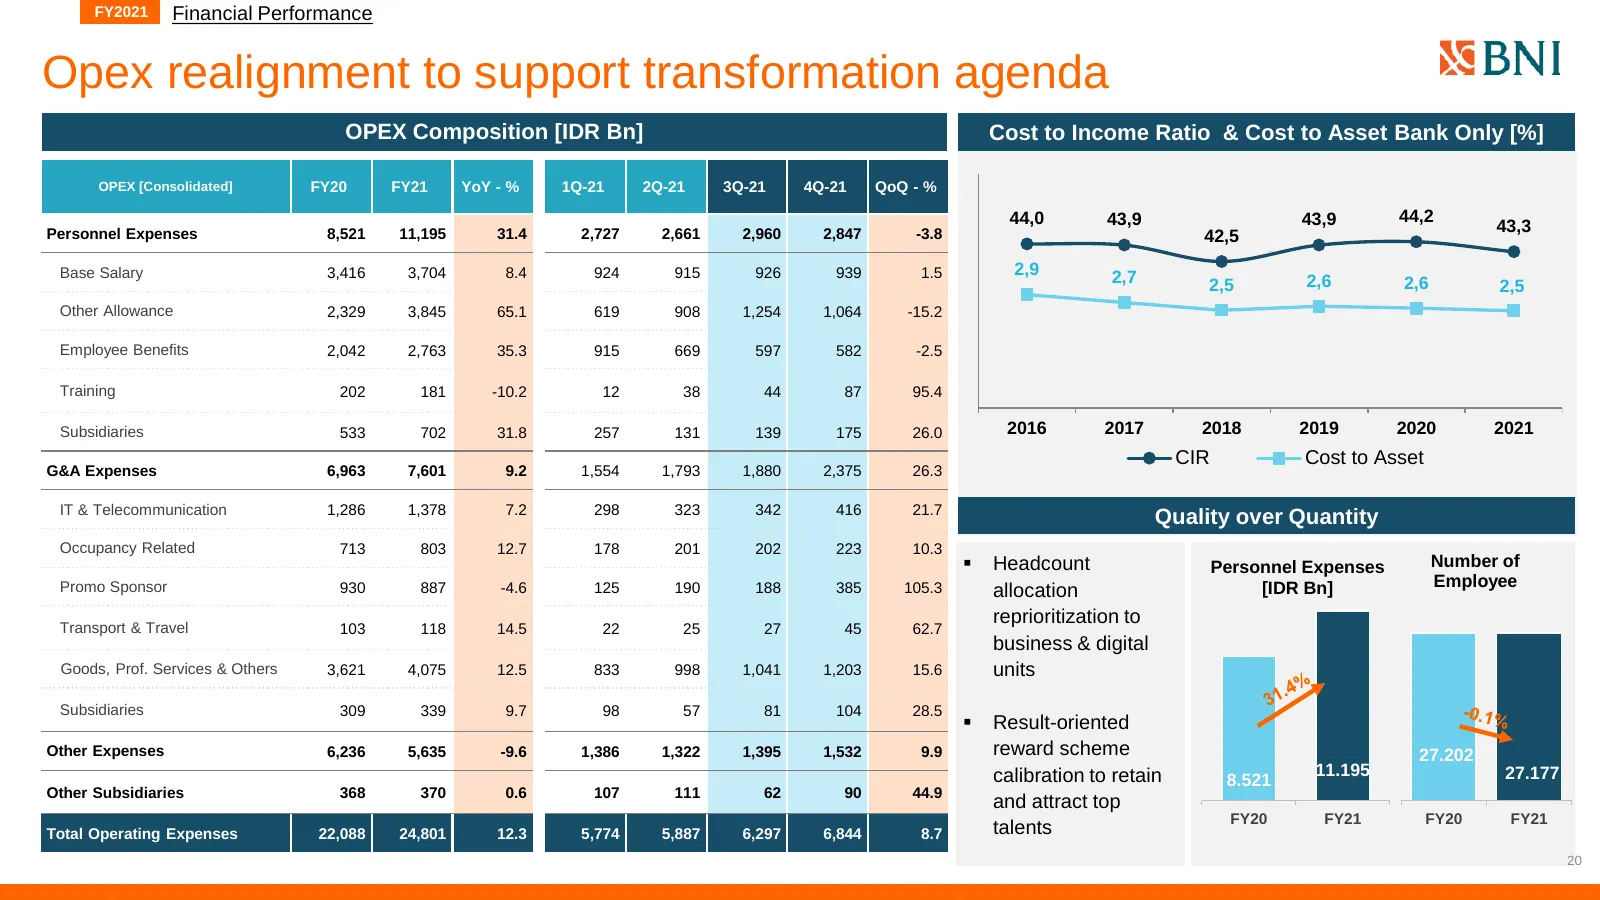
FY2021 Financial Performance Opex realignment to support transformation agenda OPEX Composition [IDR Bn] Cost to Income Ratio & Cost to Asset Bank Only [%] OPEX [Consolidated] FY20 FY21 YoY - % 1Q-21 2Q-21 3Q-21 4Q-21 QoQ - % 44,0 43,9 43,9 44,2 Personnel Expenses 8,521 11,195 31.4 2,727 2,661 2,960
Slide 21: Excess liquidity surprise is temporarily parked on banks placement
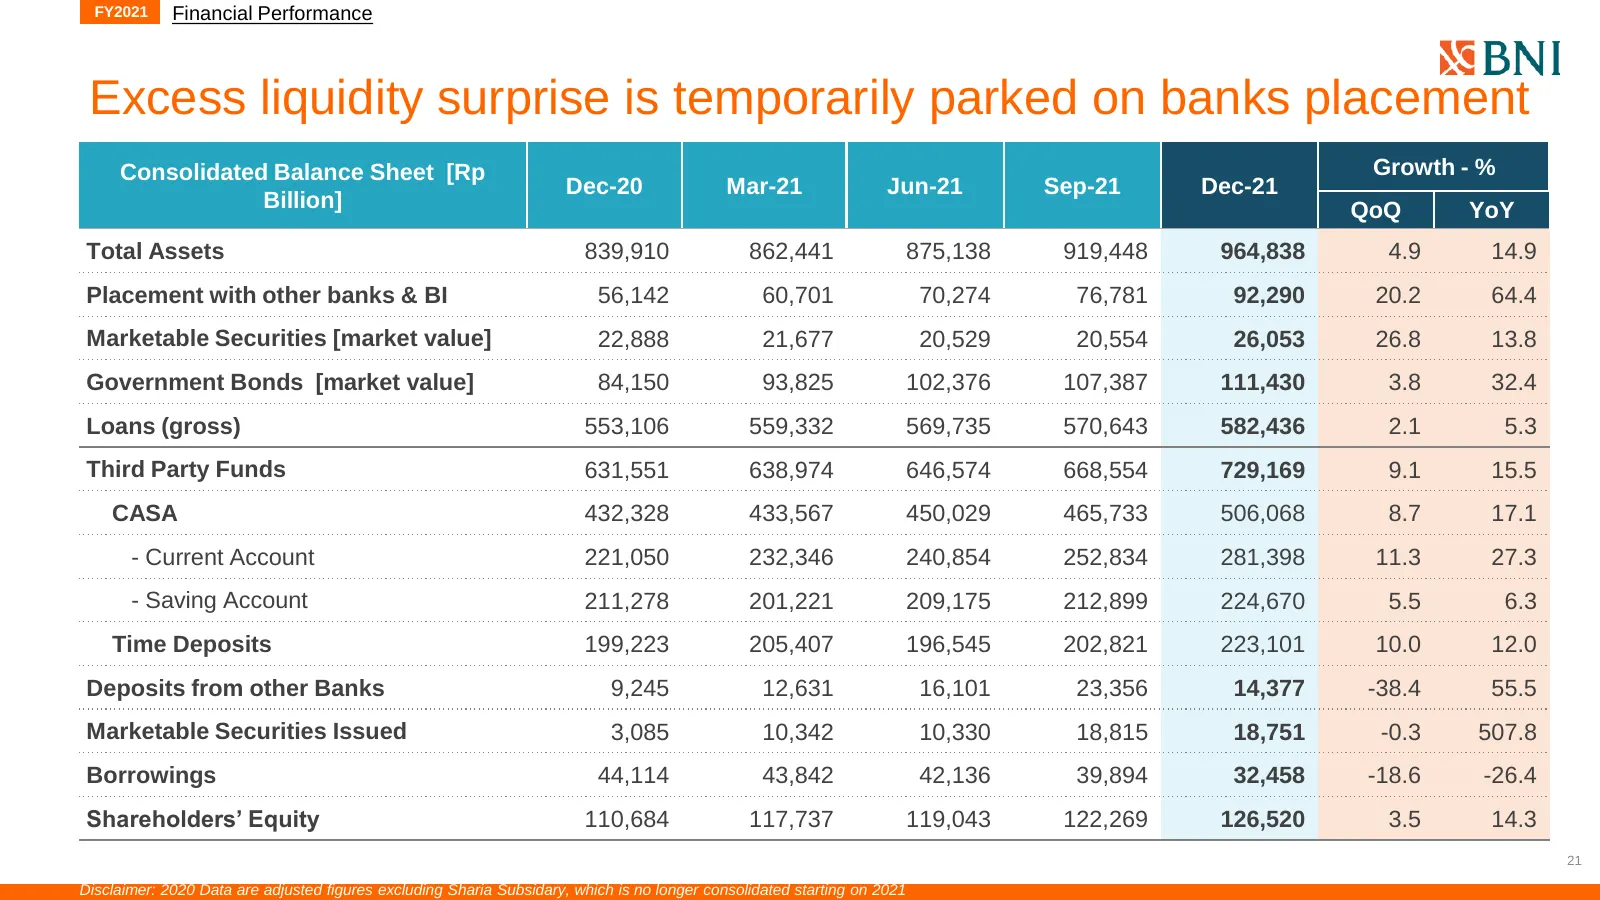
FY2021 Financial Performance Excess liquidity surprise is temporarily parked on banks placement Consolidated Balance Sheet [Rp Growth - % Dec-20 Mar-21 Jun-21 Sep-21 Dec-21 Billion] QoQ YoY Total Assets 839,910 862,441 875,138 919,448 964,838 4.9 14.9 Placement with other banks & BI 56,142 60,701 70
Slide 22: Stronger than expected funding leads to rate cut in 1Q21
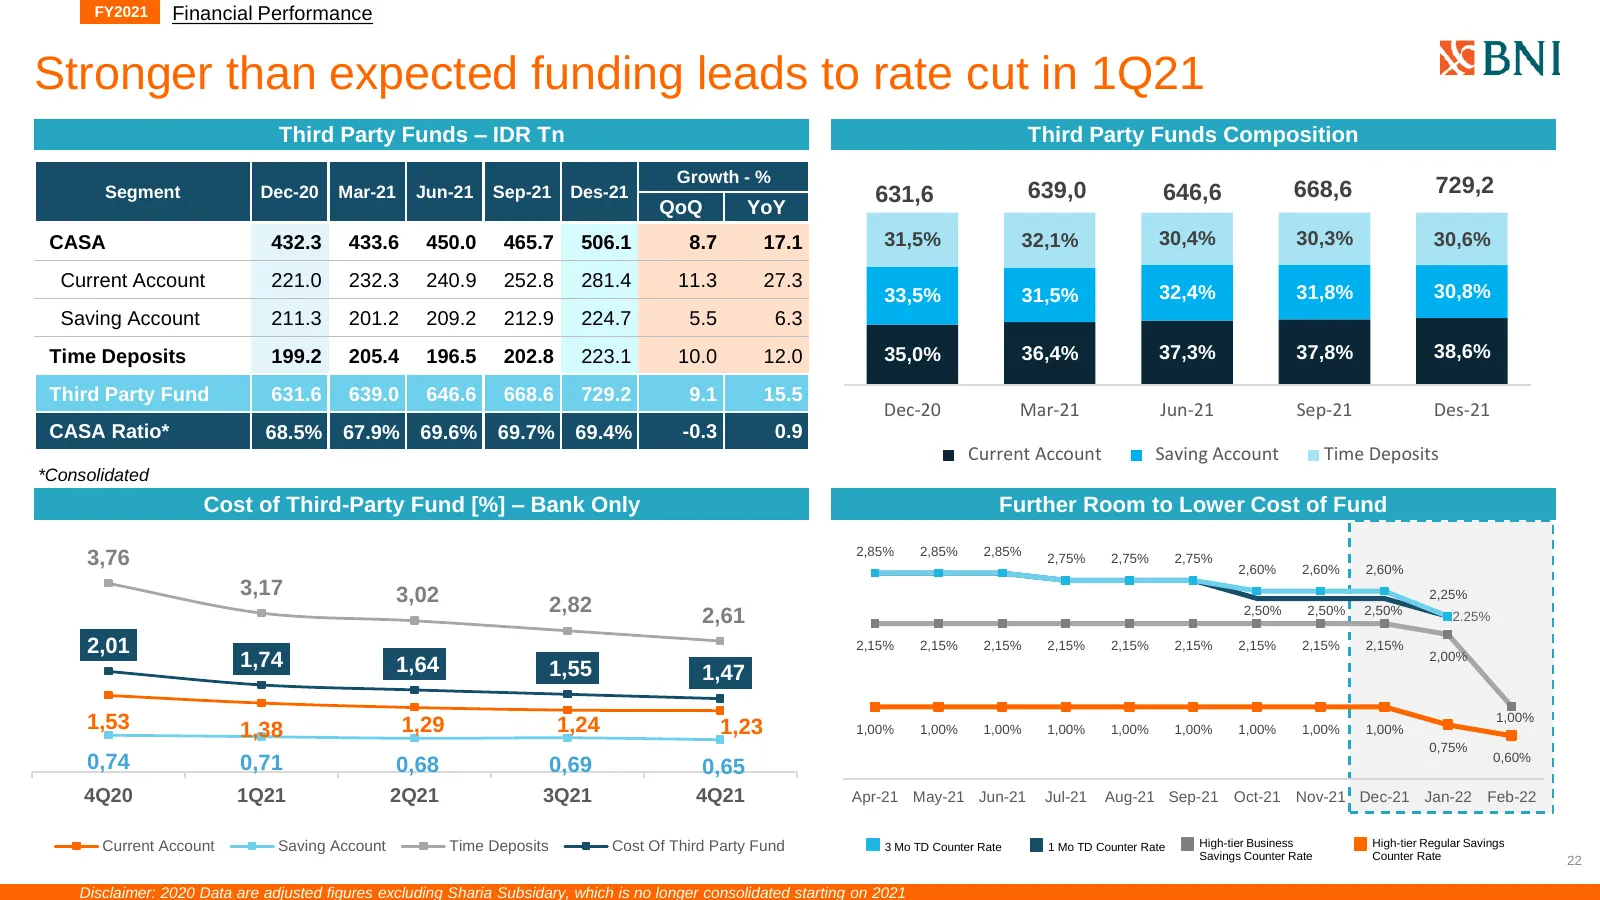
FY2021 Financial Performance Stronger than expected funding leads to rate cut in 1Q21 Third Party Funds – IDR Tn Third Party Funds Composition Growth - % 729,2 120 ,0% 815 ,0 Segment Dec-20 Mar-21 Jun-21 Sep-21 Des-21 631,6 639,0 646,6 668,6 715 ,0 QoQ YoY 100 ,0% 615 ,0 CASA 432.3 433.6 450.0 465.7
Slide 23: Surging Liquidity During 4Q21
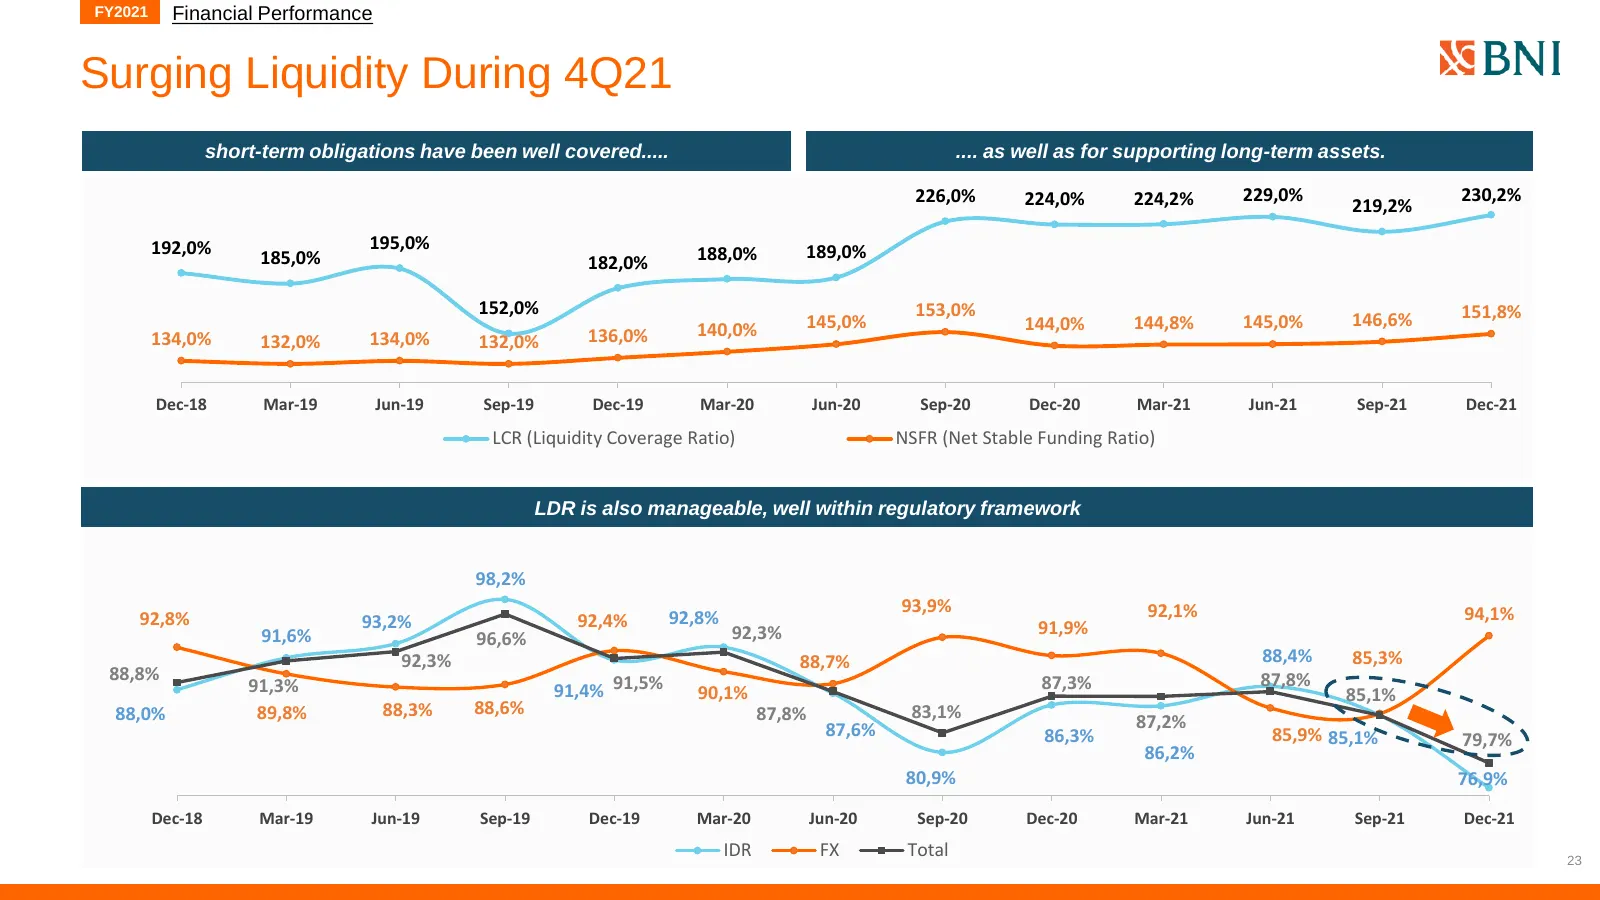
FY2021 Financial Performance Surging Liquidity During 4Q21 short-term obligations have been well covered..... .... as well as for supporting long-term assets. 226,0% 224,0% 224,2% 229,0% 230,2% 219,2% 192,0% 195,0% 189,0% 185,0% 182,0% 188,0% 152,0% 153,0% 151,8% 145,0% 144,0% 144,8% 145,0% 146,6% 1
Slide 24: Asset Quality
FY2021 Asset Quality
Slide 25: The amount of Covid-19 restructuring continued to decline
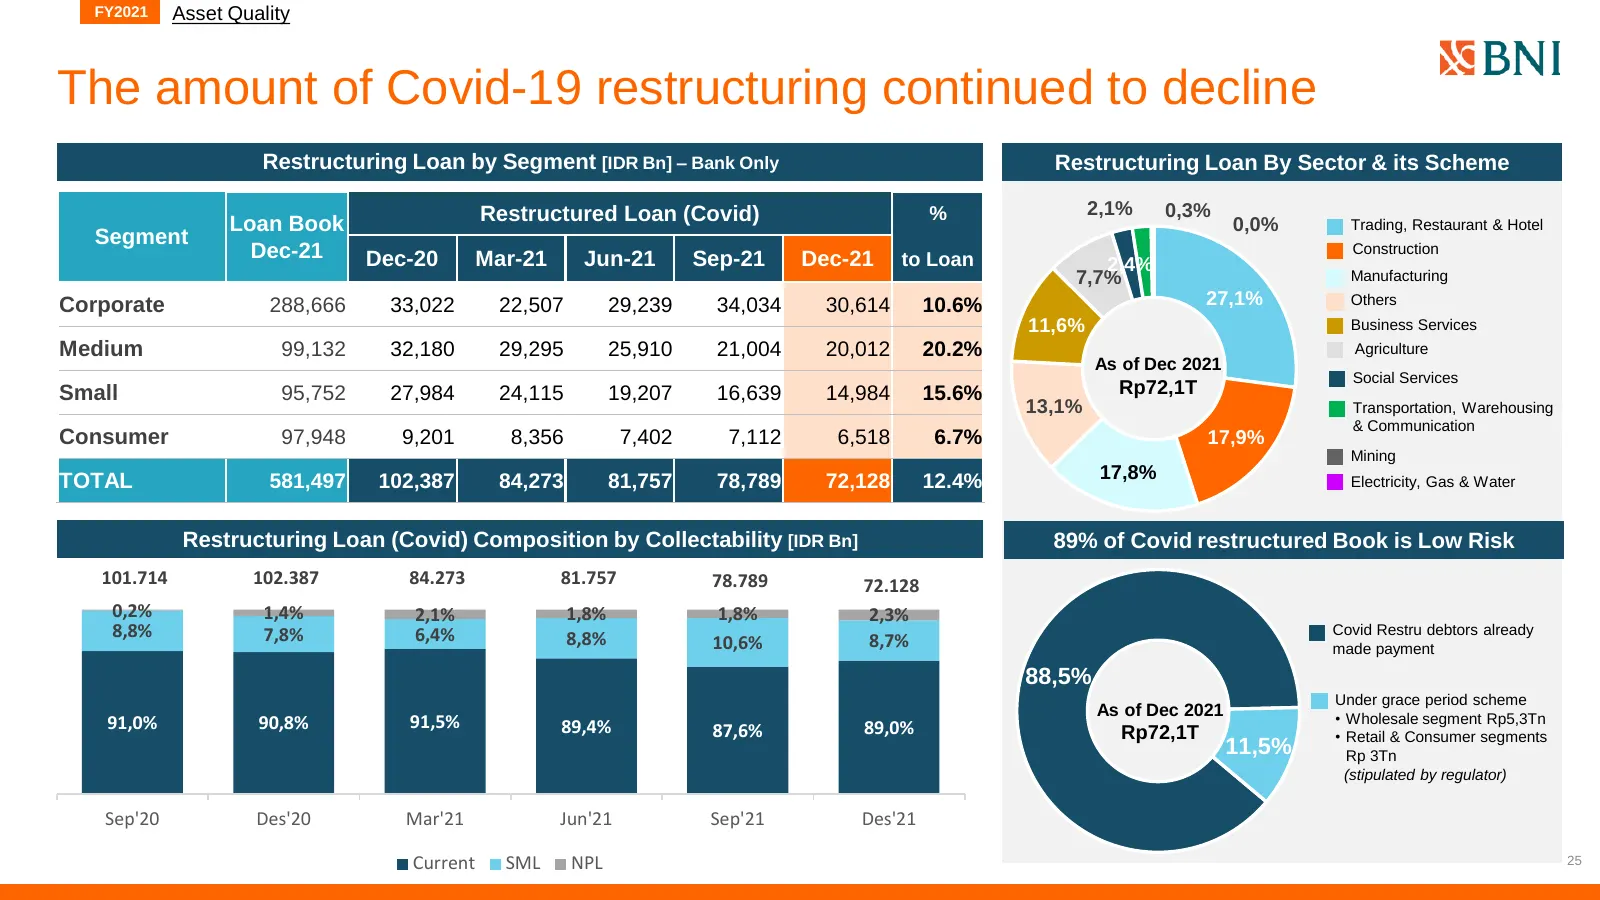
FY2021 Asset Quality The amount of Covid-19 restructuring continued to decline Restructuring Loan by Segment [IDR Bn] – Bank Only Restructuring Loan By Sector & its Scheme Restructured Loan (Covid) % 2,1% 0,3% Loan Book 0,0% Trading, Restaurant & Hotel Segment Dec-21 Dec-20 Mar-21 Jun-21 Sep-21 Dec-
Slide 26: LAR improvement driven by Special Mention and NPL contraction
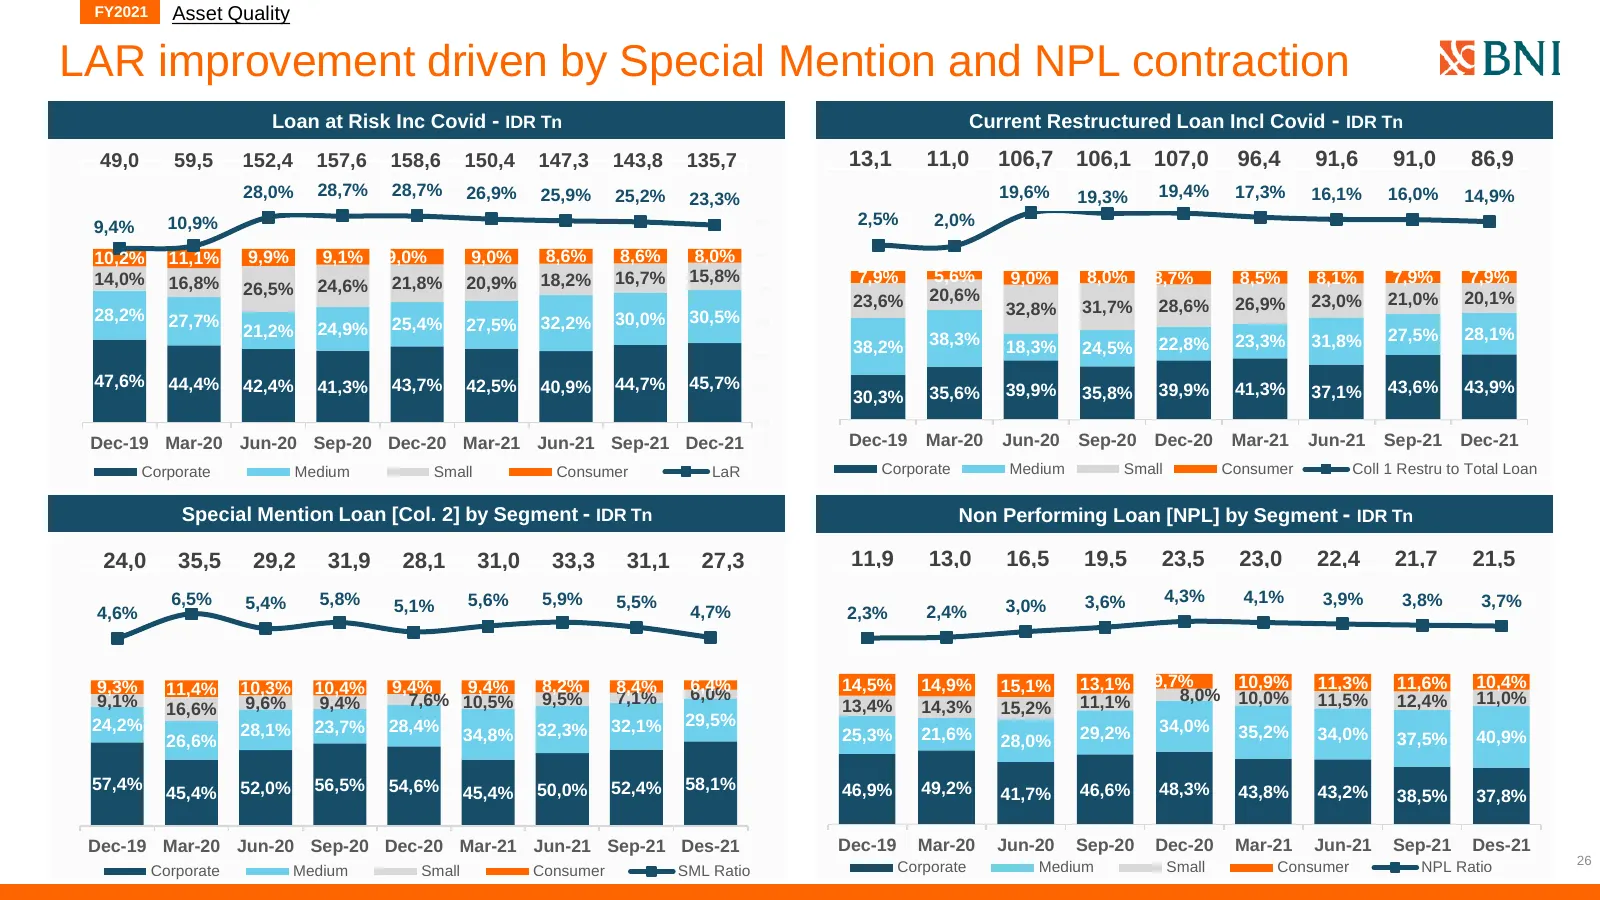
FY2021 Asset Quality LAR improvement driven by Special Mention and NPL contraction Loan at Risk Inc Covid - IDR Tn Current Restructured Loan Incl Covid - IDR Tn 49,0 59,5 152,4 157,6 158,6 150,4 147,3 143,8 135,7 13,1 11,0 106,7 106,1 107,0 96,4 91,6 91,0 86,9 28,0% 28,7% 28,7% 26,9% 25,9% 25,2% 19,
Slide 27: Loan at Risk & Provision Coverage
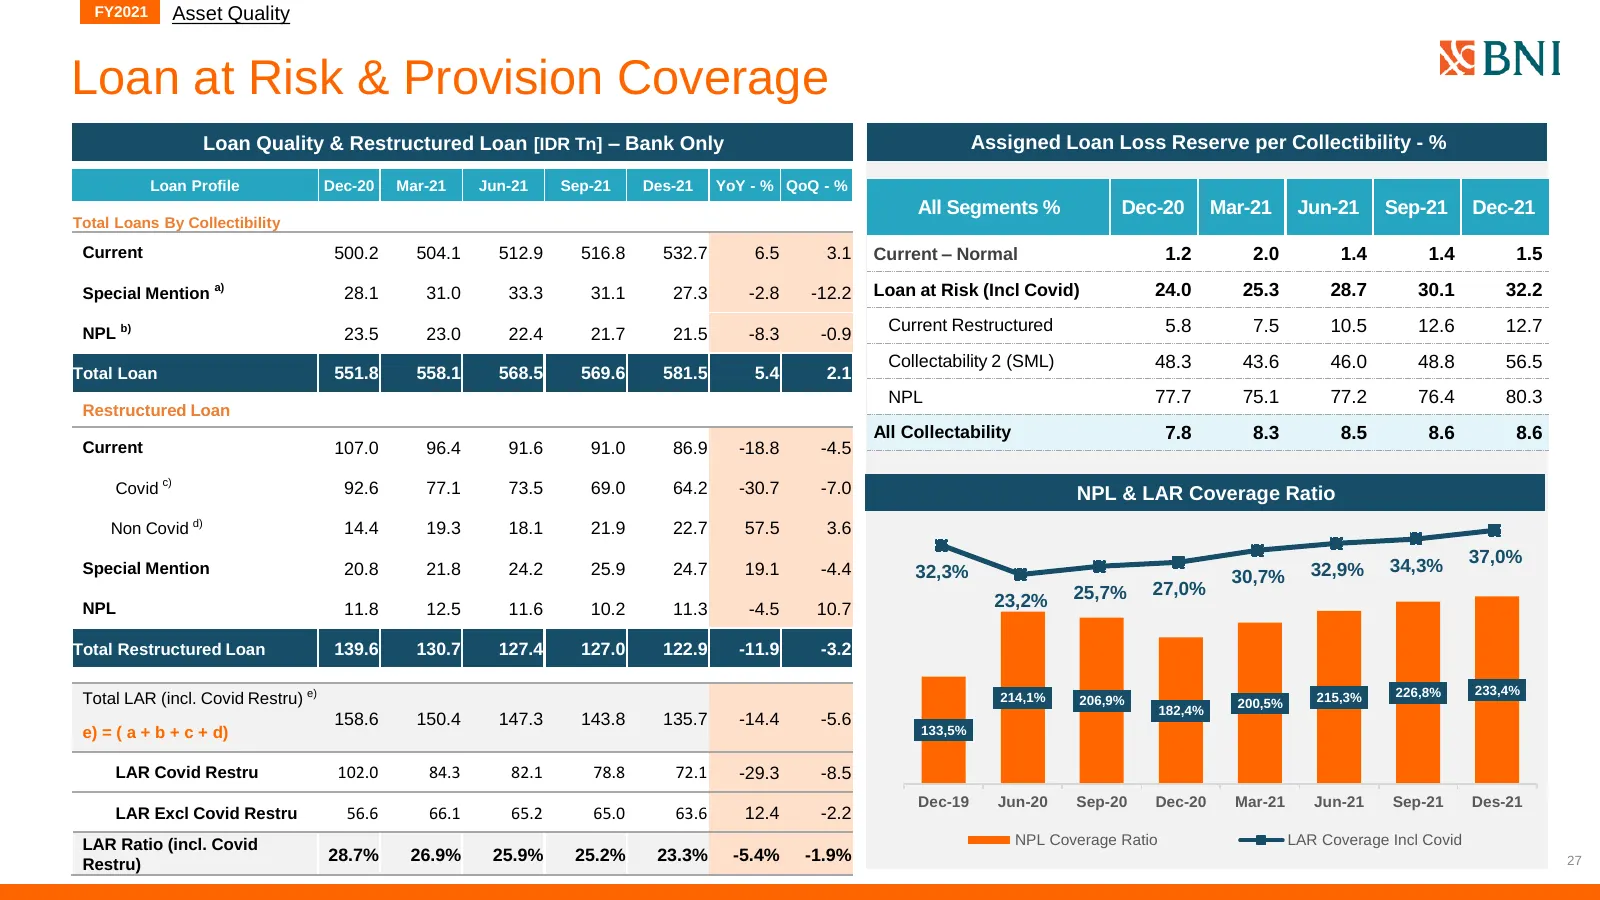
FY2021 Asset Quality Loan at Risk & Provision Coverage Loan Quality & Restructured Loan [IDR Tn] – Bank Only Assigned Loan Loss Reserve per Collectibility - % Loan Profile Dec-20 Mar-21 Jun-21 Sep-21 Des-21 YoY - % QoQ - % All Segments % Dec-20 Mar-21 Jun-21 Sep-21 Dec-21 Total Loans By Collectibili
Slide 28: SML, NPL, Write Off & Recovery [Bank Only]
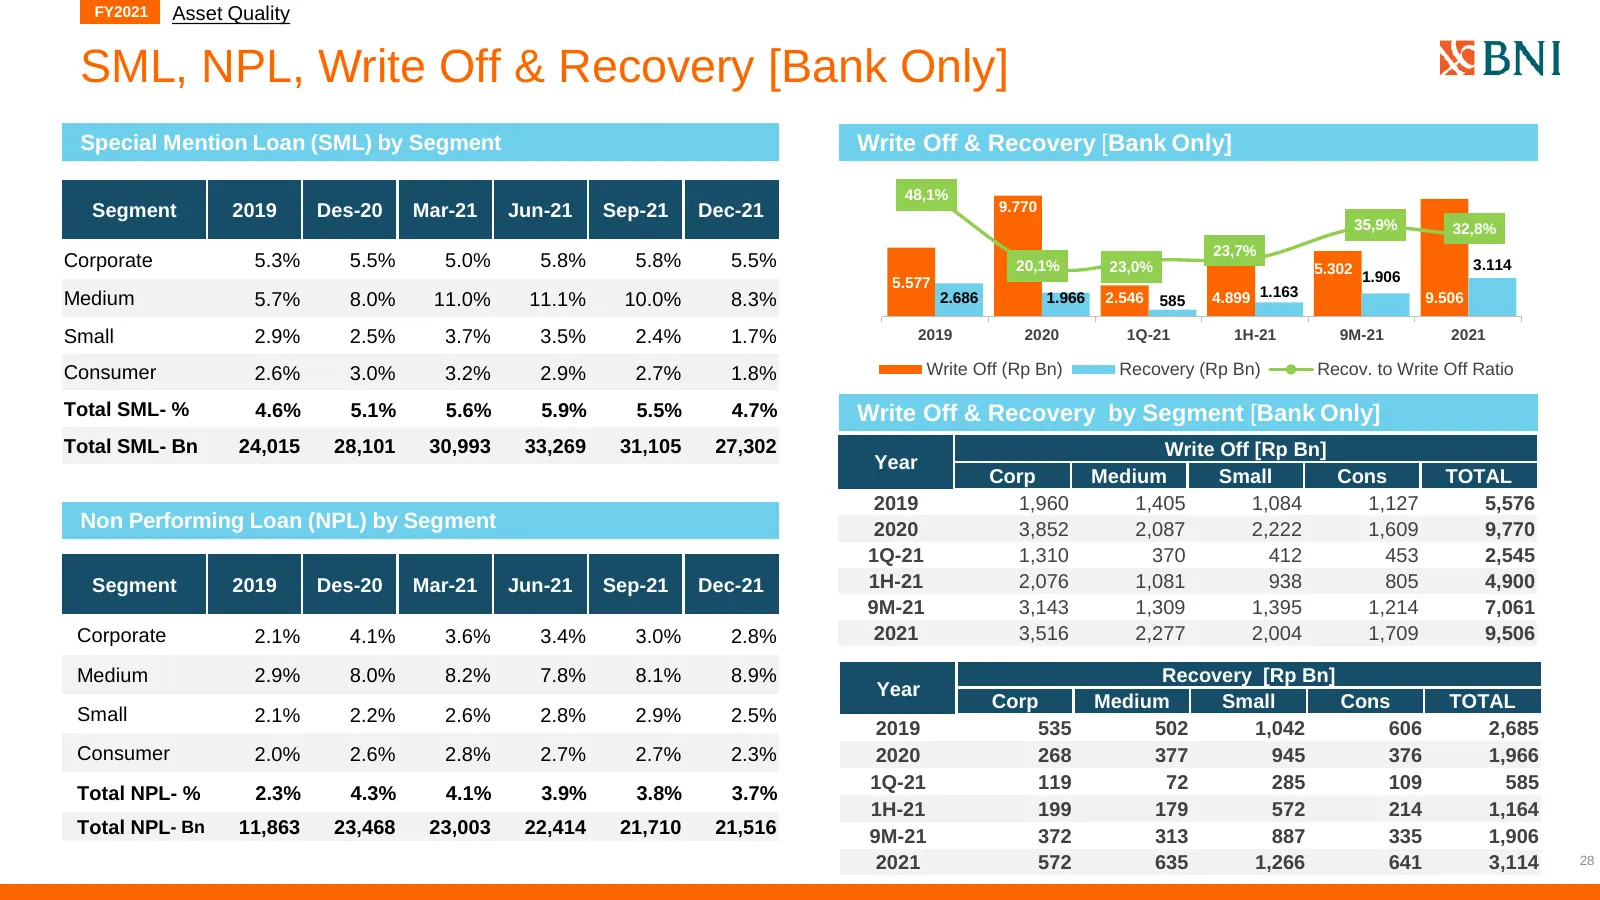
FY2021 Asset Quality SML, NPL, Write Off & Recovery [Bank Only] Special Mention Loan (SML) by Segment Write Off & Recovery [Bank Only] 48,1% Segment 2019 Des-20 Mar-21 Jun-21 Sep-21 Dec-21 9.770 35,9% 32,8% 23,7% Corporate 5.3% 5.5% 5.0% 5.8% 5.8% 5.5% 20,1% 23,0% 5.302 1.906 3.114 5.577 Medium 5.7%
Slide 29: Digital Initiatives
Digital Initiatives
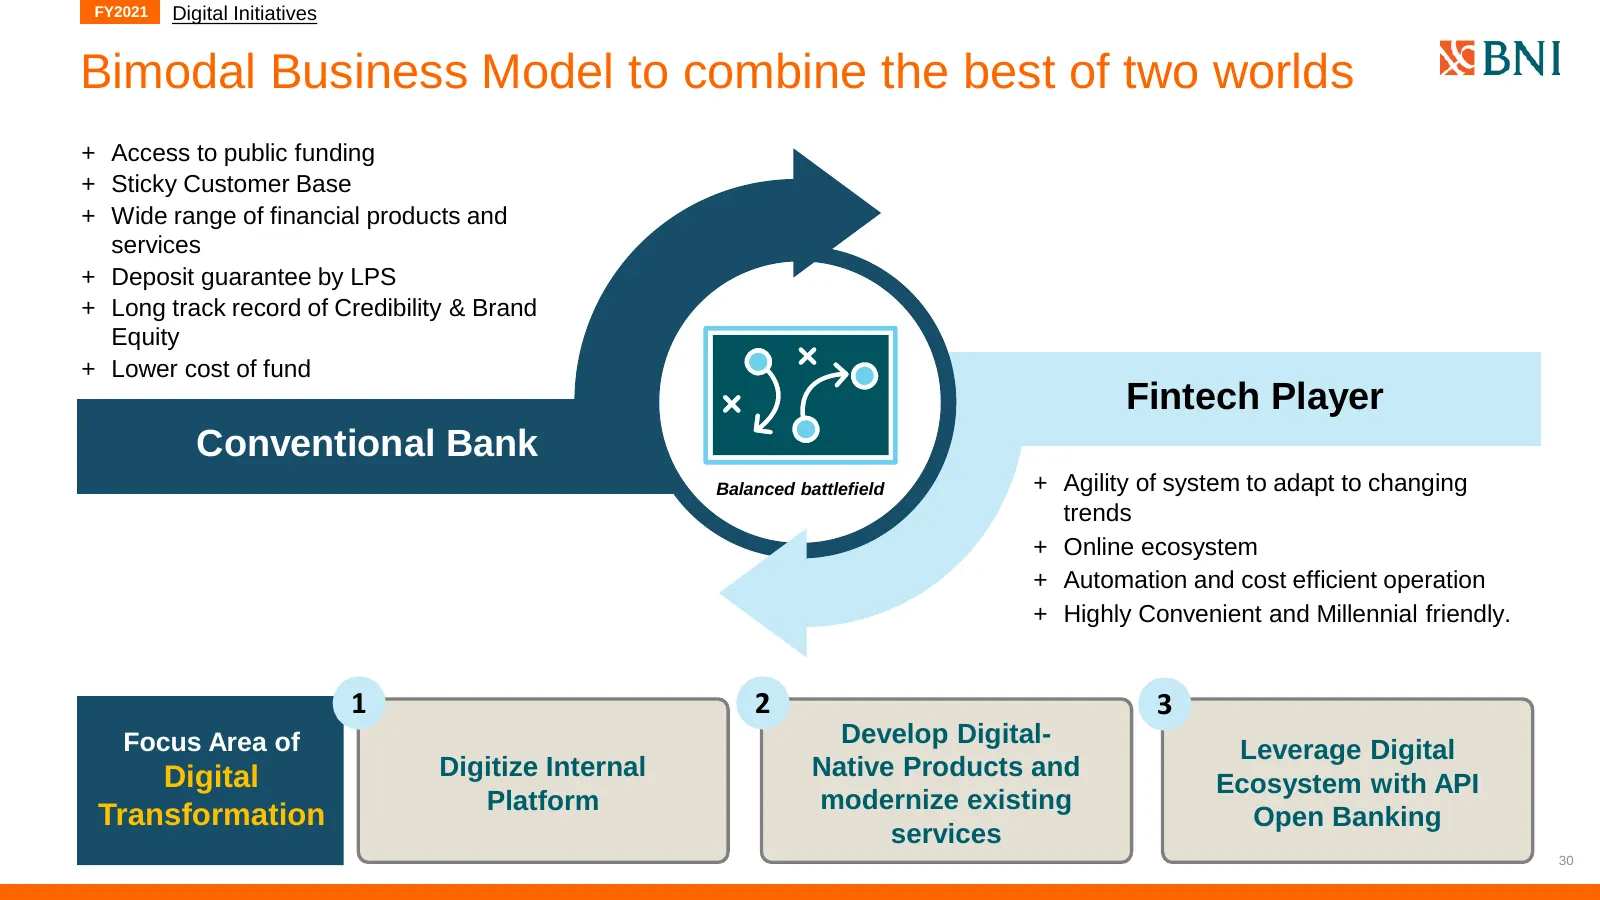
Slide 30: Bimodal Business Model to combine the best of two worlds
FY2021 Digital Initiatives Bimodal Business Model to combine the best of two worlds + Access to public funding + Sticky Customer Base + Wide range of financial products and services + Deposit guarantee by LPS + Long track record of Credibility & Brand Equity + Lower cost of fund Fintech Player Conve
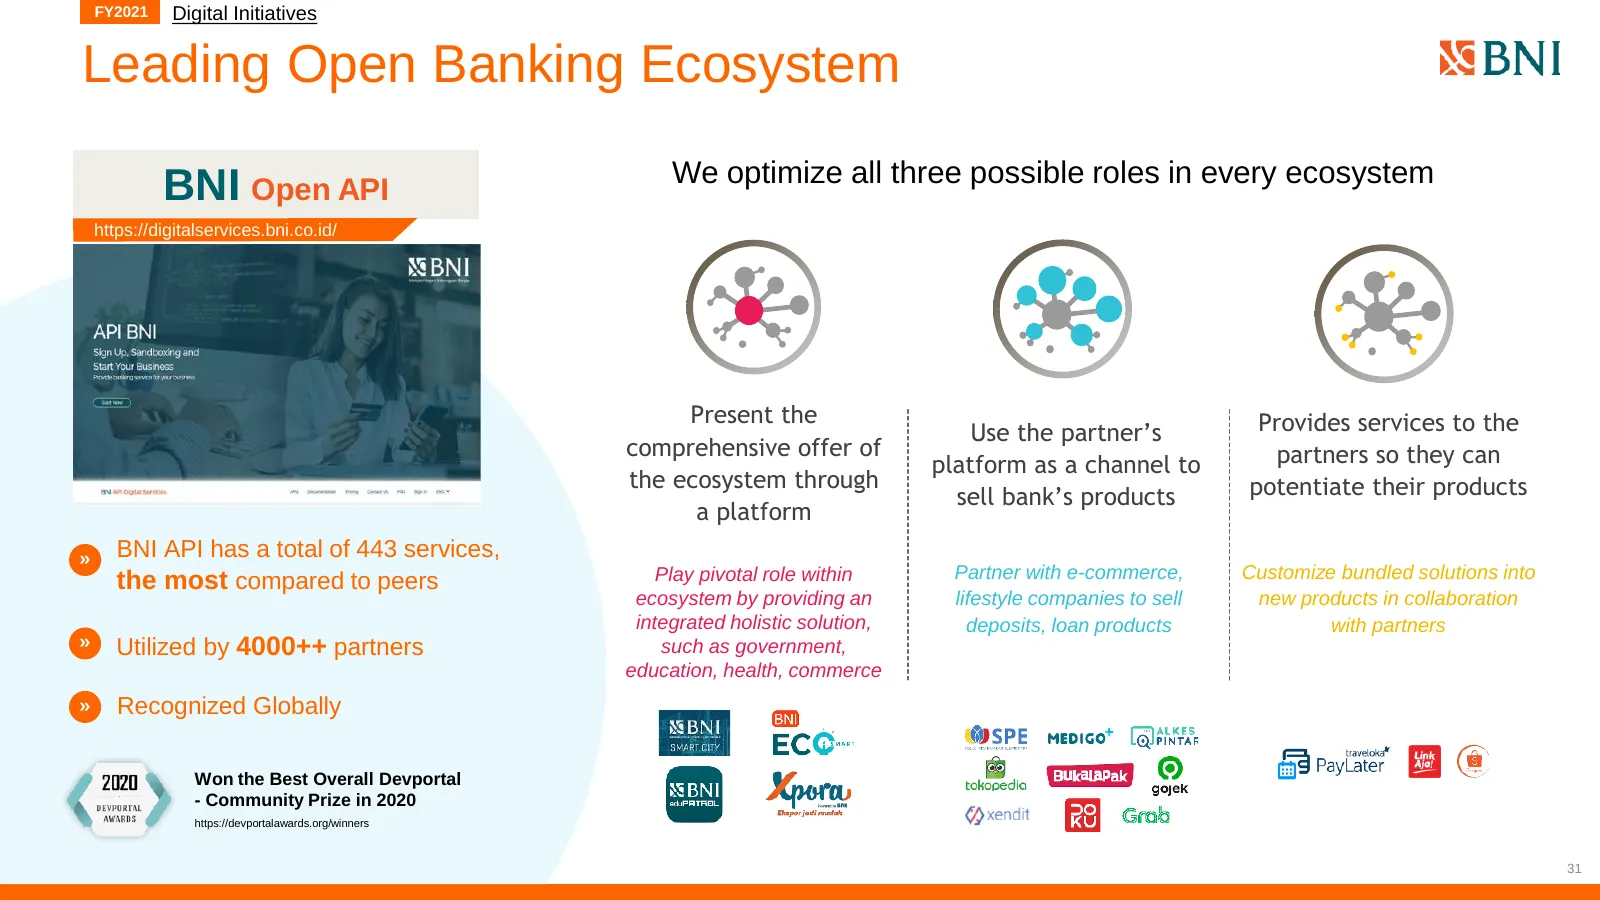
Slide 31: Leading Open Banking Ecosystem
FY2021 Digital Initiatives Leading Open Banking Ecosystem We optimize all three possible roles in every ecosystem BNI Open API https://digitalservices.bni.co.id/ Present the Provides services to the Use the partner’s comprehensive offer of partners so they can platform as a channel to the ecosystem
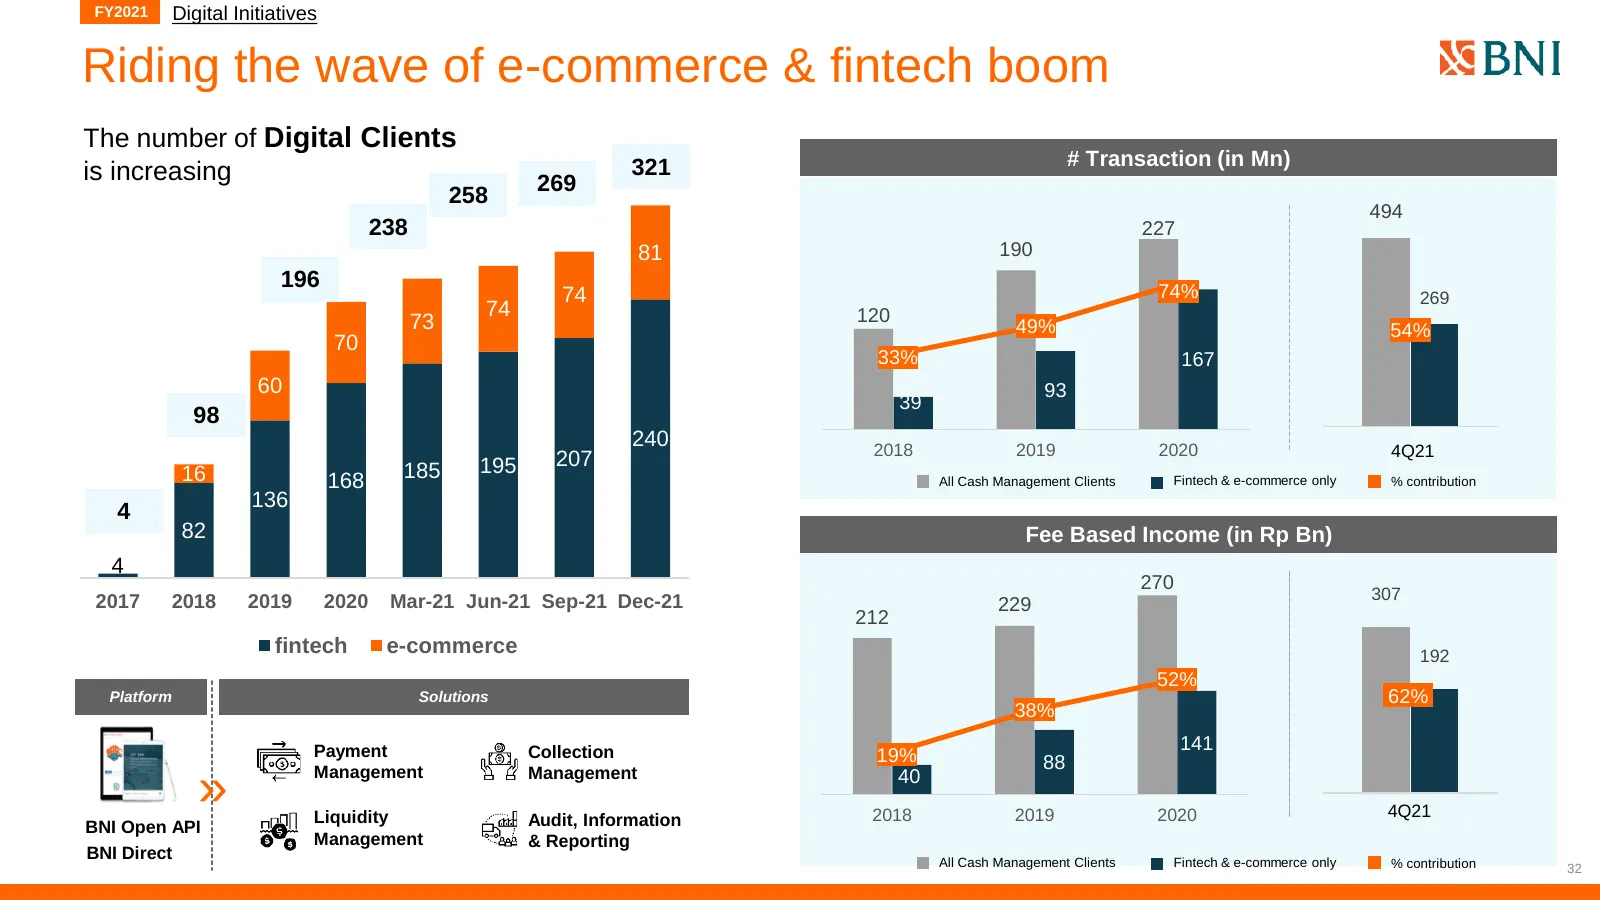
Slide 32: Riding the wave of e-commerce & fintech boom
FY2021 Digital Initiatives Riding the wave of e-commerce & fintech boom The number of Digital Clients 321 # Transaction (in Mn) is increasing 269 258 494 238 227 81 190 196 74% 74 269 74 120 73 49% 54% 70 33% 167 60 93 39 98 240 2018 2019 2020 4Q21 195 207 16 168 185 All Cash Management Clients Fint
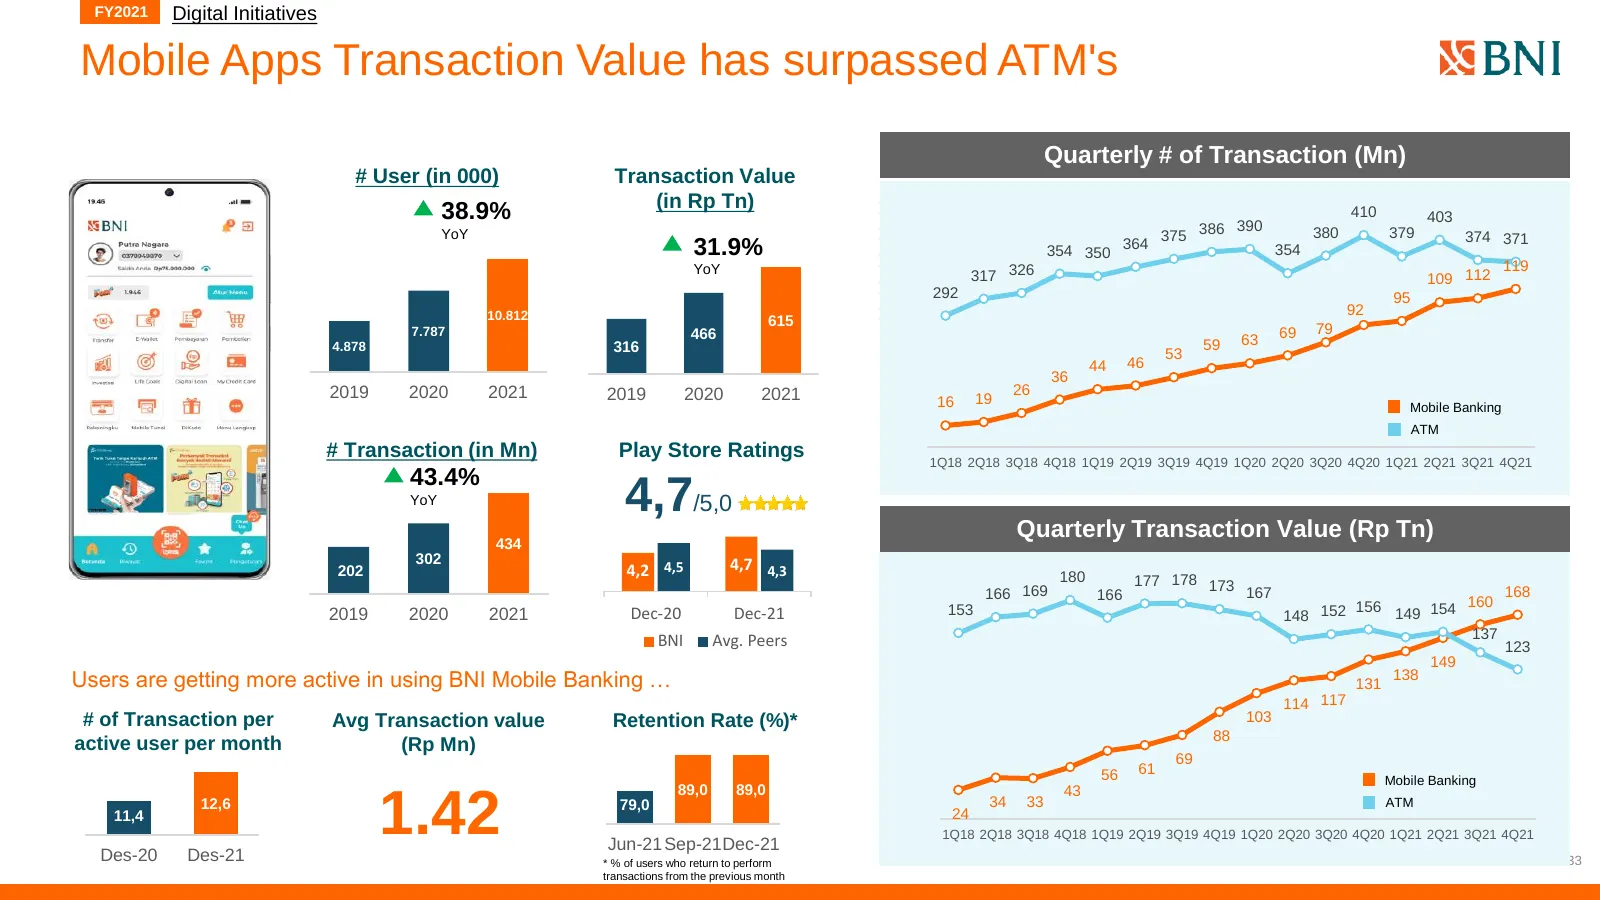
Slide 33: Mobile Apps Transaction Value has surpassed ATM's
FY2021 Digital Initiatives Mobile Apps Transaction Value has surpassed ATM's Quarterly # of Transaction (Mn) # User (in 000) Transaction Value (in Rp Tn) 180 38.9% 390 410 403 YoY 160 375 386 380 379 374 371 31.9% 354 350 364 354 140 119 YoY 317 326 109 112 120 292 95 10.812 100 92 615 7.787 466 69
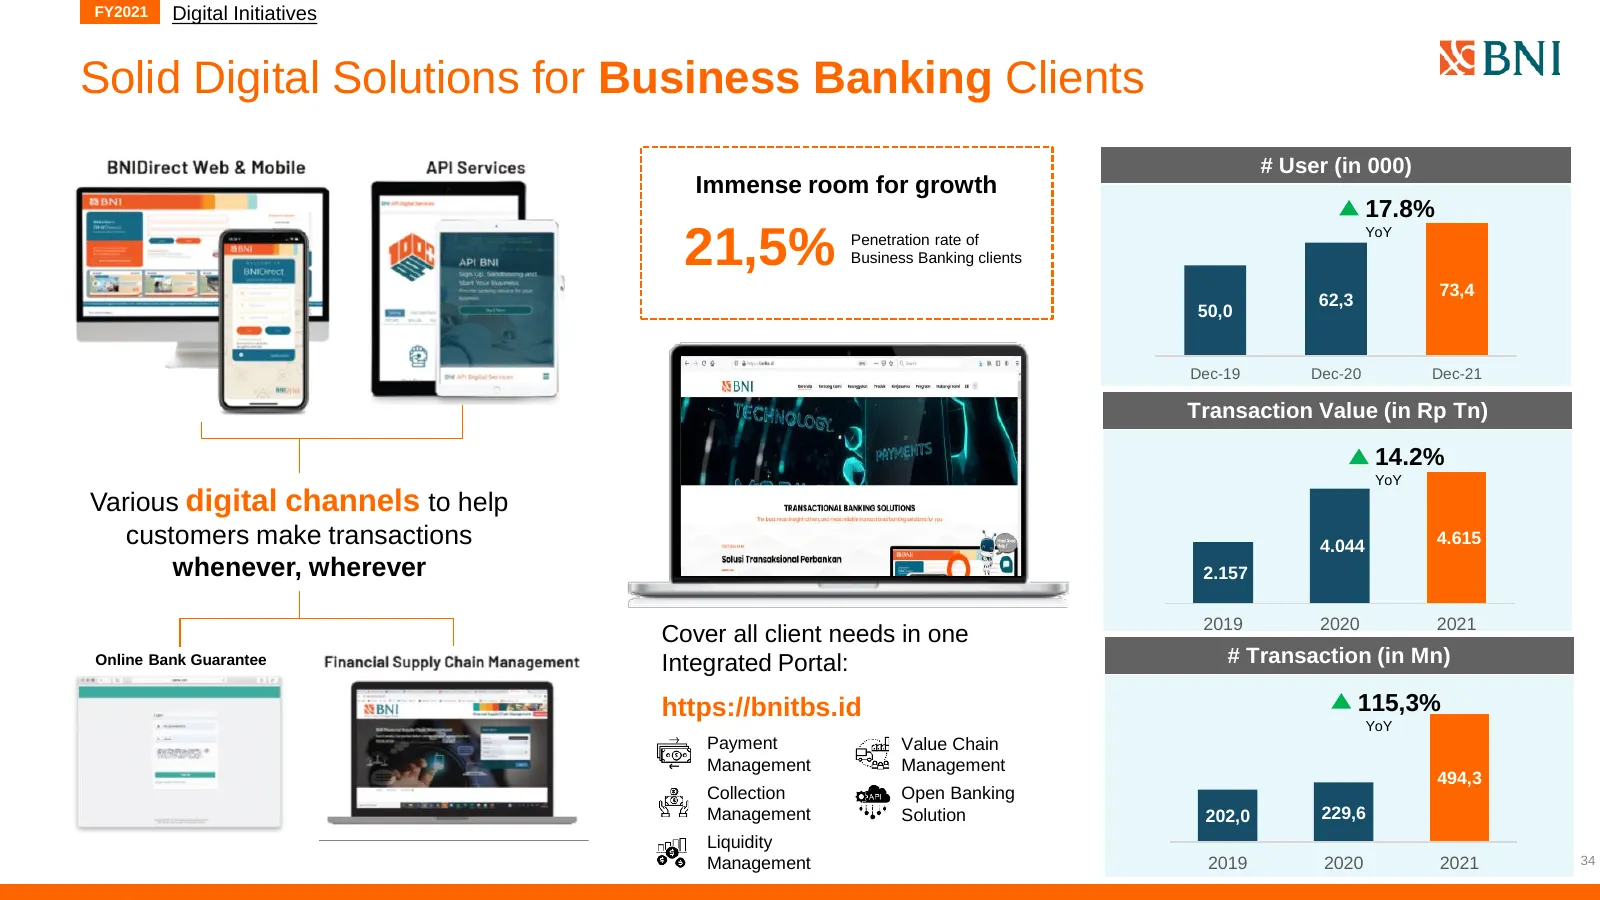
Slide 34: Solid Digital Solutions for Business Banking Clients
FY2021 Digital Initiatives Solid Digital Solutions for Business Banking Clients # User (in 000) Immense room for growth 17.8% YoY 21,5% Penetration rate of Business Banking clients 73,4 62,3 50,0 Dec-19 Dec-20 Dec-21 Transaction Value (in Rp Tn) 14.2% YoY Various digital channels to help customers m
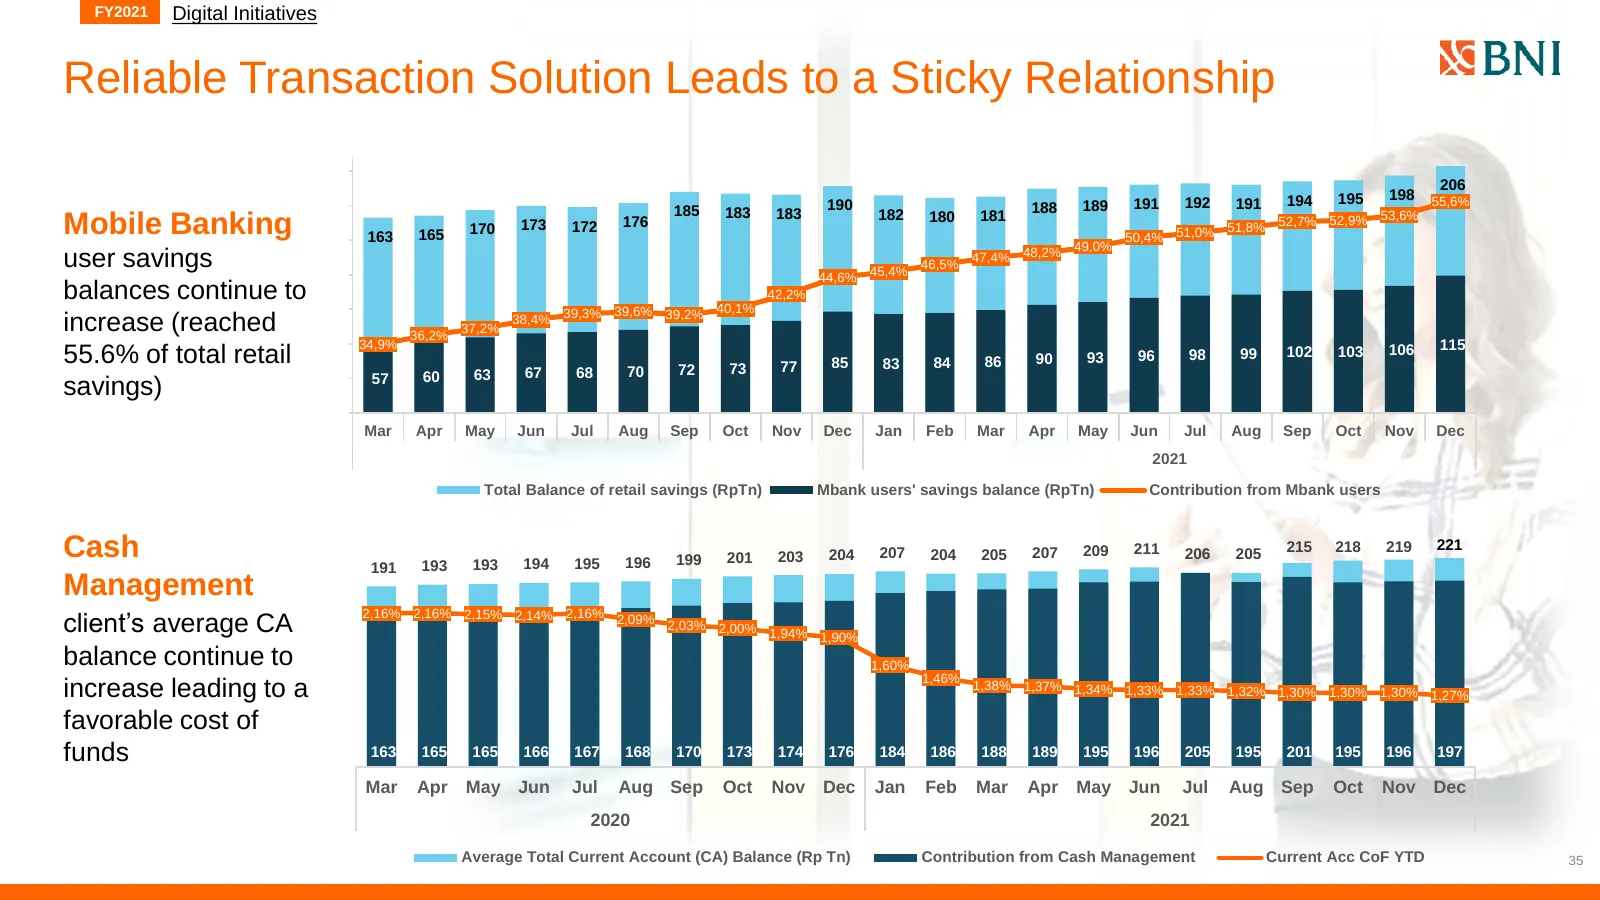
Slide 35: Reliable Transaction Solution Leads to a Sticky Relationship
FY2021 Digital Initiatives Reliable Transaction Solution Leads to a Sticky Relationship 206 192 194 195 198 55,6% 185 190 188 189 191 191 183 183 182 180 181 52,9% 53,6% Mobile Banking 163 165 170 173 172 176 50,4% 51,0% 51,8% 52,7% 48,2% 49,0% user savings 46,5% 47,4% 44,6% 45,4% balances continue
Slide 36: Business & Consumer Banking
Business & Consumer Banking
Slide 37: Rp71.9 Tn Loans Disbursed in 4Q-2021 [Bank Only]
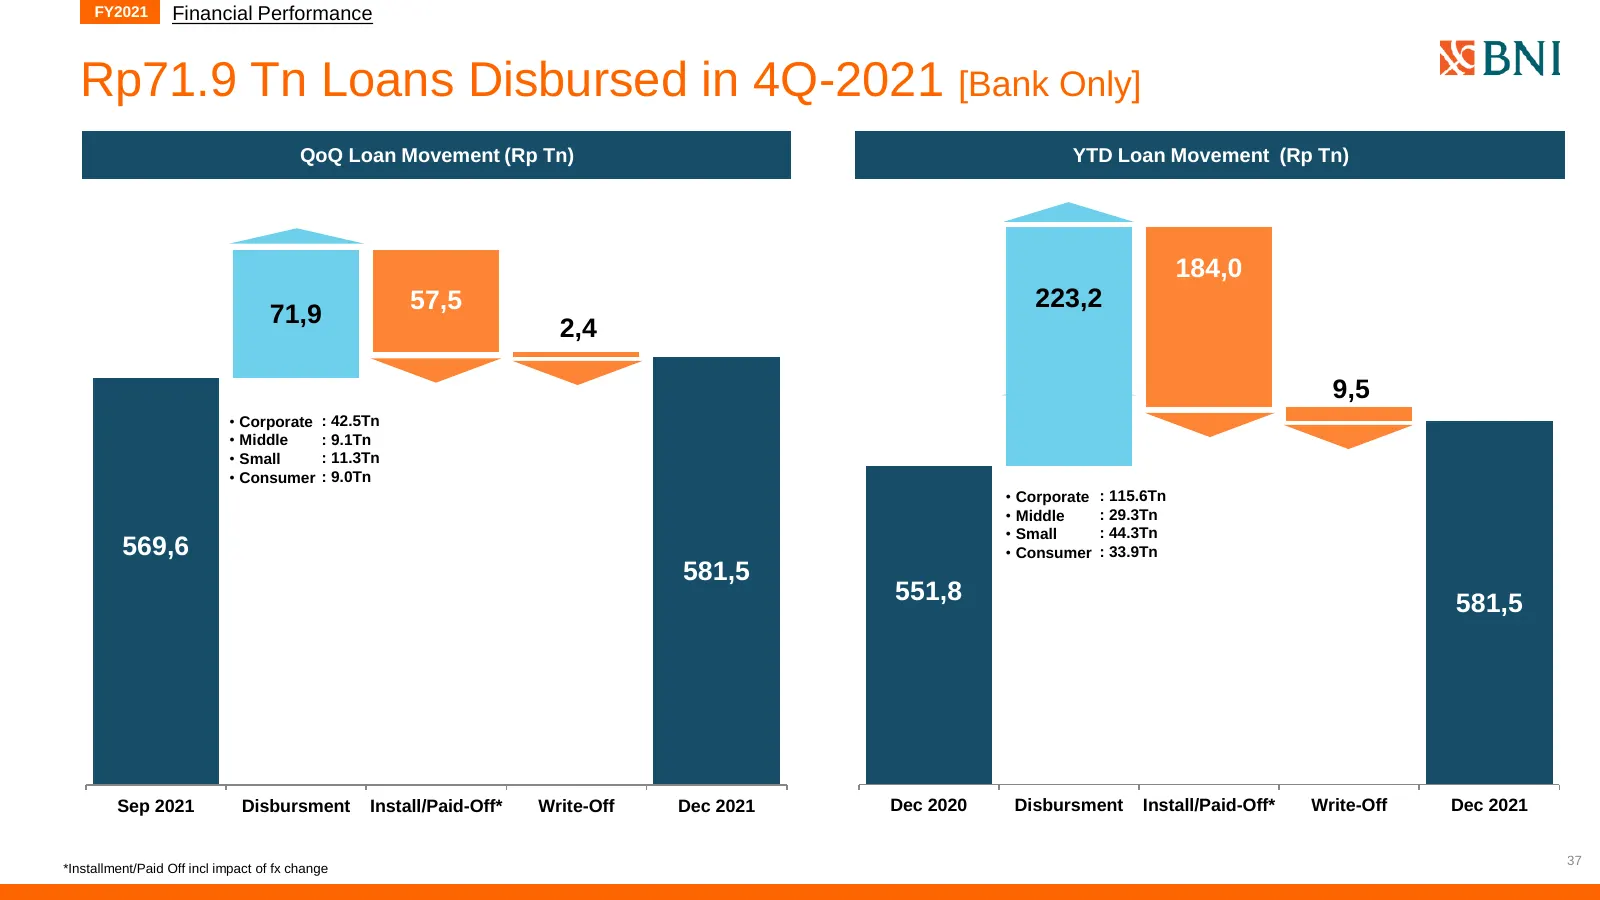
FY2021 Financial Performance Rp71.9 Tn Loans Disbursed in 4Q-2021 [Bank Only] QoQ Loan Movement (Rp Tn) YTD Loan Movement (Rp Tn) 184,0 57,5 223,2 71,9 2,4 9,5 [20.8%] • Corporate : 42.5Tn • Middle : 9.1Tn • Small : 11.3Tn [32.0%] • Consumer : 9.0Tn • Corporate : 115.6Tn • Middle : 29.3Tn • Small :
Slide 38: Business Banking Highlight
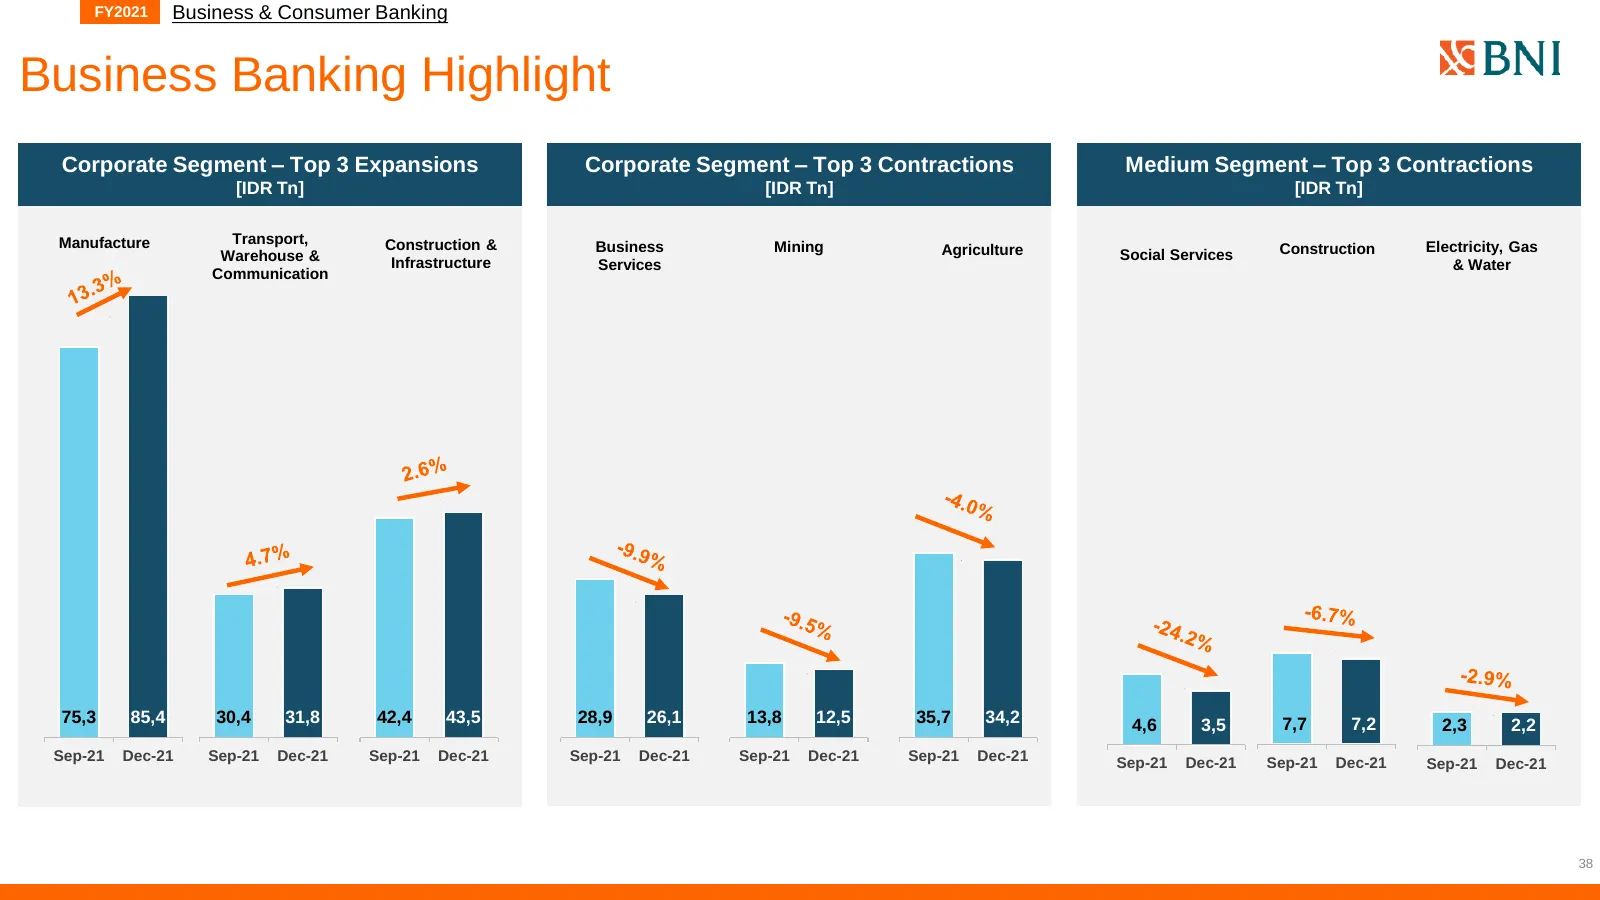
FY2021 Business & Consumer Banking Business Banking Highlight Corporate Segment – Top 3 Expansions Corporate Segment – Top 3 Contractions Medium Segment – Top 3 Contractions [IDR Tn] [IDR Tn] [IDR Tn] Manufacture Transport, Construction & Business Mining Agriculture Social Services Construction Elec
Slide 39: Consumer Business
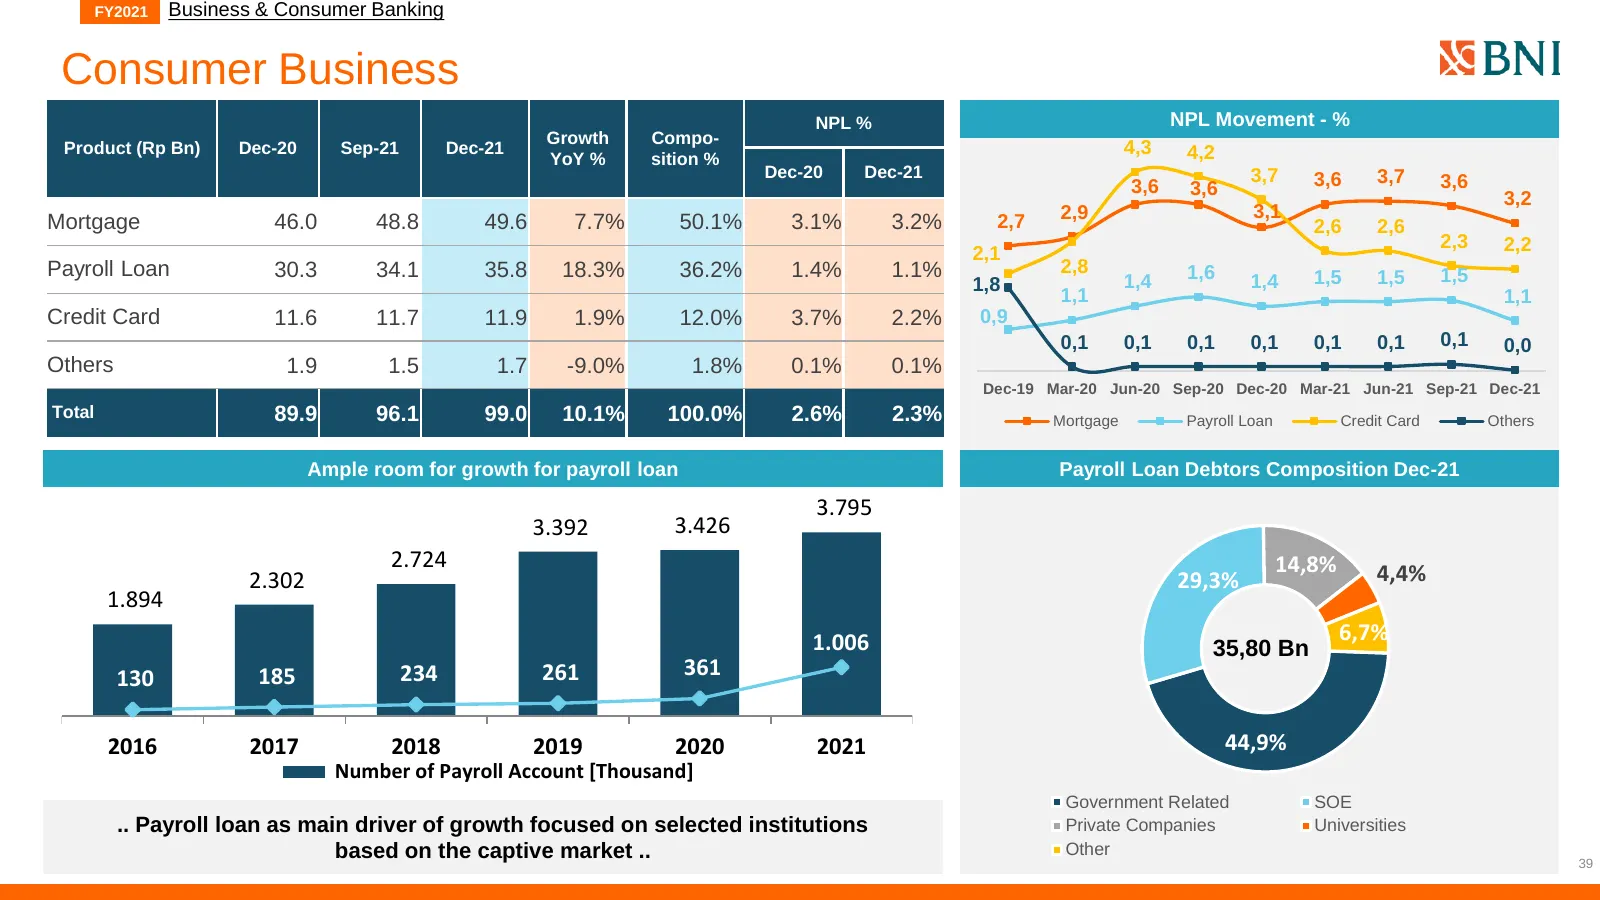
FY2021 Business & Consumer Banking Consumer Business NPL % NPL Movement - % Growth Compo- Product (Rp Bn) Dec-20 Sep-21 Dec-21 4,3 4,2 YoY % sition % Dec-20 Dec-21 3,7 3,6 3,7 3,6 3,6 3,6 3,2 2,9 3,1 Mortgage 46.0 48.8 49.6 7.7% 50.1% 3.1% 3.2% 2,7 2,6 2,6 2,3 2,2 2,1 Payroll Loan 30.3 34.1 35.8 18.
Slide 40: Well-Established Brand and Strong Consumer Banking Franchise
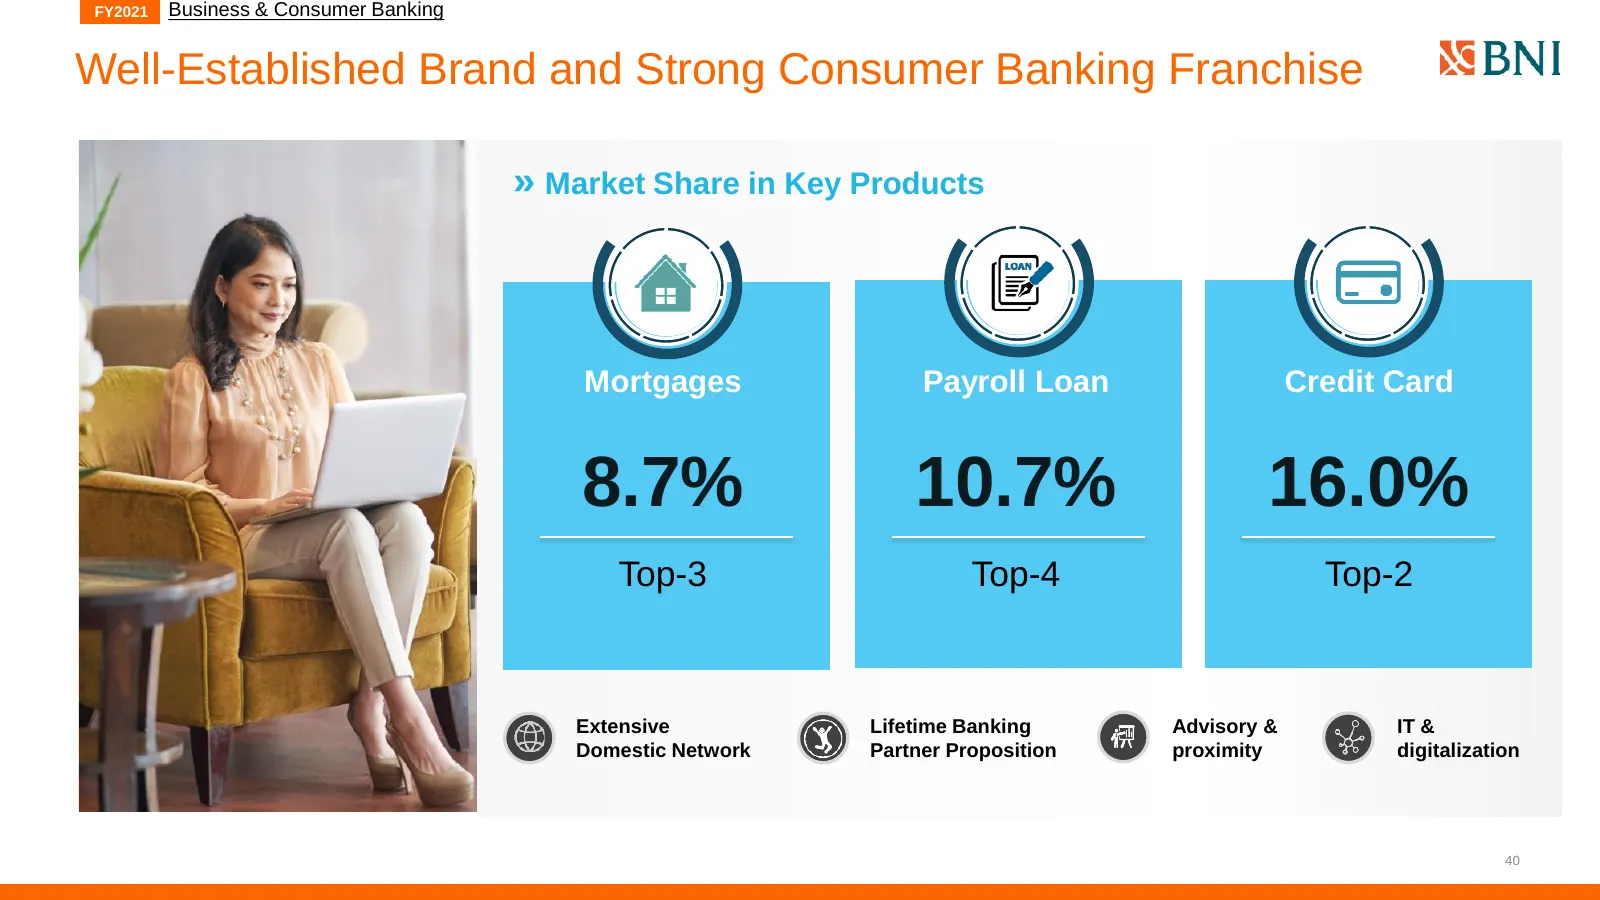
FY2021 Business & Consumer Banking Well-Established Brand and Strong Consumer Banking Franchise » Market Share in Key Products Mortgages Payroll Loan Credit Card 8.7% 10.7% 16.0% Top-3 Top-4 Top-2 Extensive Lifetime Banking Advisory & IT & Domestic Network Partner Proposition proximity digitalizatio
Slide 41: Environment, Social and Governance (ESG)
Environment, Social and Governance (ESG) Uniting Energy for Sustainability
Slide 42: Five Pillars of Sustainability Aligning Business to UN SDGs
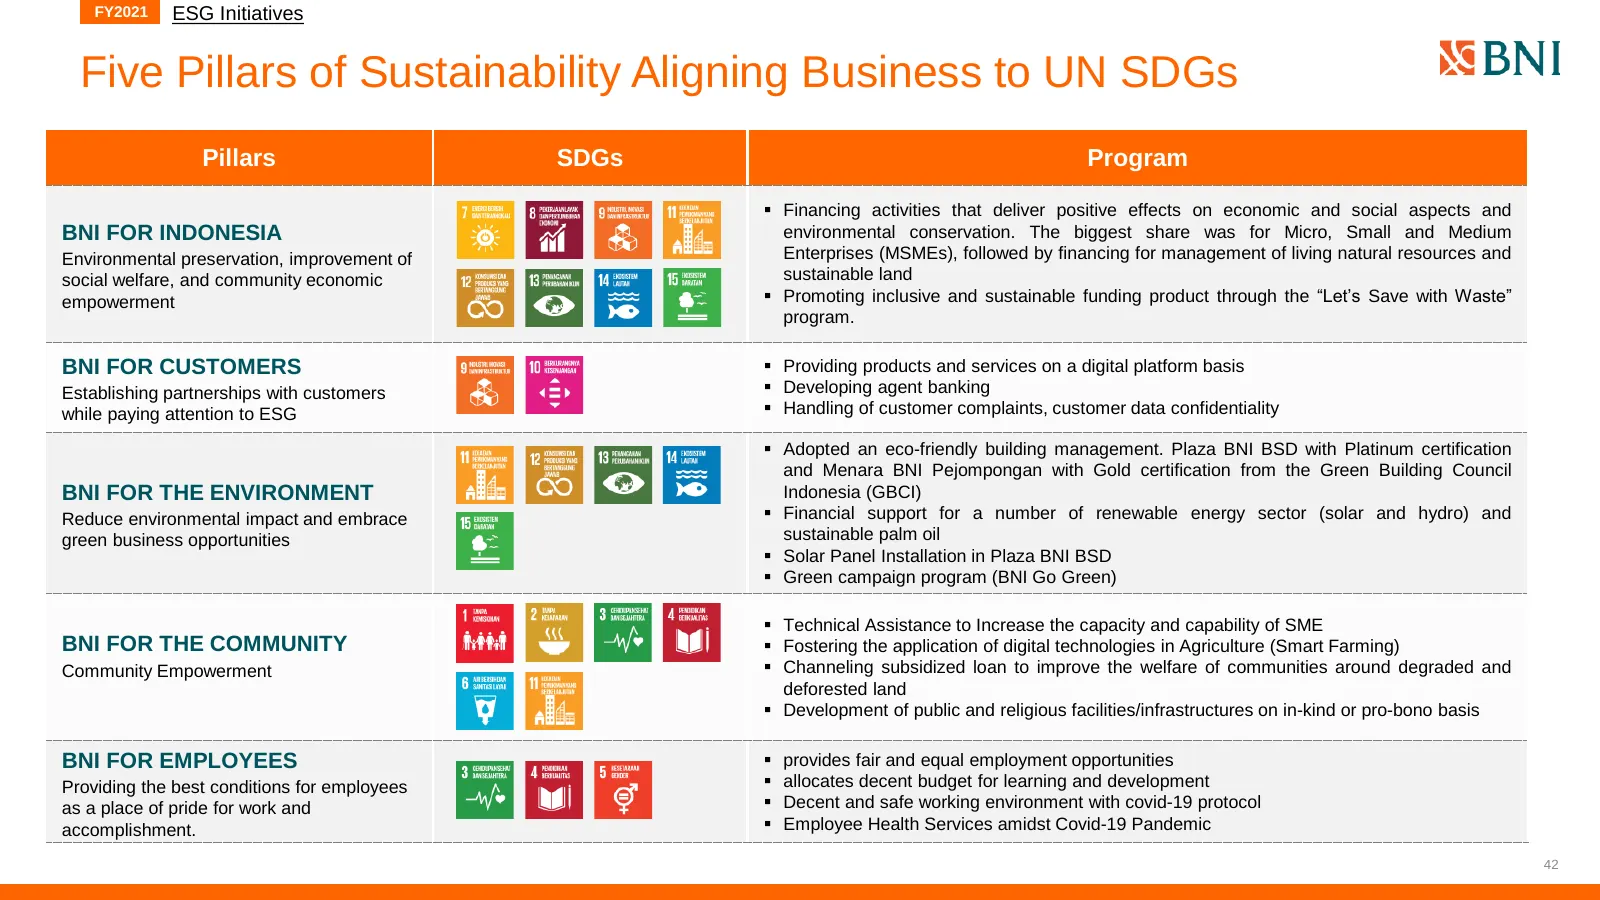
FY2021 ESG Initiatives Five Pillars of Sustainability Aligning Business to UN SDGs Pillars SDGs Program ▪ Financing activities that deliver positive effects on economic and social aspects and BNI FOR INDONESIA environmental conservation. The biggest share was for Micro, Small and Medium Environmenta
Slide 43: Sustainable Portfolio
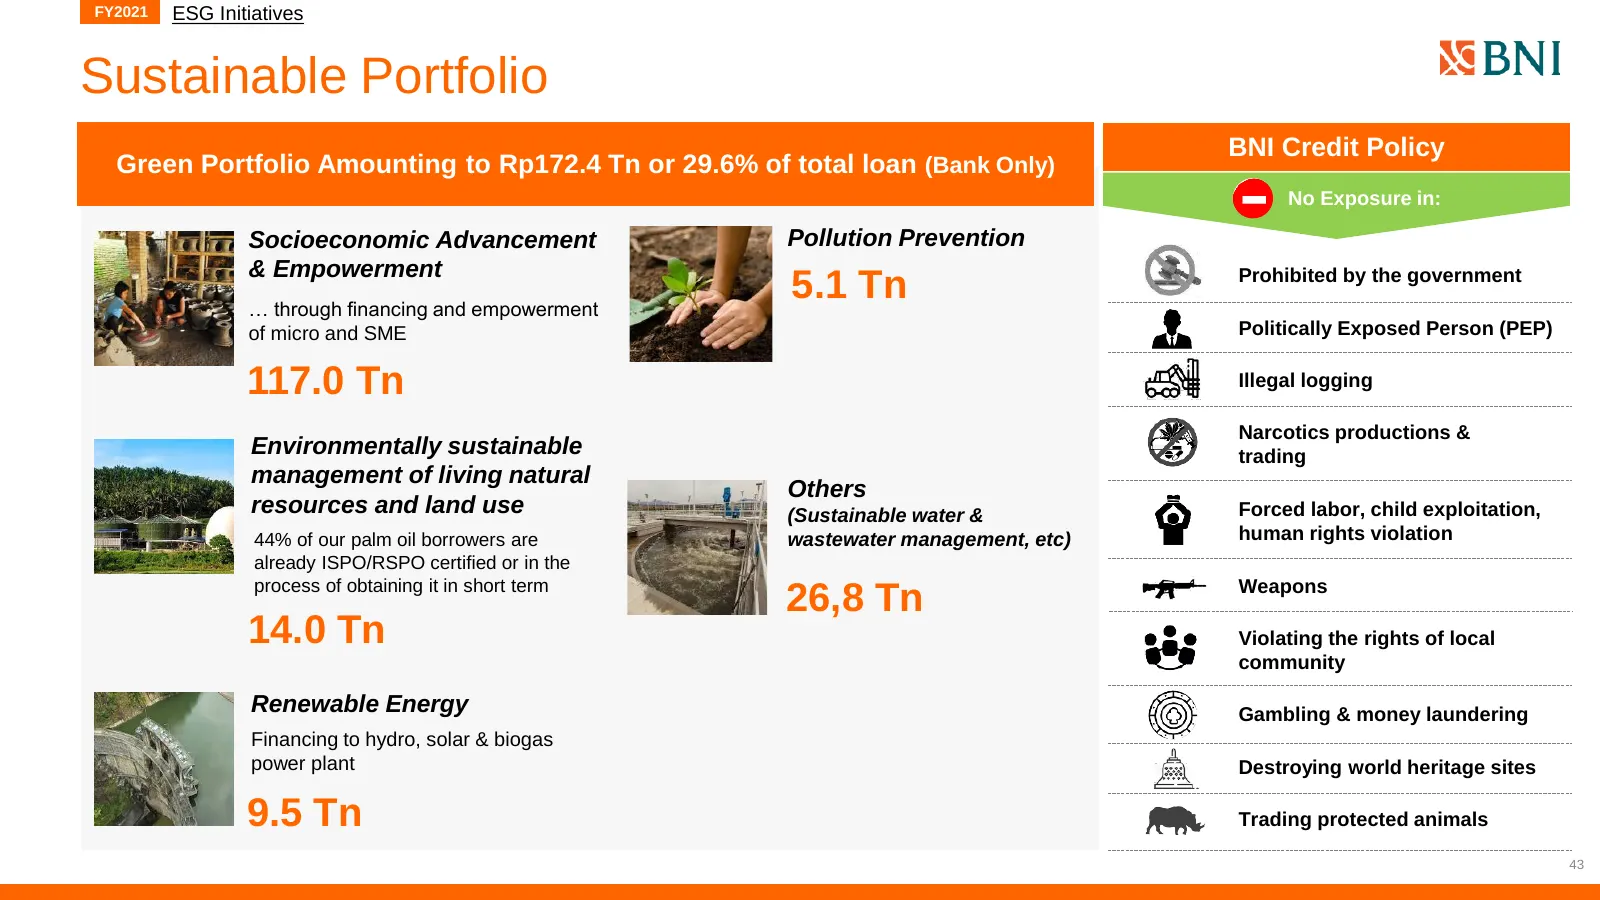
FY2021 ESG Initiatives Sustainable Portfolio BNI Credit Policy Green Portfolio Amounting to Rp172.4 Tn or 29.6% of total loan (Bank Only) No Exposure in: Socioeconomic Advancement Pollution Prevention & Empowerment Prohibited by the government … through financing and empowerment 5.1 Tn of micro and
Slide 44: Sector Guides of Responsible Financing
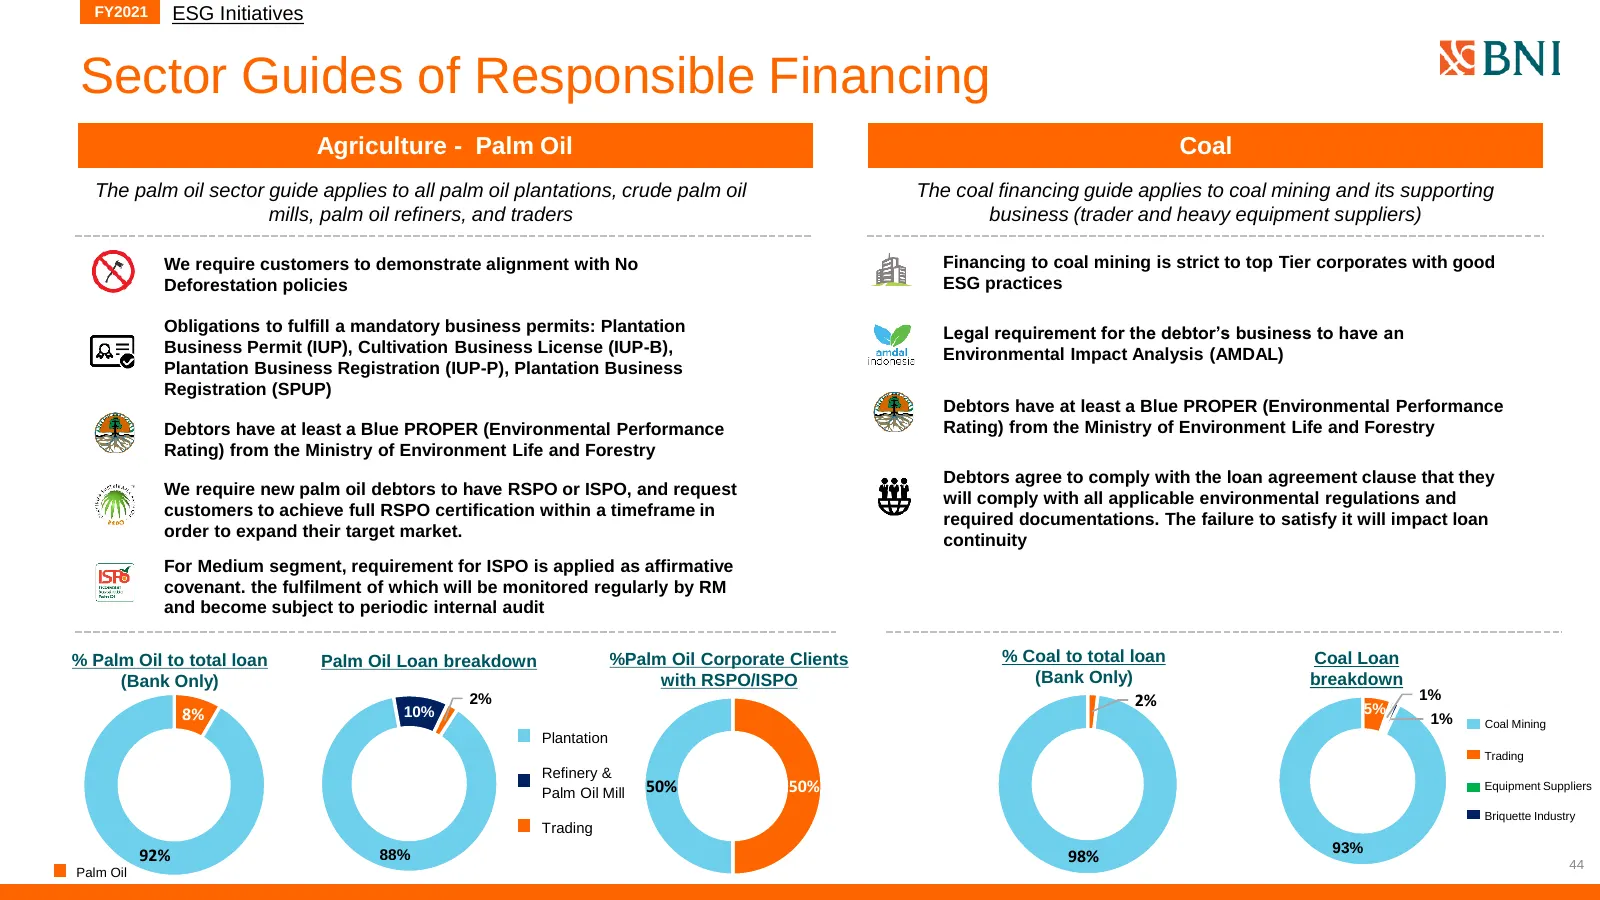
FY2021 ESG Initiatives Sector Guides of Responsible Financing Agriculture - Palm Oil Coal The palm oil sector guide applies to all palm oil plantations, crude palm oil The coal financing guide applies to coal mining and its supporting mills, palm oil refiners, and traders business (trader and heavy
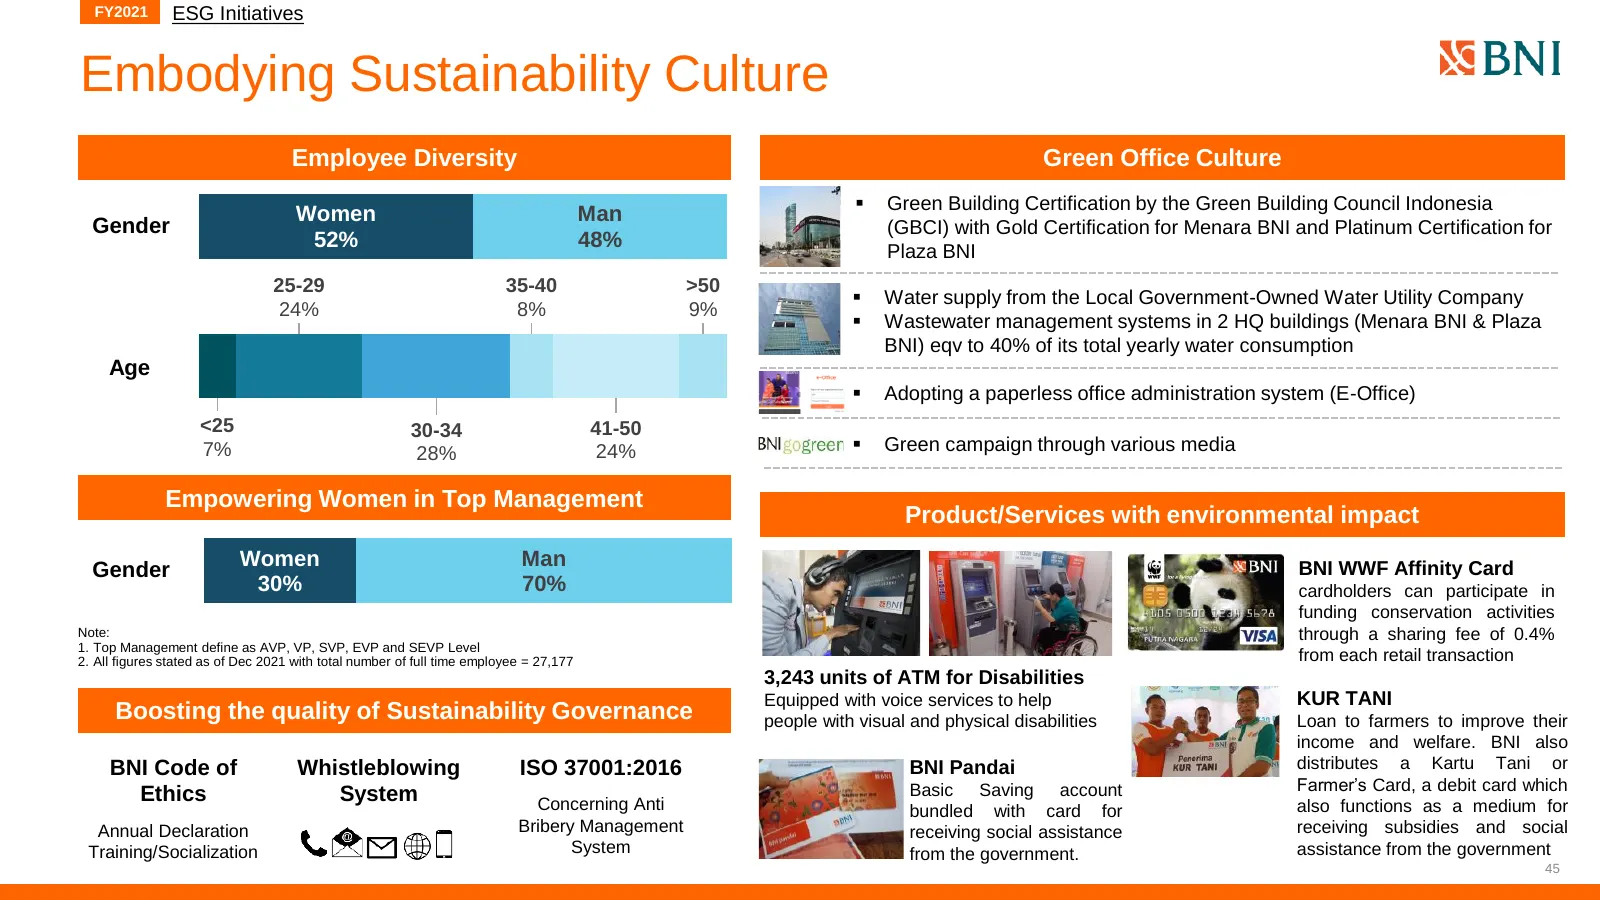
Slide 45: Embodying Sustainability Culture
FY2021 ESG Initiatives Embodying Sustainability Culture Employee Diversity Green Office Culture ▪ Green Building Certification by the Green Building Council Indonesia Women Man Gender (GBCI) with Gold Certification for Menara BNI and Platinum Certification for 52% 48% Plaza BNI 25-29 35-40 >50 ▪ Wat
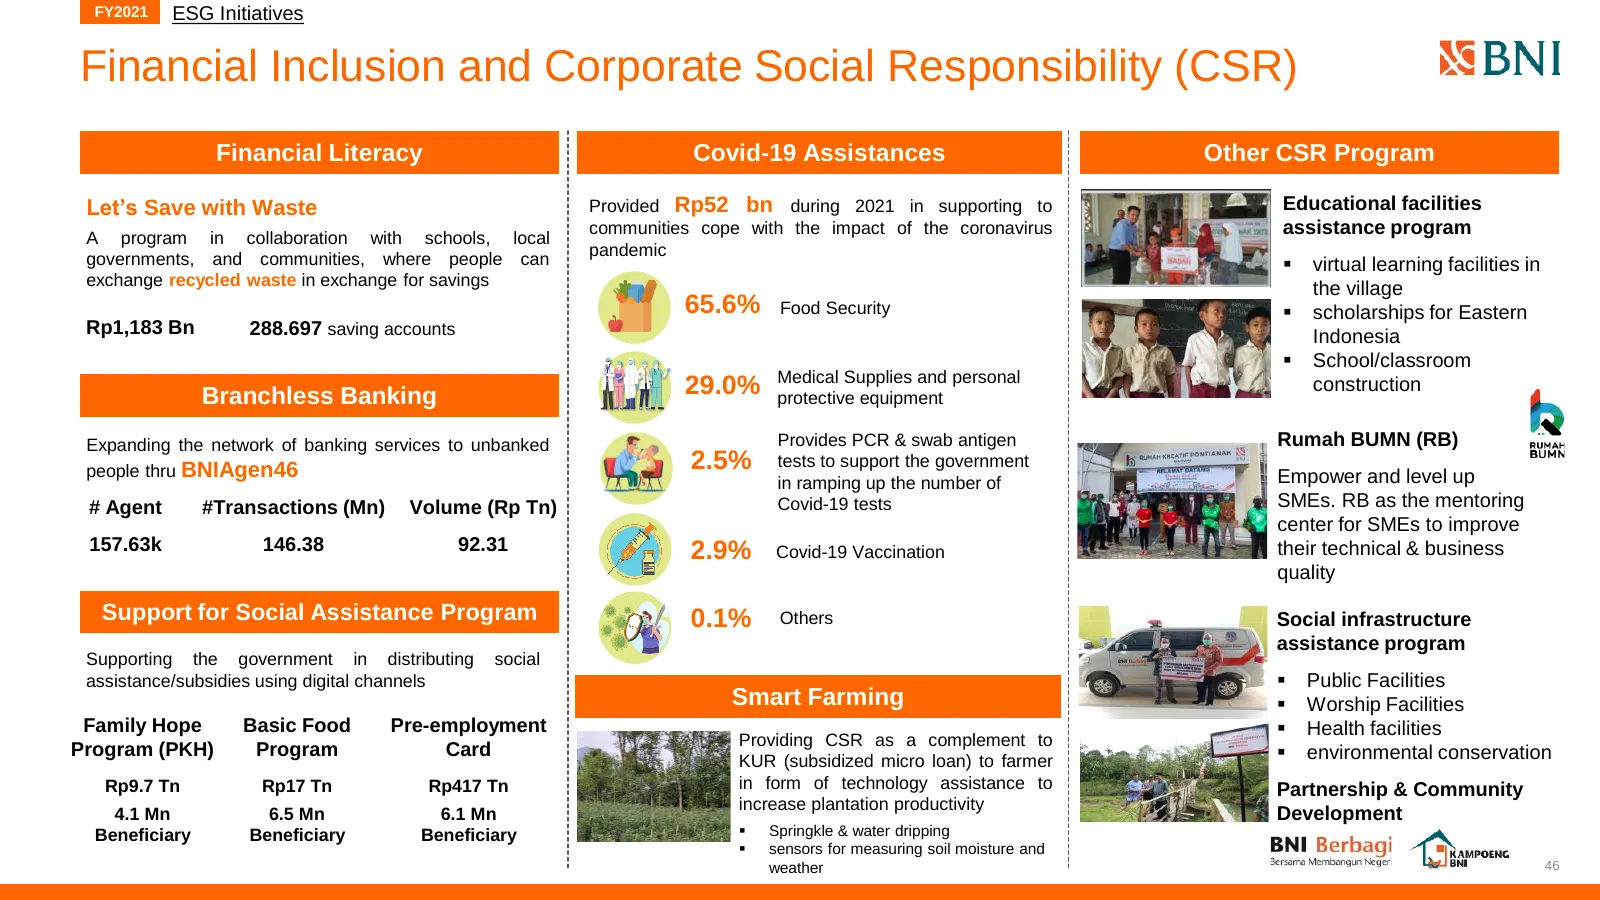
Slide 46: Financial Inclusion and Corporate Social Responsibility (CSR)
FY2021 ESG Initiatives Financial Inclusion and Corporate Social Responsibility (CSR) Financial Literacy Covid-19 Assistances Other CSR Program Let’s Save with Waste Provided Rp52 bn during 2021 in supporting to Educational facilities A program in collaboration with schools, local communities cope wi
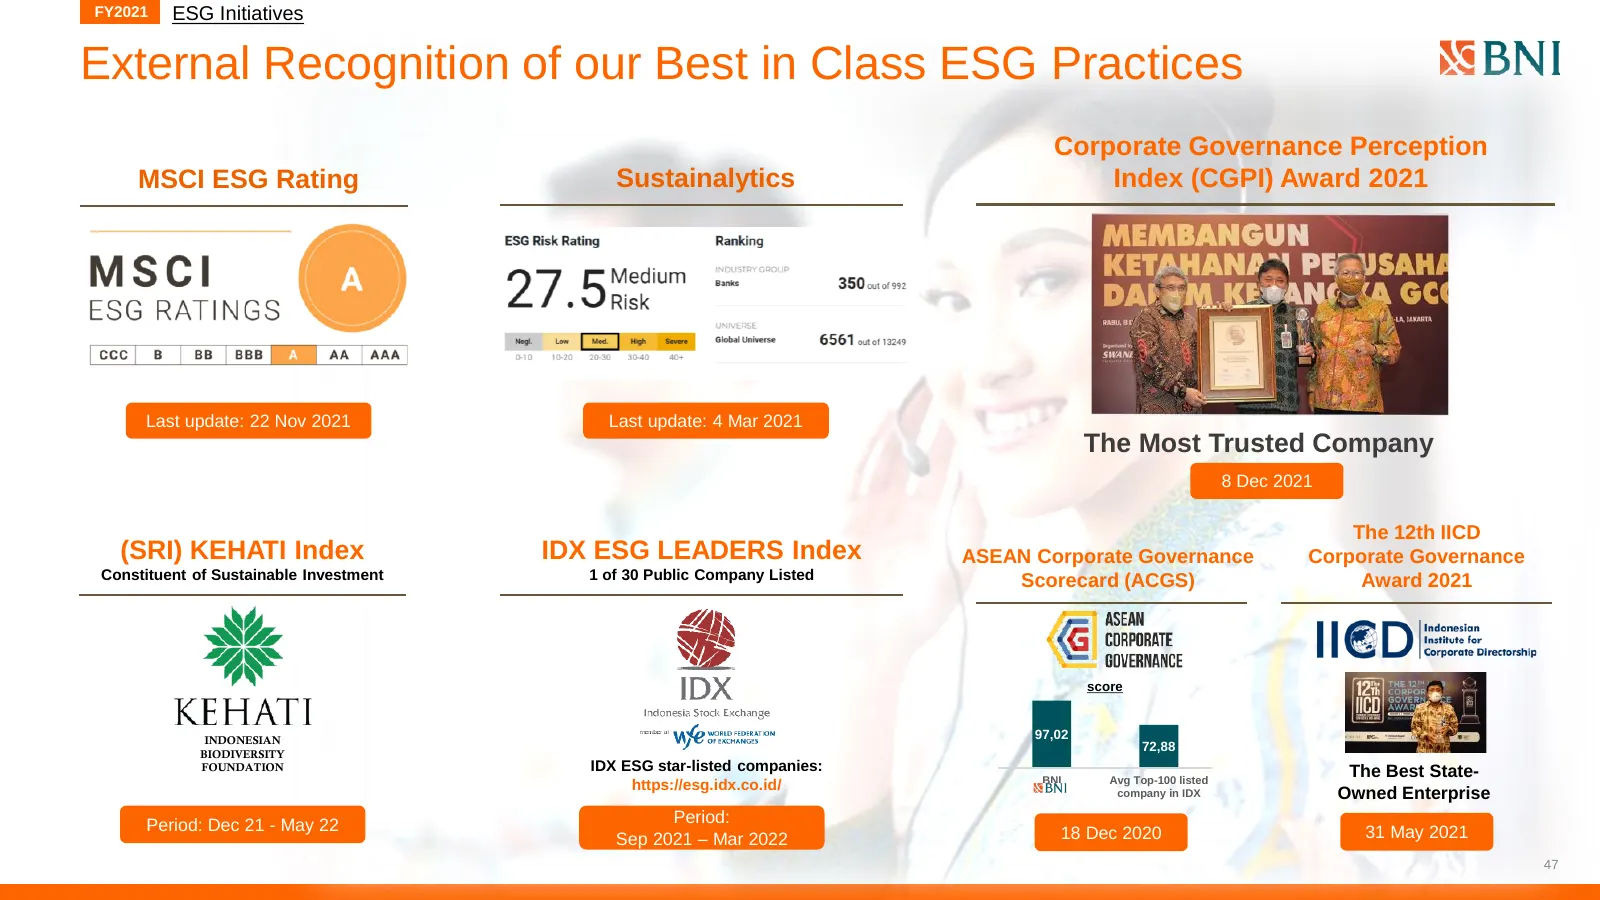
Slide 47: External Recognition of our Best in Class ESG Practices
FY2021 ESG Initiatives External Recognition of our Best in Class ESG Practices Corporate Governance Perception MSCI ESG Rating Sustainalytics Index (CGPI) Award 2021 Last update: 22 Nov 2021 Last update: 4 Mar 2021 The Most Trusted Company 8 Dec 2021 The 12th IICD (SRI) KEHATI Index IDX ESG LEADERS
Slide 48: About BNI
About BNI
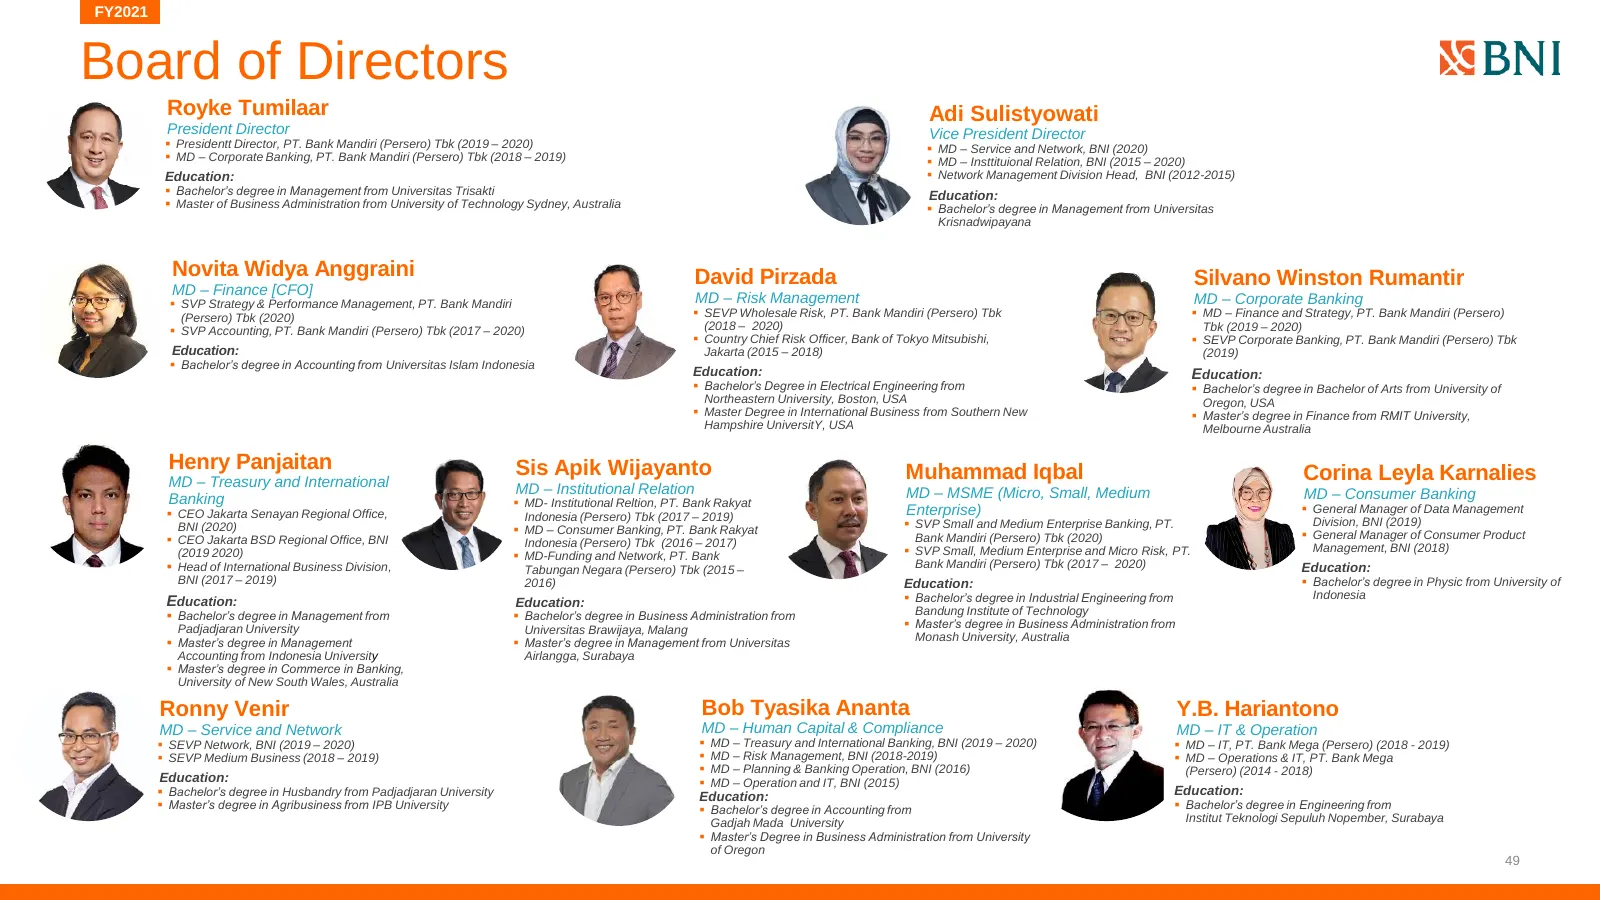
Slide 49: Board of Directors
FY2021 Board of Directors Royke Tumilaar Adi Sulistyowati President Director Vice President Director ▪ Presidentt Director, PT. Bank Mandiri (Persero) Tbk (2019 – 2020) ▪ MD – Service and Network, BNI (2020) ▪ MD – Corporate Banking, PT. Bank Mandiri (Persero) Tbk (2018 – 2019) ▪ MD – Insttituional
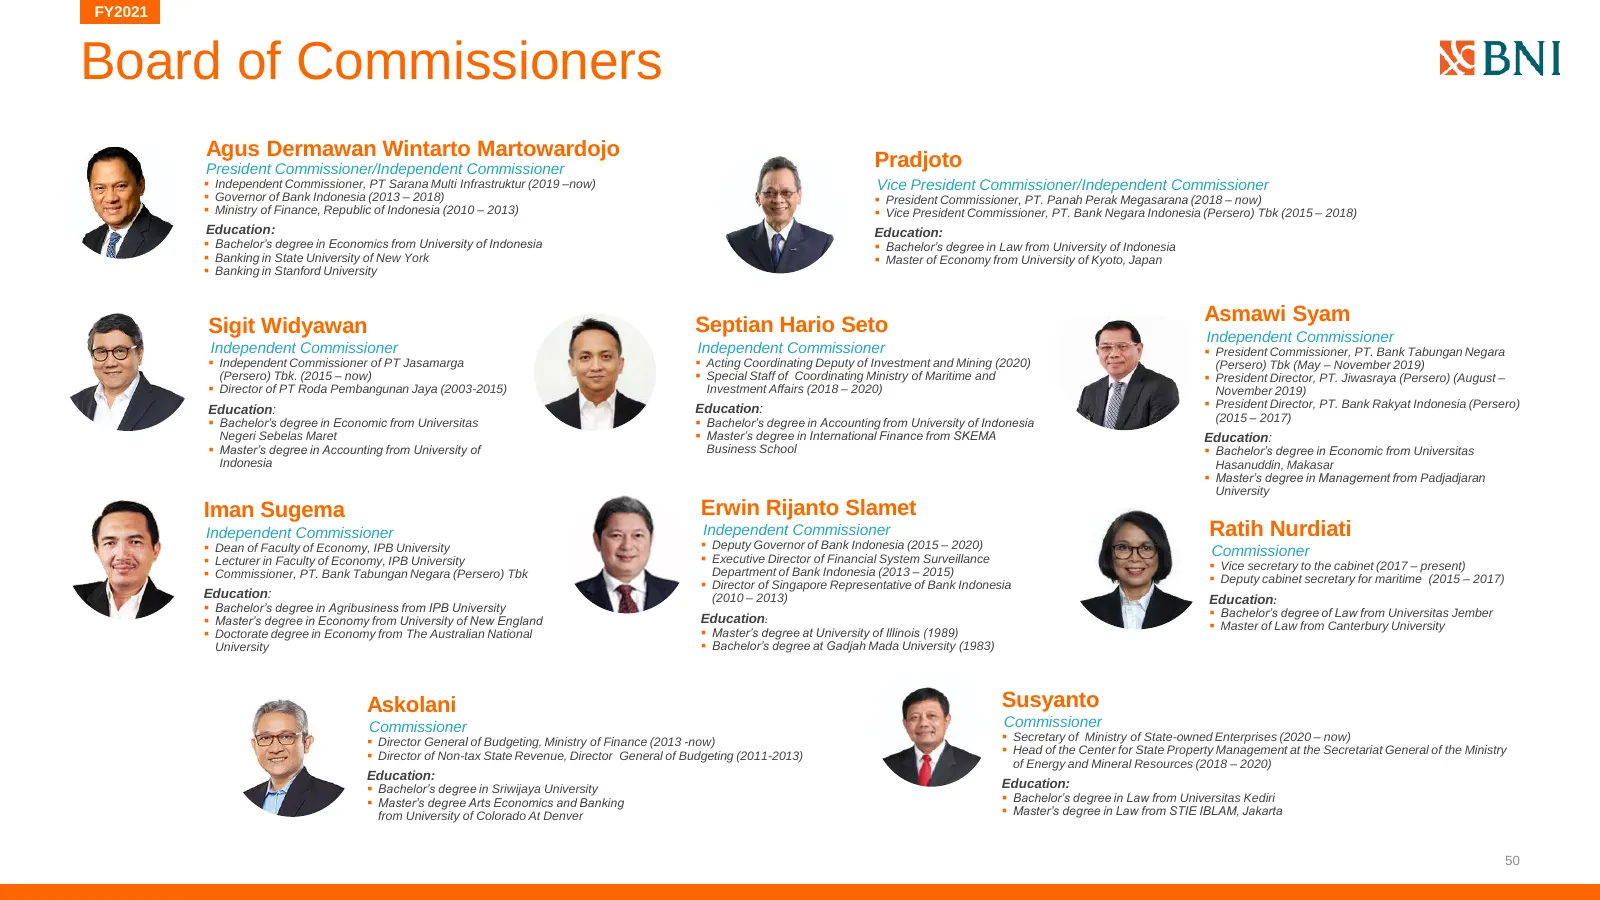
Slide 50: Board of Commissioners
FY2021 Board of Commissioners Agus Dermawan Wintarto Martowardojo President Commissioner/Independent Commissioner Pradjoto ▪ Independent Commissioner, PT Sarana Multi Infrastruktur (2019 –now) Vice President Commissioner/Independent Commissioner ▪ Governor of Bank Indonesia (2013 – 2018) ▪ President
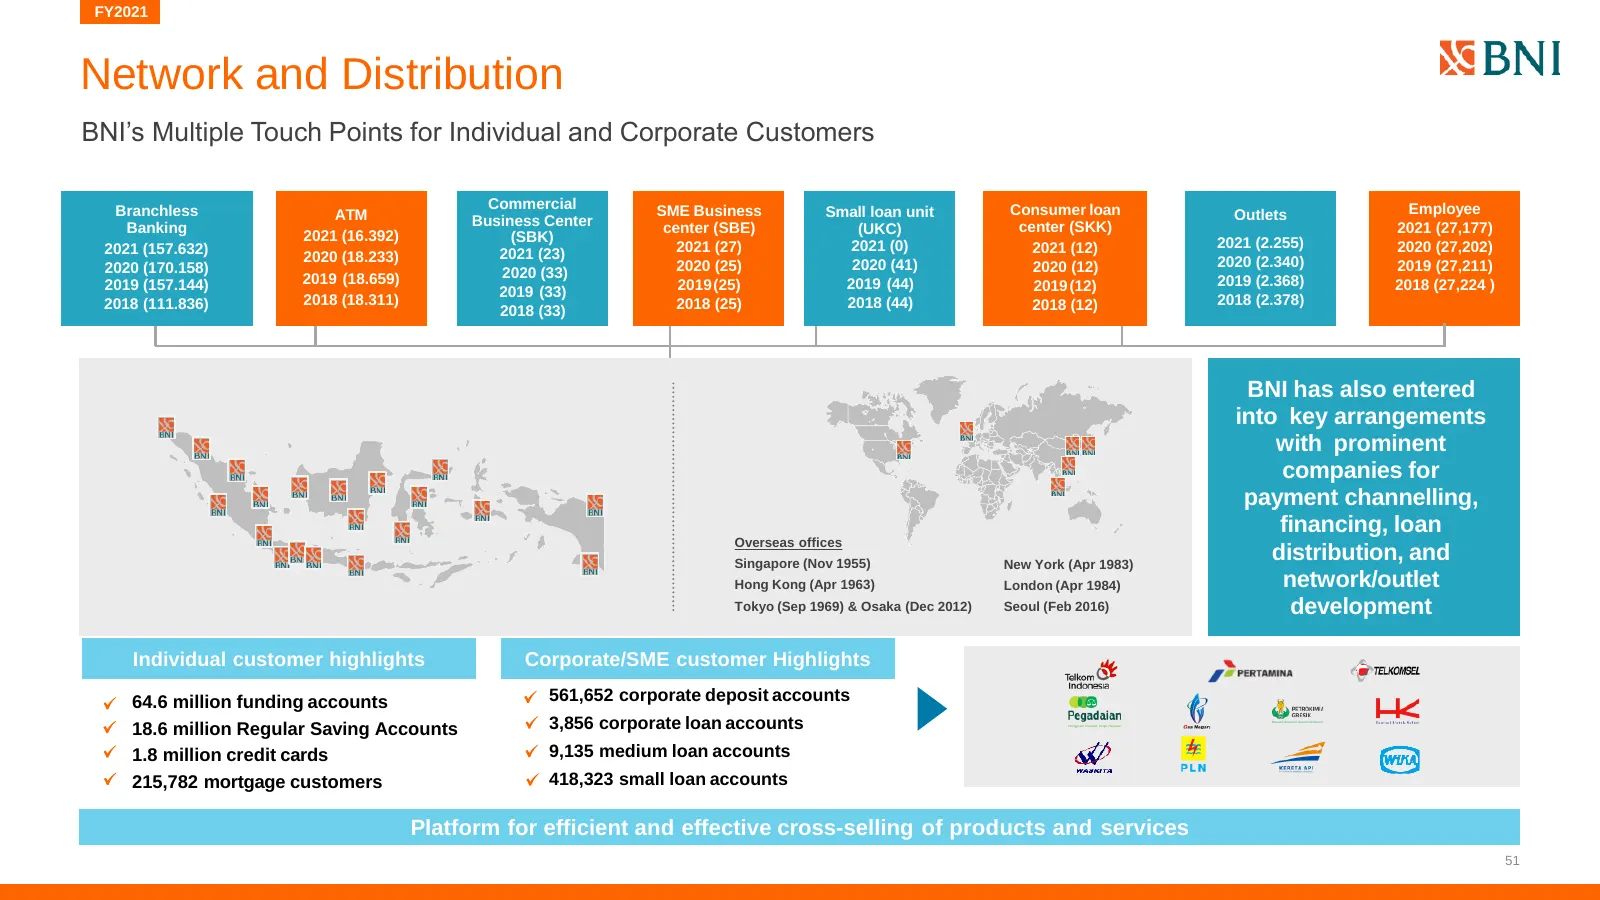
Slide 51: Network and Distribution
FY2021 Network and Distribution BNI’s Multiple Touch Points for Individual and Corporate Customers Branchless Commercial SME Business Consumer loan Employee ATM Small loan unit Outlets Banking Business Center center (SBE) center (SKK) 2021 (27,177) 2021 (16.392) (UKC) (SBK) 2021 (2.255) 2021 (157.63
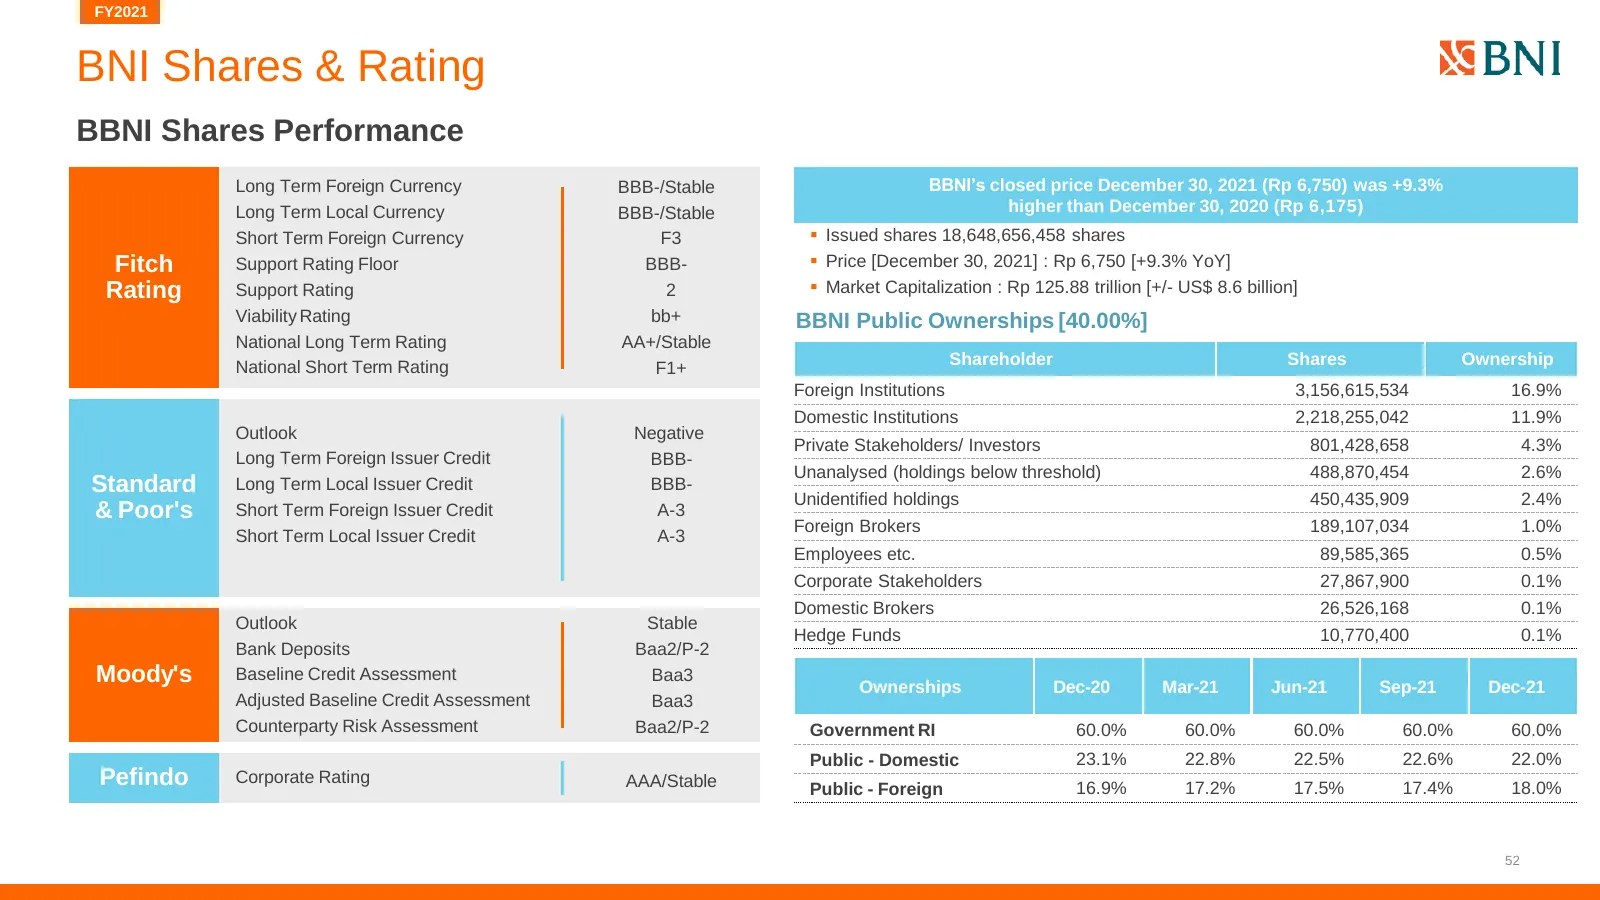
Slide 52: BNI Shares & Rating
FY2021 BNI Shares & Rating BBNI Shares Performance Long Term Foreign Currency BBB-/Stable BBNI’s closed price December 30, 2021 (Rp 6,750) was +9.3% Long Term Local Currency BBB-/Stable higher than December 30, 2020 (Rp 6,175) Short Term Foreign Currency F3 ▪ Issued shares 18,648,656,458 shares Fitc
Slide 53: Subsidiaries
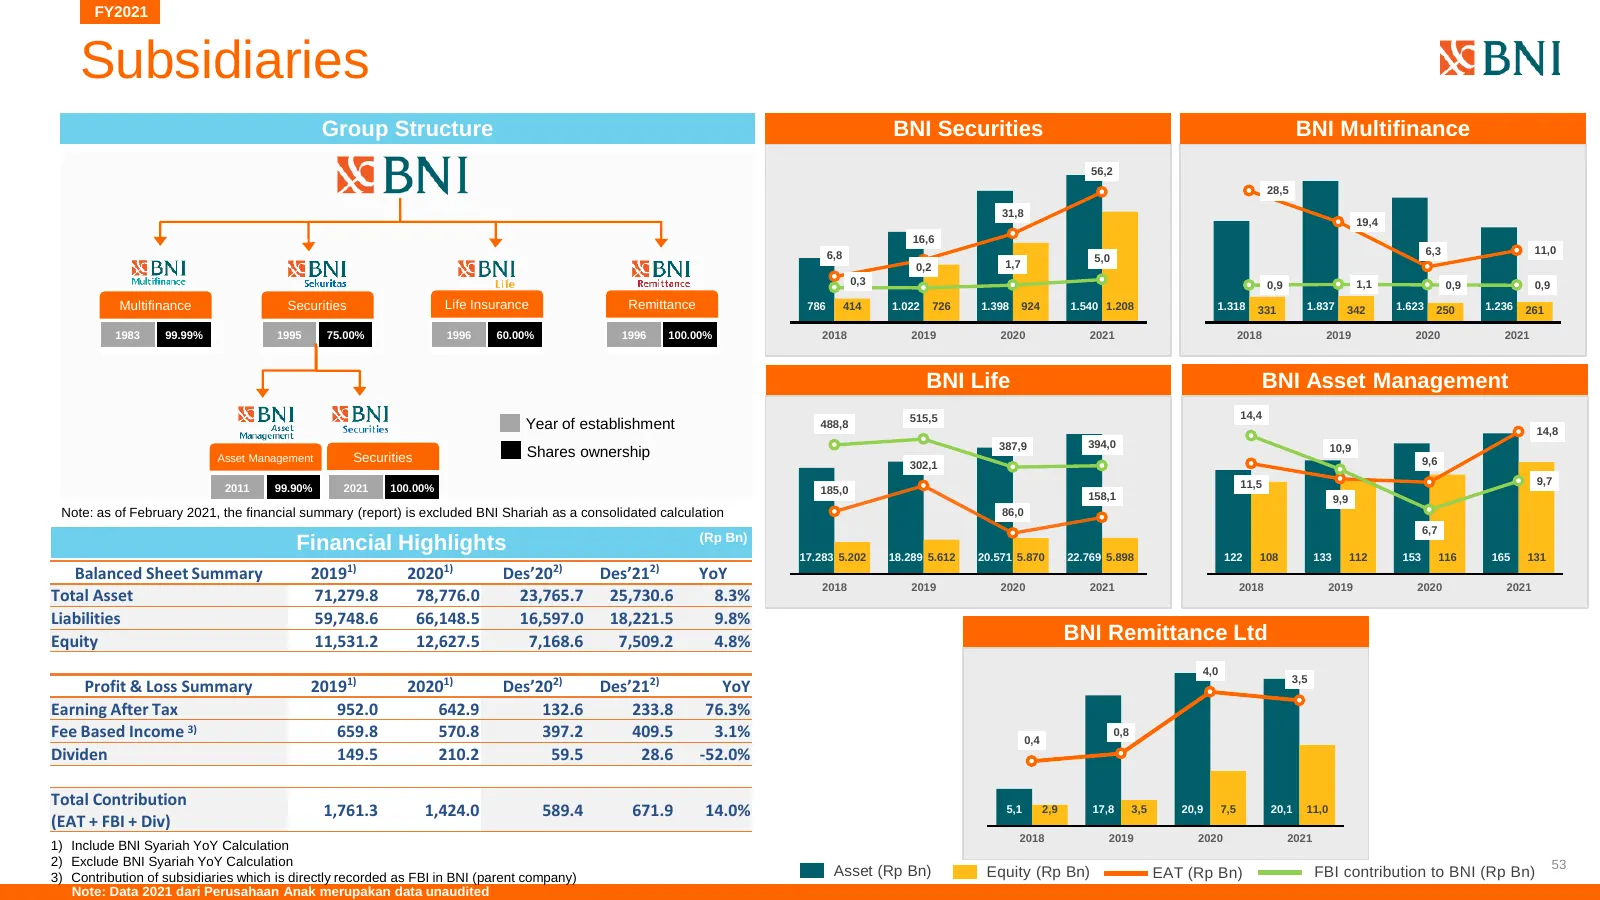
FY2021 Subsidiaries Group Structure BNI Securities BNI Multifinance 56,2 28,5 31,8 19,4 16,6 6,8 6,3 11,0 1,7 5,0 0,2 0,3 0,9 1,1 0,9 0,9 Multifinance Securities Life Insurance Remittance 786 414 1.022 726 1.398 924 1.540 1.208 1.318 331 1.837 342 1.623 250 1.236 261 1983 99.99% 1995 75.00% 1996 60.
Slide 54: E-Banking and Branchless Banking
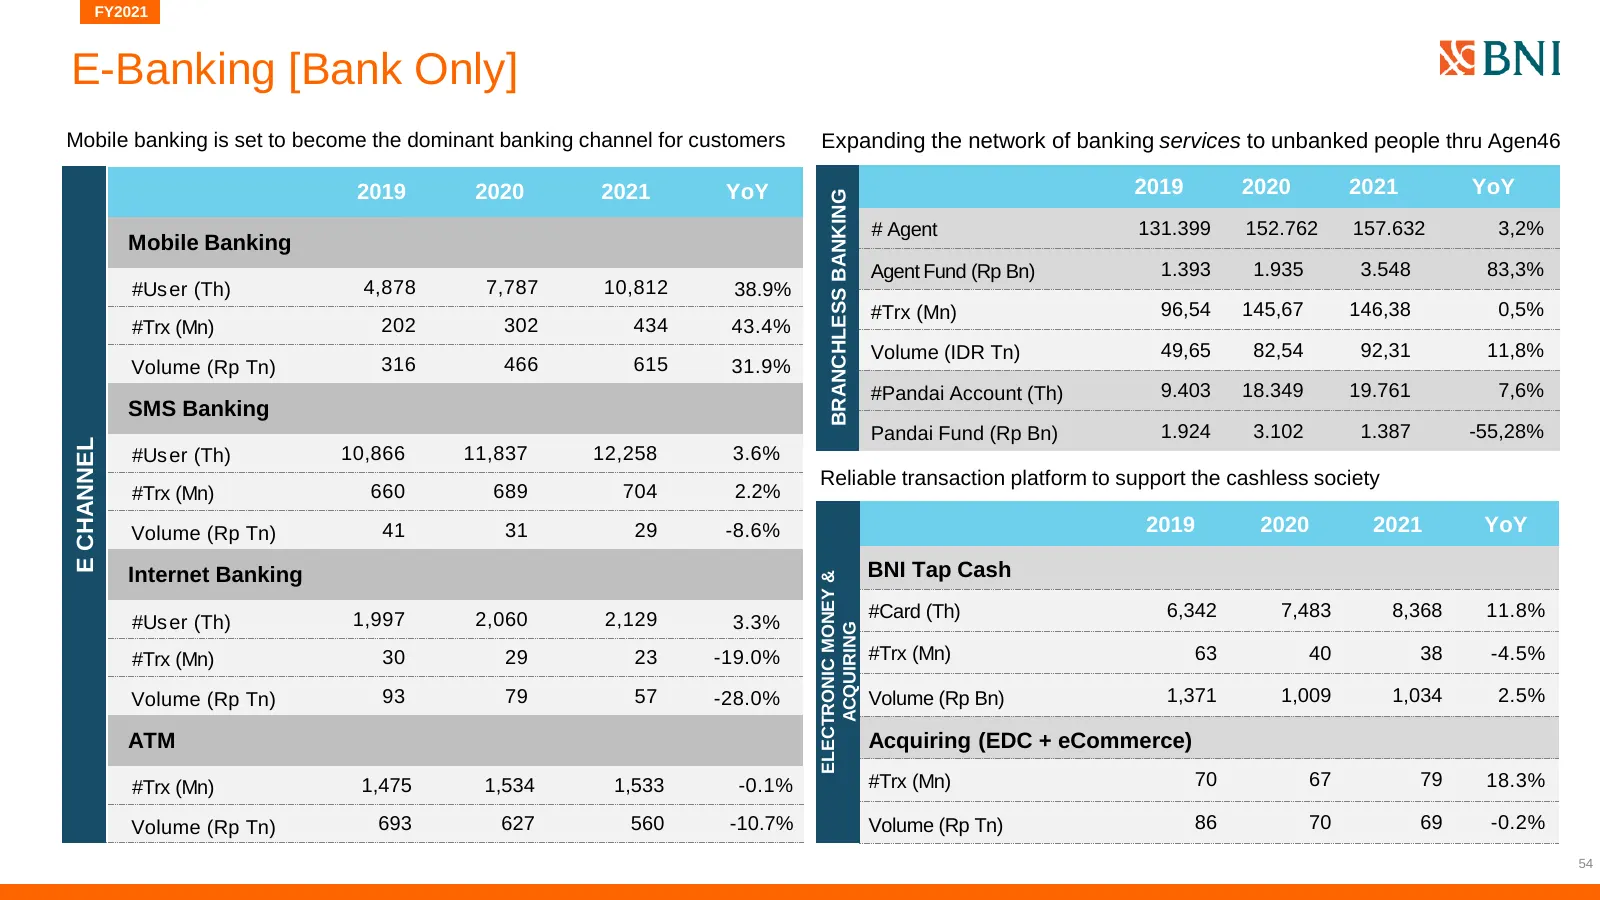
FY2021 E-Banking [Bank Only] Mobile banking is set to become the dominant banking channel for customers Expanding the network of banking services to unbanked people thru Agen46 2019 2020 2021 YoY 2019 2020 2021 YoY BRANCHLESS BANKING # Agent 131.399 152.762 157.632 3,2% Mobile Banking Agent Fund (Rp
Slide 55: BASEL 3 Capital Requirement and BNI Capital Realization
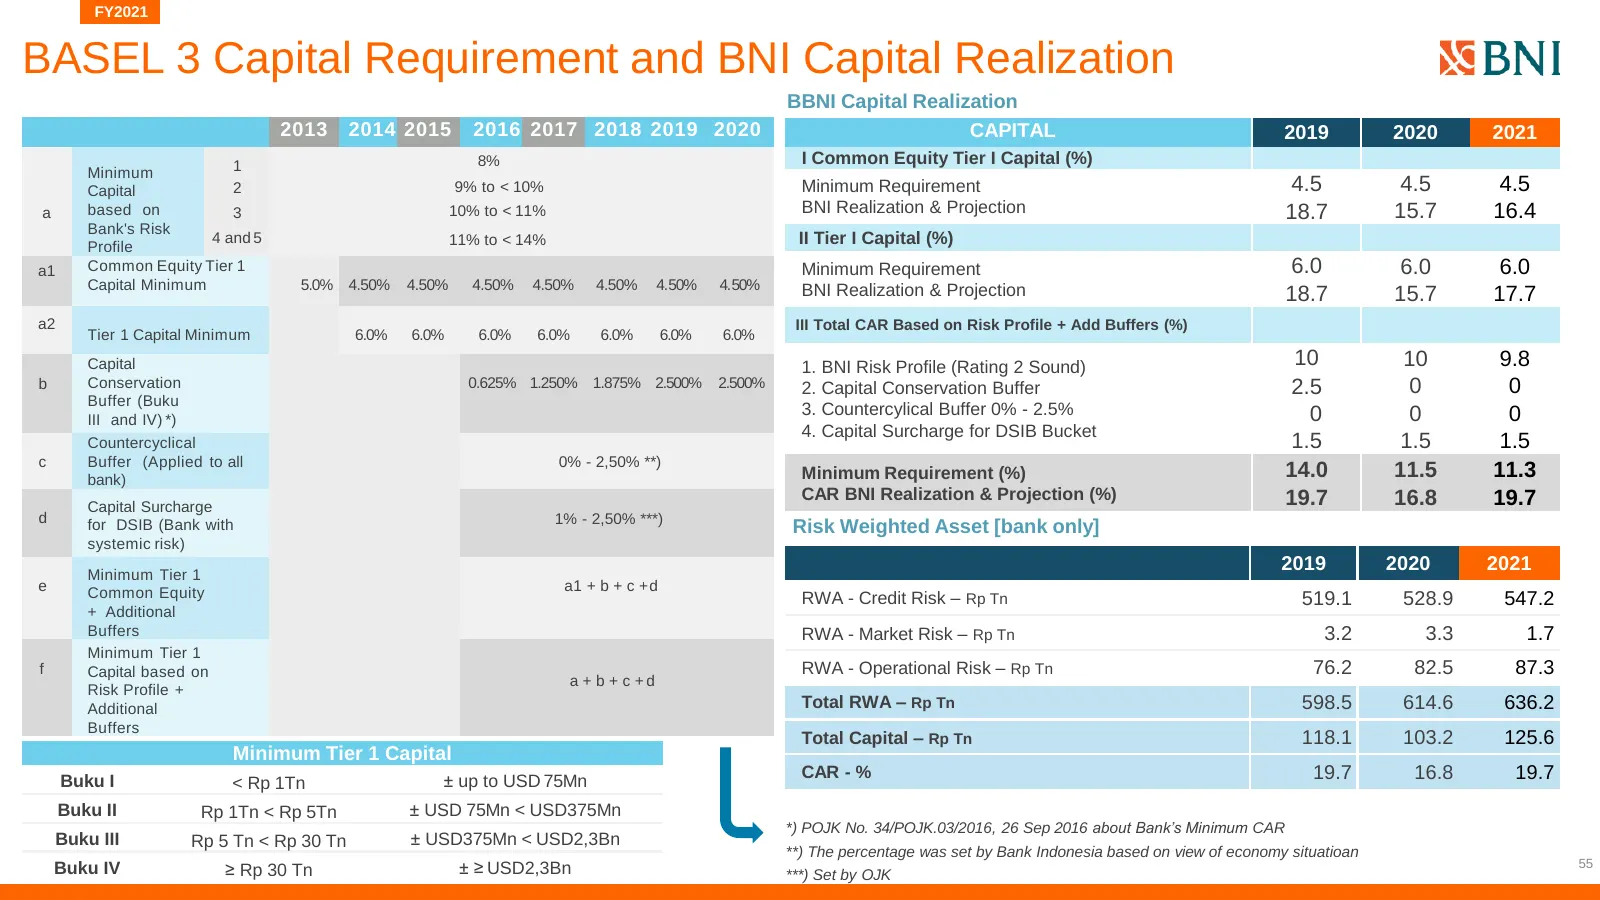
FY2021 BASEL 3 Capital Requirement and BNI Capital Realization BBNI Capital Realization 2013 2014 2015 2016 2017 2018 2019 2020 CAPITAL 2019 2020 2021 1 8% I Common Equity Tier I Capital (%) Minimum Capital 2 9% to < 10% Minimum Requirement 4.5 4.5 4.5 a based on 3 10% to < 11% BNI Realization & Pro
Slide 56: Comprehensive Portfolio Review
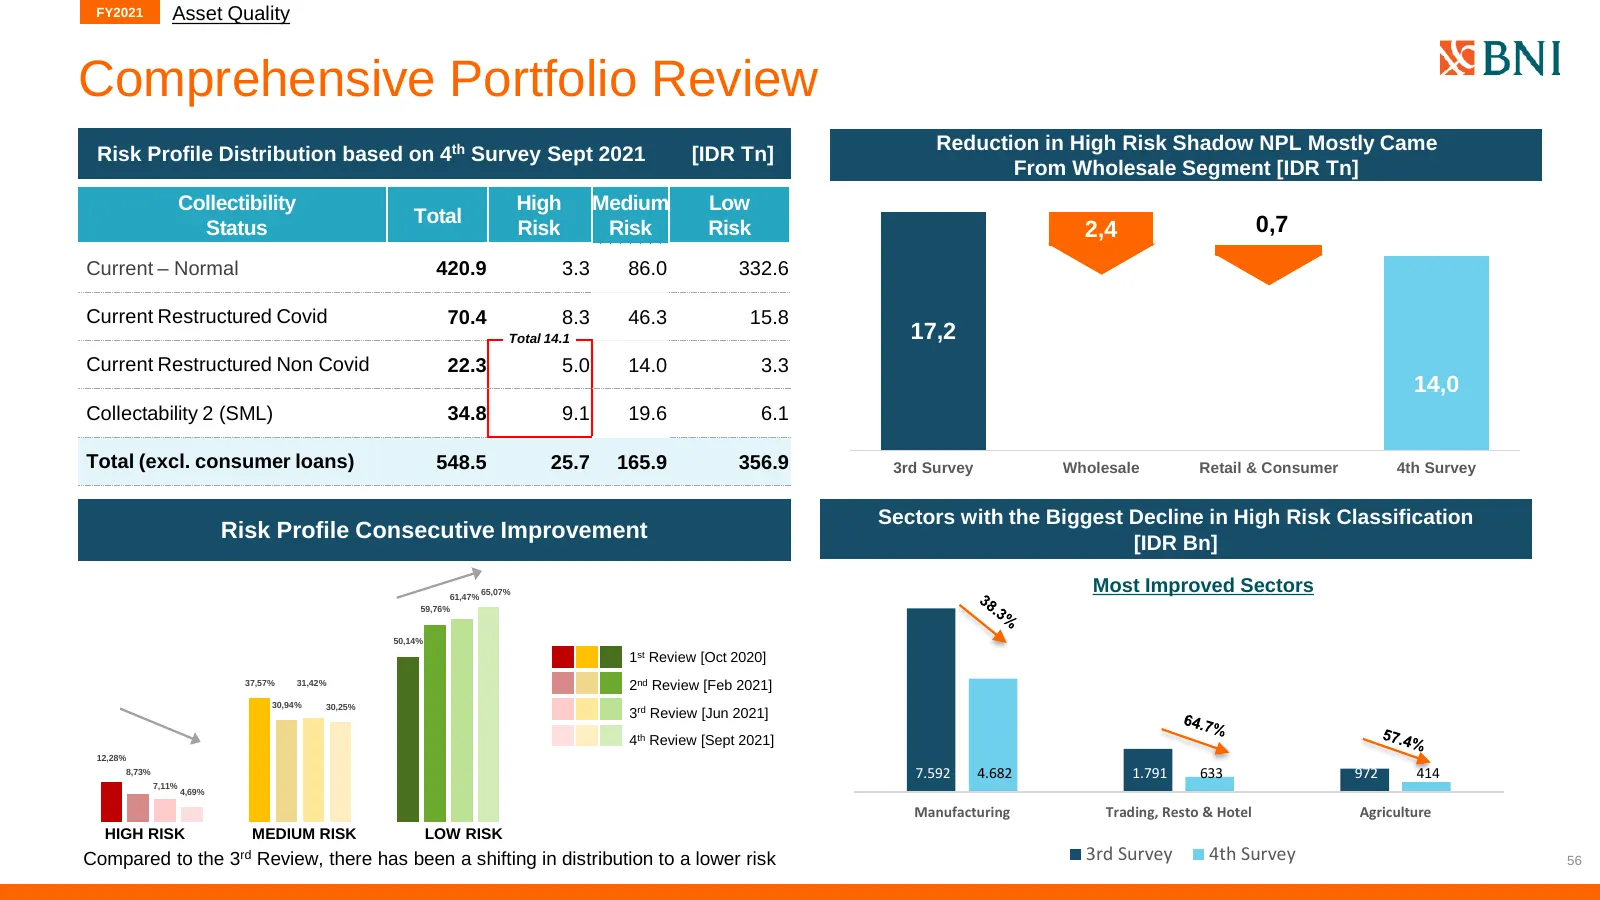
FY2021 Asset Quality Comprehensive Portfolio Review Reduction in High Risk Shadow NPL Mostly Came Risk Profile Distribution based on 4th Survey Sept 2021 [IDR Tn] From Wholesale Segment [IDR Tn] Collectibility High Medium Low Total 0,7 Status Risk Risk Risk 2,4 Current – Normal 420.9 3.3 86.0 332.6
Slide 57: 5 Years Financial Data
5 Years Financial Data
Slide 58: 5 Years Financial Data (1)
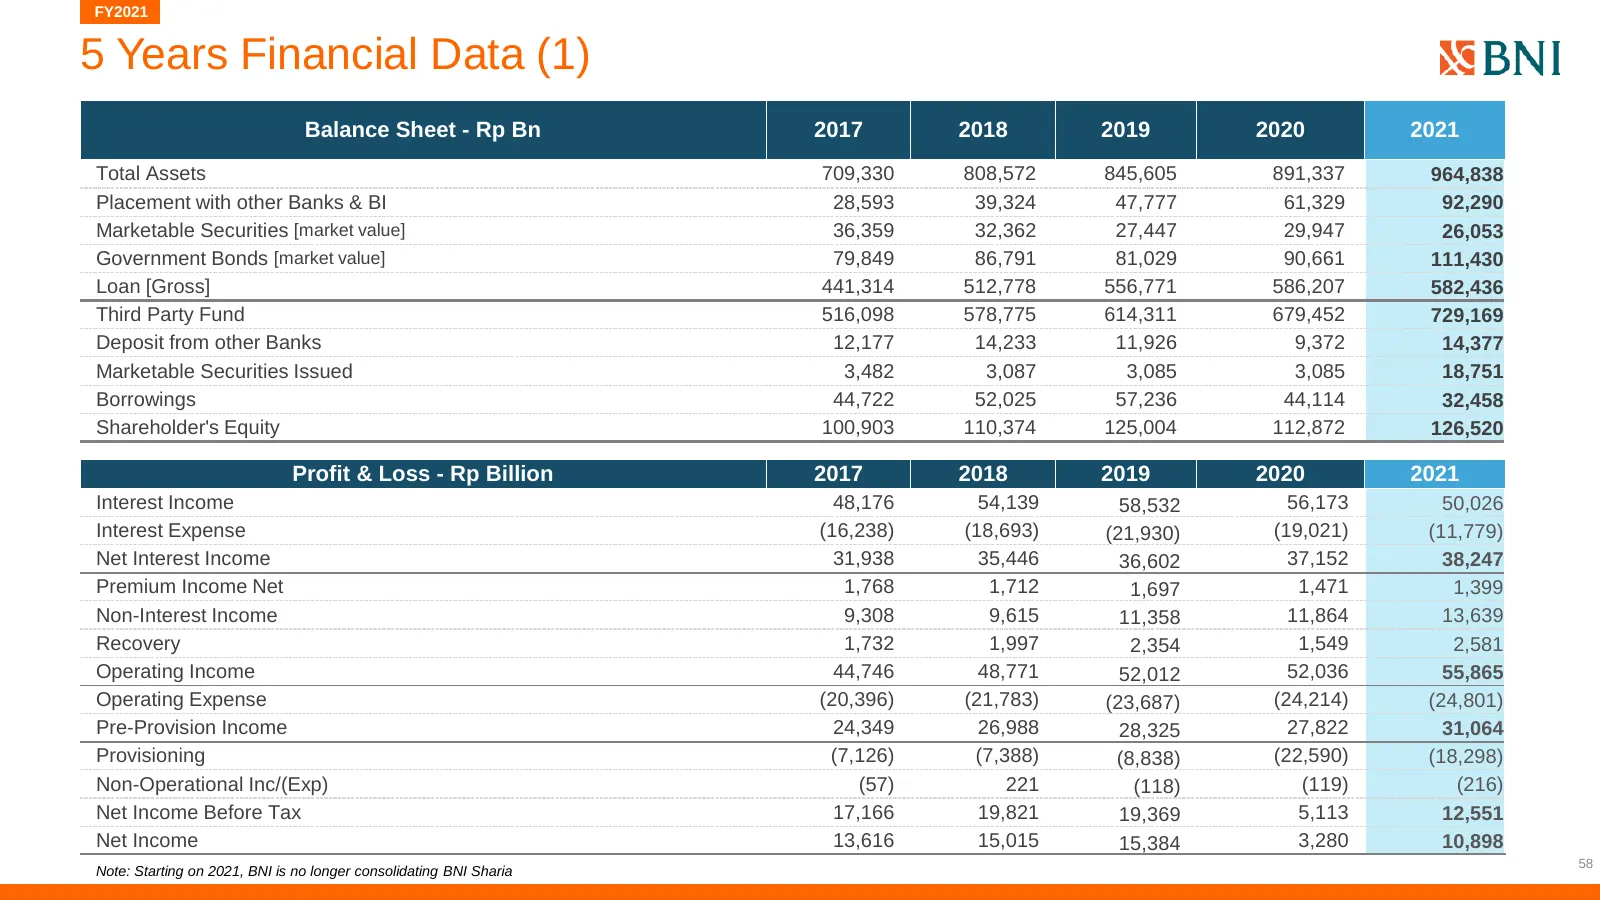
FY2021 5 Years Financial Data (1) Balance Sheet - Rp Bn 2017 2018 2019 2020 2021 Total Assets 709,330 808,572 845,605 891,337 964,838 Placement with other Banks & BI 28,593 39,324 47,777 61,329 92,290 Marketable Securities [market value] 36,359 32,362 27,447 29,947 26,053 Government Bonds [market va
Slide 59: 5 Years Financial Data (2)
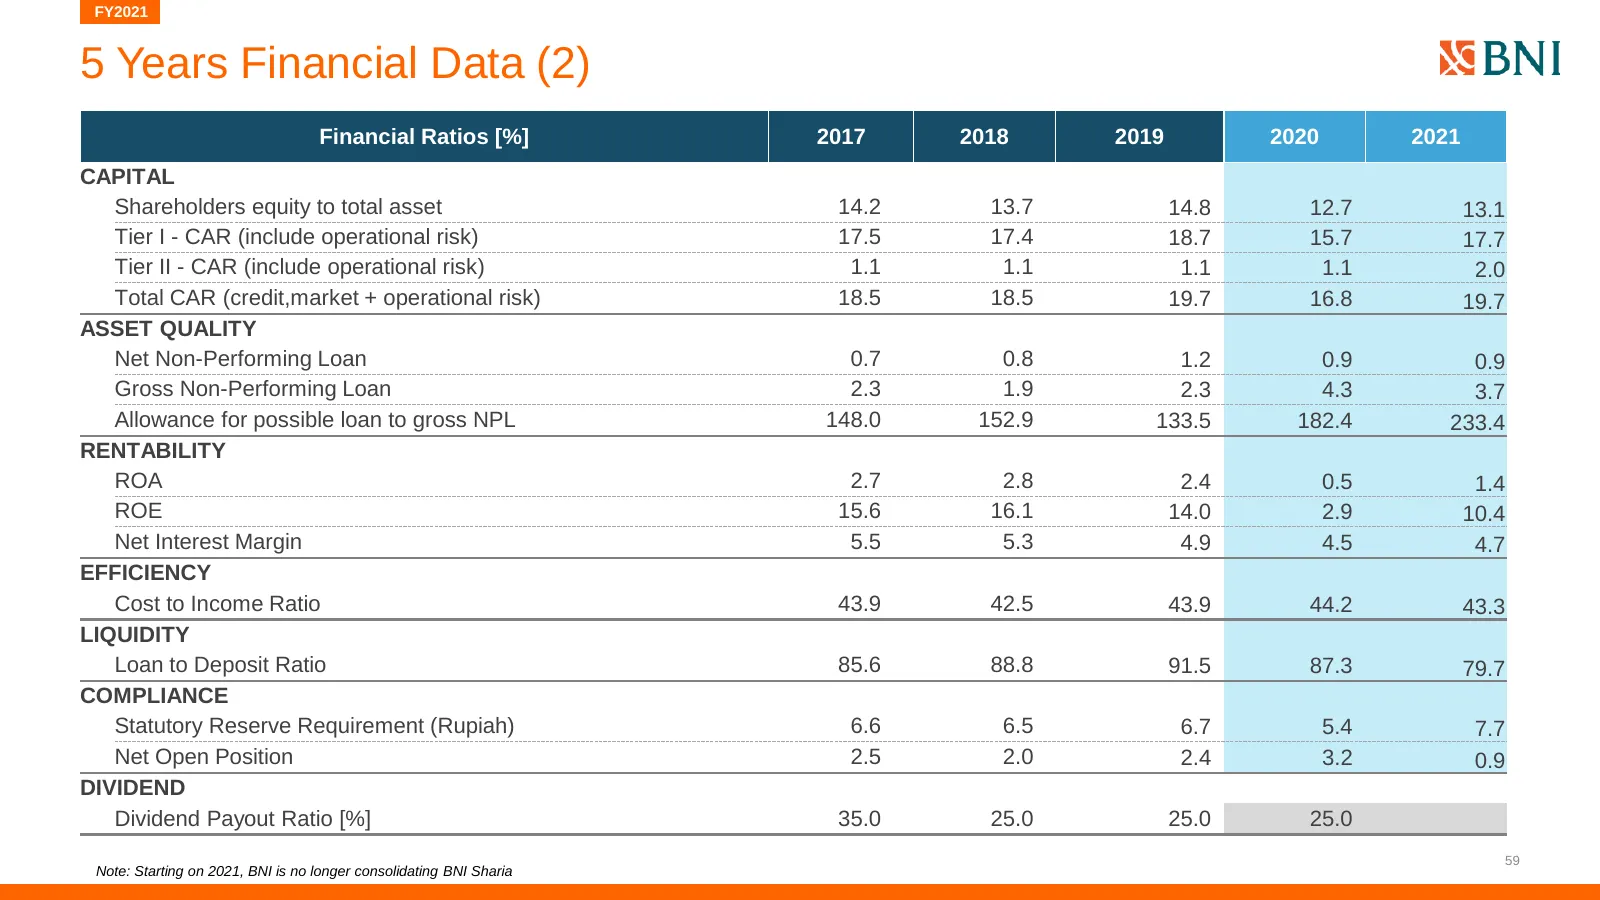
FY2021 5 Years Financial Data (2) Financial Ratios [%] 2017 2018 2019 2020 2021 CAPITAL Shareholders equity to total asset 14.2 13.7 14.8 12.7 13.1 Tier I - CAR (include operational risk) 17.5 17.4 18.7 15.7 17.7 Tier II - CAR (include operational risk) 1.1 1.1 1.1 1.1 2.0 Total CAR (credit,market +
Slide 60: Equity Research Contact Details
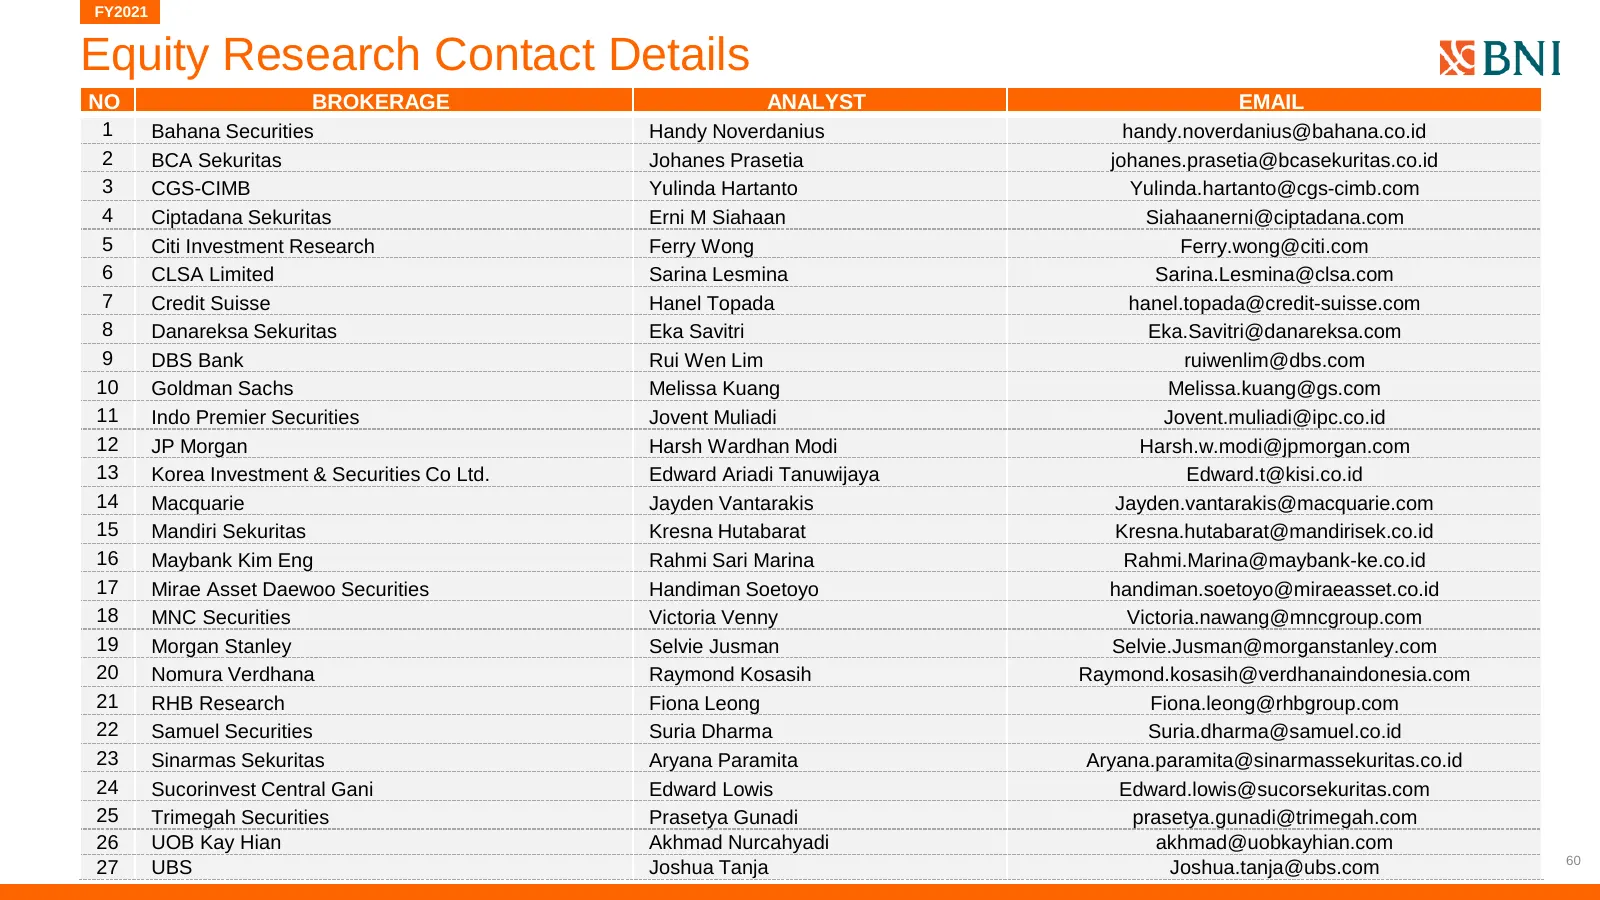
FY2021 Equity Research Contact Details NO BROKERAGE ANALYST EMAIL 1 Bahana Securities Handy Noverdanius handy.noverdanius@bahana.co.id 2 BCA Sekuritas Johanes Prasetia johanes.prasetia@bcasekuritas.co.id 3 CGS-CIMB Yulinda Hartanto Yulinda.hartanto@cgs-cimb.com 4 Ciptadana Sekuritas Erni M Siahaan S
Slide 61: Notes
FY2021 Notes 61
Slide 62: PT Bank Negara Indonesia (Persero) Tbk. Investor Relations
PT Bank Negara Indonesia (Persero) Tbk. Investor Relations Group BNI Building, 24th Floor Jl Jend Sudirman kav. 1 Jakarta 10220 T: 62-21-572-8449/8909/9279 E: ir@bni.co.id PT. Bank Negara Indonesia (Persero) Tbk. | Divisi Komunikasi Perusahaan dan Kesekretariatan (KMP)

Slide 63: Thank You
Thank You PT. Bank Negara Indonesia (Persero) Tbk.
Source: Internet Archive copy of bni.co.id
More decks from PT Bank Negara Indonesia (Persero) Tbk Class B
 Q1 2025 Earnings Presentation68 slides · Apr 28, 2025
 FY2024 Earnings Presentation71 slides · Jan 22, 2025
 Q1 2024 Earnings Presentation72 slides · Apr 29, 2024
 Q3 2023 Earnings Presentation74 slides · Oct 31, 2023
 Q1 2023 Earnings Presentation69 slides · May 18, 2023
 FY2022 Earnings Presentation69 slides · Jan 24, 2023