TPG Inc. · NASDAQ:TPG
TPG — FY2000 Earnings Presentation
43 slides from TPG's earnings presentation, 2001

Slide 1: 2000 Full Year results
Strong performances generating excellent results 2000 Full Year results Overview Ad Scheepbouwer Chairman and CEO
Slide 2: Agenda
Agenda • Ad Scheepbouwer: • What we accomplished in 2000 • Performance • Highlights • Looking ahead • Short-term developments • Outlook • Peter Bakker • Financials for full year 2000
Slide 3: Excellent full year results
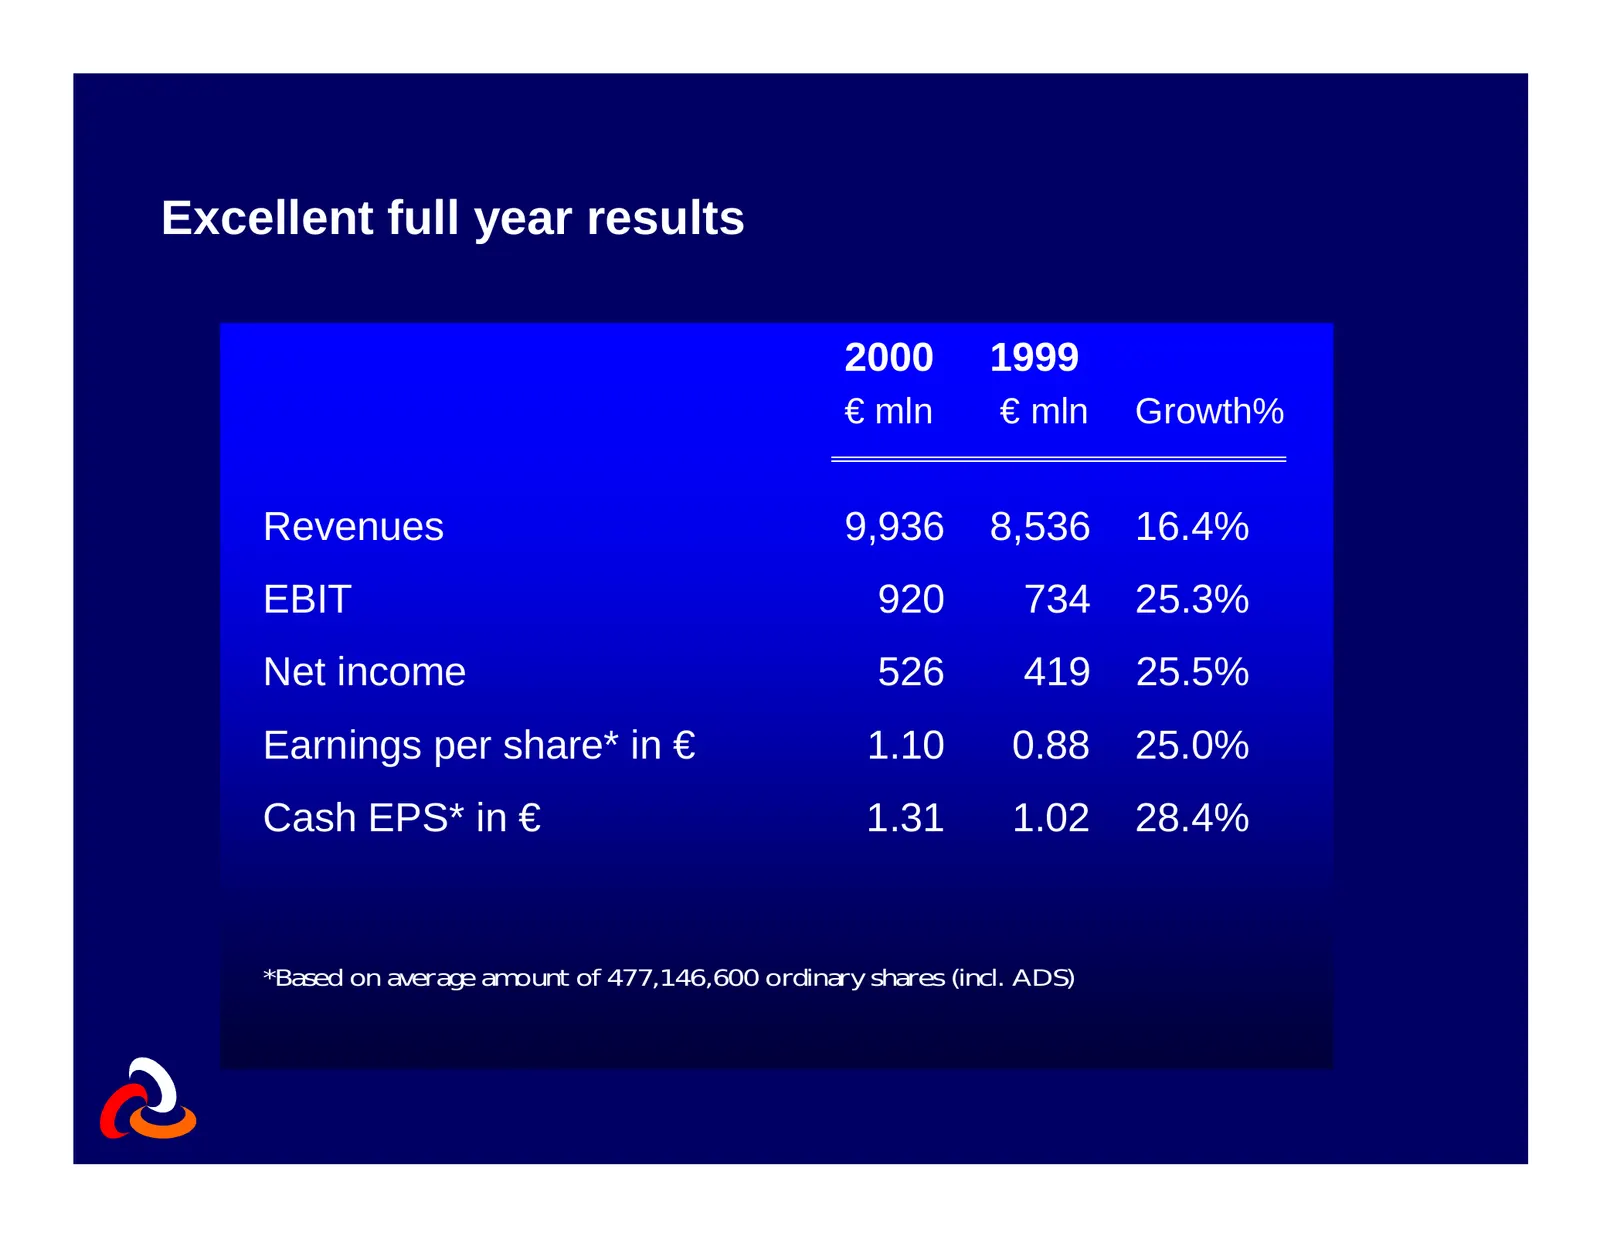
Excellent full year results 2000 1999 € mln € mln Growth% Revenues 9,936 8,536 16.4% EBIT 920 734 25.3% Net income 526 419 25.5% Earnings per share* in € 1.10 0.88 25.0% Cash EPS* in € 1.31 1.02 28.4% *Based on average amount of 477,146,600 ordinary shares (incl. ADS)
Slide 4: 2000 Highlights
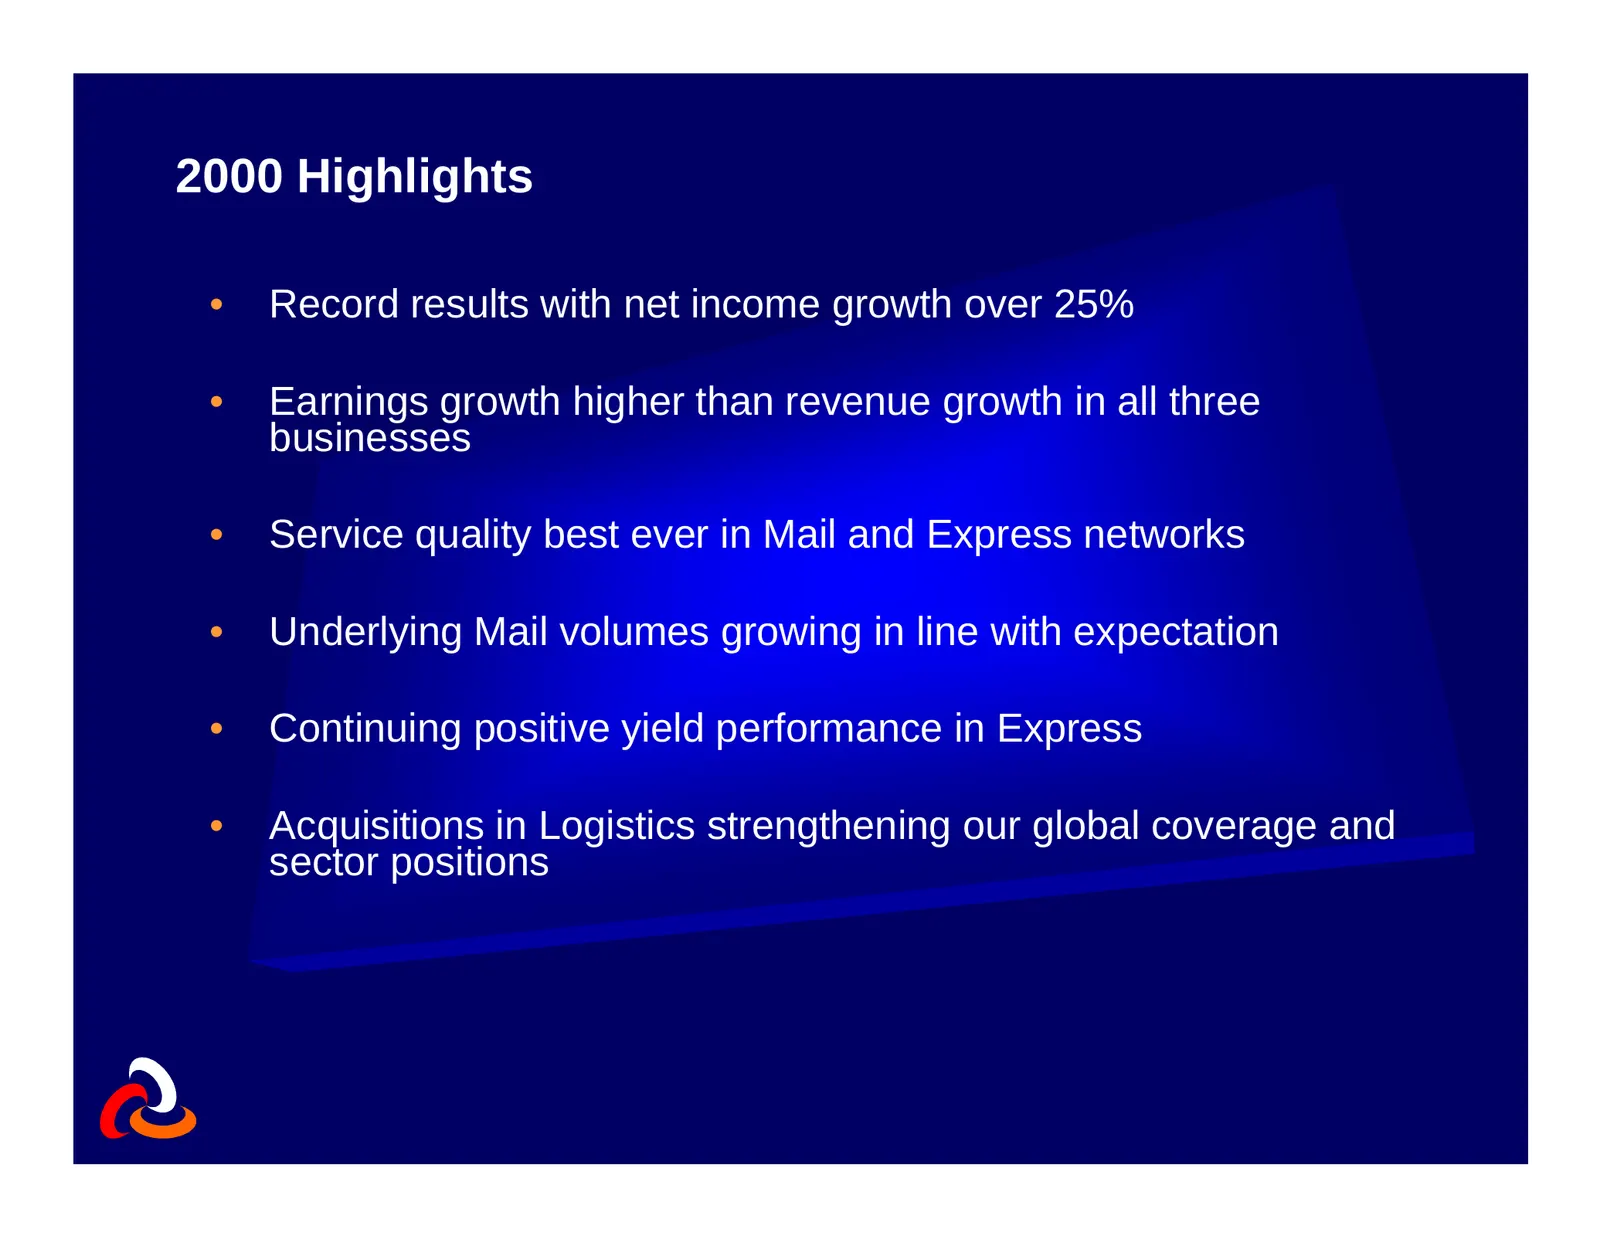
2000 Highlights • Record results with net income growth over 25% • Earnings growth higher than revenue growth in all three businesses • Service quality best ever in Mail and Express networks • Underlying Mail volumes growing in line with expectation • Continuing positive yield performance in Express
Slide 5: 2000 Highlights
2000 Highlights • Five year strategic plan completed and internal targets upgraded • Value Based Management drilled down into the organization • E-fulfillment (Loop) initiatives embedded in Express and Logistics divisions
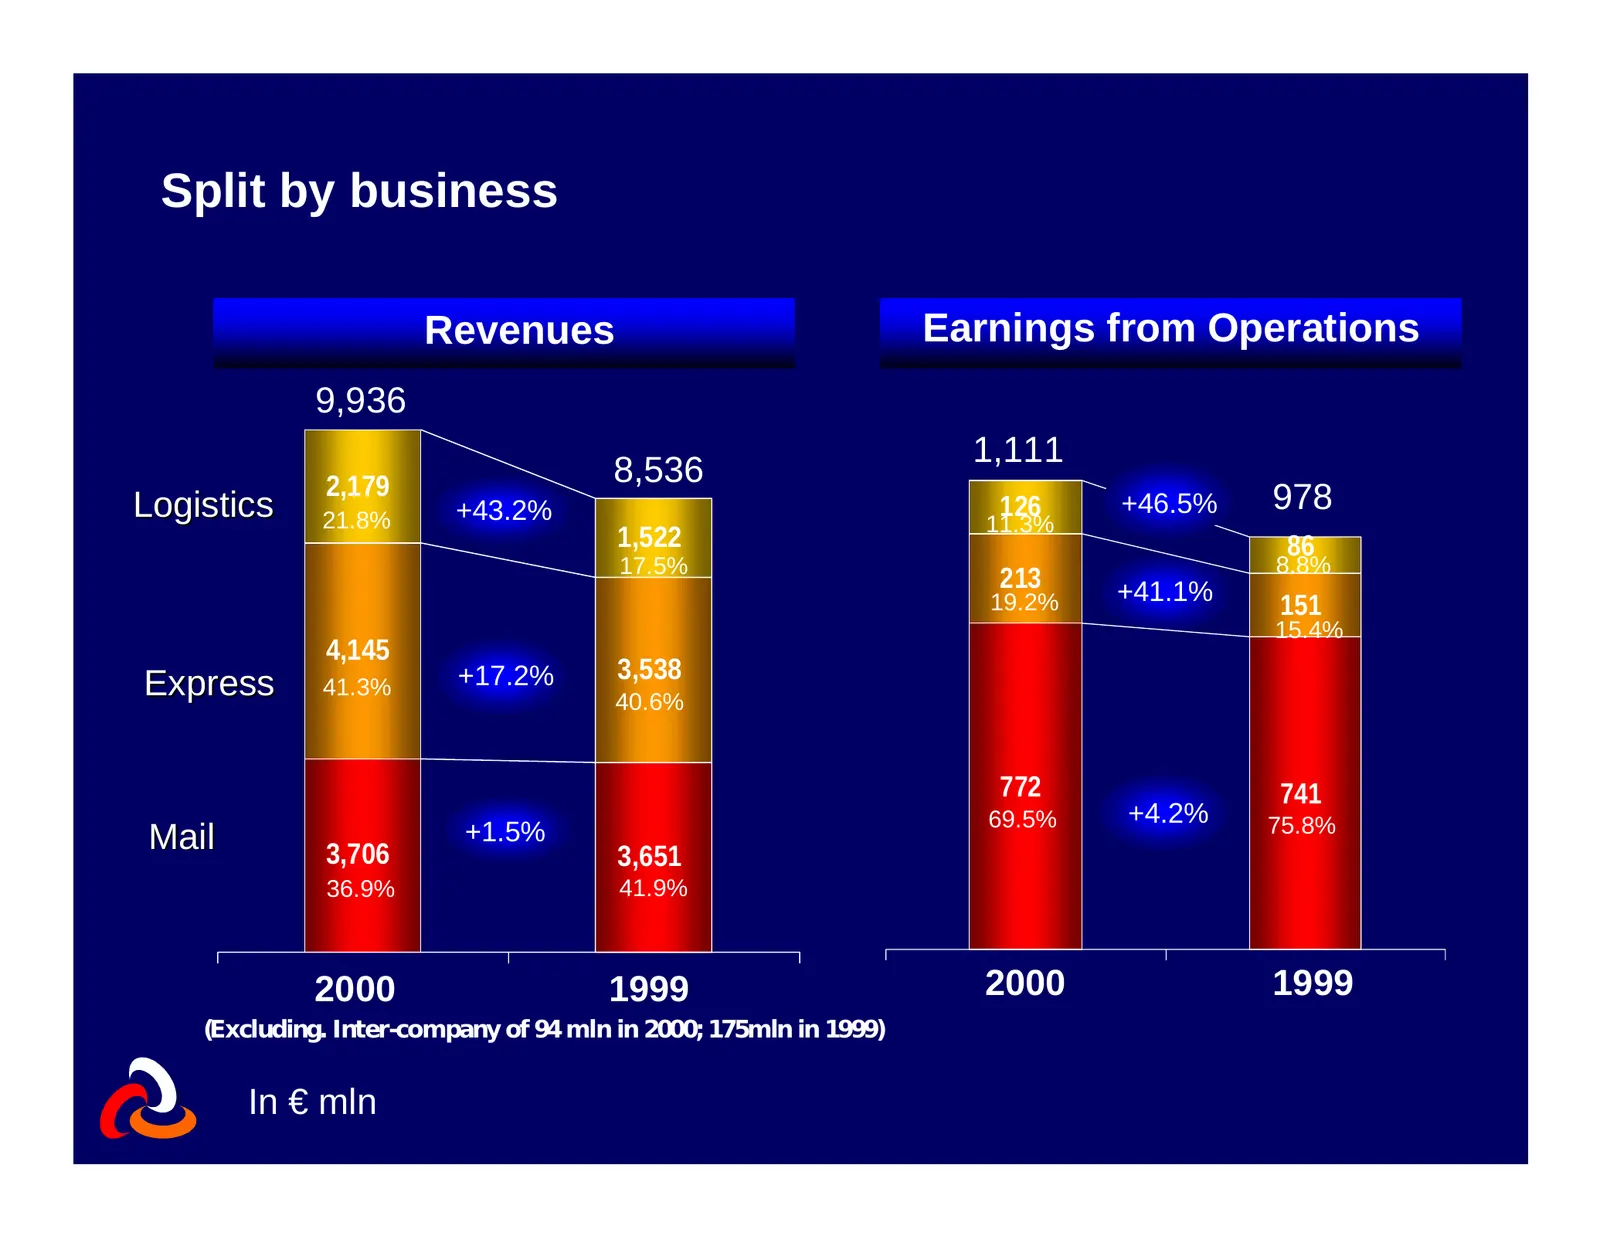
Slide 6: Split by business
Split by business Revenues Earnings from Operations 9,936 1,111 2,179 8,536 Logistics +43.2% 126 +46.5% 978 21.8% 11.3% 1,522 86 17.5% 8.8% 213 +41.1% 19.2% 151 15.4% 4,145 +17.2% 3,538 Express 41.3% 40.6% 772 741 69.5% +4.2% 75.8% Mail +1.5% 3,706 3,651 36.9% 41.9% 2000 1999 2000 1999 (Excluding. I
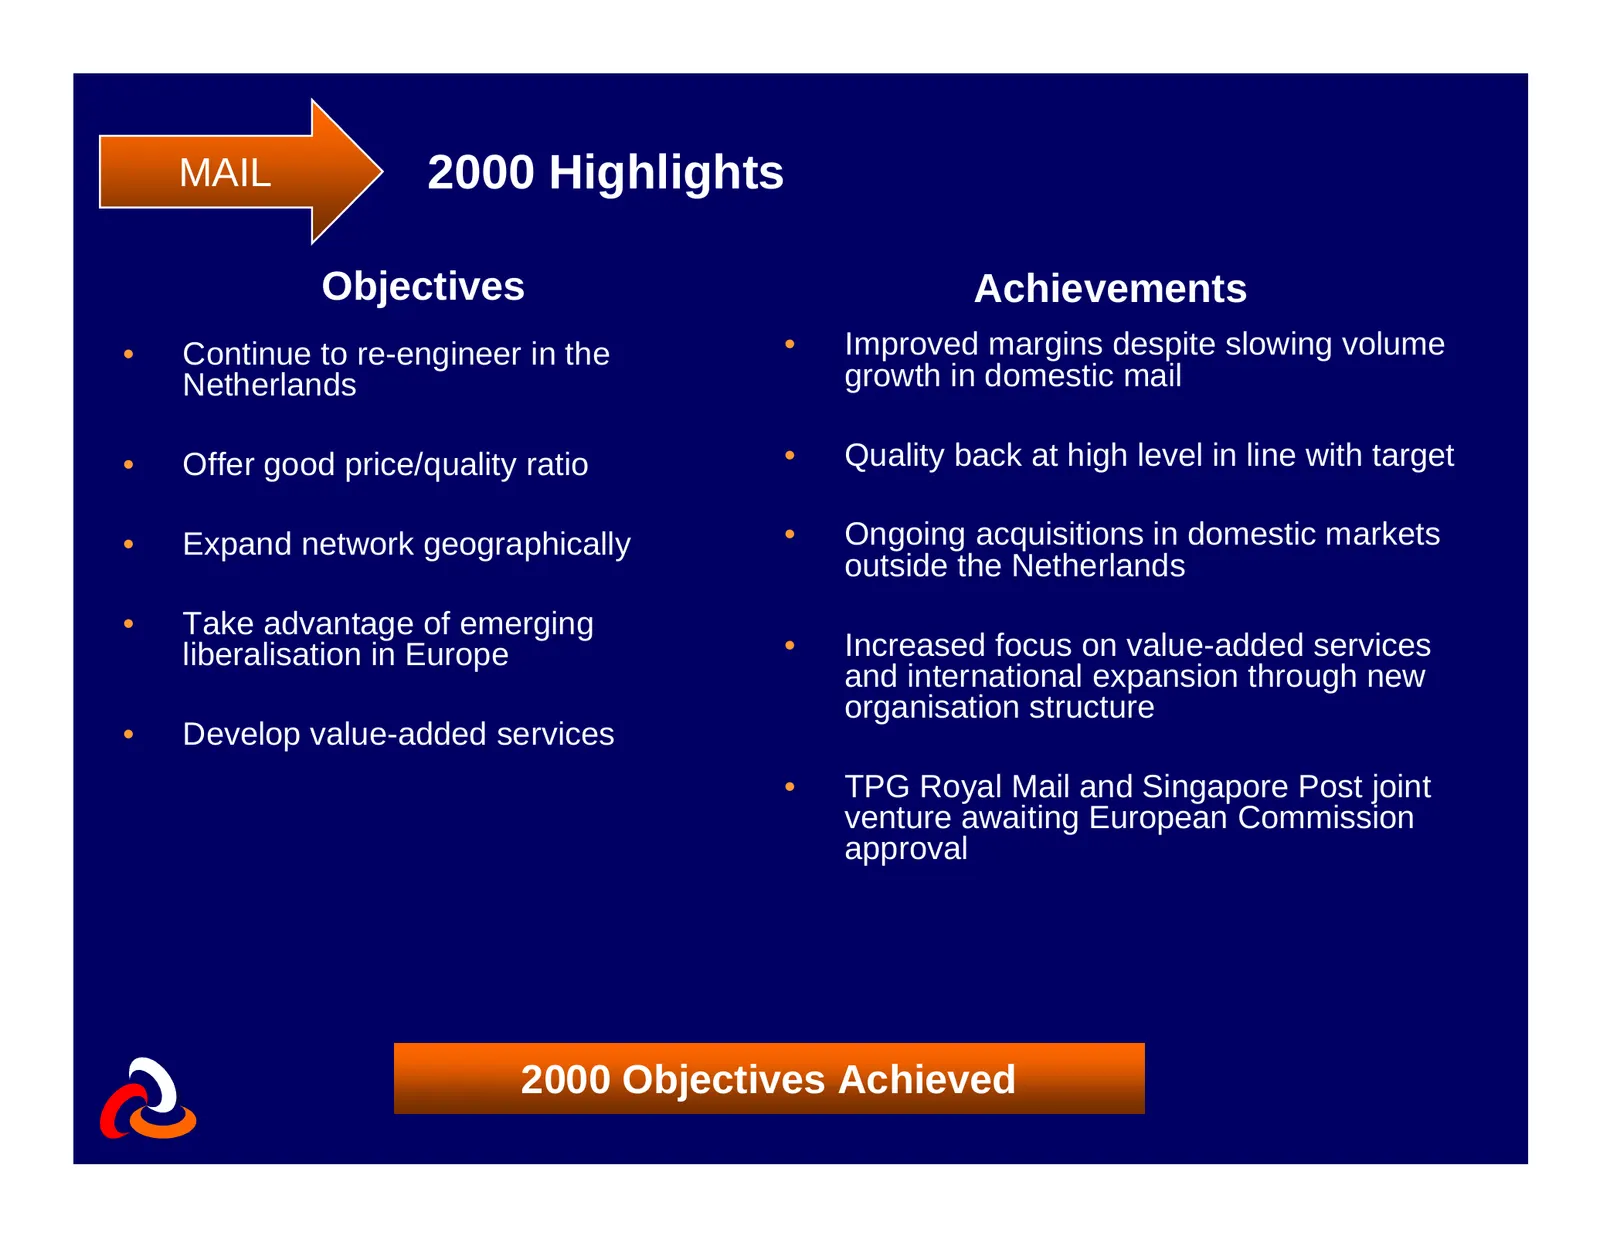
Slide 7: Mail 2000 Highlights
MAIL 2000 Highlights Objectives Achievements • Continue to re-engineer in the • Improved margins despite slowing volume Netherlands growth in domestic mail • Offer good price/quality ratio • Quality back at high level in line with target • Expand network geographically • Ongoing acquisitions in dome
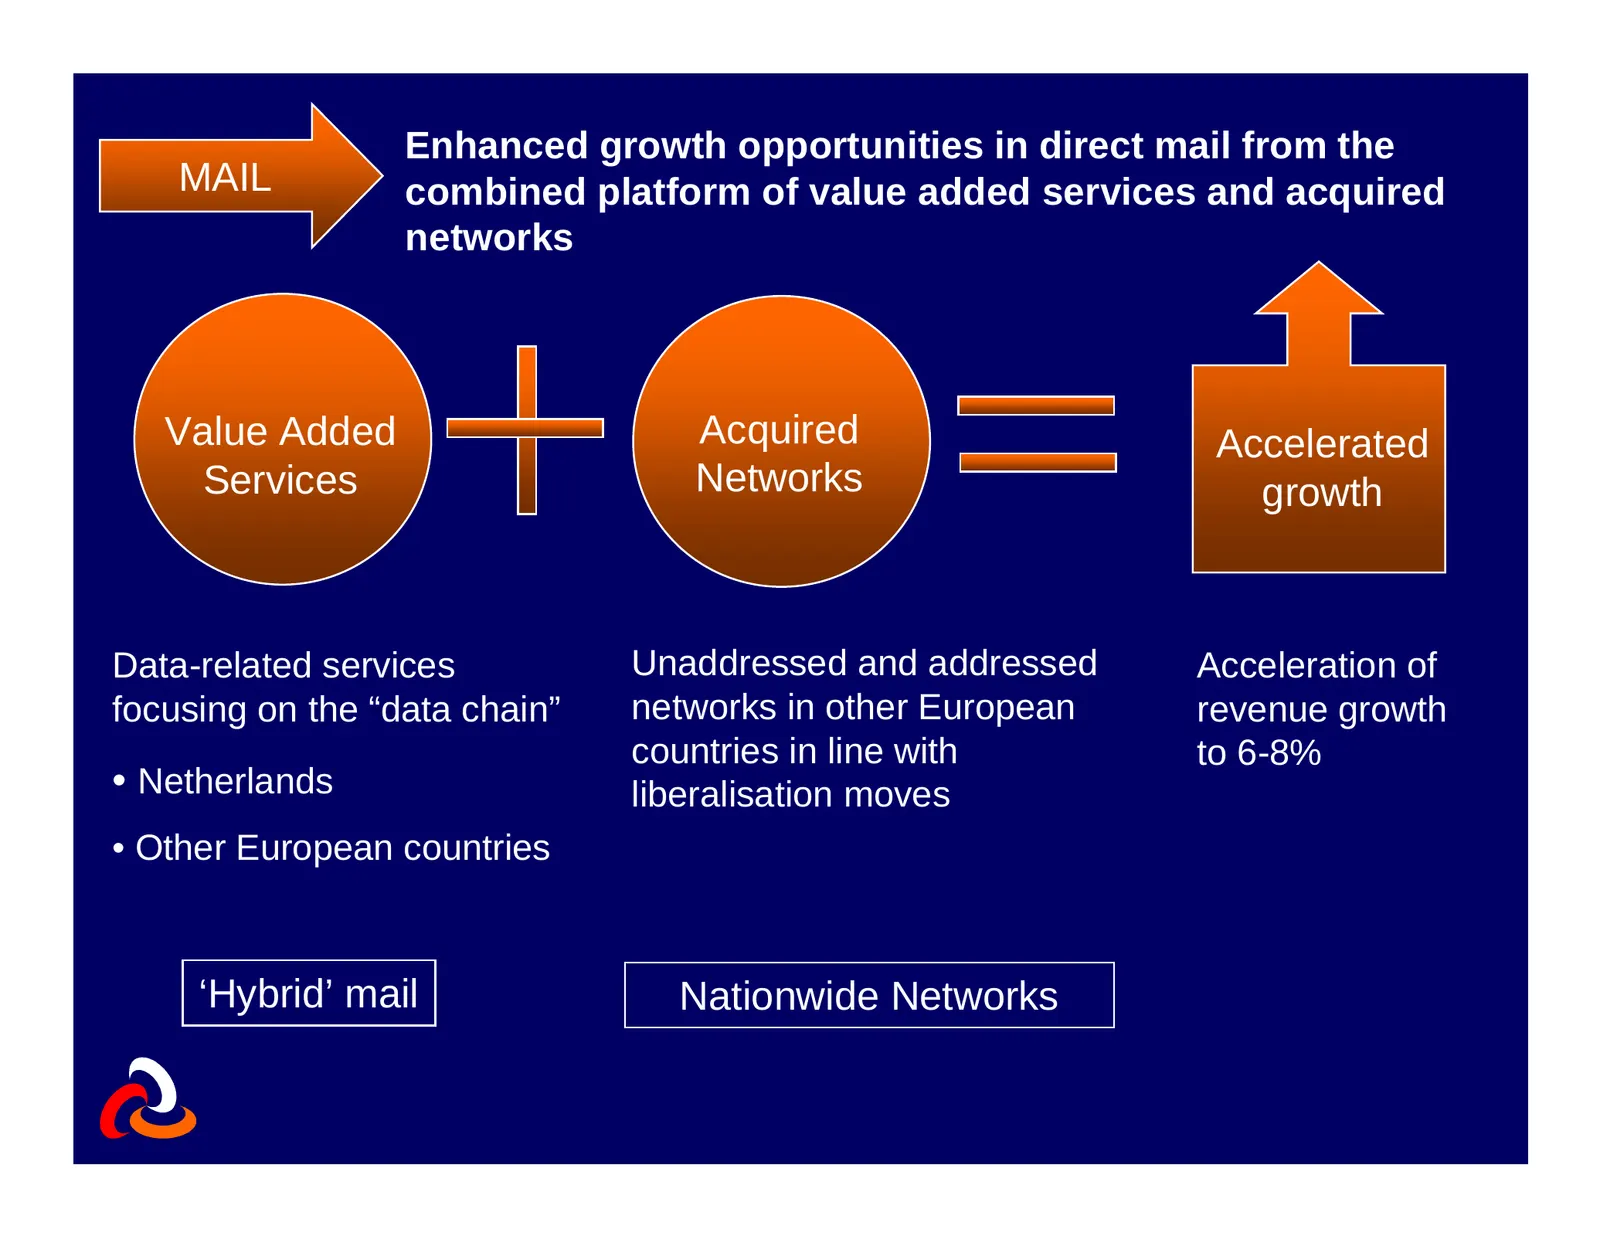
Slide 8: Mail: Enhanced growth opportunities in direct mail
Enhanced growth opportunities in direct mail from the MAIL combined platform of value added services and acquired networks Value Added Acquired Accelerated Services Networks growth Data-related services Unaddressed and addressed Acceleration of focusing on the “data chain” networks in other European
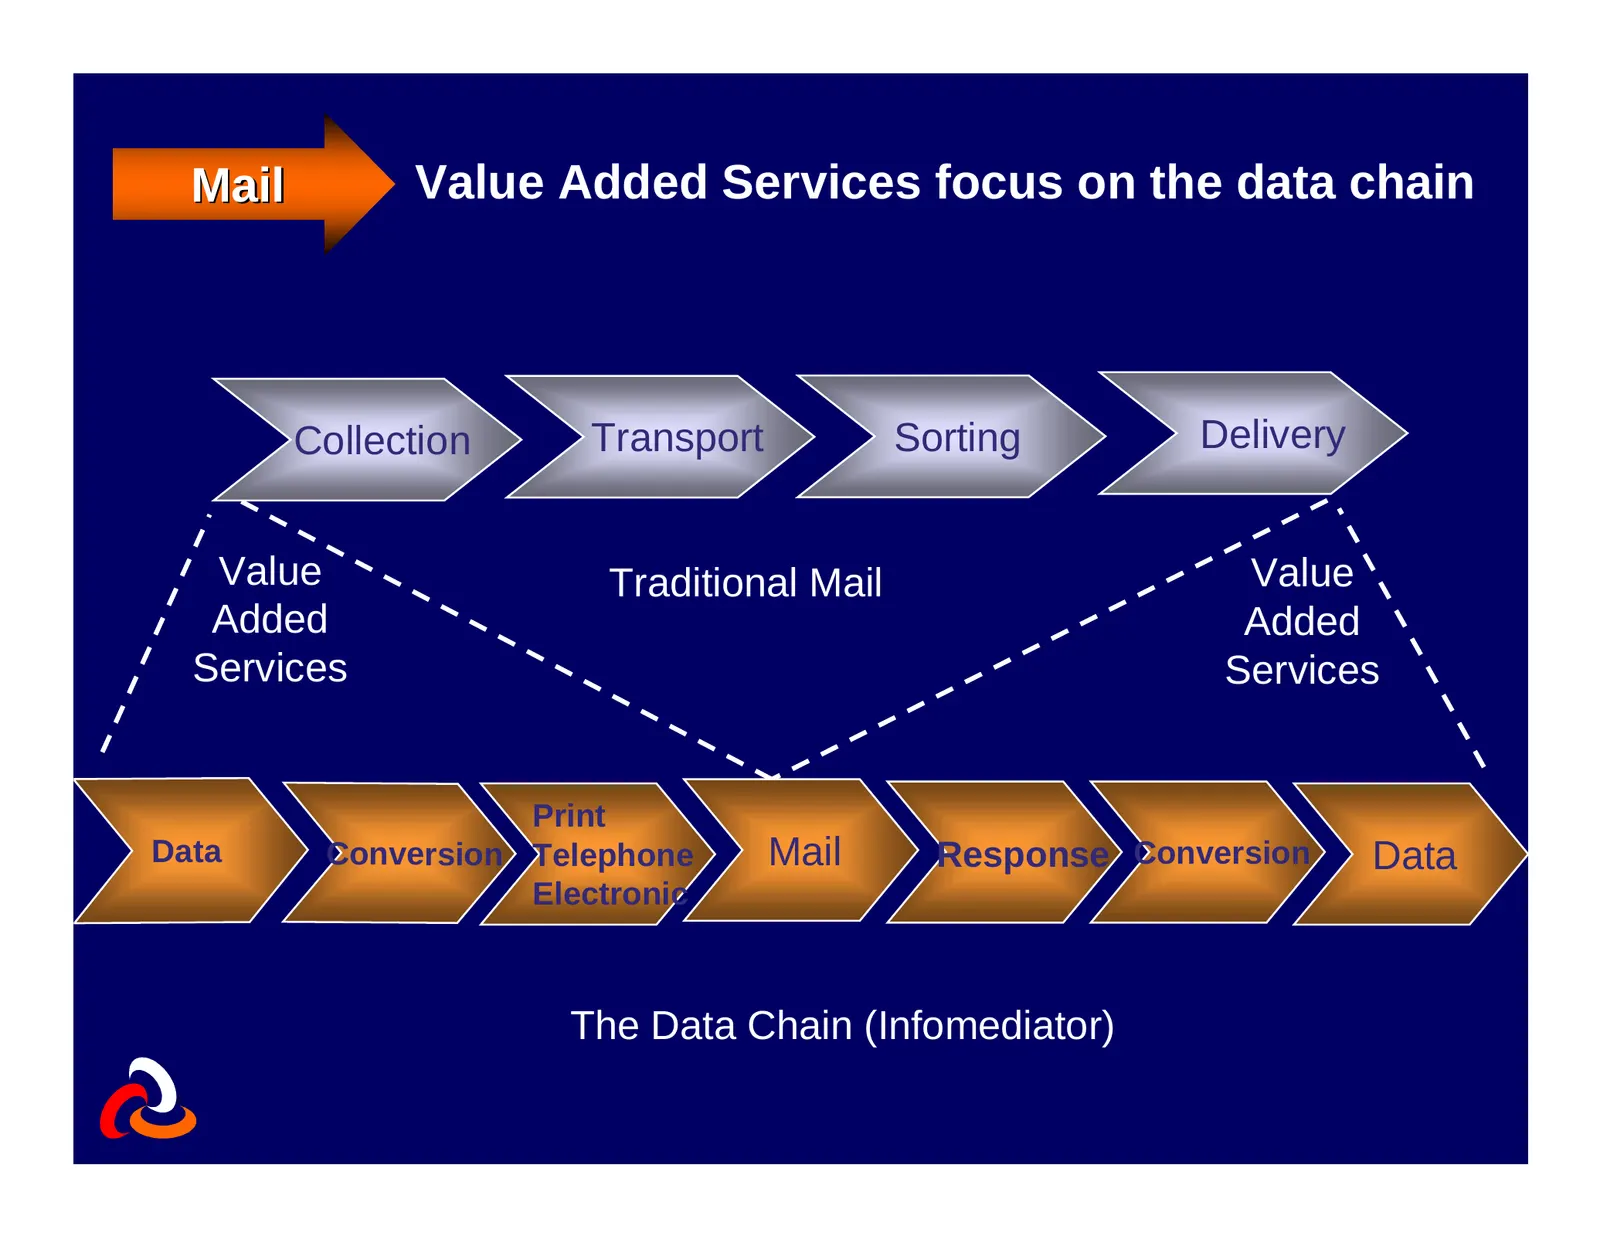
Slide 9: Mail Value Added Services focus on the data chain
Mail Value Added Services focus on the data chain Collection Transport Sorting Delivery Value Traditional Mail Value Added Added Services Services Print Data Conversion Telephone Mail Response Conversion Data Electronic The Data Chain (Infomediator)
Slide 10: Acquired networks provide basis for European expansion
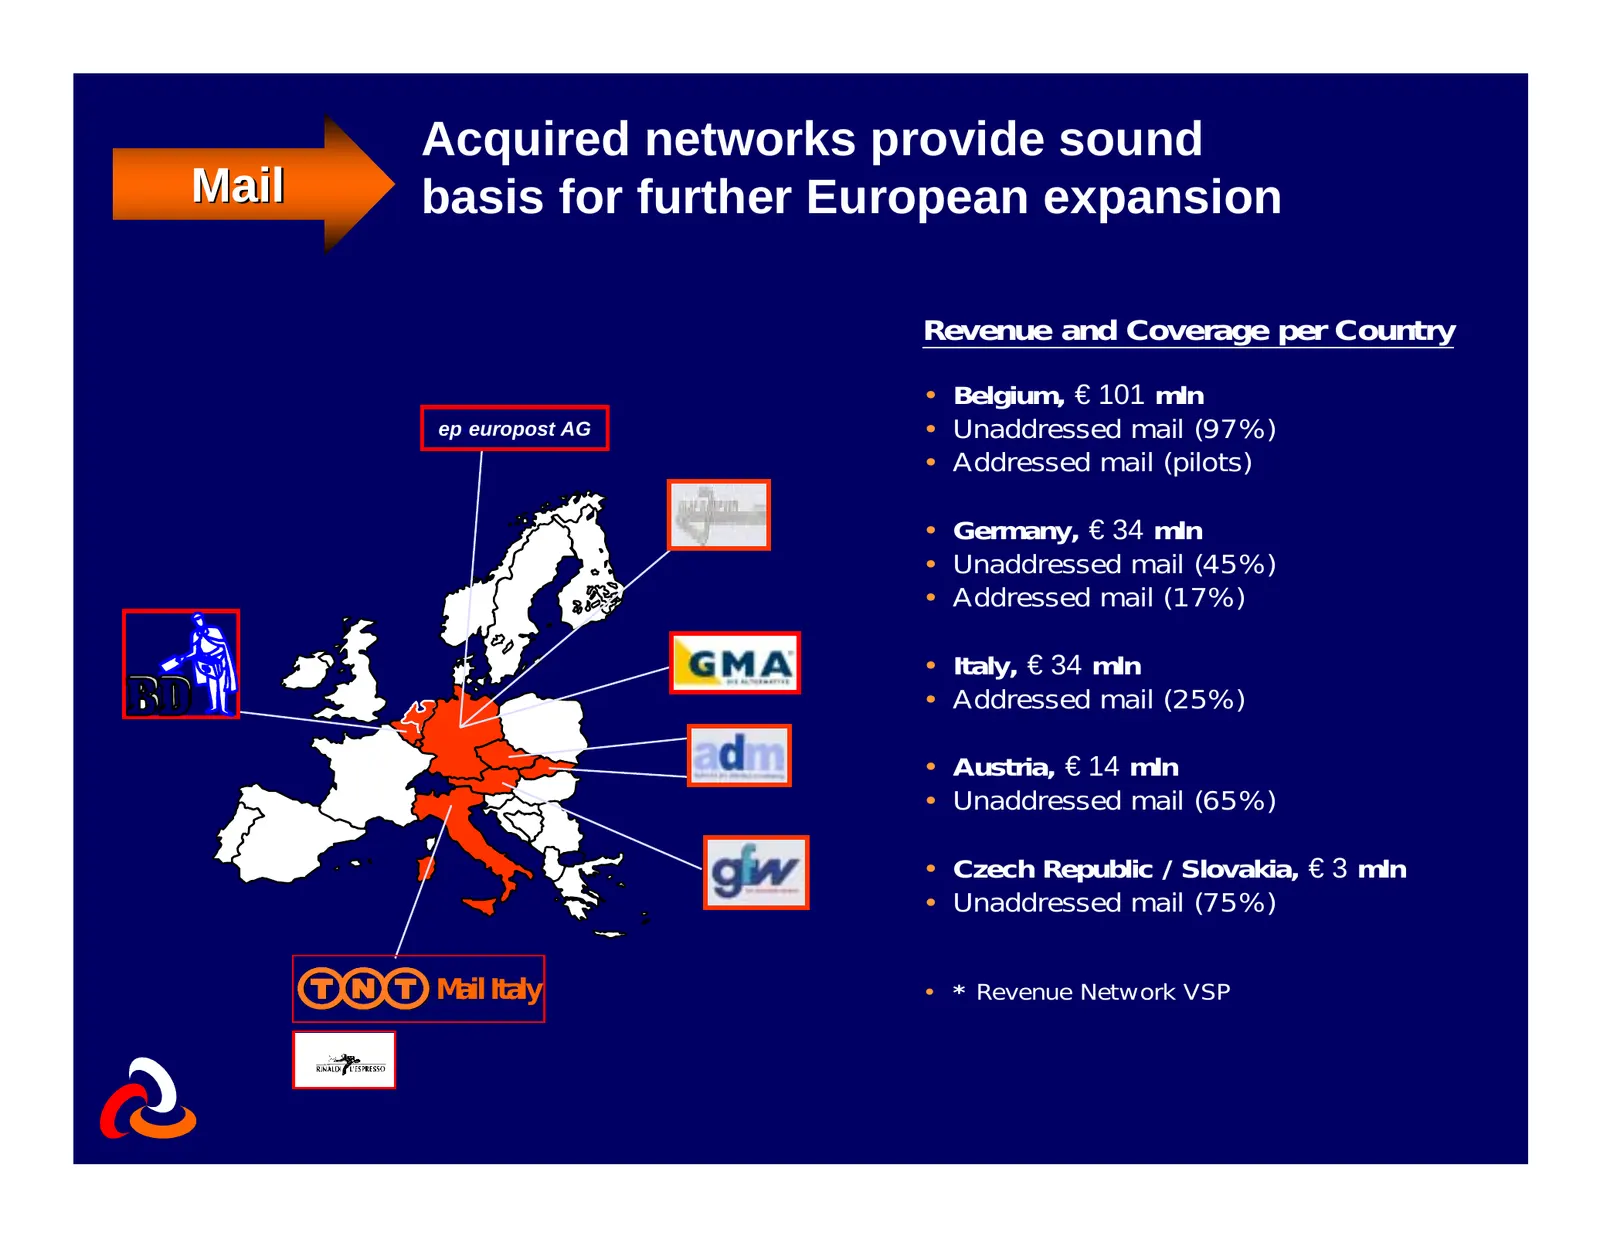
Acquired networks provide sound Mail basis for further European expansion Revenue and Coverage per Country • Belgium, € 101 mln ep-europost AG • Unaddressed mail (97%) • Addressed mail (pilots) • Germany, € 34 mln • Unaddressed mail (45%) • Addressed mail (17%) • Italy, € 34 mln • Addressed mail (25
Slide 11: European Postal Liberalisation
MAIL European Postal Liberalisation Status • Latest EU Commission plan is to reduce present monopoly limit from 350 to 50 grams/2,5 x basic tariff in 2003 with view to total liberalisation in 2007 • French compromise plan tabled at December 2000 EU Council of Ministers meeting was to reduce monopoly
Slide 12: Mail Postkantoren B.V.
Mail POSTKANTOREN B.V. • Negotiations with the Ministry of Transport and Public works still in progress • Service quality in rural areas -number of branches with full product assortment / international parcel transport • Negotiations between Postkantoren B.V. and postagents -pilots
Slide 13: Mail DELTA status
Mail DELTA status • Last week much press attention was given to the joint venture between TPG, Royal Mail and Singapore Post • Our Counsel expects to receive the EC approval this week • TPG has given undertakings - a.o. to sell TNT International mail in the Netherlands (€ 11 million revenue)
Slide 14: Mail Objectives 2001 and Outlook 2001
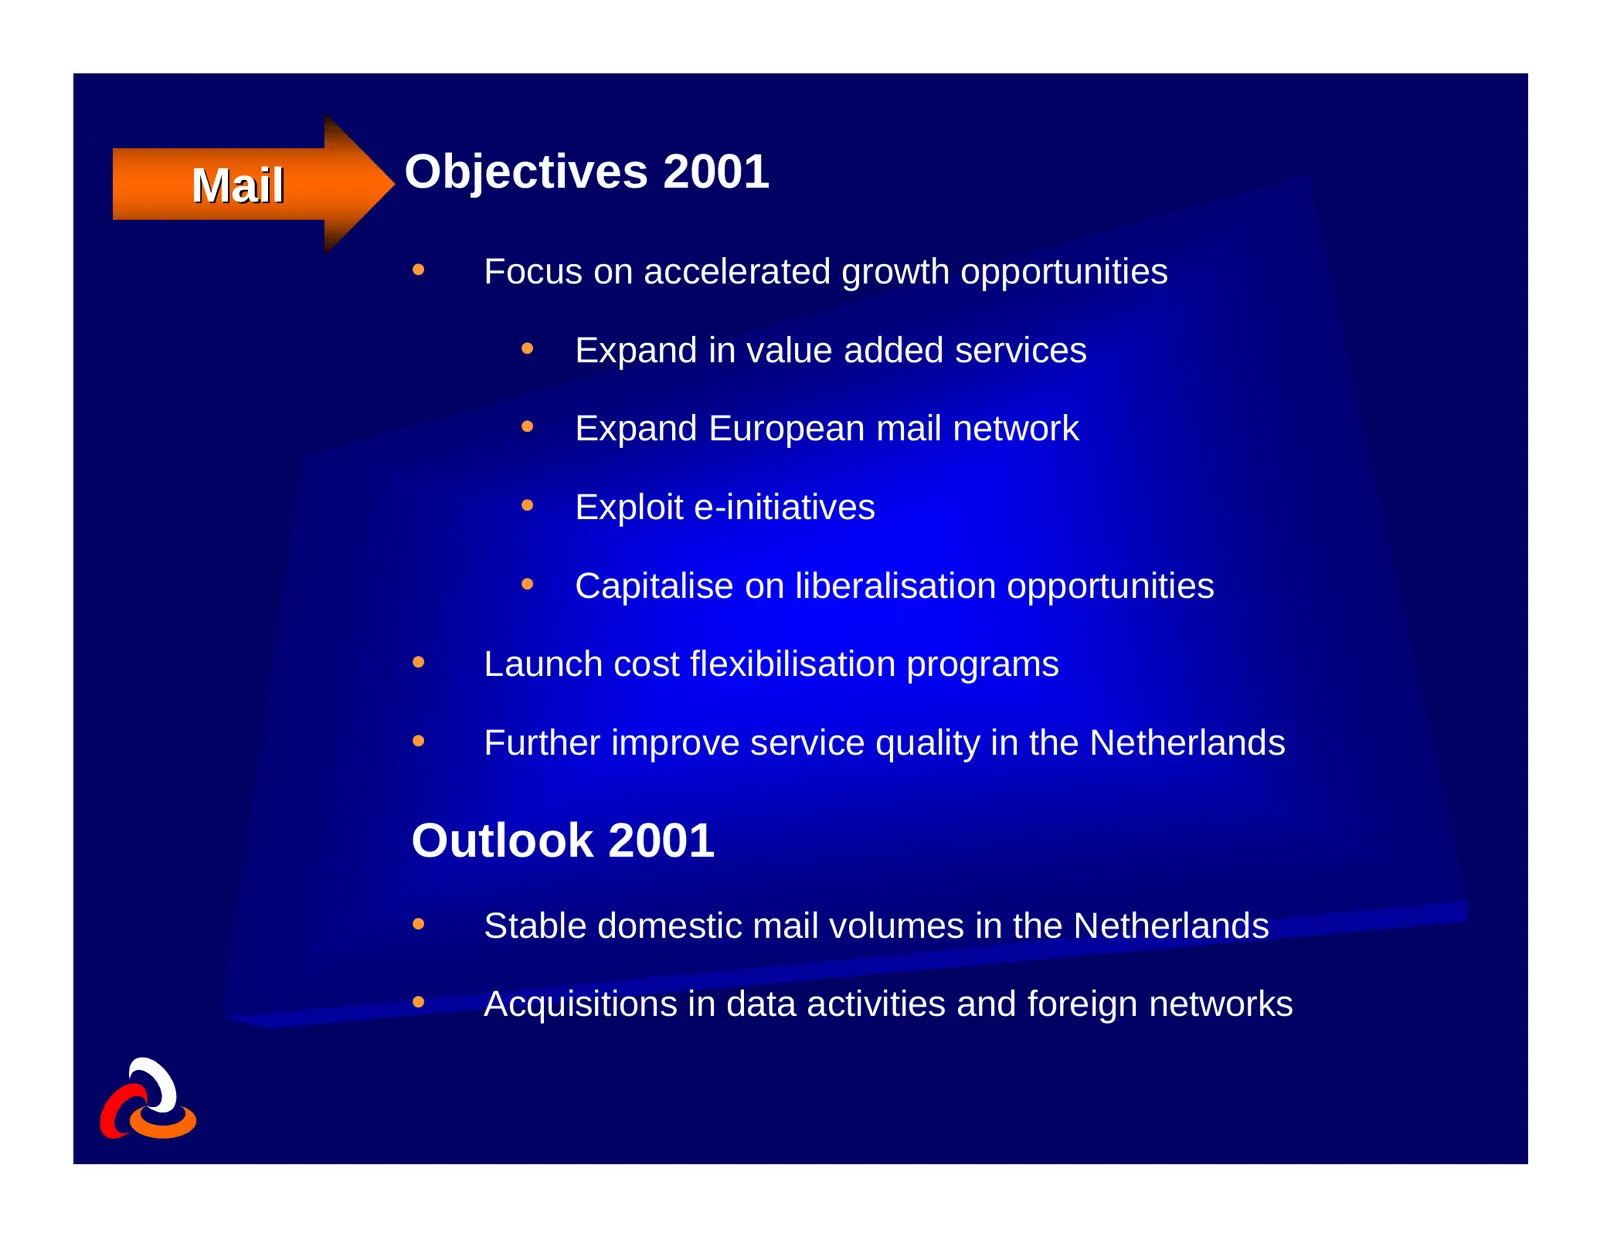
Mail Objectives 2001 • Focus on accelerated growth opportunities • Expand in value added services • Expand European mail network • Exploit e-initiatives • Capitalise on liberalisation opportunities • Launch cost flexibilisation programs • Further improve service quality in the Netherlands Outlook 20
Slide 15: Express 2000 Highlights
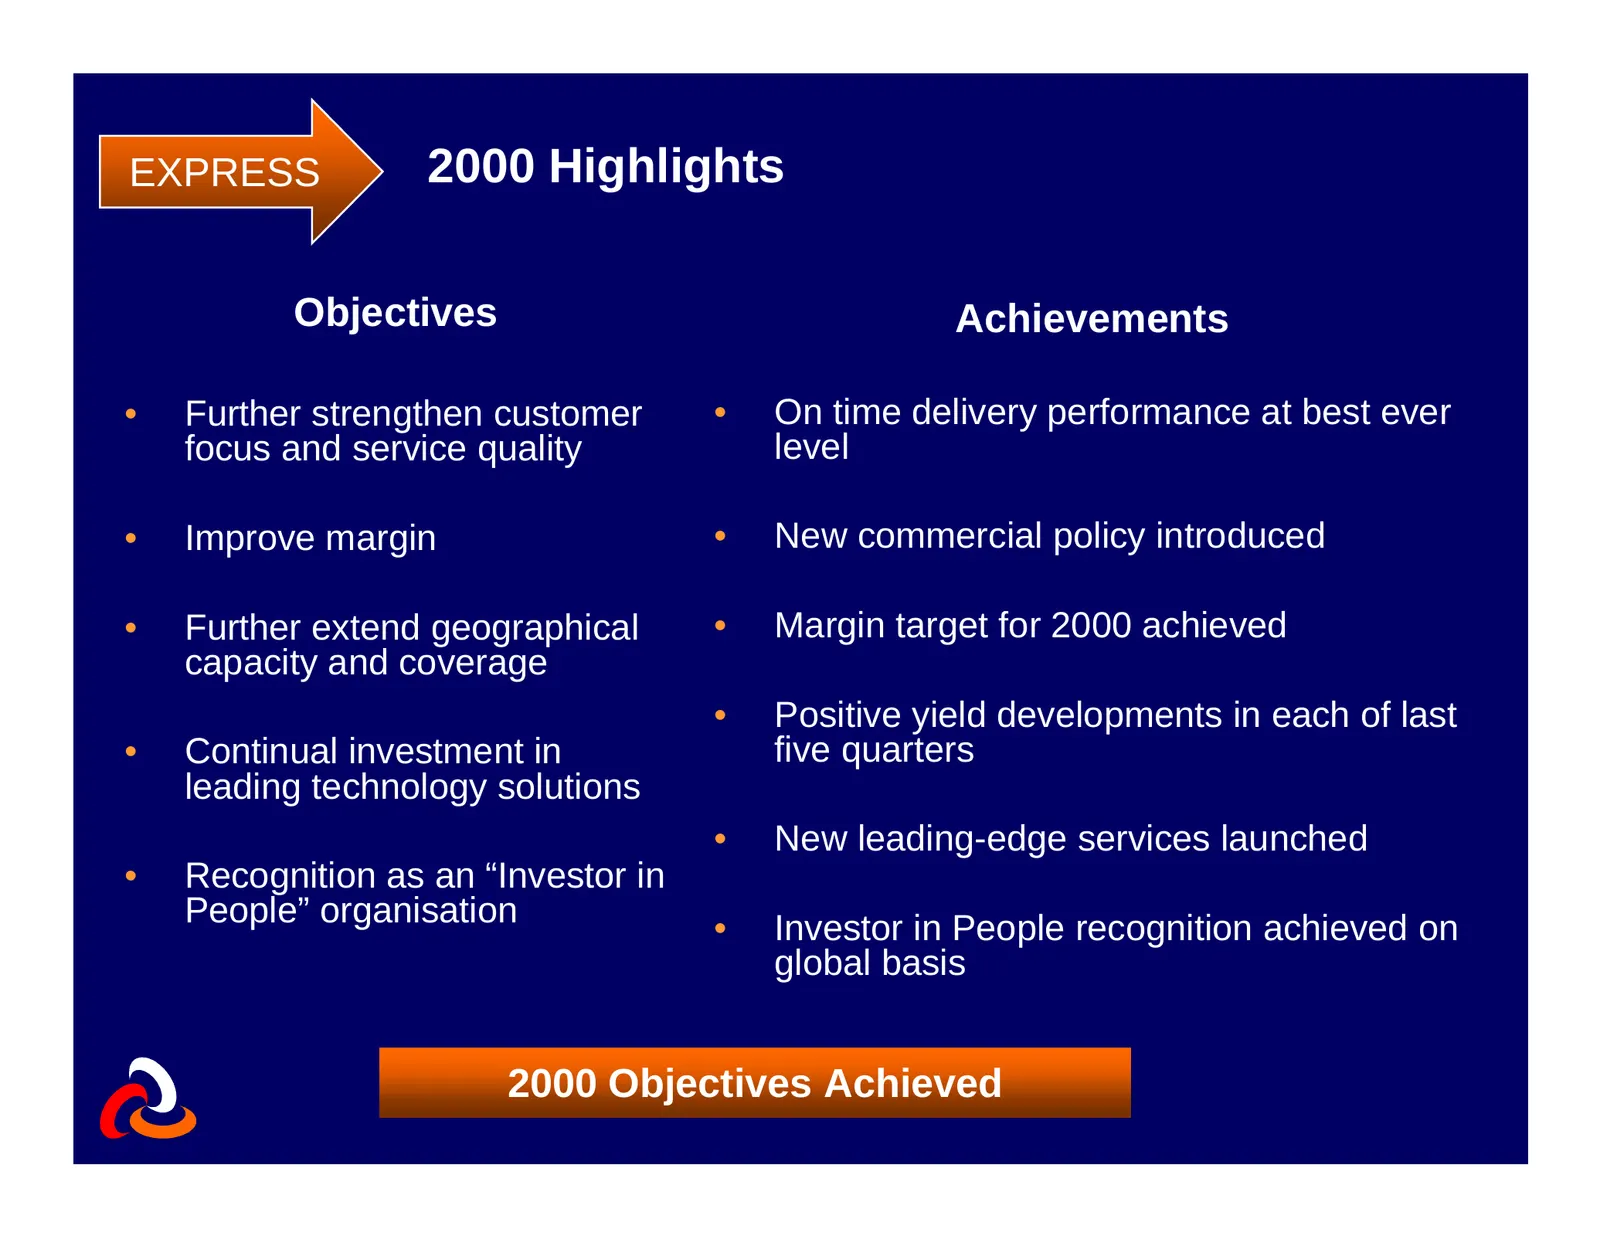
EXPRESS 2000 Highlights Objectives Achievements • Further strengthen customer • On time delivery performance at best ever focus and service quality level • Improve margin • New commercial policy introduced • Further extend geographical • Margin target for 2000 achieved capacity and coverage • Positi
Slide 16: Improving operating margin through yield management
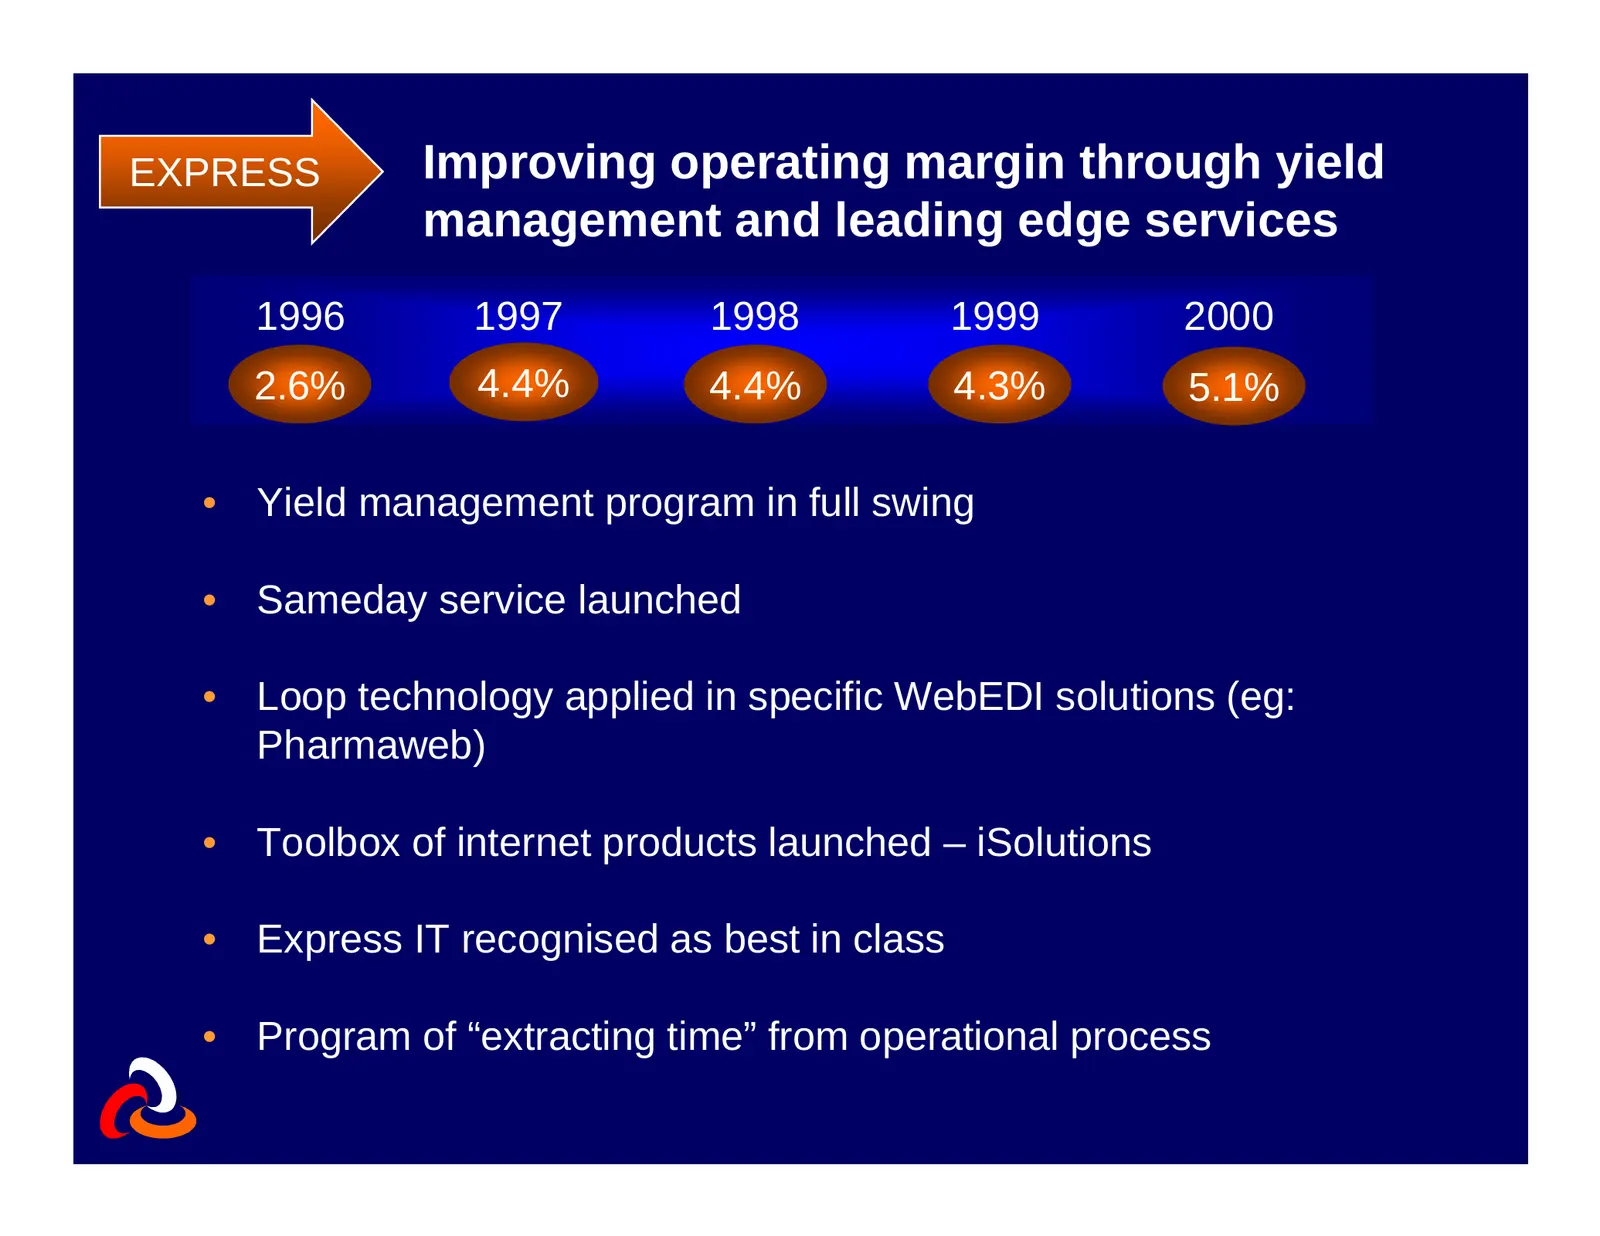
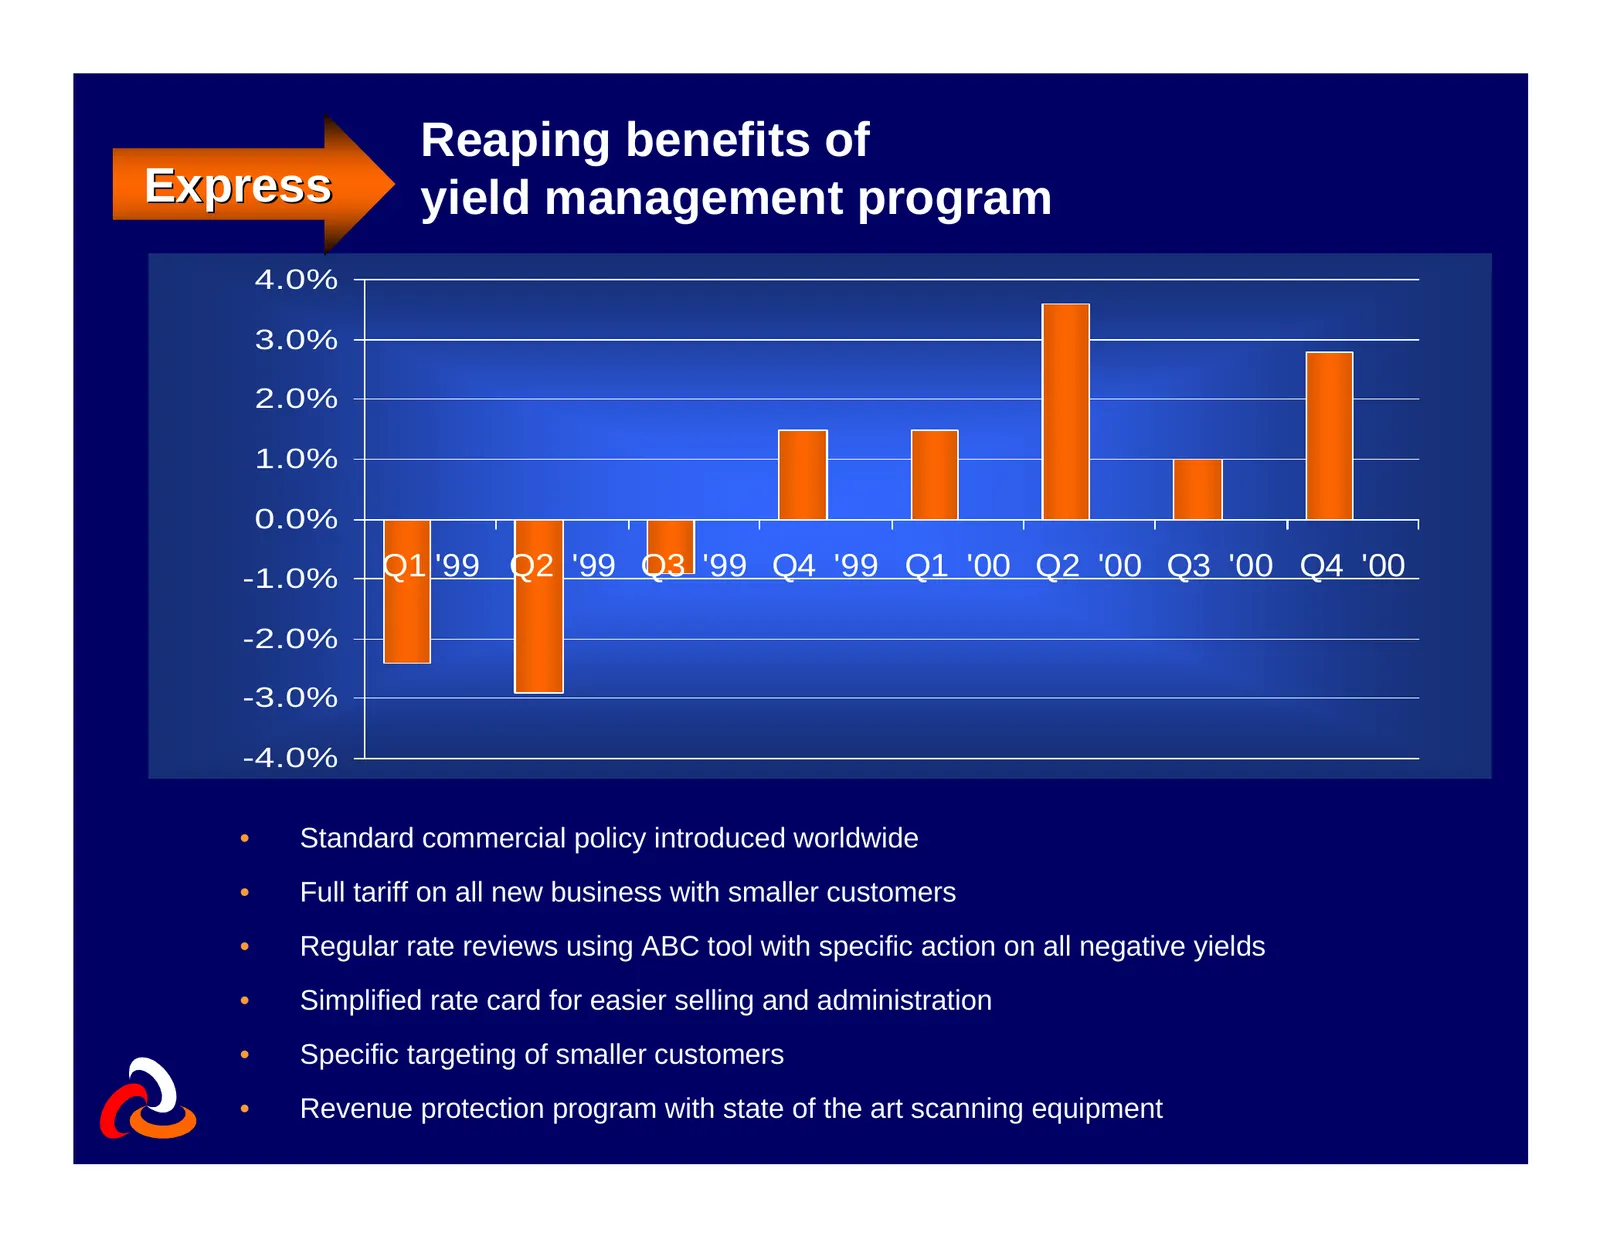
EXPRESS Improving operating margin through yield management and leading edge services 1996 1997 1998 1999 2000 2.6% 4.4% 4.4% 4.3% 5.1% • Yield management program in full swing • Sameday service launched • Loop technology applied in specific WebEDI solutions (eg: Pharmaweb) • Toolbox of internet pro
Slide 17: Express 2001 Objectives and Outlook
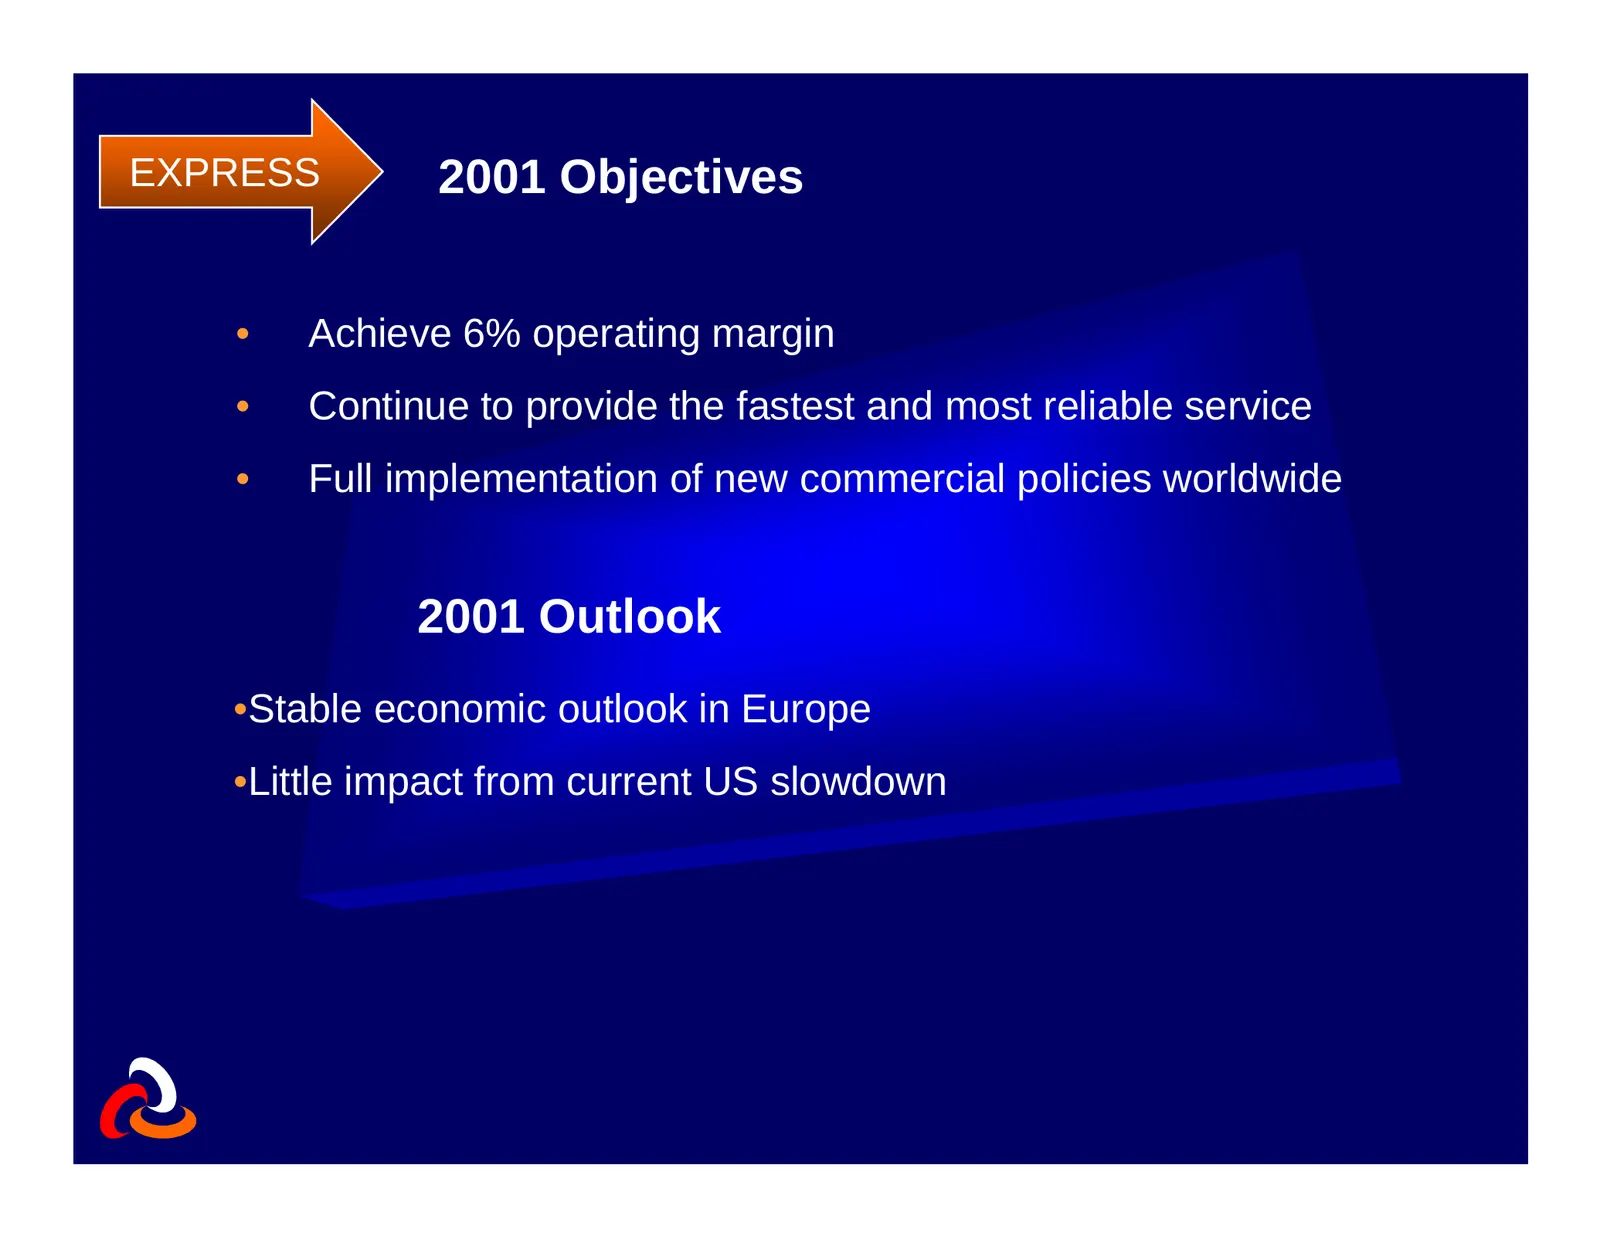
EXPRESS 2001 Objectives • Achieve 6% operating margin • Continue to provide the fastest and most reliable service • Full implementation of new commercial policies worldwide 2001 Outlook •Stable economic outlook in Europe •Little impact from current US slowdown
Slide 18: Logistics 2000 Highlights
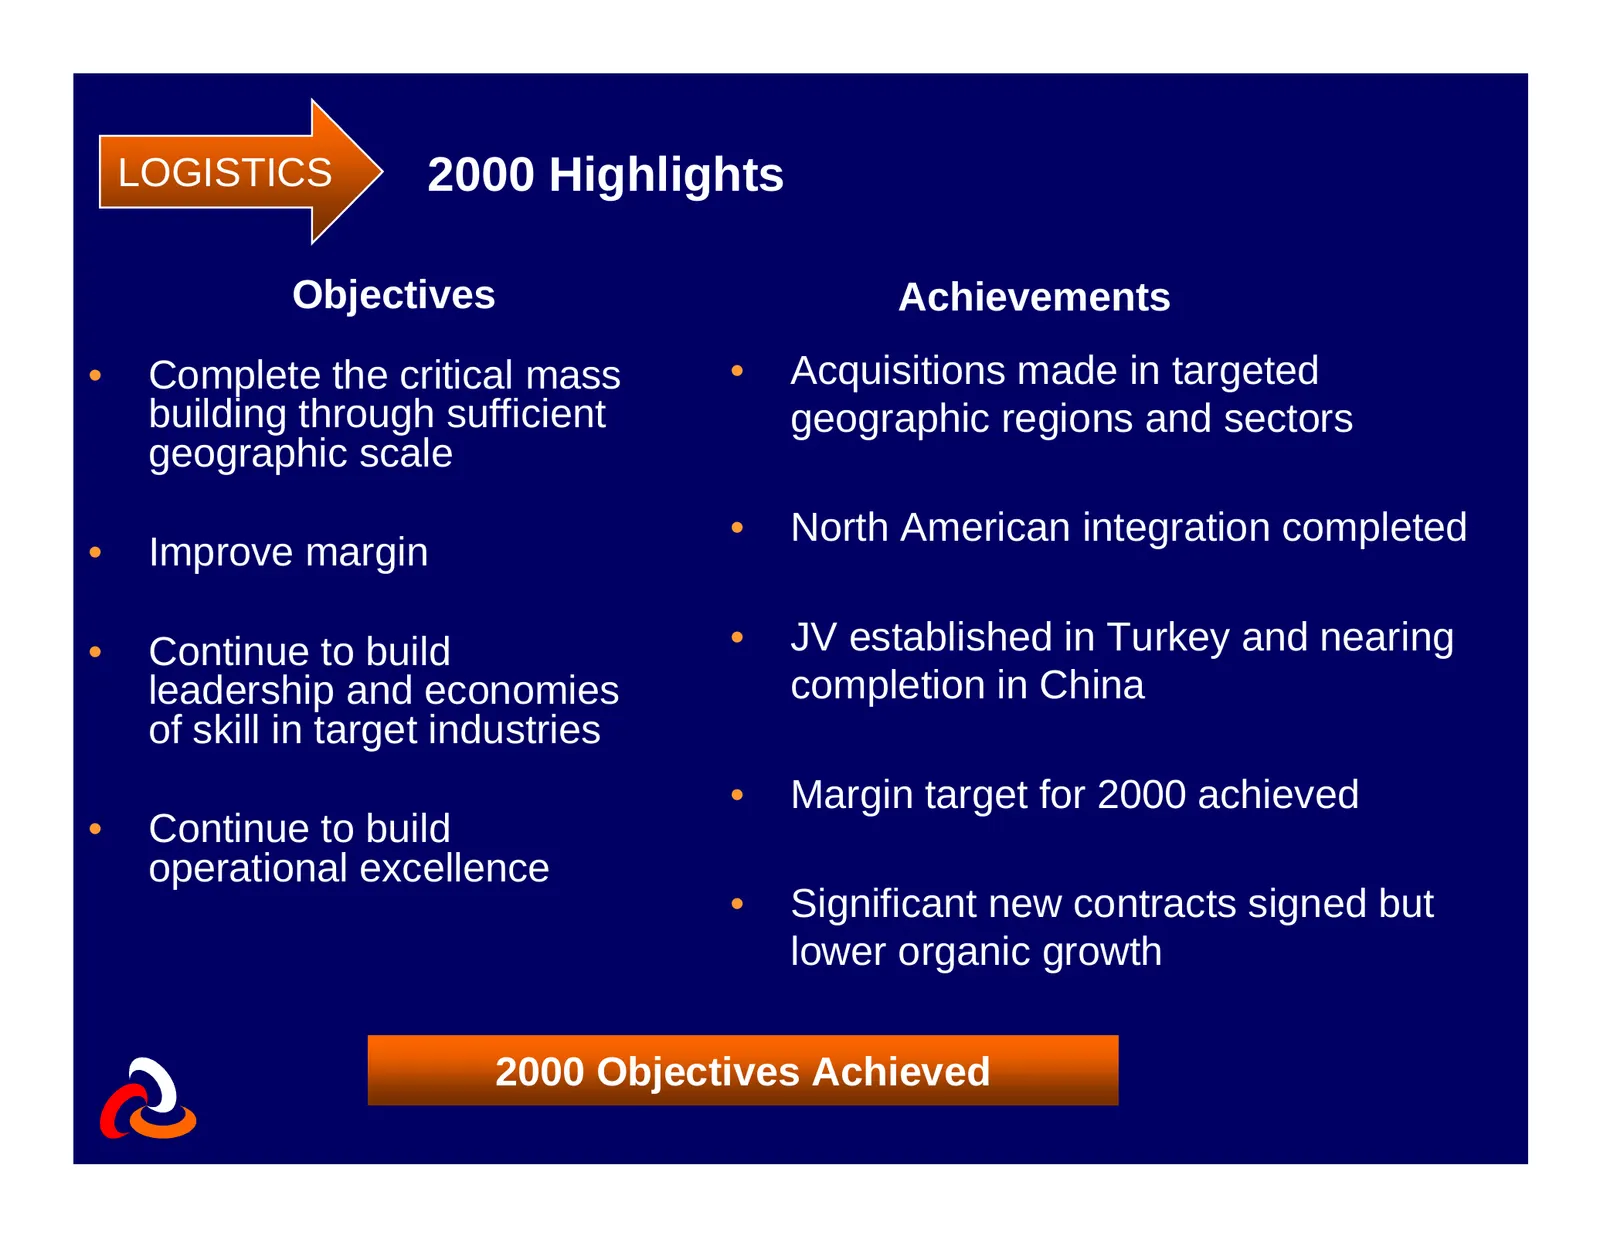
LOGISTICS 2000 Highlights Objectives Achievements • Complete the critical mass • Acquisitions made in targeted building through sufficient geographic regions and sectors geographic scale • North American integration completed • Improve margin • Continue to build • JV established in Turkey and nearin
Slide 19: Logistics new contracts pipeline is looking very healthy
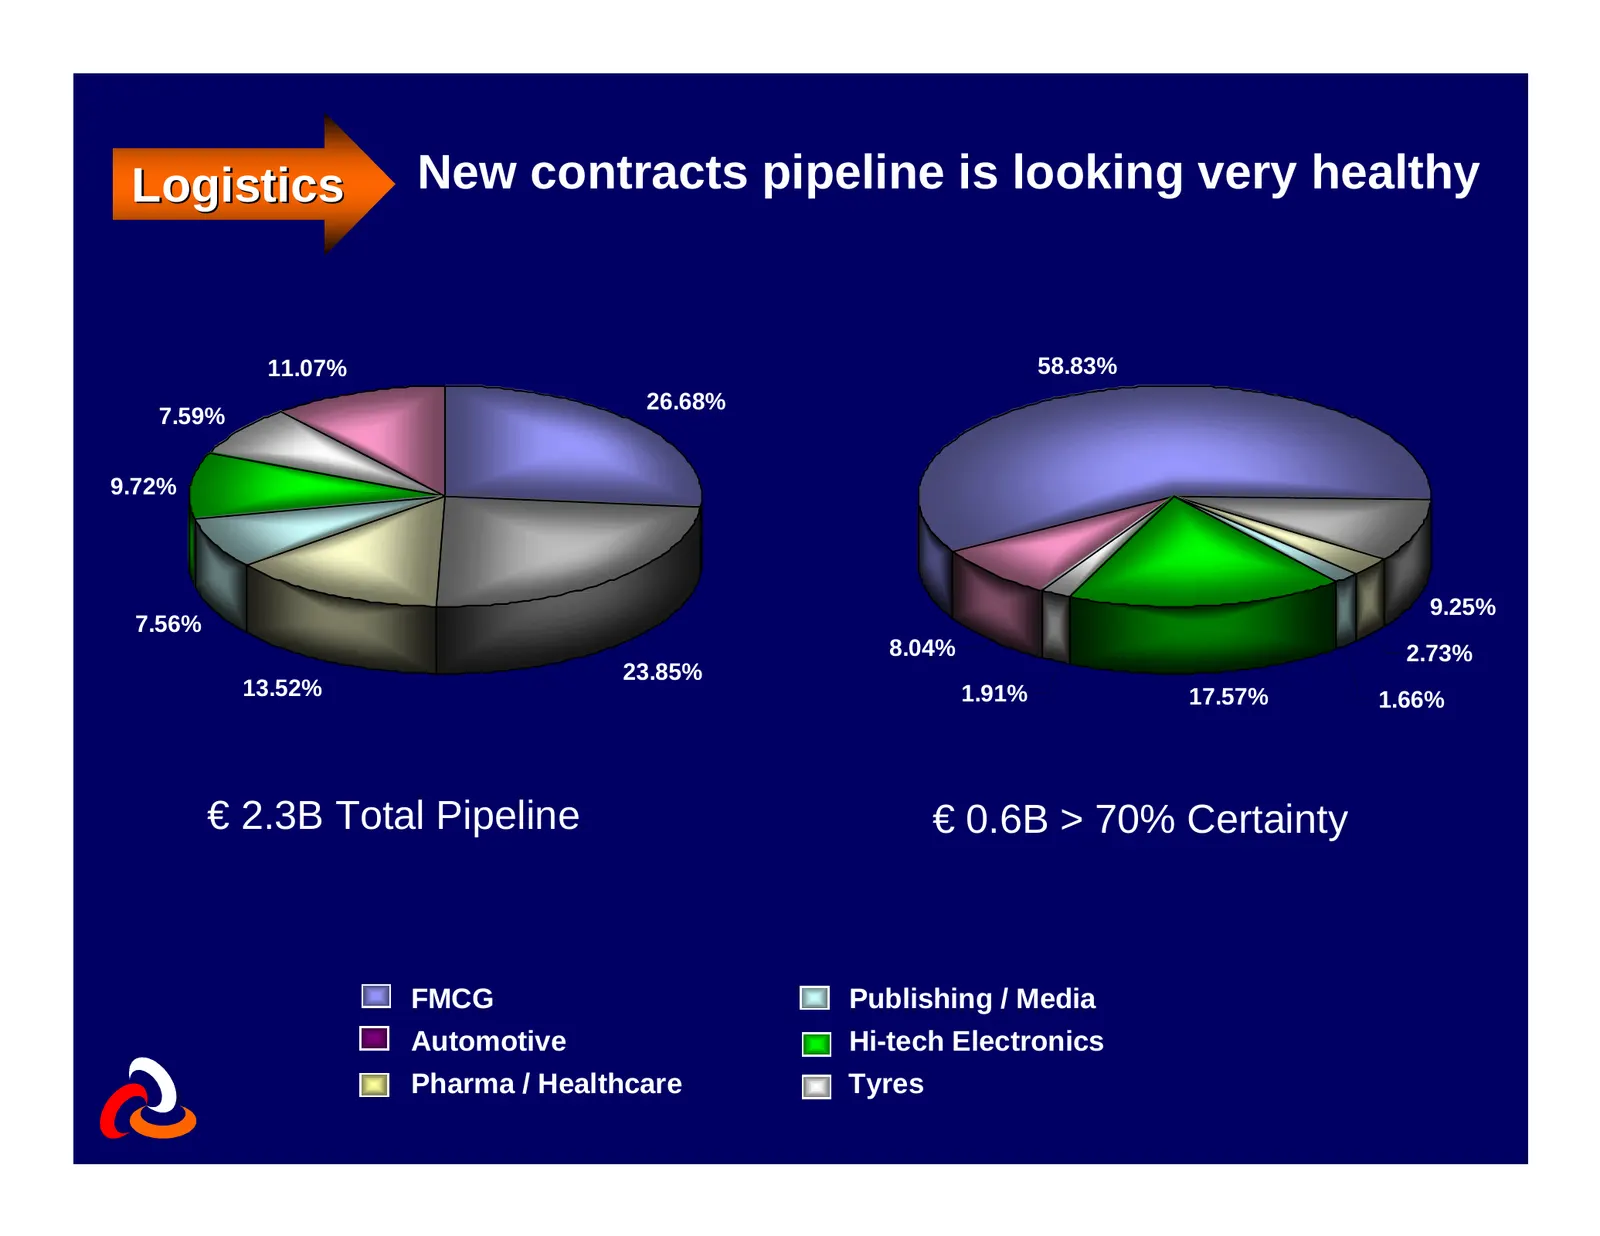
Logistics New contracts pipeline is looking very healthy 11.07% 58.83% 26.68% 7.59% 9.72% 9.25% 7.56% 8.04% 2.73% 23.85% 13.52% 1.91% 17.57% 1.66% € 2.3B Total Pipeline € 0.6B > 70% Certainty FMCG Publishing / Media Automotive Hi-tech Electronics Pharma / Healthcare Tyres
Slide 20: North American integration successfully completed
LOGISTICS North American integration successfully completed • Integration of CTI into TNT North American operation completed • Rebranding of CTI accomplished • First commercial joint success under way • Leveraging of CTI technology across the group
Slide 21: Logistics Objectives 2001 and Outlook 2001
Logistics Objectives 2001 • Increase organic growth to around 15% • Further develop efficient high value technology applications and supply chain event management capabilities • Further strengthen critical mass in key countries • Continue development of individual industry sectors Outlook 2001 • Acq
Slide 22: Status of e-business initiatives
e-business Status of e-business initiatives • Development of Loop technology completed and handed over to divisions • e-back office masterplan framework agreed and pilots underway in each of the three divisions
Slide 23: Timeline for managing for value
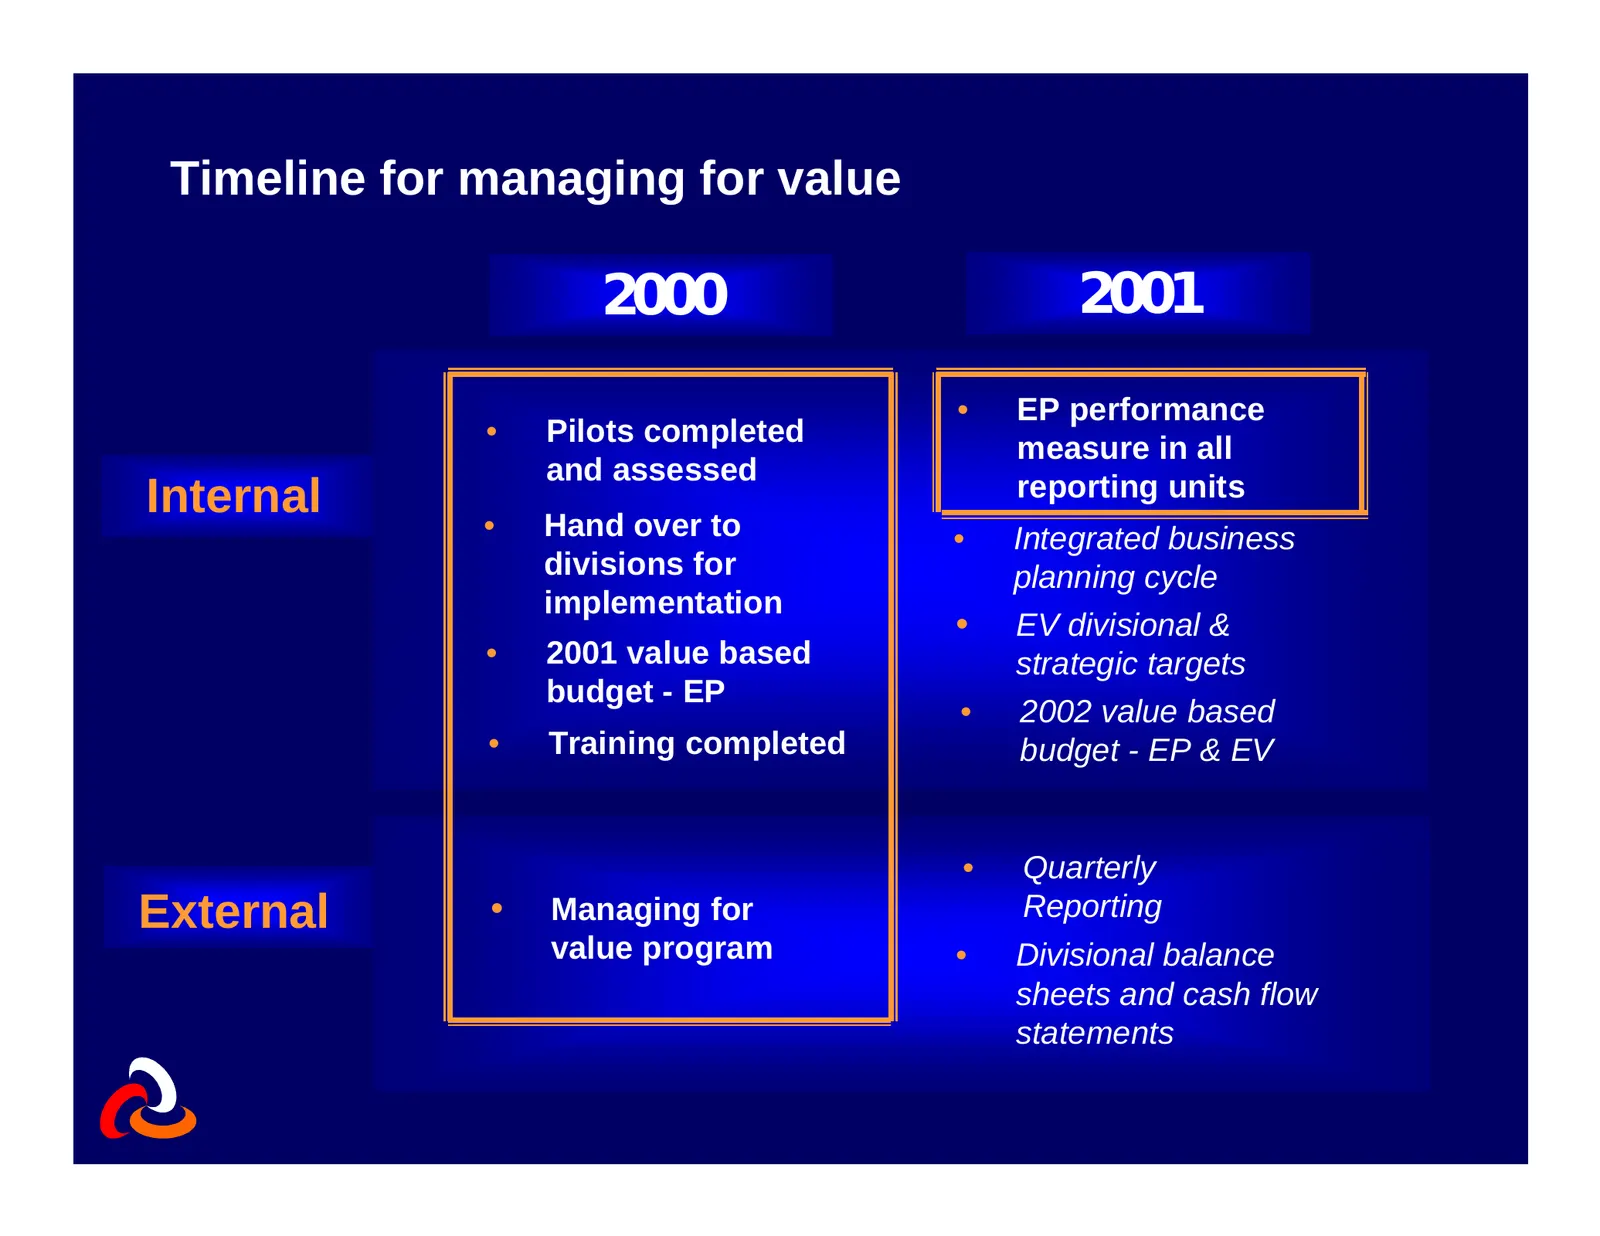
Timeline for managing for value 2000 2001 • EP performance • Pilots completed measure in all and assessed Internal reporting units • Hand over to • Integrated business divisions for planning cycle implementation • EV divisional & • 2001 value based strategic targets budget - EP • 2002 value based •
Slide 24: Focus areas for management in 2001
Focus areas for management in 2001 • Mail: Implement Cost Flexibilisation Plan for the Netherlands • Mail: Realise first steps of accelerated expansion in Value Added Services and International Networks • Express: Reach for 6,0% ROS for full year • Logistics: Get organic growth back to 15% level • G
Slide 25: Outlook 2001
Outlook 2001 • Net income growth in 2000 from continued operations was 22% (€ 511m) • Restated for the changes in accounting policies, net income in 2000 was € 458m • For 2001, TPG expects a net income growth of 20-25% (on a restated basis)
Slide 26: Excellent full year results
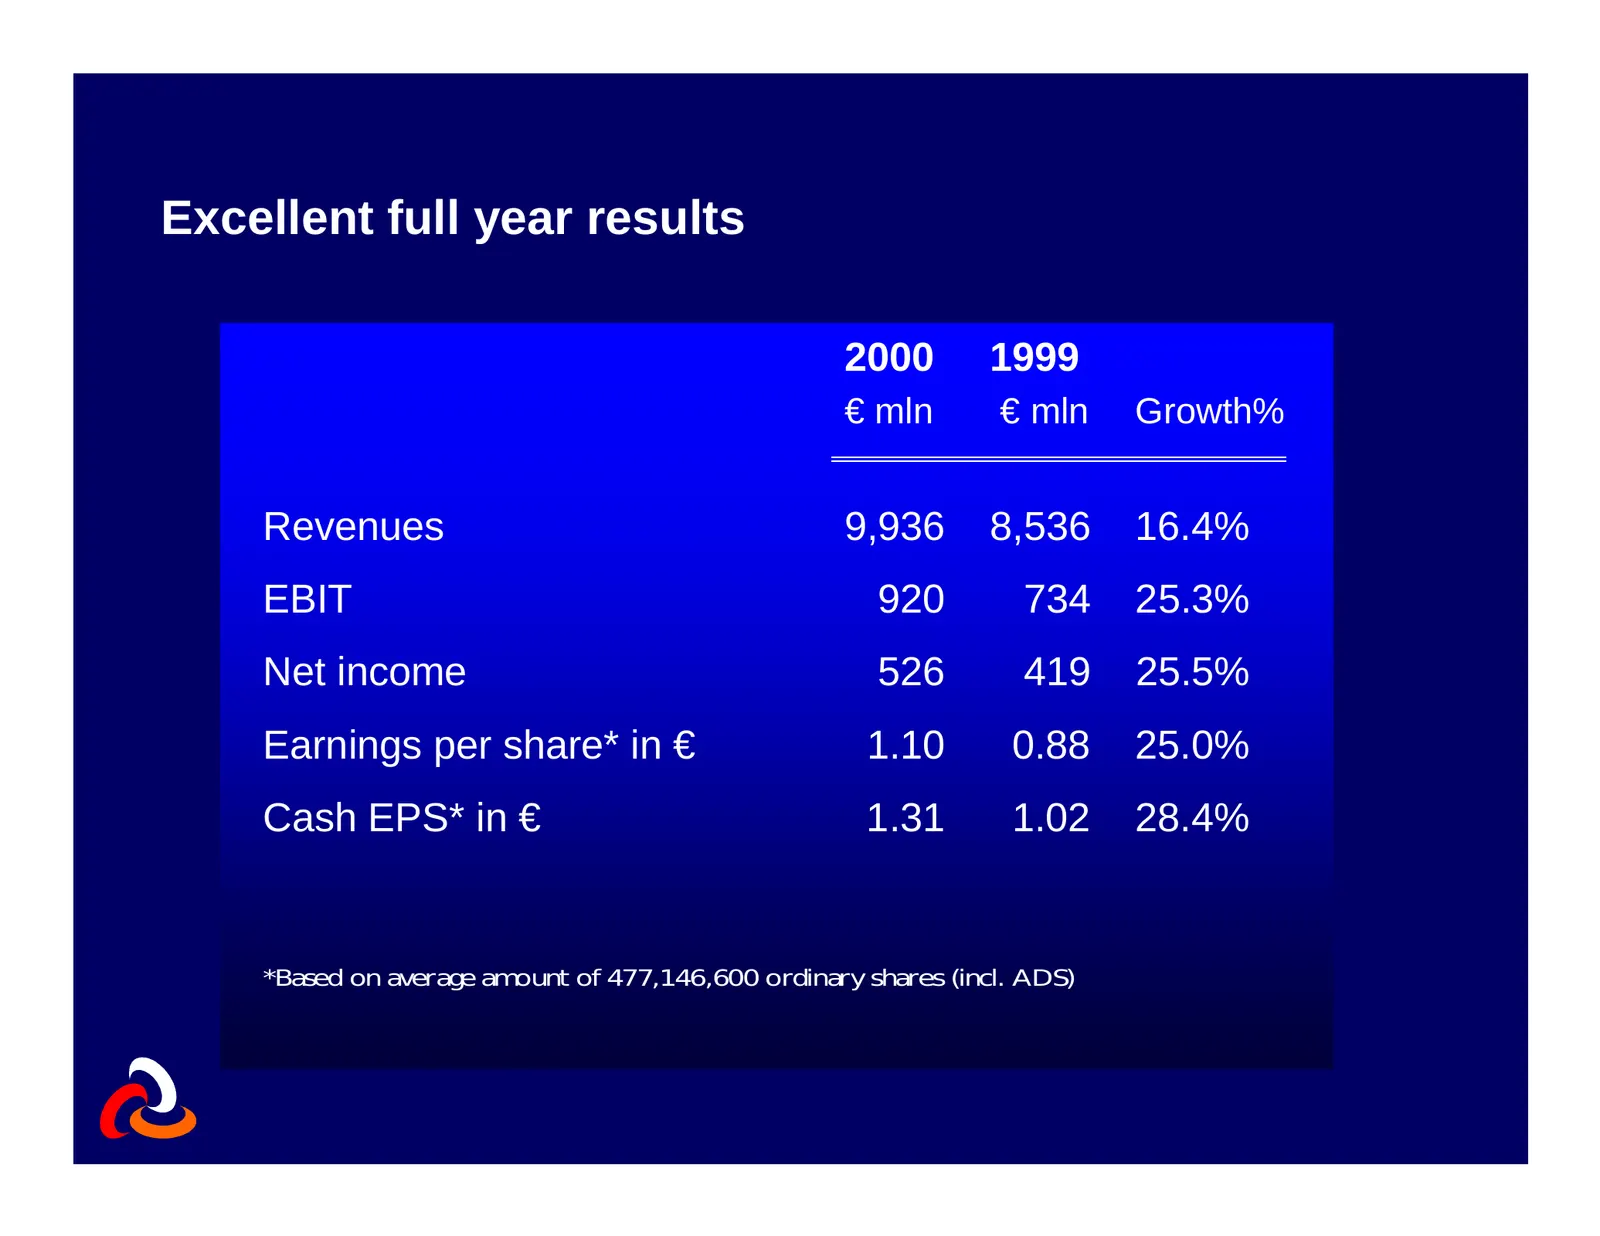
Excellent full year results 2000 1999 € mln € mln Growth% Revenues 9,936 8,536 16.4% EBIT 920 734 25.3% Net income 526 419 25.5% Earnings per share* in € 1.10 0.88 25.0% Cash EPS* in € 1.31 1.02 28.4% *Based on average amount of 477,146,600 ordinary shares (incl. ADS)
Slide 27: Group revenue growth
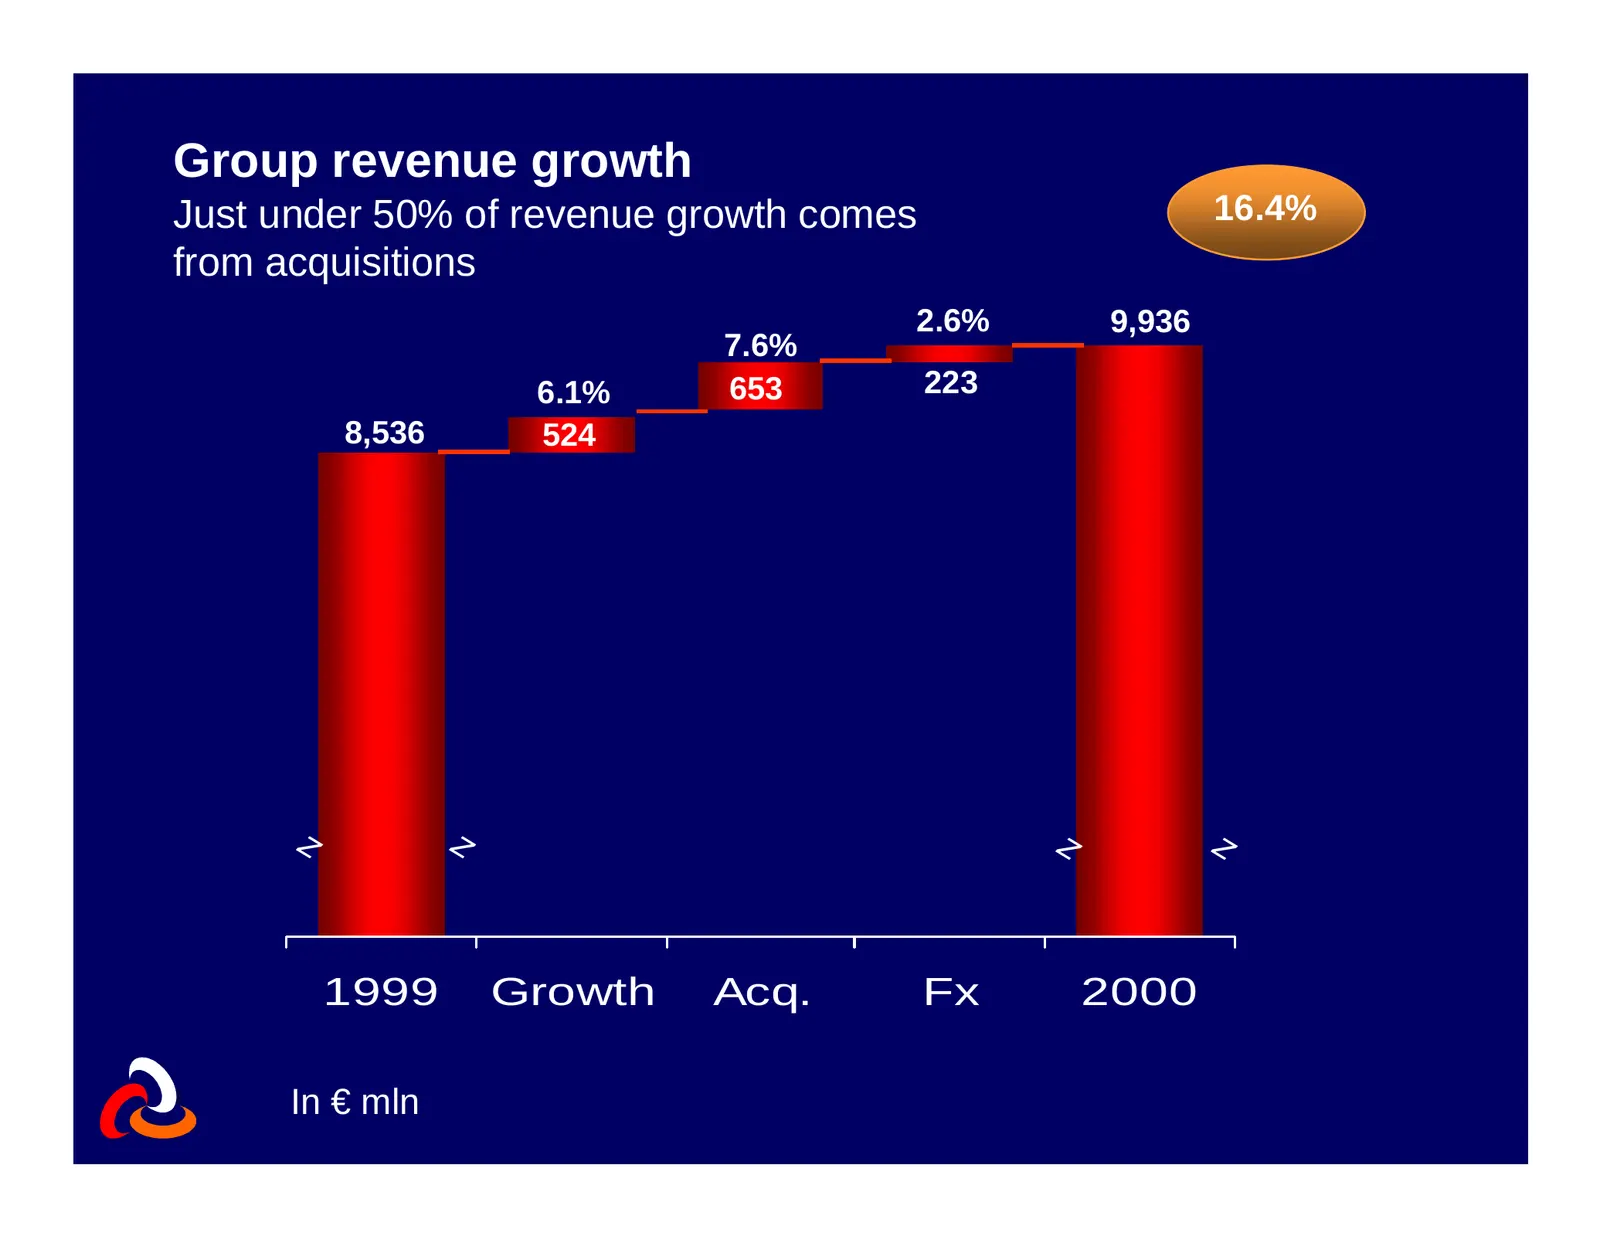
Group revenue growth Just under 50% of revenue growth comes 16.4% from acquisitions 2.6% 9,936 7.6% 6.1% 653 223 8,536 524 z z z z 1999 Growth Acq. Fx 2000 In € mln
Slide 28: Group revenues by region
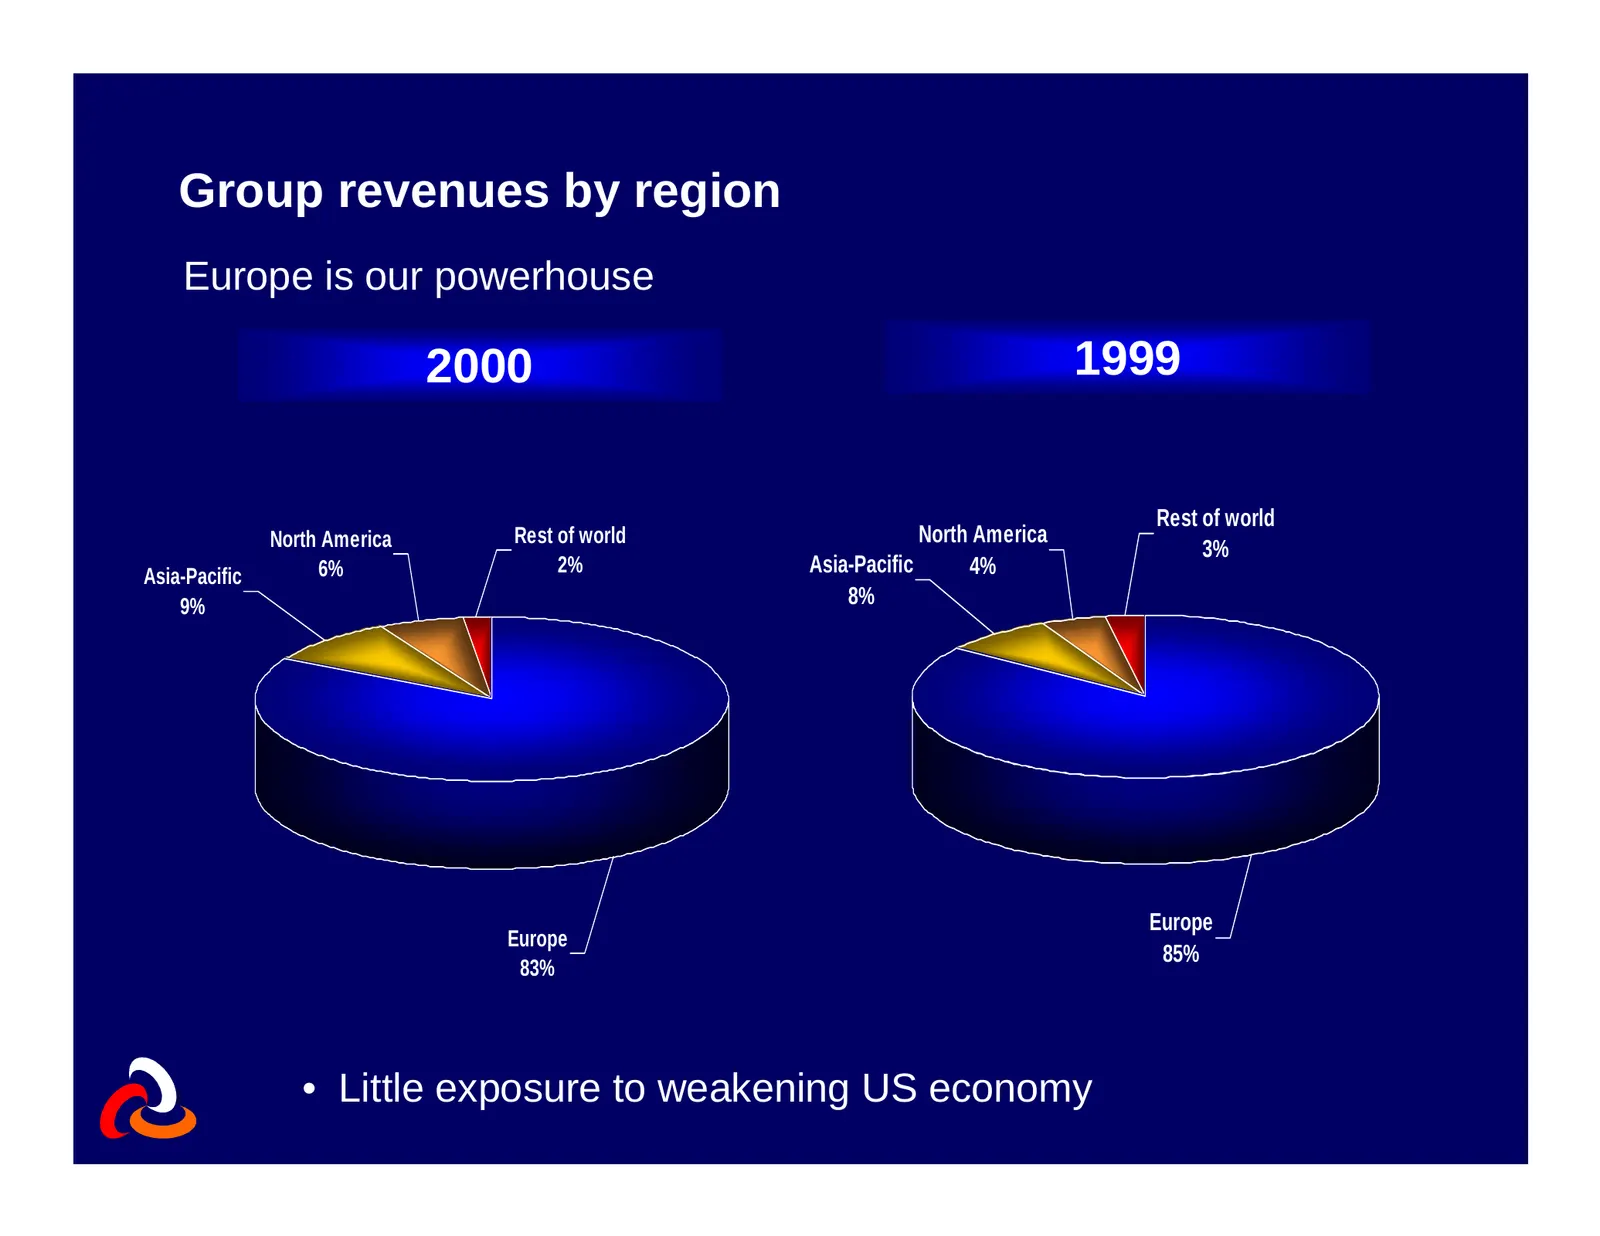
Group revenues by region Europe is our powerhouse 2000 1999 Rest of world North America Rest of world North America 3% Asia-Pacific 6% 2% Asia-Pacific 4% 9% 8% Europe Europe 85% 83% • Little exposure to weakening US economy
Slide 29: Mail Revenue Growth
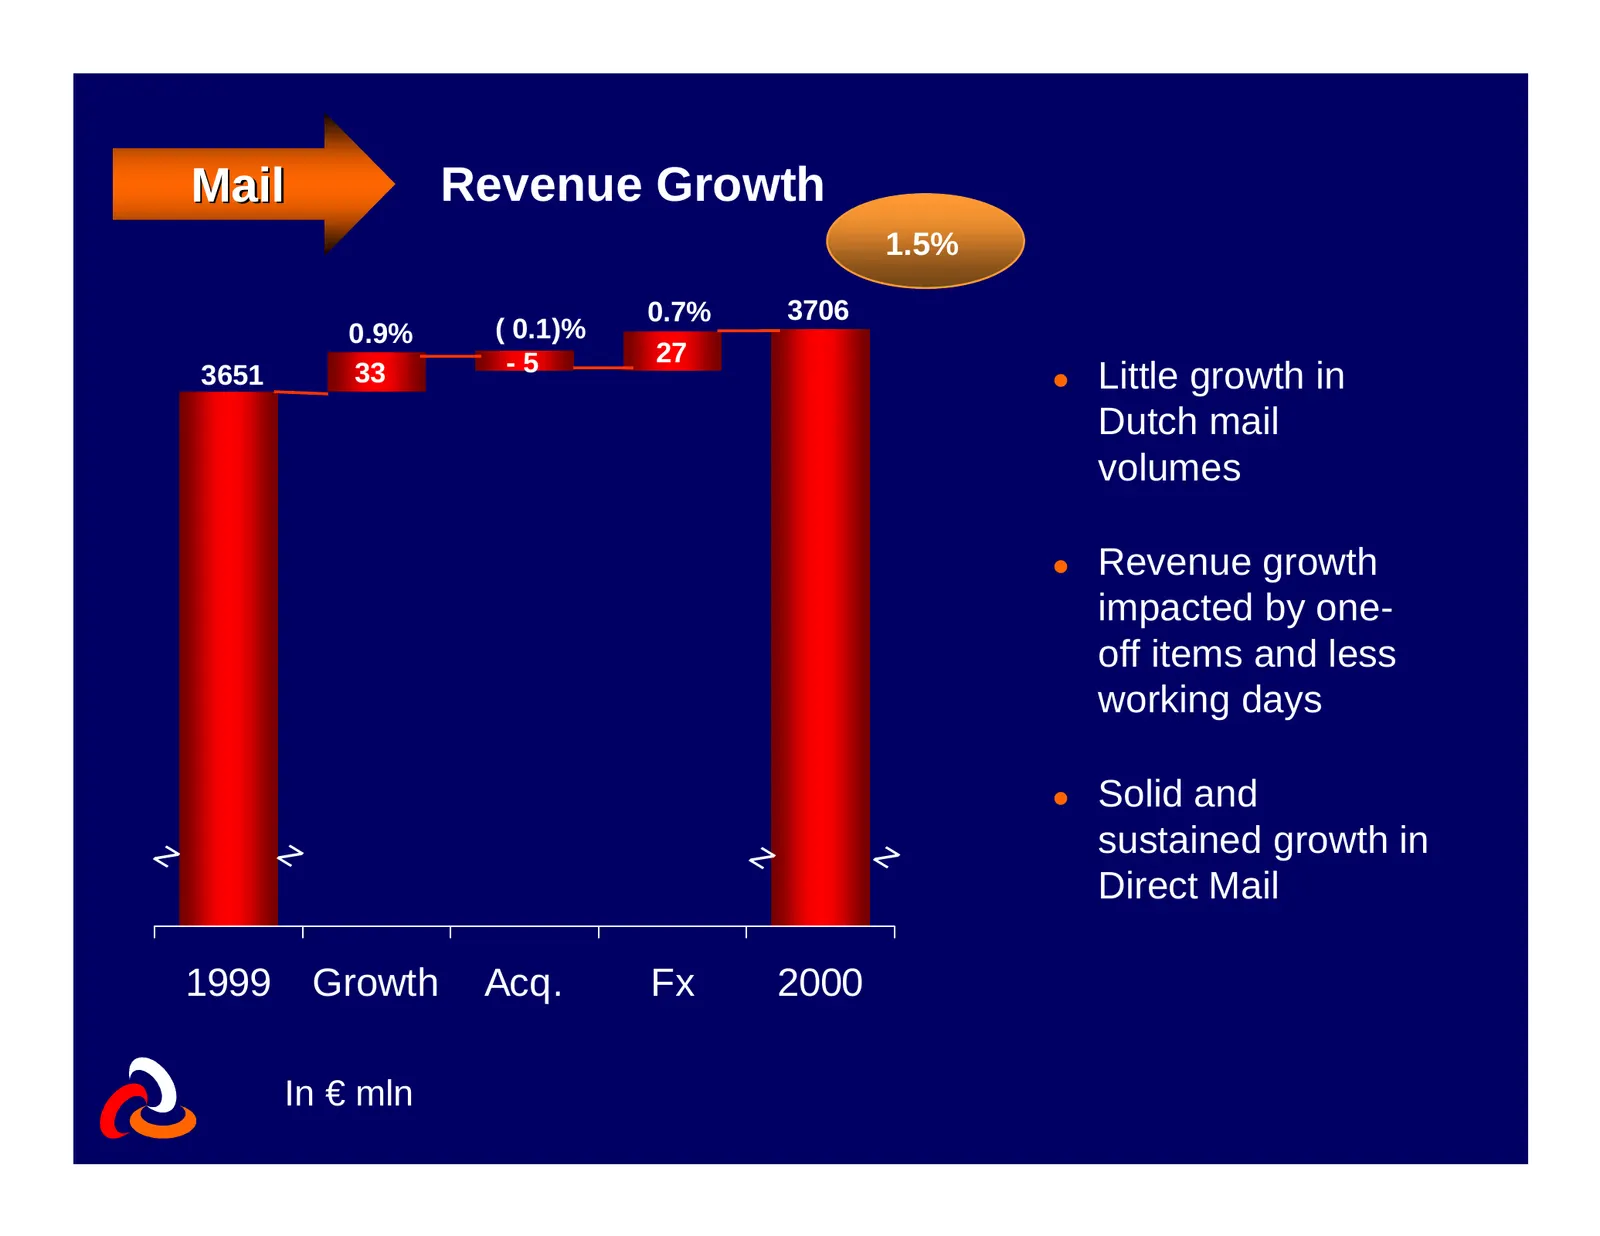
Mail Revenue Growth 1.5% 0.7% 3706 0.9% ( 0.1)% -5 27 3651 33 l Little growth in Dutch mail volumes l Revenue growth impacted by one- off items and less working days l Solid and z z z z sustained growth in Direct Mail 1999 Growth Acq. Fx 2000 In € mln
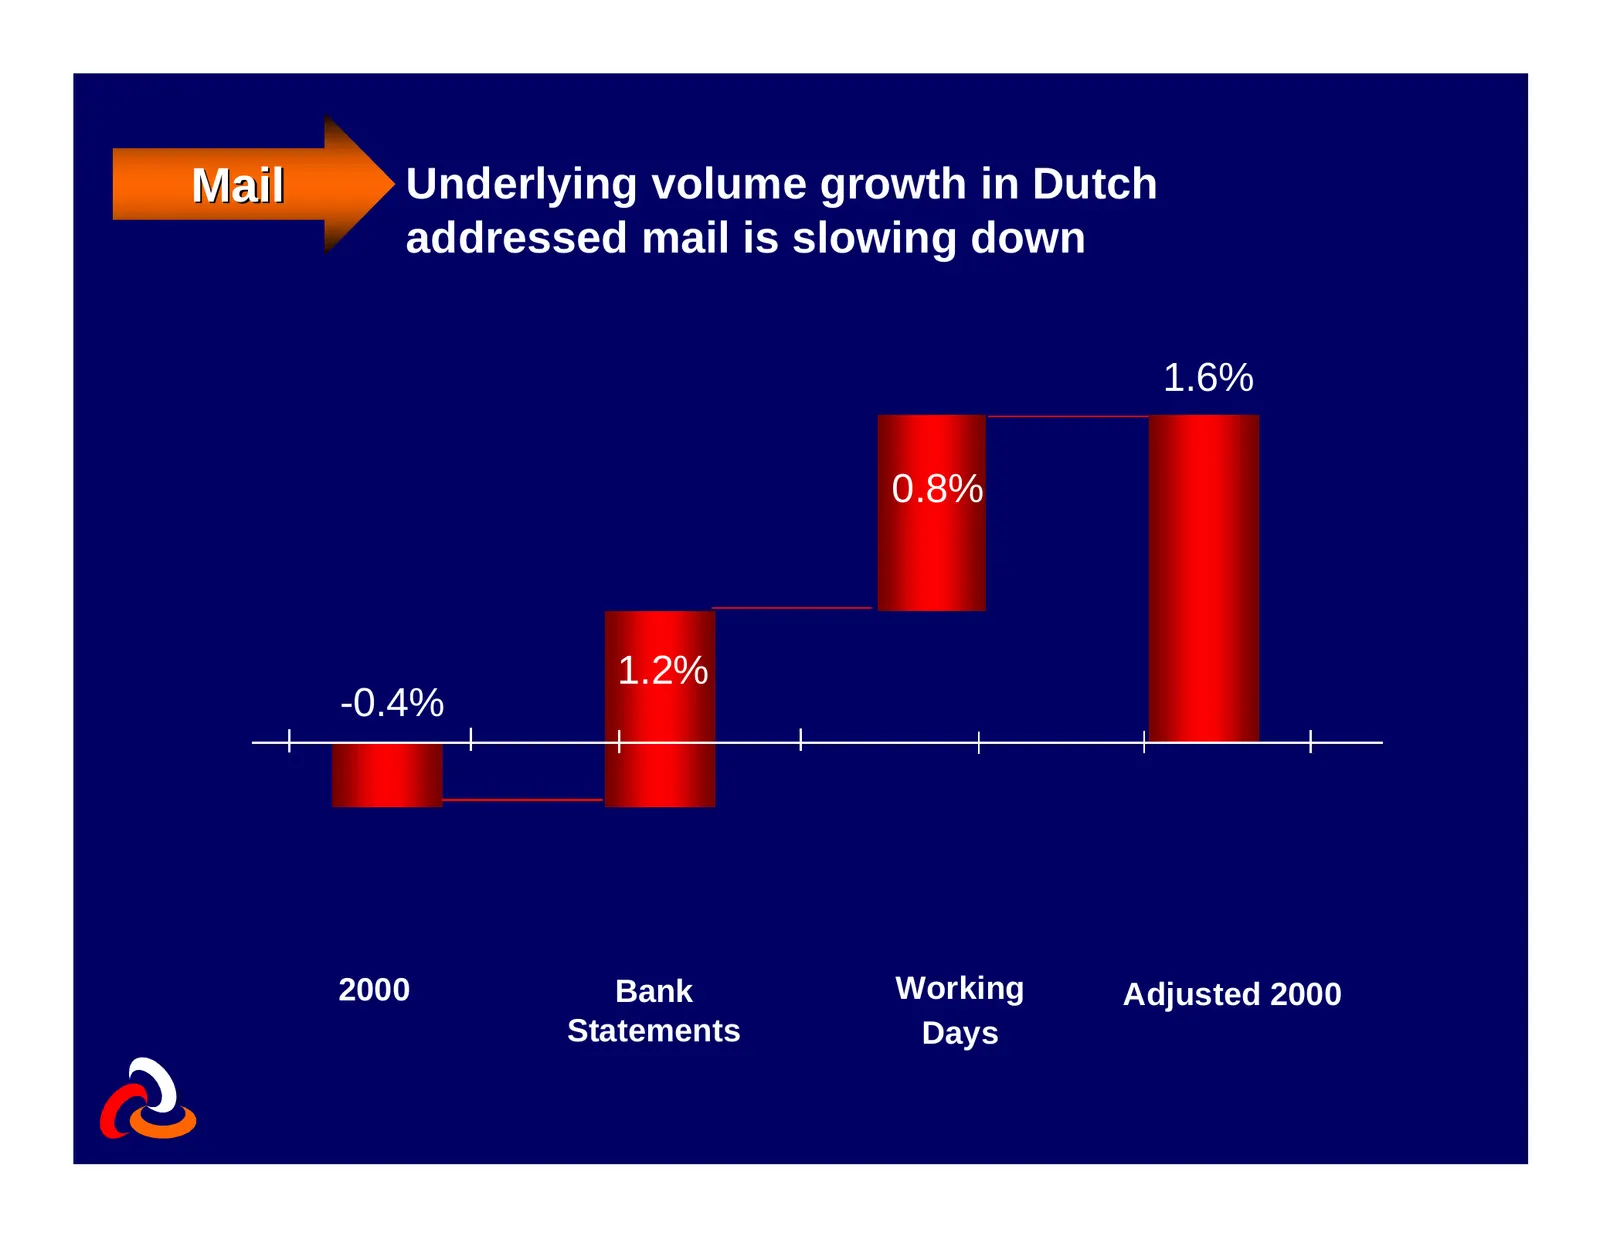
Slide 30: Underlying volume growth in Dutch addressed mail is slowing down
Mail Underlying volume growth in Dutch addressed mail is slowing down 1.6% 0.8% 1.2% -0.4% 2000 Bank Working Adjusted 2000 Statements Days
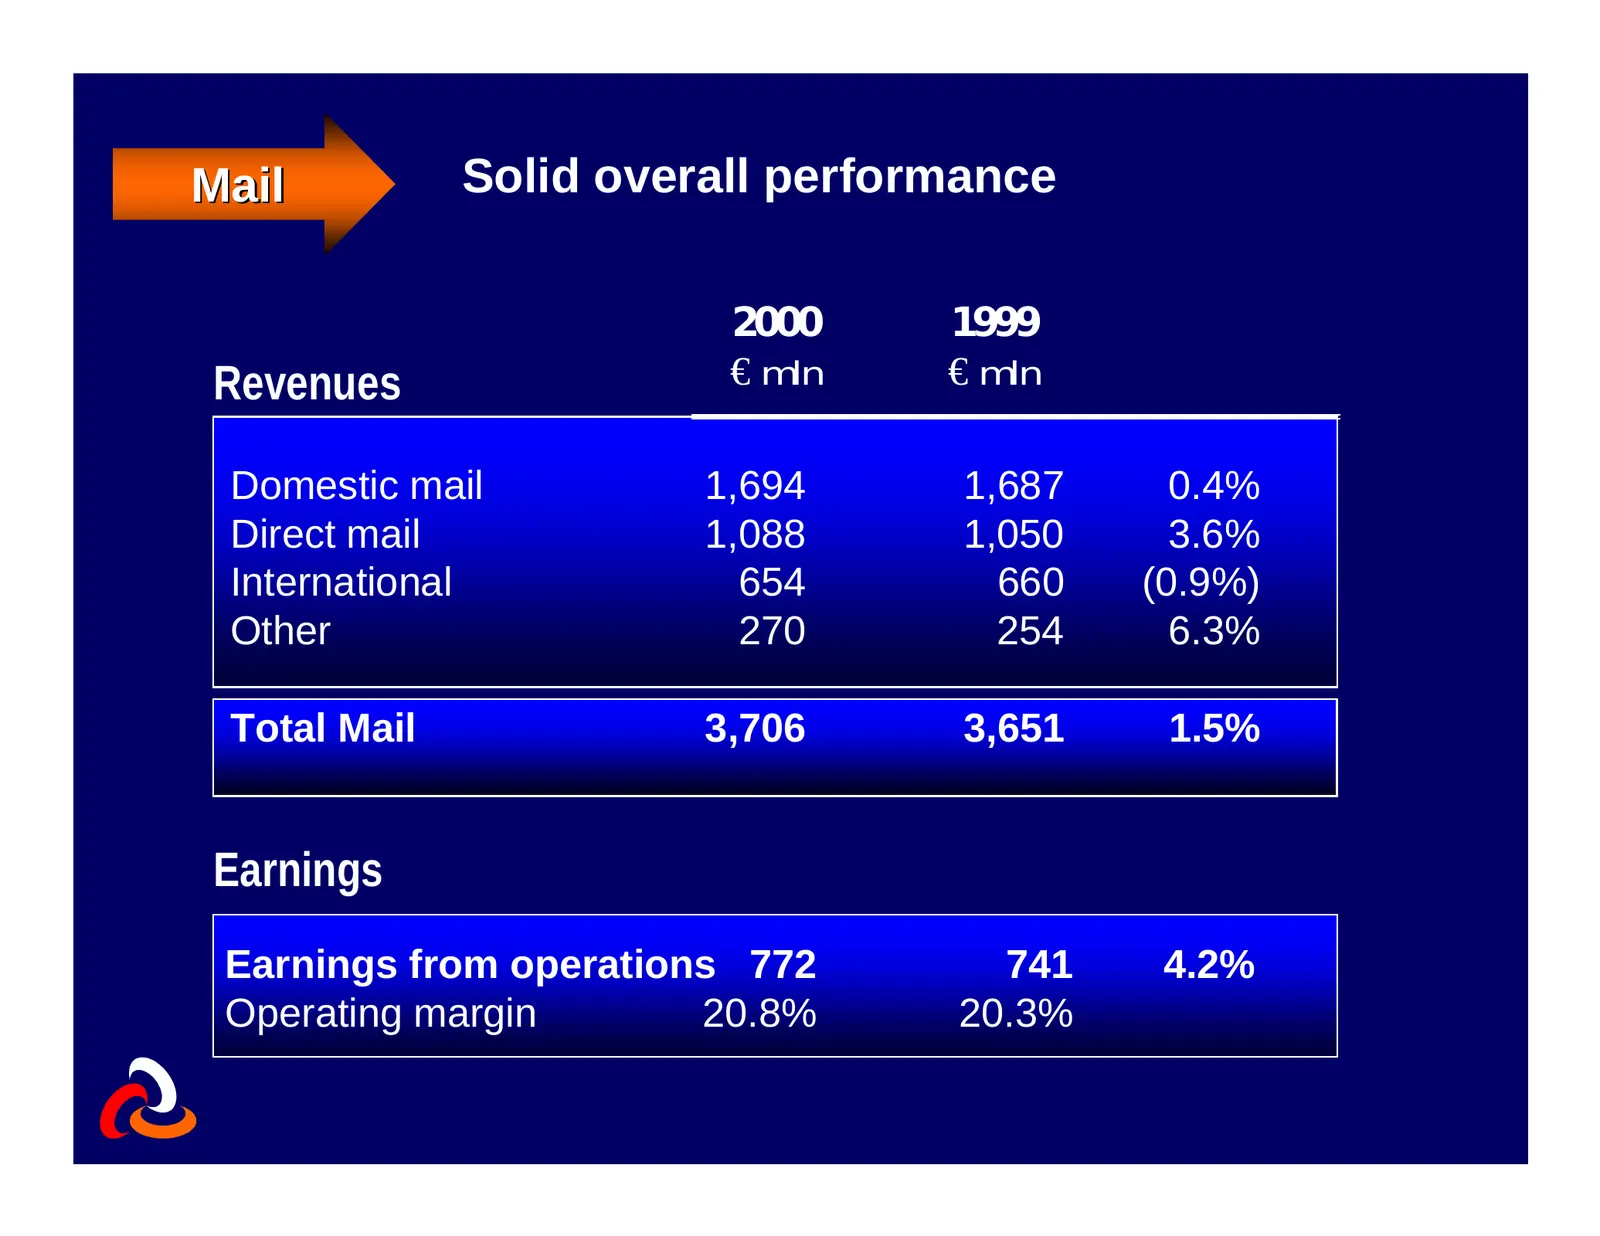
Slide 31: Mail Solid overall performance
Mail Solid overall performance 2000 1999 Revenues € mln € mln Domestic mail 1,694 1,687 0.4% Direct mail 1,088 1,050 3.6% International 654 660 (0.9%) Other 270 254 6.3% Total Mail 3,706 3,651 1.5% Earnings Earnings from operations 772 741 4.2% Operating margin 20.8% 20.3%
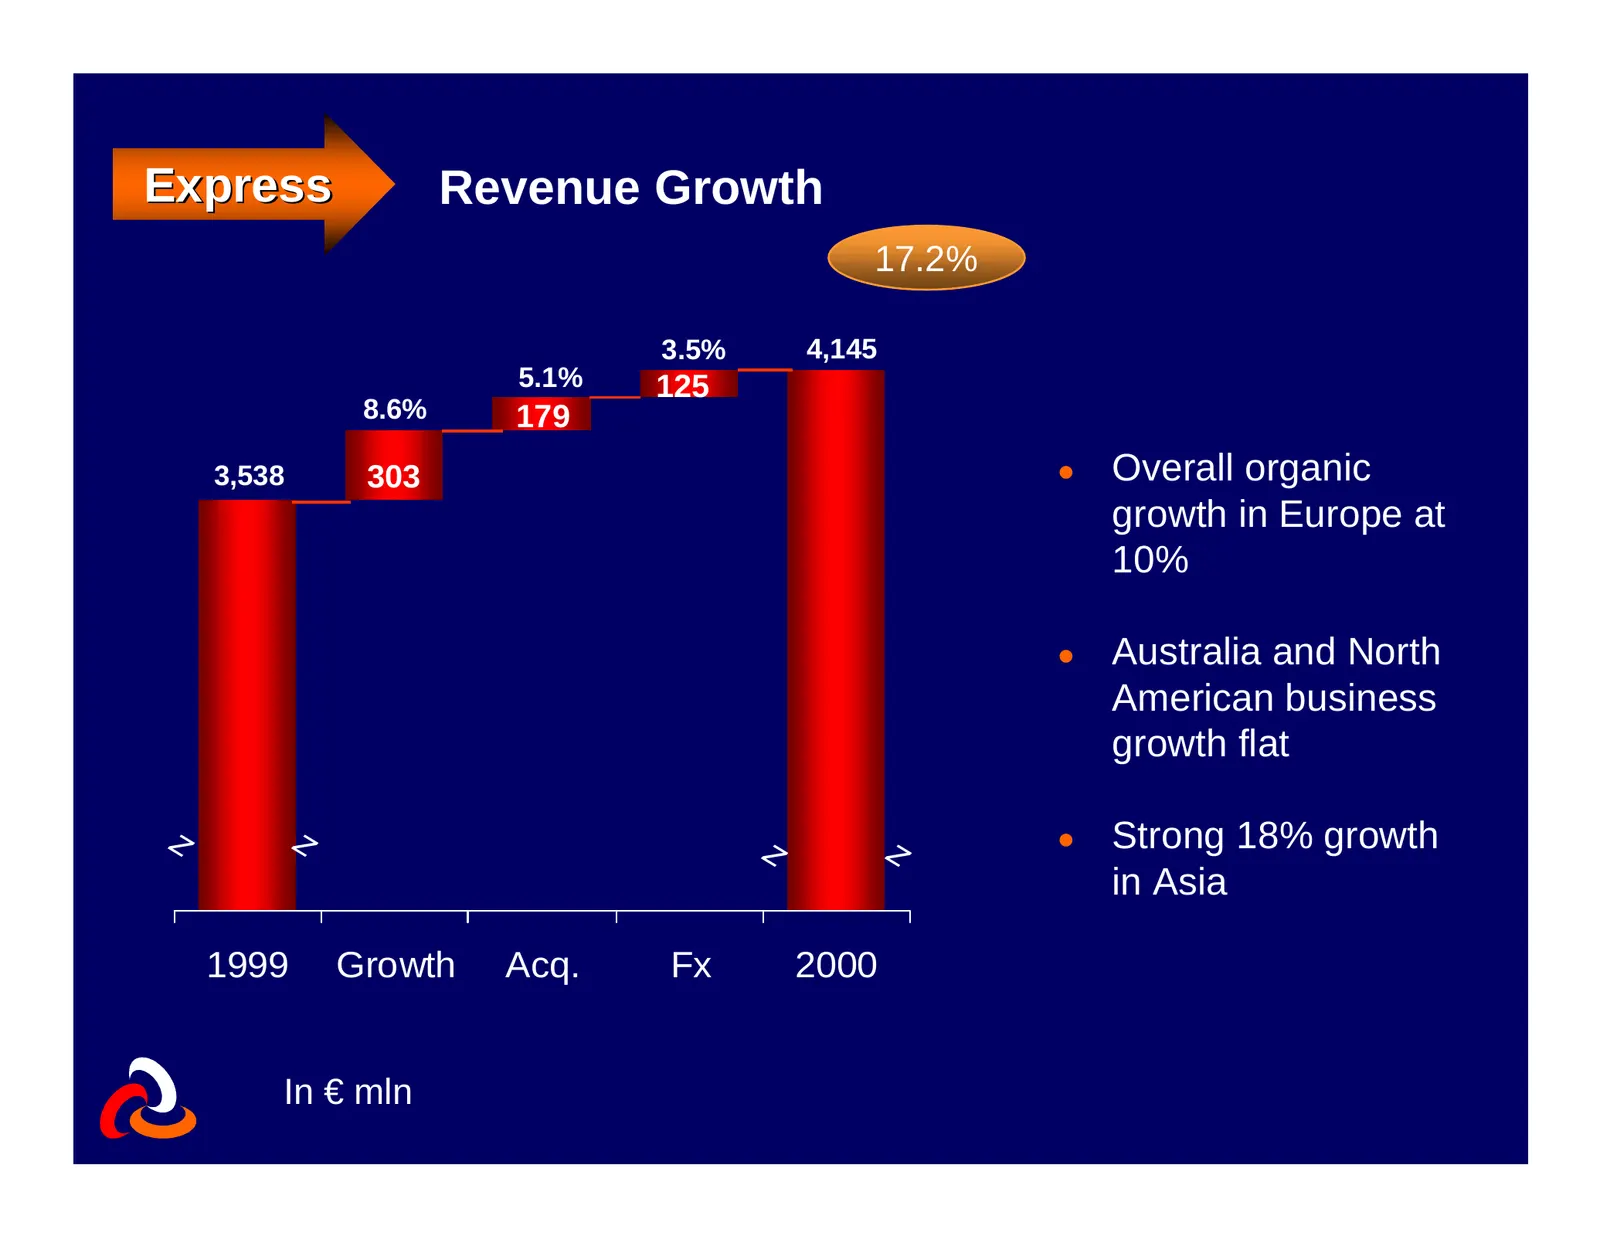
Slide 32: Express Revenue Growth
Express Revenue Growth 17.2% 3.5% 4,145 5.1% 125 8.6% 179 3,538 303 l Overall organic growth in Europe at 10% l Australia and North American business growth flat z z z z l Strong 18% growth in Asia 1999 Growth Acq. Fx 2000 In € mln
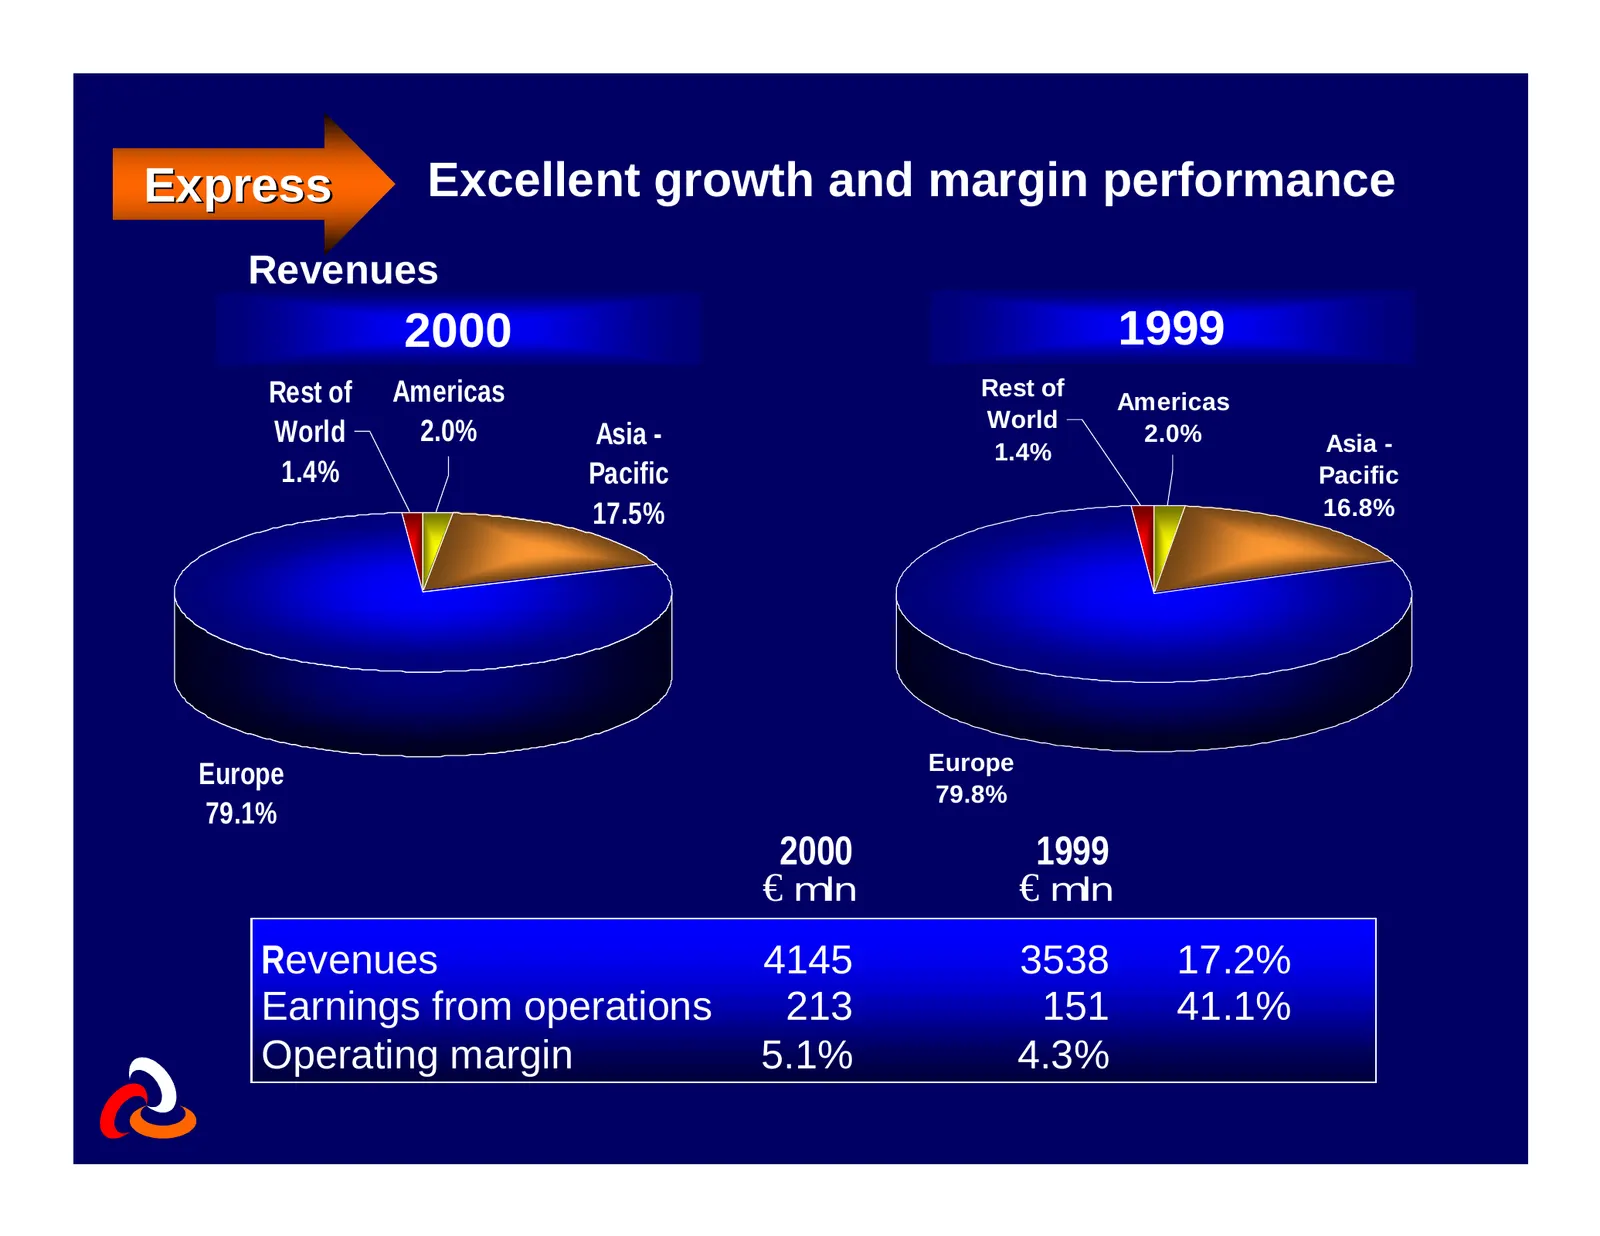
Slide 33: Express Excellent growth and margin performance
Express Excellent growth and margin performance Revenues 2000 1999 Rest of Americas Rest of Americas World World 2.0% Asia - 2.0% Asia - 1.4% 1.4% Pacific Pacific 17.5% 16.8% Europe Europe 79.8% 79.1% 2000 1999 € mln € mln Revenues 4145 3538 17.2% Earnings from operations 213 151 41.1% Operating mar
Slide 34: Express Reaping benefits of yield management program
Reaping benefits of Express yield management program 4.0% 3.0% 2.0% 1.0% 0.0% -1.0% Q1 '99 Q2 '99 Q3 '99 Q4 '99 Q1 '00 Q2 '00 Q3 '00 Q4 '00 -2.0% -3.0% -4.0% • Standard commercial policy introduced worldwide • Full tariff on all new business with smaller customers • Regular rate reviews using ABC to
Slide 35: Logistics Revenue Growth
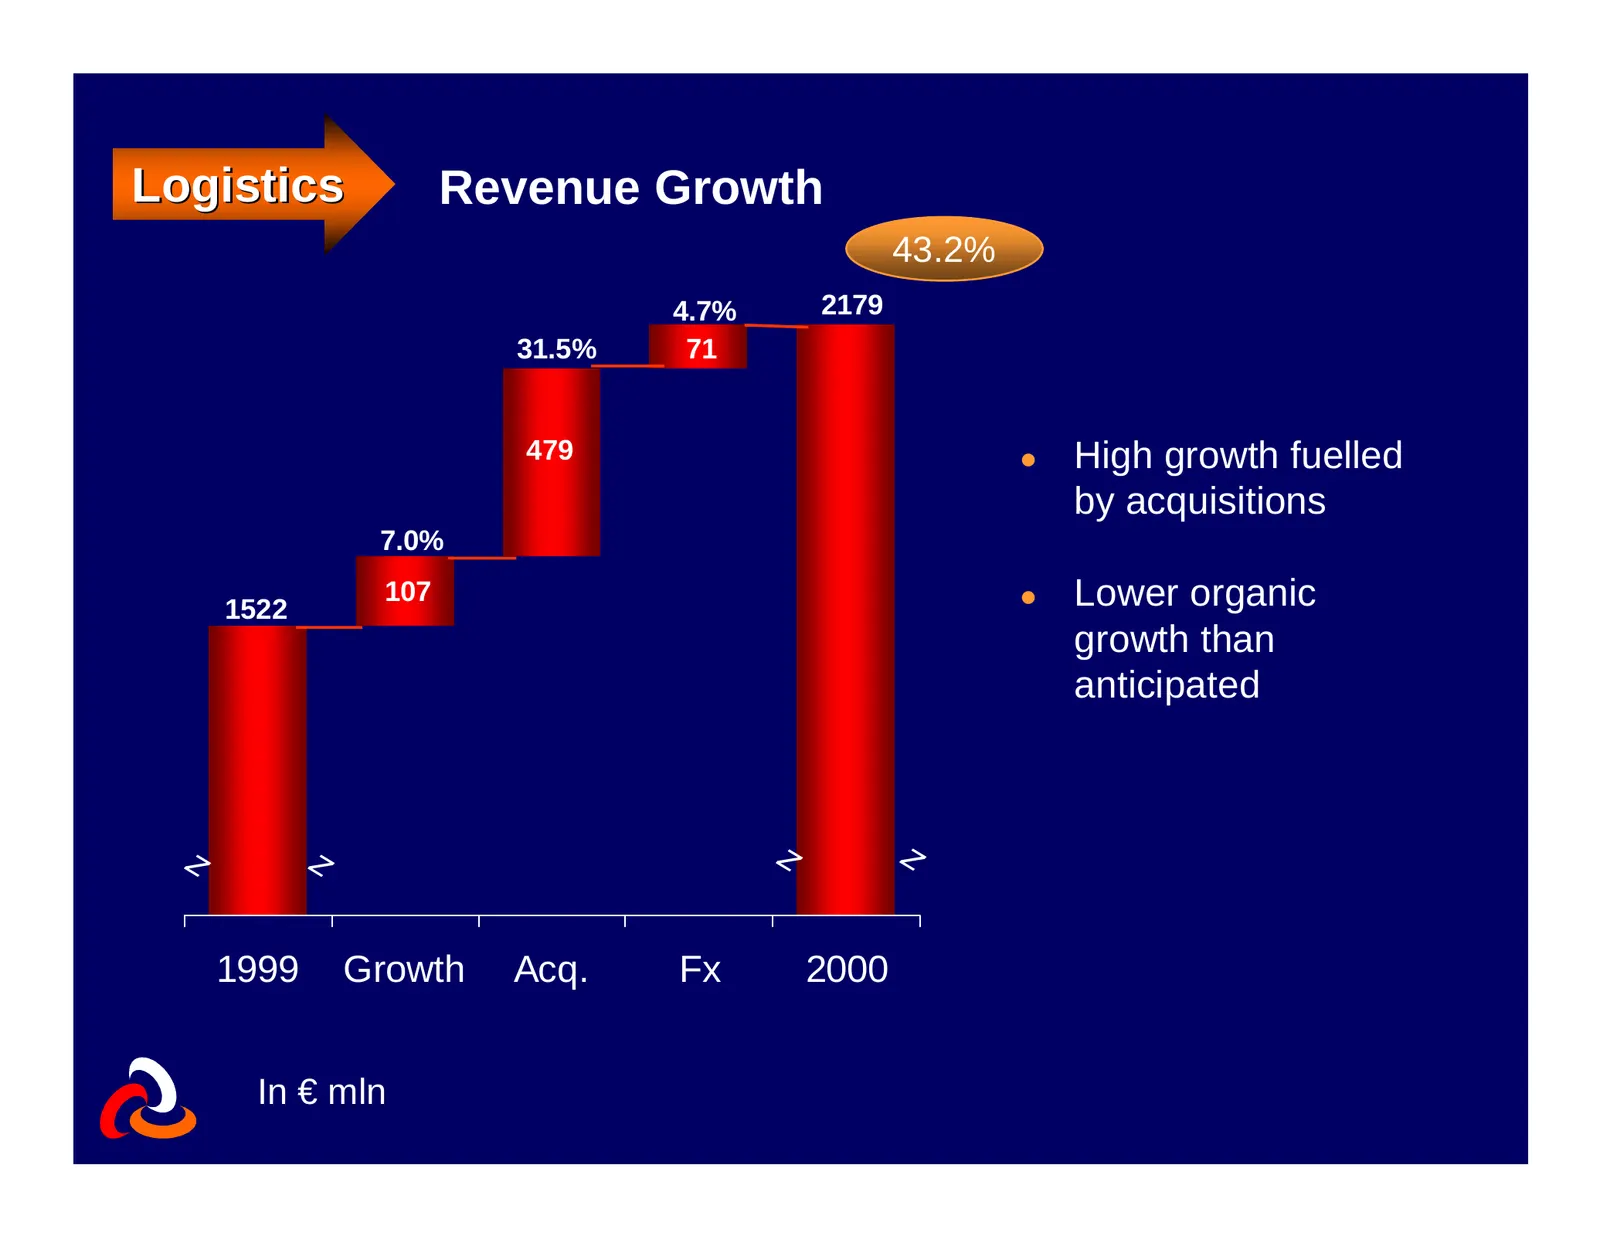
Logistics Revenue Growth 43.2% 4.7% 2179 31.5% 71 479 l High growth fuelled by acquisitions 7.0% 1522 107 l Lower organic growth than anticipated z z z z 1999 Growth Acq. Fx 2000 In € mln
Slide 36: Logistics Improving margins despite massive growth
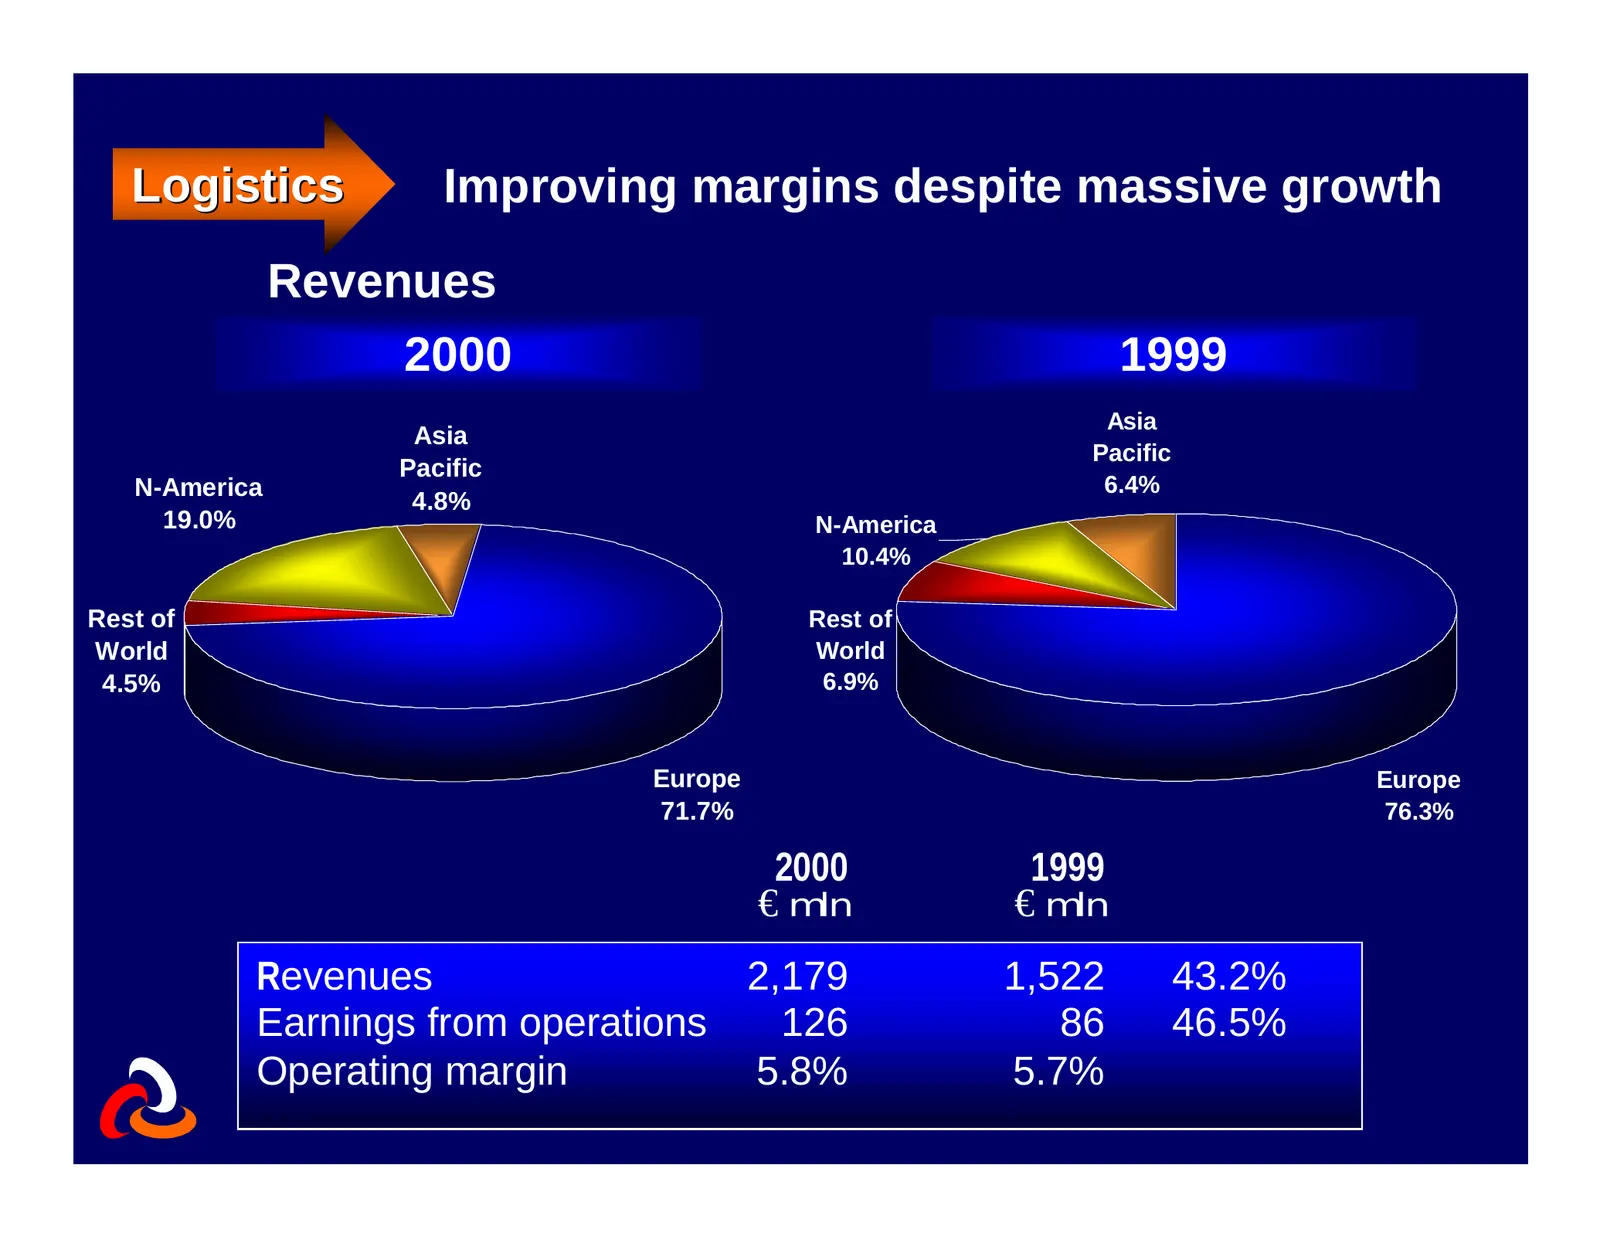
Logistics Improving margins despite massive growth Revenues 2000 1999 Asia Asia Pacific Pacific N-America 6.4% 4.8% 19.0% N-America 10.4% Rest of Rest of World World 4.5% 6.9% Europe Europe 71.7% 76.3% 2000 1999 € mln € mln Revenues 2,179 1,522 43.2% Earnings from operations 126 86 46.5% Operating m
Slide 37: Statement of income (1)
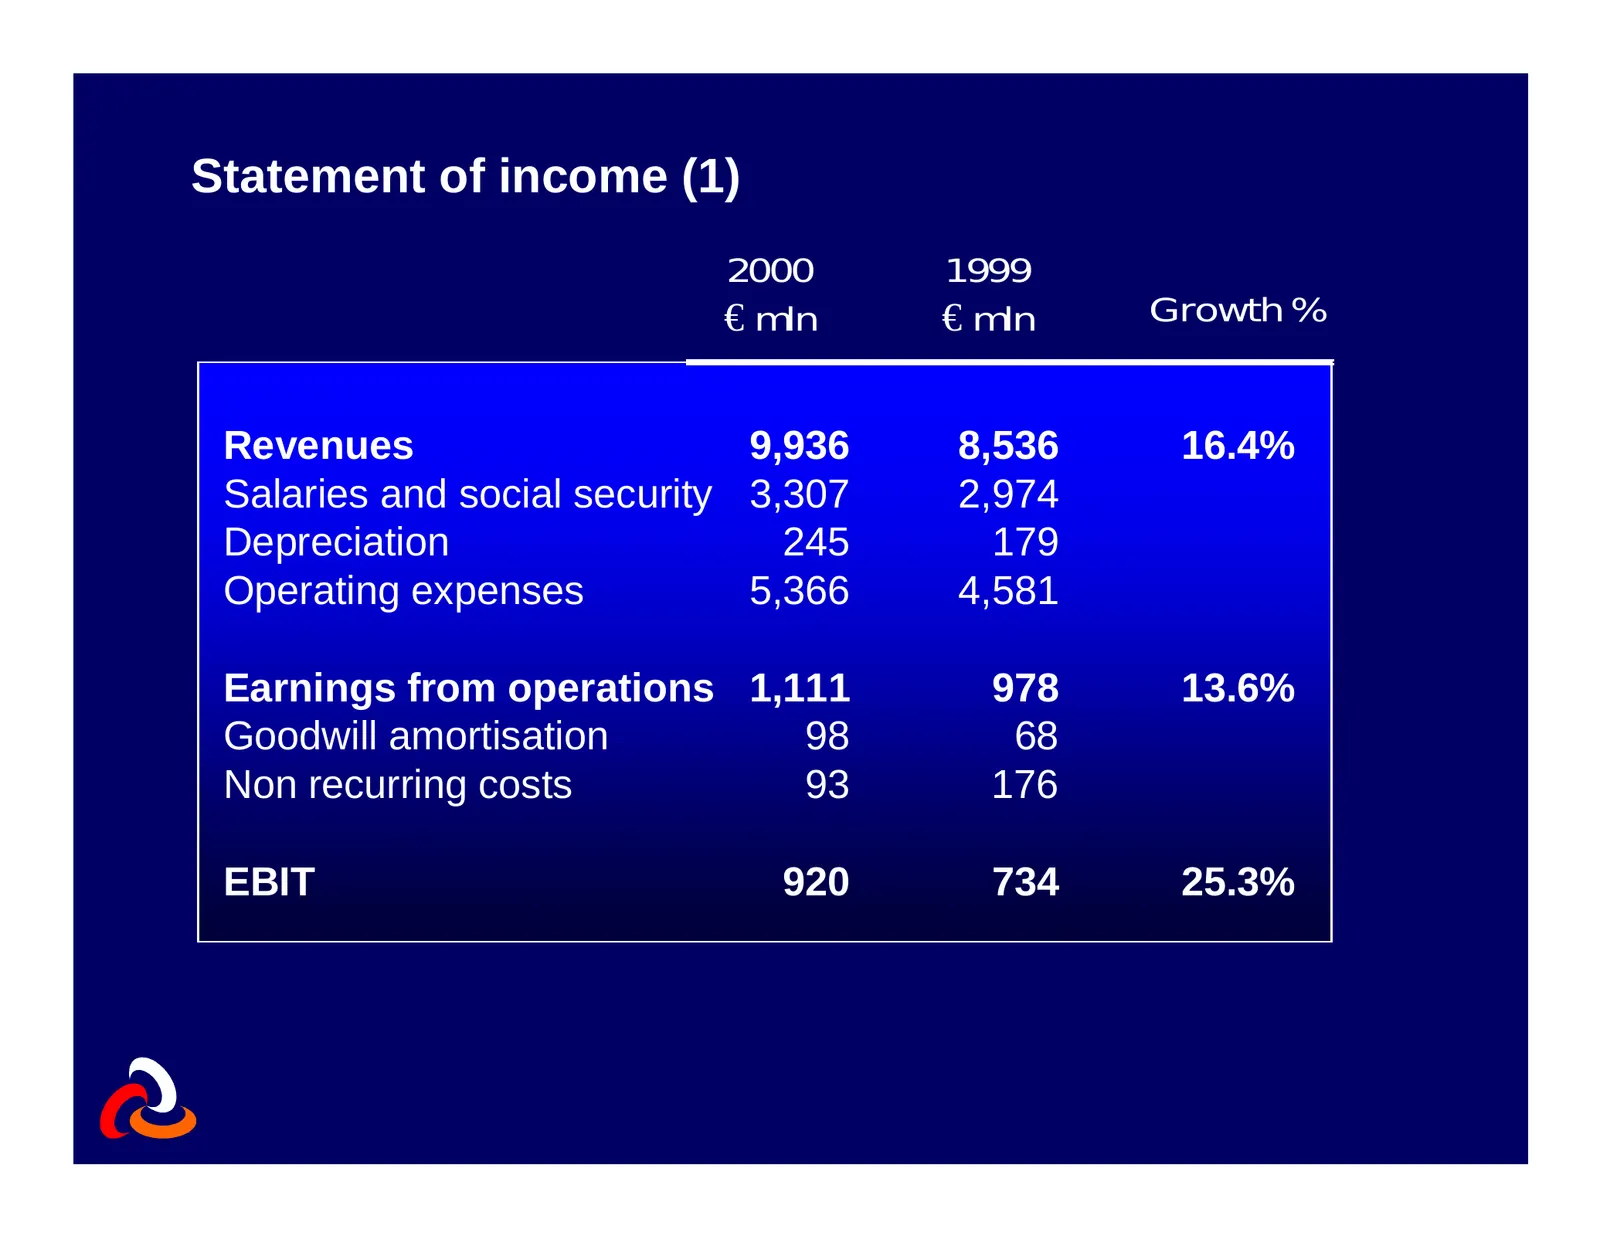
Statement of income (1) 2000 1999 € mln € mln Growth % Revenues 9,936 8,536 16.4% Salaries and social security 3,307 2,974 Depreciation 245 179 Operating expenses 5,366 4,581 Earnings from operations 1,111 978 13.6% Goodwill amortisation 98 68 Non recurring costs 93 176 EBIT 920 734 25.3%
Slide 38: Statement of income (2)
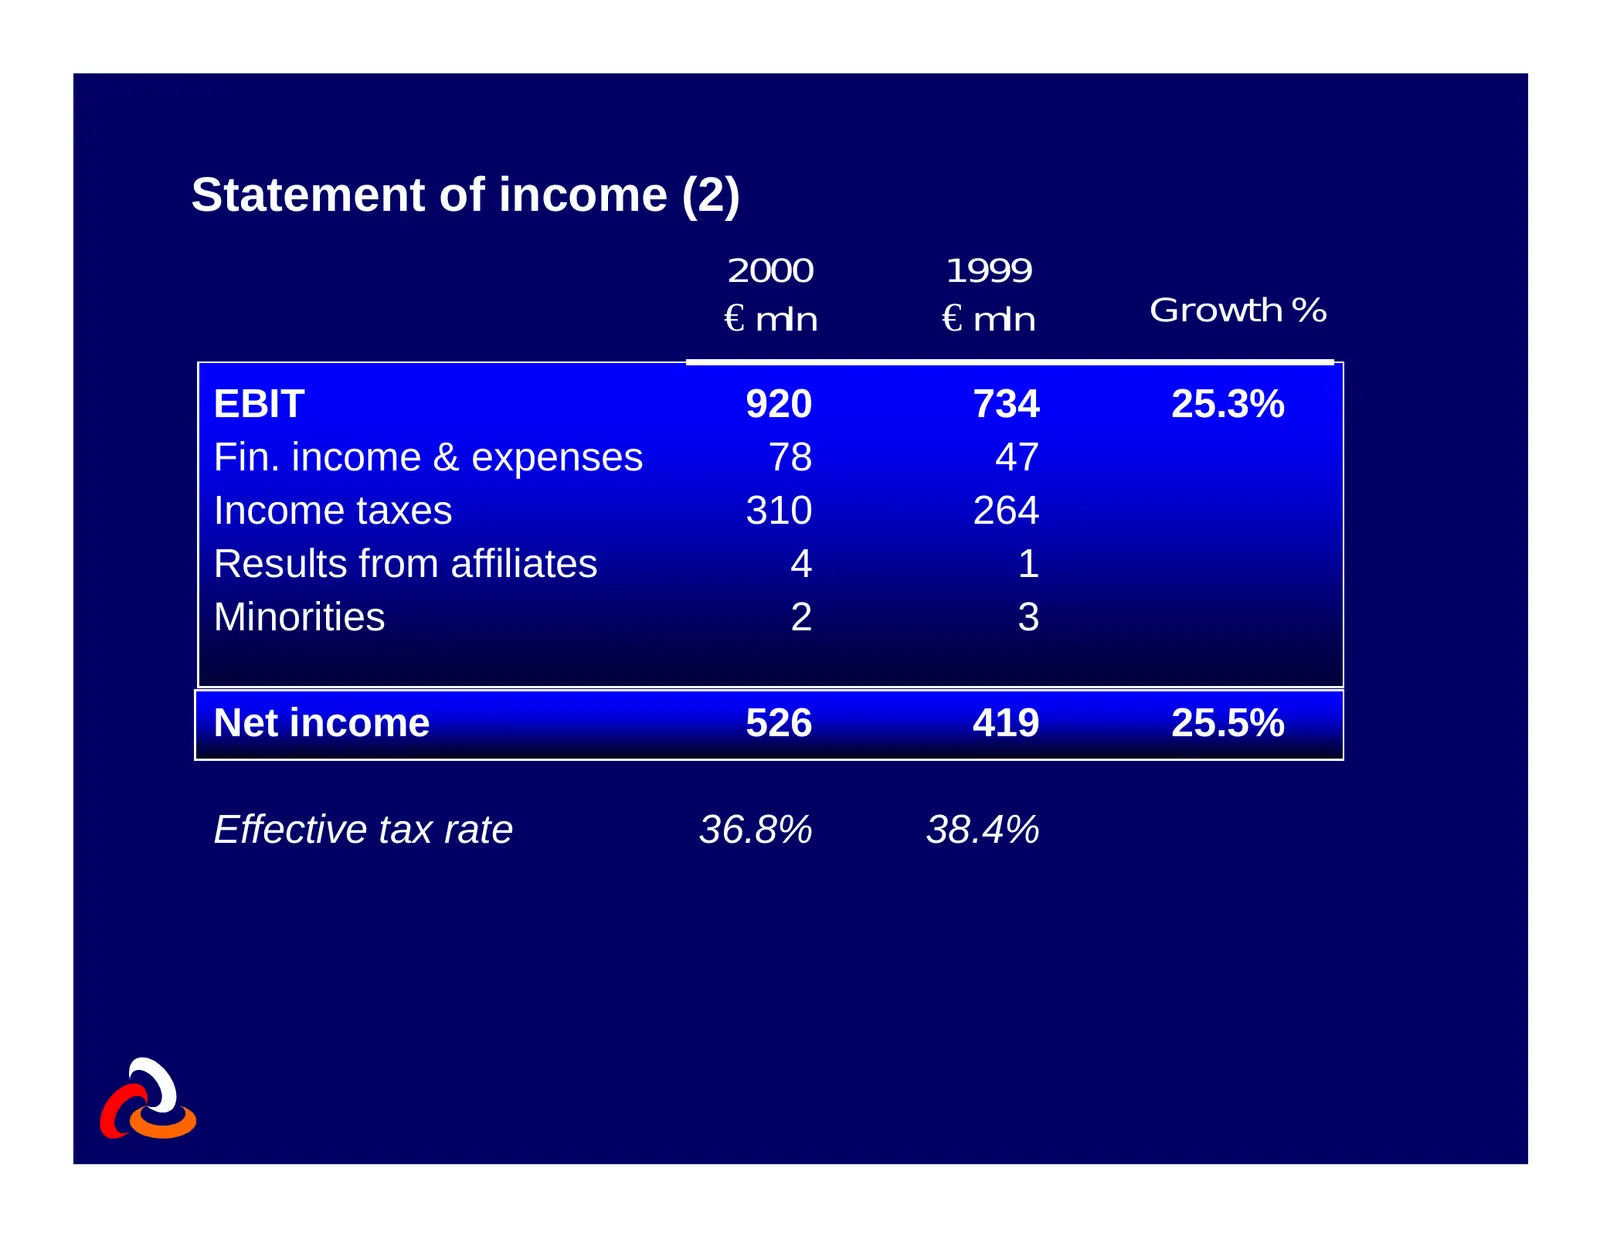
Statement of income (2) 2000 1999 € mln € mln Growth % EBIT 920 734 25.3% Fin. income & expenses 78 47 Income taxes 310 264 Results from affiliates 4 1 Minorities 2 3 Net income 526 419 25.5% Effective tax rate 36.8% 38.4%
Slide 39: Balance sheet
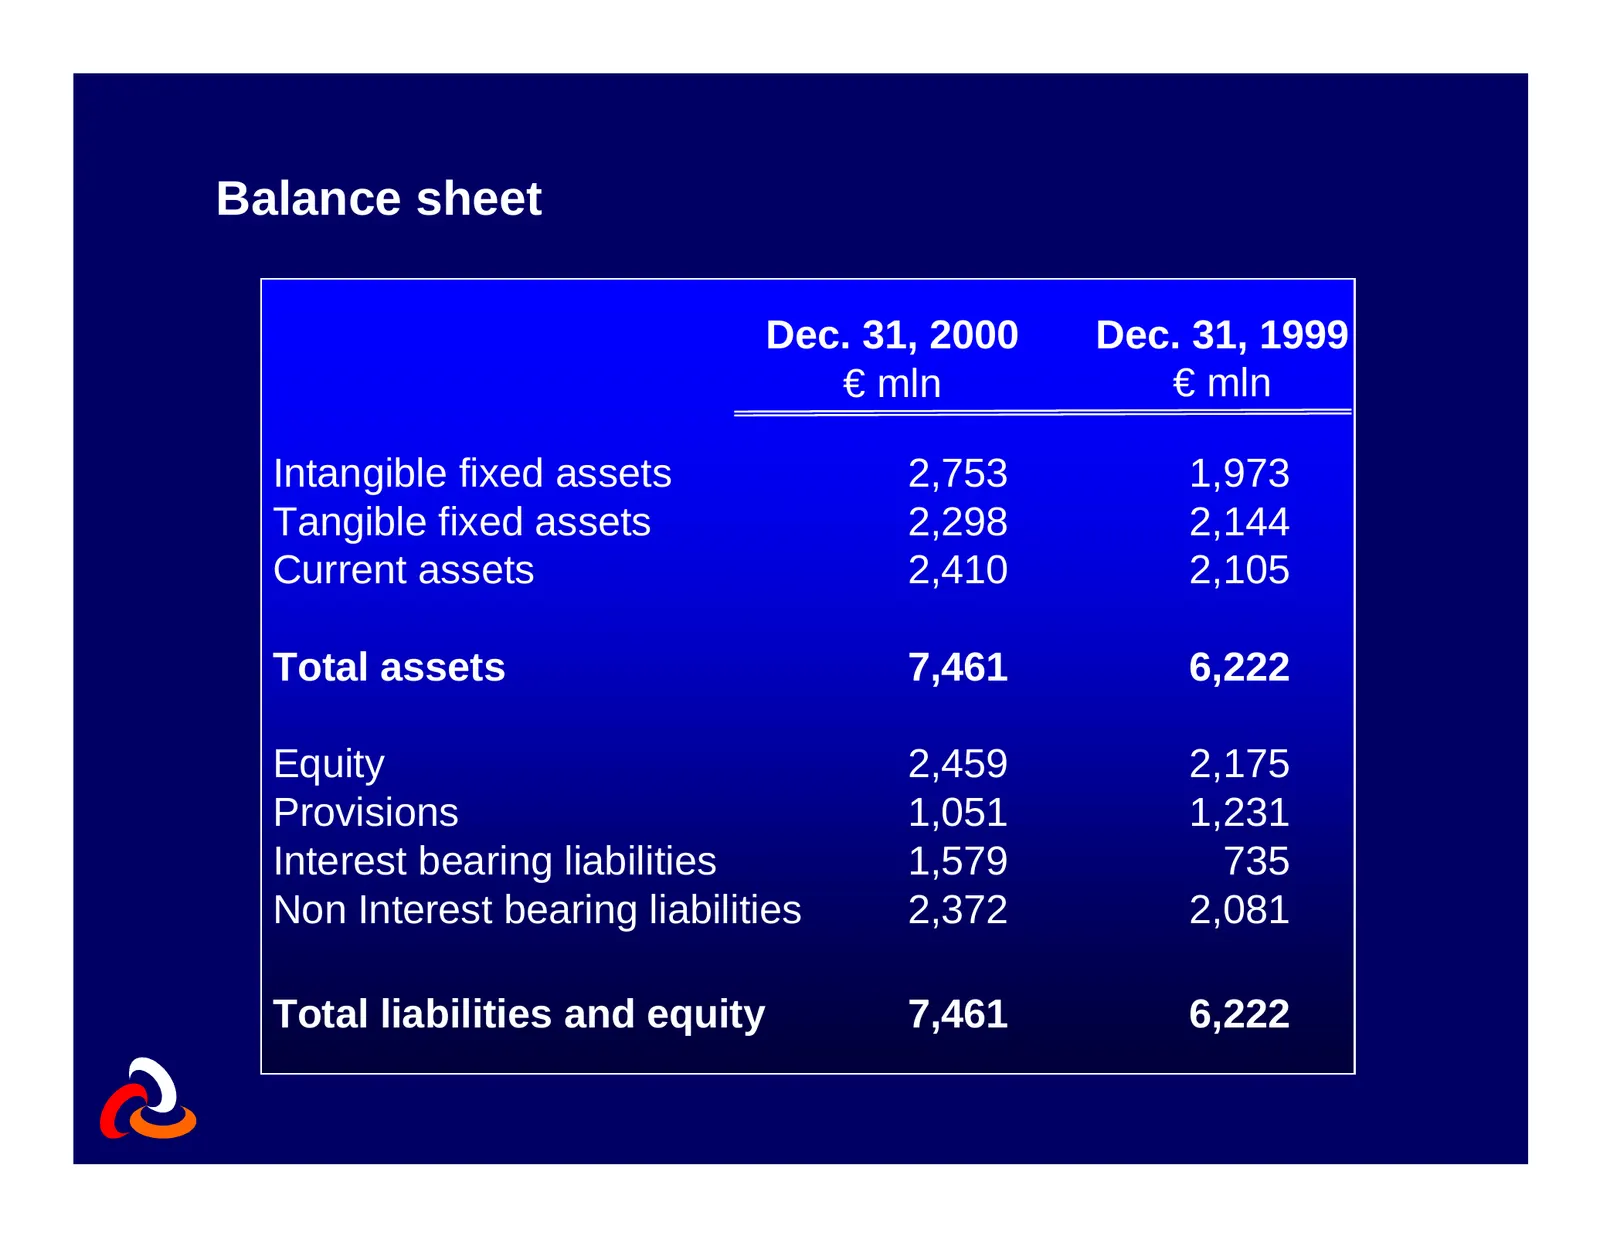
Balance sheet Dec. 31, 2000 Dec. 31, 1999 € mln € mln Intangible fixed assets 2,753 1,973 Tangible fixed assets 2,298 2,144 Current assets 2,410 2,105 Total assets 7,461 6,222 Equity 2,459 2,175 Provisions 1,051 1,231 Interest bearing liabilities 1,579 735 Non Interest bearing liabilities 2,372 2,08
Slide 40: Cashflow Statement Overview
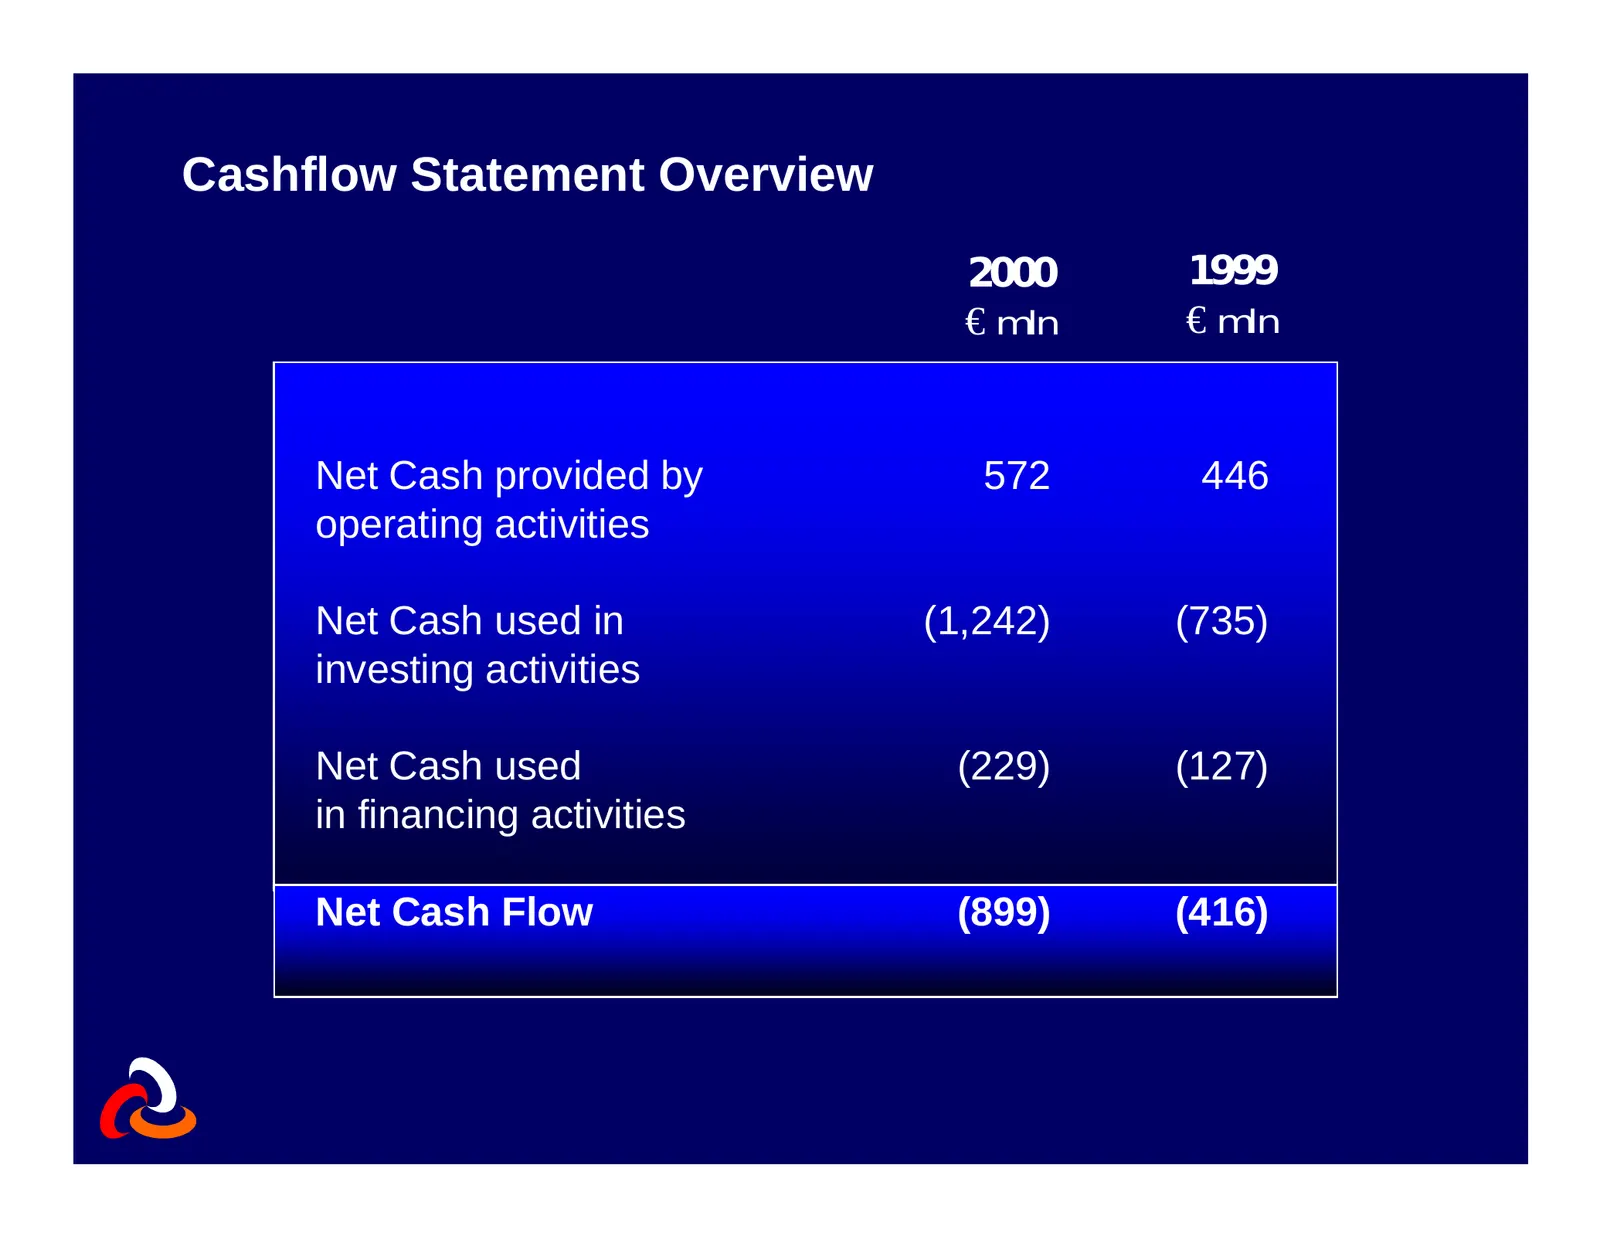
Cashflow Statement Overview 2000 1999 € mln € mln Net Cash provided by 572 446 operating activities Net Cash used in (1,242) (735) investing activities Net Cash used (229) (127) in financing activities Net Cash Flow (899) (416)
Slide 41: Cashflow Statement Overview
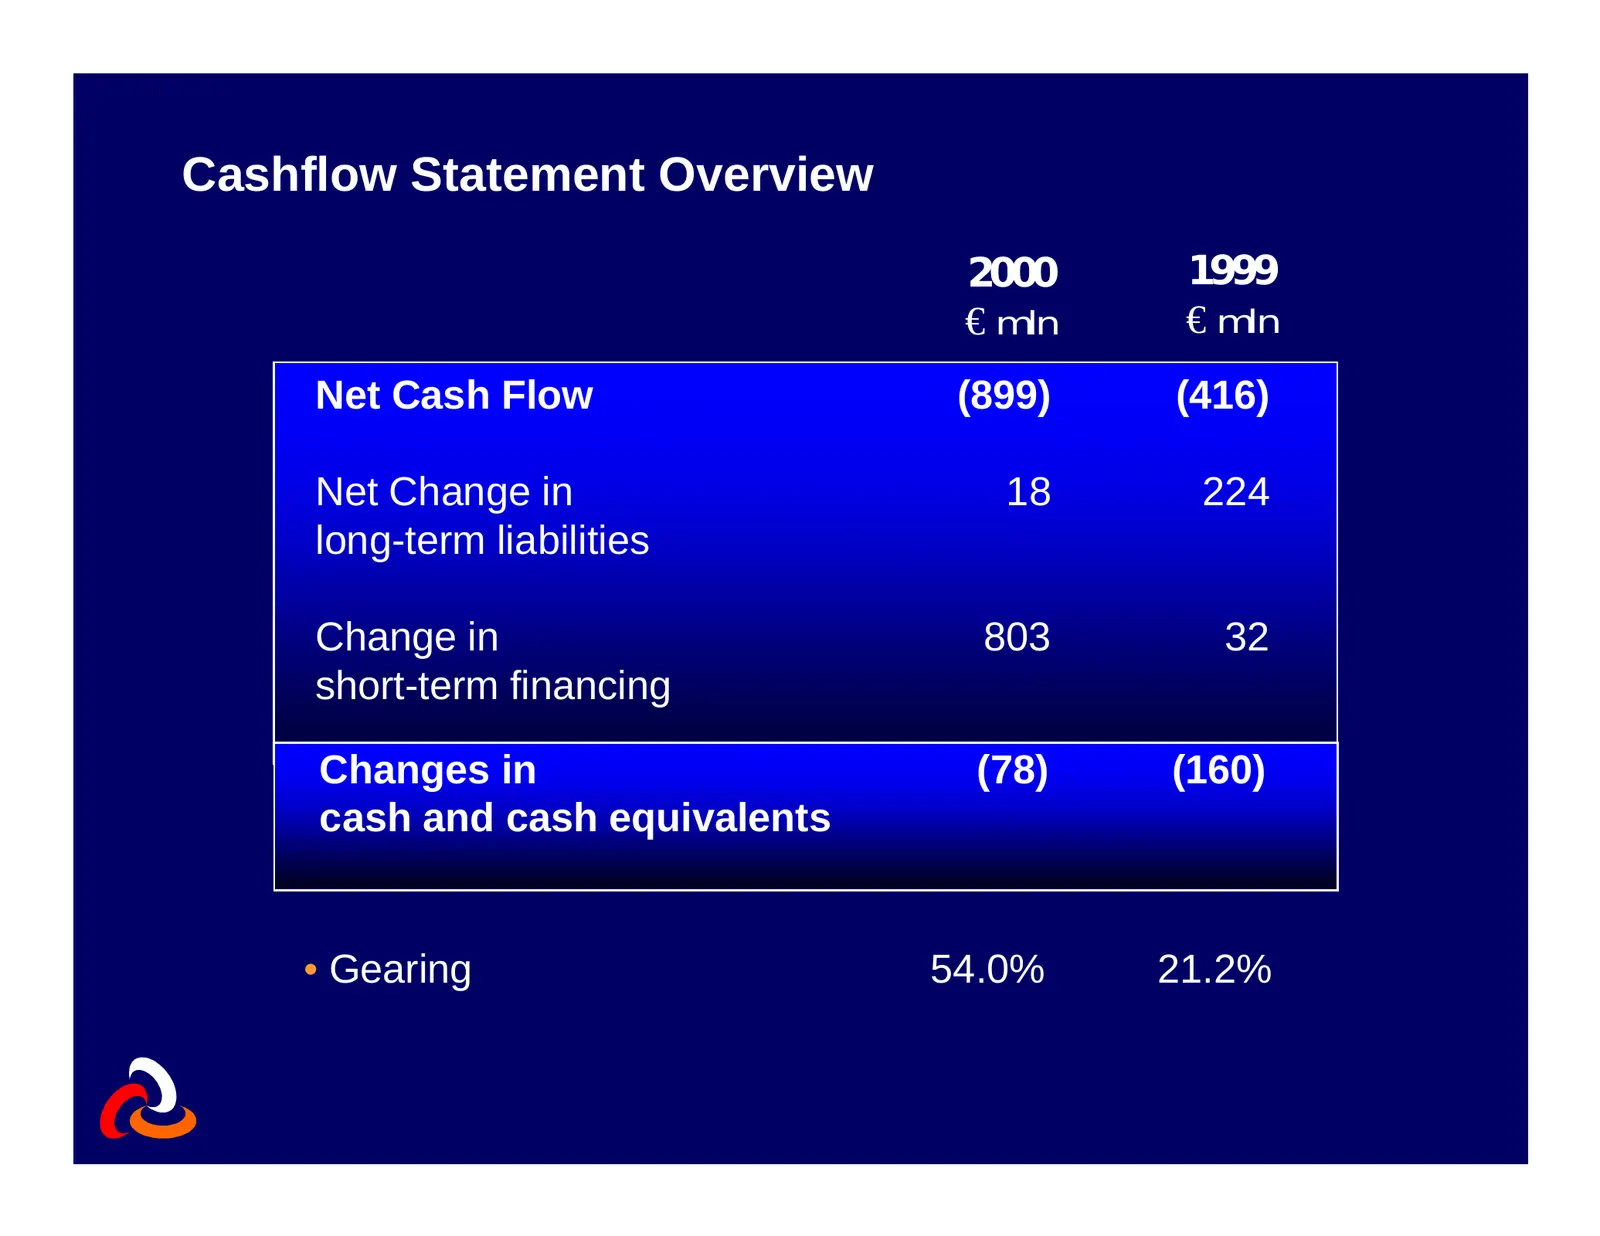
Cashflow Statement Overview 2000 1999 € mln € mln Net Cash Flow (899) (416) Net Change in 18 224 long-term liabilities Change in 803 32 short-term financing Changes in (78) (160) cash and cash equivalents • Gearing 54.0% 21.2%
Slide 42: Accounting policy changes
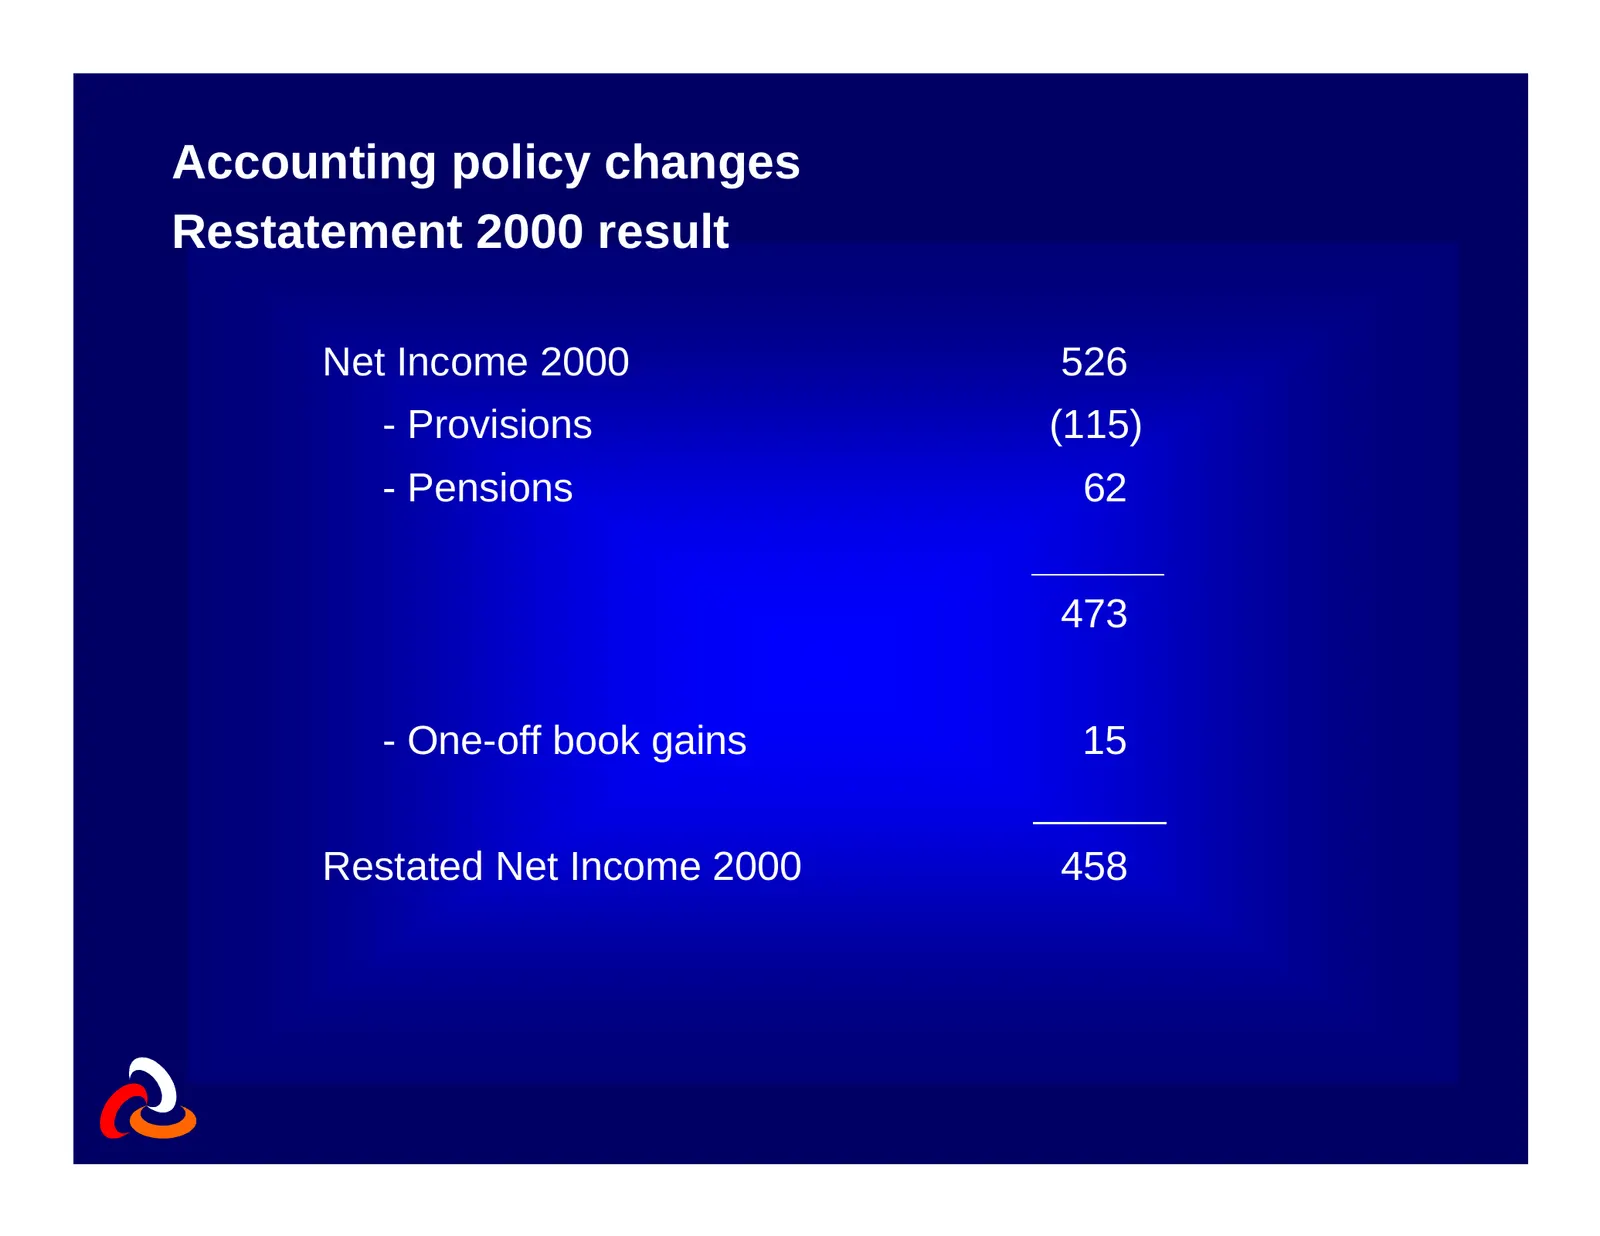
Accounting policy changes Restatement 2000 result Net Income 2000 526 - Provisions (115) - Pensions 62 473 - One-off book gains 15 Restated Net Income 2000 458
Slide 43: Outlook 2001
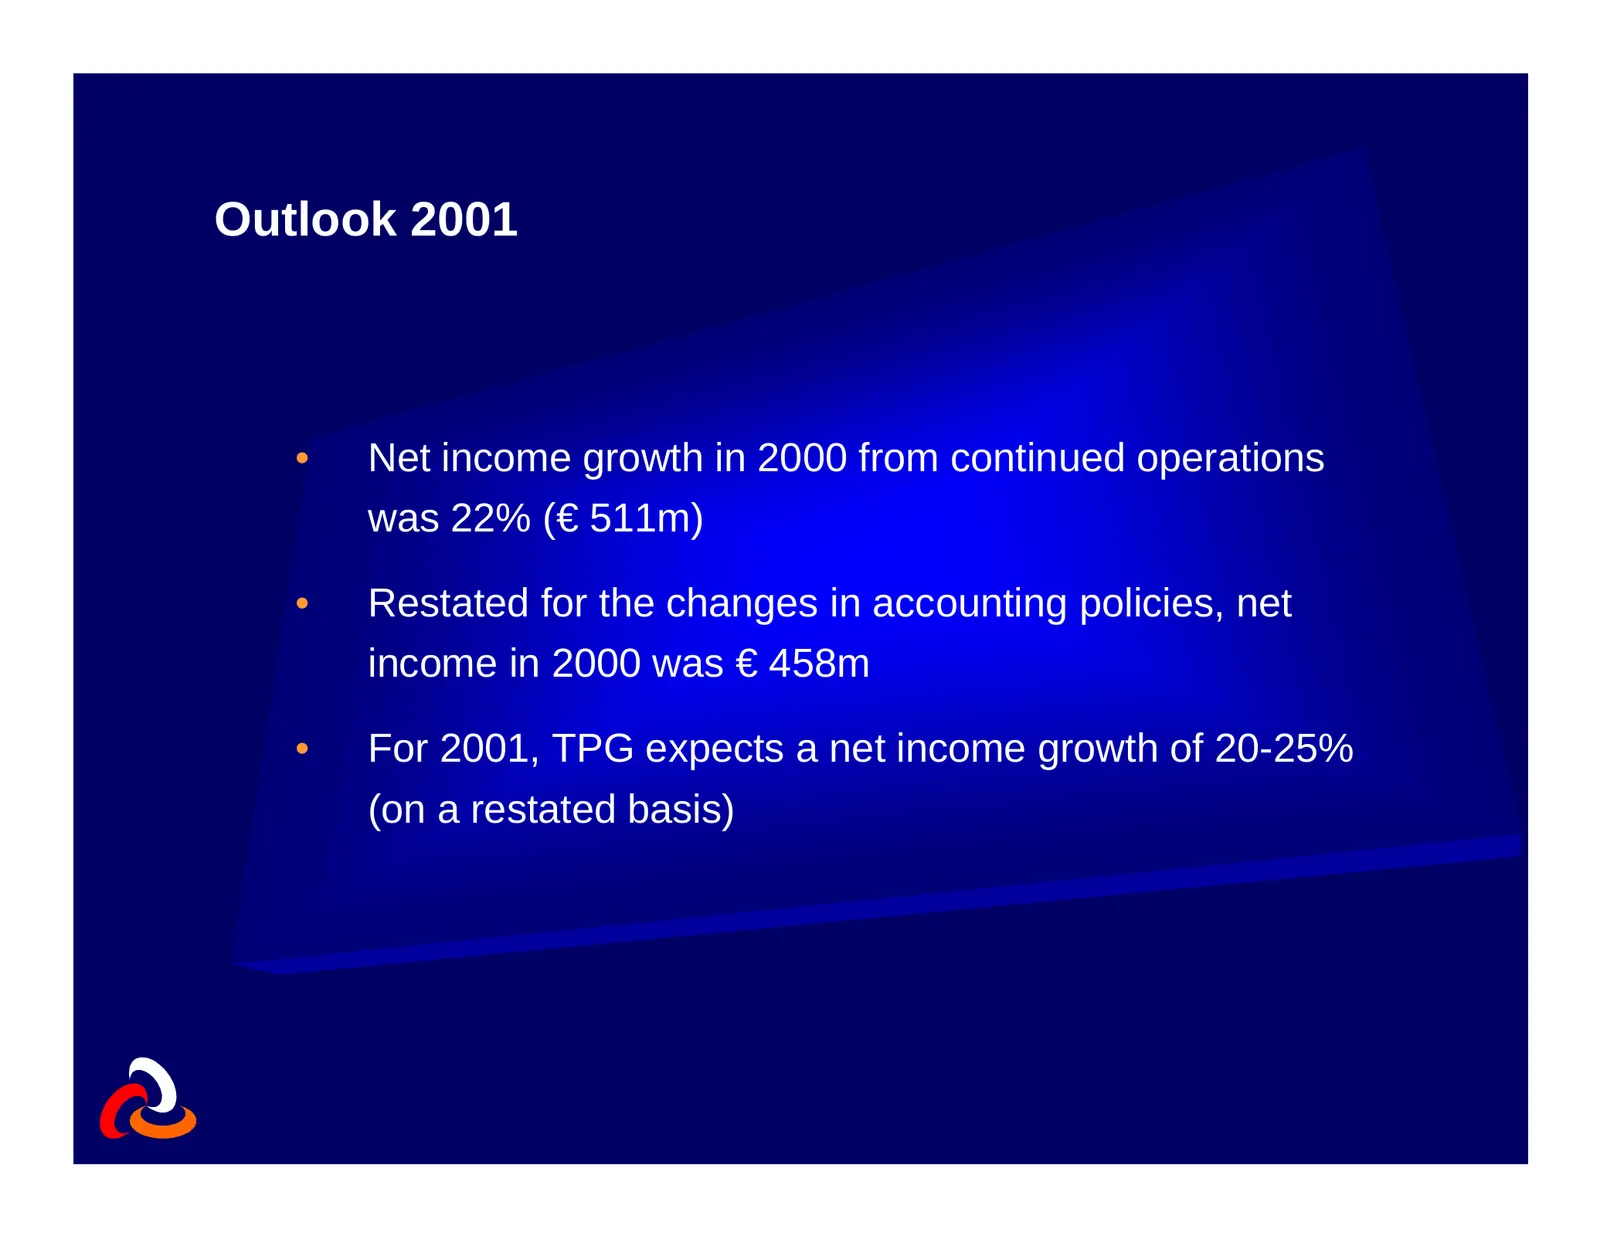
Outlook 2001 • Net income growth in 2000 from continued operations was 22% (€ 511m) • Restated for the changes in accounting policies, net income in 2000 was € 458m • For 2001, TPG expects a net income growth of 20-25% (on a restated basis)
Source: Internet Archive copy of tpg.com
More decks from TPG Inc.
 Q2 2026 Earnings Presentation44 slides · Aug 4, 2026
 Q1 2026 Earnings Presentation44 slides · May 1, 2026
 Q4 2025 Earnings Presentation45 slides · Feb 5, 2026
 Merger or Acquisition (January 2026)14 slides · Jan 6, 2026
 Q2 2025 Earnings Presentation44 slides · Aug 6, 2025
 Q1 2025 Earnings Presentation44 slides · May 7, 2025