Flutter Entertainment plc · NYSE:FLUT
Flutter Entertainment — Paddy Power Betfair — FY2016 Earnings Presentation
27 slides from Flutter Entertainment's earnings presentation, 2017
Slide 1: Paddy Power Betfair plc 2016 Prelim Results
Paddy Power Betfair plc 2016 Prelim Results

Slide 2: Financial & Operating Review
Financial & Operating Review [find new imagery for cover]
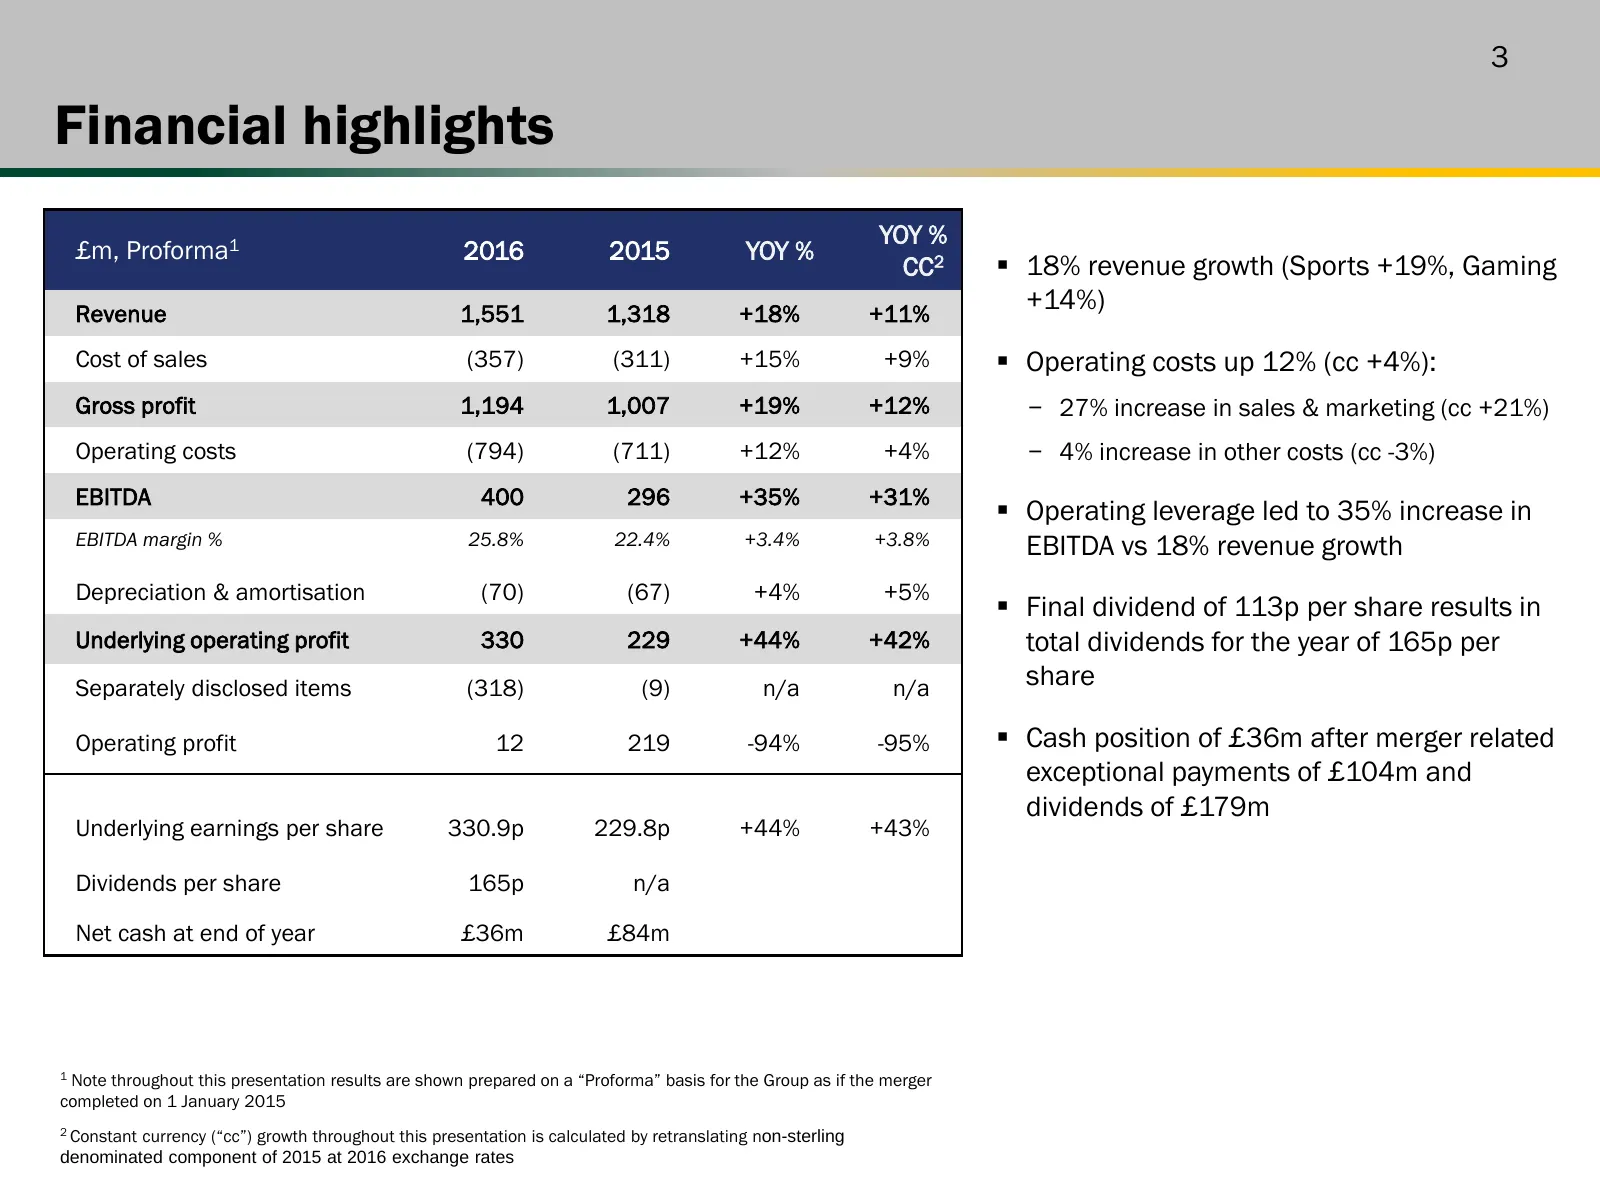
Slide 3: Financial highlights
3 Financial highlights YOY % £m, Proforma1 2016 2015 YOY % CC2 18% revenue growth (Sports +19%, Gaming Revenue 1,551 1,318 +18% +11% +14%) Cost of sales (357) (311) +15% +9% Operating costs up 12% (cc +4%): Gross profit 1,194 1,007 +19% +12% − 27% increase in sales & marketing (cc +21%) Operatin
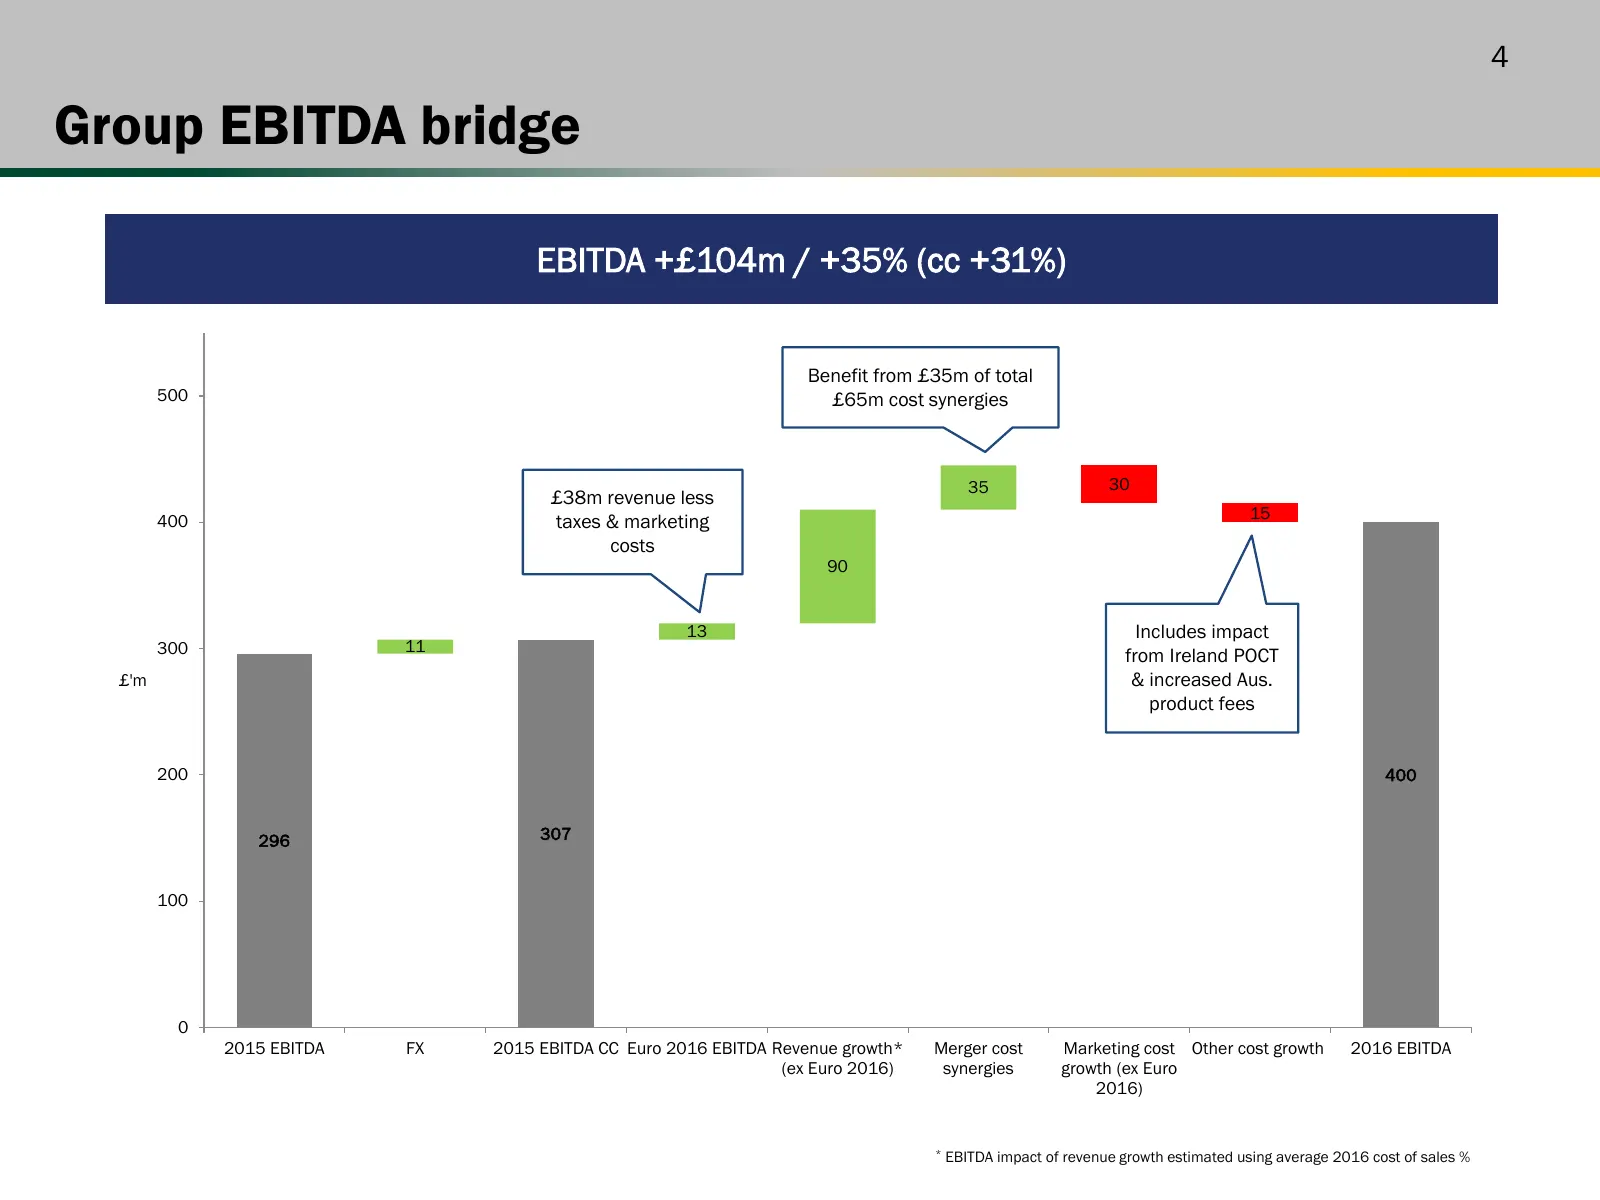
Slide 4: Group EBITDA bridge
4 Group EBITDA bridge EBITDA +£104m / +35% (cc +31%) Benefit from £35m of total 500 £65m cost synergies 35 30 £38m revenue less 15 400 taxes & marketing costs 90 13 Includes impact 300 11 from Ireland POCT £'m & increased Aus. product fees 200 400 296 307 100 0 2015 EBITDA FX 2015 EBITDA CC Euro 201
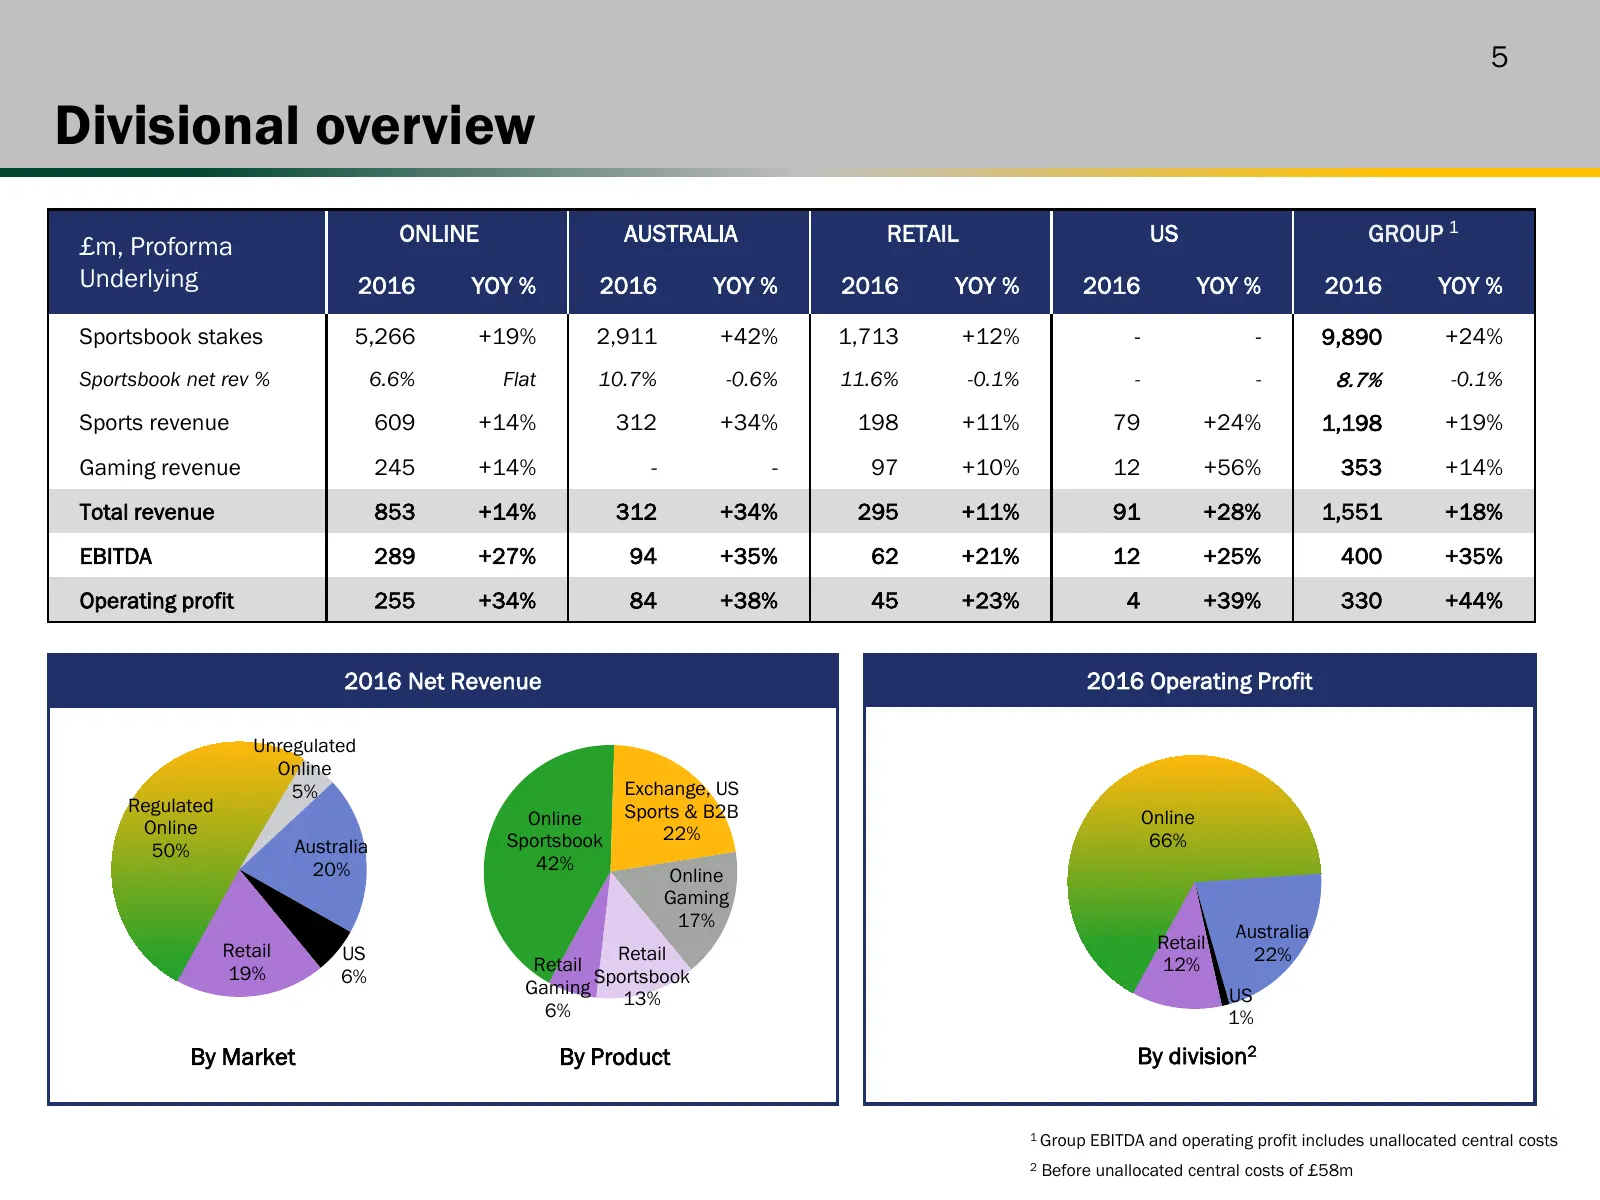
Slide 5: Divisional overview
5 Divisional overview ONLINE AUSTRALIA RETAIL US GROUP 1 £m, Proforma Underlying 2016 YOY % 2016 YOY % 2016 YOY % 2016 YOY % 2016 YOY % Sportsbook stakes 5,266 +19% 2,911 +42% 1,713 +12% - - 9,890 +24% Sportsbook net rev % 6.6% Flat 10.7% -0.6% 11.6% -0.1% - - 8.7% -0.1% Sports revenue 609 +14% 312
Slide 6: Online
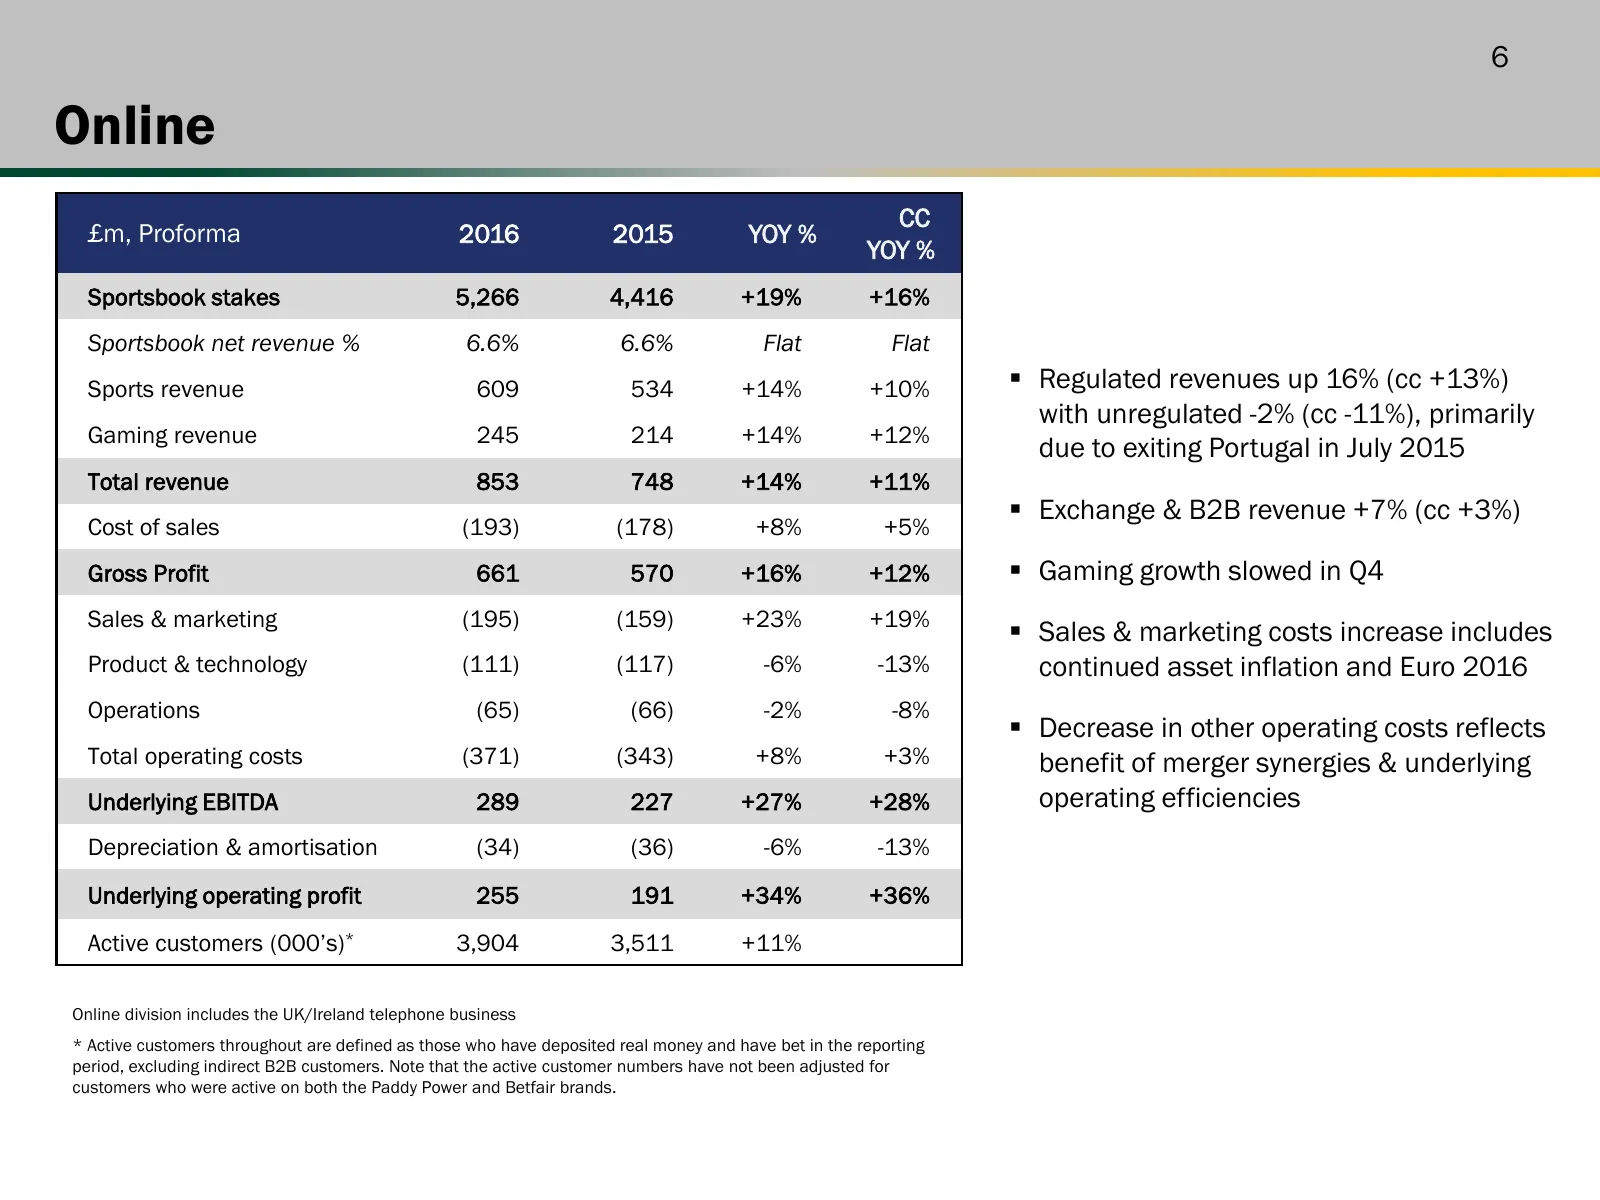
6 Online CC £m, Proforma 2016 2015 YOY % YOY % Sportsbook stakes 5,266 4,416 +19% +16% Sportsbook net revenue % 6.6% 6.6% Flat Flat Sports revenue 609 534 +14% +10% Regulated revenues up 16% (cc +13%) with unregulated -2% (cc -11%), primarily Gaming revenue 245 214 +14% +12% due to exiting Portuga
Slide 7: Australia
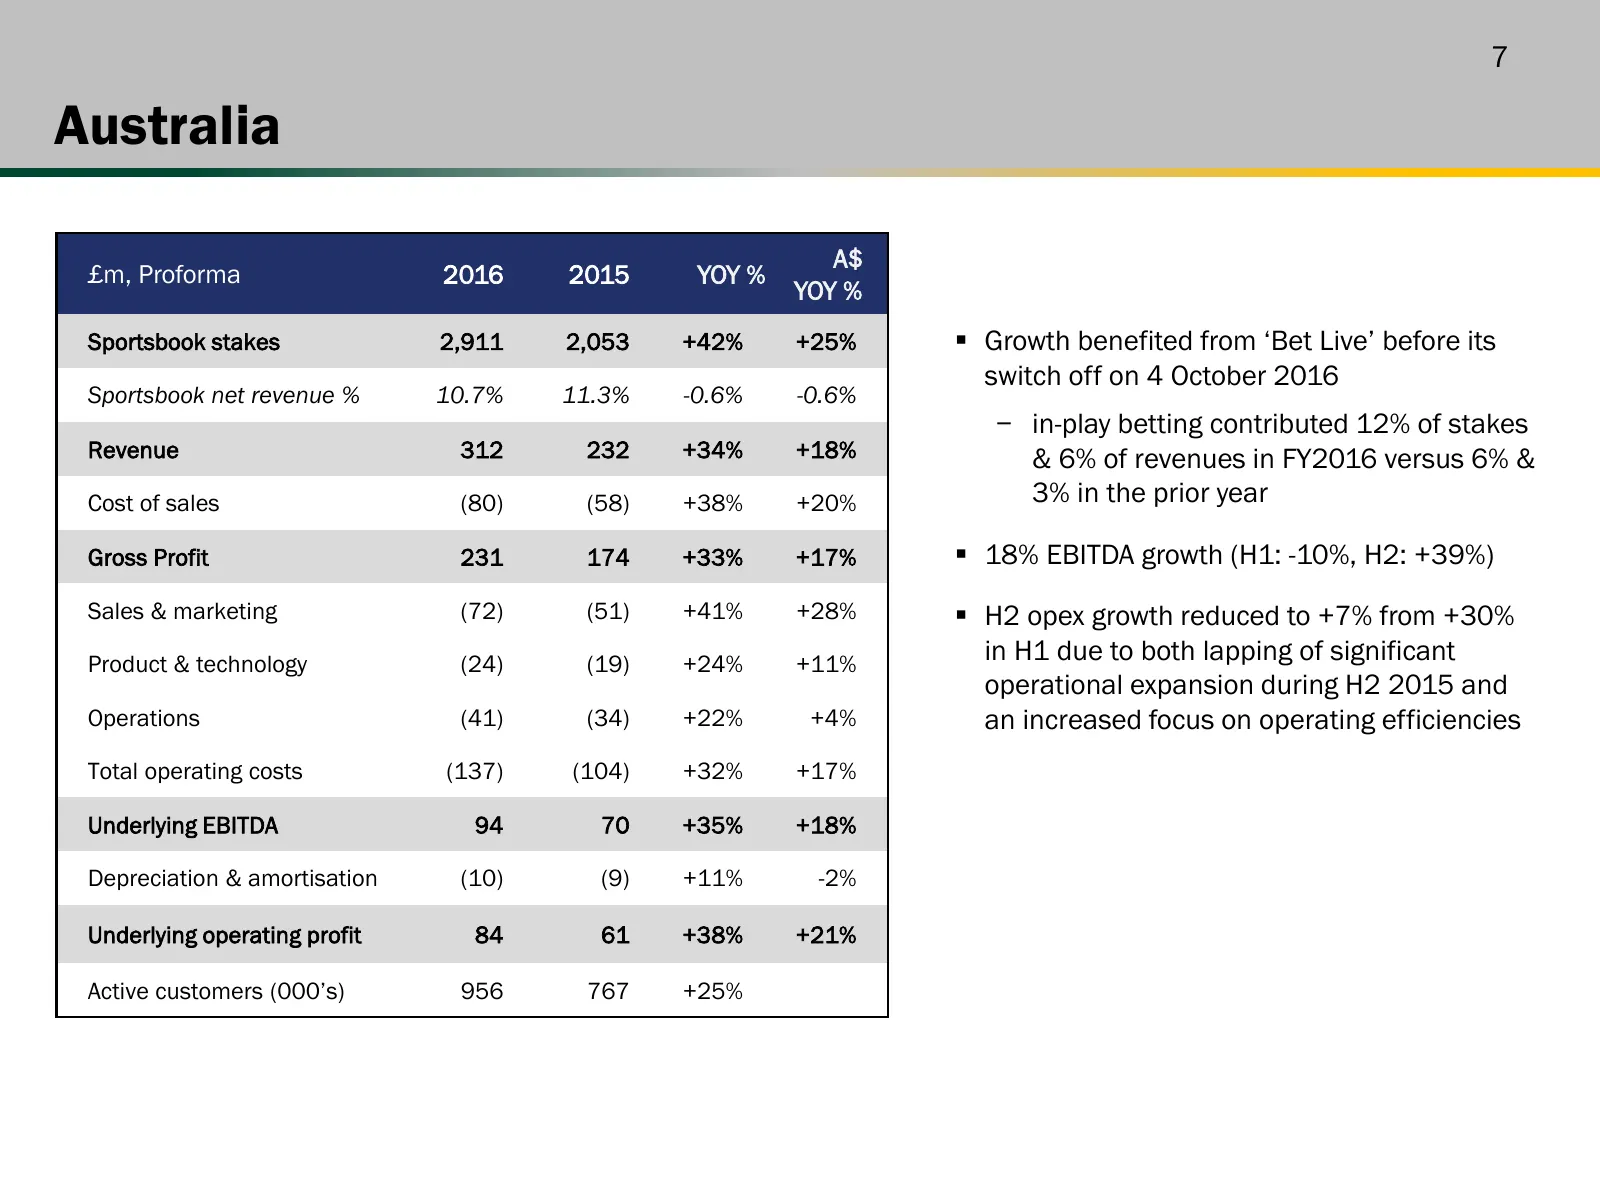
7 Australia A$ £m, Proforma 2016 2015 YOY % YOY % Sportsbook stakes 2,911 2,053 +42% +25% Growth benefited from ‘Bet Live’ before its switch off on 4 October 2016 Sportsbook net revenue % 10.7% 11.3% -0.6% -0.6% − in-play betting contributed 12% of stakes Revenue 312 232 +34% +18% & 6% of revenues
Slide 8: Retail
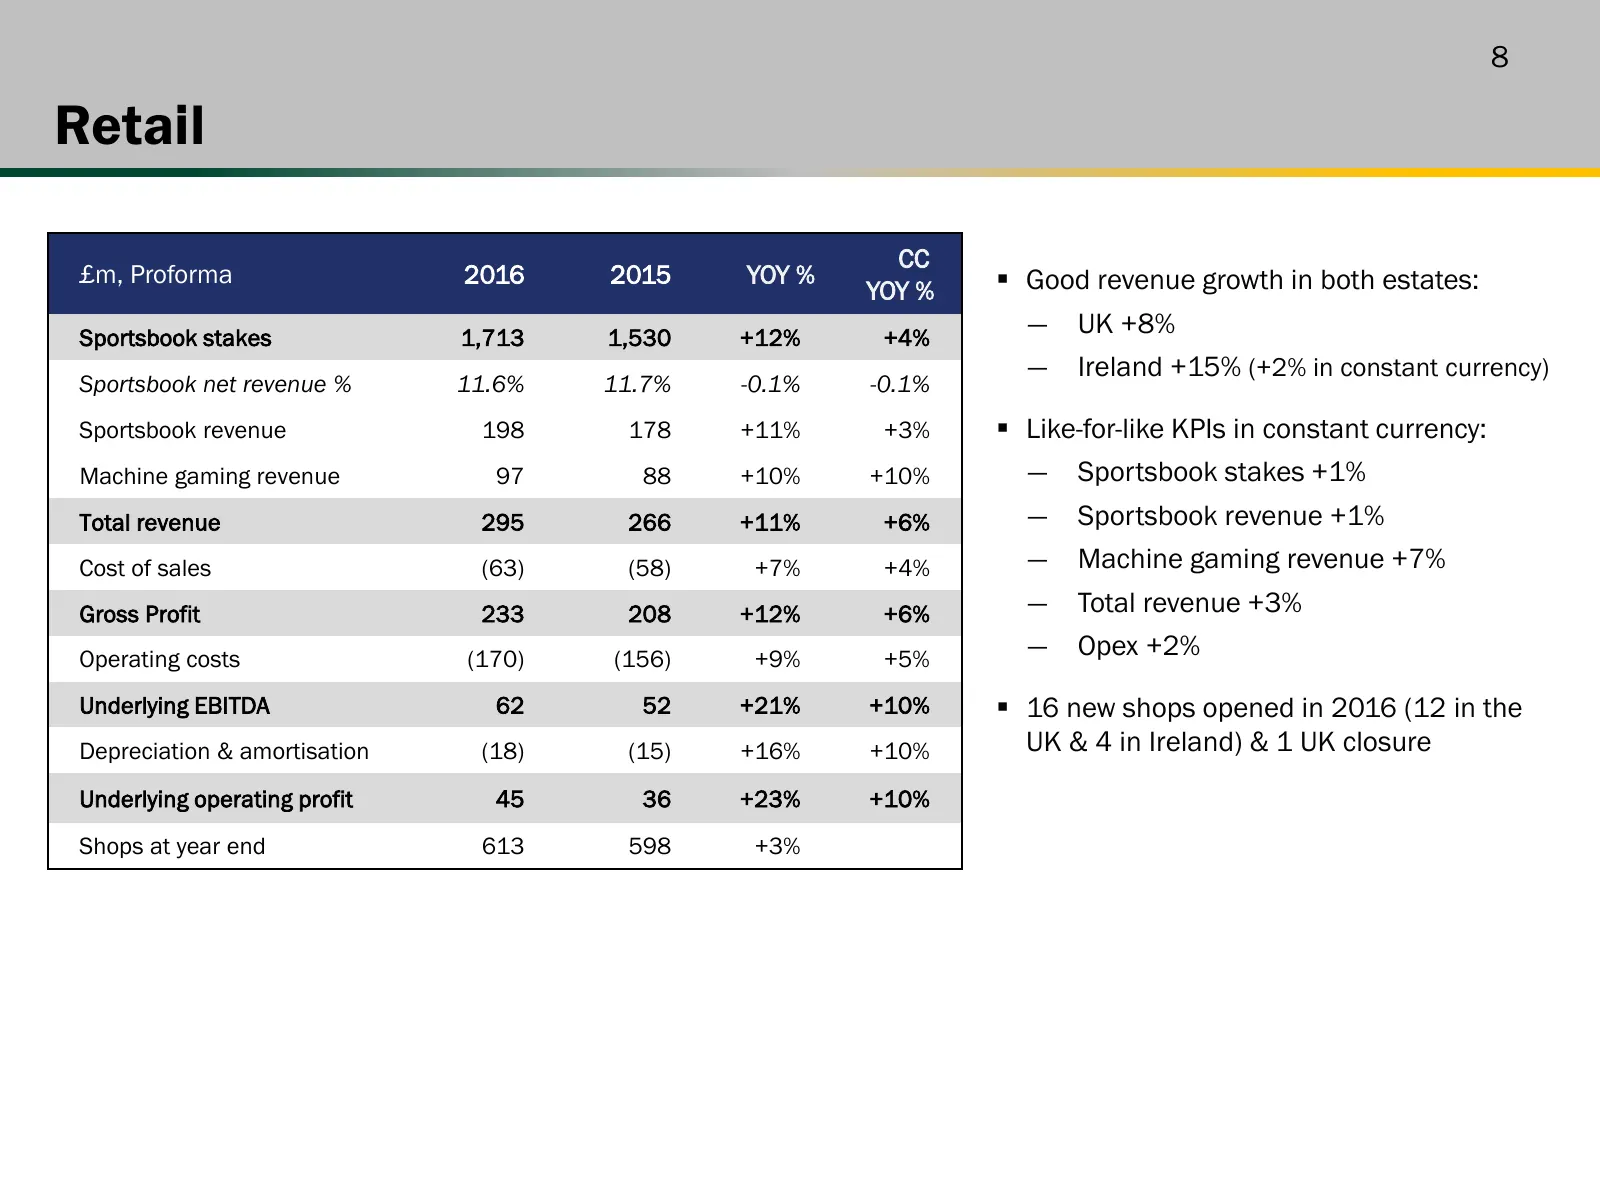
8 Retail CC £m, Proforma 2016 2015 YOY % Good revenue growth in both estates: YOY % Sportsbook stakes 1,713 1,530 +12% +4% ― UK +8% ― Ireland +15% (+2% in constant currency) Sportsbook net revenue % 11.6% 11.7% -0.1% -0.1% Sportsbook revenue 198 178 +11% +3% Like-for-like KPIs in constant curren
Slide 9: US
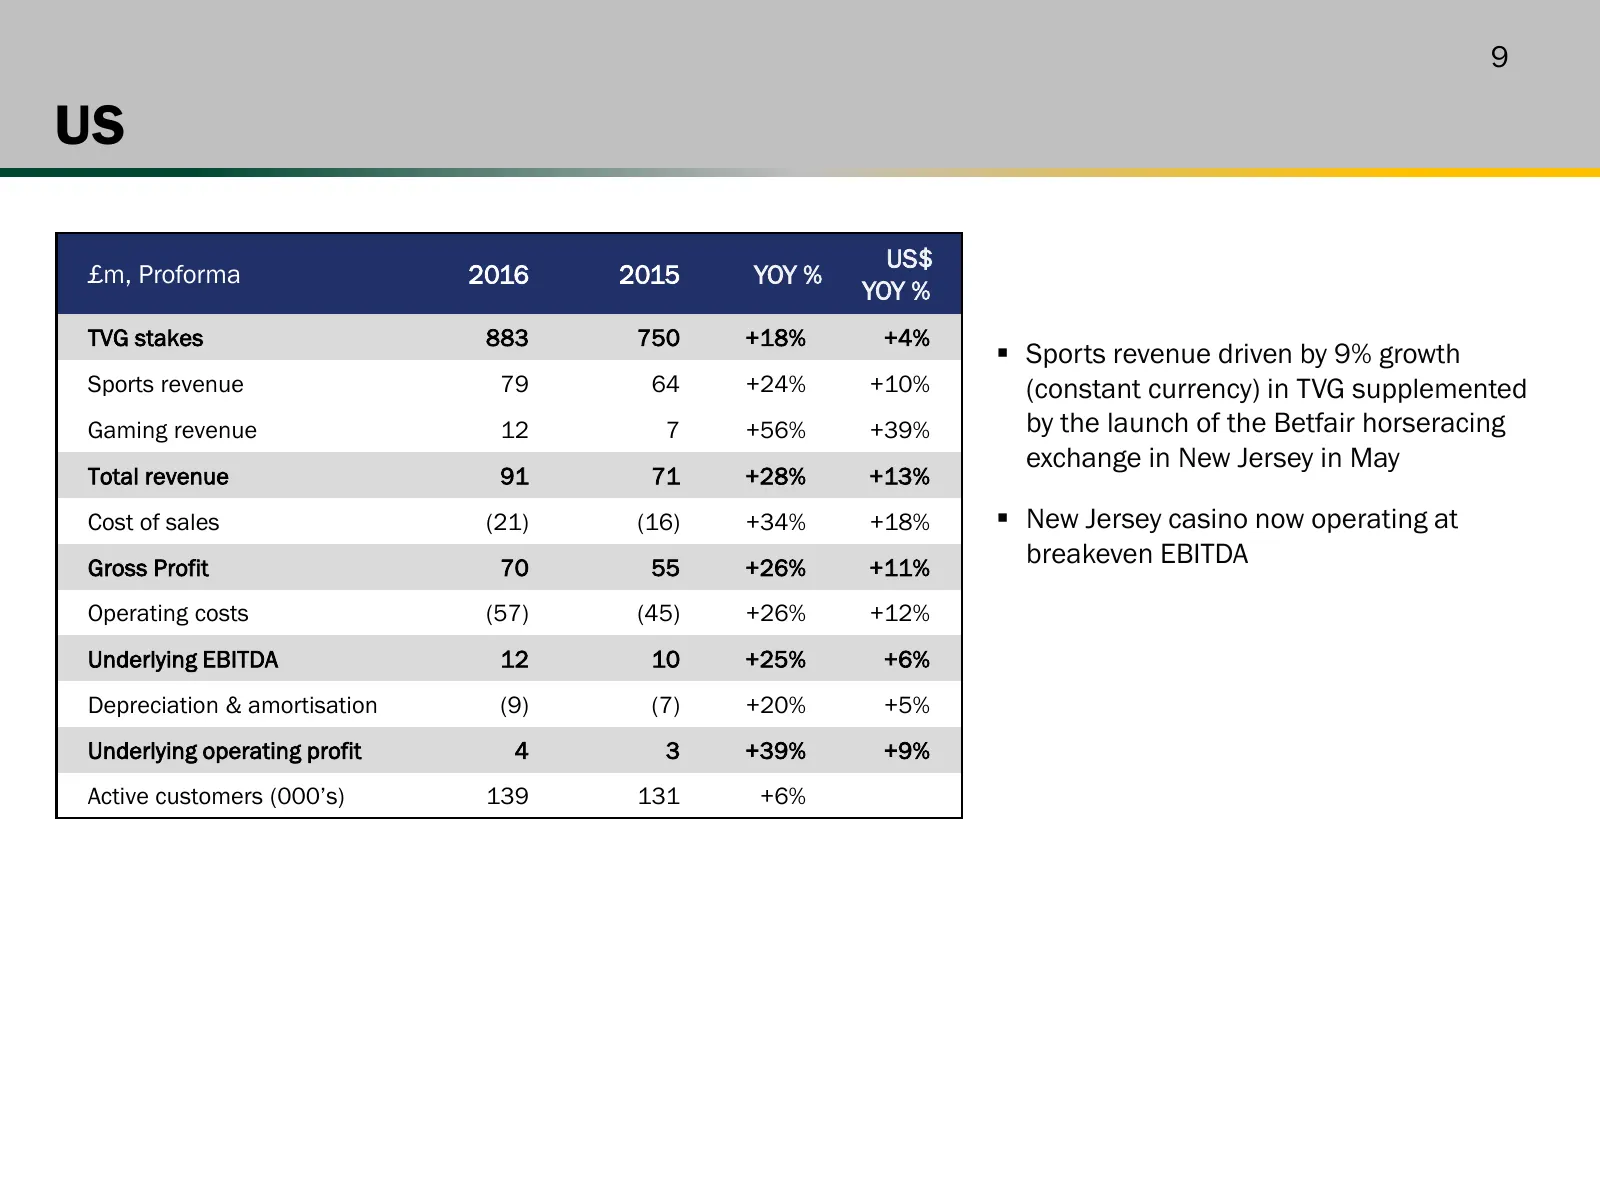
9 US US$ £m, Proforma 2016 2015 YOY % YOY % TVG stakes 883 750 +18% +4% Sports revenue driven by 9% growth Sports revenue 79 64 +24% +10% (constant currency) in TVG supplemented Gaming revenue 12 7 +56% +39% by the launch of the Betfair horseracing exchange in New Jersey in May Total revenue 91 71
Slide 10: Separately disclosed items
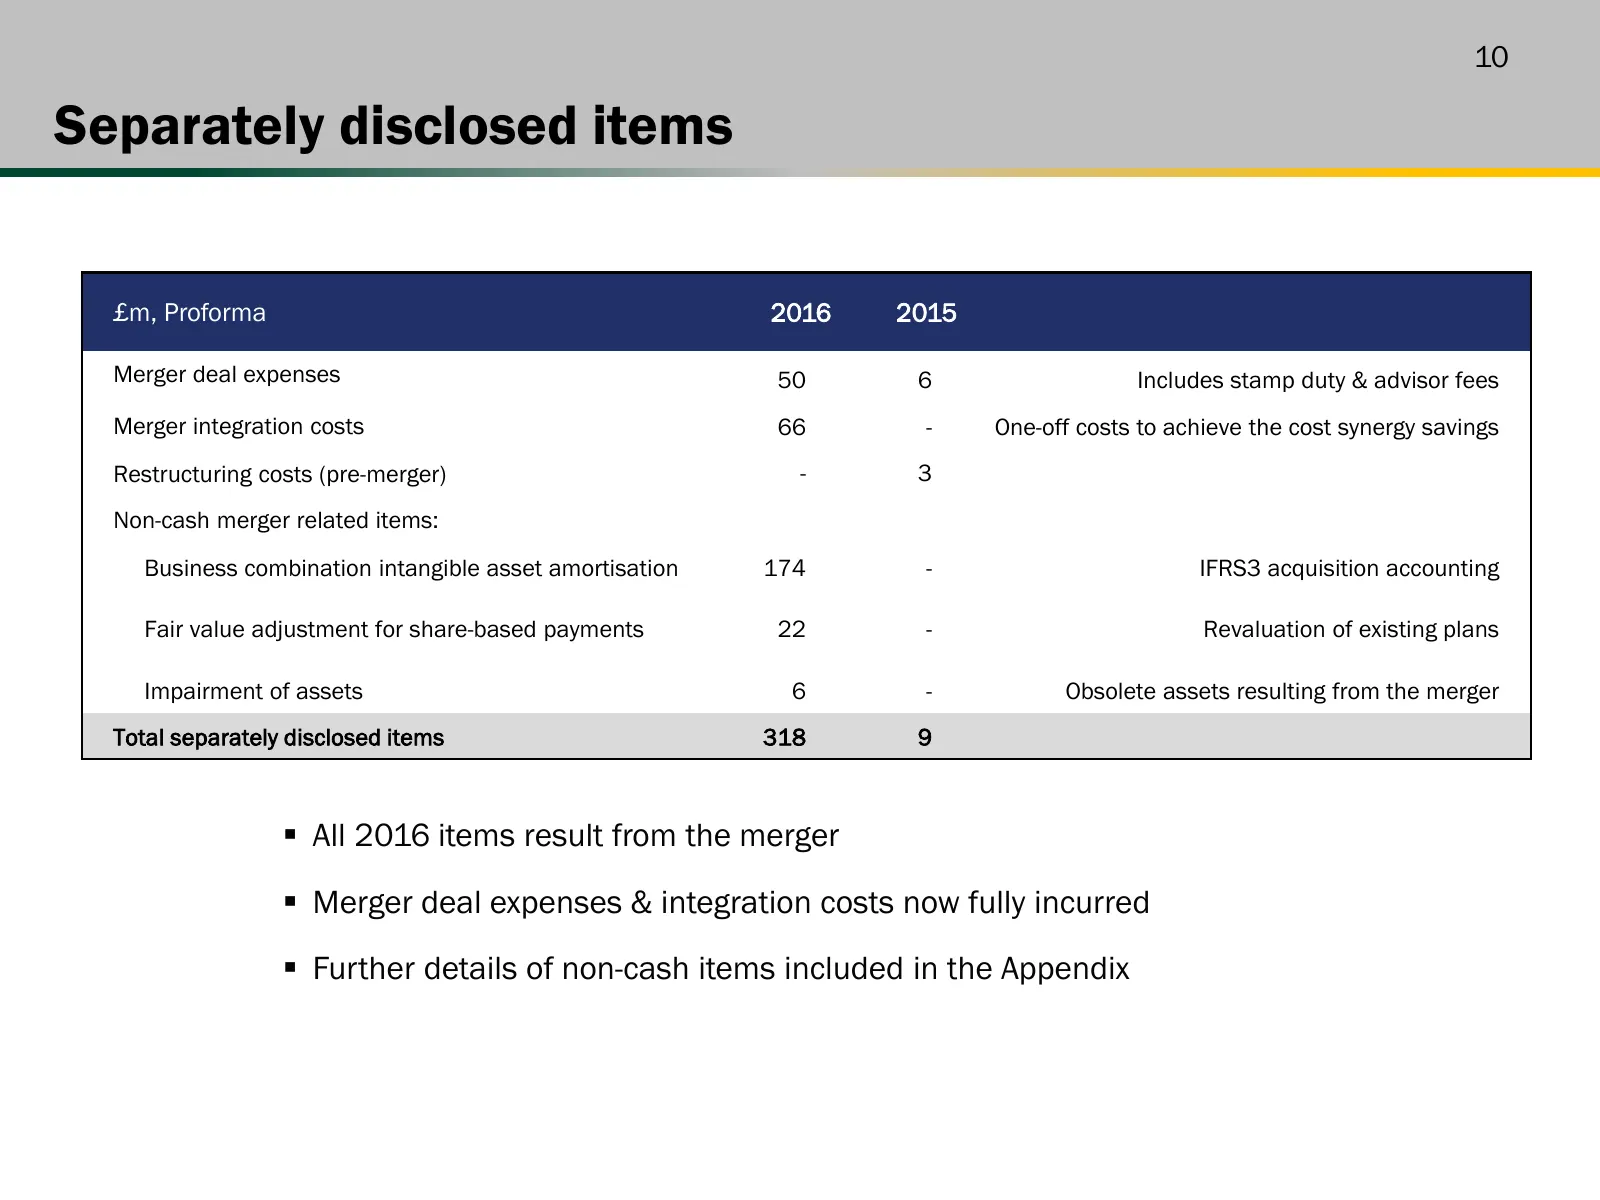
10 Separately disclosed items £m, Proforma 2016 2015 Merger deal expenses 50 6 Includes stamp duty & advisor fees Merger integration costs 66 - One-off costs to achieve the cost synergy savings Restructuring costs (pre-merger) - 3 Non-cash merger related items: Business combination intangible asset
Slide 11: Cash flow
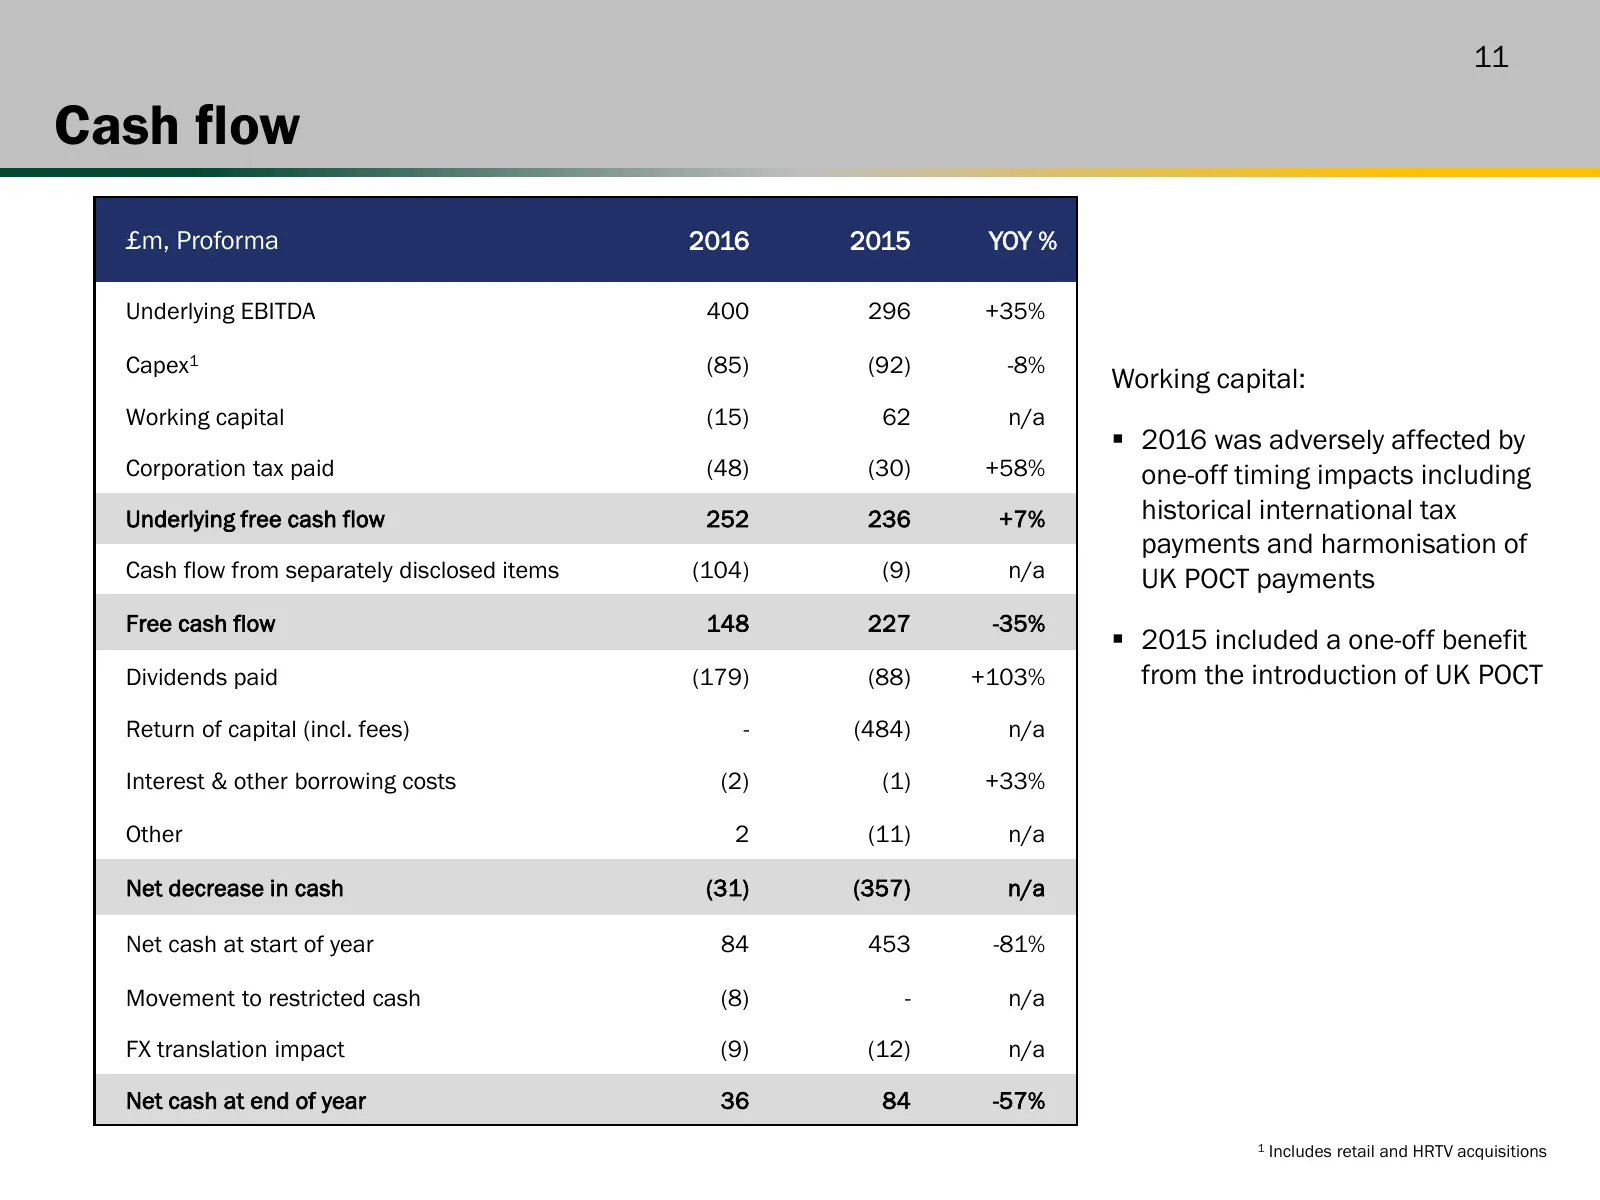
11 Cash flow £m, Proforma 2016 2015 YOY % Underlying EBITDA 400 296 +35% Capex1 (85) (92) -8% Working capital: Working capital (15) 62 n/a 2016 was adversely affected by Corporation tax paid (48) (30) +58% one-off timing impacts including Underlying free cash flow 252 236 +7% historical internatio
Slide 12: Financial guidance & regulatory update
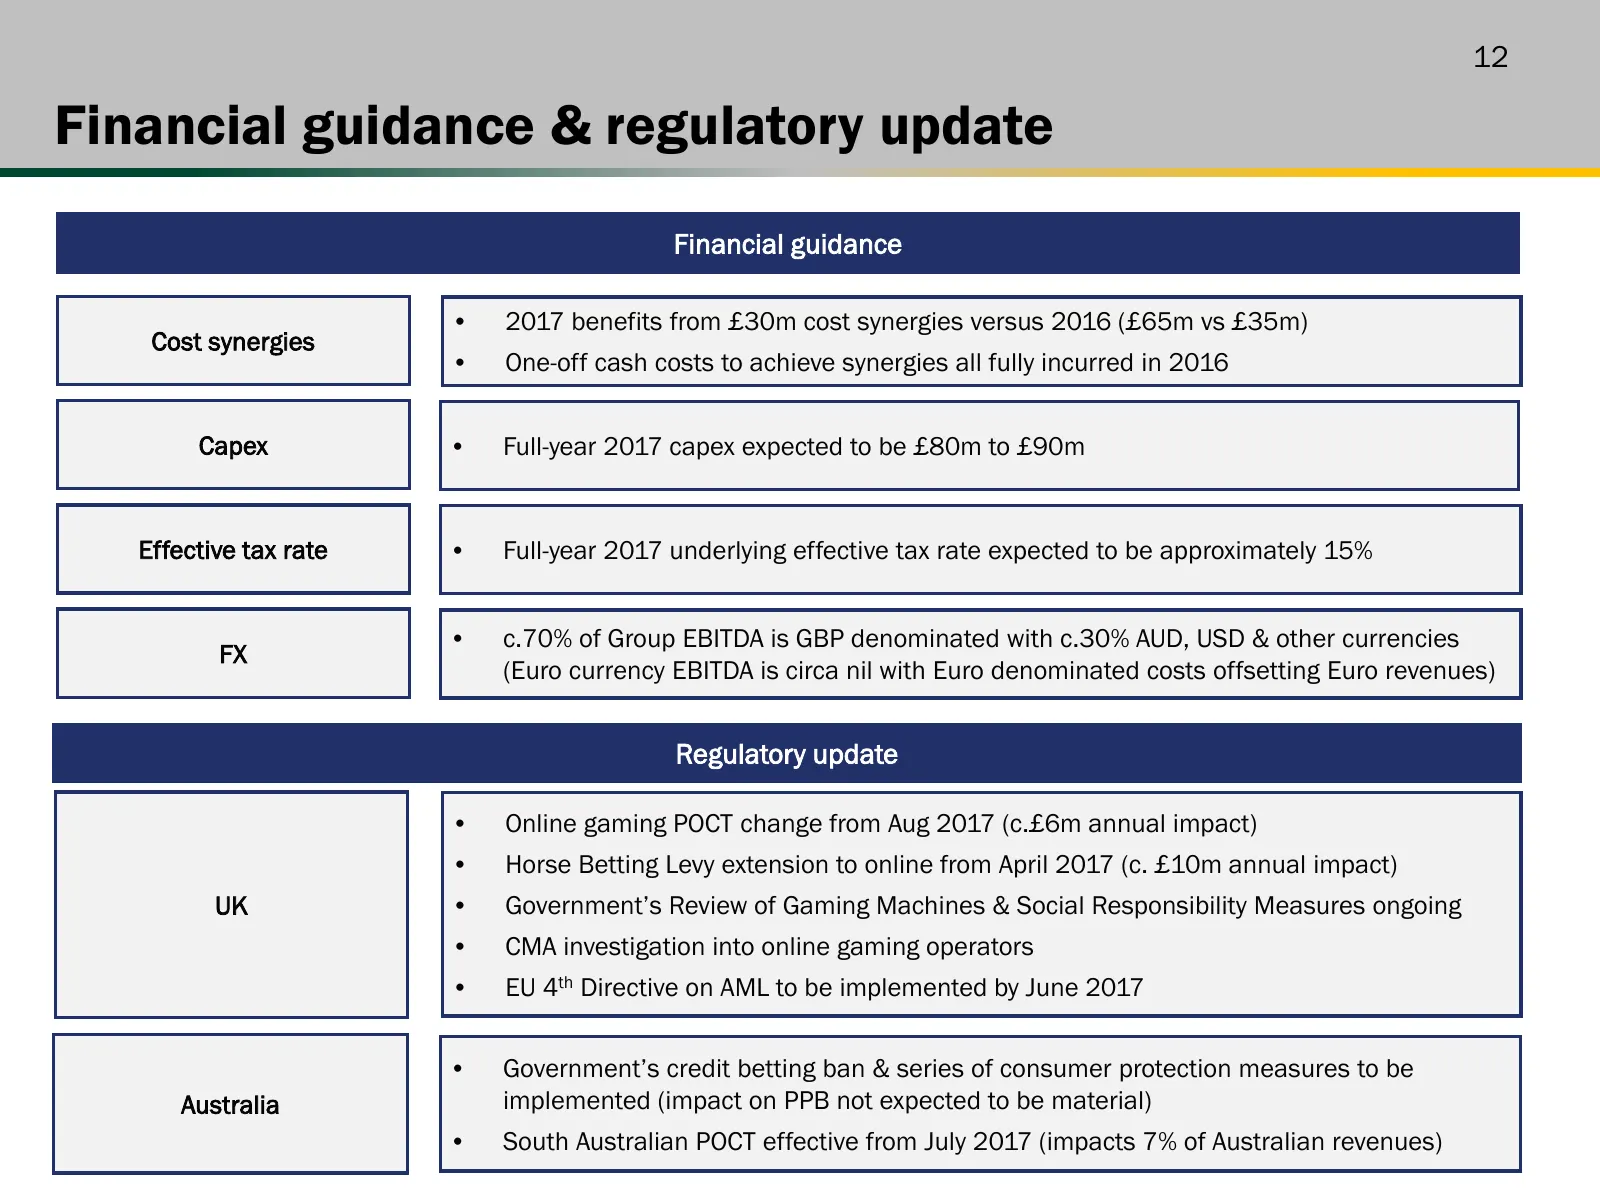
12 Financial guidance & regulatory update Financial guidance • 2017 benefits from £30m cost synergies versus 2016 (£65m vs £35m) Cost synergies • One-off cash costs to achieve synergies all fully incurred in 2016 Capex • Full-year 2017 capex expected to be £80m to £90m Effective tax rate • Full-year
Slide 13: Business Review
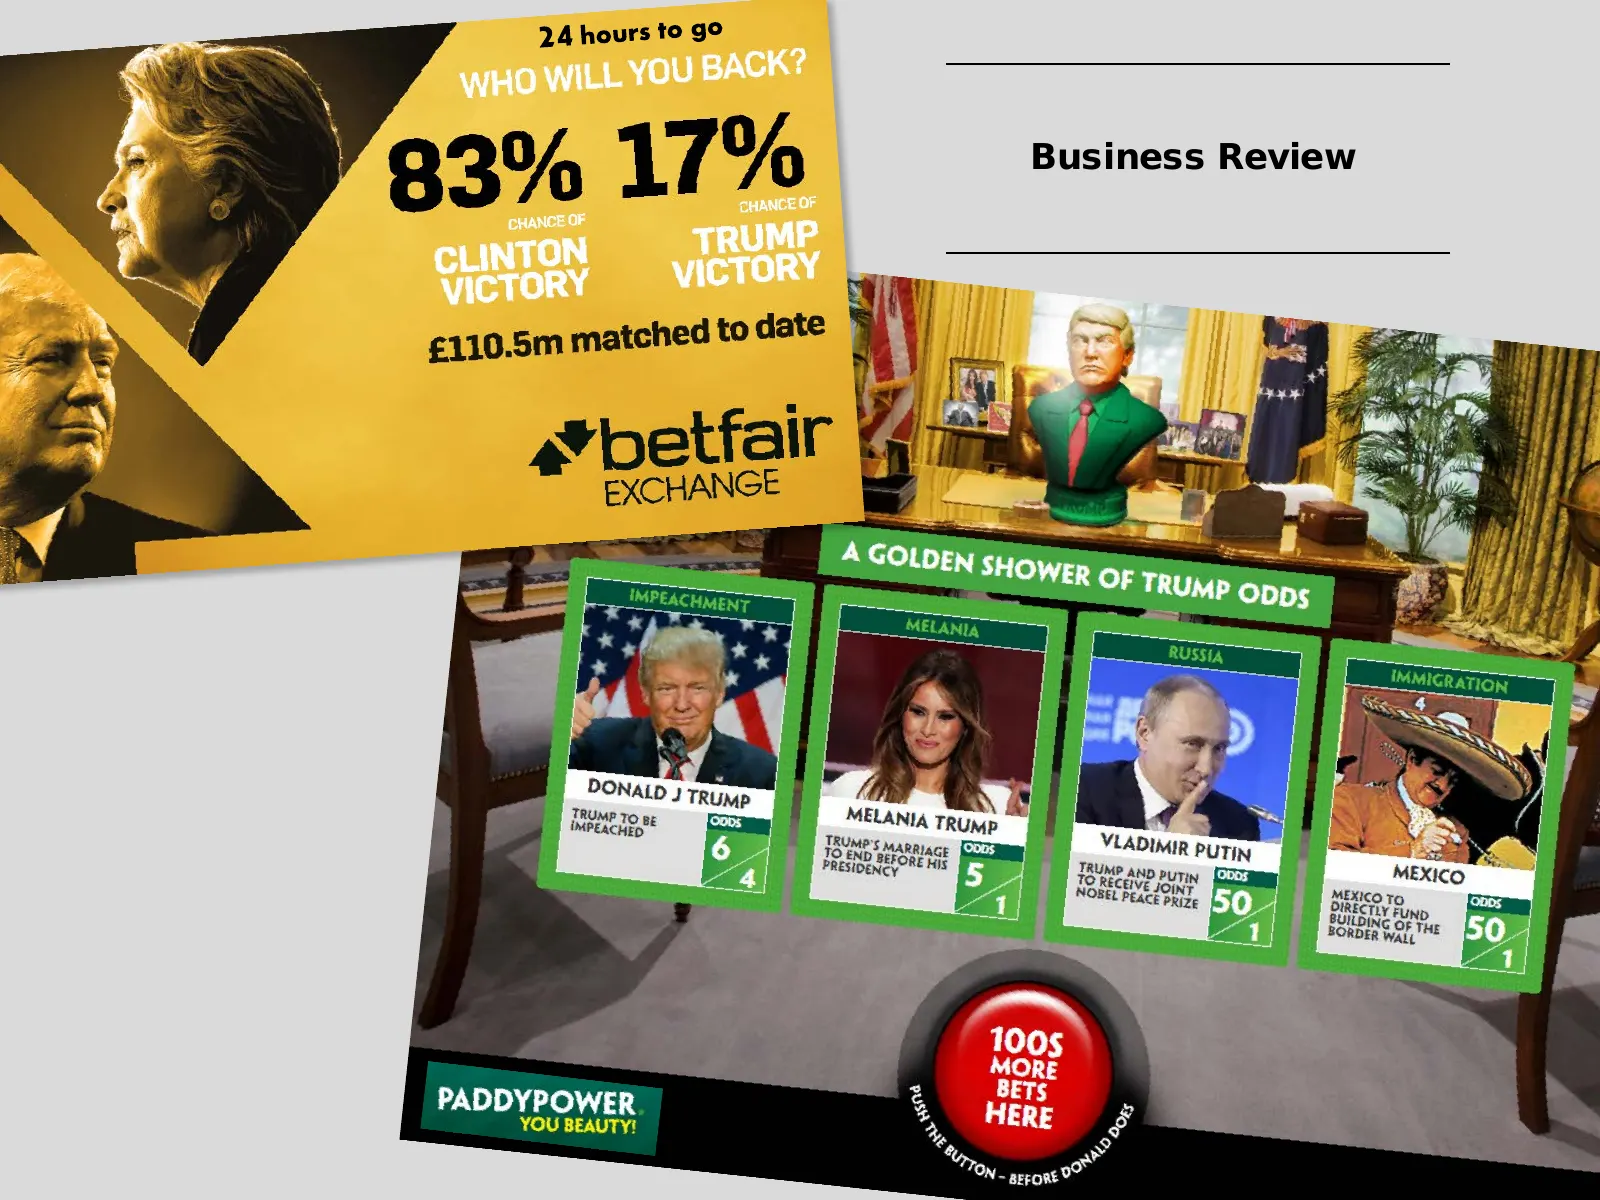
24 hours to g° 83% 17% Business Review ate £110.5m matched to di a* betfair Yat EXCHANGE “ = - PONALD J TRUMP TRUMP 10 ee IMPEACHED: Joons | rma TRUMP DaMARRce Foam "VLADIMIR p Pure j 13 iD BEFORE His nee MEXICO TRumi ID PUTIN Cora jones) te OaeceE JOINT BRS, FUND EL PEACE PRIZE BYUDING OF fie f FOR
Slide 14: Key priorities
14 Key priorities 1 Capitalising on our enhanced scale 2 Combining the best assets and capabilities of each legacy business 3 Optimising our brand positioning
Slide 15: Capitalising on our enhanced scale
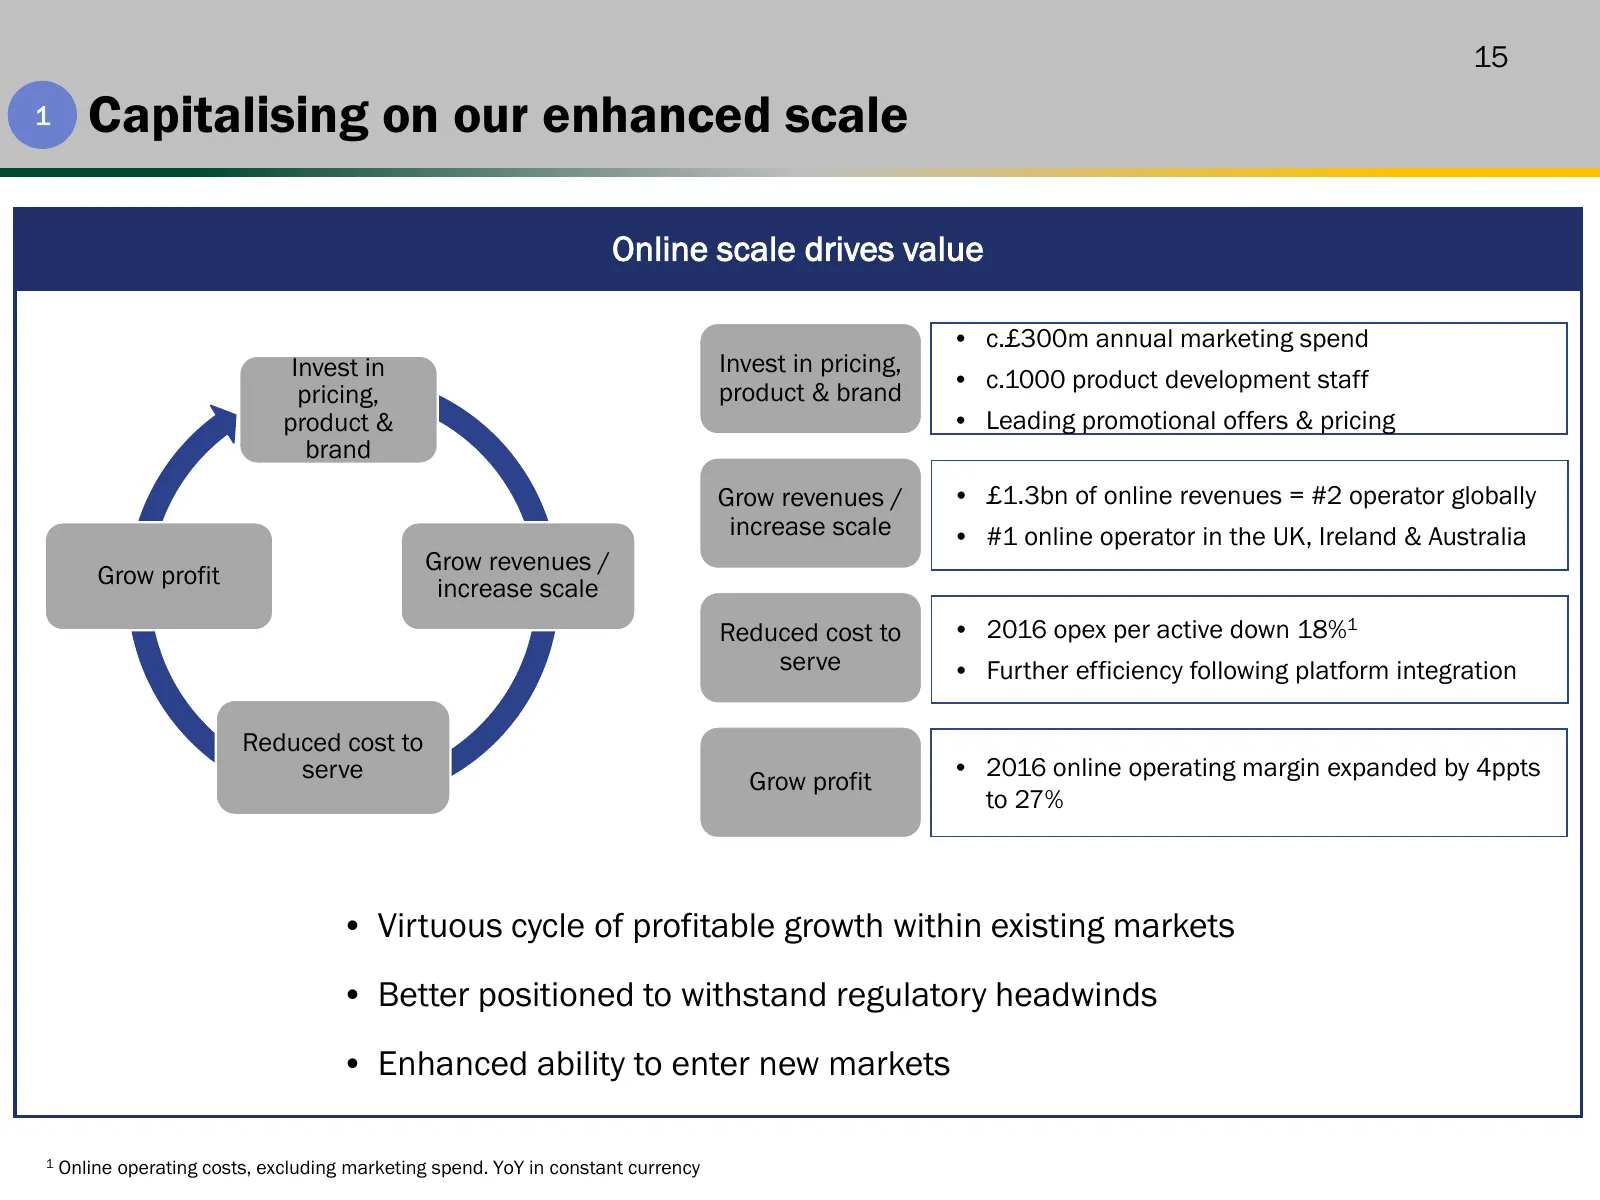
15 1 Capitalising on our enhanced scale Online scale drives value • c.£300m annual marketing spend Invest in Invest in pricing, product & brand • c.1000 product development staff pricing, product & • Leading promotional offers & pricing brand Grow revenues / • £1.3bn of online revenues = #2 operator
Slide 16: Technology – platform integration on track
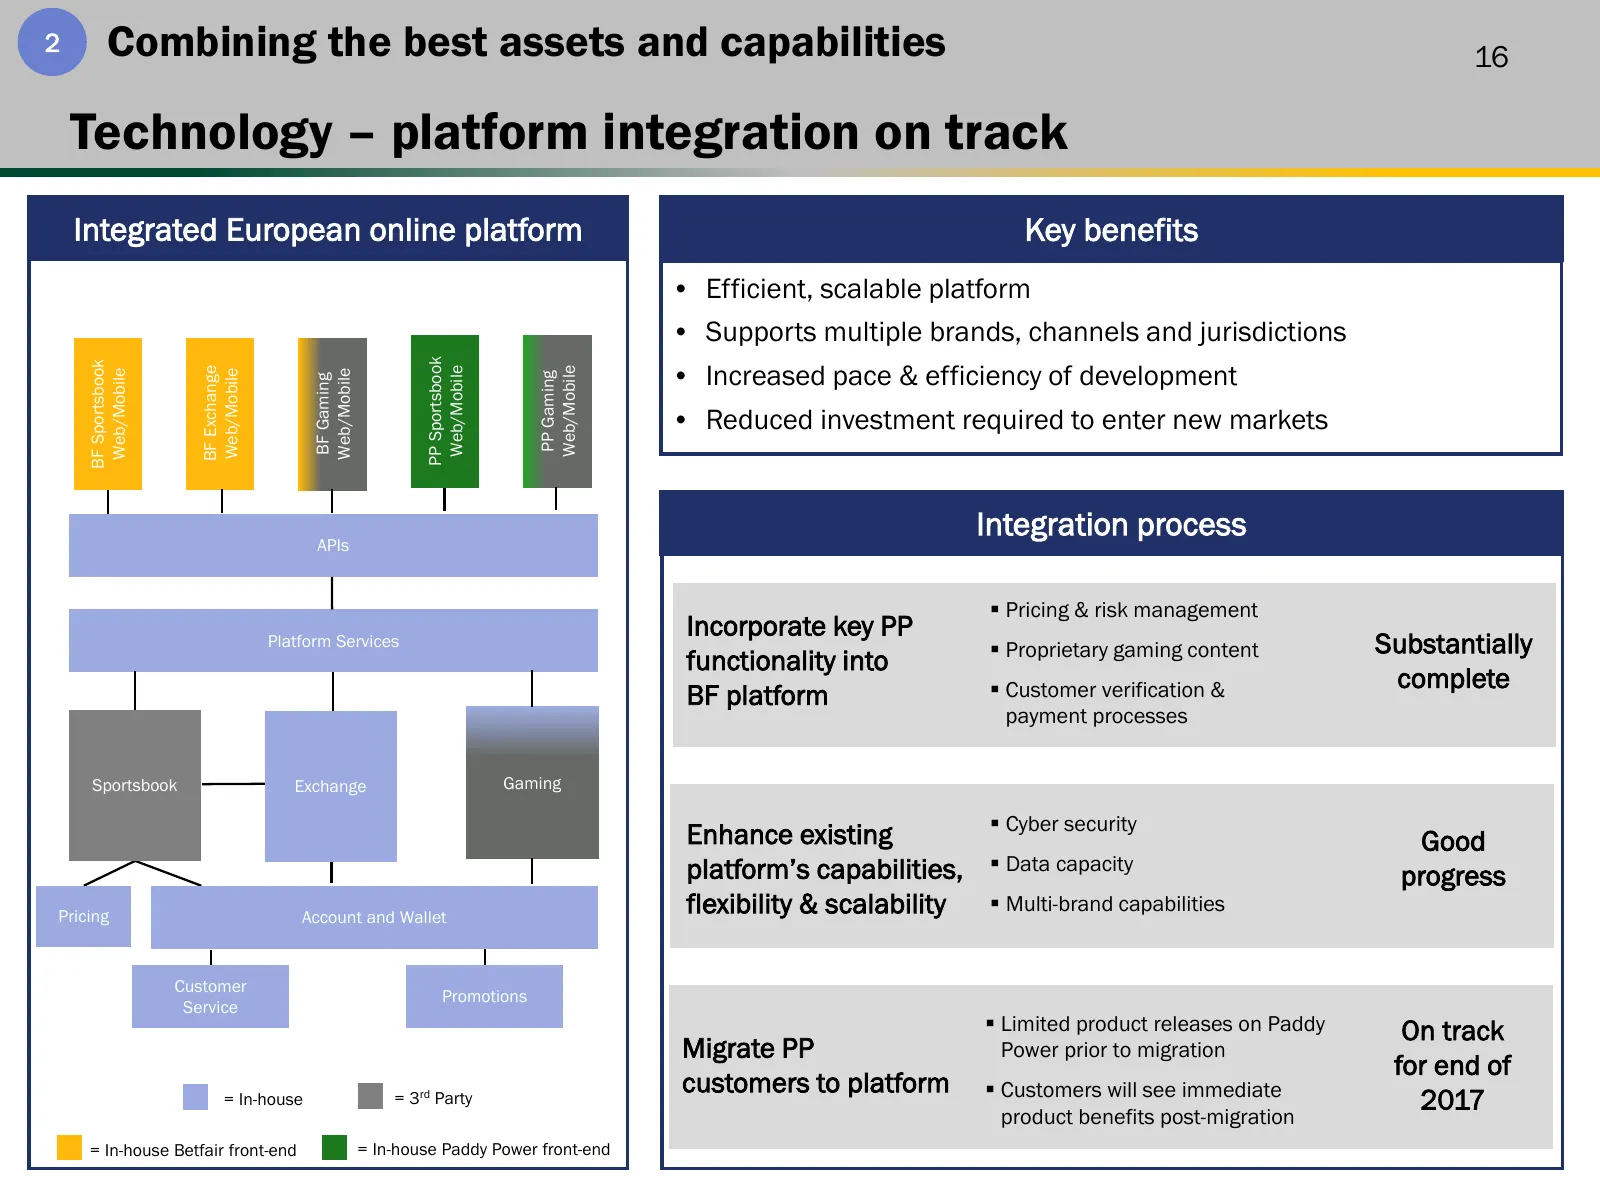
2 Combining the best assets and capabilities 16 Technology – platform integration on track Integrated European online platform Key benefits • Efficient, scalable platform • Supports multiple brands, channels and jurisdictions PP Sportsbook • Increased pace & efficiency of development BF Sportsbook B
Slide 17: Product – investing in our proposition
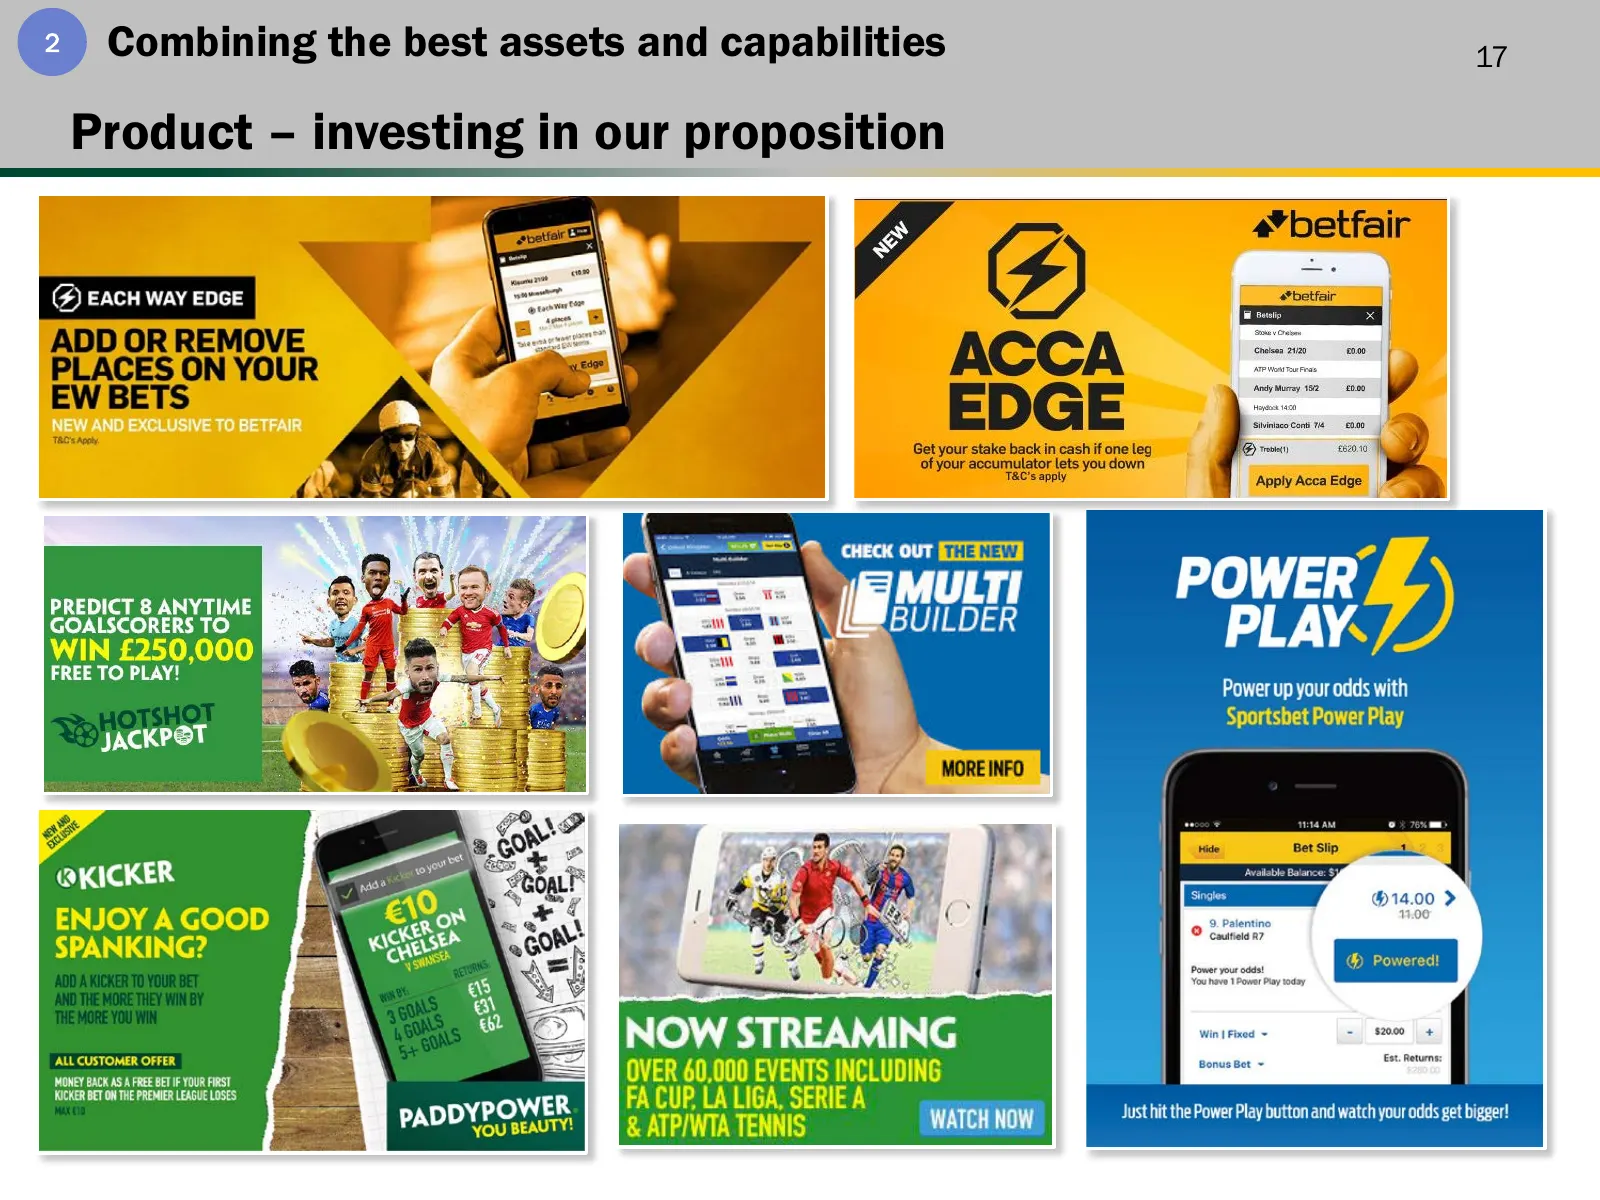
2 Combining the best assets and capabilities 17 Product – investing in our proposition
Slide 18: Risk & trading
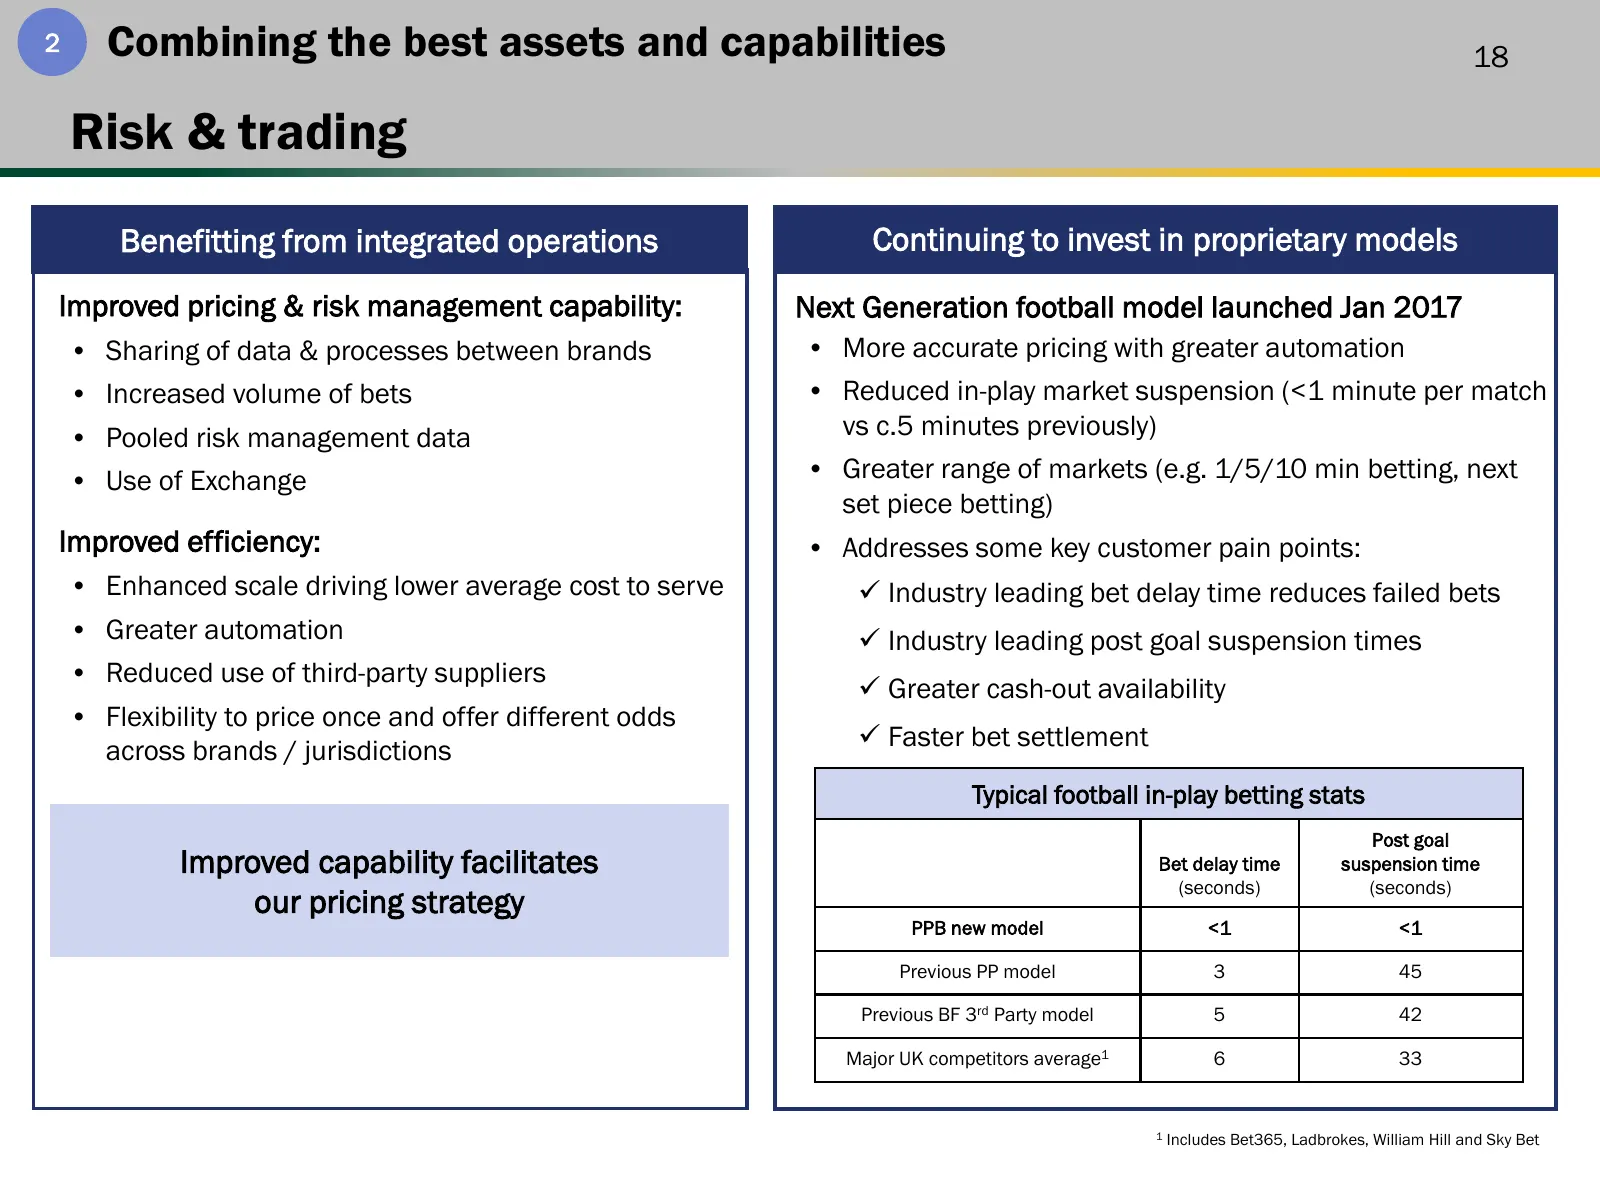
2 Combining the best assets and capabilities 18 Risk & trading Benefitting from integrated operations Continuing to invest in proprietary models Improved pricing & risk management capability: Next Generation football model launched Jan 2017 • Sharing of data & processes between brands • More accurat
Slide 19: Communicating differently
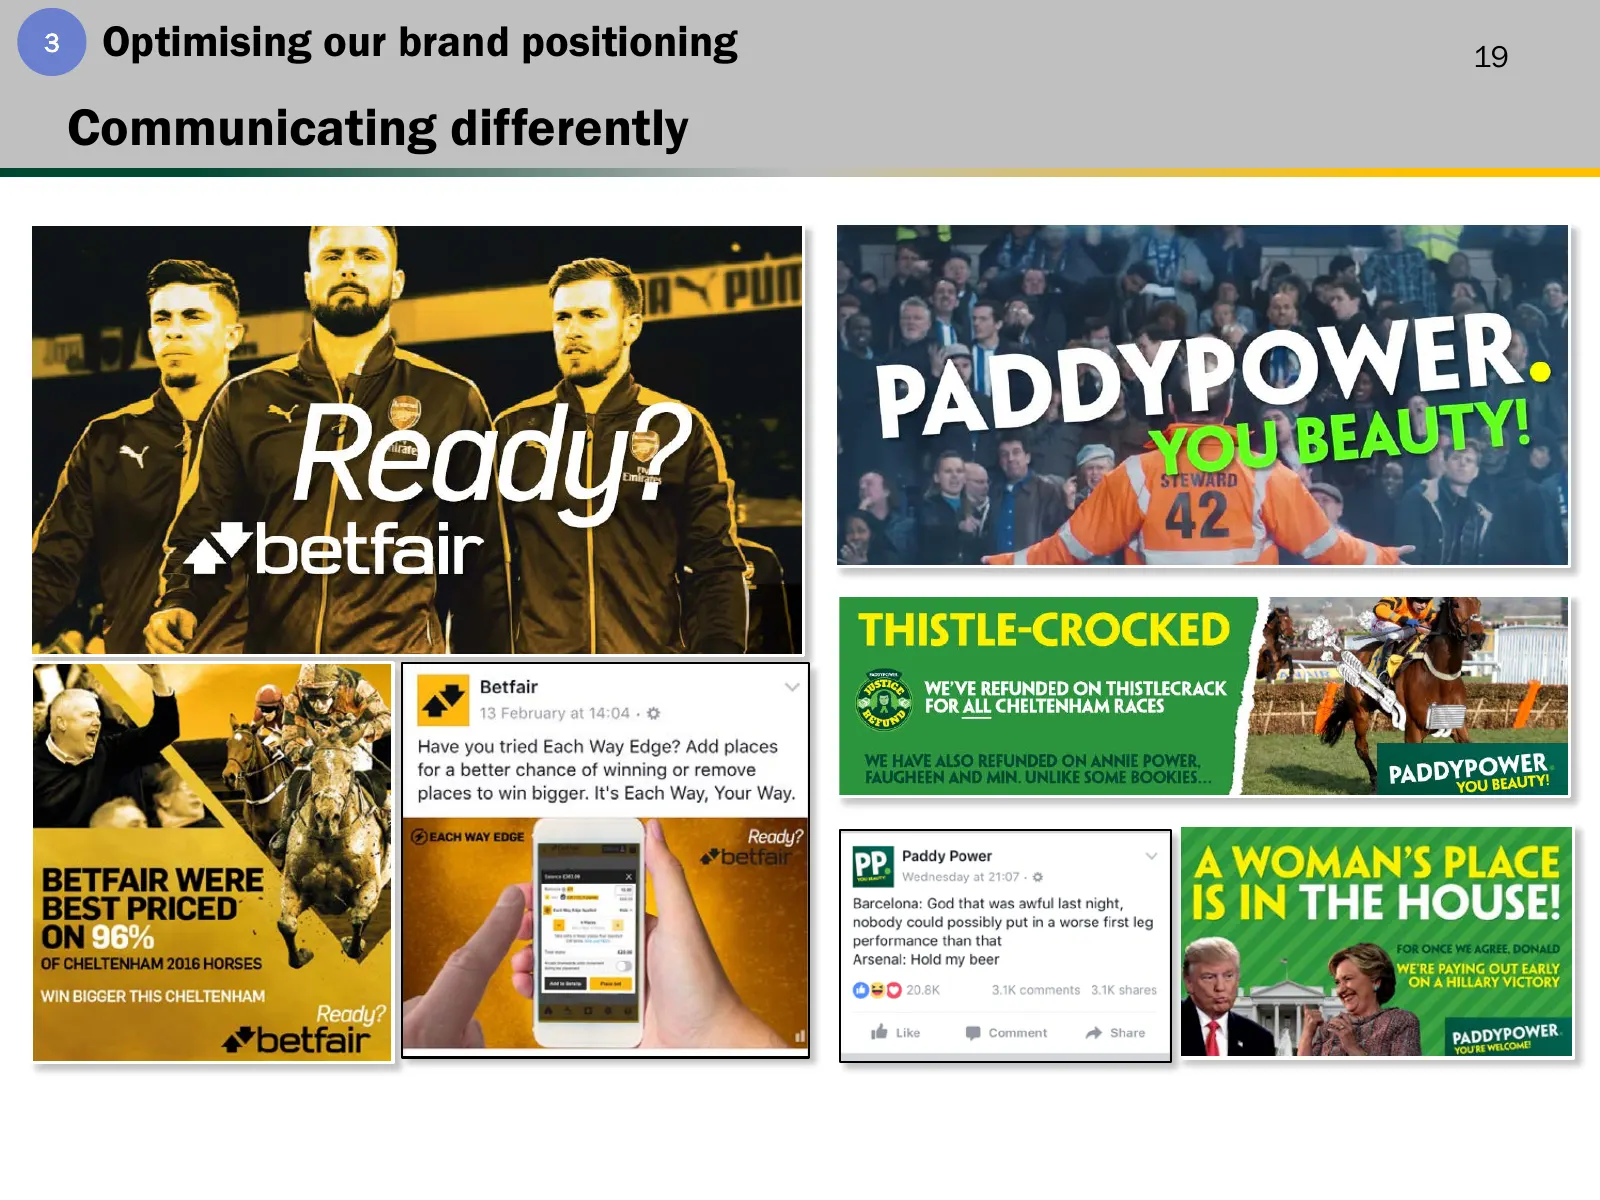
3 Optimising our brand positioning 19 Communicating differently
Slide 20: Distinct value propositions
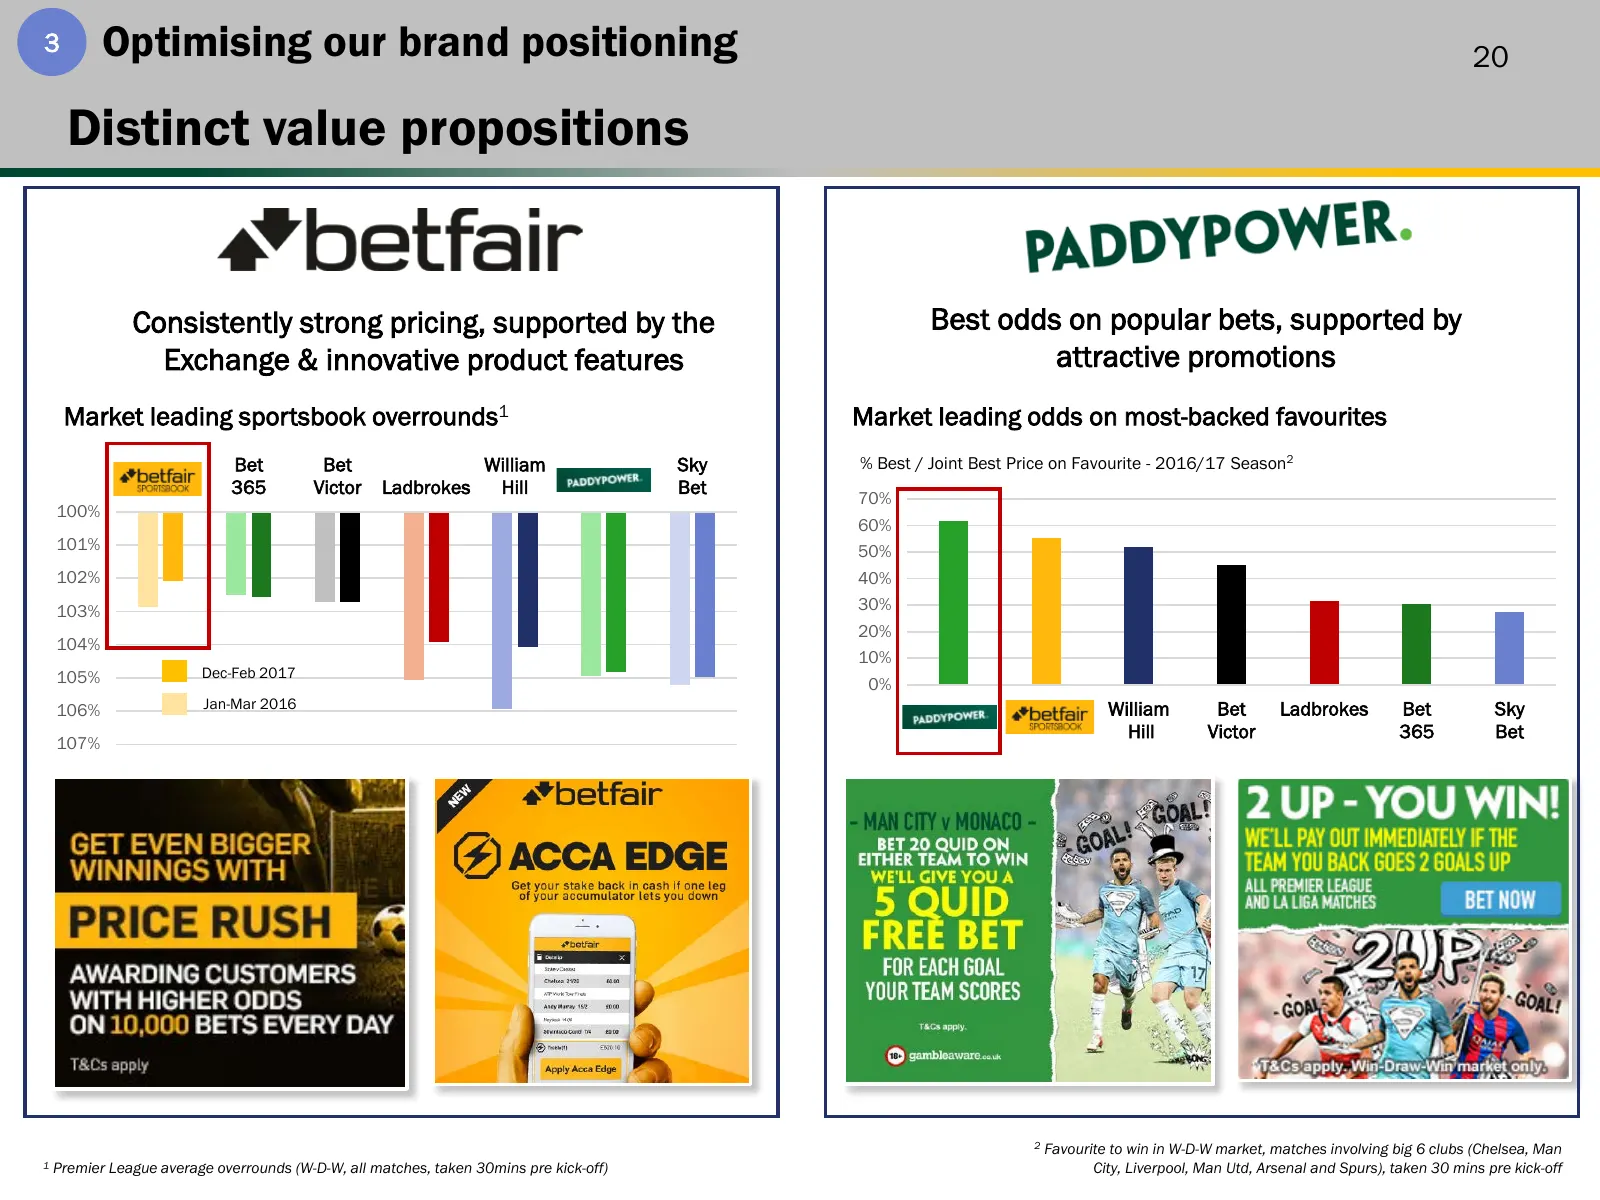
3 Optimising our brand positioning 20 Distinct value propositions Consistently strong pricing, supported by the Best odds on popular bets, supported by Exchange & innovative product features attractive promotions Market leading sportsbook overrounds1 Market leading odds on most-backed favourites Bet
Slide 21: Australia
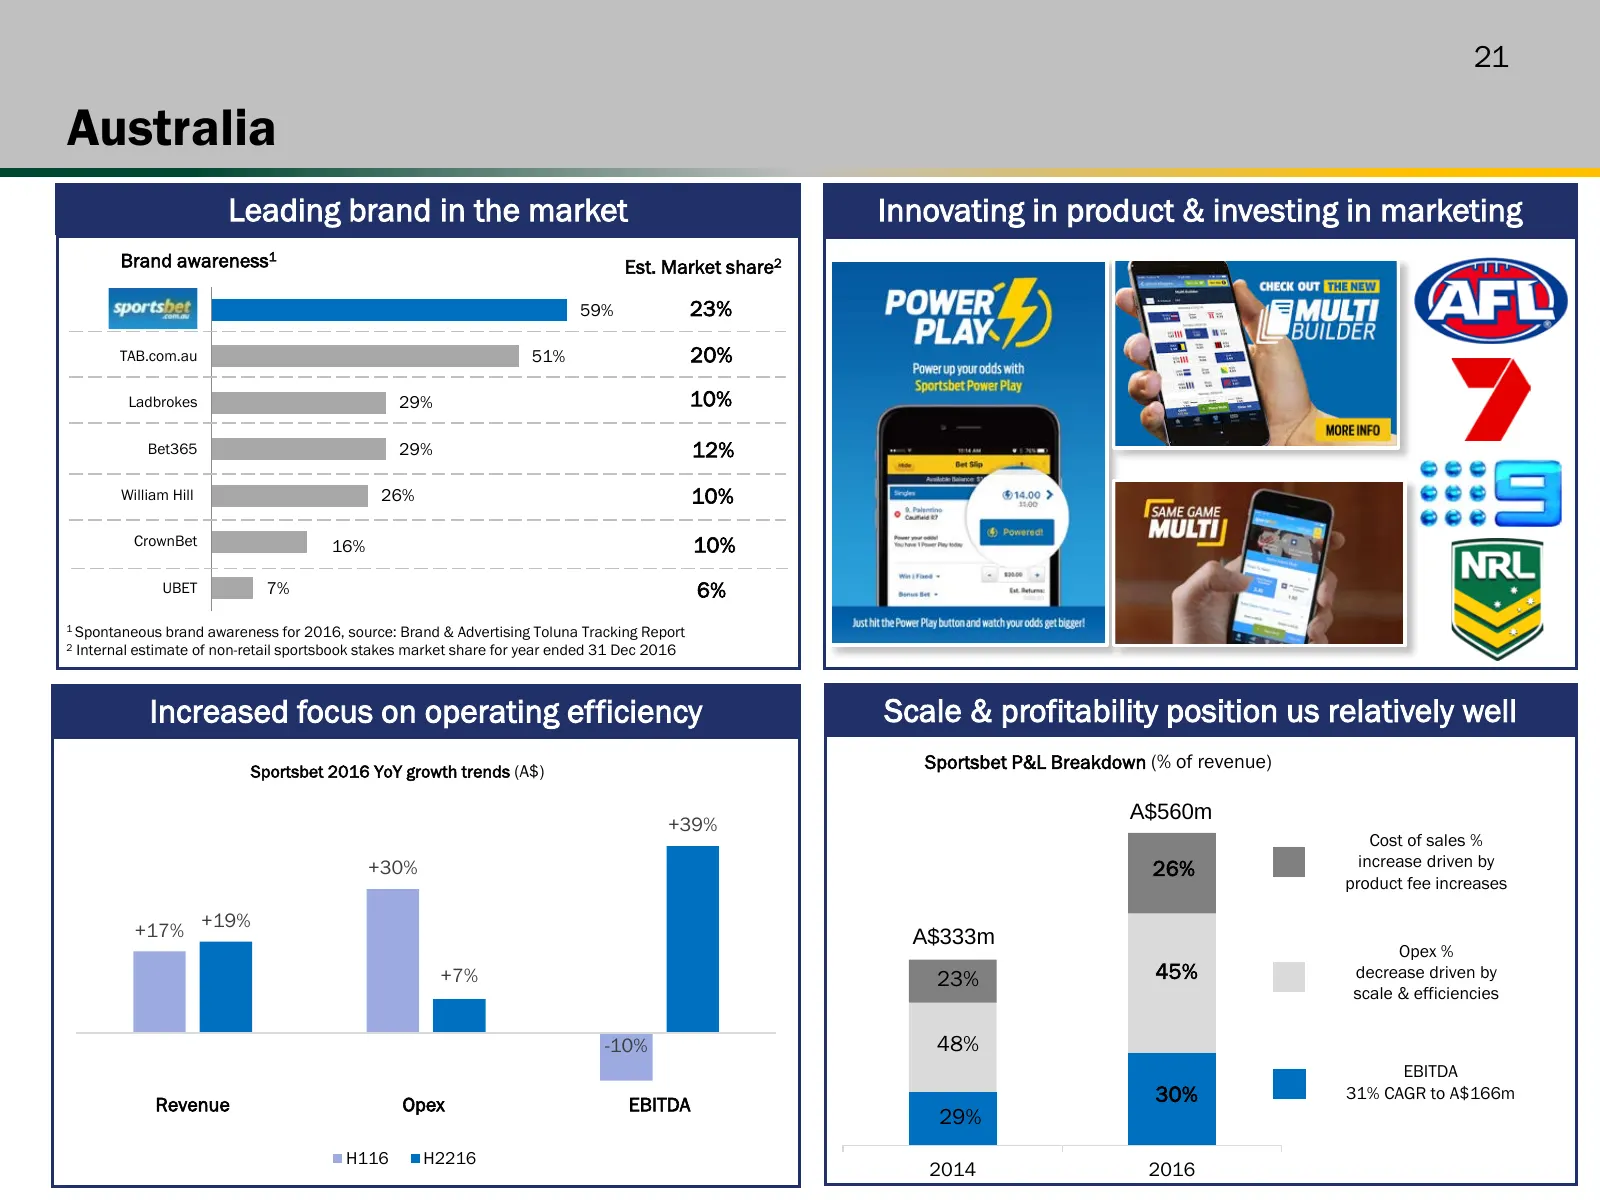
21 Australia Leading brand in the market Innovating in product & investing in marketing Brand awareness1 Est. Market share2 59% 23% TAB.com.au 51% 20% Ladbrokes 29% 10% Bet365 29% 12% William Hill 26% 10% CrownBet 16% 10% UBET 7% 6% 1 Spontaneous brand awareness for 2016, source: Brand & Advertising
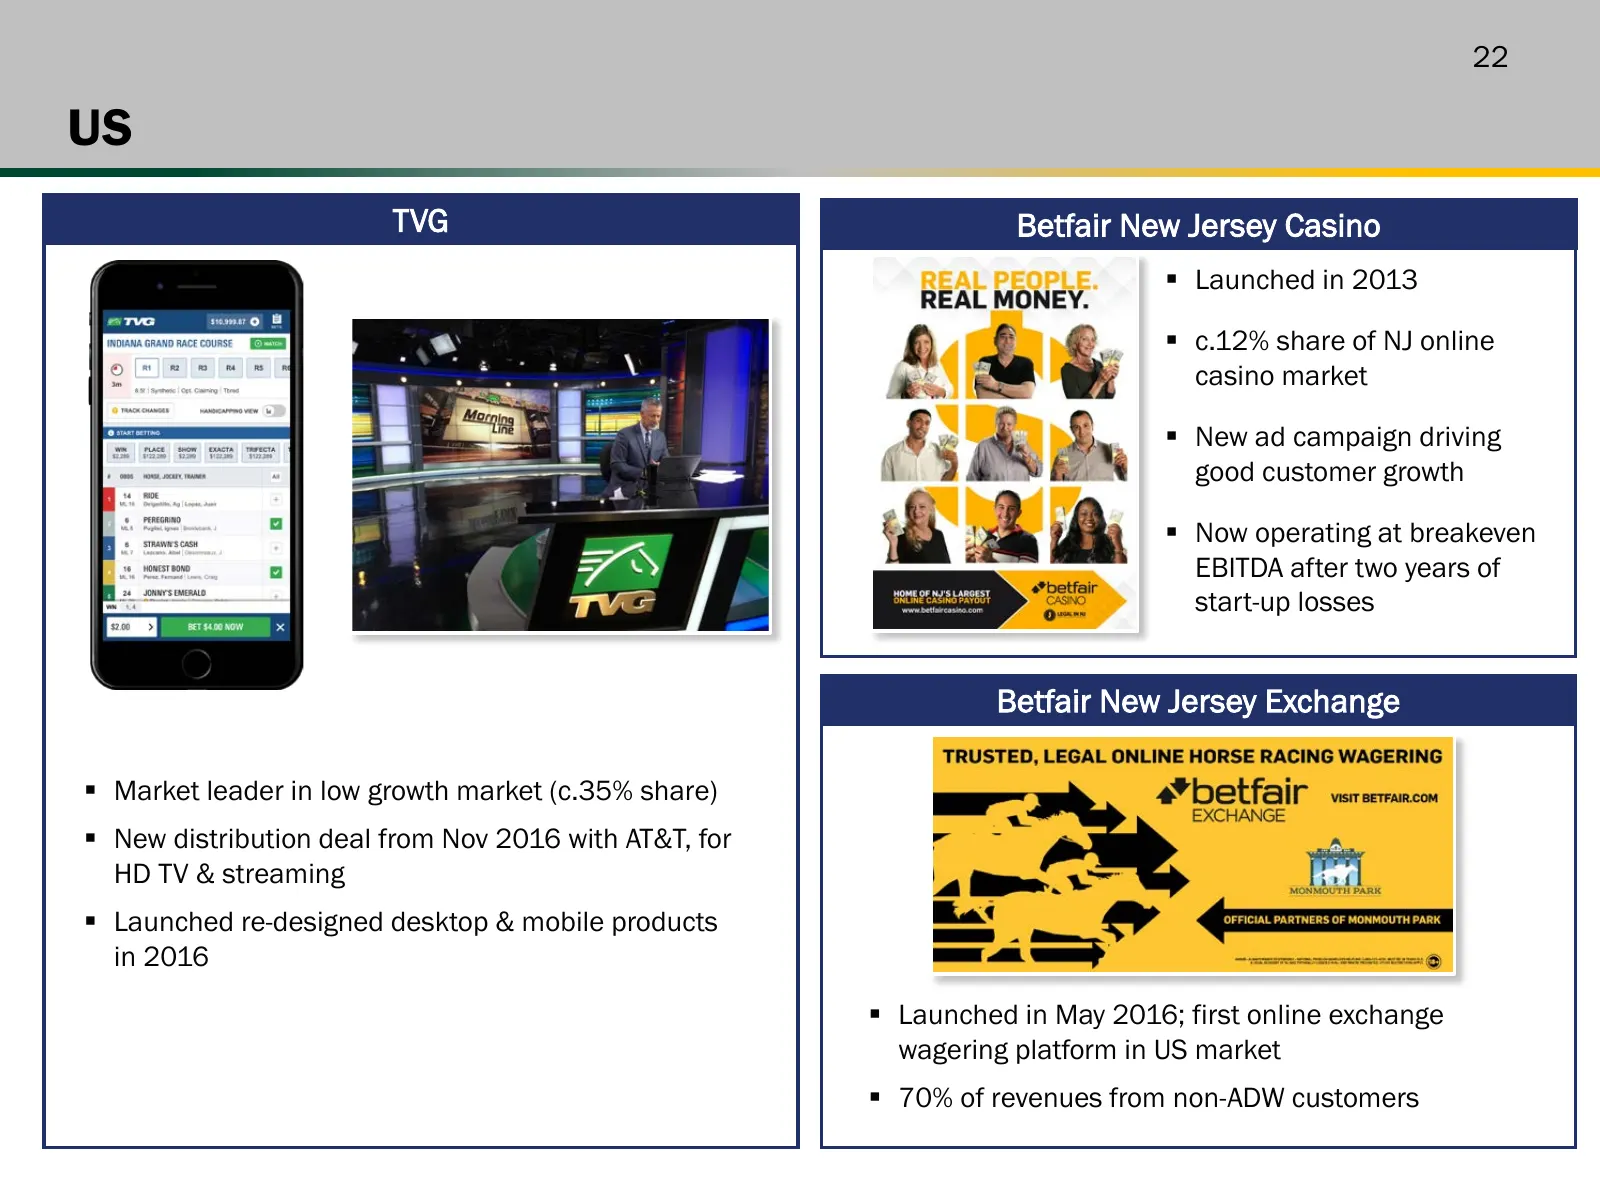
Slide 22: US
22 US TVG Betfair New Jersey Casino Launched in 2013 c.12% share of NJ online casino market New ad campaign driving good customer growth Now operating at breakeven EBITDA after two years of start-up losses Betfair New Jersey Exchange Market leader in low growth market (c.35% share) New d
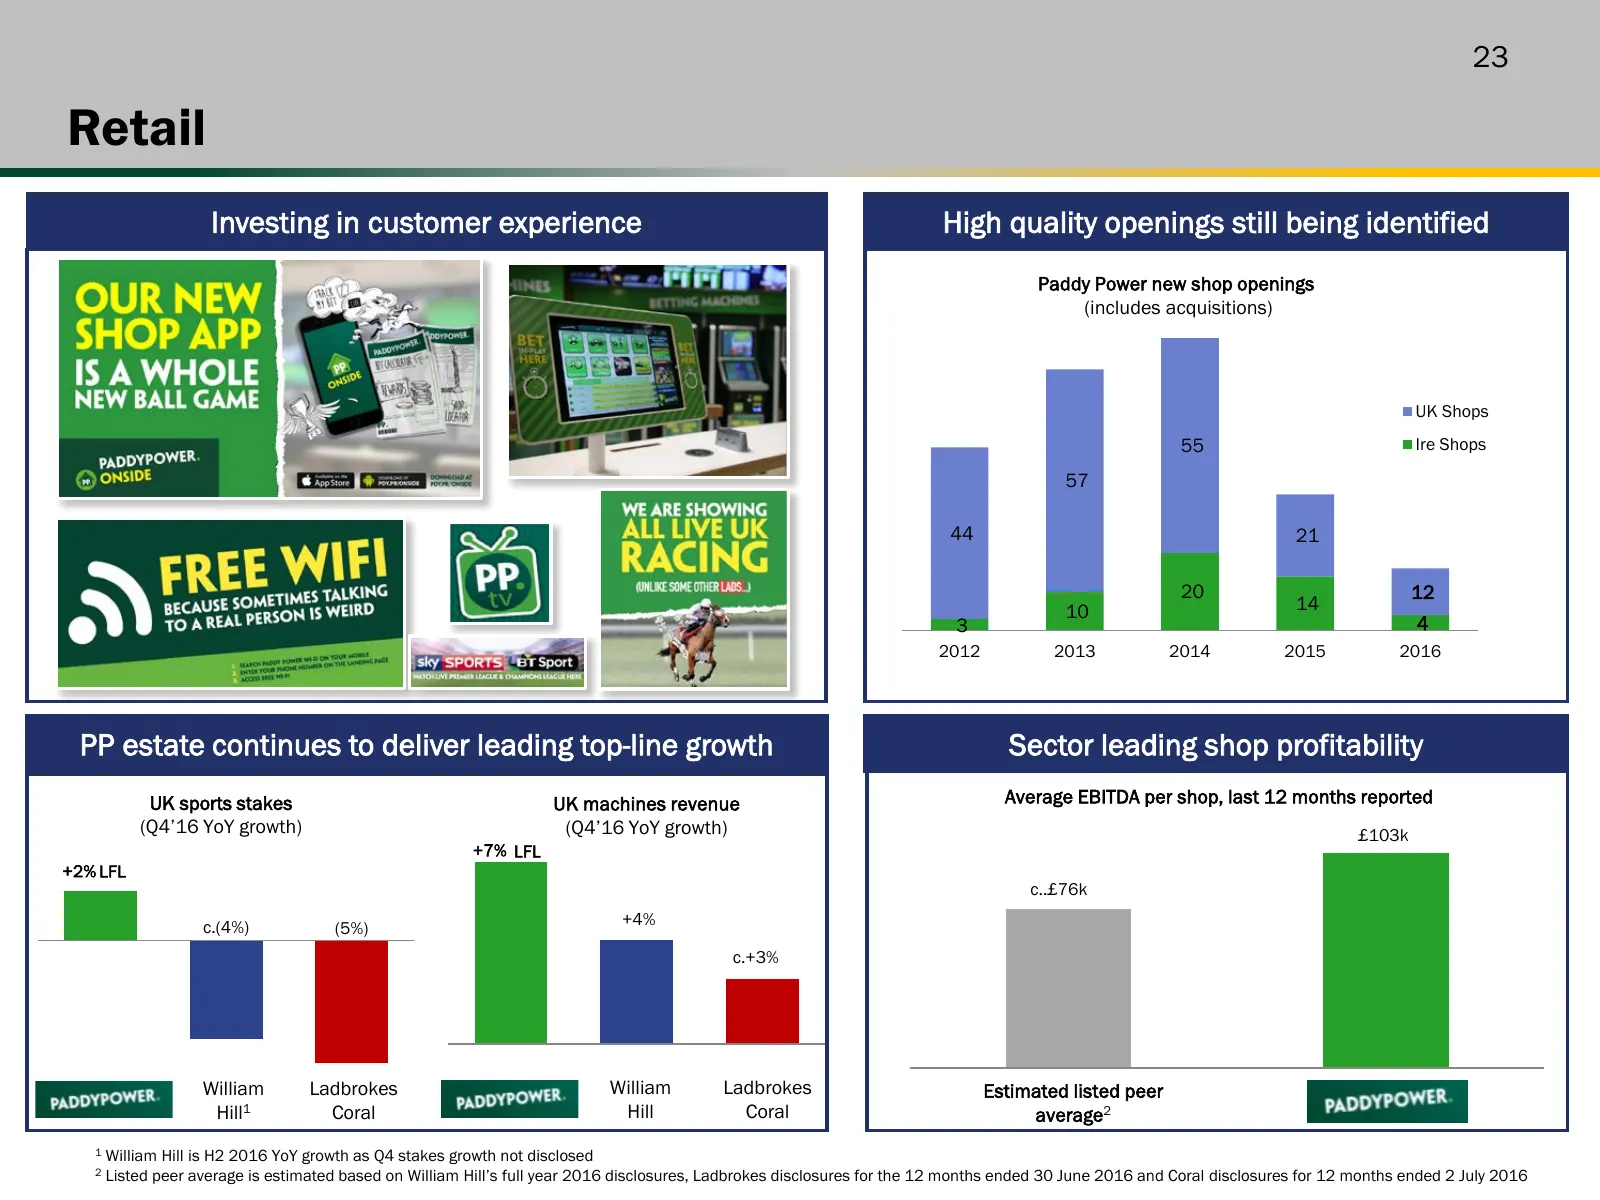
Slide 23: Retail
23 Retail Investing in customer experience High quality openings still being identified Paddy Power new shop openings (includes acquisitions) UK Shops 55 Ire Shops 57 44 21 20 12 10 14 3 4 2012 2013 2014 2015 2016 PP estate continues to deliver leading top-line growth Sector leading shop profitabili
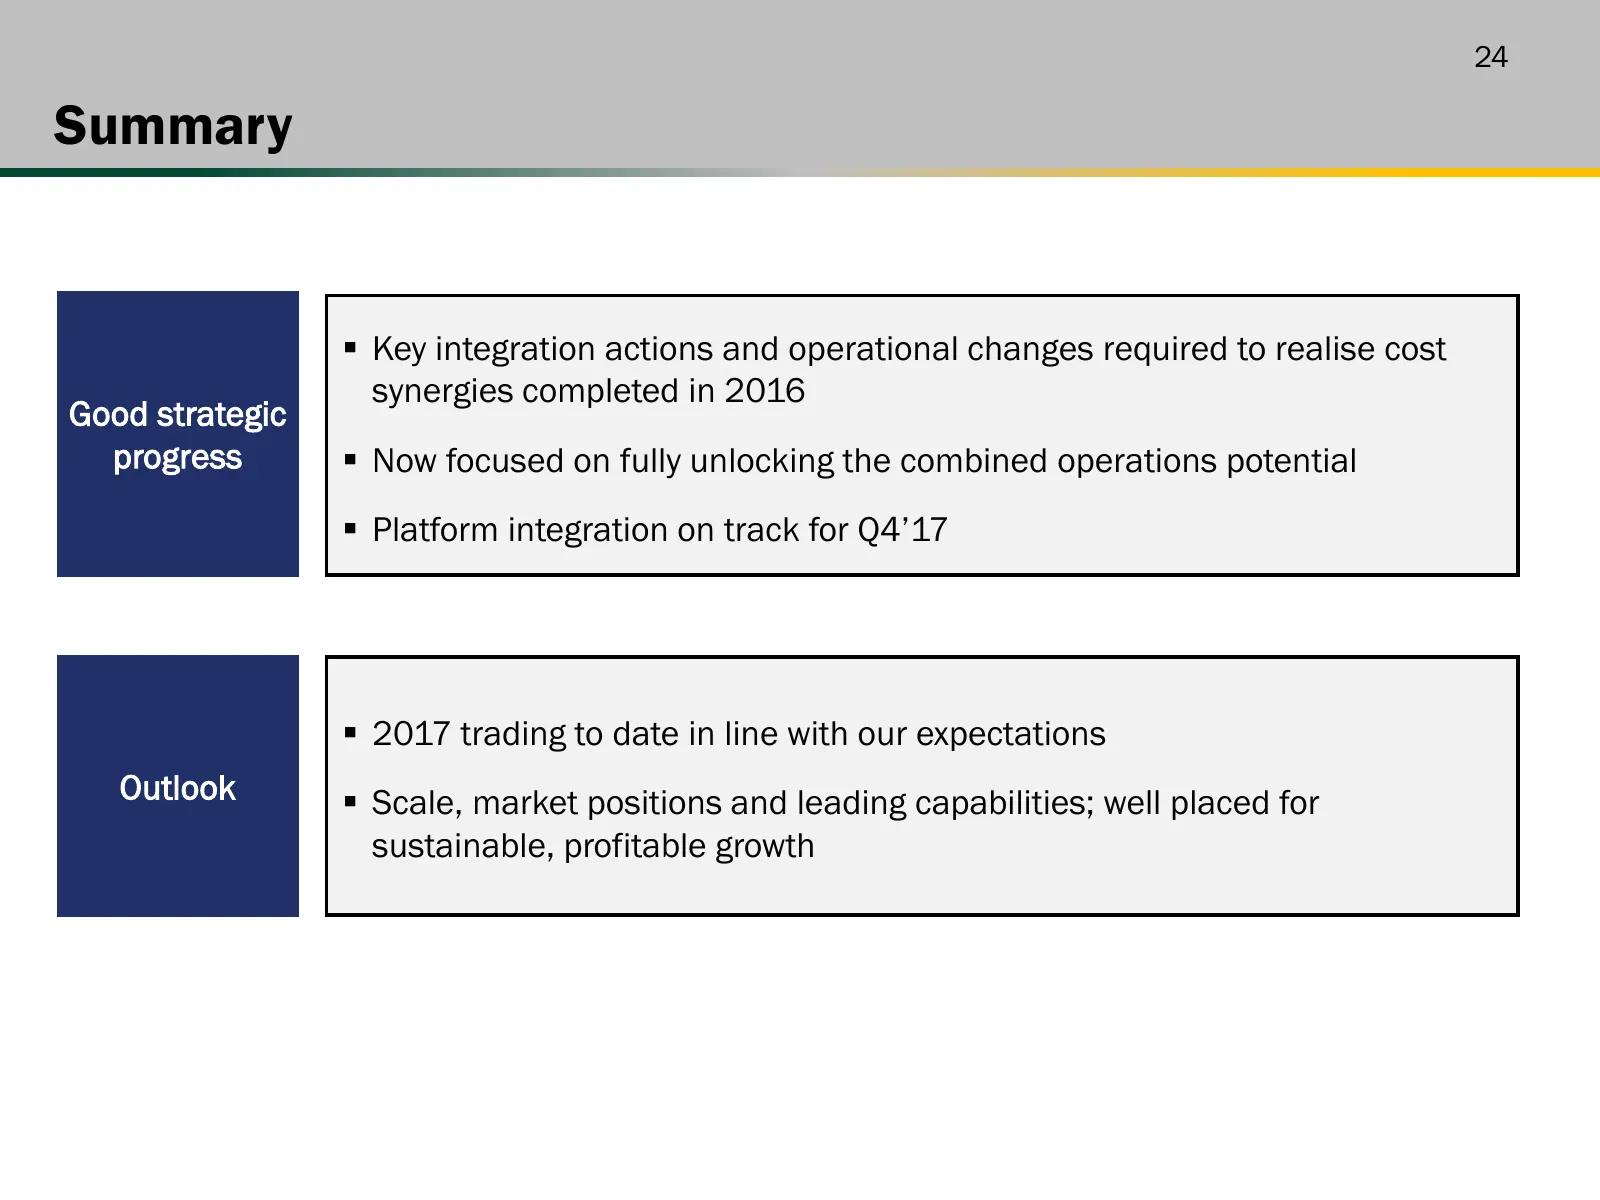
Slide 24: Summary
24 Summary Key integration actions and operational changes required to realise cost synergies completed in 2016 Good strategic progress Now focused on fully unlocking the combined operations potential Platform integration on track for Q4’17 2017 trading to date in line with our expectations

Slide 25: Q&A
Q&A [find new imagery for cover]

Slide 26: Appendix
Appendix [find new imagery for cover]
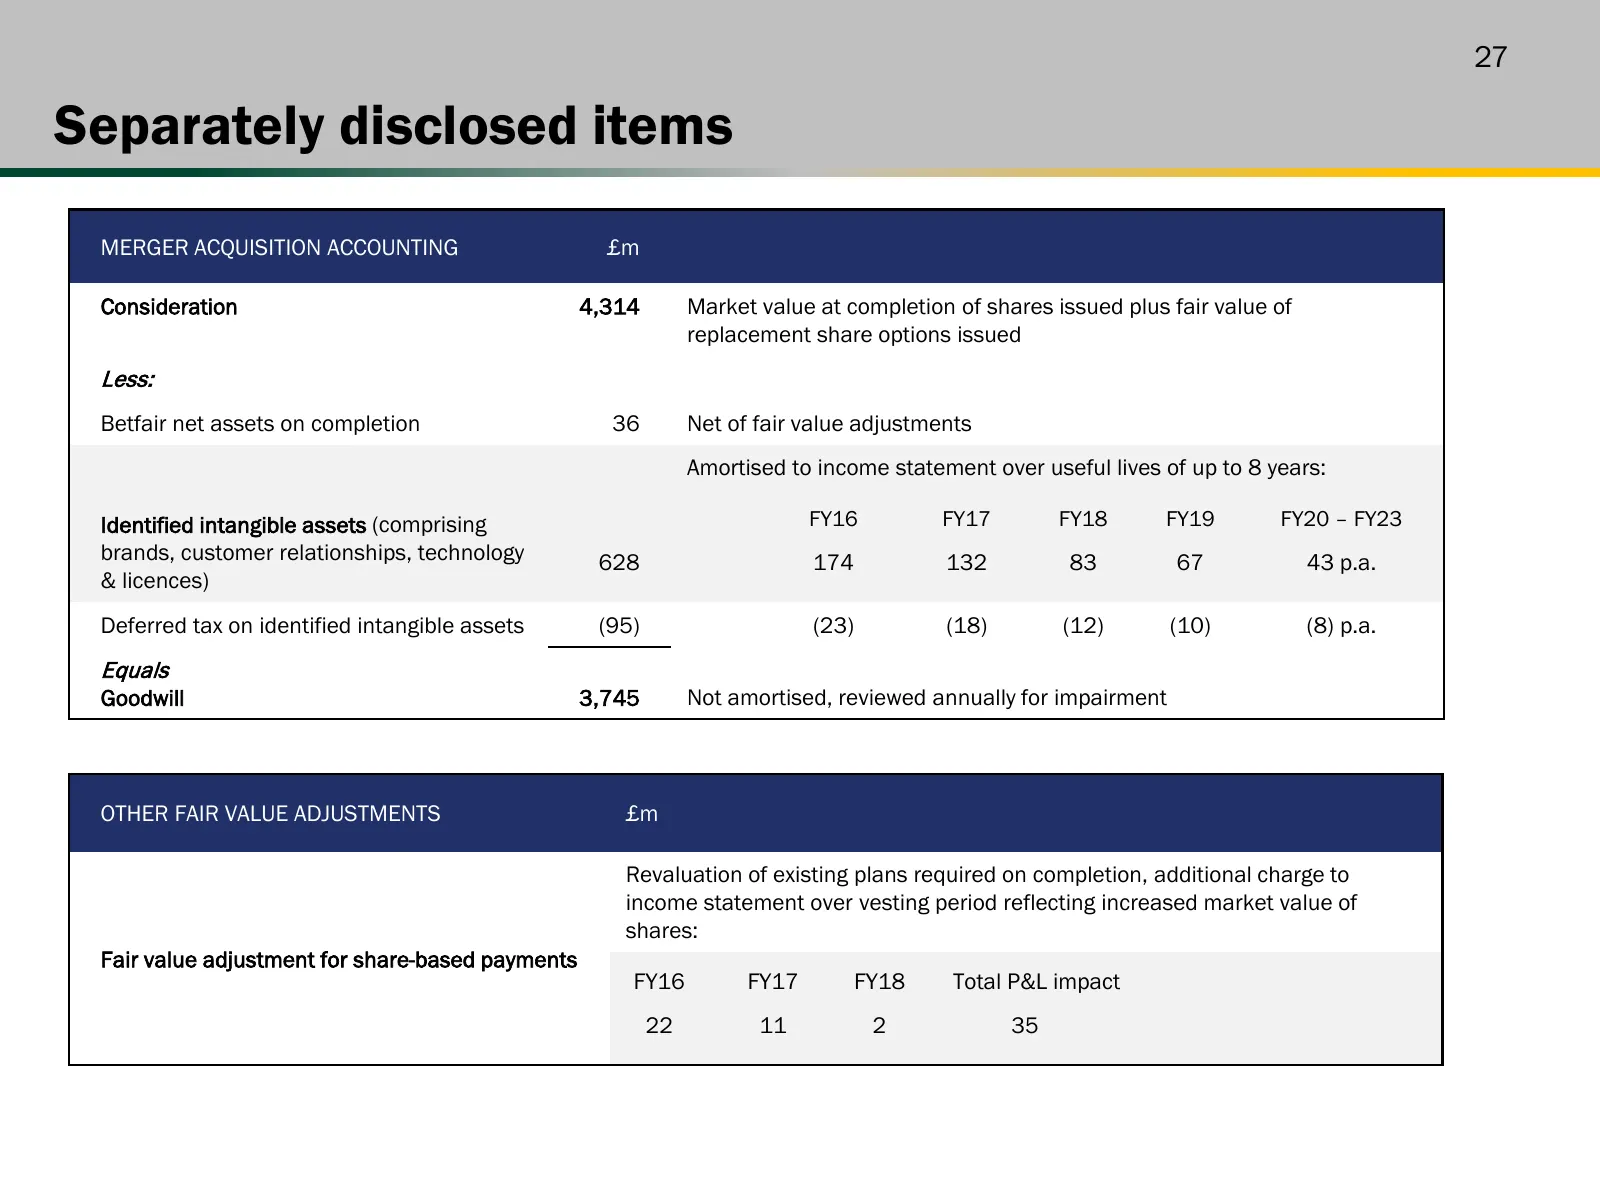
Slide 27: Separately disclosed items
27 Separately disclosed items MERGER ACQUISITION ACCOUNTING £m Consideration 4,314 Market value at completion of shares issued plus fair value of replacement share options issued Less: Betfair net assets on completion 36 Net of fair value adjustments Amortised to income statement over useful lives o
Source: Internet Archive copy of flutter.com
More decks from Flutter Entertainment plc
 Q3 2026 Earnings Presentation15 slides · Nov 4, 2026
 Q2 2026 Earnings Presentation14 slides · Aug 5, 2026
 Investor Day (September 2024)152 slides · Sep 25, 2024
 Q2 2024 Earnings Presentation20 slides · Aug 13, 2024
 Q1 2024 Earnings Presentation20 slides · May 14, 2024
 FY2023 Earnings Presentation36 slides · Mar 26, 2024