Accel Entertainment, Inc. · NYSE:ACEL
Accel Entertainment — SPAC Merger (October 2019)
54 slides from Accel Entertainment's SPAC merger presentation, October 2019
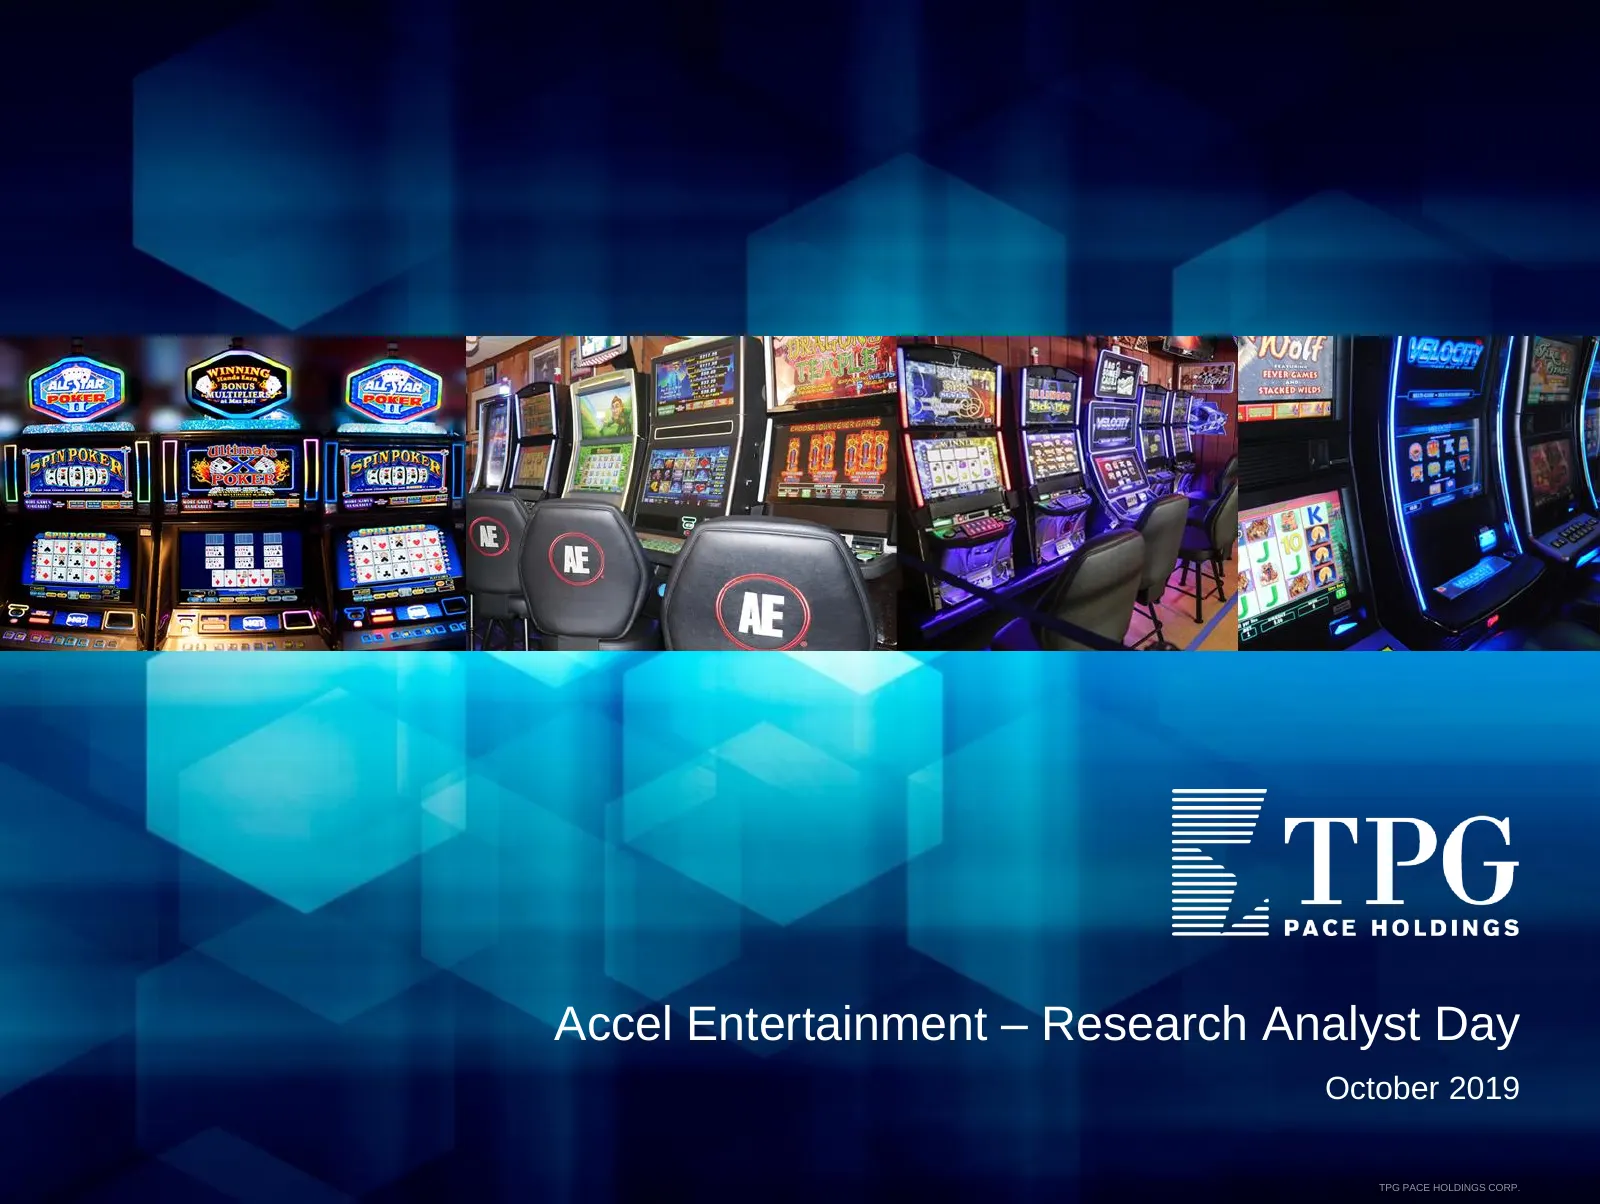
Slide 1: Accel Entertainment – Research Analyst Day
Accel Entertainment – Research Analyst Day October 2019 TPG PACE HOLDINGS CORP.
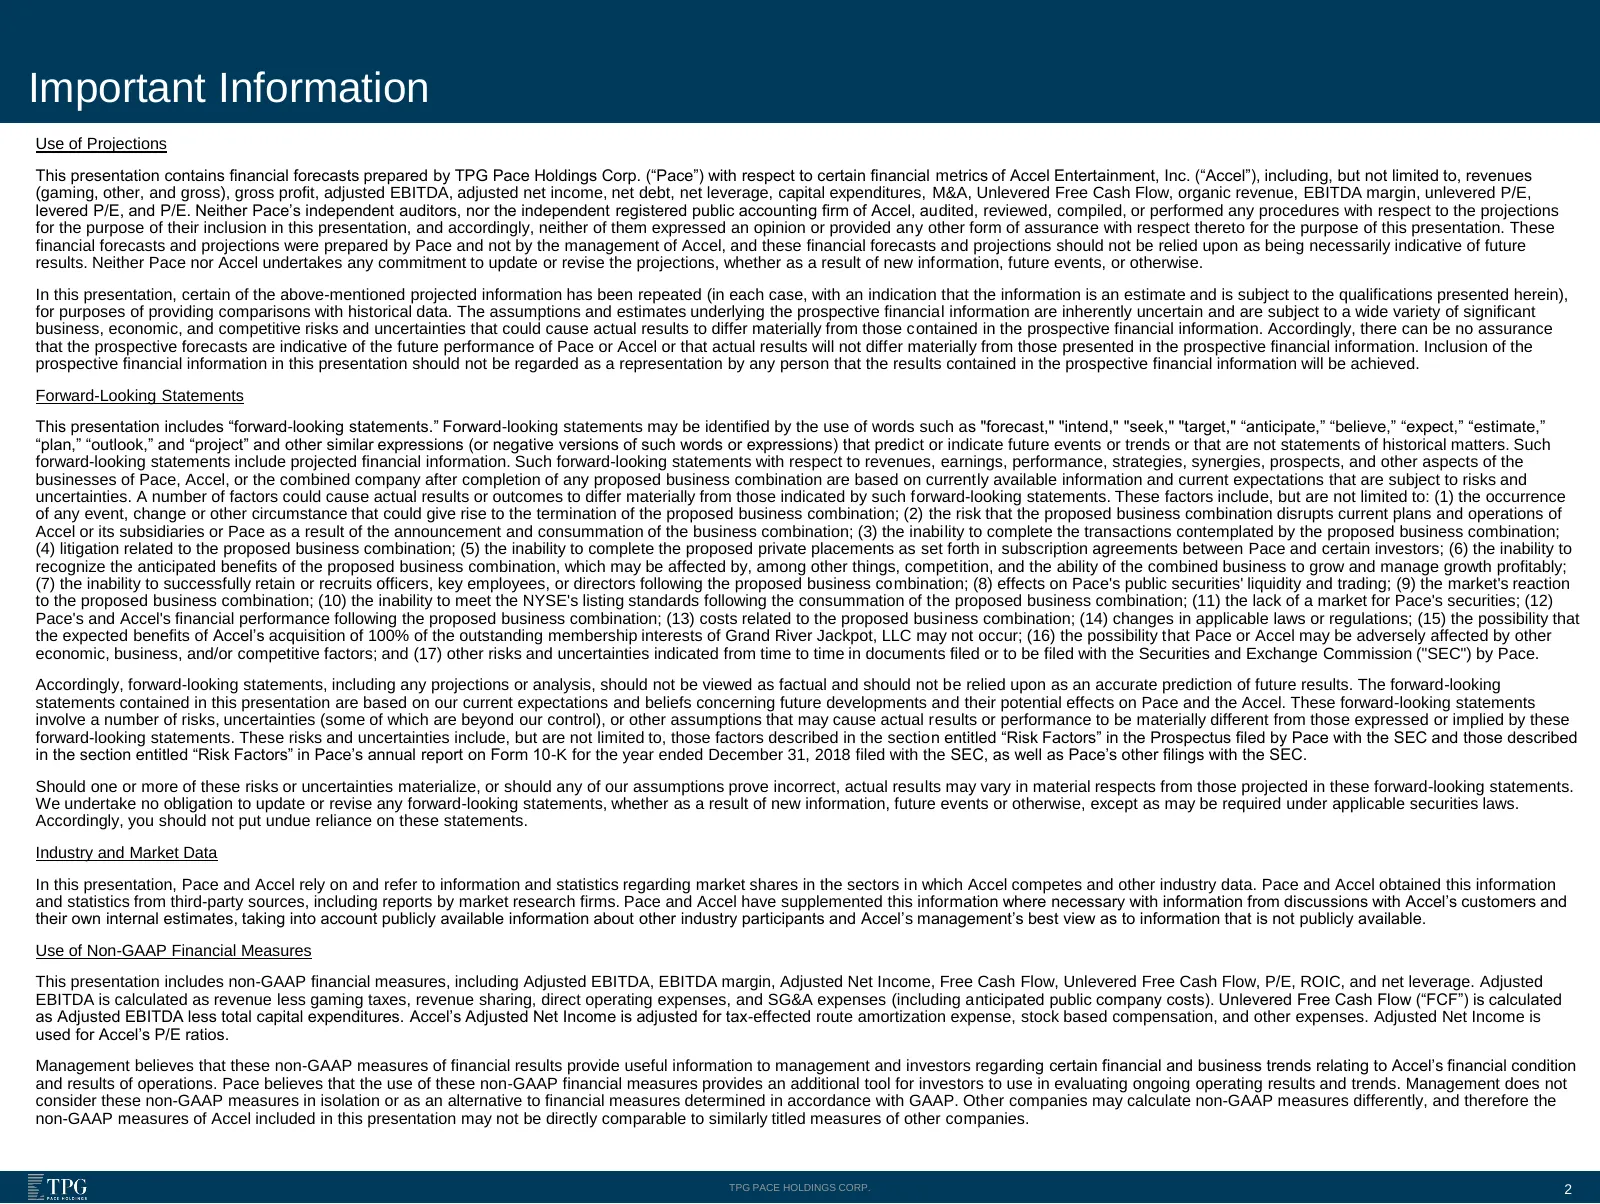
Slide 2: Important Information
Important Information Use of Projections This presentation contains financial forecasts prepared by TPG Pace Holdings Corp. (“Pace”) with respect to certain financial metrics of Accel Entertainment, Inc. (“Accel”), including, but not limited to, revenues (gaming, other, and gross), gross profit, adj
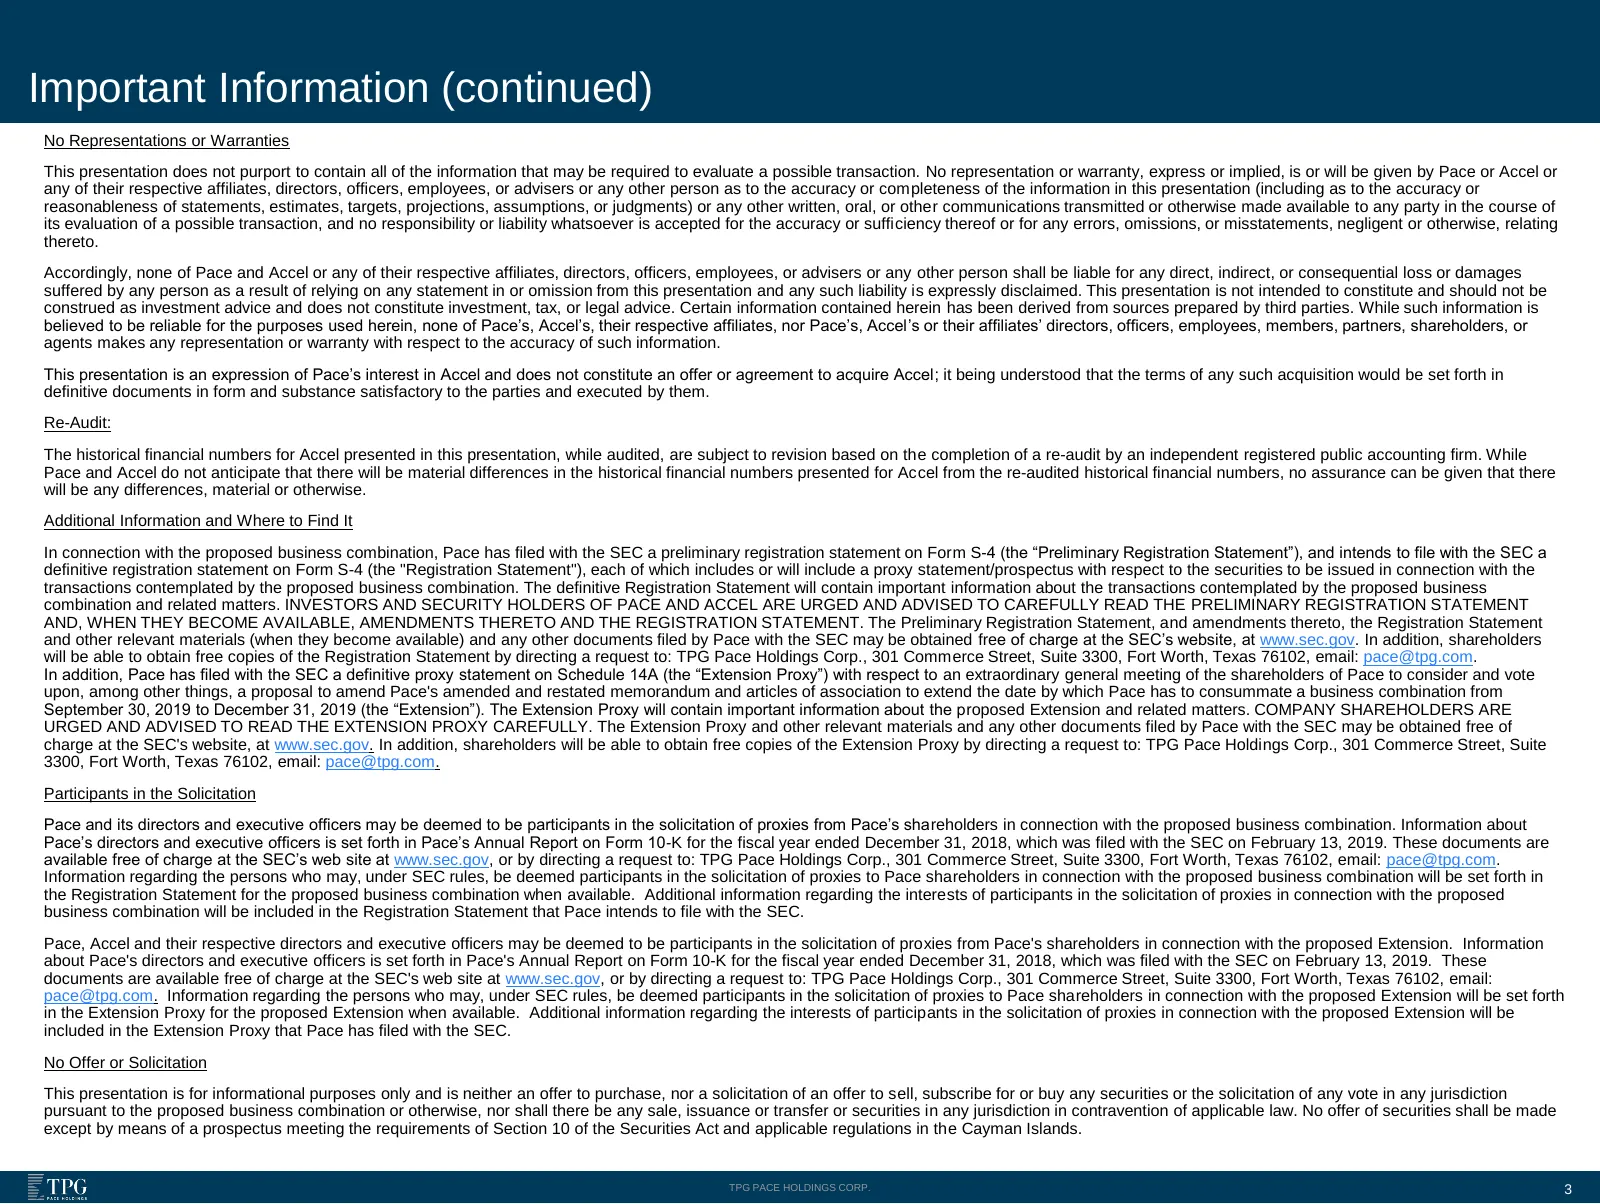
Slide 3: Important Information (continued)
Important Information (continued) No Representations or Warranties This presentation does not purport to contain all of the information that may be required to evaluate a possible transaction. No representation or warranty, express or implied, is or will be given by Pace or Accel or any of their res
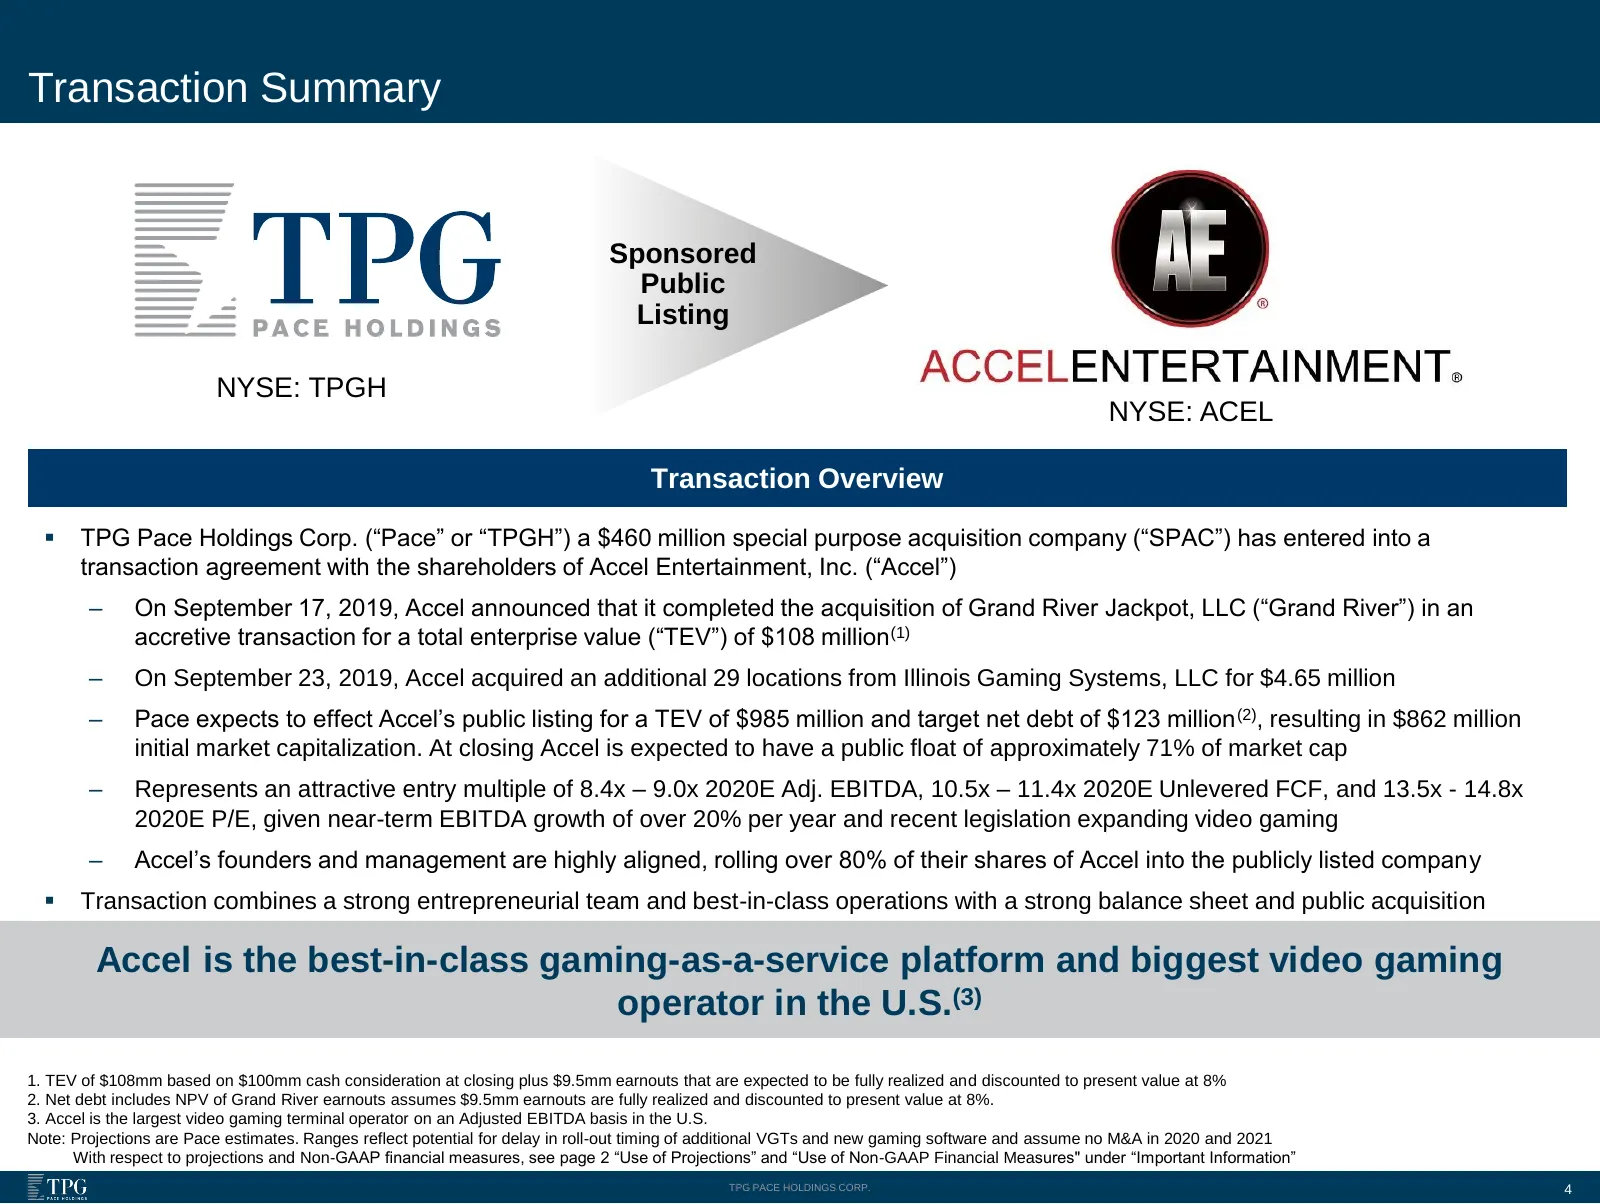
Slide 4: Transaction Summary
Transaction Summary Sponsored Public Listing NYSE: TPGH NYSE: ACEL Transaction Overview ▪ TPG Pace Holdings Corp. (“Pace” or “TPGH”) a $460 million special purpose acquisition company (“SPAC”) has entered into a transaction agreement with the shareholders of Accel Entertainment, Inc. (“Accel”) – On
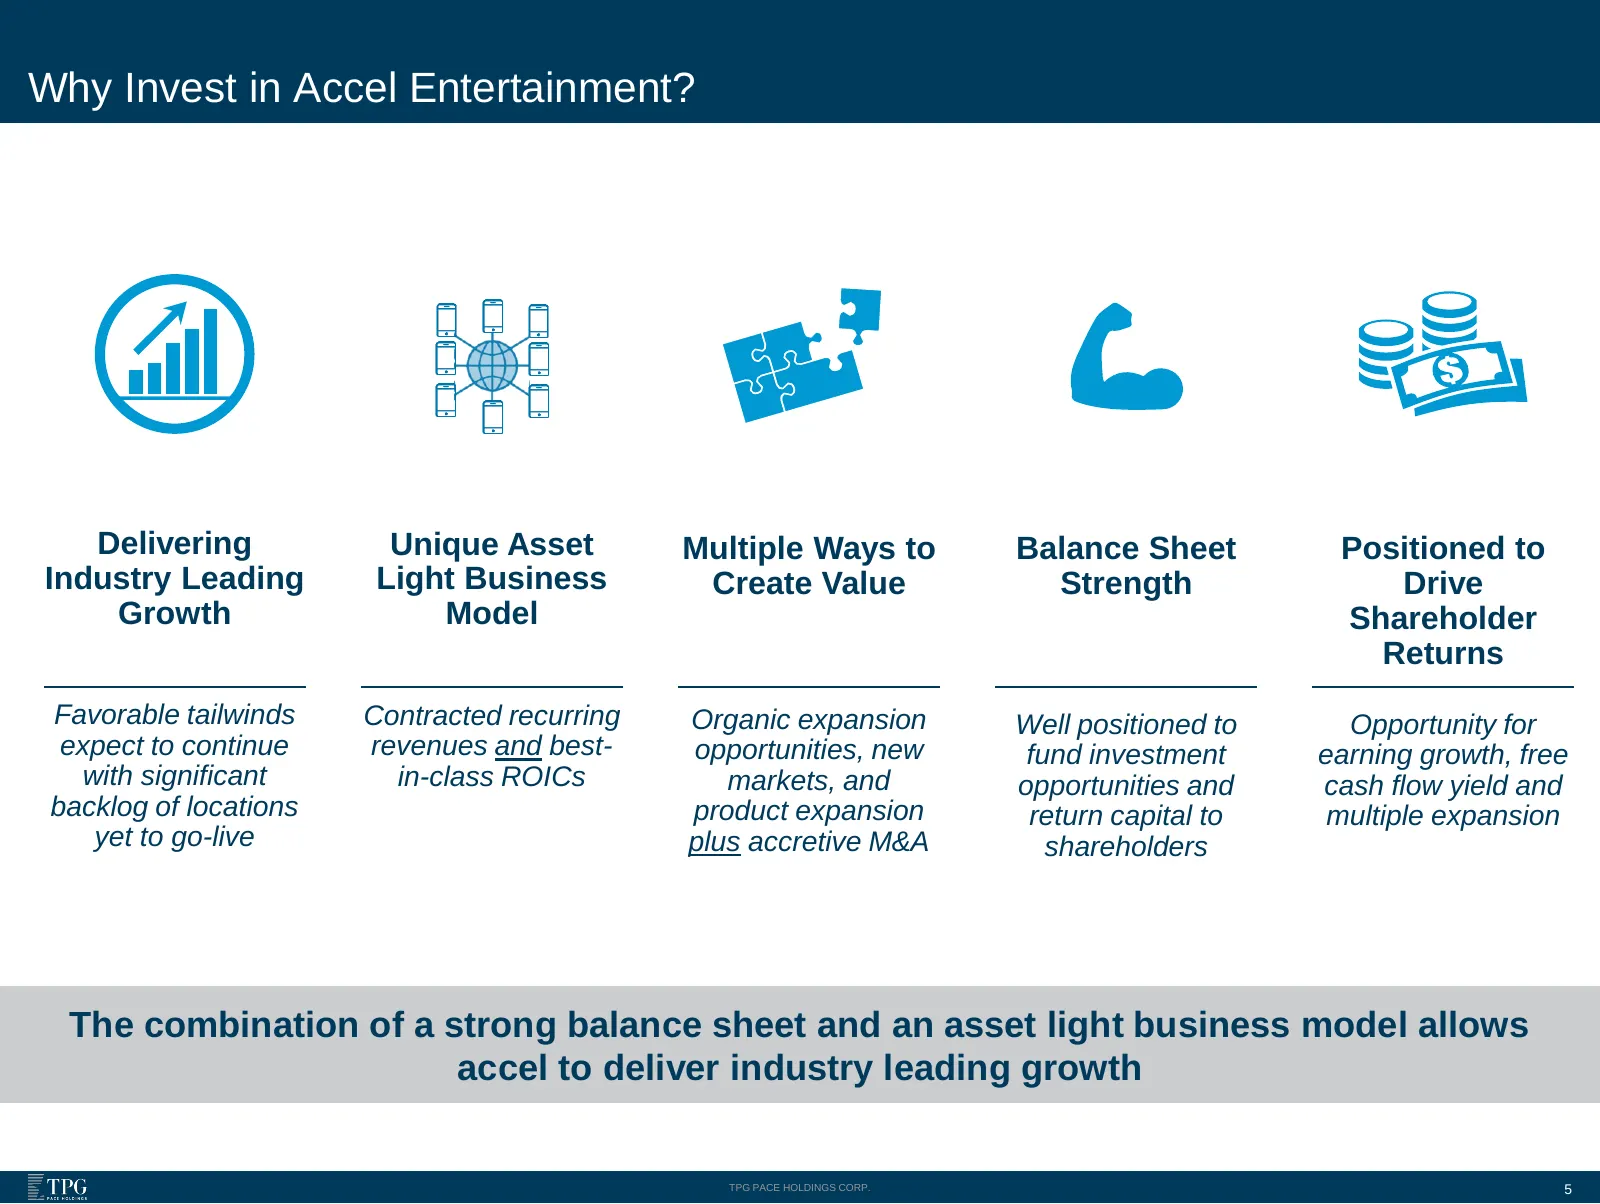
Slide 5: Why Invest in Accel Entertainment?
Why Invest in Accel Entertainment? Delivering Unique Asset Multiple Ways to Balance Sheet Positioned to Industry Leading Light Business Create Value Strength Drive Growth Model Shareholder Returns Favorable tailwinds Contracted recurring Organic expansion Well positioned to Opportunity for expect to
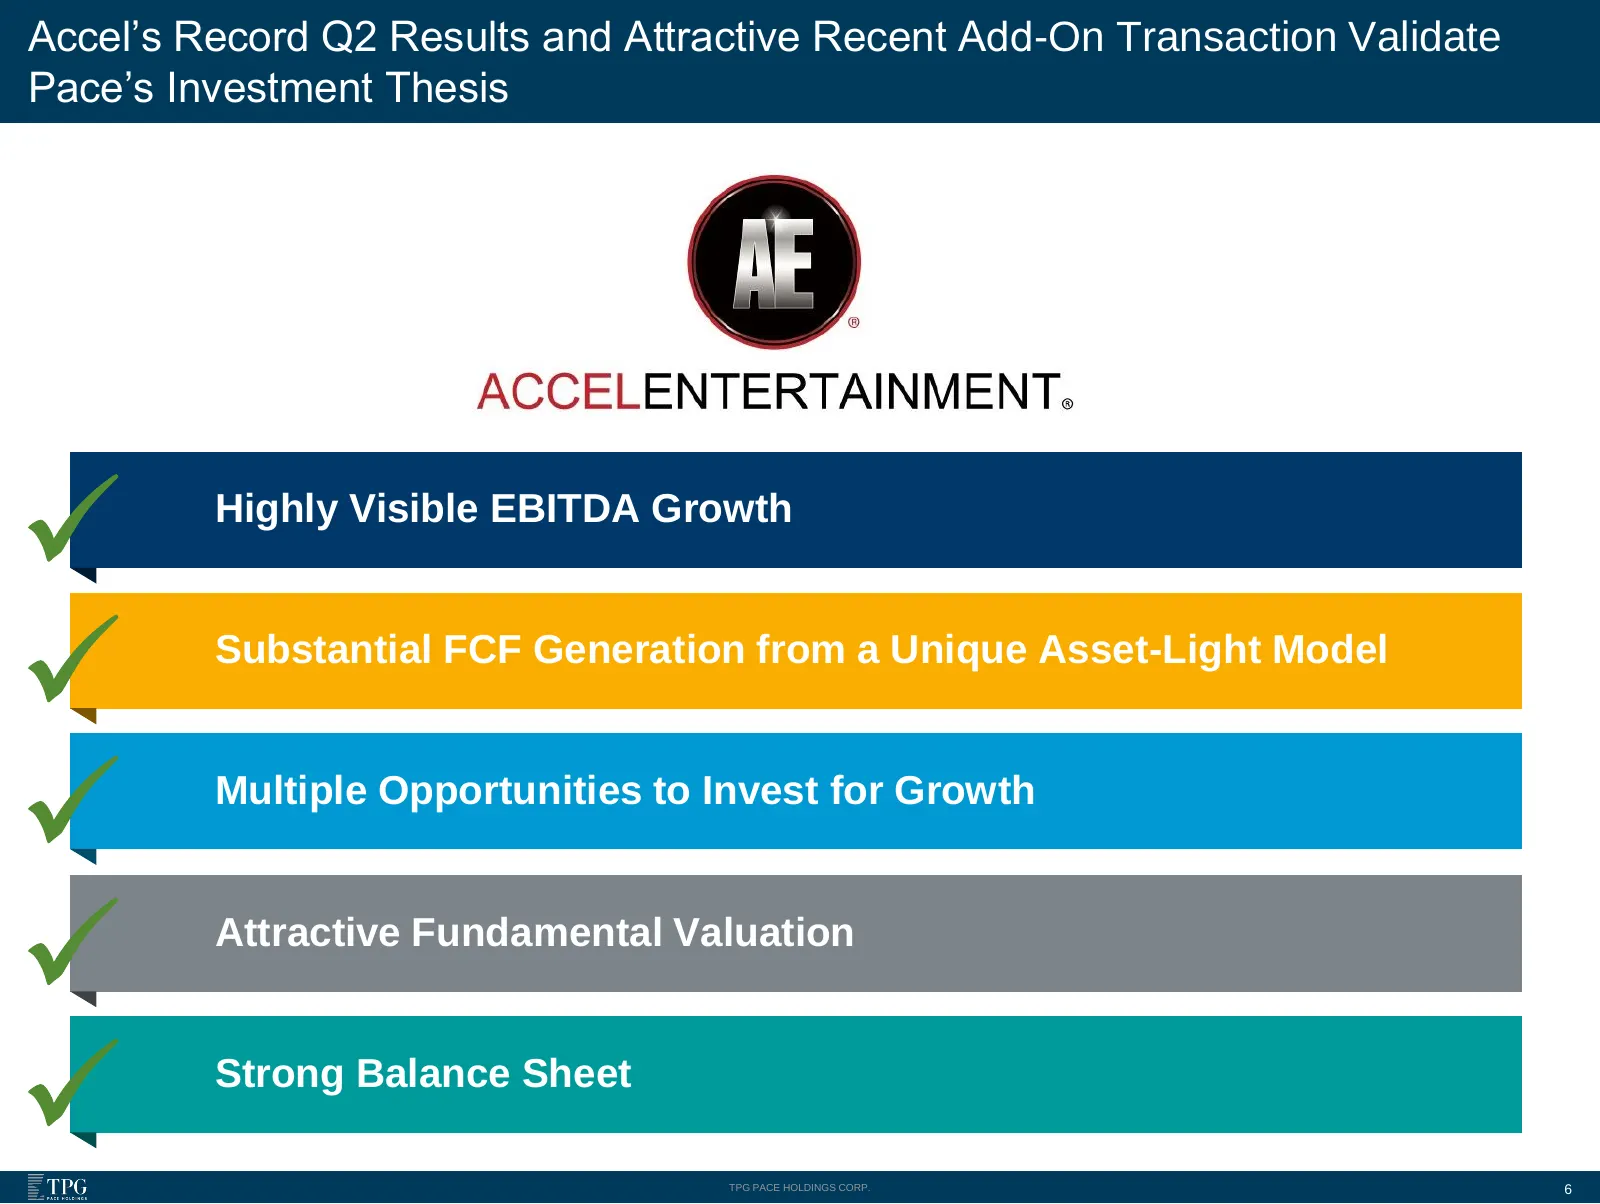
Slide 6: Accel's Record Q2 Results and Attractive Recent Add-On Transaction Validate Pace's Investment Thesis
Accel’s Record Q2 Results and Attractive Recent Add-On Transaction Validate Pace’s Investment Thesis Highly Visible EBITDA Growth Substantial FCF Generation from a Unique Asset-Light Model Multiple Opportunities to Invest for Growth Attractive Fundamental Valuation Strong Balance Sheet TPG PACE HOLD
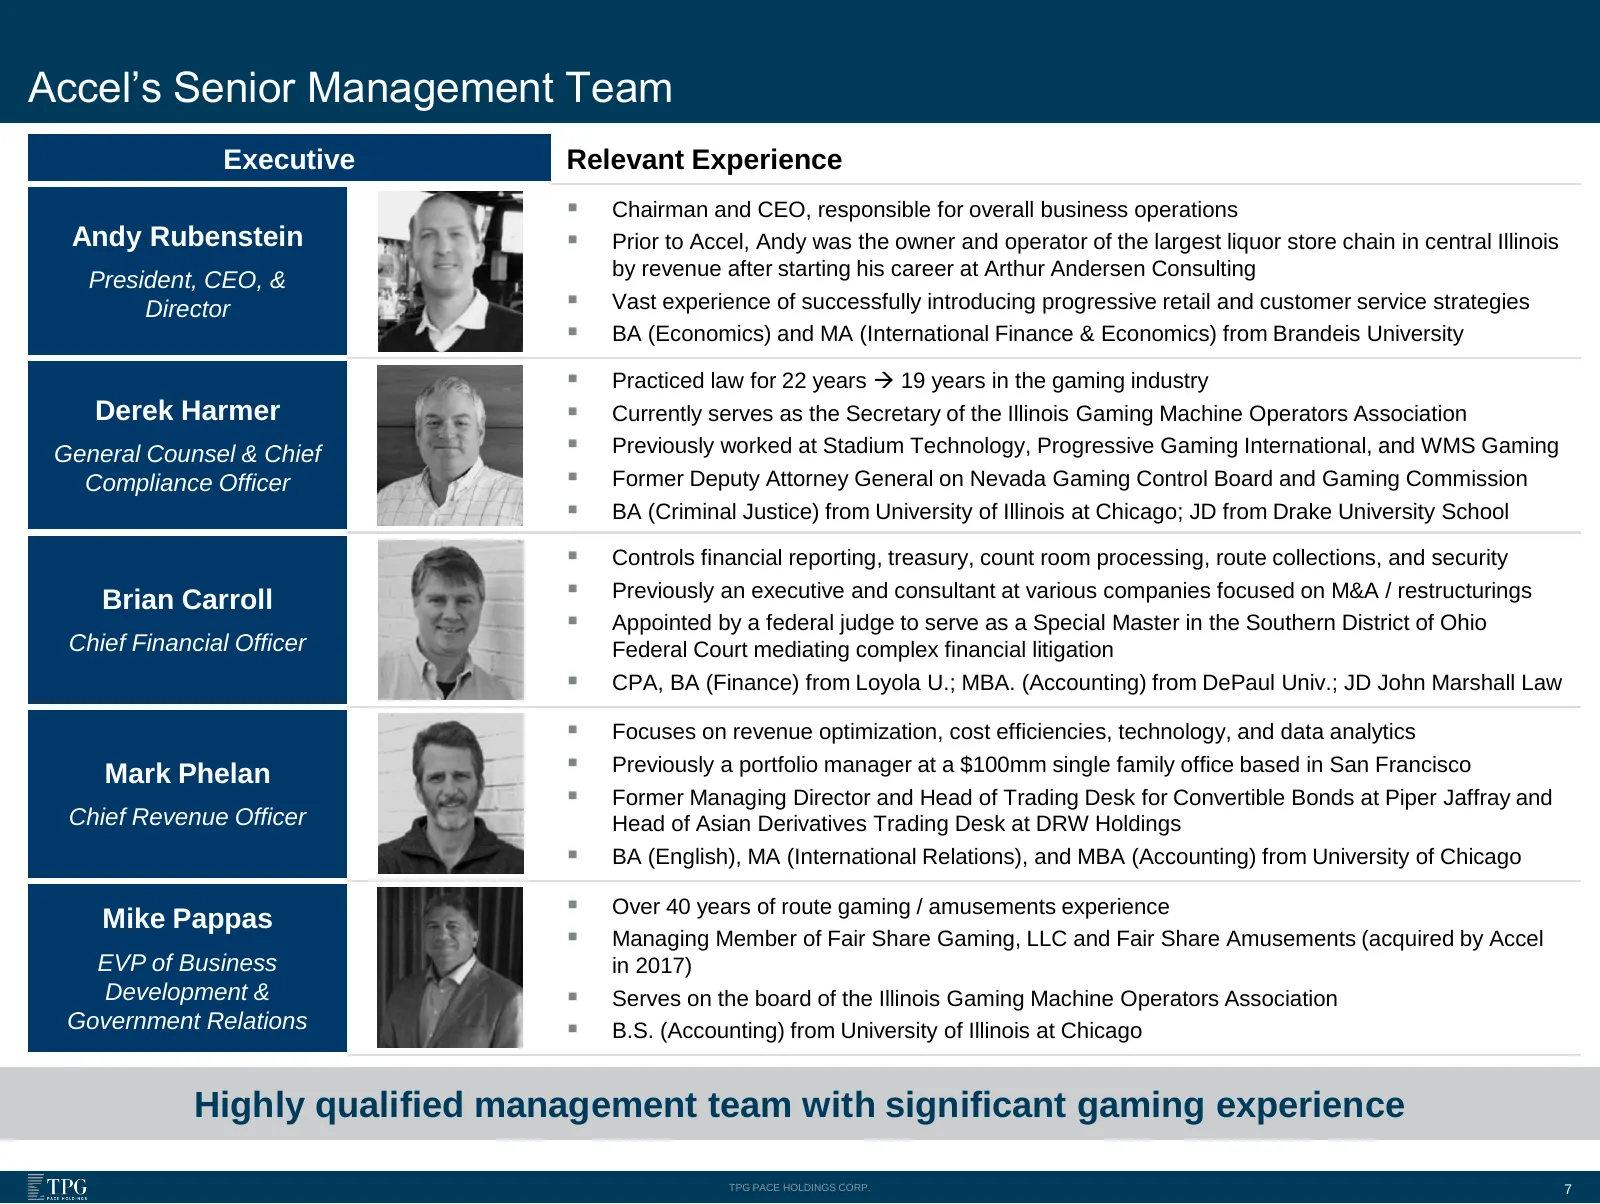
Slide 7: Accel's Senior Management Team
Accel’s Senior Management Team Executive Relevant Experience ▪ Chairman and CEO, responsible for overall business operations Andy Rubenstein ▪ Prior to Accel, Andy was the owner and operator of the largest liquor store chain in central Illinois by revenue after starting his career at Arthur Andersen

Slide 8: Key Business Model Attributes
Key Business Model Attributes TPG PACE HOLDINGS CORP.
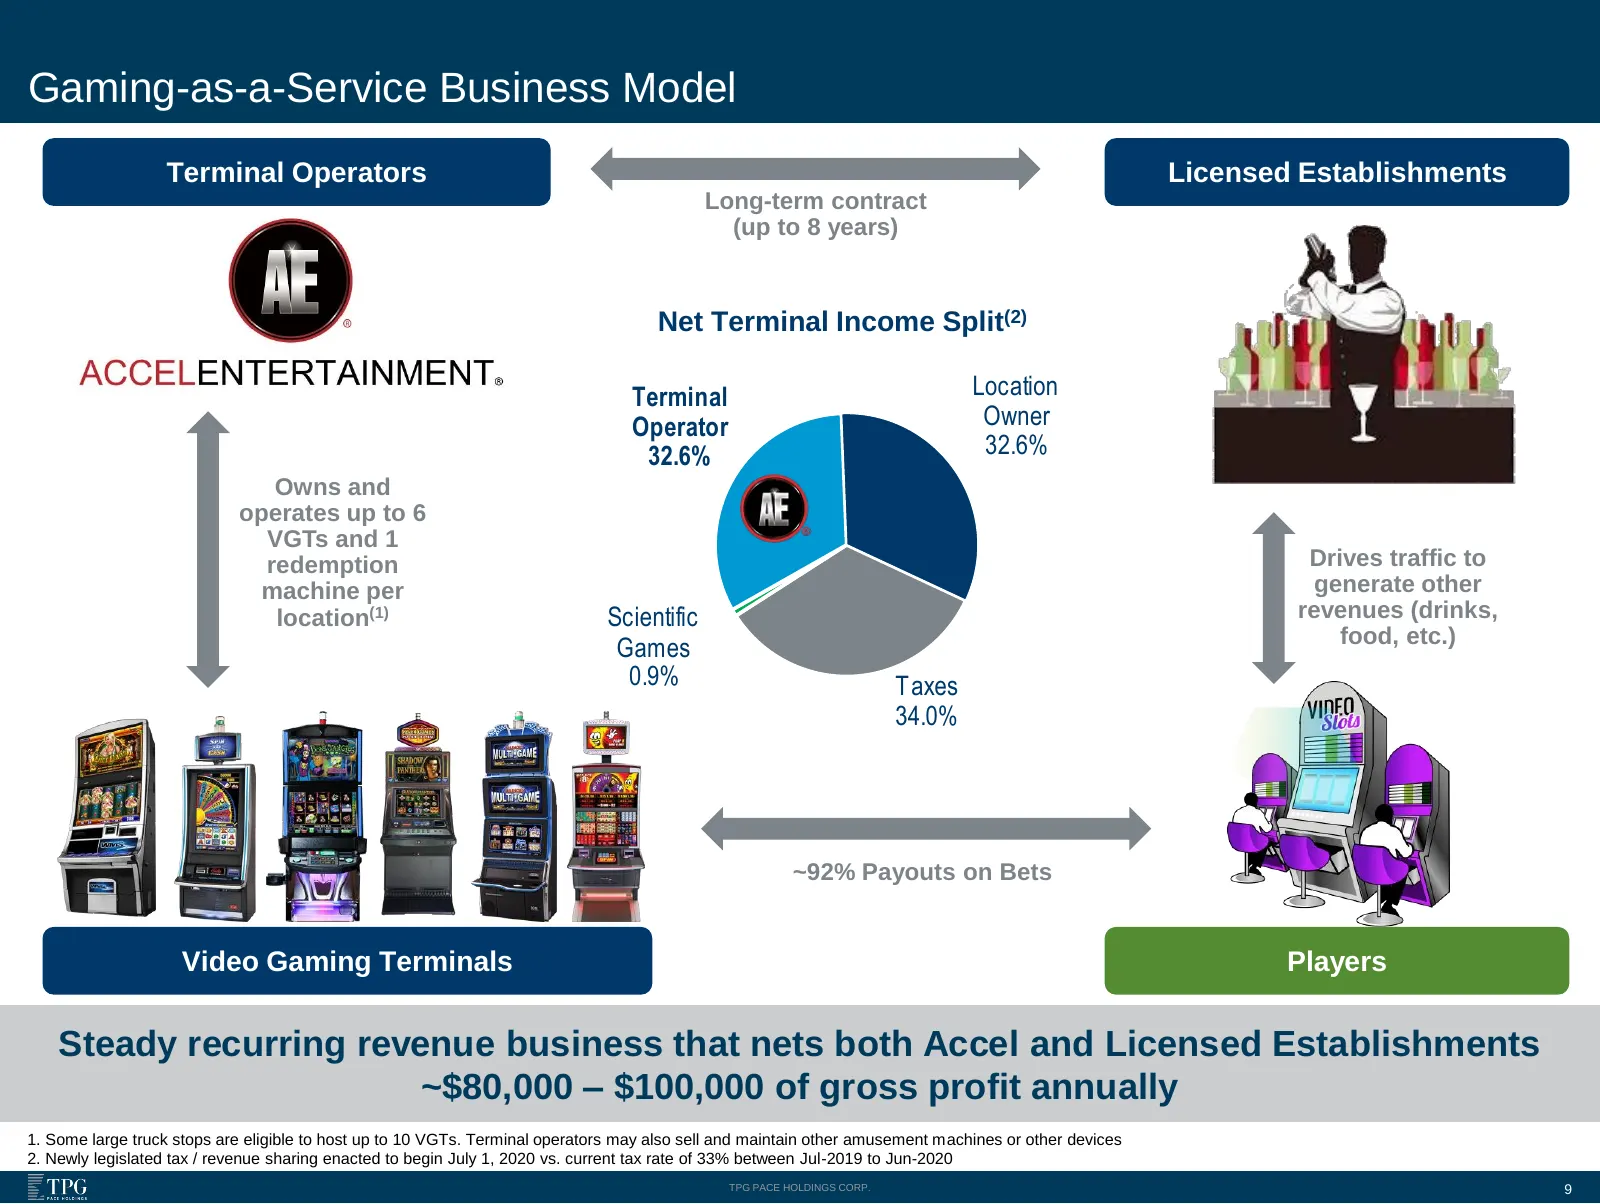
Slide 9: Gaming-as-a-Service Business Model
Gaming-as-a-Service Business Model Terminal Operators Licensed Establishments Long-term contract (up to 8 years) Net Terminal Income Split(2) Terminal Location Operator Owner 32.6% 32.6% Owns and operates up to 6 VGTs and 1 redemption Drives traffic to machine per generate other location(1) Scientif
Slide 10: Gaming-as-a-Service Model has Numerous Advantages vs. Traditional Casinos
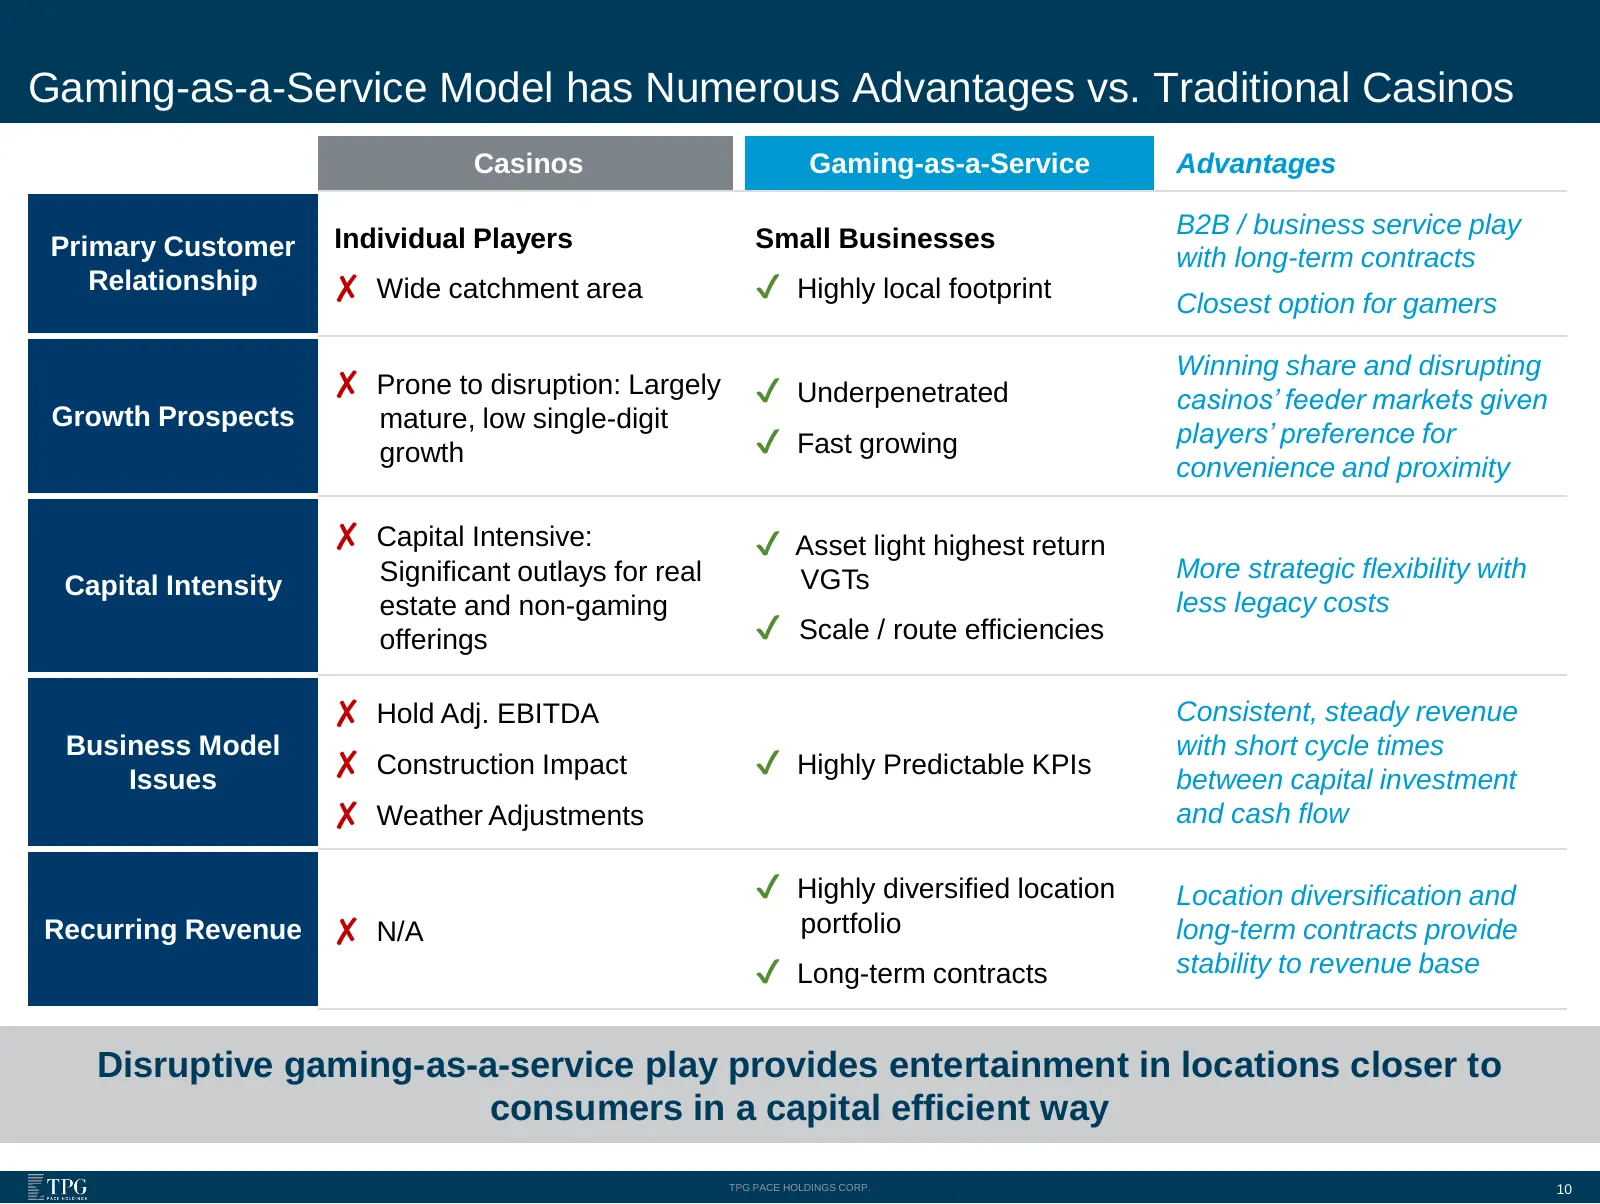
Gaming-as-a-Service Model has Numerous Advantages vs. Traditional Casinos Casinos Gaming-as-a-Service Advantages B2B / business service play Primary Customer Individual Players Small Businesses with long-term contracts Relationship ✘ Wide catchment area ✔ Highly local footprint Closest option for ga
Slide 11: Distributed Gaming… Standout for Growth Prospects
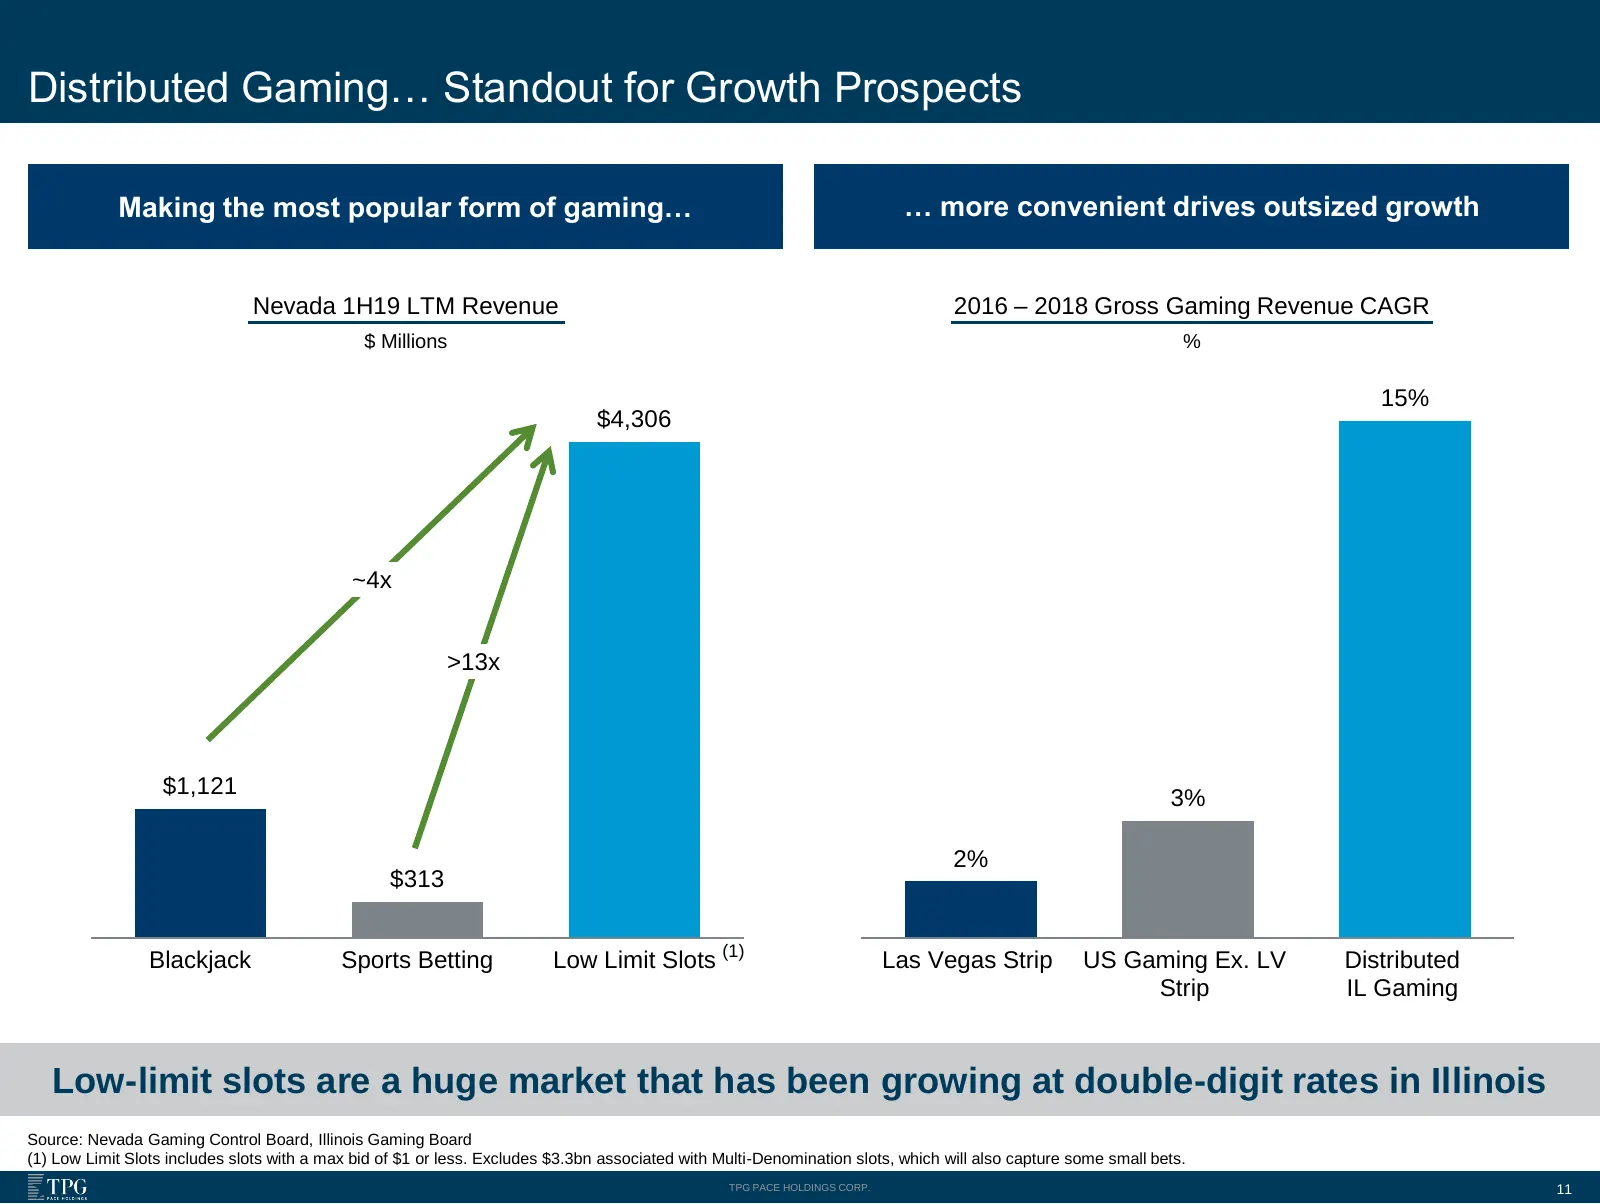
Distributed Gaming… Standout for Growth Prospects Making the most popular form of gaming… … more convenient drives outsized growth Nevada 1H19 LTM Revenue 2016 – 2018 Gross Gaming Revenue CAGR $ Millions % 15% $4,306 ~4x >13x $1,121 3% 2% $313 Blackjack Sports Betting Low Limit Slots (1) Las Vegas S
Slide 12: Gaming Has Been Resilient in Recessions
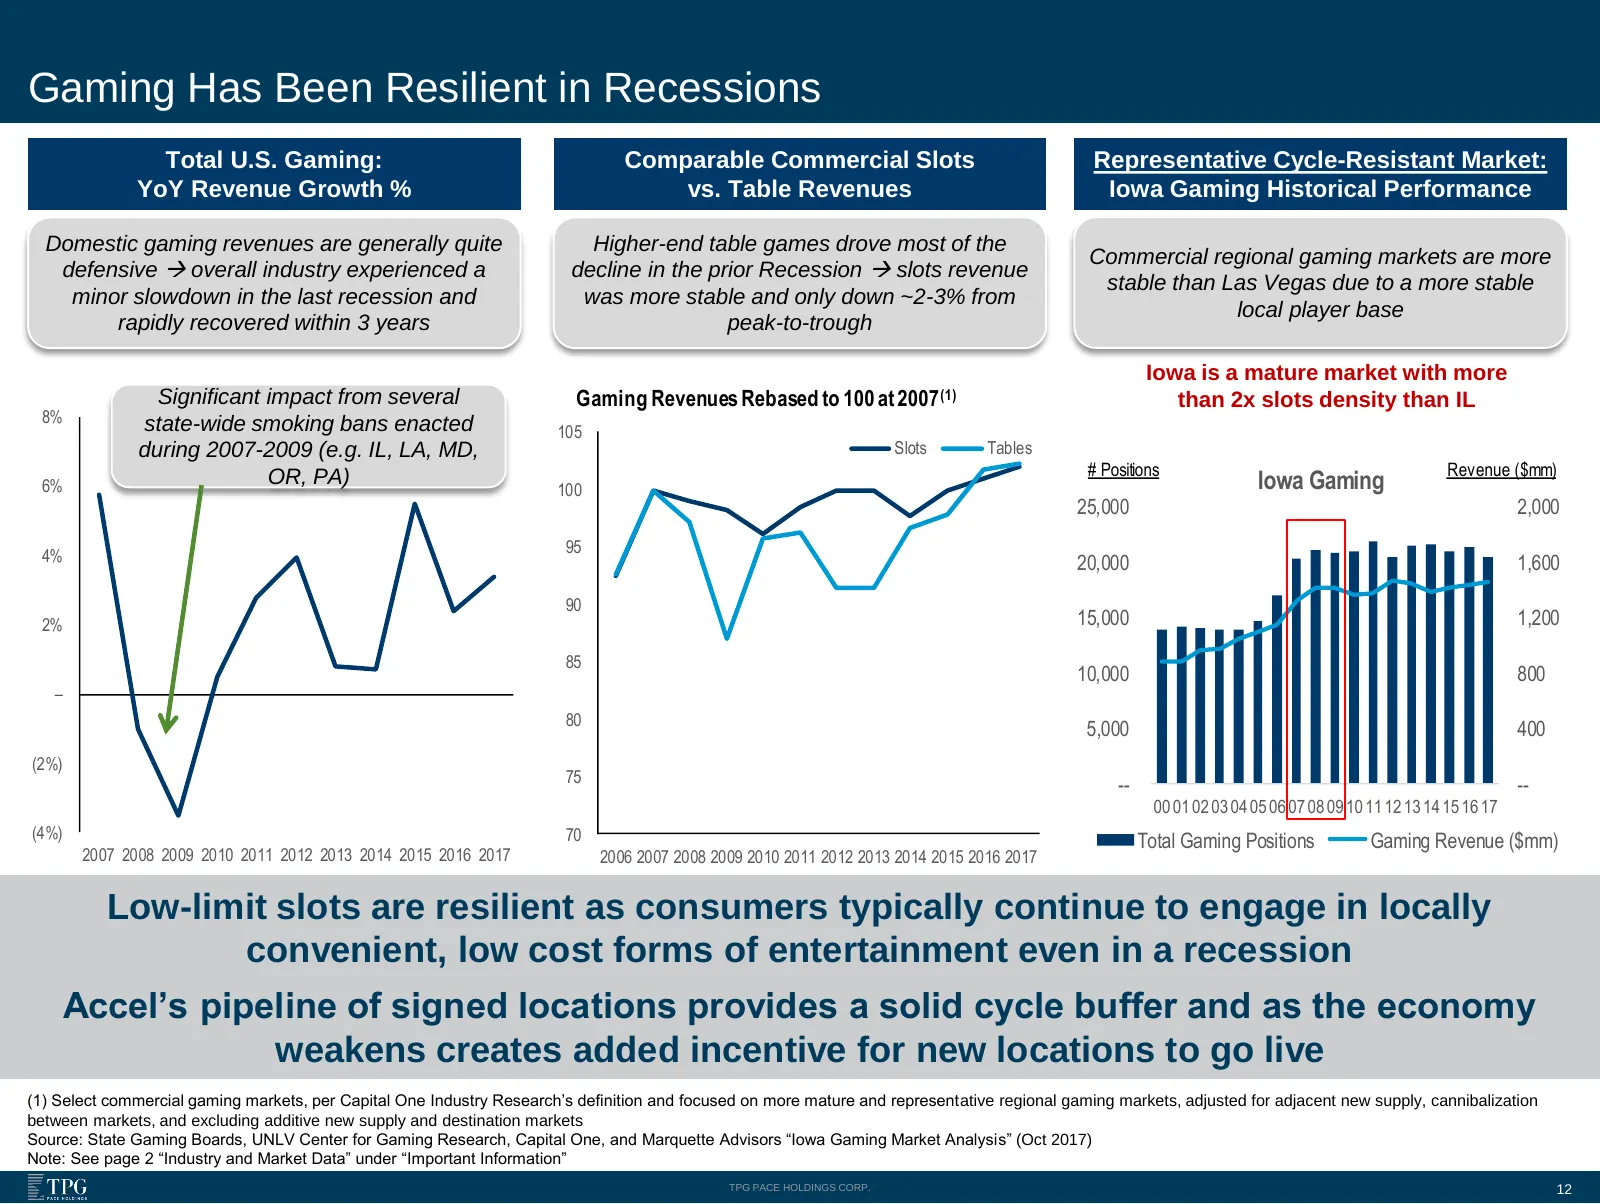
Gaming Has Been Resilient in Recessions Total U.S. Gaming: Comparable Commercial Slots Representative Cycle-Resistant Market: YoY Revenue Growth % vs. Table Revenues Iowa Gaming Historical Performance Domestic gaming revenues are generally quite Higher-end table games drove most of the Commercial re
Slide 13: Attractive Unit Economics
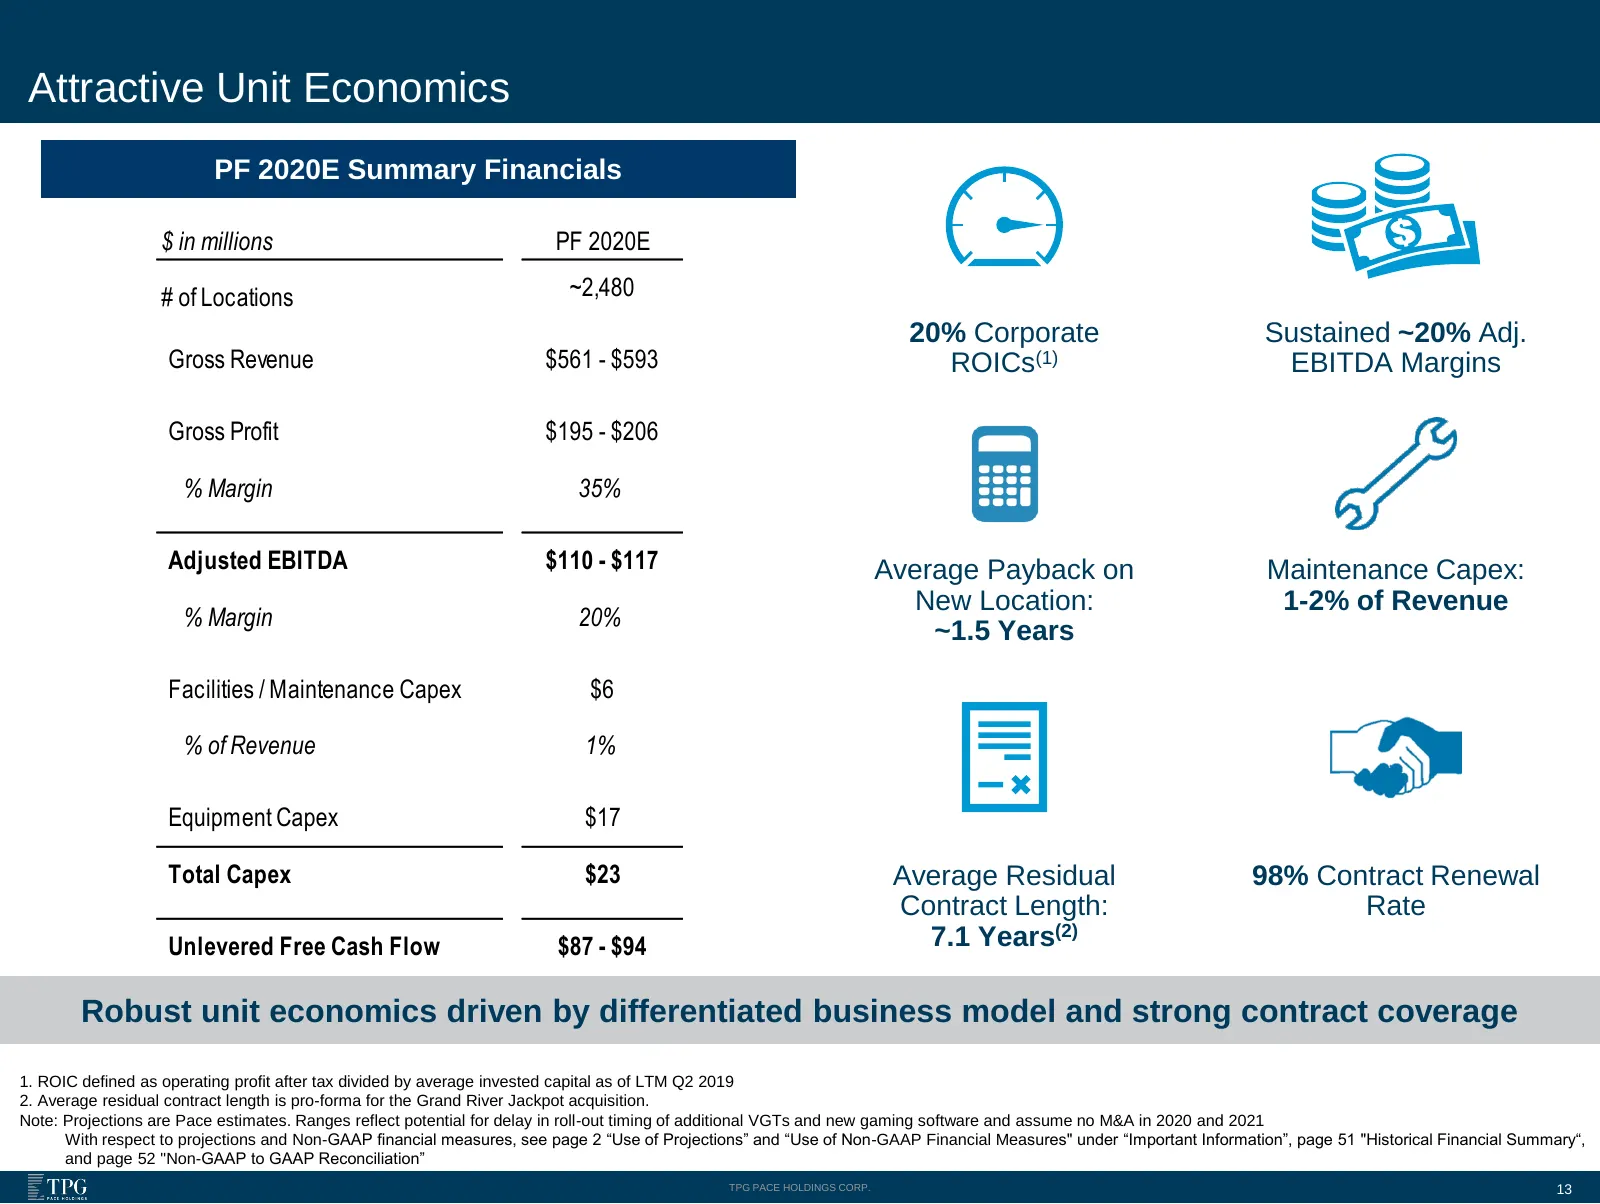
Attractive Unit Economics PF 2020E Summary Financials $ in millions PF 2020E # of Locations ~2,480 20% Corporate Sustained ~20% Adj. Gross Revenue $561 - $593 ROICs(1) EBITDA Margins Gross Profit $195 - $206 % Margin 35% Adjusted EBITDA $110 - $117 Average Payback on Maintenance Capex: New Location:
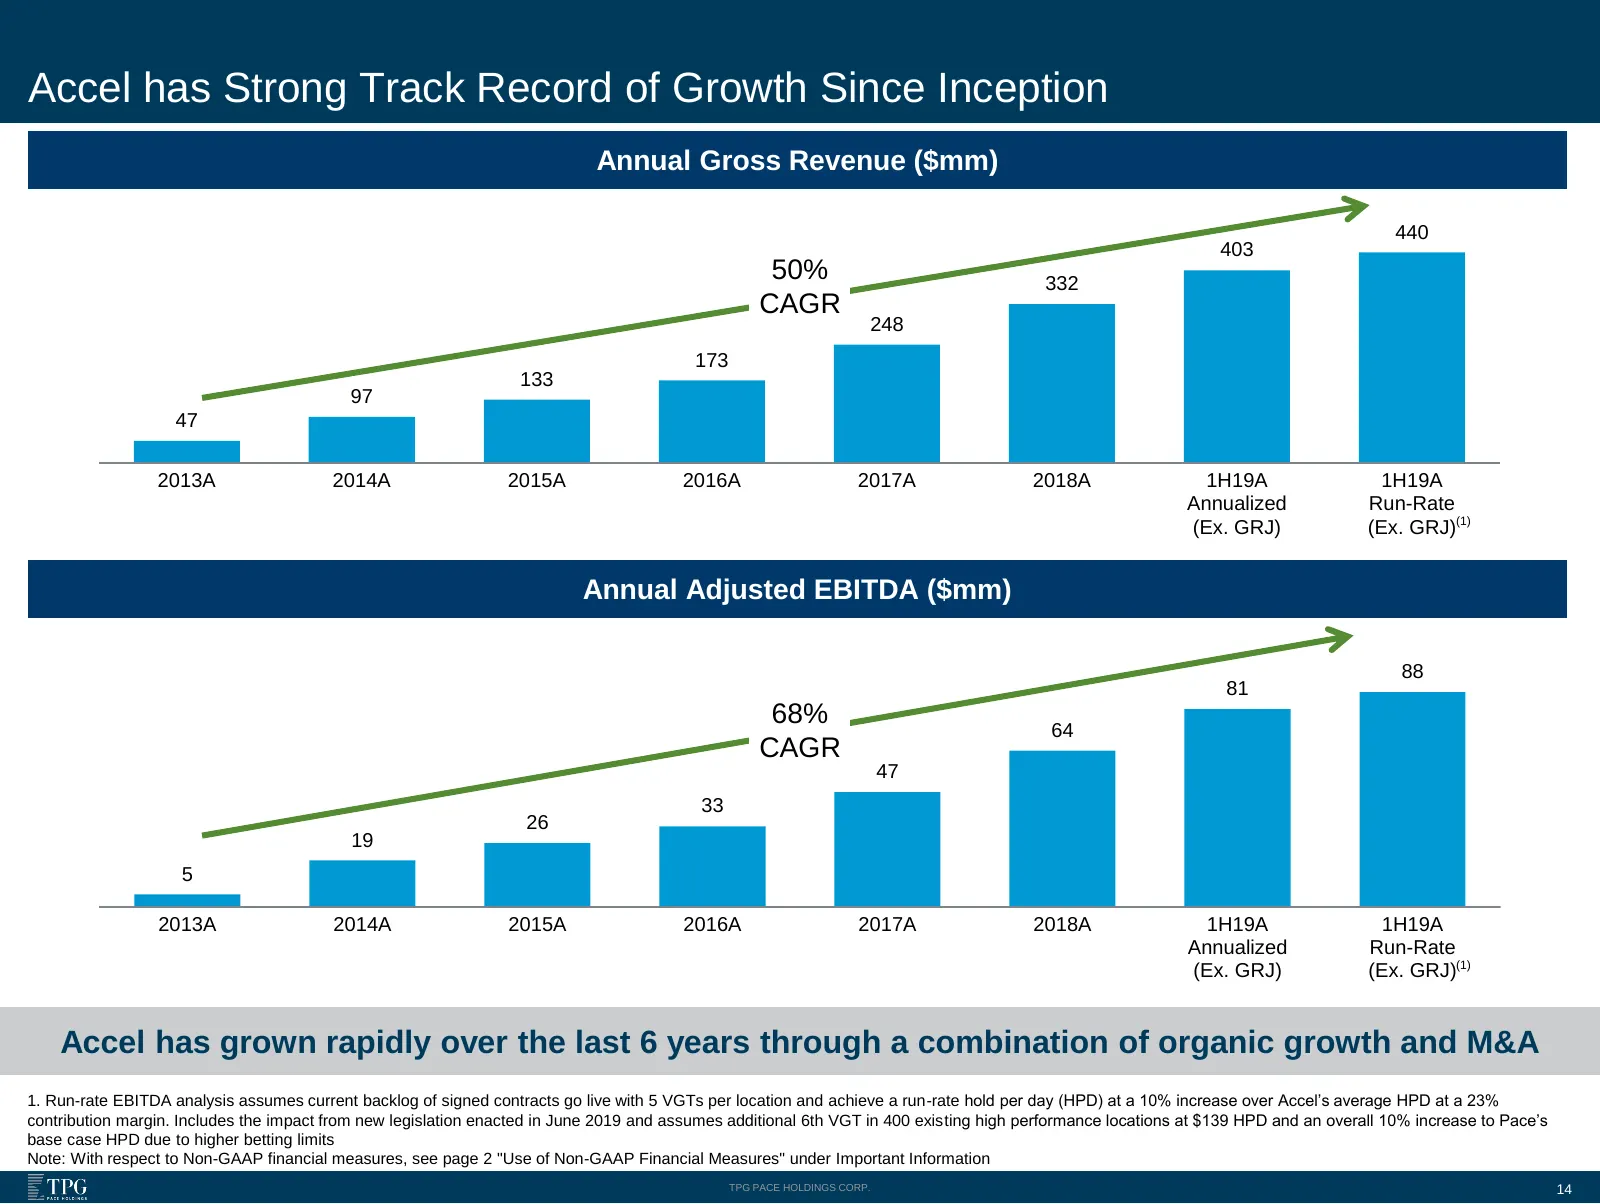
Slide 14: Accel has Strong Track Record of Growth Since Inception
Accel has Strong Track Record of Growth Since Inception Annual Gross Revenue ($mm) 440 403 50% 332 CAGR 248 173 133 97 47 2013A 2014A 2015A 2016A 2017A 2018A 1H19A 1H19A Annualized Run-Rate (Ex. GRJ) (Ex. GRJ)(1) Annual Adjusted EBITDA ($mm) 88 81 68% 64 CAGR 47 33 26 19 5 2013A 2014A 2015A 2016A 20
Slide 15: TAM / Growth Opportunities
TAM / Growth Opportunities TPG PACE HOLDINGS CORP.
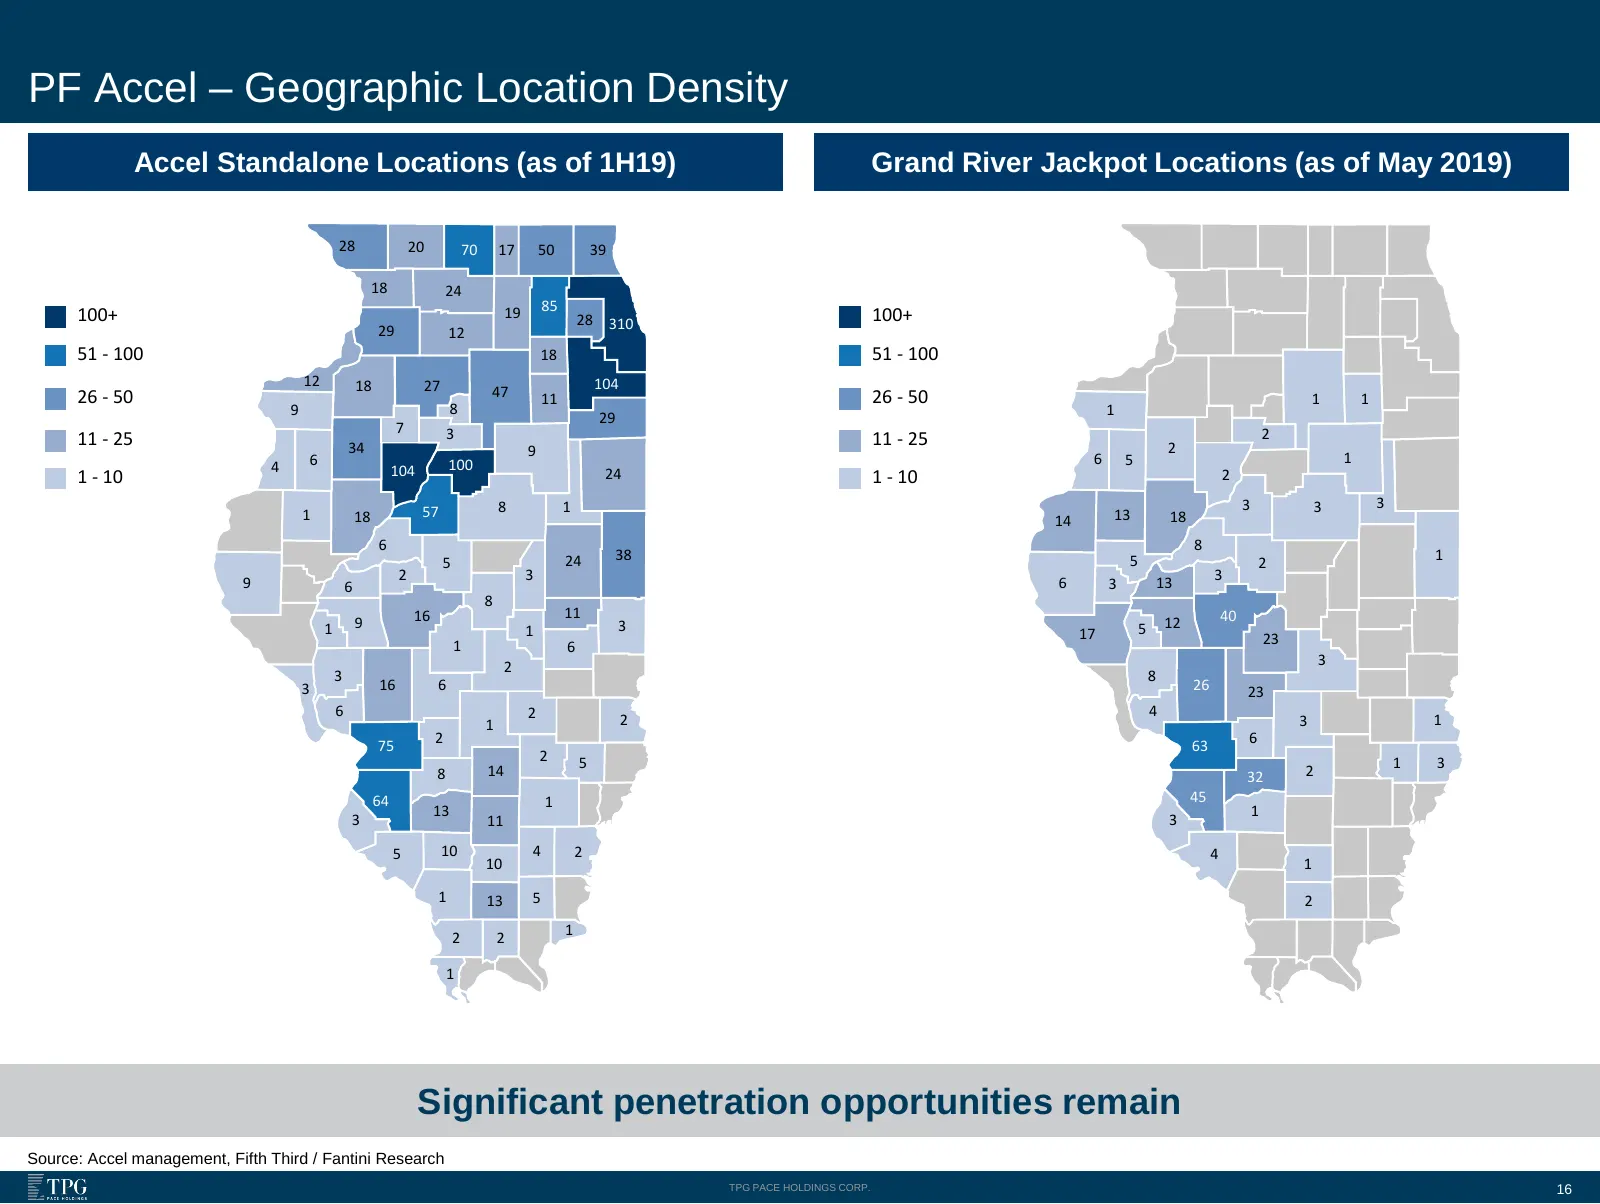
Slide 16: PF Accel – Geographic Location Density
PF Accel – Geographic Location Density Accel Standalone Locations (as of 1H19) Grand River Jackpot Locations (as of May 2019) 28 20 70 17 50 39 18 24 19 85 100+ 28 310 100+ 29 12 51 - 100 18 51 - 100 12 18 27 104 26 - 50 47 11 26 - 50 1 1 9 8 1 29 7 3 2 11 - 25 34 11 - 25 2 9 1 4 6 100 6 5 1 - 10 10
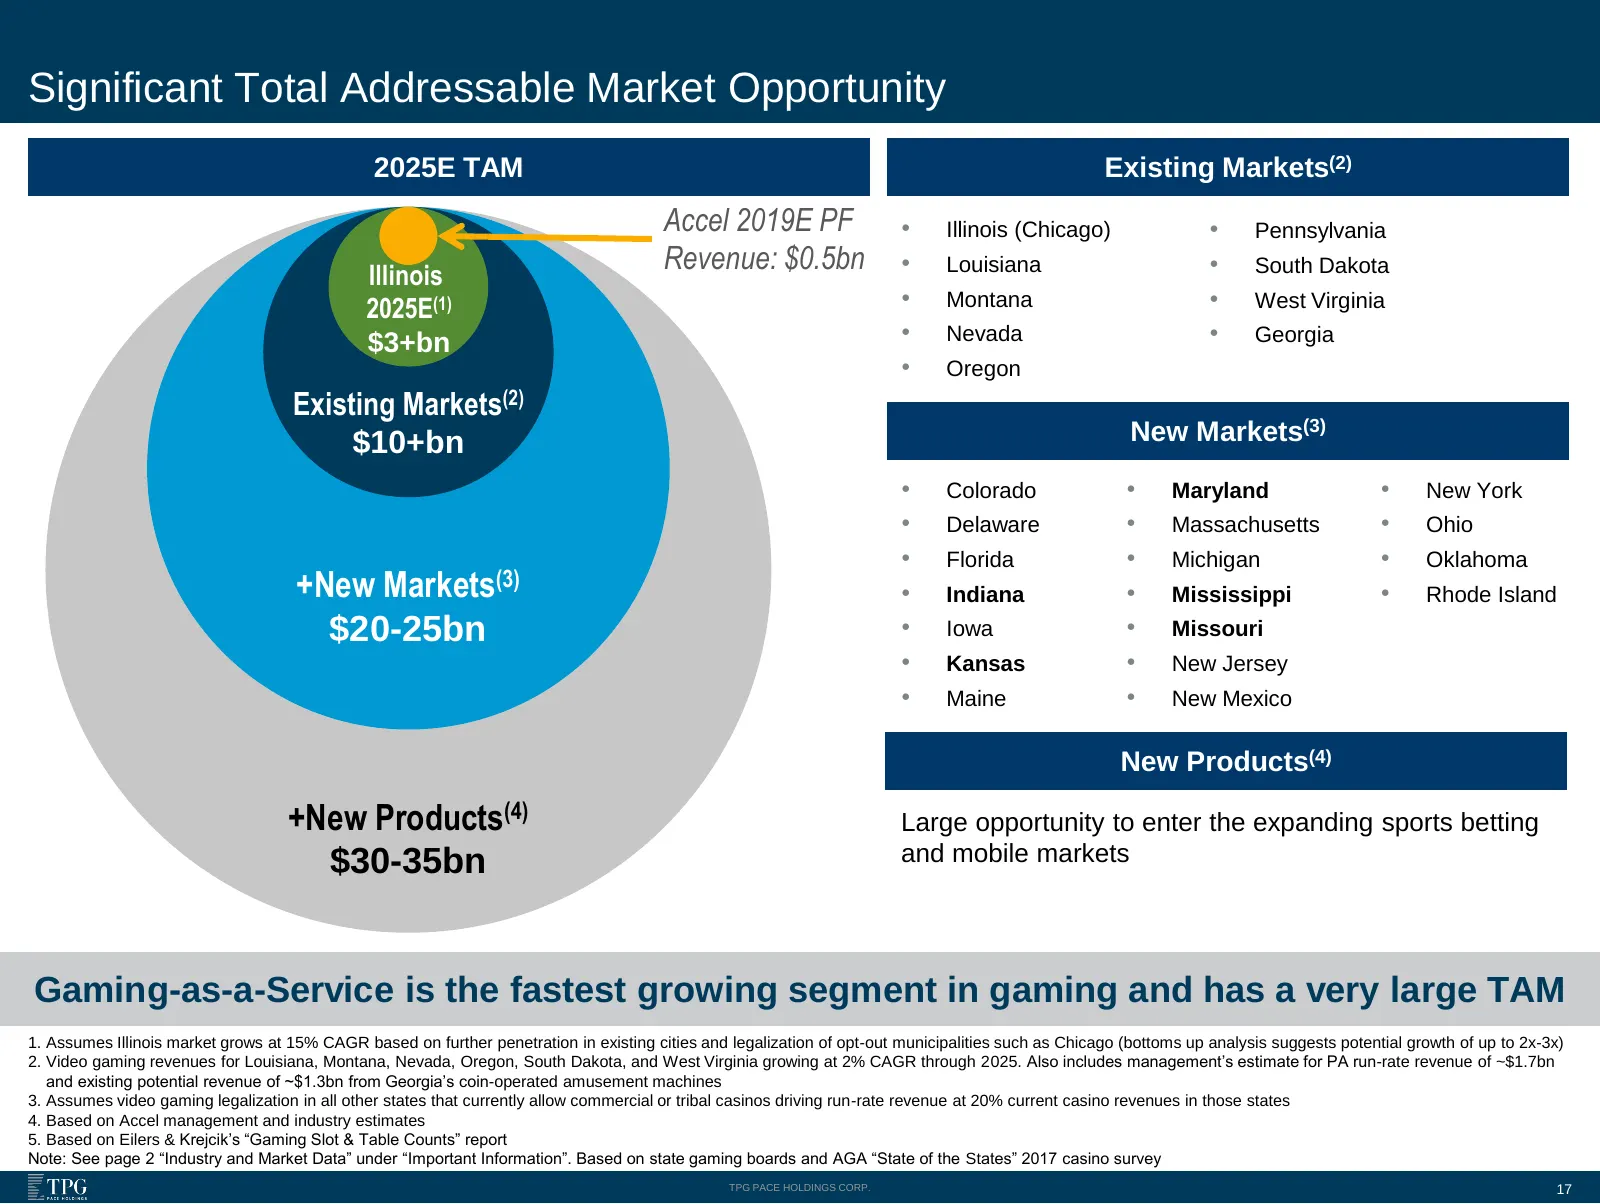
Slide 17: Significant Total Addressable Market Opportunity
Significant Total Addressable Market Opportunity 2025E TAM Existing Markets(2) Accel 2019E PF • Illinois (Chicago) • Pennsylvania Illinois Revenue: $0.5bn • Louisiana • South Dakota 2025E(1) • Montana • West Virginia $3+bn • Nevada • Georgia • Oregon Existing Markets(2) $10+bn New Markets(3) • Color
Slide 18: Estimated Video Gaming Opportunity in Illinois
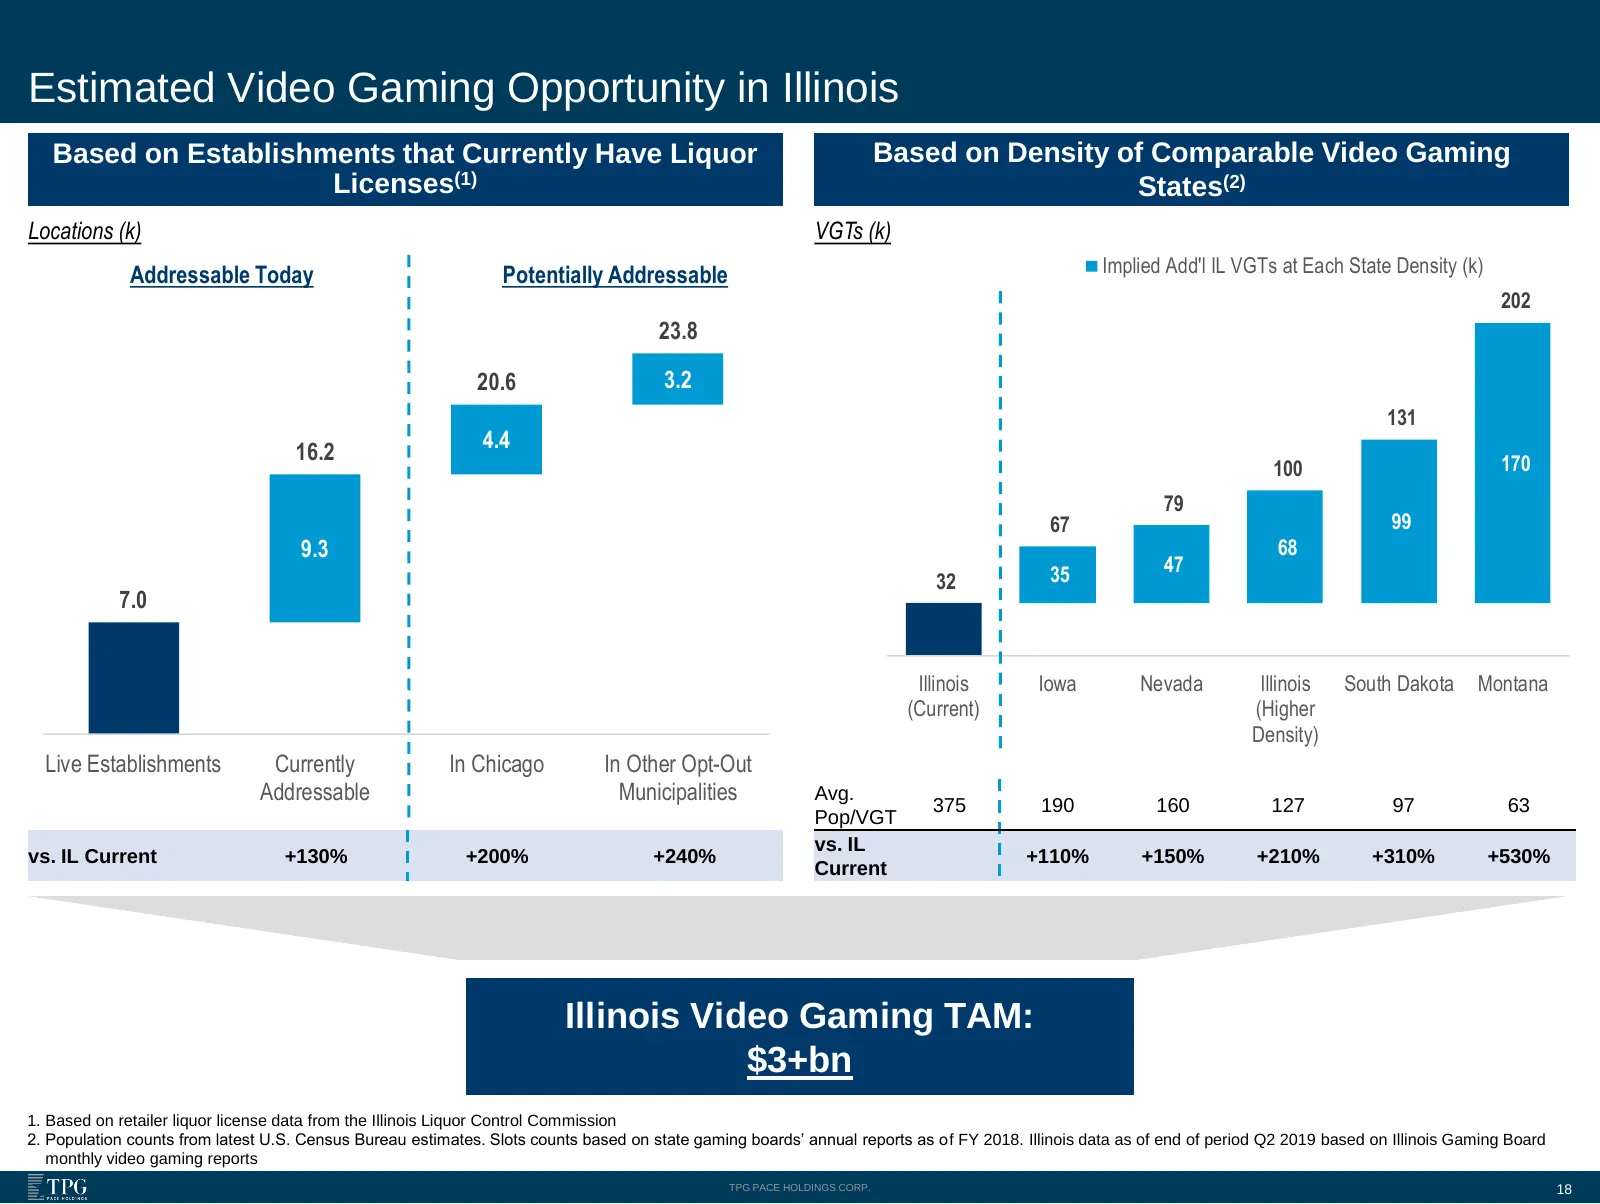
Estimated Video Gaming Opportunity in Illinois Based on Establishments that Currently Have Liquor Based on Density of Comparable Video Gaming Licenses(1) States(2) Locations (k) VGTs (k) Addressable Today Potentially Addressable Implied Add'l IL VGTs at Each State Density (k) 202 23.8 20.6 3.2 131 1
Slide 19: Favorable Tailwinds for Continued Growth
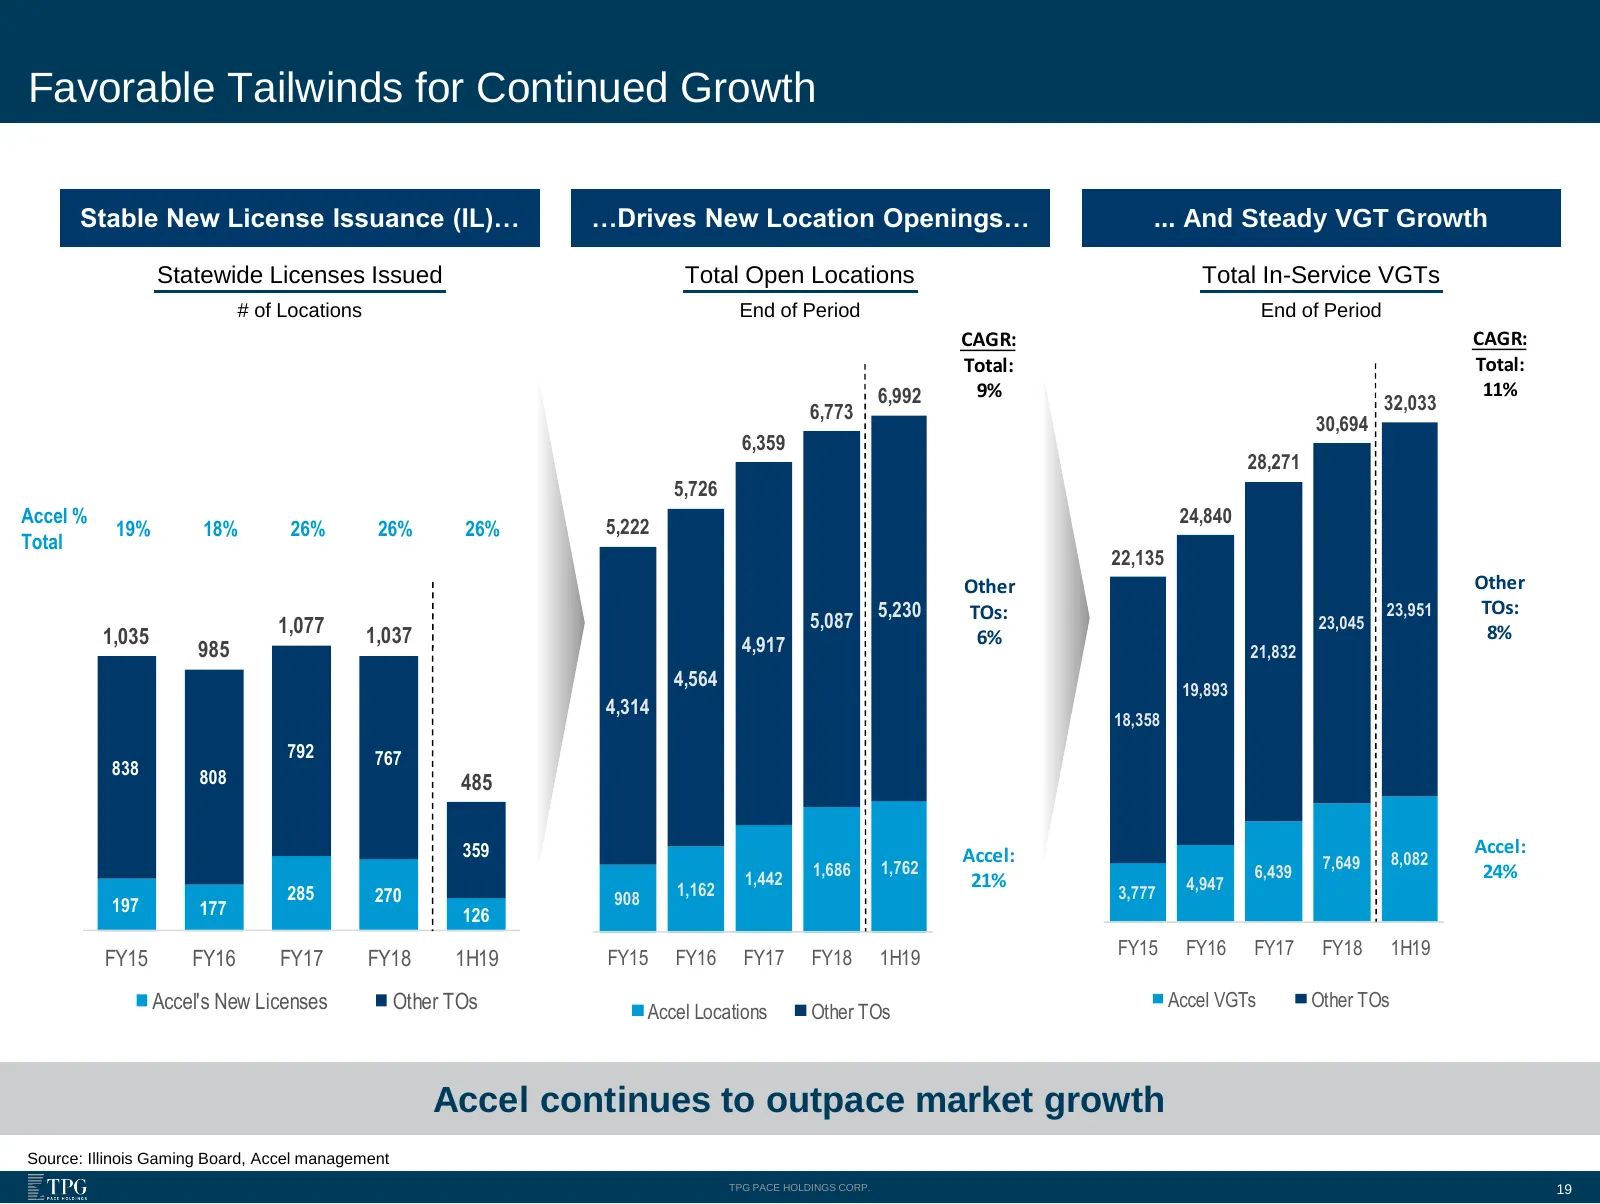
Favorable Tailwinds for Continued Growth Stable New License Issuance (IL)… …Drives New Location Openings… ... And Steady VGT Growth Statewide Licenses Issued Total Open Locations Total In-Service VGTs # of Locations End of Period End of Period CAGR: CAGR: Total: Total: 6,992 9% 11% 6,773 32,033 30,6
Slide 20: Fragmented Landscape in Illinois
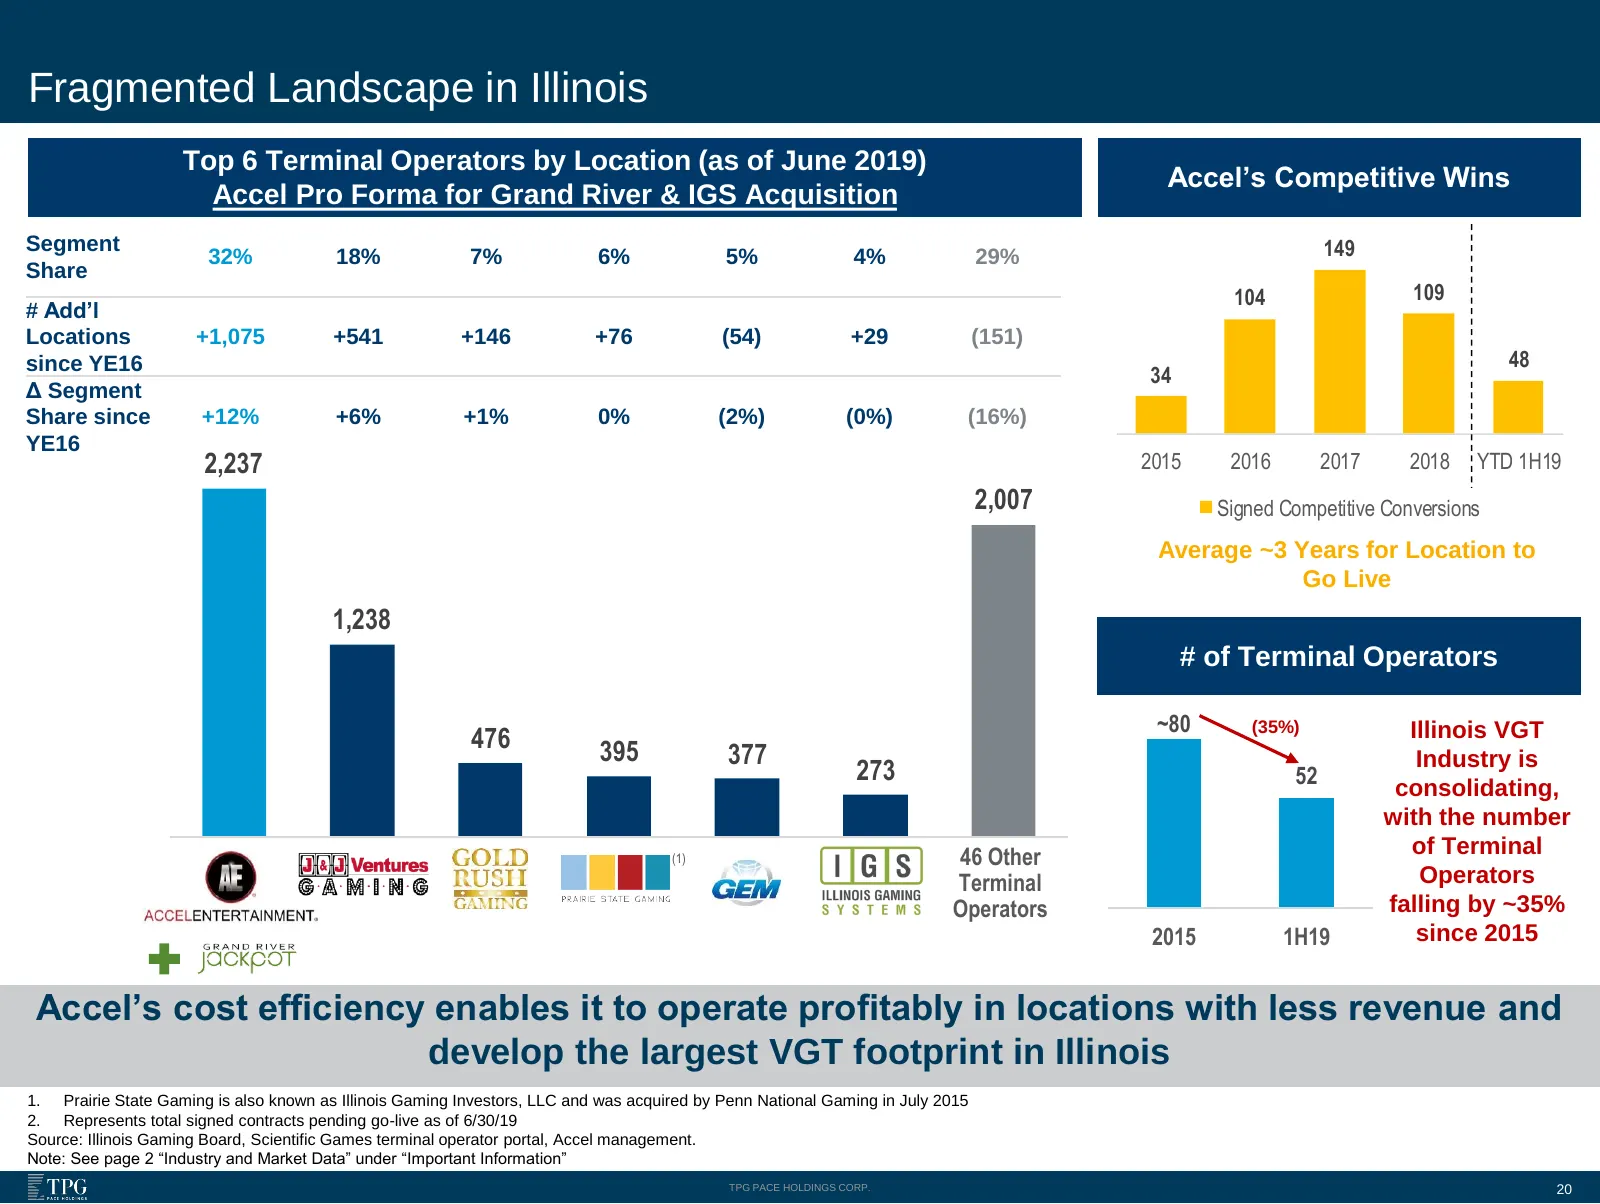
Fragmented Landscape in Illinois Top 6 Terminal Operators by Location (as of June 2019) Accel’s Competitive Wins Accel Pro Forma for Grand River & IGS Acquisition Segment 32% 18% 7% 6% 5% 4% 29% 149 Share 104 109 # Add’l Locations +1,075 +541 +146 +76 (54) +29 (151) since YE16 48 34 Δ Segment Share
Slide 21: Growth Opportunities Both In and Out of Illinois
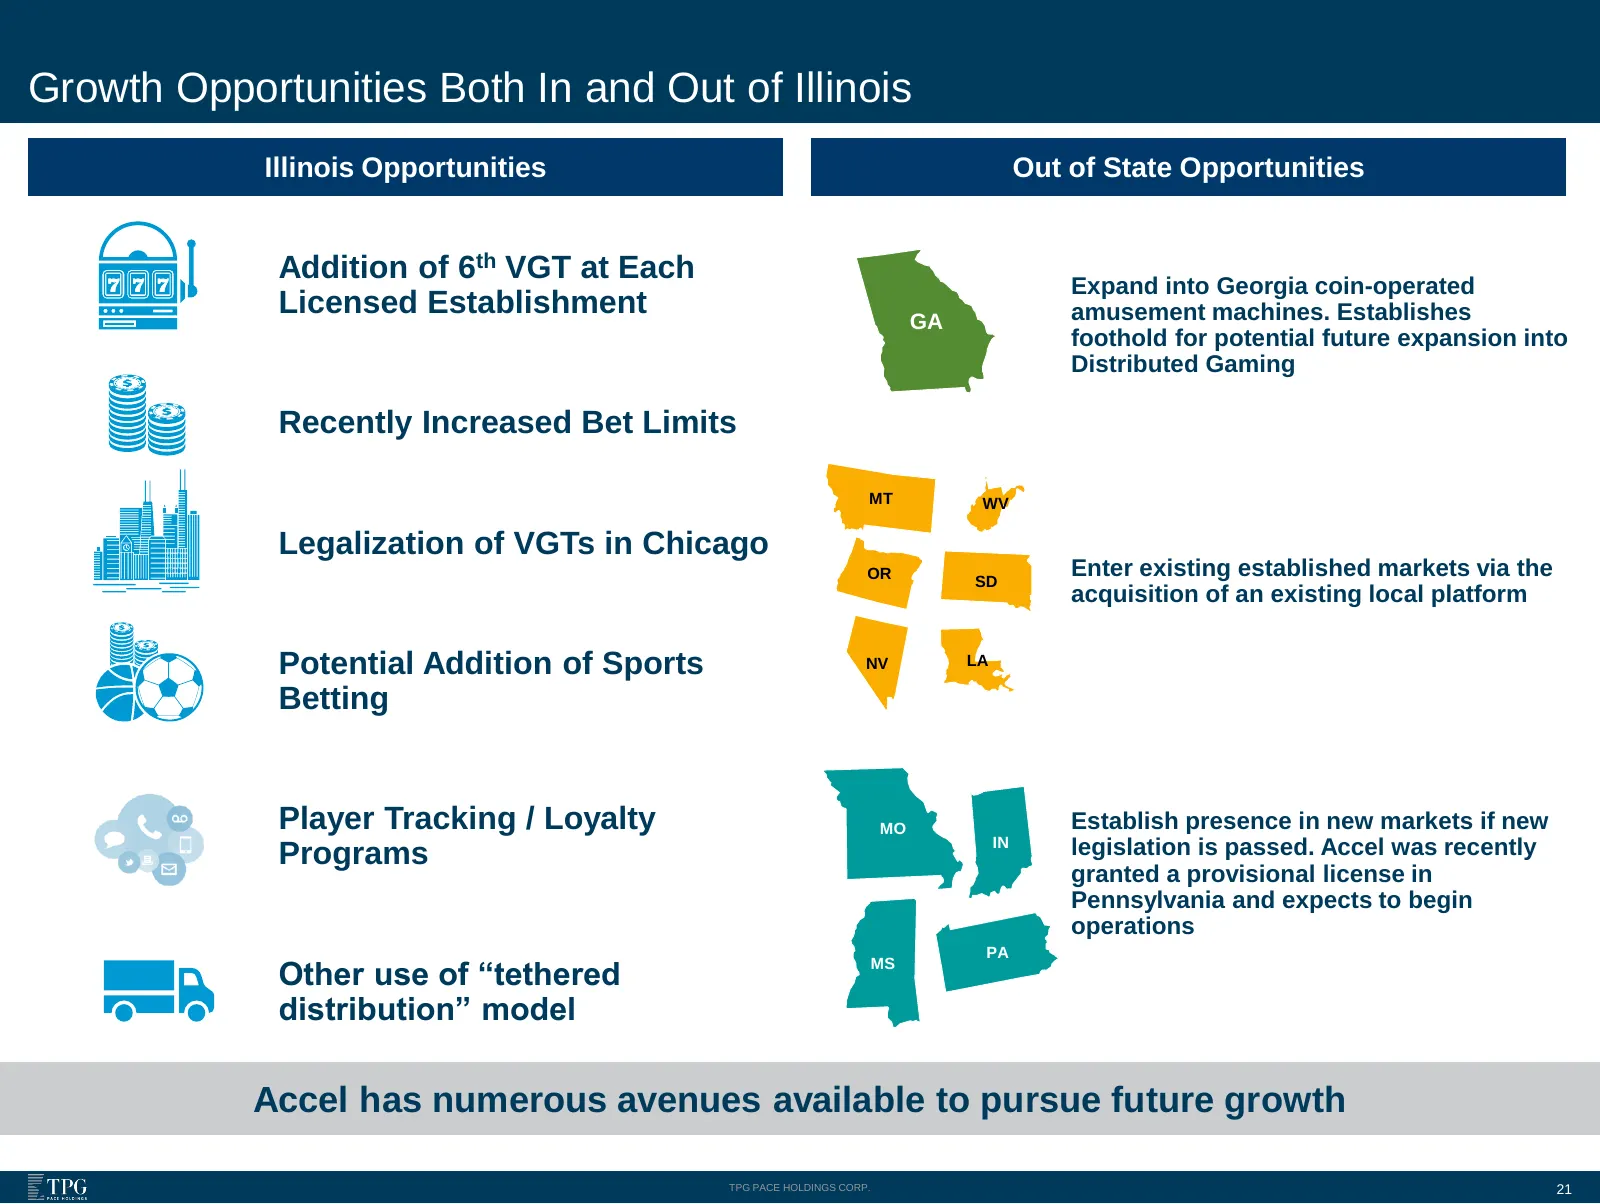
Growth Opportunities Both In and Out of Illinois Illinois Opportunities Out of State Opportunities Addition of 6th VGT at Each Expand into Georgia coin-operated Licensed Establishment amusement machines. Establishes GA foothold for potential future expansion into Distributed Gaming Recently Increase
Slide 22: Multiple Additional Non-modeled Growth Levers
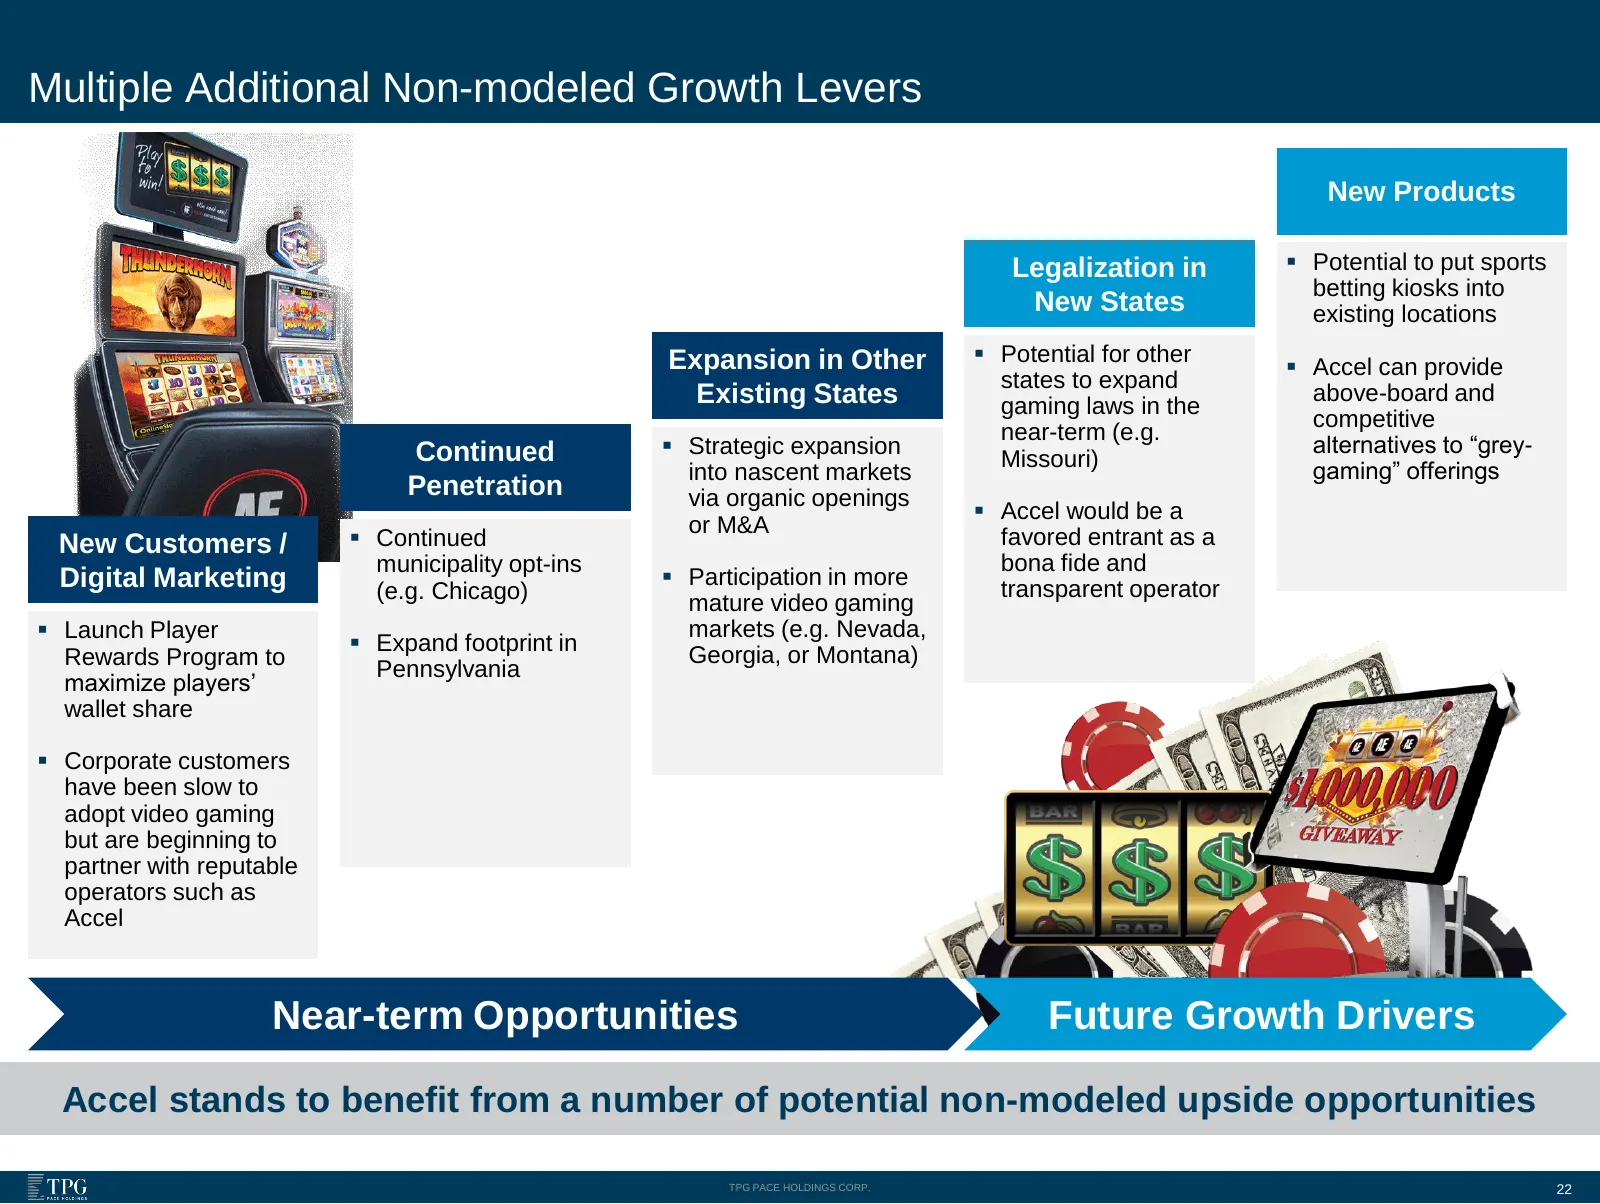
Multiple Additional Non-modeled Growth Levers New Products Legalization in ▪ Potential to put sports betting kiosks into New States existing locations Expansion in Other ▪ Potential for other ▪ Accel can provide states to expand Existing States gaming laws in the above-board and competitive near-ter
Slide 23: Q2 2019 Update
Q2 2019 Update TPG PACE HOLDINGS CORP.
Slide 24: Key Q1 and Q2 KPIs – Industry-Leading Growth
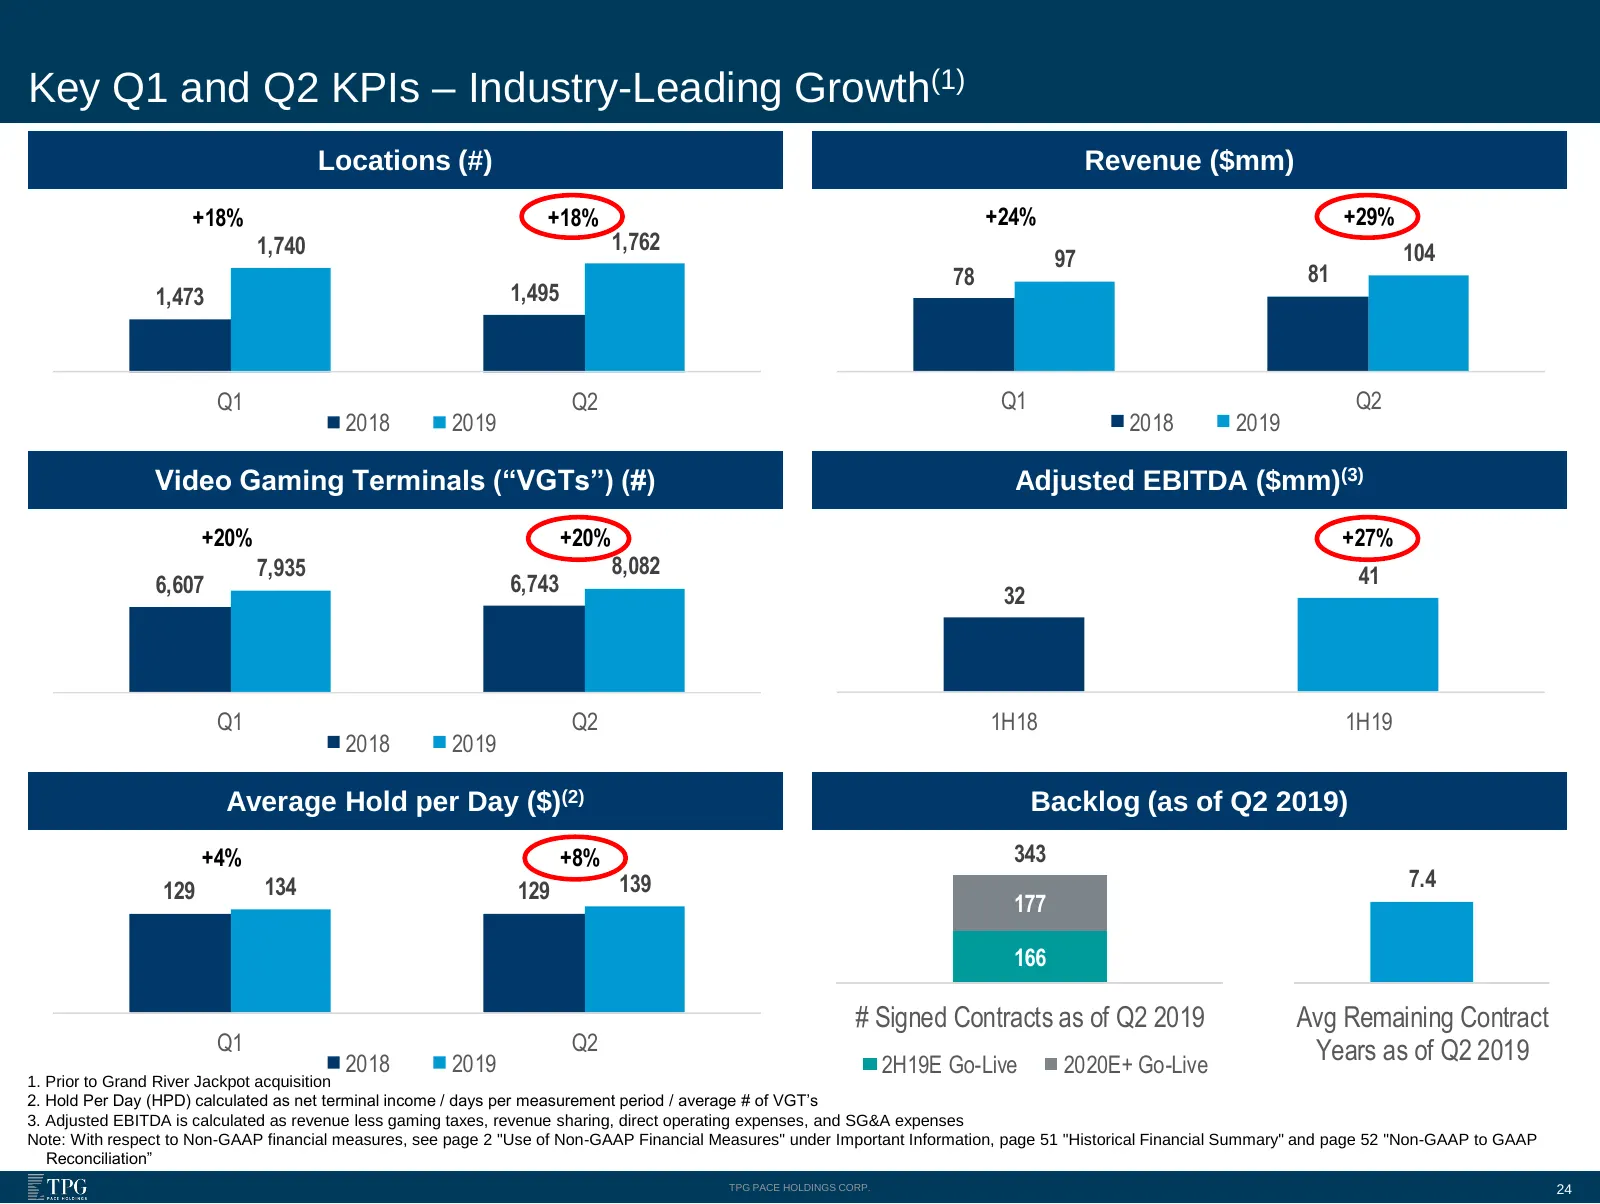
Key Q1 and Q2 KPIs – Industry-Leading Growth(1) Locations (#) Revenue ($mm) +18% +18% +24% +29% 1,740 1,762 104 97 78 81 1,473 1,495 Q1 Q2 Q1 Q2 2018 2019 2018 2019 Video Gaming Terminals (“VGTs”) (#) Adjusted EBITDA ($mm)(3) +20% +20% +27% 7,935 8,082 41 6,607 6,743 32 Q1 Q2 1H18 1H19 2018 2019 Ave
Slide 25: Accel Revenue Growth Outstripping Industry at Large
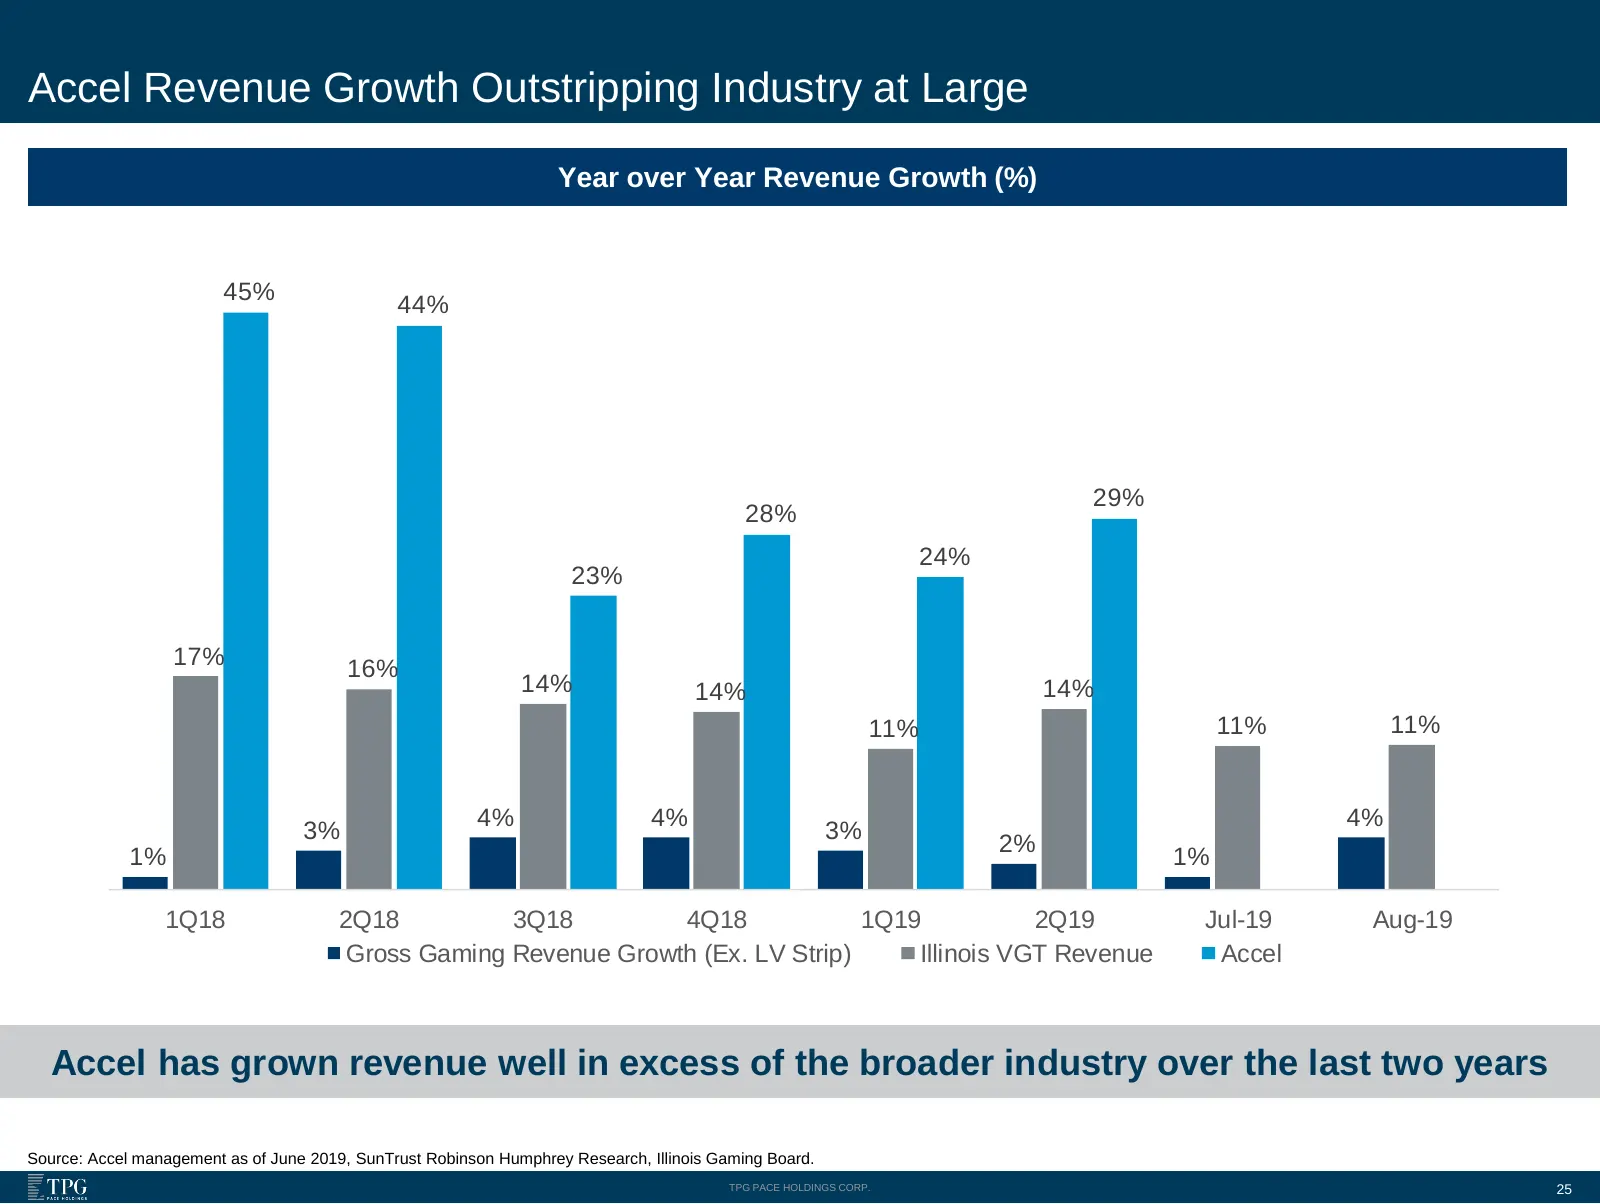
Accel Revenue Growth Outstripping Industry at Large Year over Year Revenue Growth (%) 45% 44% 29% 28% 24% 23% 17% 16% 14% 14% 14% 11% 11% 11% 4% 4% 4% 3% 3% 2% 1% 1% 1Q18 2Q18 3Q18 4Q18 1Q19 2Q19 Jul-19 Aug-19 Gross Gaming Revenue Growth (Ex. LV Strip) Illinois VGT Revenue Accel Accel has grown reve
Slide 26: Location Trends by Vintage
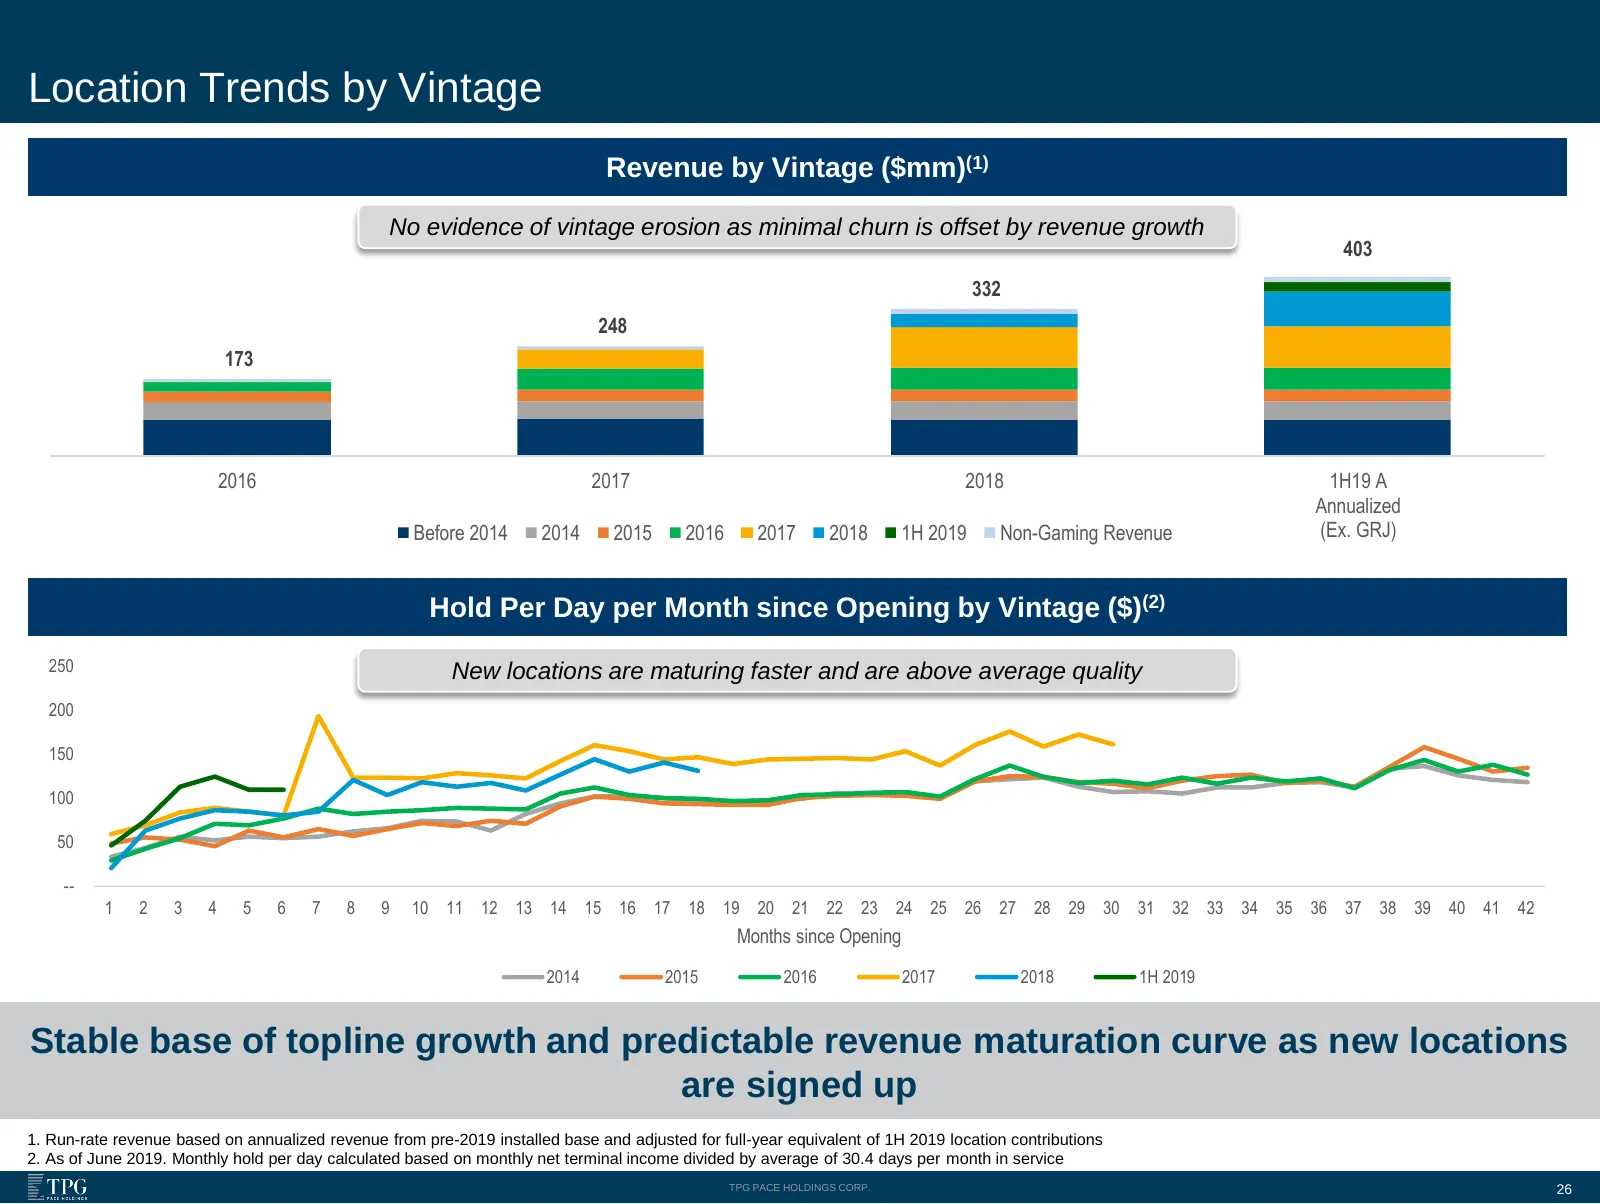
Location Trends by Vintage Revenue by Vintage ($mm)(1) No evidence of vintage erosion as minimal churn is offset by revenue growth 403 332 248 173 2016 2017 2018 1H19 A Annualized Before 2014 2014 2015 2016 2017 2018 1H 2019 Non-Gaming Revenue (Ex. GRJ) Hold Per Day per Month since Opening by Vintag
Slide 27: Grand River Acquisition Update
Grand River Acquisition Update TPG PACE HOLDINGS CORP.
Slide 28: Accel is a Disciplined Buyer
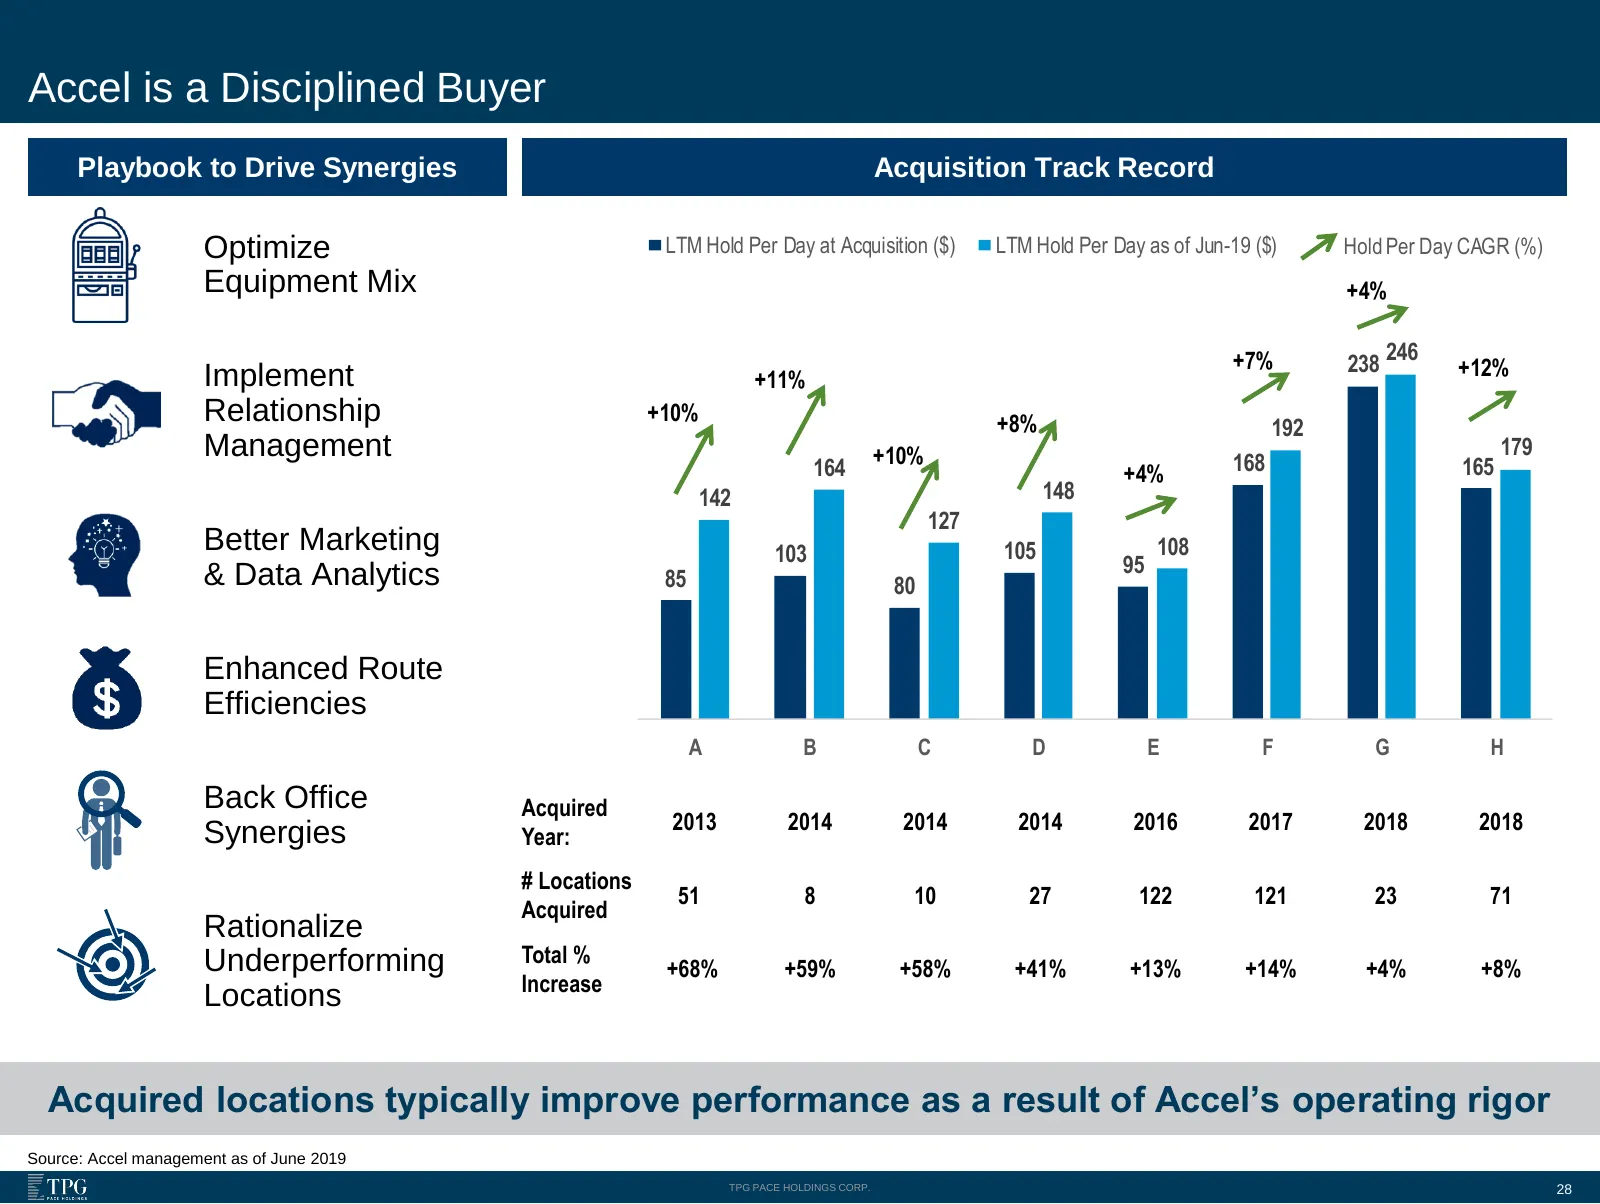
Accel is a Disciplined Buyer Playbook to Drive Synergies Acquisition Track Record Optimize LTM Hold Per Day at Acquisition ($) LTM Hold Per Day as of Jun-19 ($) Hold Per Day CAGR (%) Equipment Mix +4% +7% 238 246 +12% Implement +11% Relationship +10% +8% 192 Management +10% 179 164 +4% 168 165 142 1
Slide 29: Grand River Jackpot – Company Overview
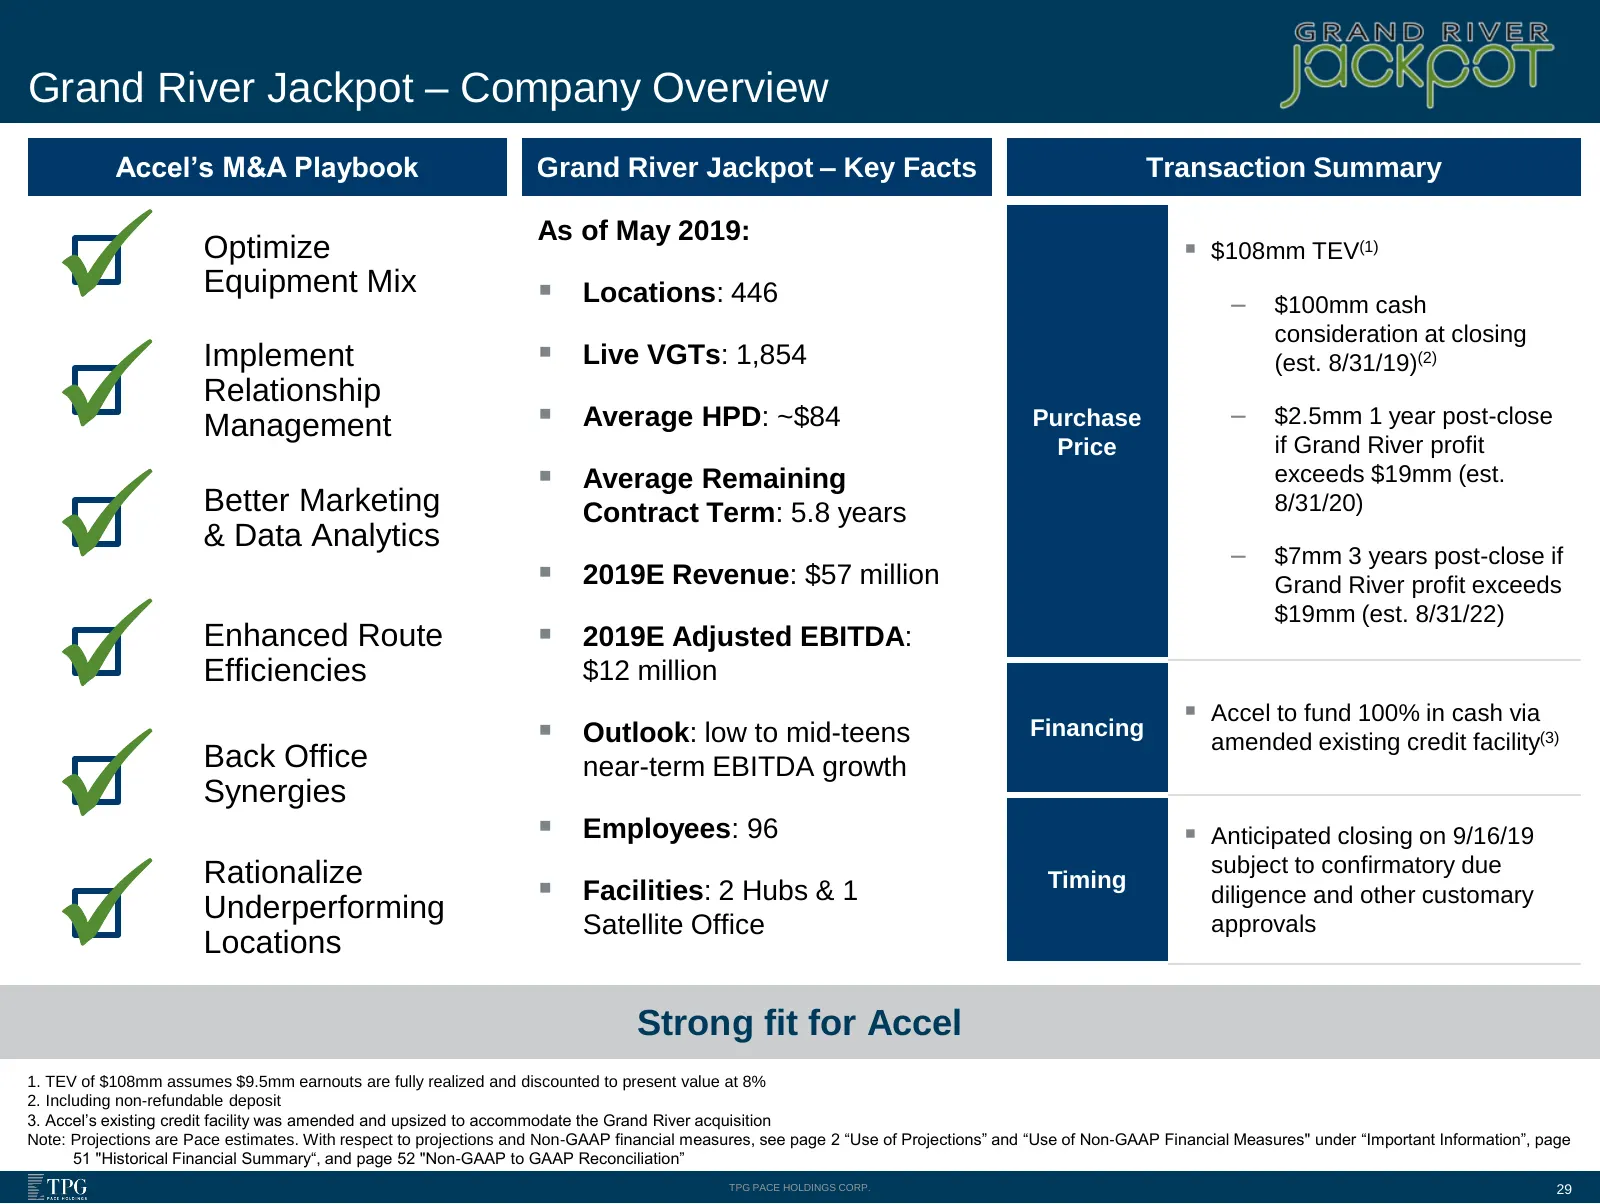
Grand River Jackpot – Company Overview Accel’s M&A Playbook Grand River Jackpot – Key Facts Transaction Summary As of May 2019: Optimize ▪ $108mm TEV(1) Equipment Mix ▪ Locations: 446 ̶ $100mm cash consideration at closing Implement ▪ Live VGTs: 1,854 (est. 8/31/19)(2) Relationship Management ▪ Aver
Slide 30: PF Accel – Geographic Location Density
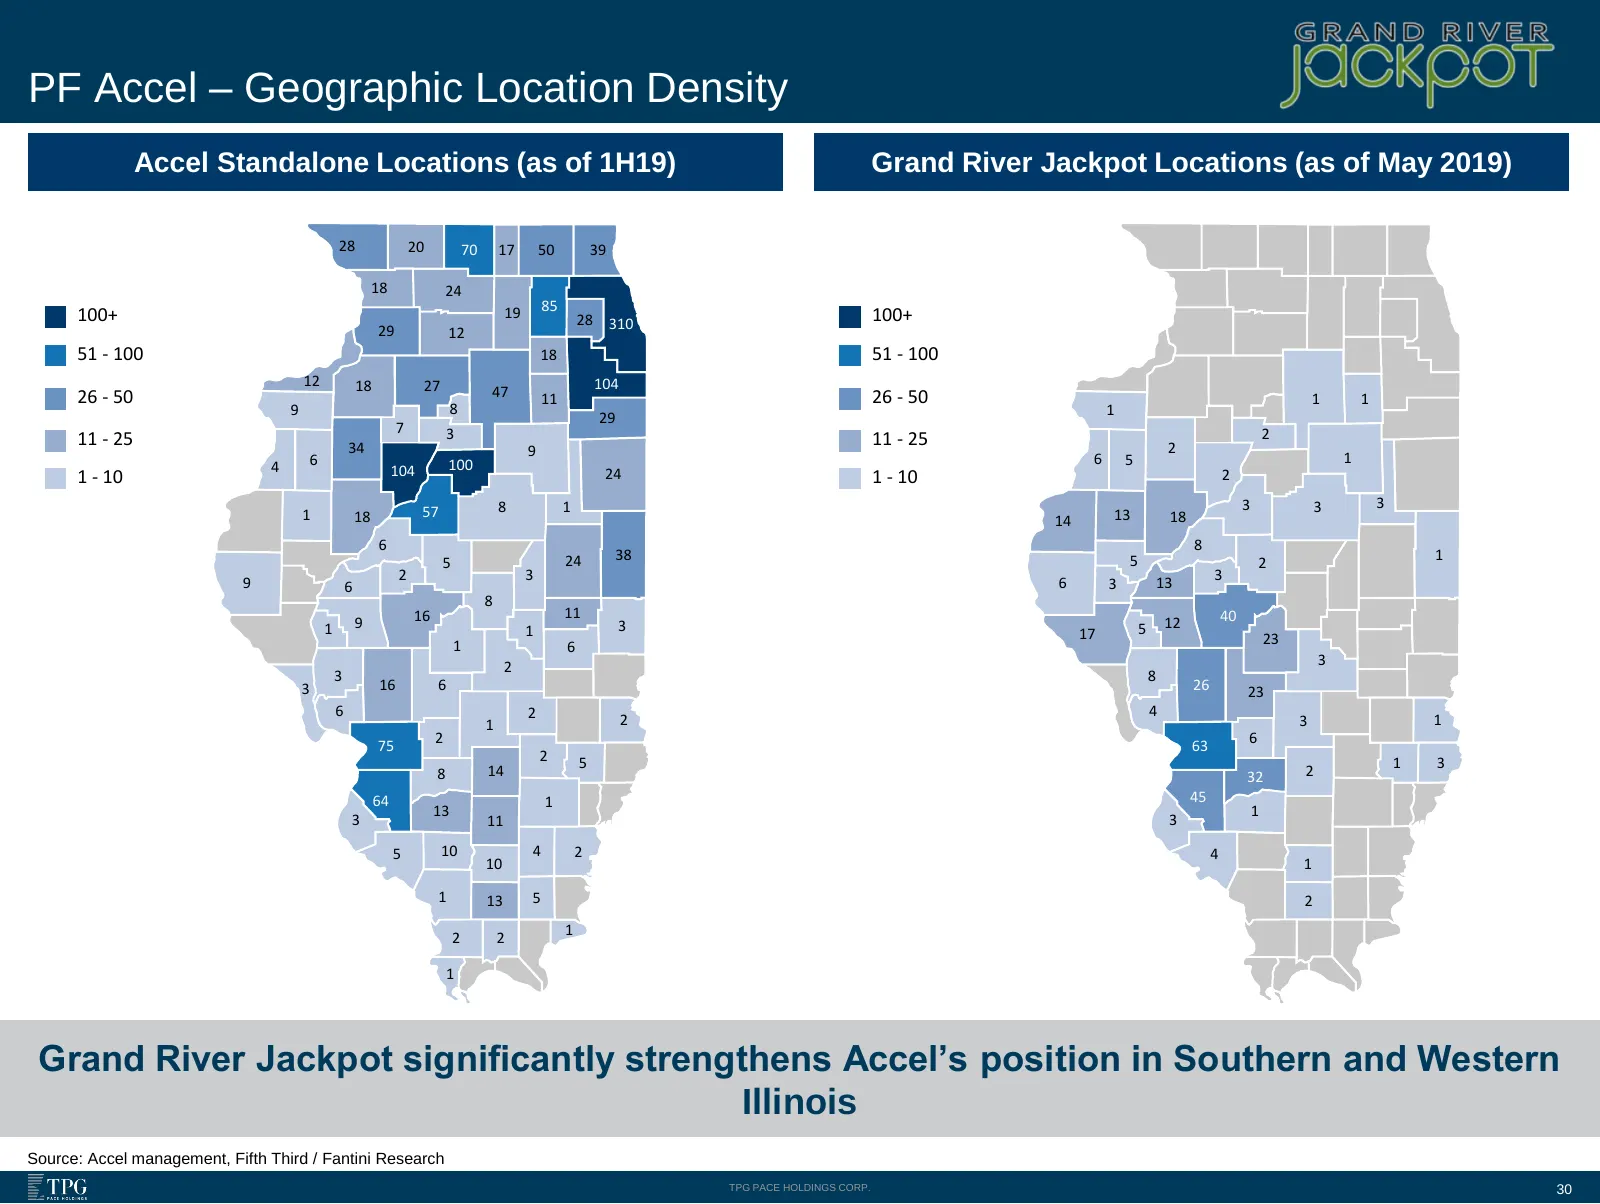
PF Accel – Geographic Location Density Accel Standalone Locations (as of 1H19) Grand River Jackpot Locations (as of May 2019) 28 20 70 17 50 39 18 24 19 85 100+ 28 310 100+ 29 12 51 - 100 18 51 - 100 12 18 27 104 26 - 50 47 11 26 - 50 1 1 9 8 1 29 7 3 2 11 - 25 34 11 - 25 2 9 1 4 6 100 6 5 1 - 10 10
Slide 31: Regulatory Update
Regulatory Update TPG PACE HOLDINGS CORP.
Slide 32: Illinois Regulatory Update
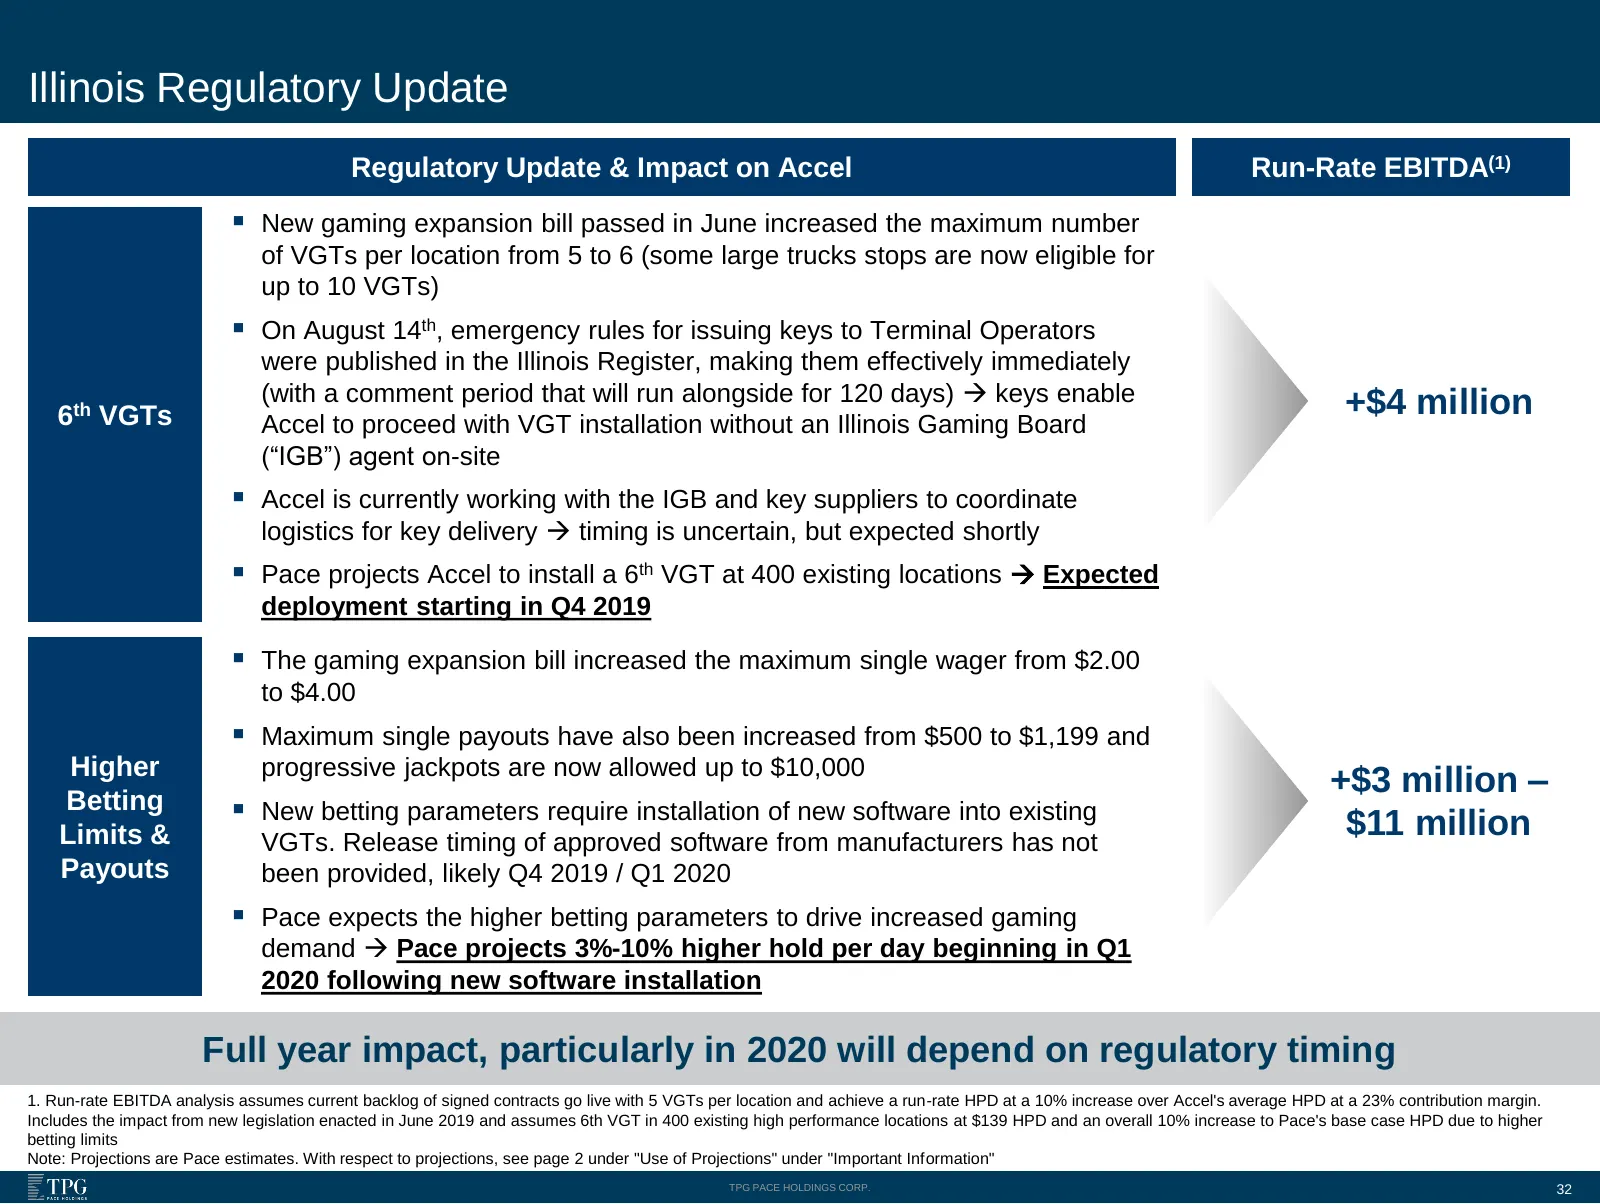
Illinois Regulatory Update Regulatory Update & Impact on Accel Run-Rate EBITDA(1) ▪ New gaming expansion bill passed in June increased the maximum number of VGTs per location from 5 to 6 (some large trucks stops are now eligible for up to 10 VGTs) ▪ On August 14th, emergency rules for issuing keys t

Slide 33: Model Drivers
Model Drivers TPG PACE HOLDINGS CORP.
Slide 34: Simple Economic Model Building Blocks → Key Pace Assumptions
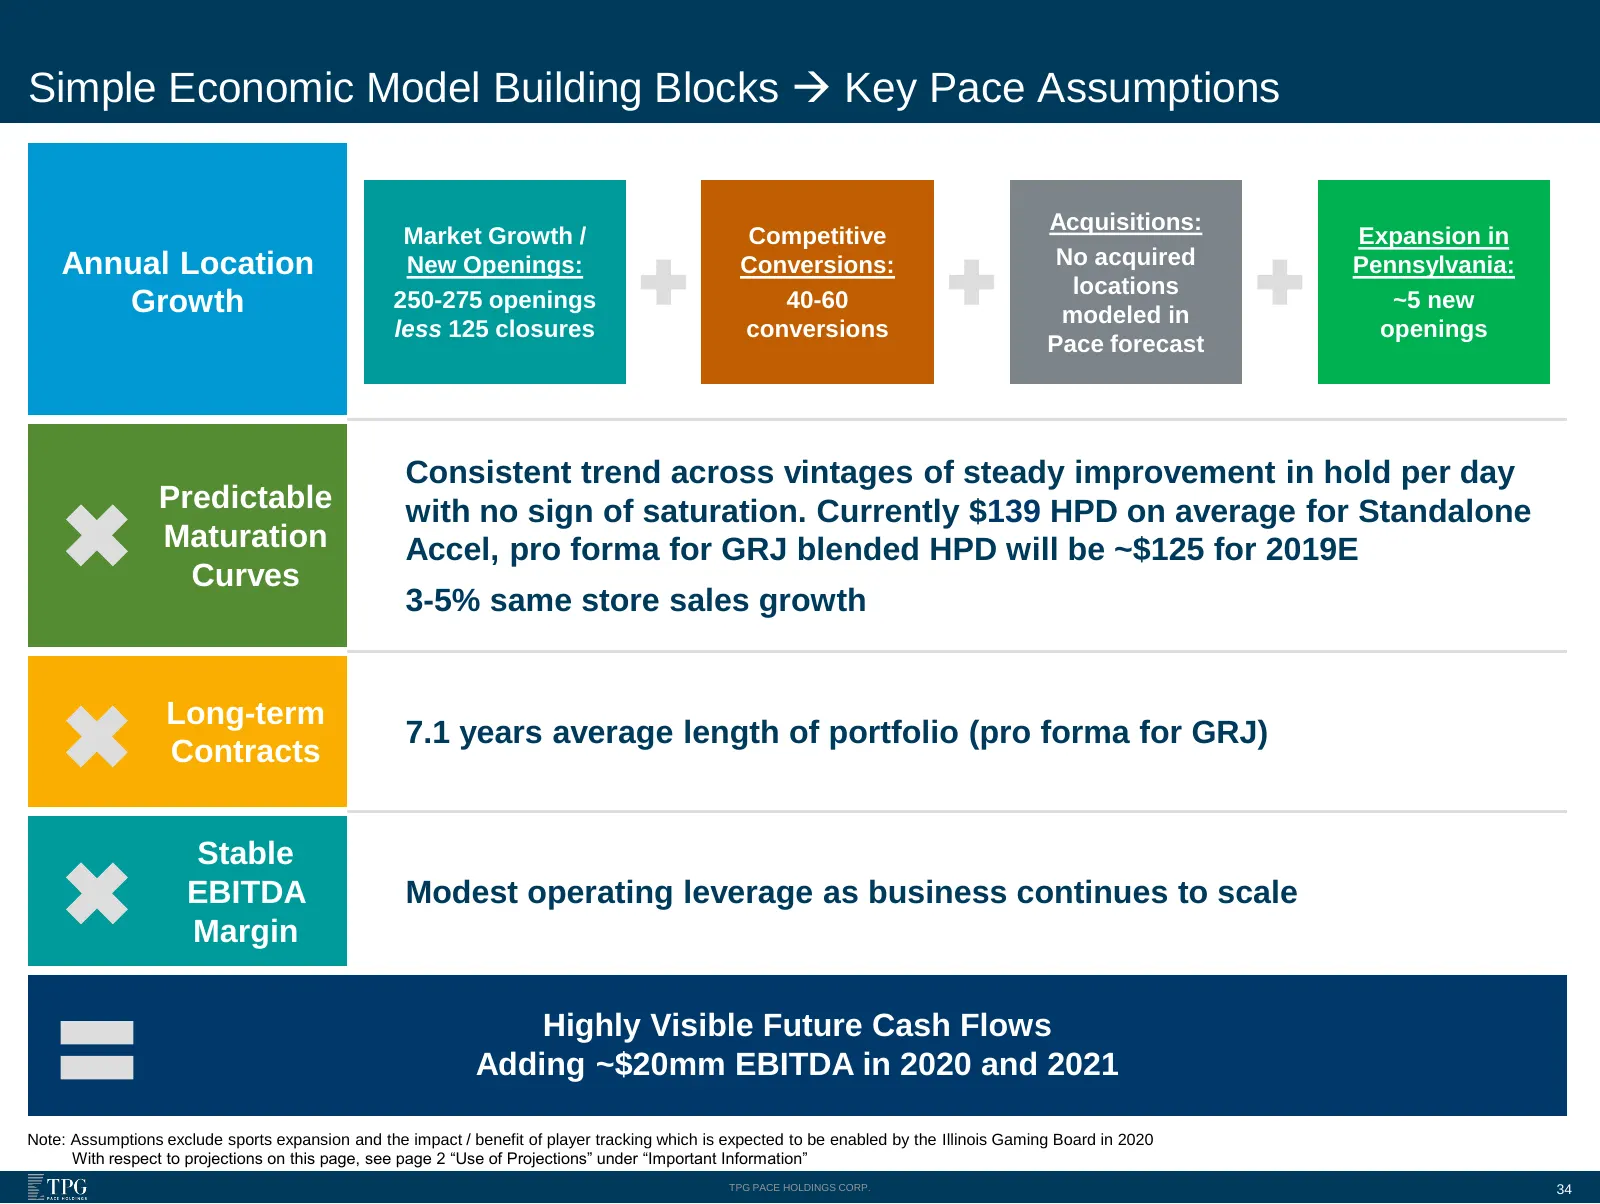
Simple Economic Model Building Blocks → Key Pace Assumptions Acquisitions: Market Growth / Competitive Expansion in Annual Location New Openings: Conversions: No acquired Pennsylvania: locations Growth 250-275 openings 40-60 modeled in ~5 new less 125 closures conversions openings Pace forecast Cons
Slide 35: Location Portfolio Building Blocks
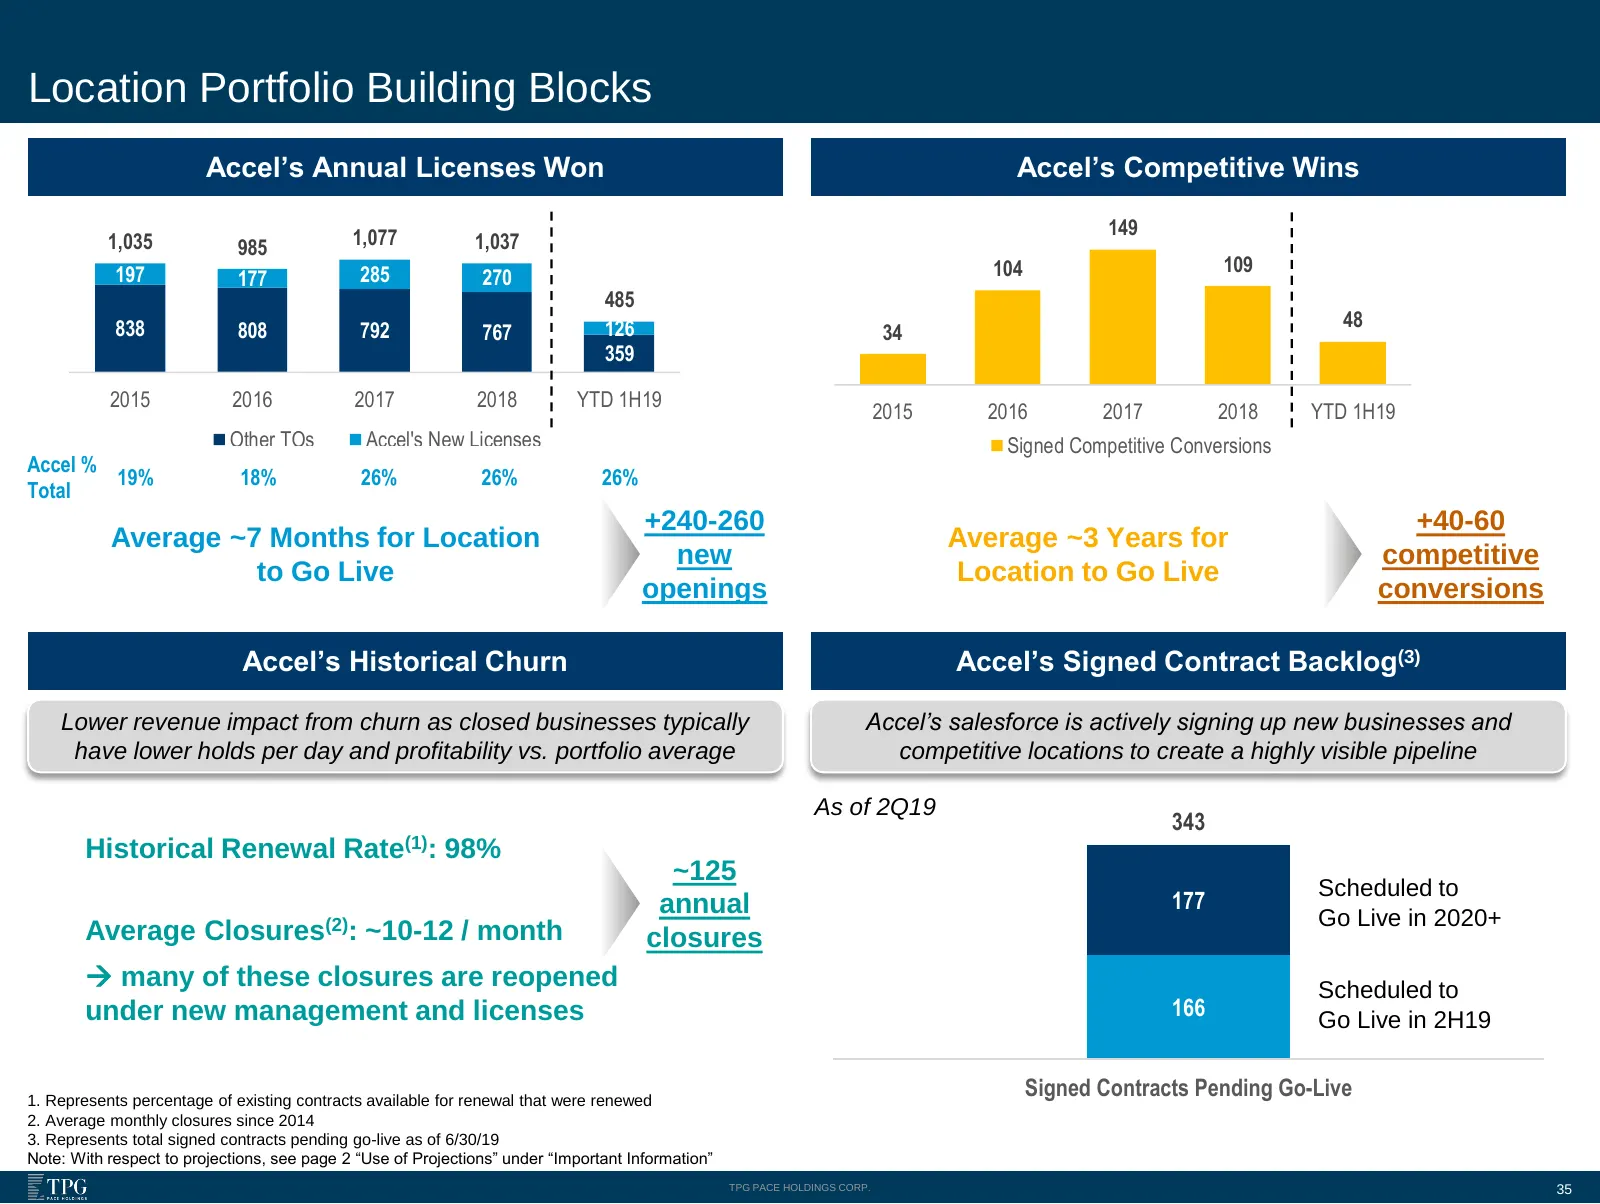
Location Portfolio Building Blocks Accel’s Annual Licenses Won Accel’s Competitive Wins 1,077 149 1,035 985 1,037 197 285 104 109 177 270 485 838 808 126 48 792 767 34 359 2015 2016 2017 2018 YTD 1H19 2015 2016 2017 2018 YTD 1H19 Other TOs Accel's New Licenses Signed Competitive Conversions Accel %
Slide 36: Accel Location Growth Components
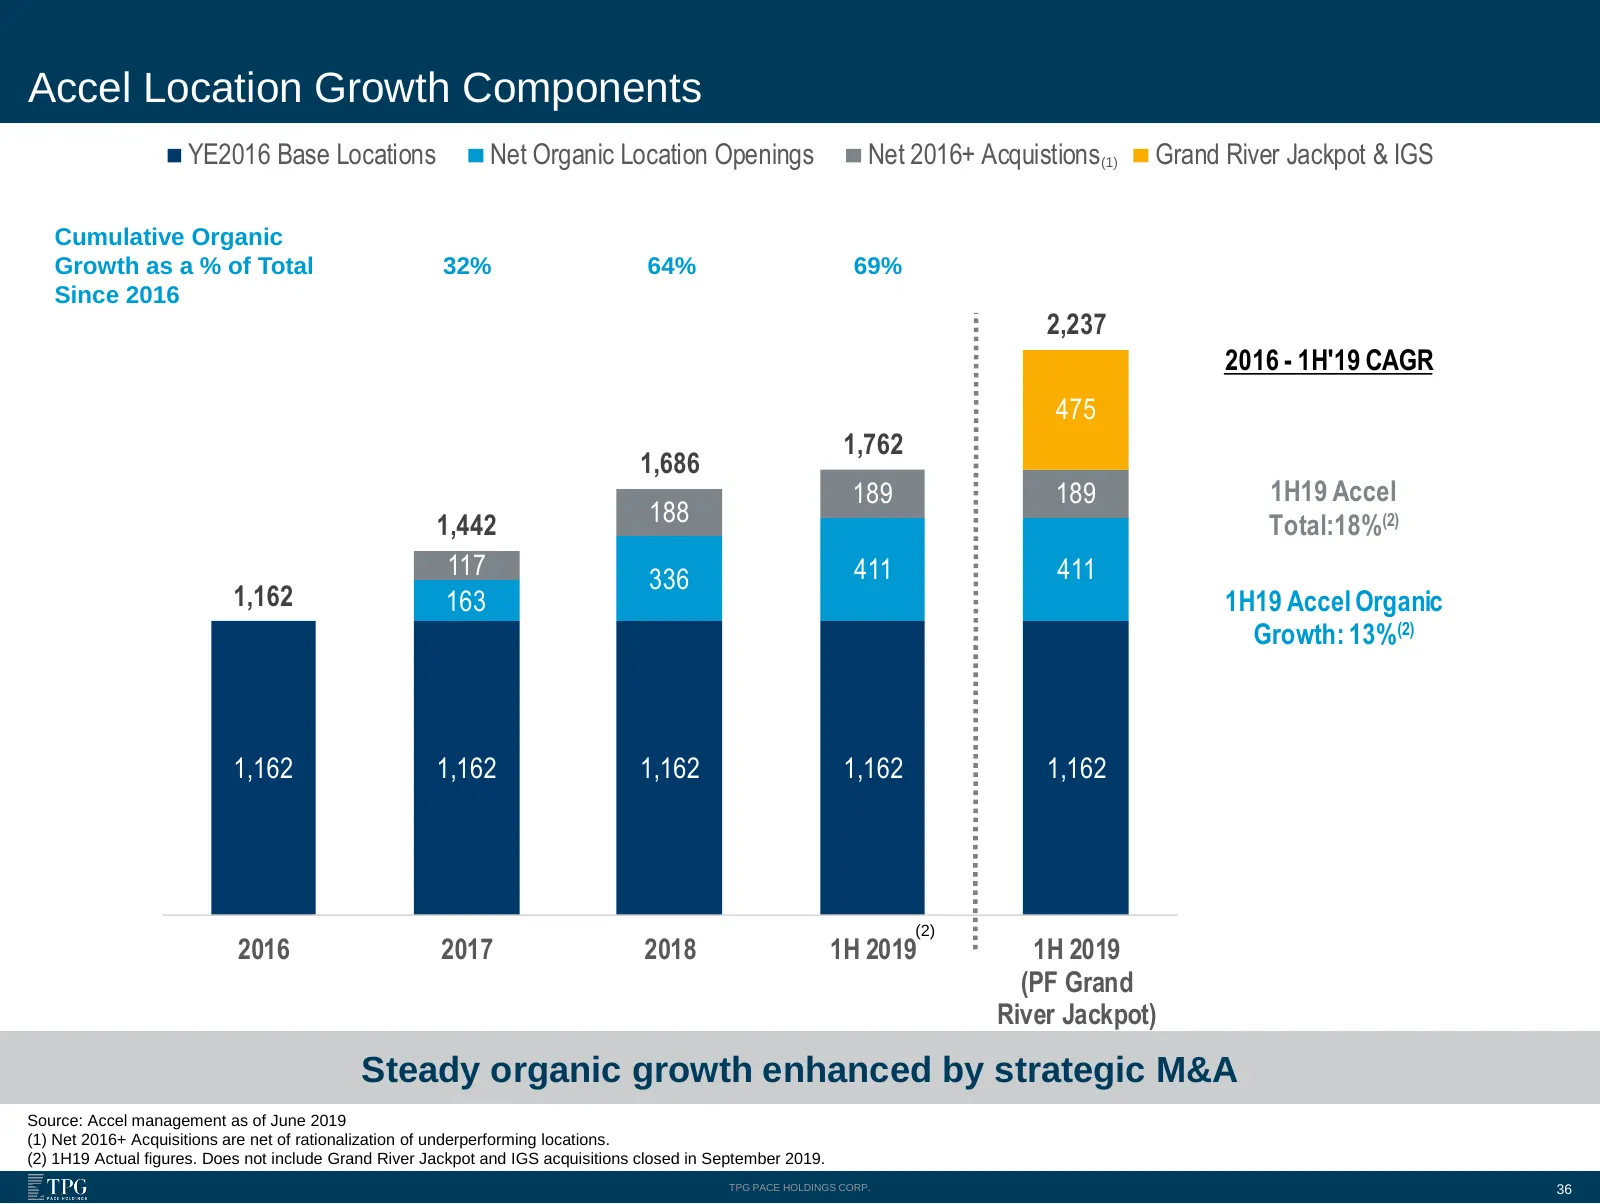
Accel Location Growth Components YE2016 Base Locations Net Organic Location Openings Net 2016+ Acquistions(1) Grand River Jackpot & IGS Cumulative Organic Growth as a % of Total 32% 64% 69% Since 2016 2,237 2016 - 1H'19 CAGR 475 1,762 1,686 189 189 1H19 Accel 1,442 188 Total:18%(2) 117 336 411 411 1
Slide 37: Location Trends by Vintage
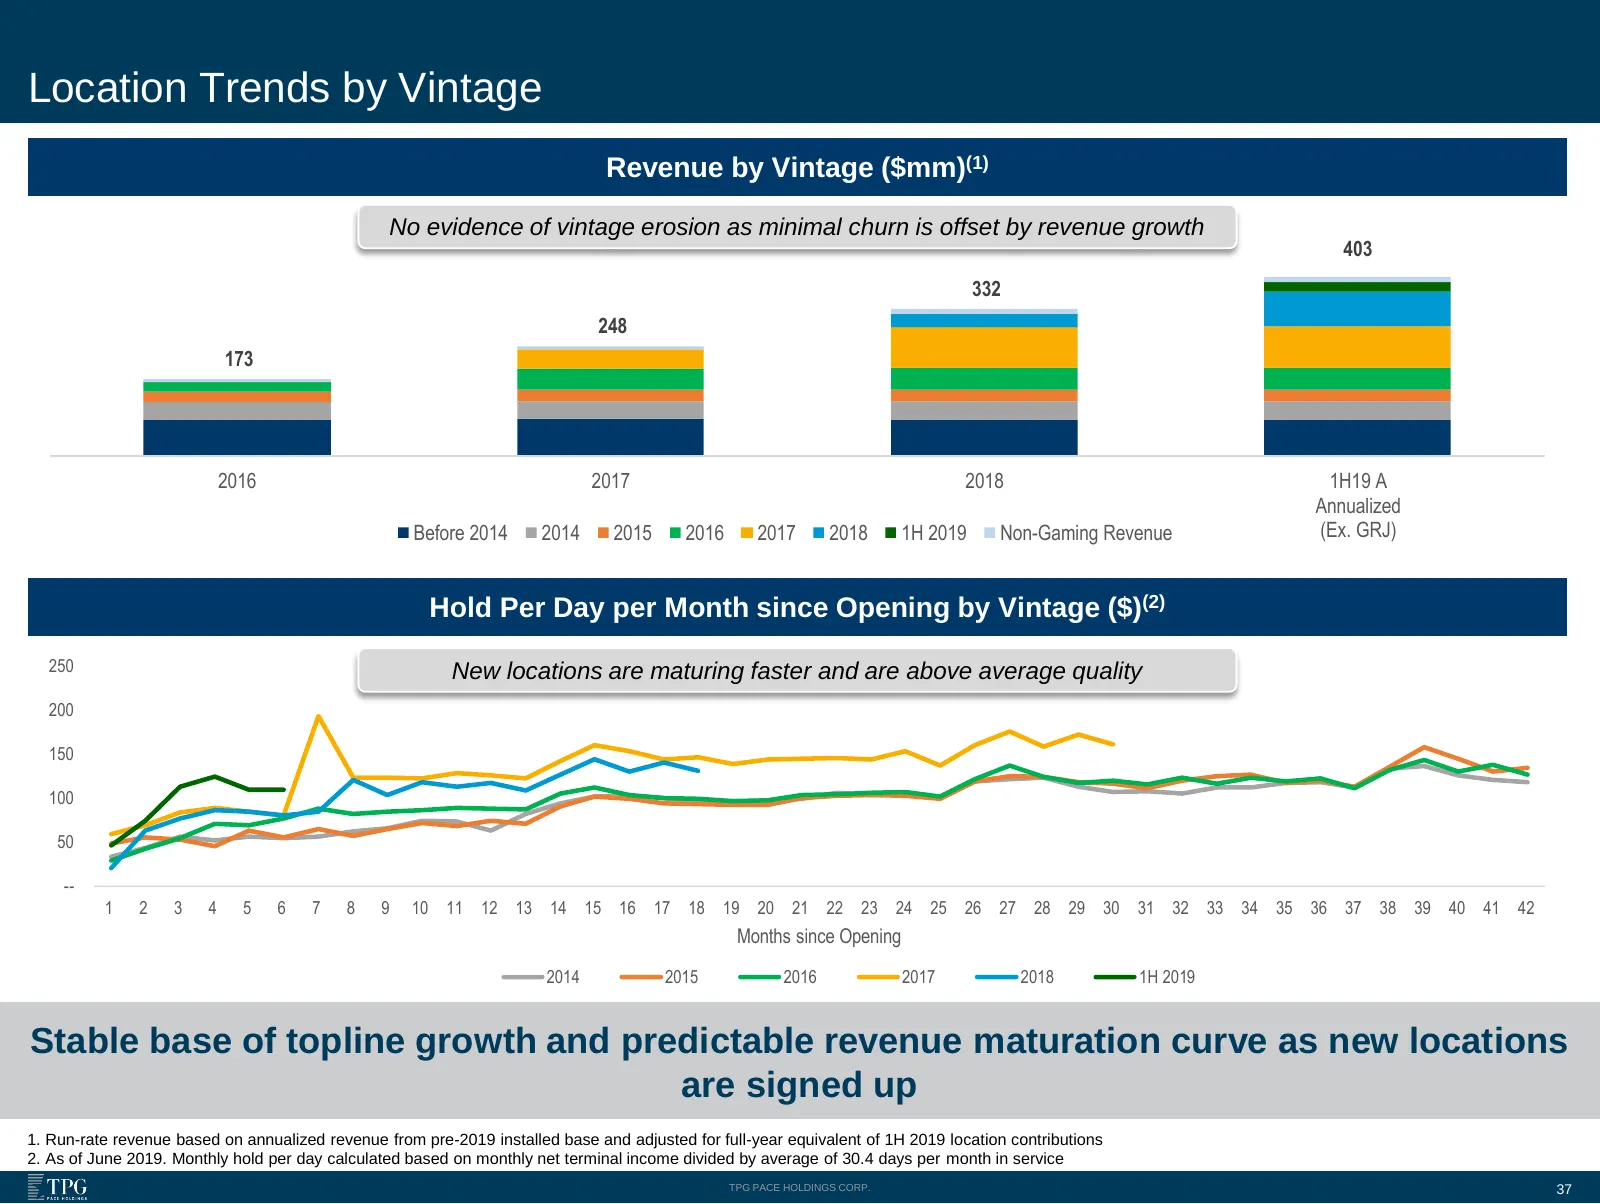
Location Trends by Vintage Revenue by Vintage ($mm)(1) No evidence of vintage erosion as minimal churn is offset by revenue growth 403 332 248 173 2016 2017 2018 1H19 A Annualized Before 2014 2014 2015 2016 2017 2018 1H 2019 Non-Gaming Revenue (Ex. GRJ) Hold Per Day per Month since Opening by Vintag
Slide 38: Tax Rate, Capex and Working Capital
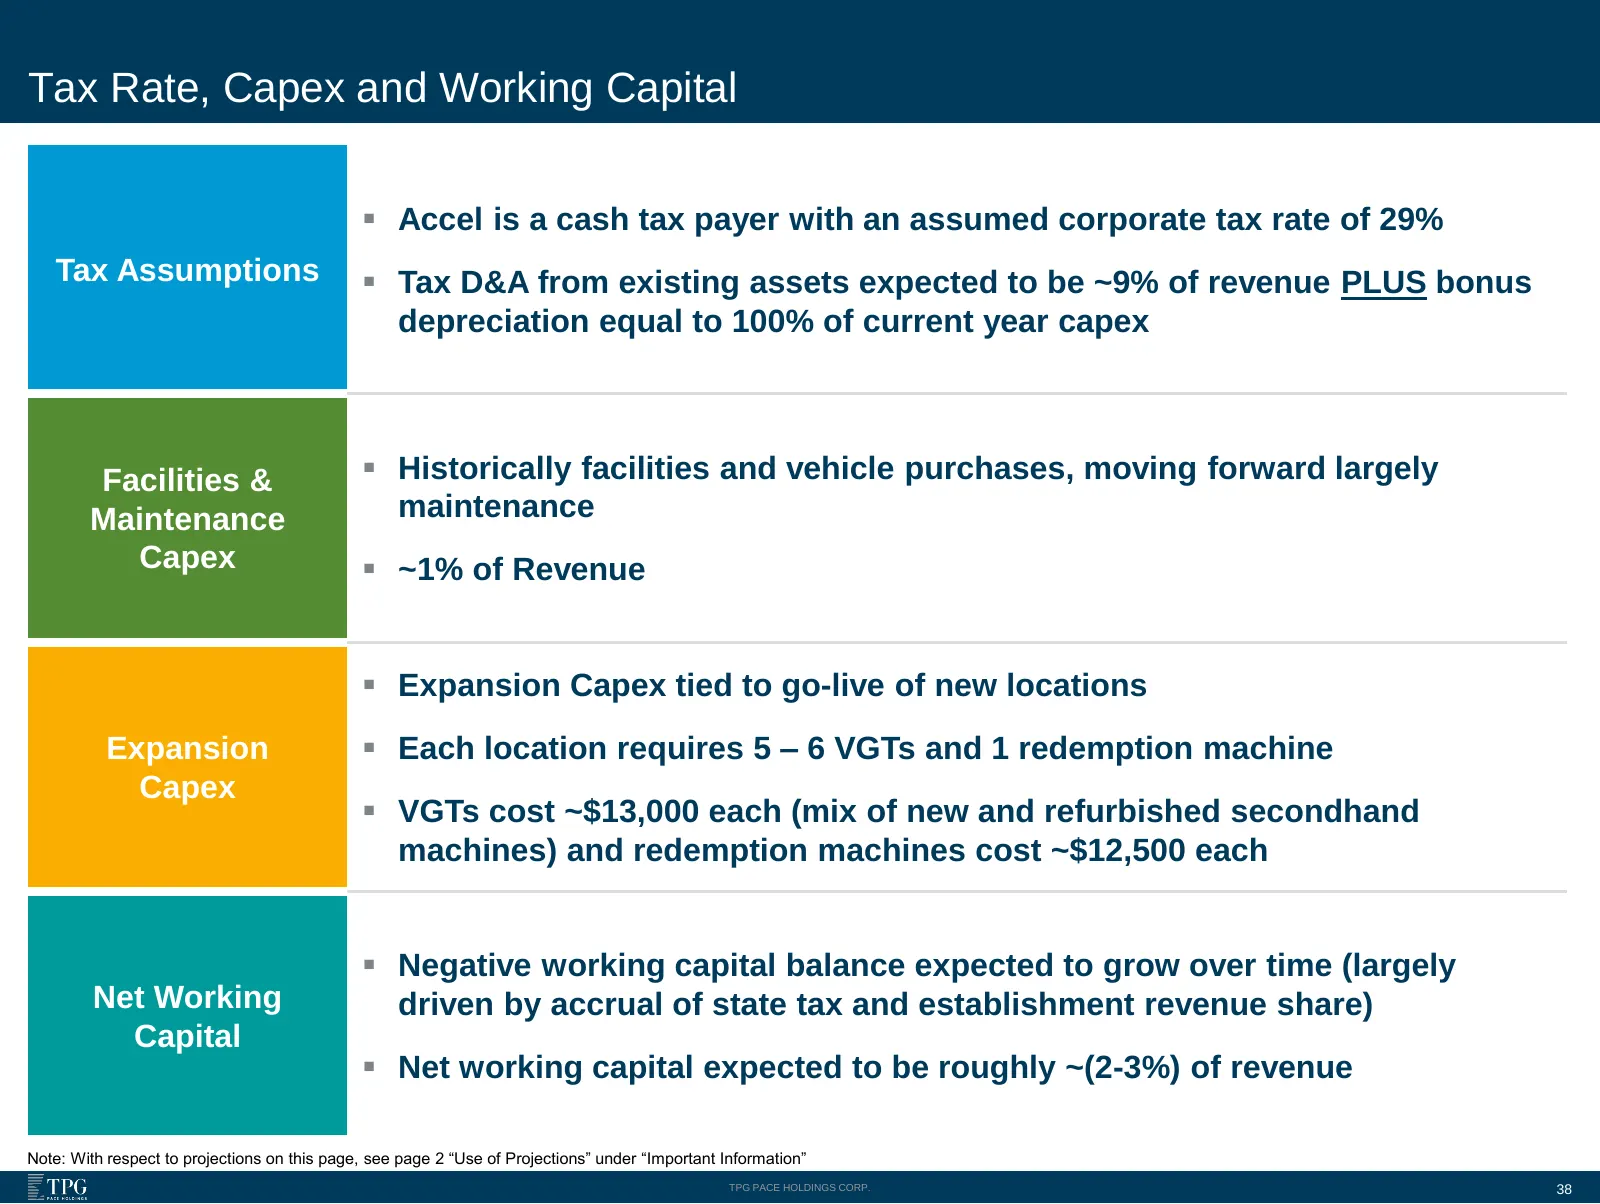
Tax Rate, Capex and Working Capital ▪ Accel is a cash tax payer with an assumed corporate tax rate of 29% Tax Assumptions ▪ Tax D&A from existing assets expected to be ~9% of revenue PLUS bonus depreciation equal to 100% of current year capex Facilities & ▪ Historically facilities and vehicle purcha
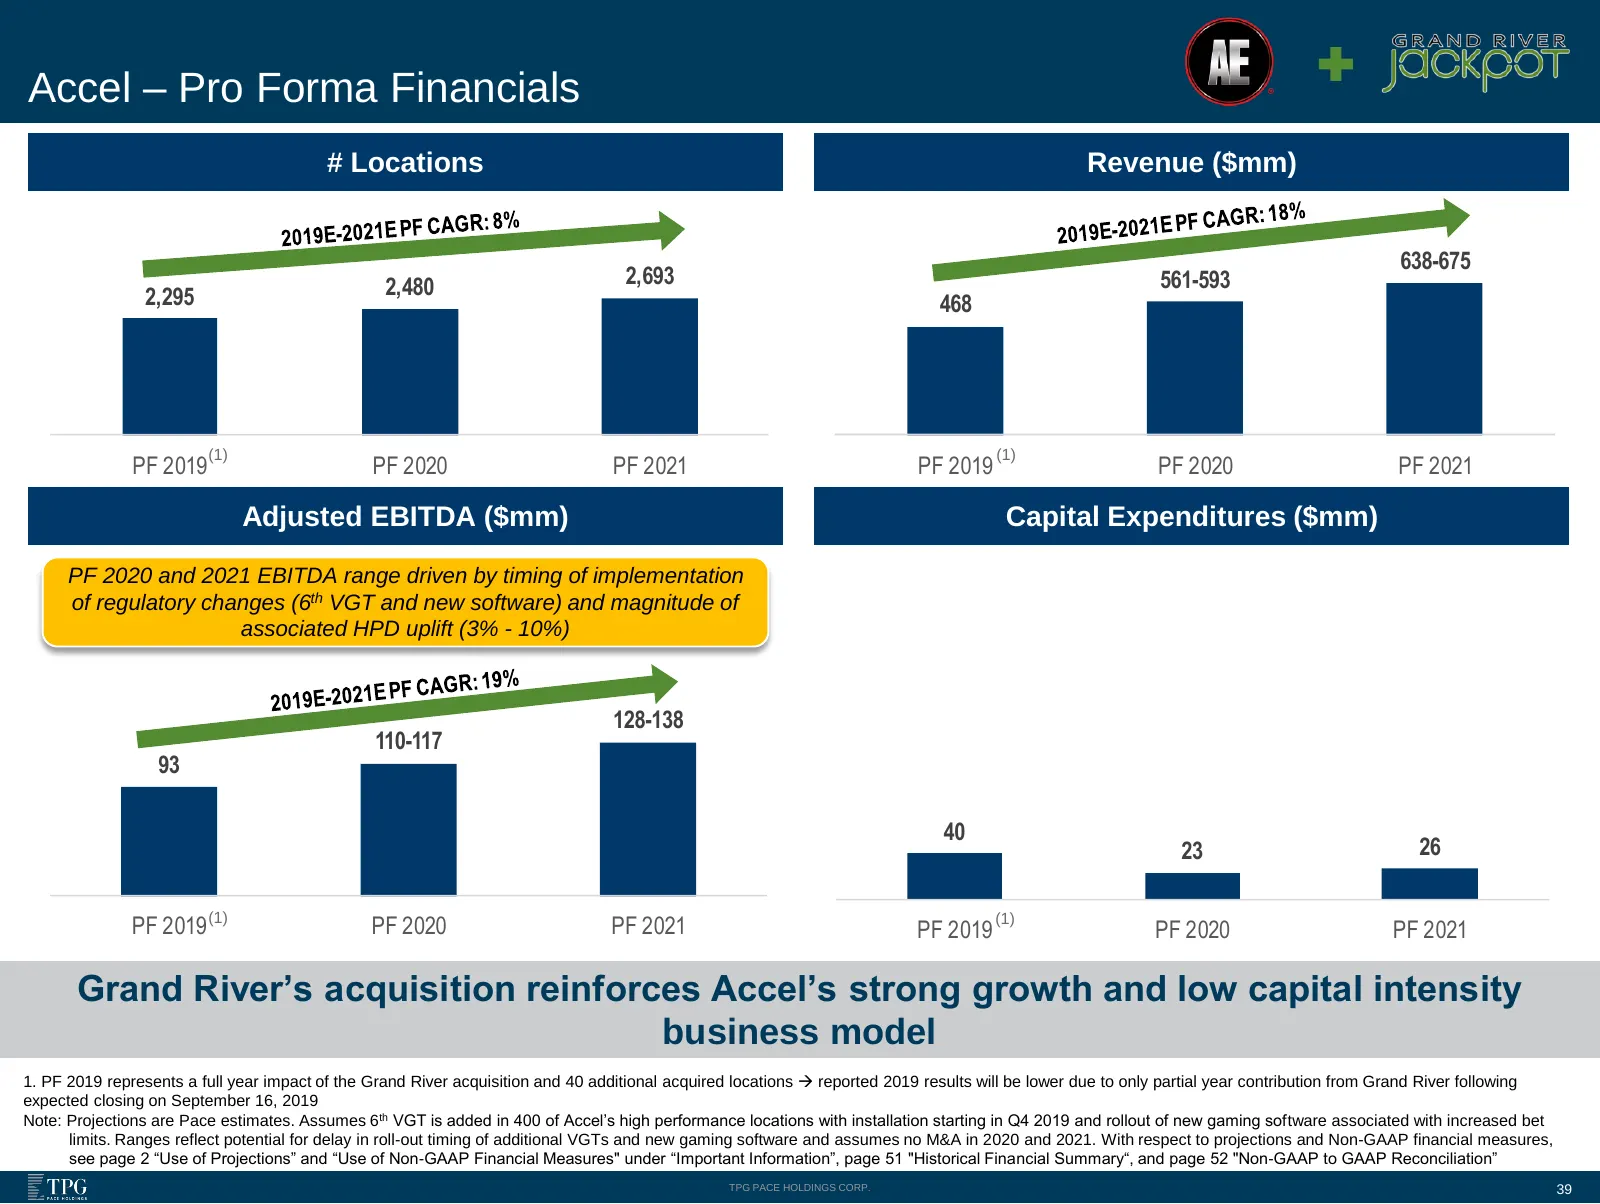
Slide 39: Accel – Pro Forma Financials
Accel – Pro Forma Financials # Locations Revenue ($mm) 638-675 2,480 2,693 561-593 2,295 468 (1) (1) PF 2019 PF 2020 PF 2021 PF 2019 PF 2020 PF 2021 Adjusted EBITDA ($mm) Capital Expenditures ($mm) PF 2020 and 2021 EBITDA range driven by timing of implementation of regulatory changes (6th VGT and ne
Slide 40: Transaction Update
Transaction Update TPG PACE HOLDINGS CORP.
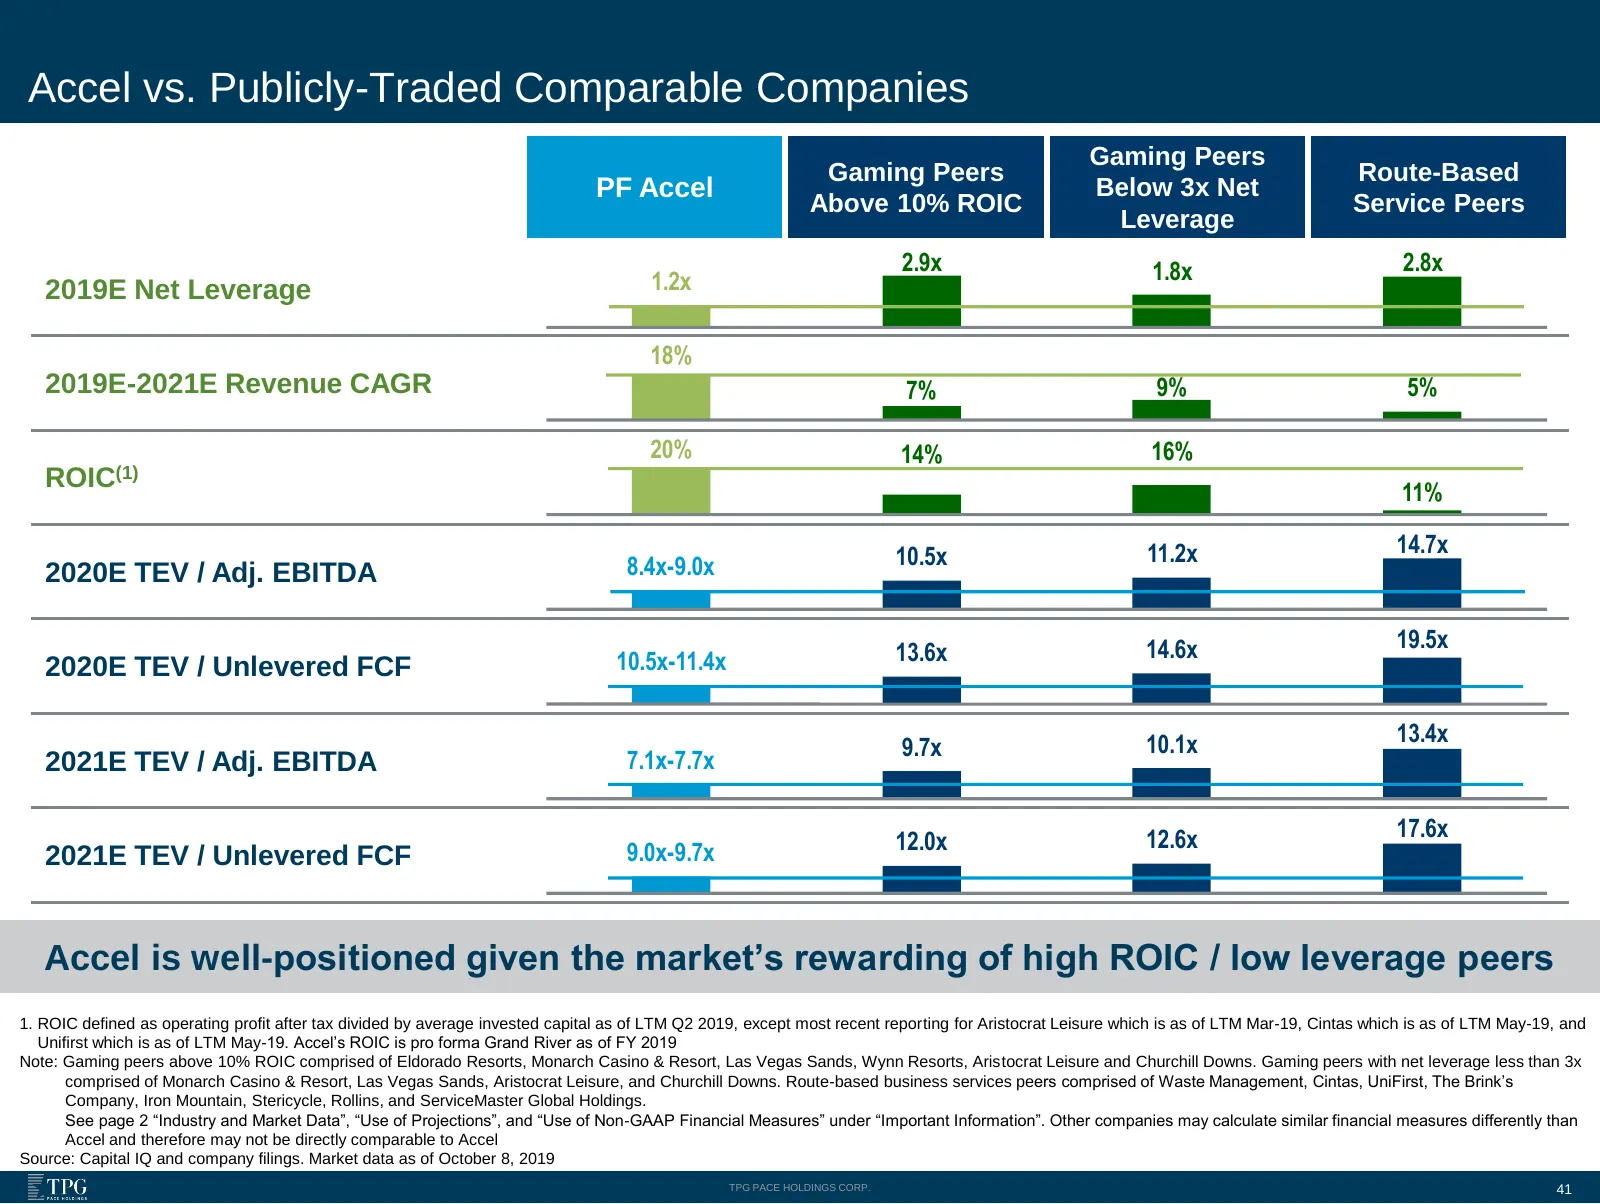
Slide 41: Accel vs. Publicly-Traded Comparable Companies
Accel vs. Publicly-Traded Comparable Companies Gaming Peers Gaming Peers Route-Based PF Accel Below 3x Net Above 10% ROIC Service Peers Leverage 2.9x 1.8x 2.8x 2019E Net Leverage 1.2x 18% 2019E-2021E Revenue CAGR 7% 9% 5% 20% 14% 16% ROIC(1) 11% 10.5x 11.2x 14.7x 2020E TEV / Adj. EBITDA 8.4x-9.0x 14
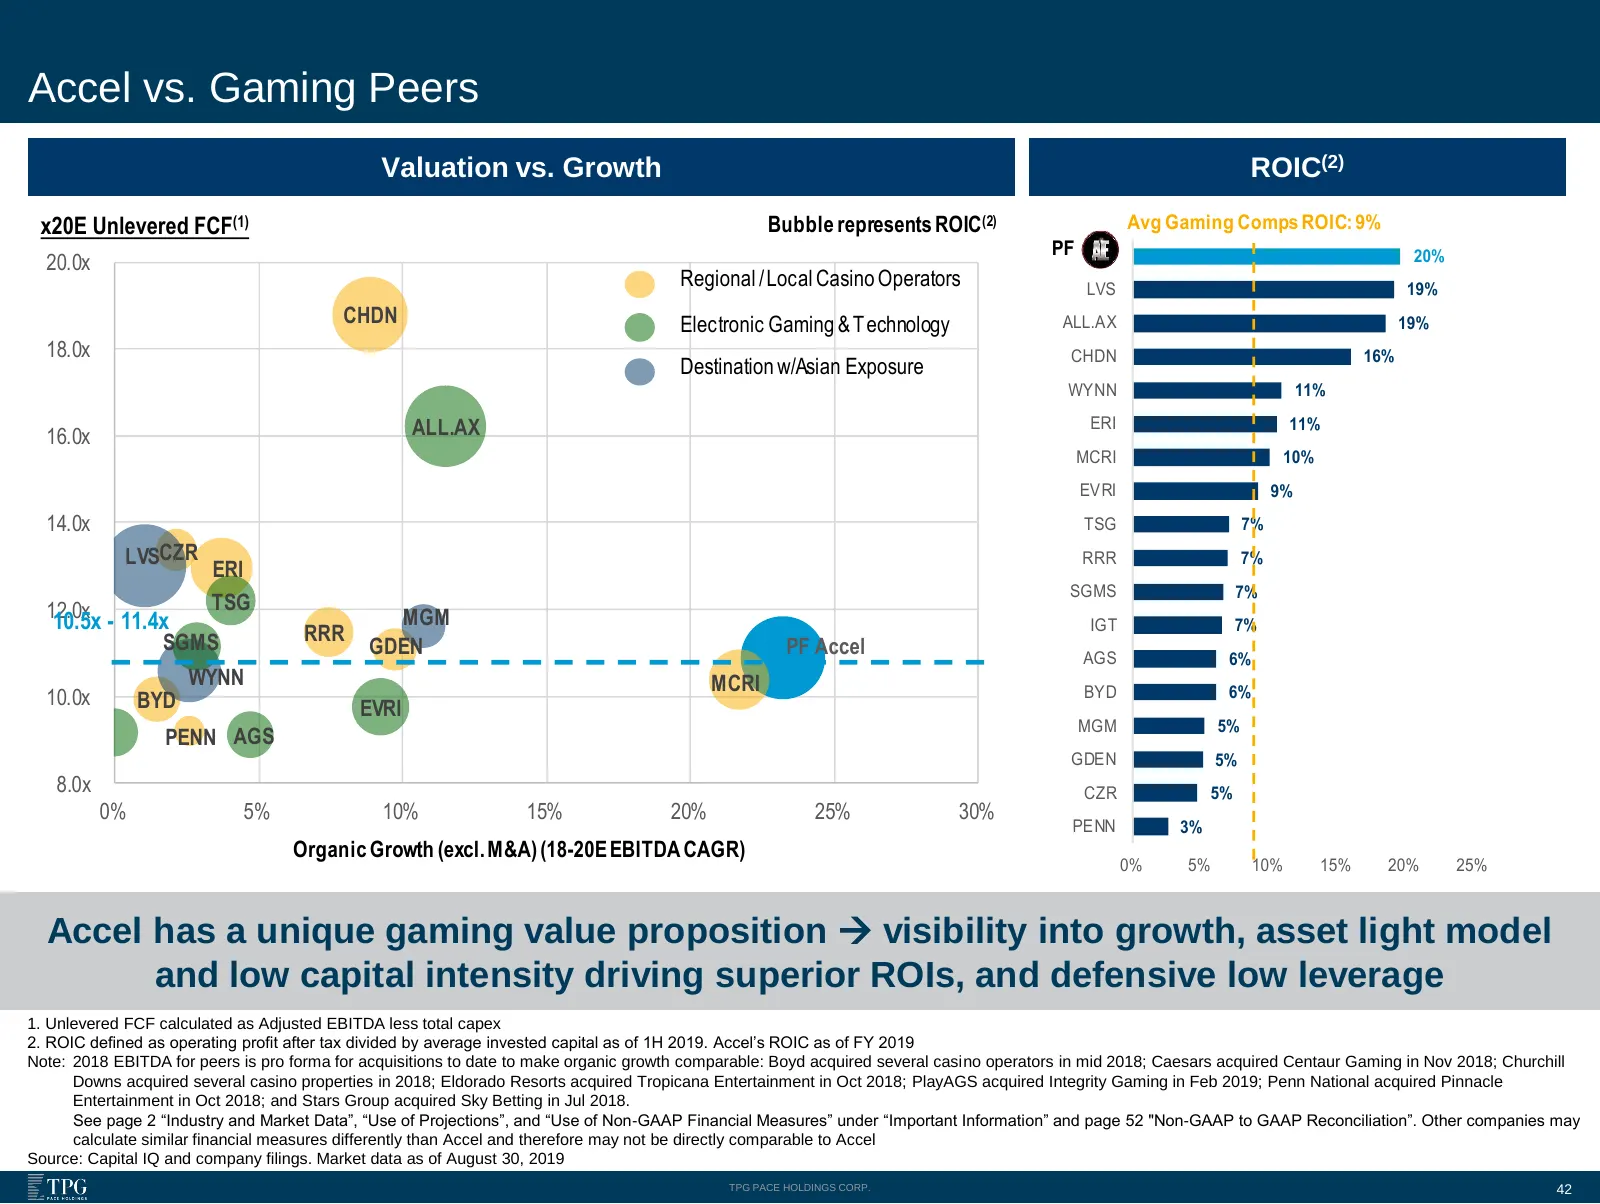
Slide 42: Accel vs. Gaming Peers
Accel vs. Gaming Peers Valuation vs. Growth ROIC(2) x20E FCF x20E (1) Unlevered FCF(1) Bubble represents ROIC(2) Avg Gaming Comps ROIC: 9% PF 20% 20.0x Regional /Local Casino Operators LVS 19% CHDN Electronic Gaming & Technology ALL.AX 19% 18.0x CHDN 16% Destination w/Asian Exposure WYNN 11% ALL.AX
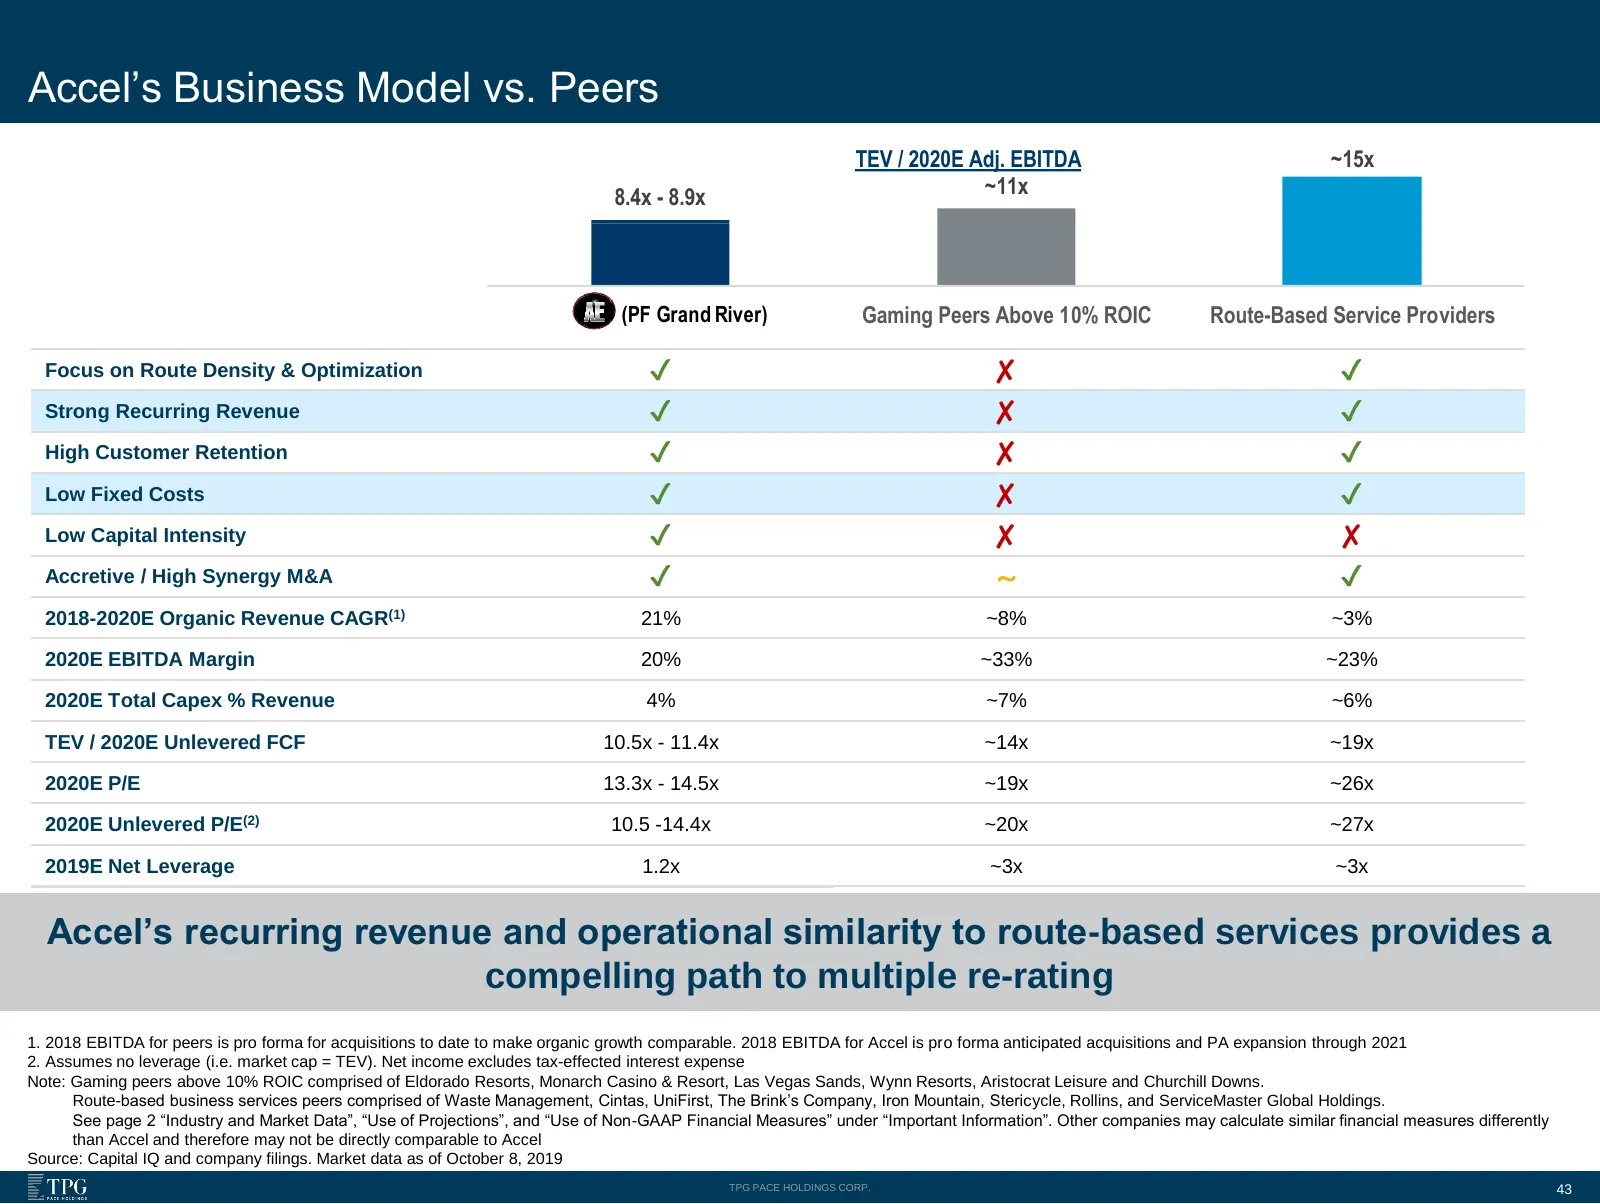
Slide 43: Accel's Business Model vs. Peers
Accel’s Business Model vs. Peers TEV / 2020E Adj. EBITDA ~15x 8.4x - 8.9x ~11x (PF Grand River) Gaming Peers Above 10% ROIC Route-Based Service Providers Focus on Route Density & Optimization ✔ ✘ ✔ Strong Recurring Revenue ✔ ✘ ✔ High Customer Retention ✔ ✘ ✔ Low Fixed Costs ✔ ✘ ✔ Low Capital Intensi
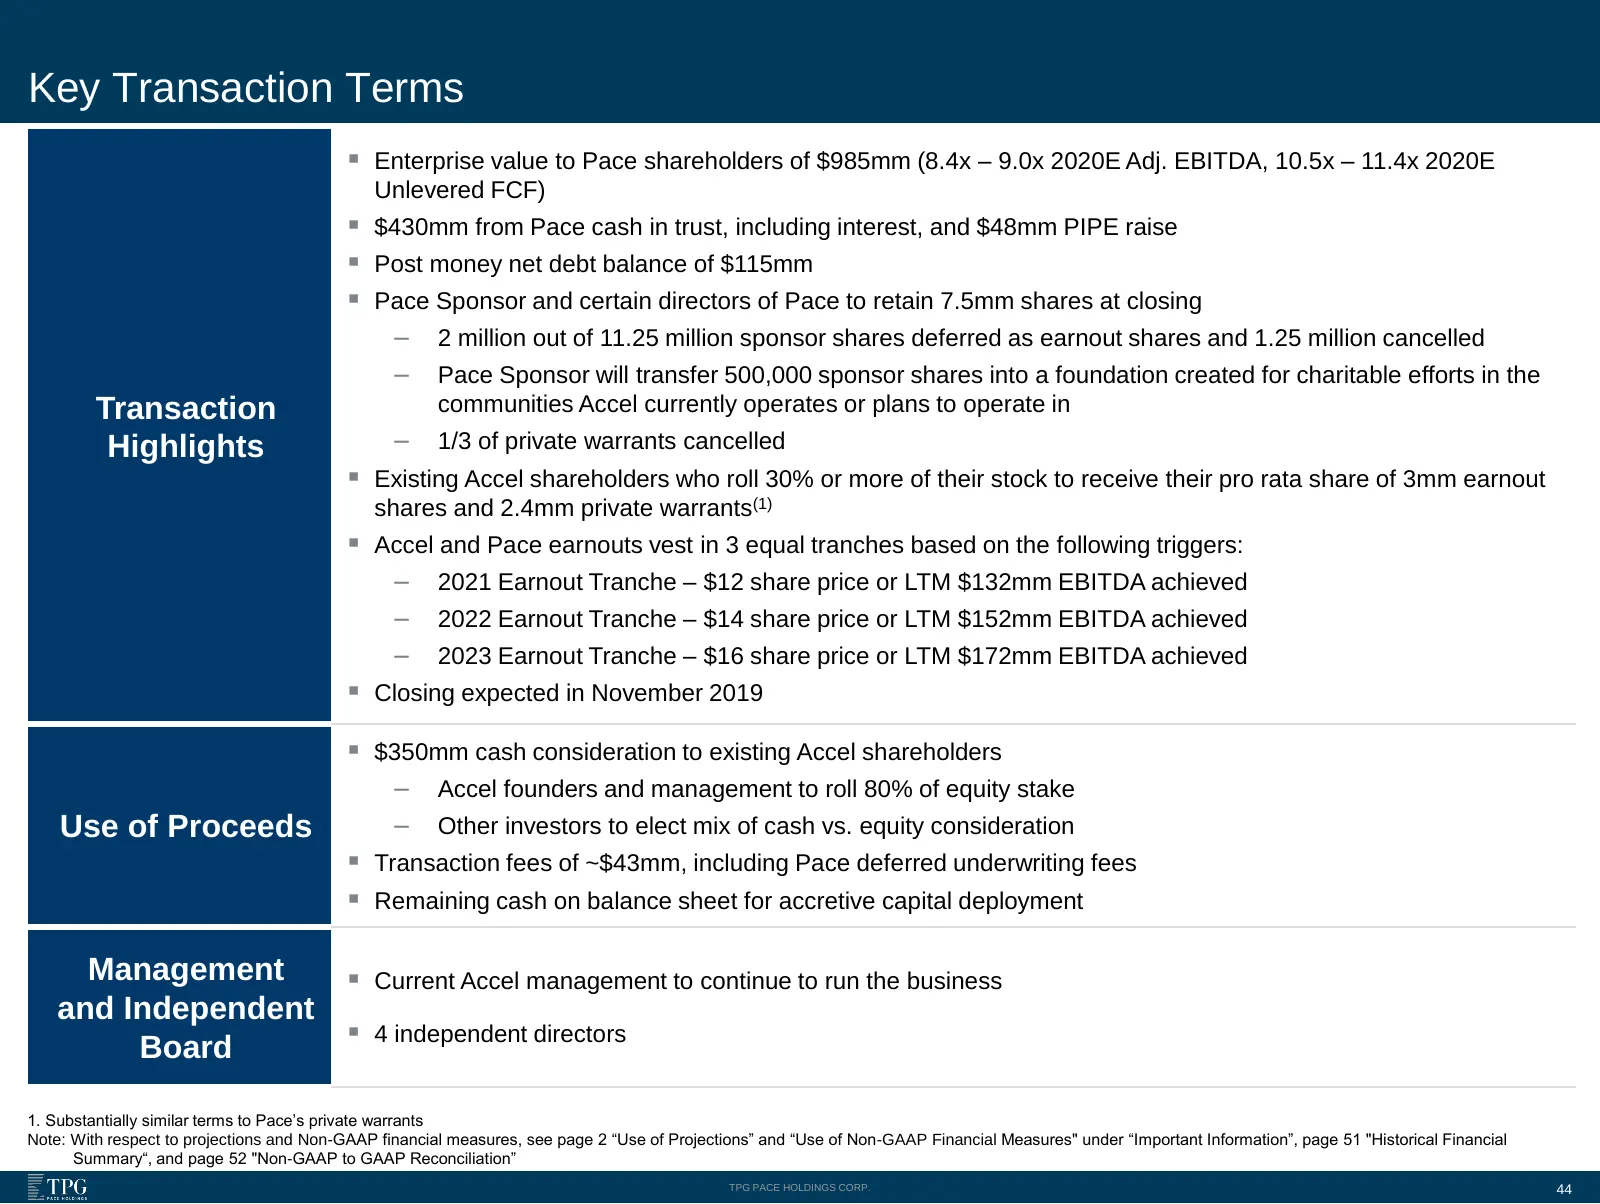
Slide 44: Key Transaction Terms
Key Transaction Terms ▪ Enterprise value to Pace shareholders of $985mm (8.4x – 9.0x 2020E Adj. EBITDA, 10.5x – 11.4x 2020E Unlevered FCF) ▪ $430mm from Pace cash in trust, including interest, and $48mm PIPE raise ▪ Post money net debt balance of $115mm ▪ Pace Sponsor and certain directors of Pace t
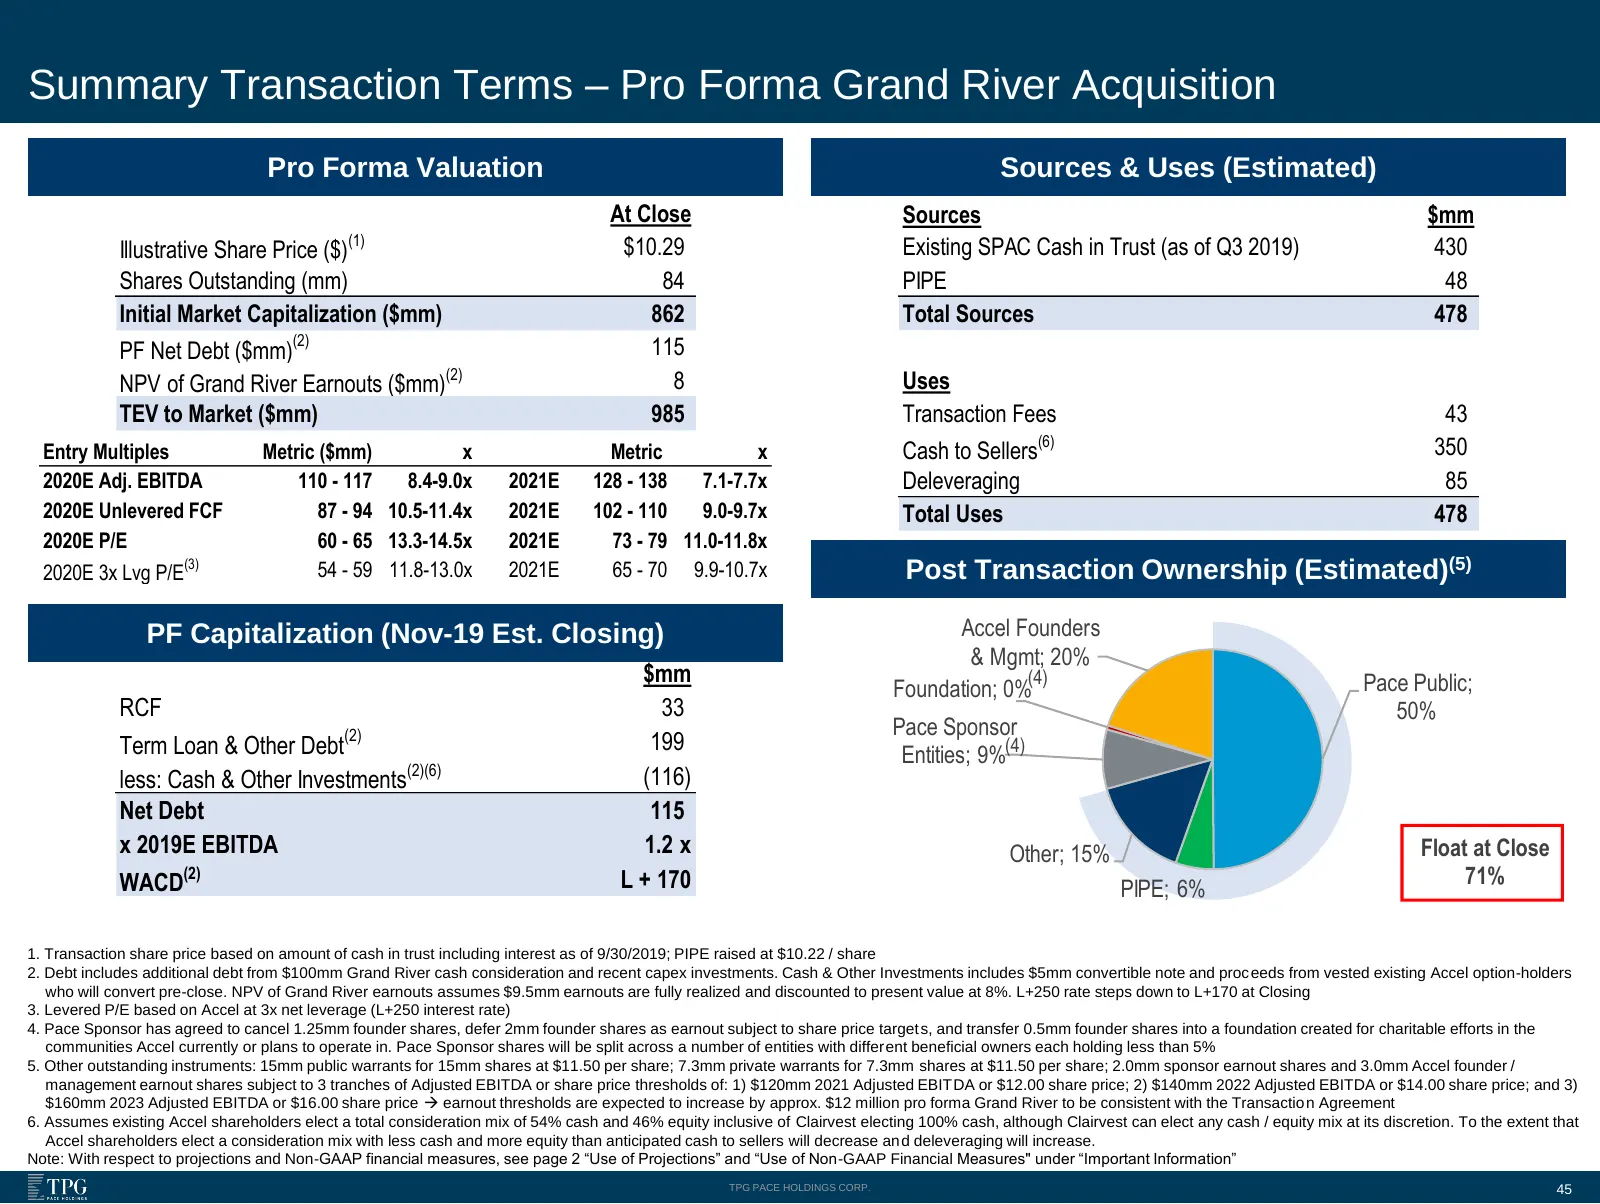
Slide 45: Summary Transaction Terms – Pro Forma Grand River Acquisition
Summary Transaction Terms – Pro Forma Grand River Acquisition Pro Forma Valuation Sources & Uses (Estimated) At Close Sources $mm (1) Illustrative Share Price ($) $10.29 Existing SPAC Cash in Trust (as of Q3 2019) 430 Shares Outstanding (mm) 84 PIPE 48 Initial Market Capitalization ($mm) 862 Total S
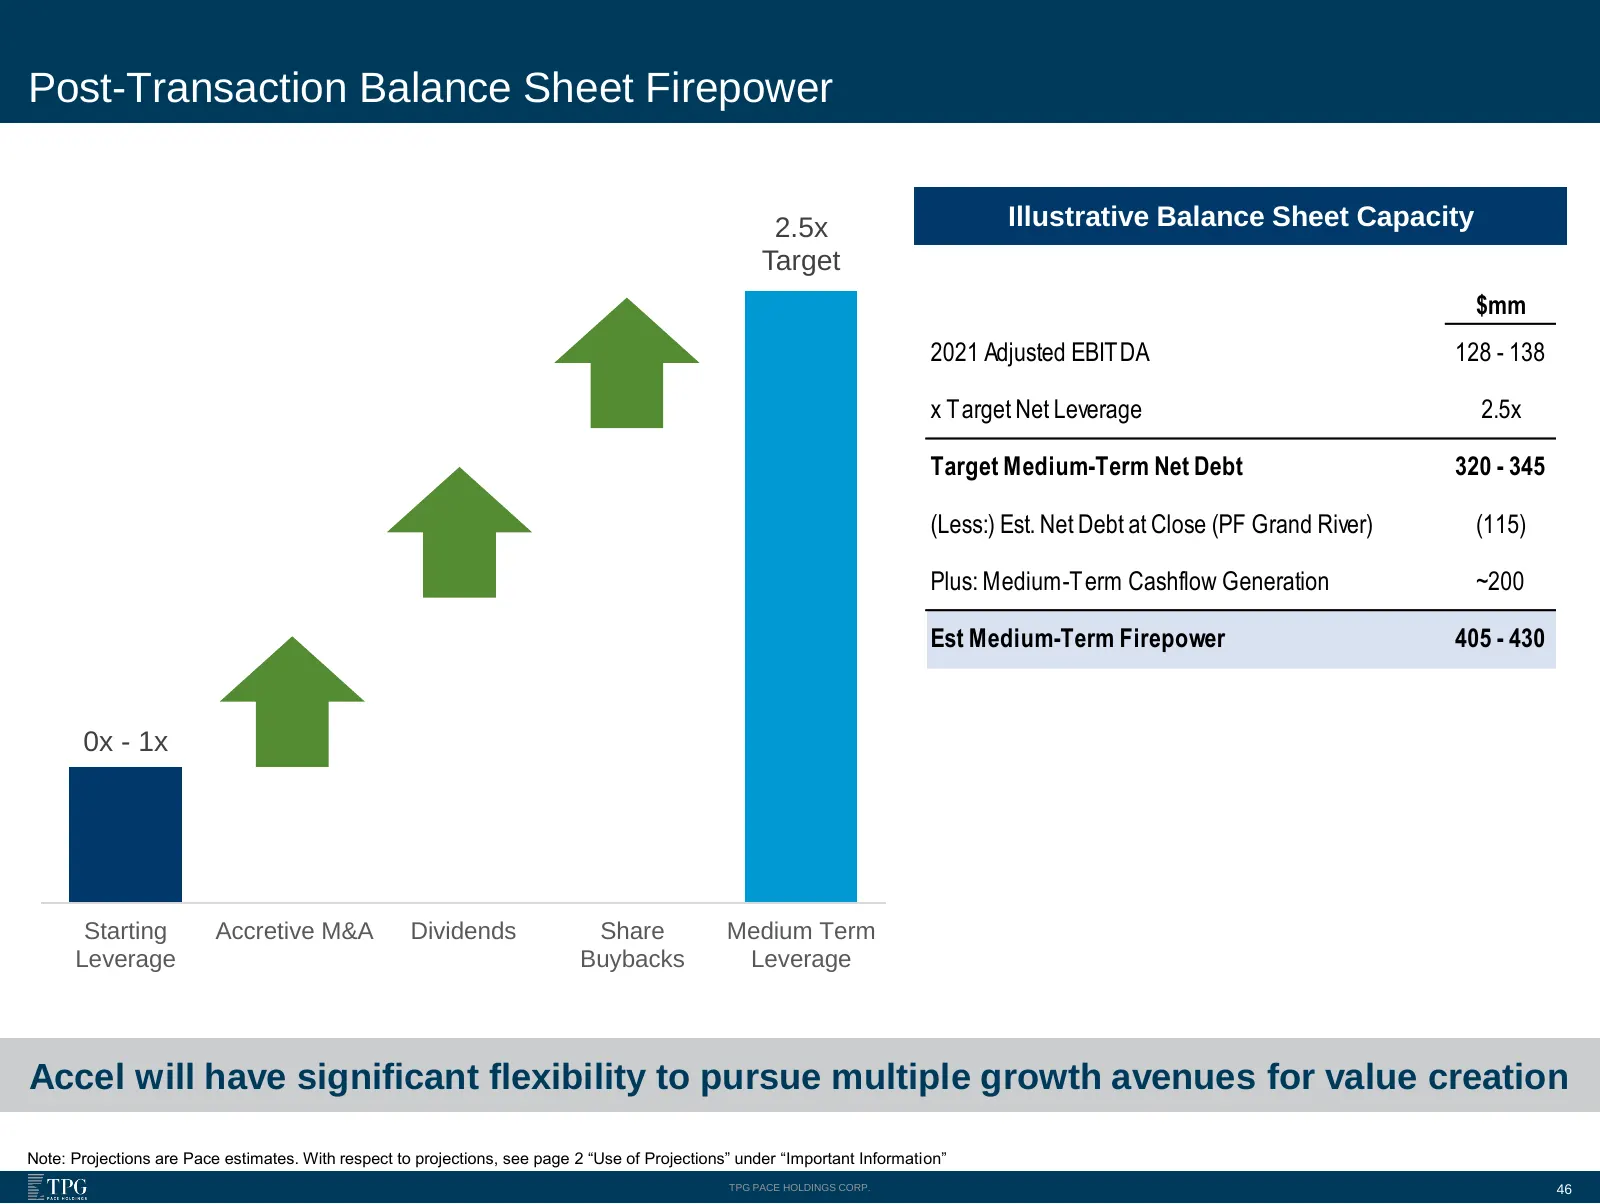
Slide 46: Post-Transaction Balance Sheet Firepower
Post-Transaction Balance Sheet Firepower 2.5x Illustrative Balance Sheet Capacity Target $mm 2021 Adjusted EBITDA 128 - 138 x Target Net Leverage 2.5x Target Medium-Term Net Debt 320 - 345 (Less:) Est. Net Debt at Close (PF Grand River) (115) Plus: Medium-Term Cashflow Generation ~200 Est Medium-Ter
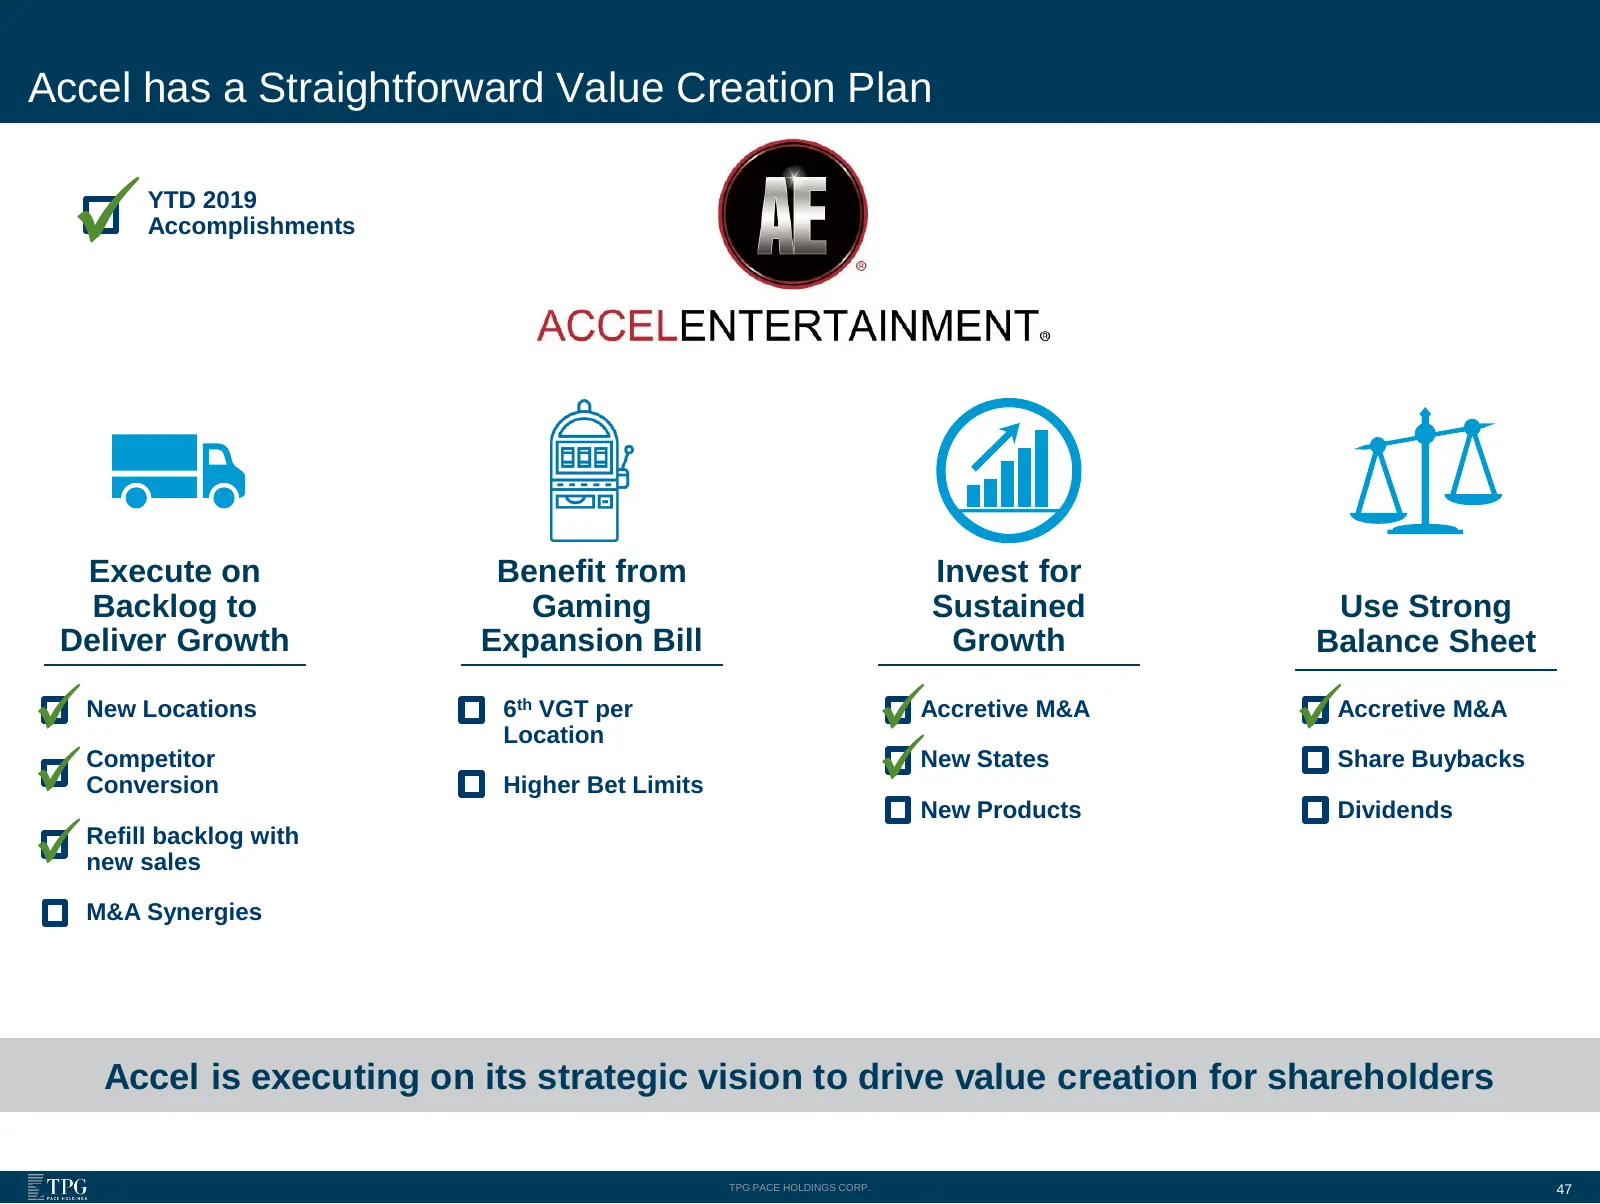
Slide 47: Accel has a Straightforward Value Creation Plan
Accel has a Straightforward Value Creation Plan YTD 2019 Accomplishments Execute on Benefit from Invest for Backlog to Gaming Sustained Use Strong Deliver Growth Expansion Bill Growth Balance Sheet New Locations 6th VGT per Accretive M&A Accretive M&A Location Competitor New States Share Buybacks Co
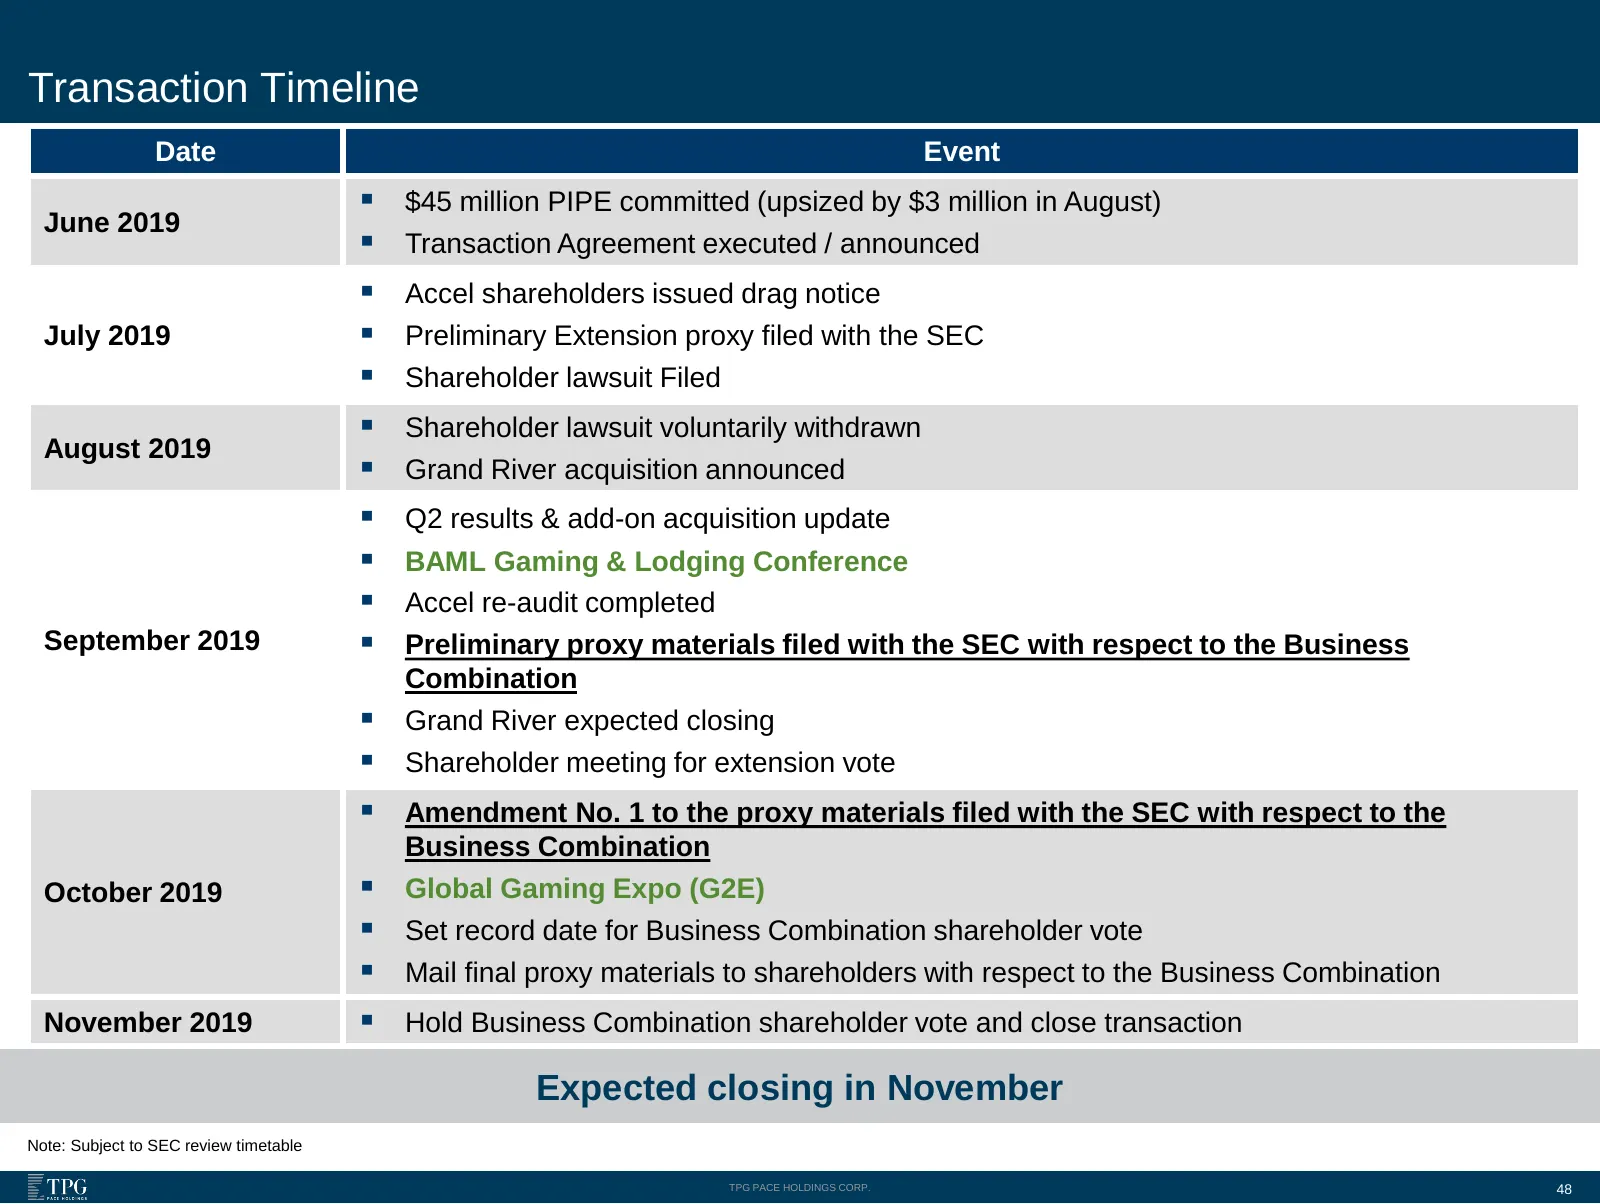
Slide 48: Transaction Timeline
Transaction Timeline Date Event ▪ $45 million PIPE committed (upsized by $3 million in August) June 2019 ▪ Transaction Agreement executed / announced ▪ Accel shareholders issued drag notice July 2019 ▪ Preliminary Extension proxy filed with the SEC ▪ Shareholder lawsuit Filed ▪ Shareholder lawsuit v

Slide 49: Appendix
Appendix TPG PACE HOLDINGS CORP.
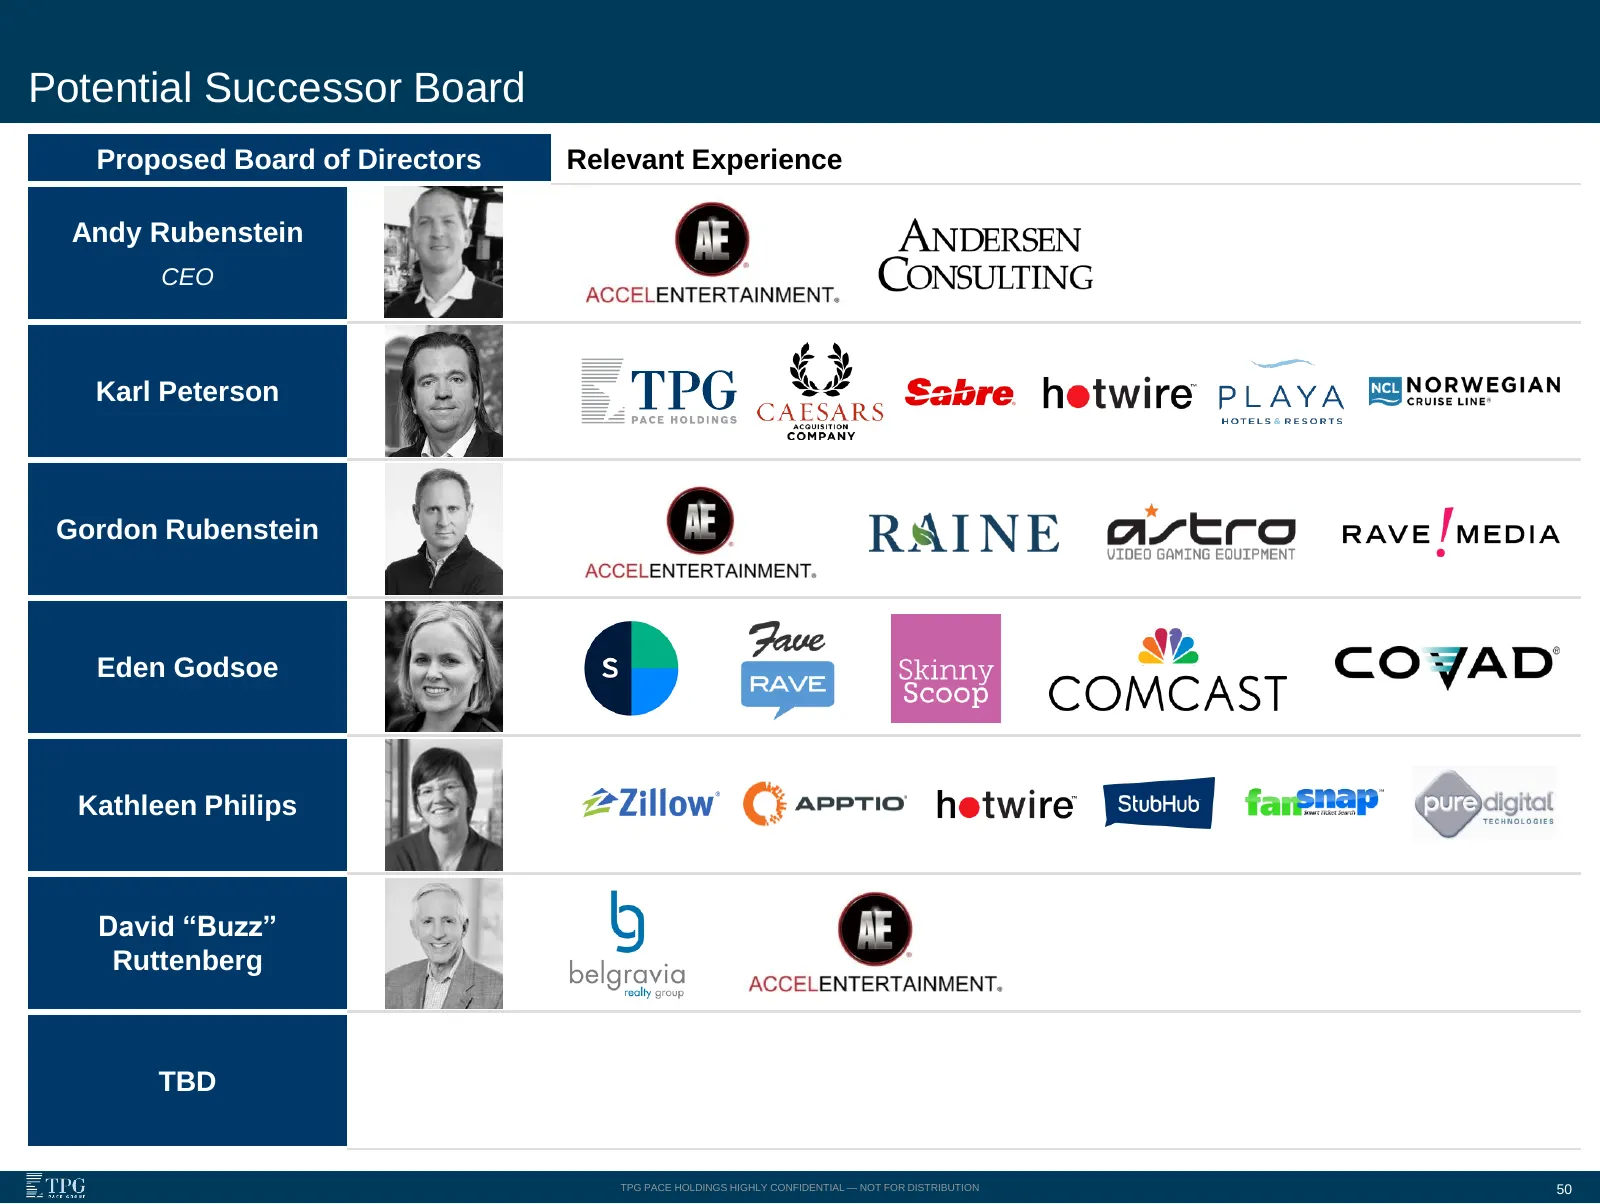
Slide 50: Potential Successor Board
Potential Successor Board Proposed Board of Directors Relevant Experience Andy Rubenstein CEO Karl Peterson Gordon Rubenstein Eden Godsoe Kathleen Philips David “Buzz” Ruttenberg TBD TPG PACE HOLDINGS HIGHLY CONFIDENTIAL — NOT FOR DISTRIBUTION 50
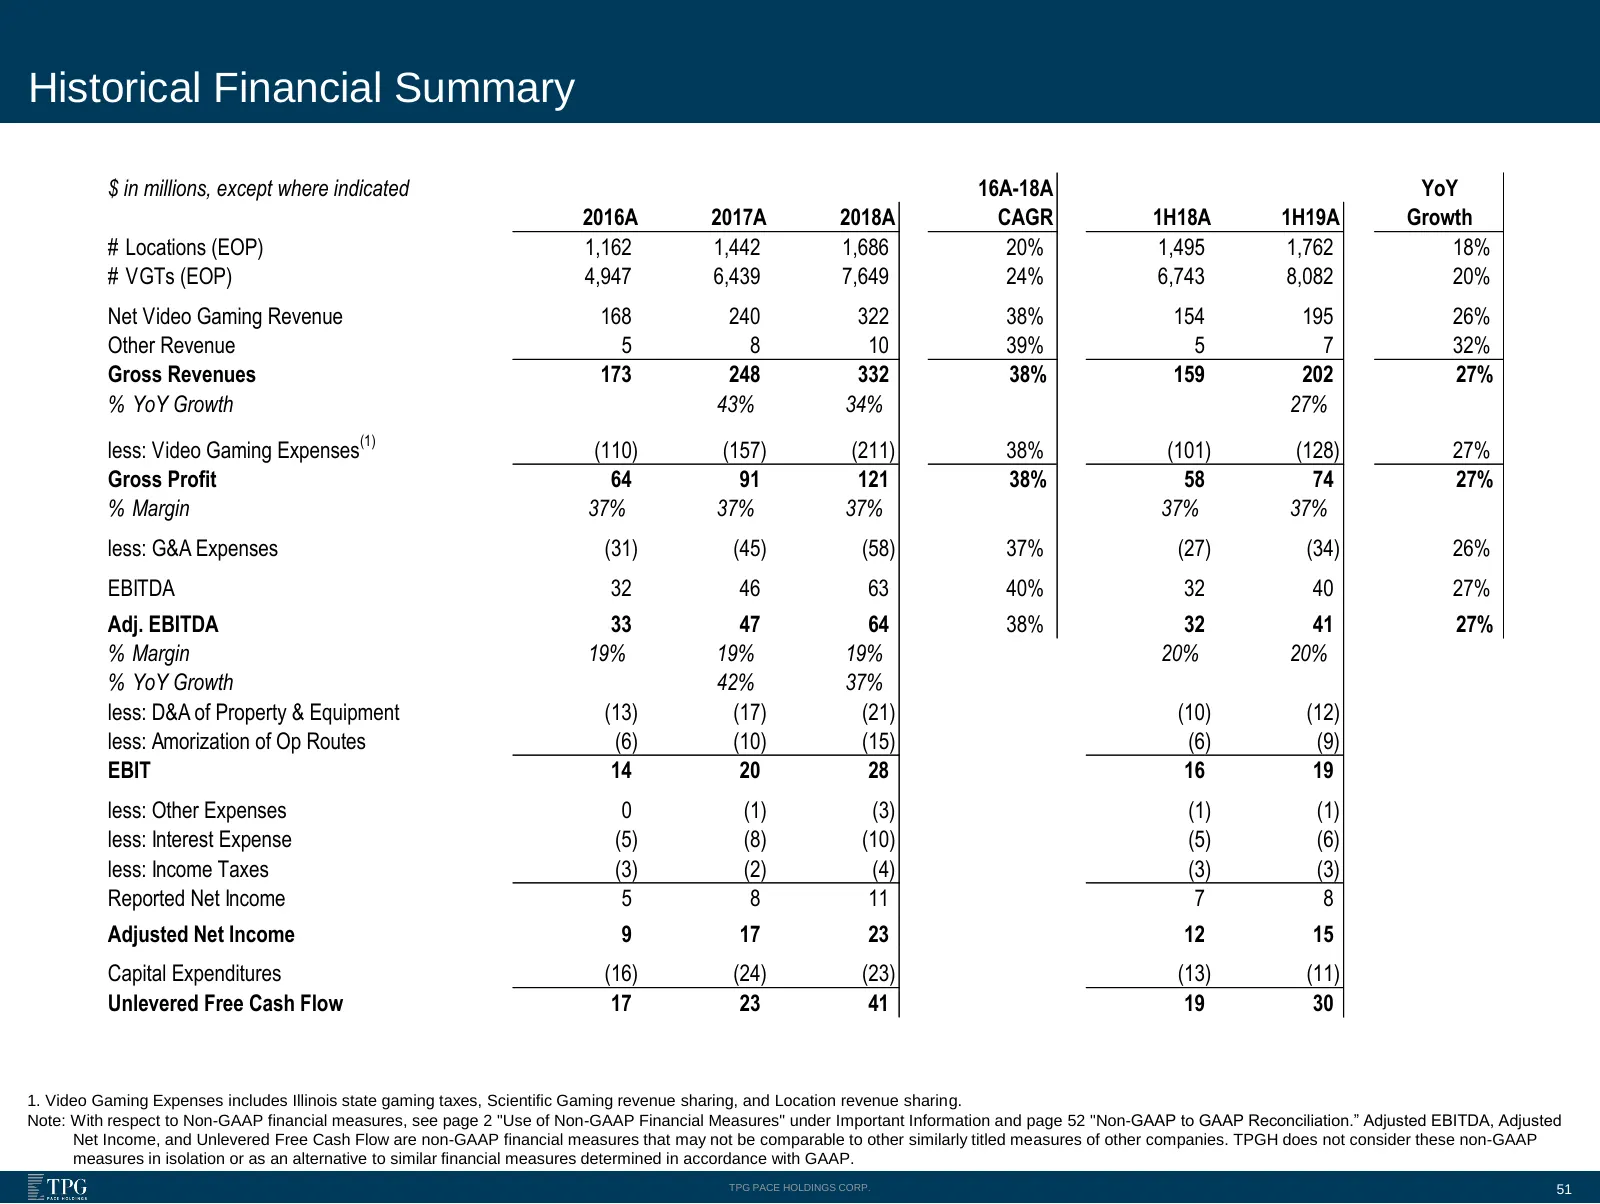
Slide 51: Historical Financial Summary
Historical Financial Summary $ in millions, except where indicated 16A-18A YoY 2016A 2017A 2018A CAGR 1H18A 1H19A Growth # Locations (EOP) 1,162 1,442 1,686 20% 1,495 1,762 18% # VGTs (EOP) 4,947 6,439 7,649 24% 6,743 8,082 20% Net Video Gaming Revenue 168 240 322 38% 154 195 26% Other Revenue 5 8 1
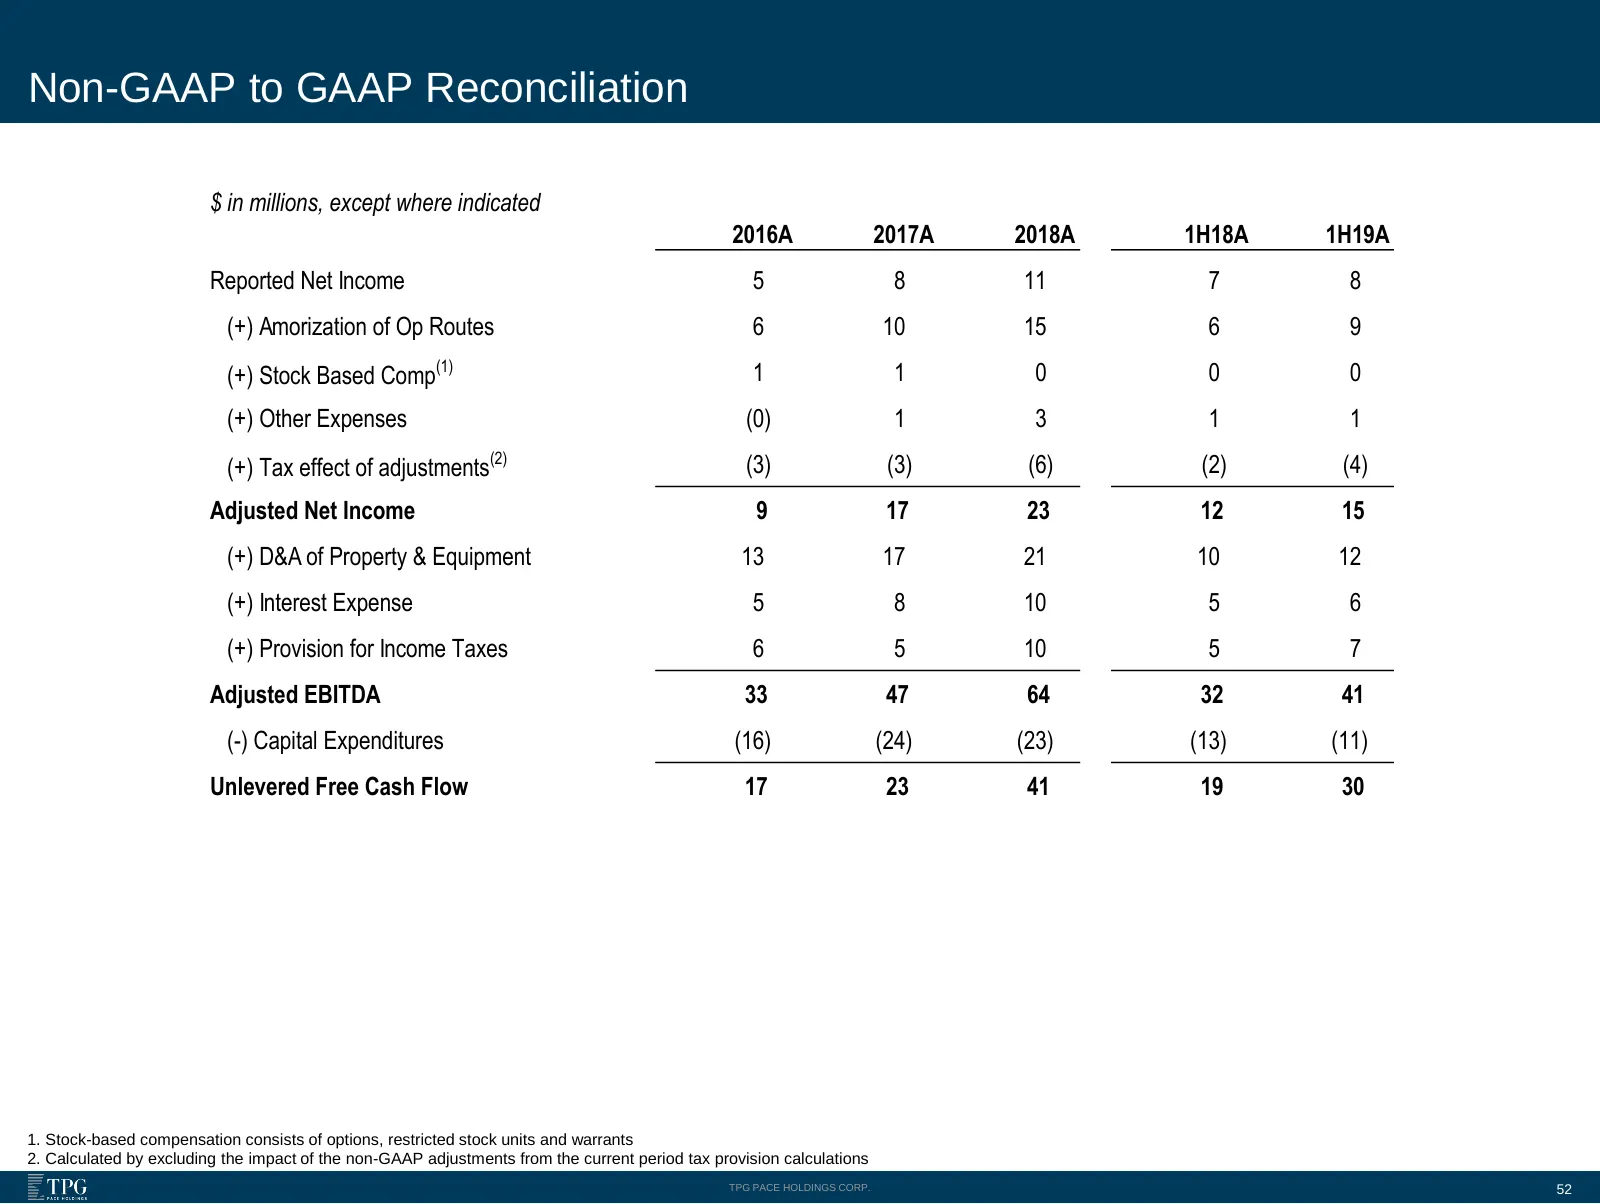
Slide 52: Non-GAAP to GAAP Reconciliation
Non-GAAP to GAAP Reconciliation $ in millions, except where indicated 2016A 2017A 2018A 1H18A 1H19A Reported Net Income 5 8 11 7 8 (+) Amorization of Op Routes 6 10 15 6 9 (+) Stock Based Comp(1) 1 1 0 0 0 (+) Other Expenses (0) 1 3 1 1 (+) Tax effect of adjustments(2) (3) (3) (6) (2) (4) Adjusted N
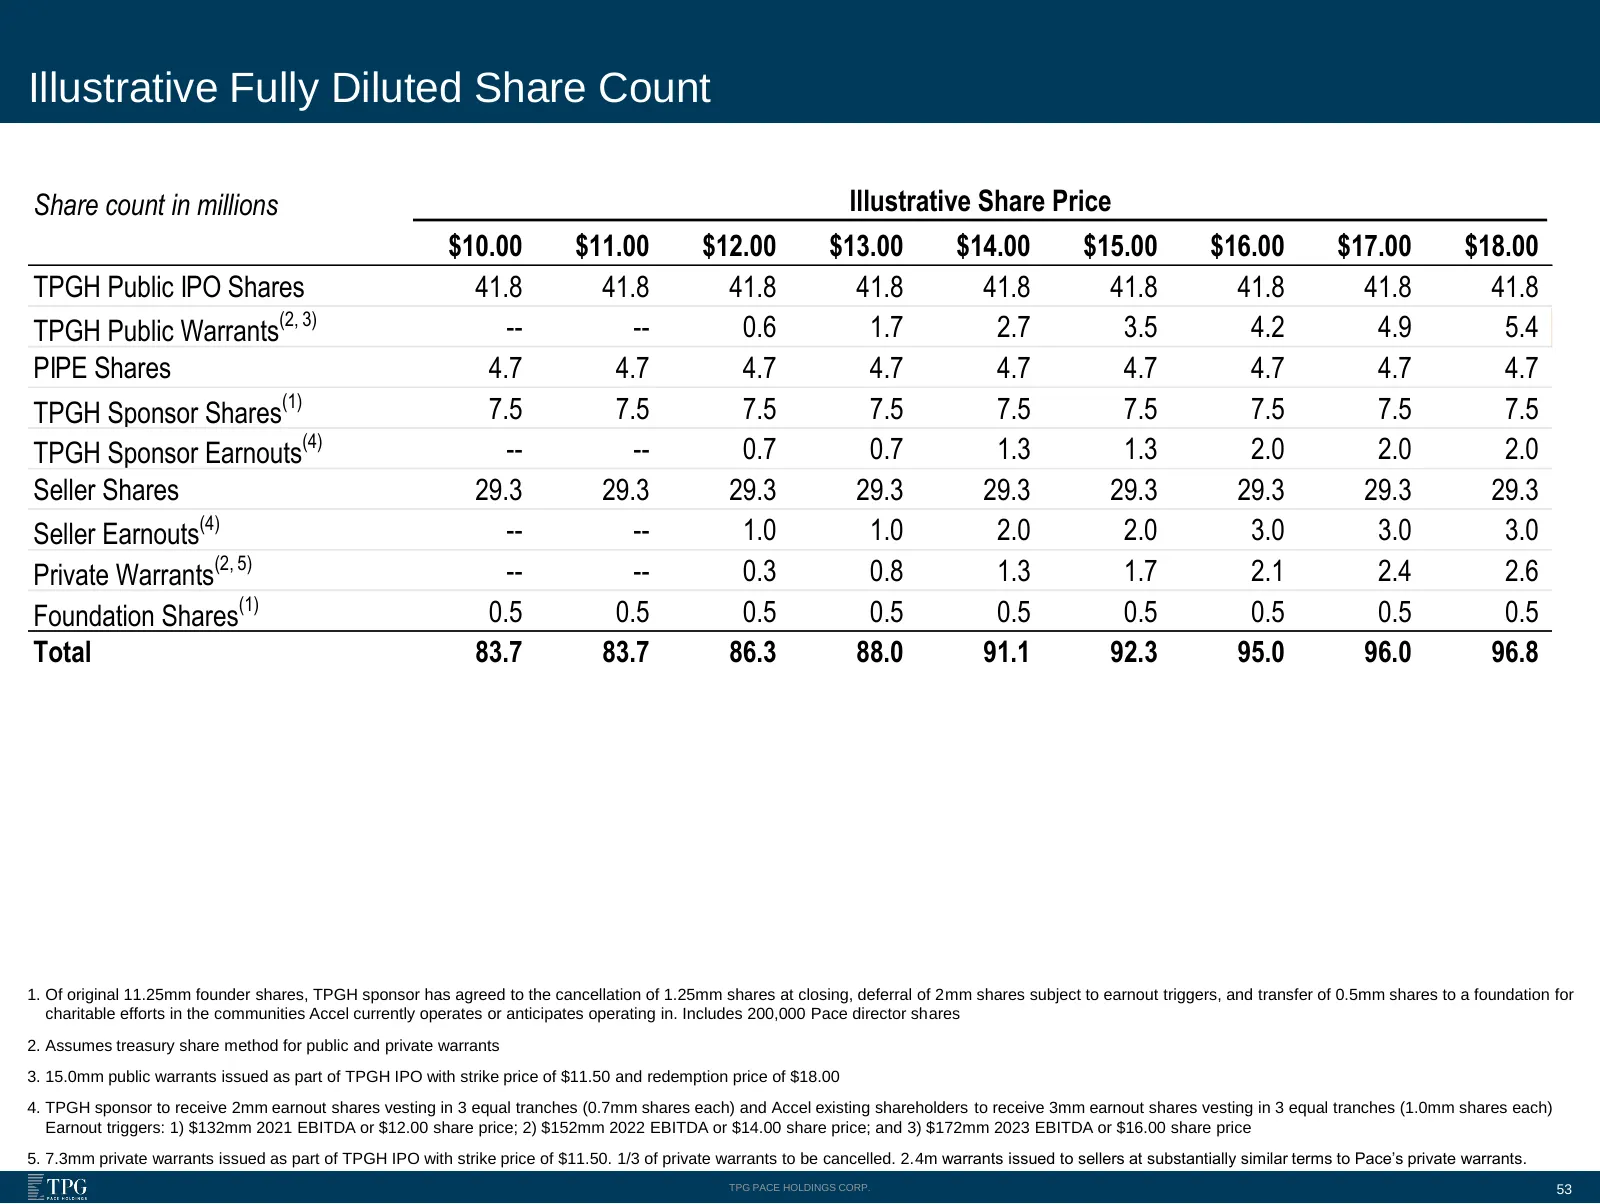
Slide 53: Illustrative Fully Diluted Share Count
Illustrative Fully Diluted Share Count Share count in millions Illustrative Share Price $10.00 $11.00 $12.00 $13.00 $14.00 $15.00 $16.00 $17.00 $18.00 TPGH Public IPO Shares 41.8 41.8 41.8 41.8 41.8 41.8 41.8 41.8 41.8 TPGH Public Warrants(2, 3) -- -- 0.6 1.7 2.7 3.5 4.2 4.9 5.4 PIPE Shares 4.7 4.7
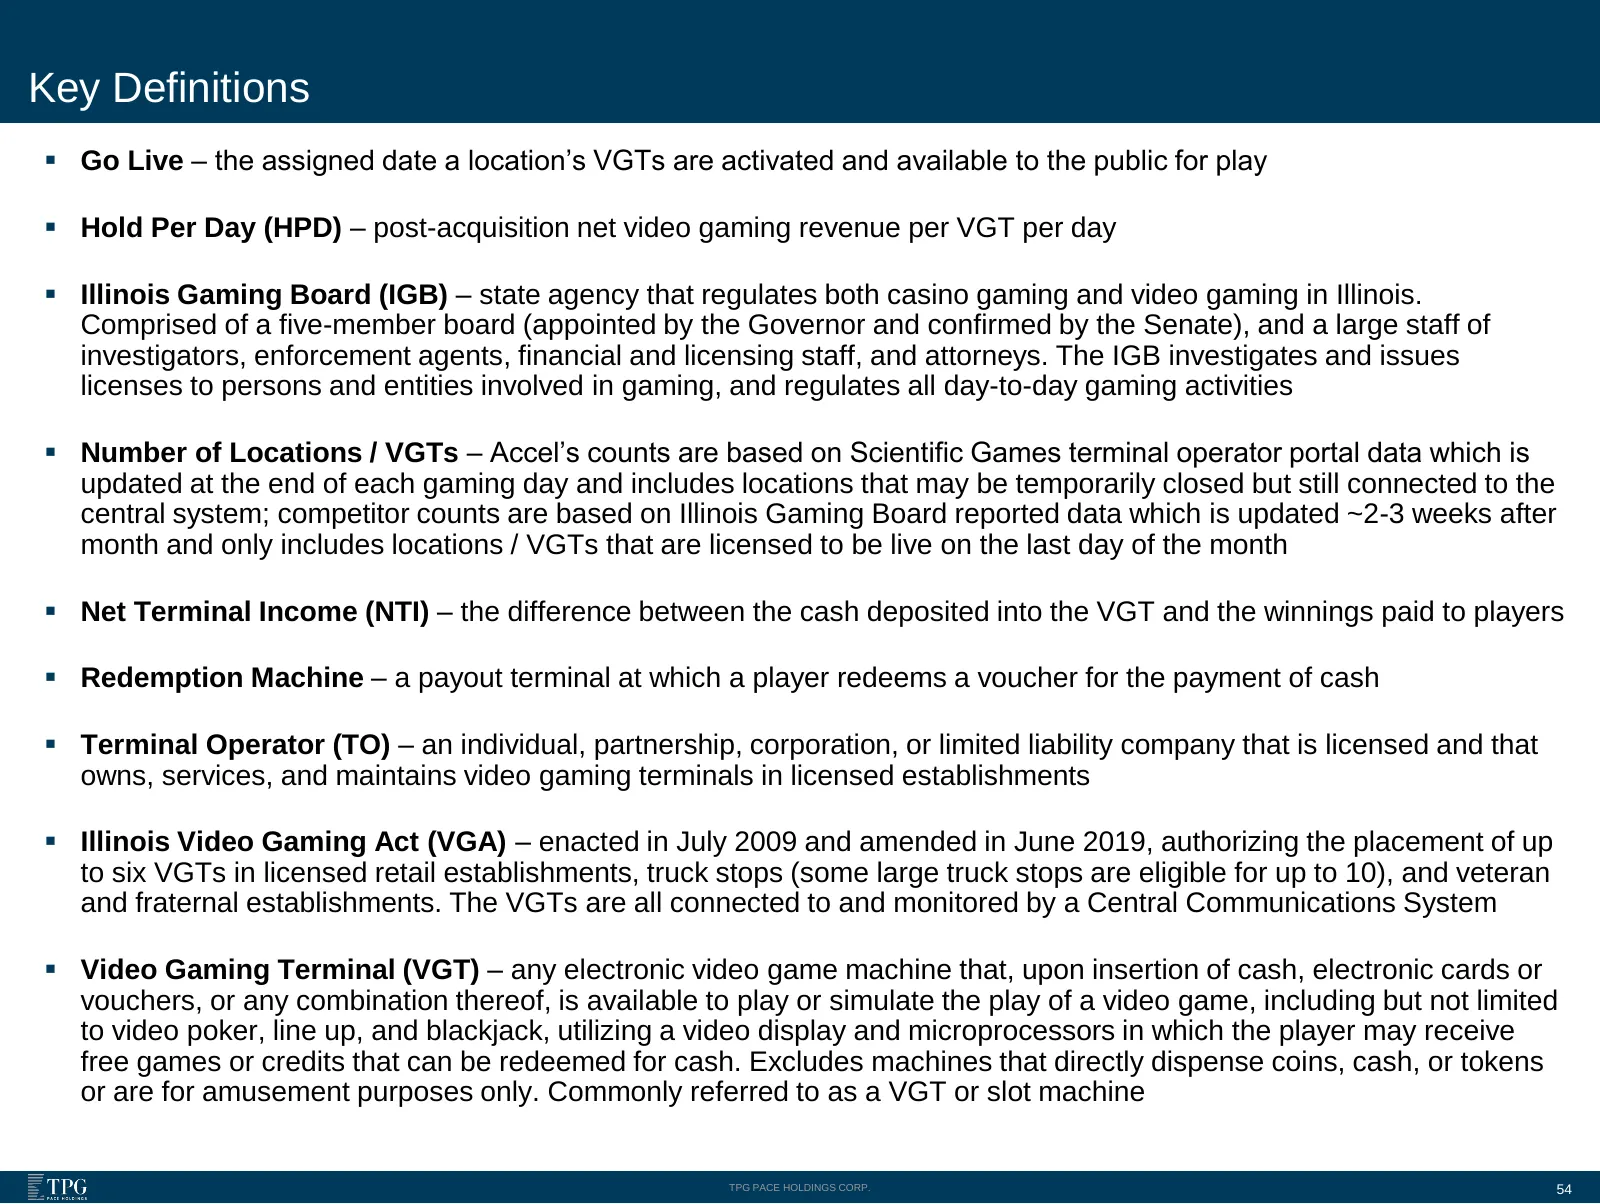
Slide 54: Key Definitions
Key Definitions ▪ Go Live – the assigned date a location’s VGTs are activated and available to the public for play ▪ Hold Per Day (HPD) – post-acquisition net video gaming revenue per VGT per day ▪ Illinois Gaming Board (IGB) – state agency that regulates both casino gaming and video gaming in Illin
Source: Internet Archive copy of tpg.com
More decks from Accel Entertainment, Inc.
 Q3 2026 Earnings Presentation45 slides · Nov 3, 2026
 Q2 2026 Earnings Presentation36 slides · Aug 4, 2026
 Q1 2026 Earnings Presentation37 slides · May 5, 2026
 Q4 2025 Earnings Presentation37 slides · Mar 3, 2026
 Q3 2025 Earnings Presentation18 slides · Nov 4, 2025
 Q2 2025 Earnings Presentation18 slides · Aug 5, 2025