Computershare Limited · ASX:CPU
Computershare — Shareholder Meeting (November 2017)
21 slides from Computershare's shareholder meeting presentation, Nov 14, 2017
Slide 1: 2017 Annual General Meeting: Delivering sustained earnings growth
2017 ANNUAL GENERAL MEETING Delivering sustained earnings growth 14 November 2017

Slide 2: Chairman's address
2017 ANNUAL GENERAL MEETING Chairman’s address Simon Jones 14 November 2017
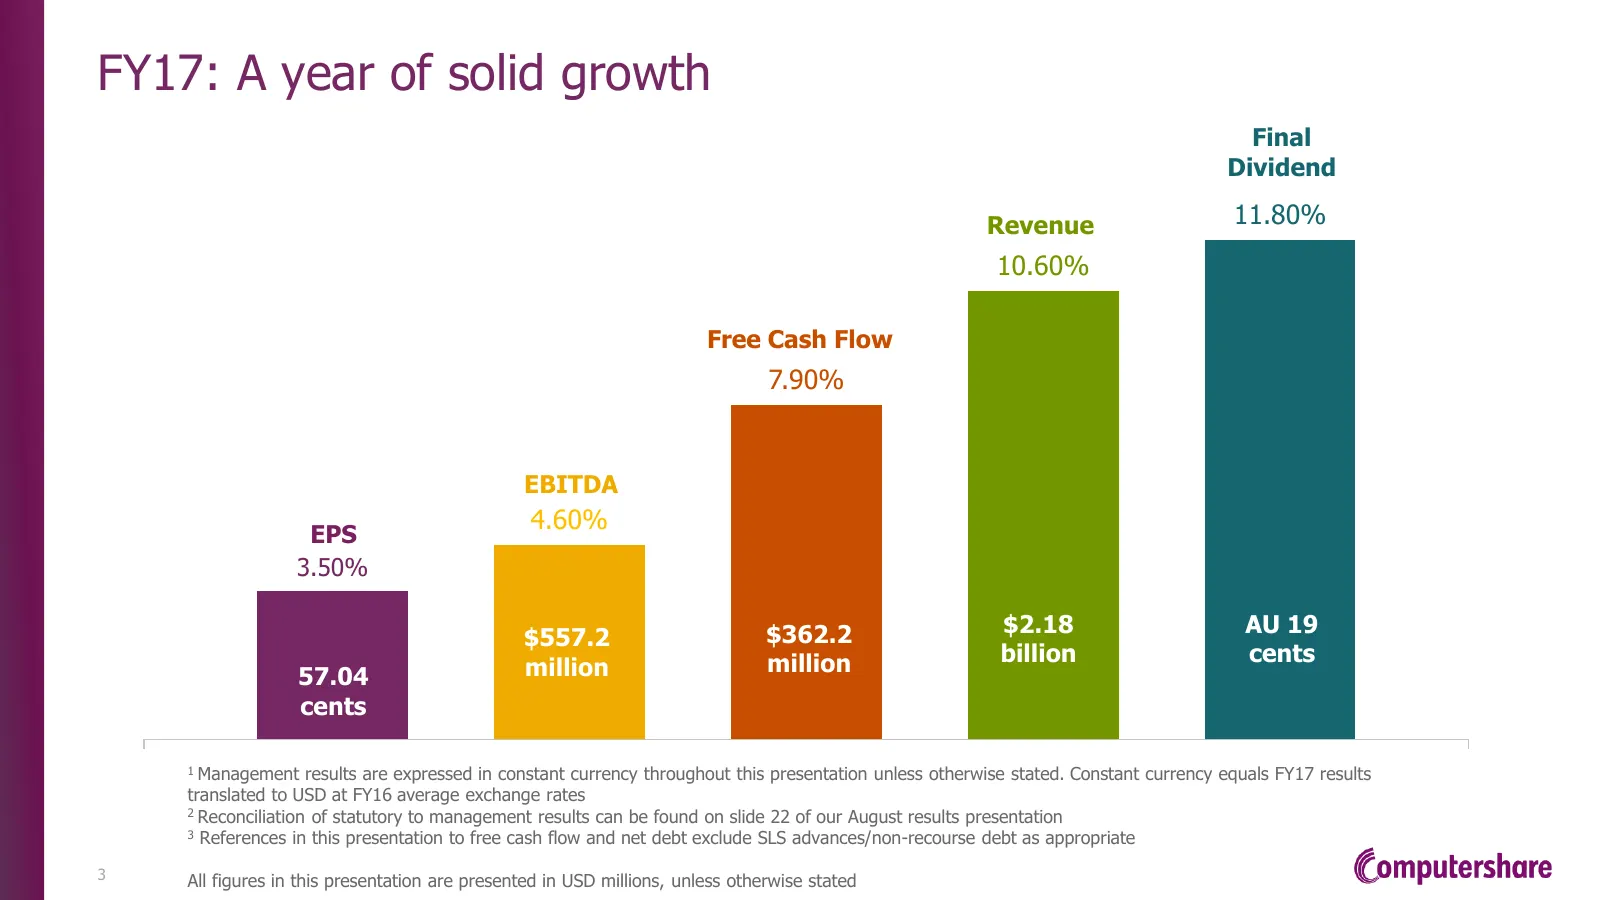
Slide 3: FY17: A year of solid growth
FY17: A year of solid growth Final Dividend Revenue 11.80% 10.60% Free Cash Flow 7.90% EBITDA 4.60% EPS 3.50% $362.2 $2.18 AU 19 $557.2 million billion cents 57.04 million cents 1 Management results are expressed in constant currency throughout this presentation unless otherwise stated. Constant cur
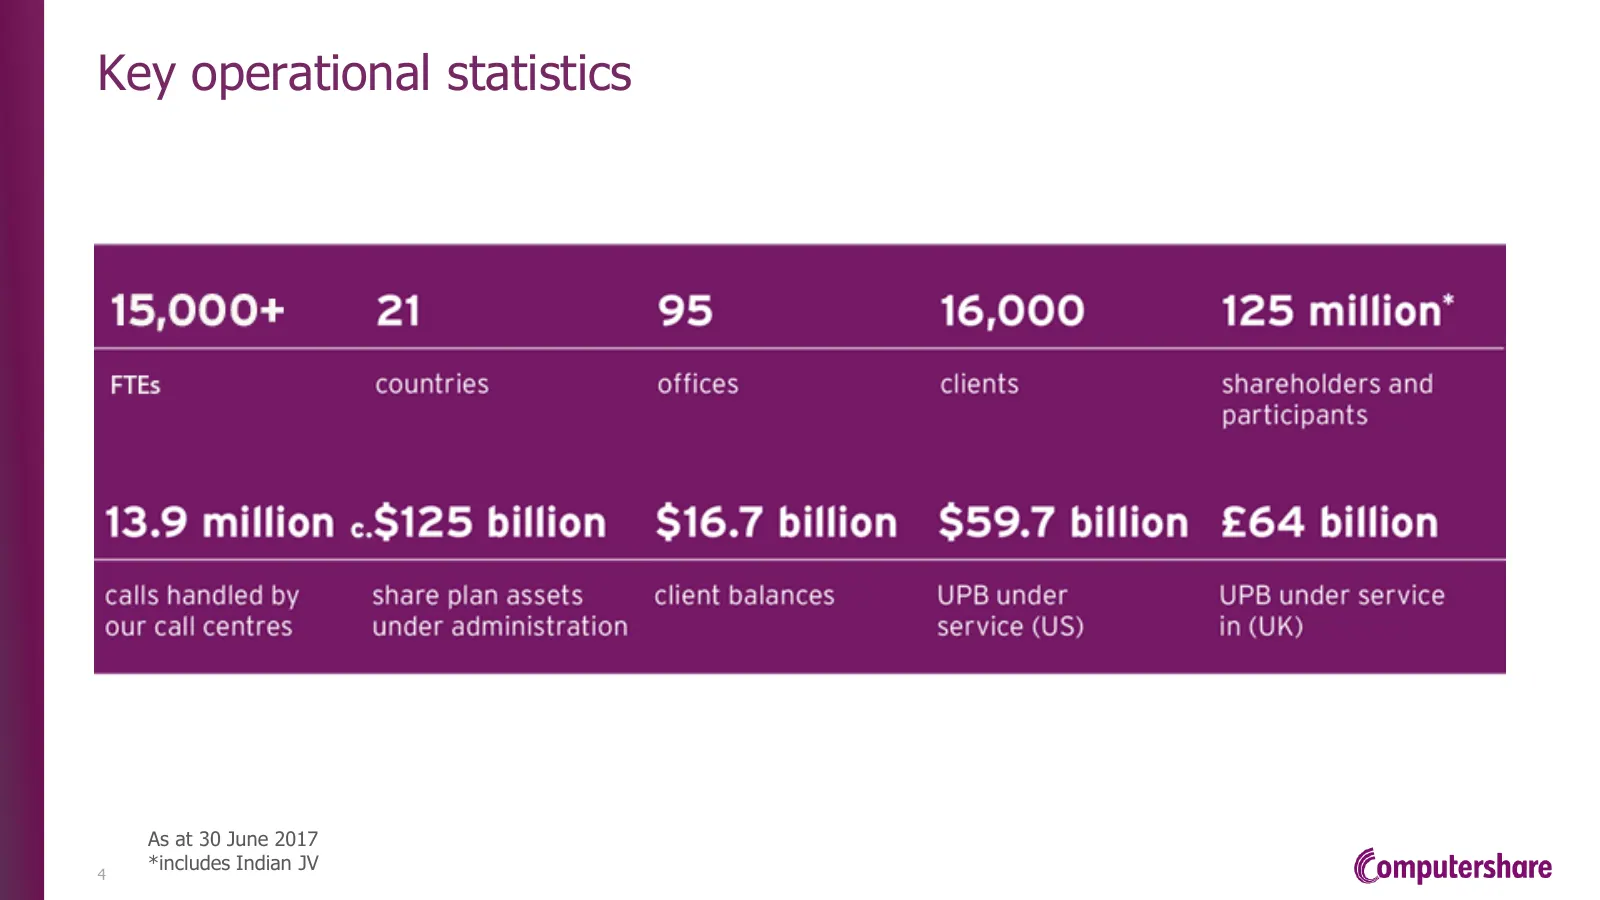
Slide 4: Key operational statistics
Key operational statistics As at 30 June 2017 4 *includes Indian JV
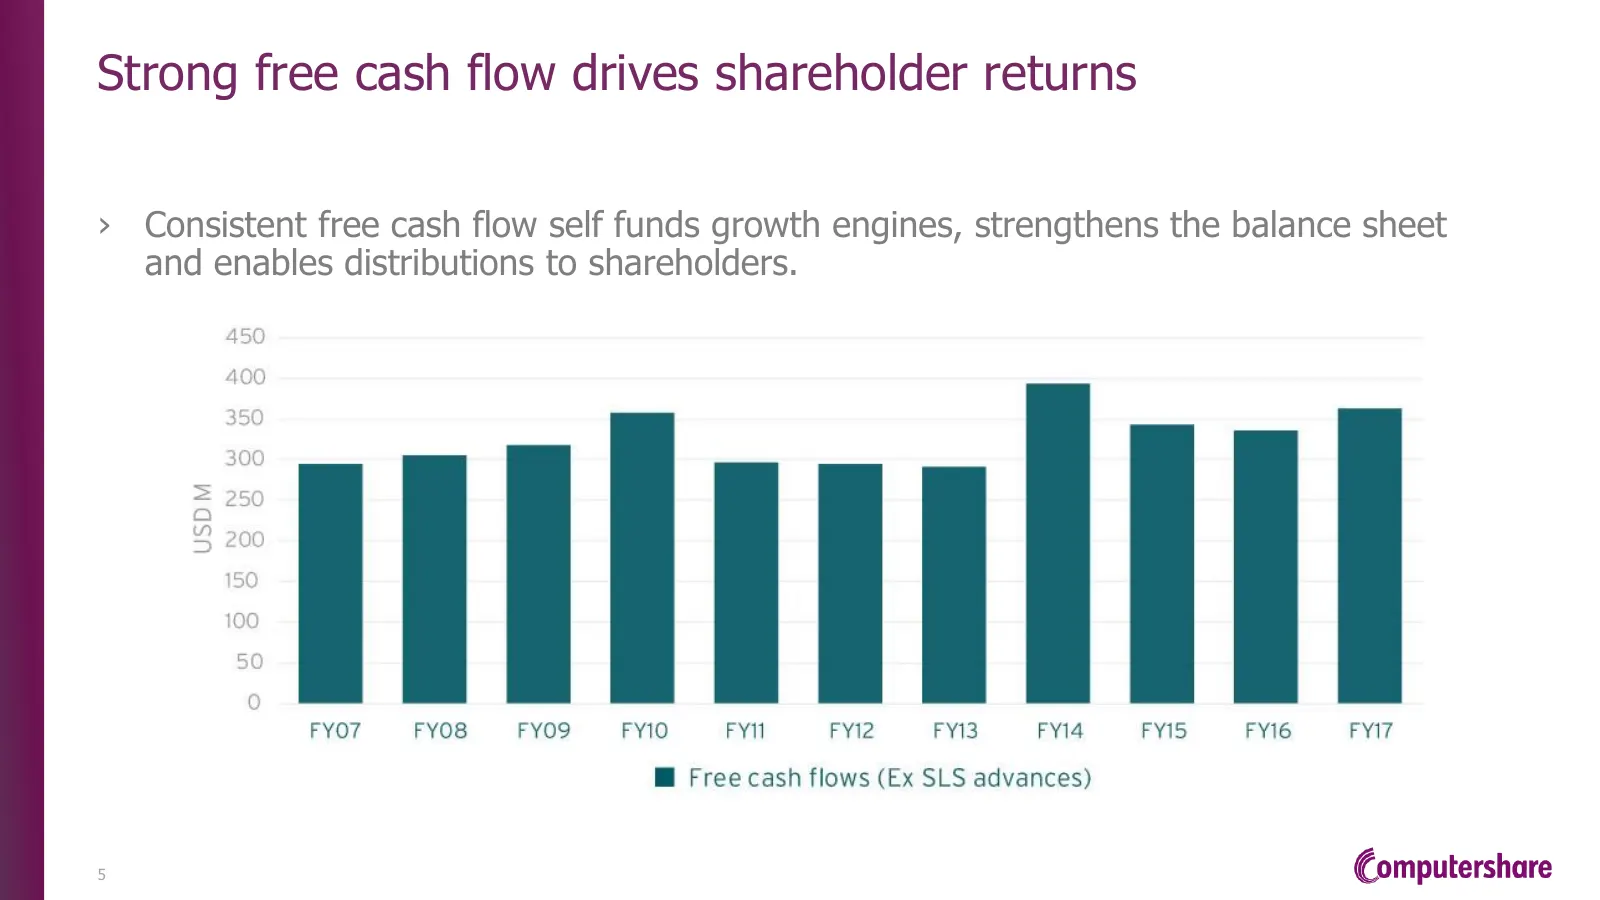
Slide 5: Strong free cash flow drives shareholder returns
Strong free cash flow drives shareholder returns › Consistent free cash flow self funds growth engines, strengthens the balance sheet and enables distributions to shareholders. 5
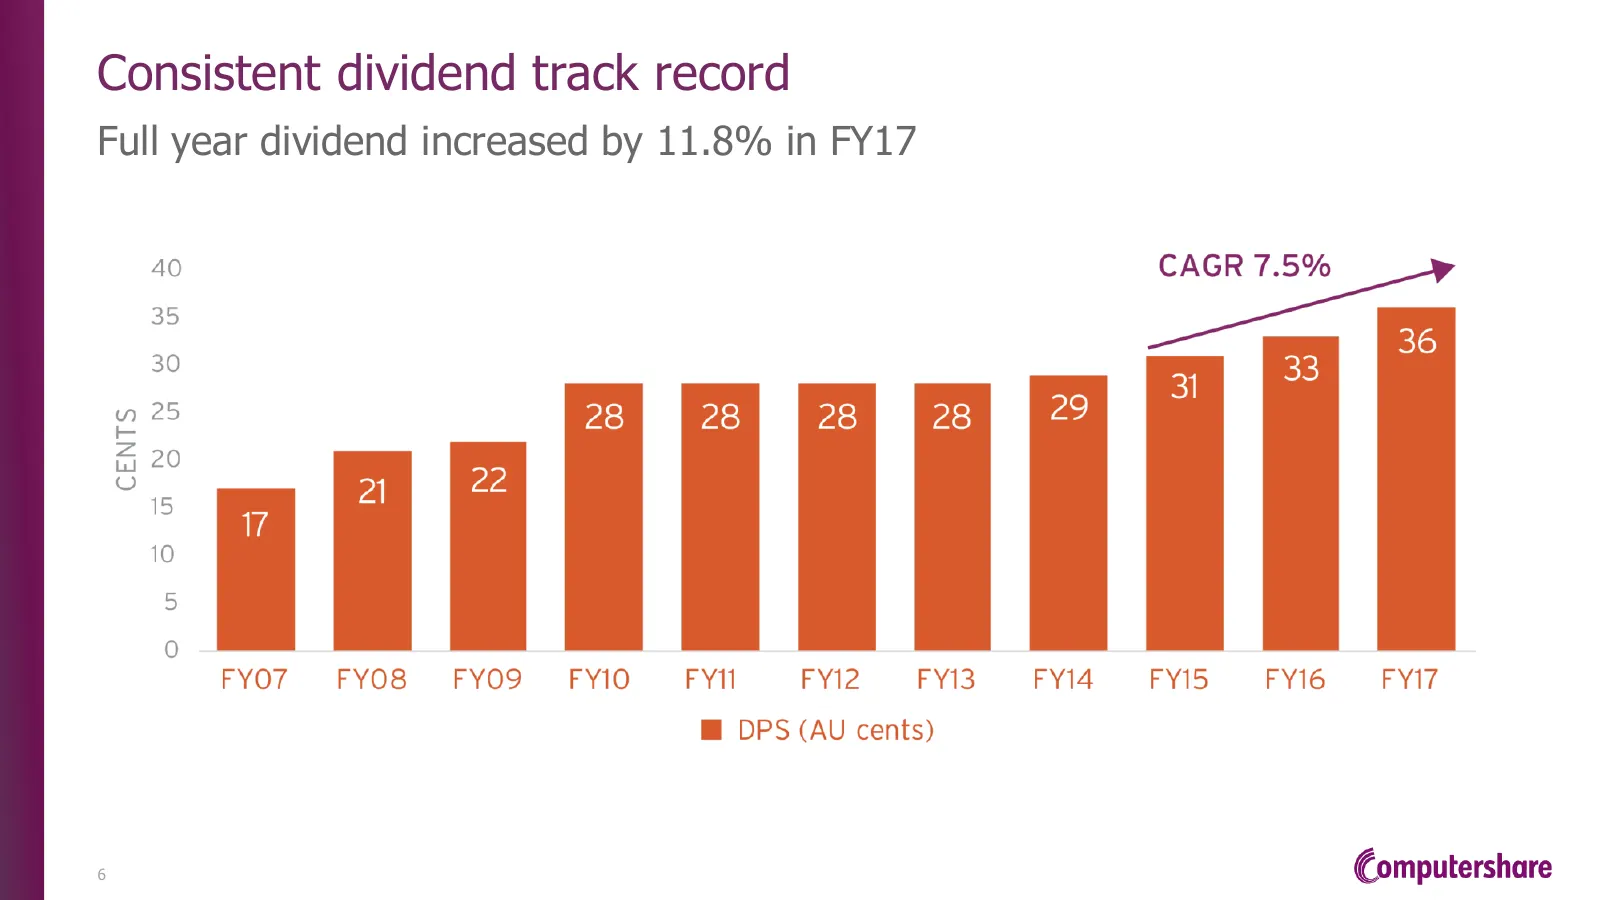
Slide 6: Consistent dividend track record
Consistent dividend track record Full year dividend increased by 11.8% in FY17 6
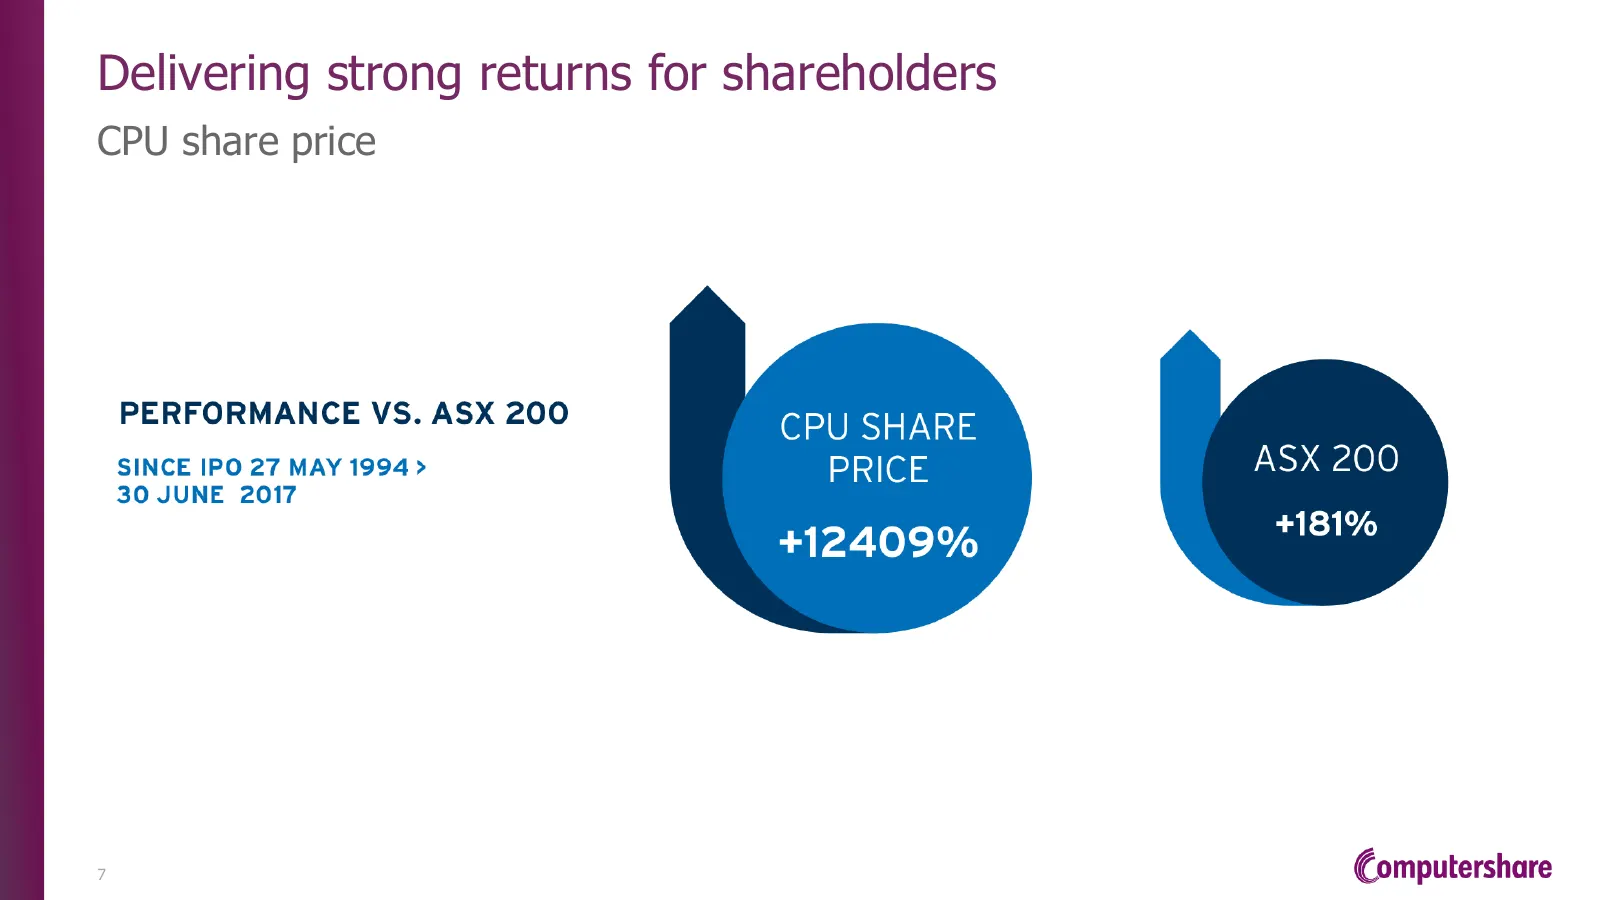
Slide 7: Delivering strong returns for shareholders
Delivering strong returns for shareholders CPU share price 7
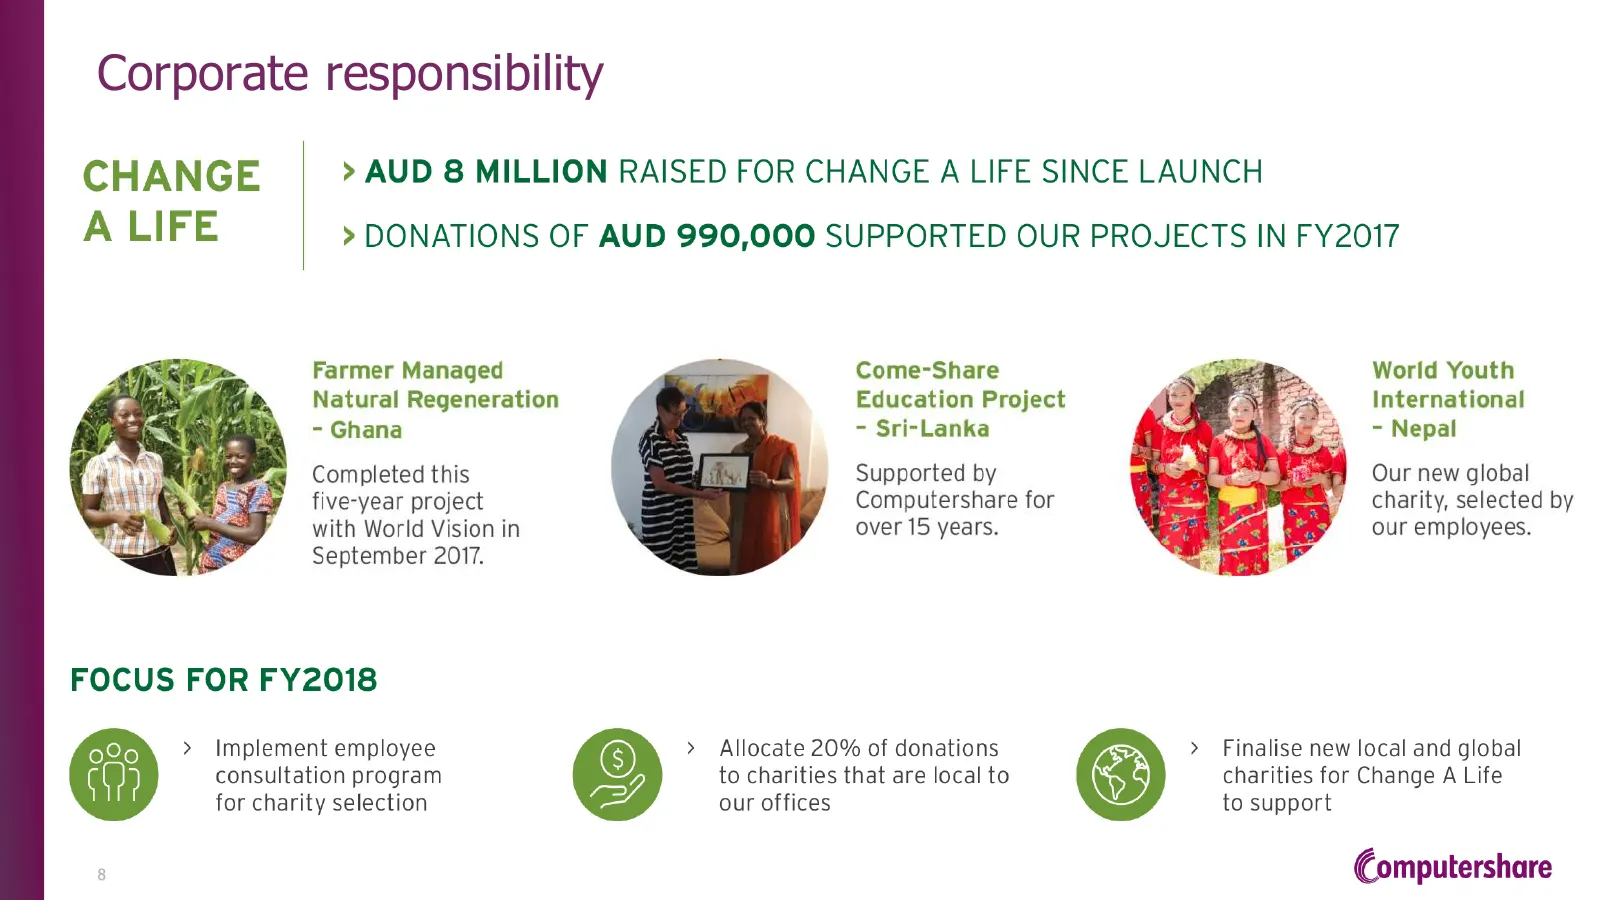
Slide 8: Corporate responsibility
Corporate responsibility CHANGE _ > AUD 8 MILLION RAISED FOR CHANGE A LIFE SINCE LAUNCH A LIFE > DONATIONS OF AUD 990,000 SUPPORTED OUR PROJECTS IN FY2017 Farmer Managed Come-Share World Youth Natural Regeneration Education Project International - Ghana - Sri-Lanka - Nepal Supported by Computershare
Slide 9: CEO's address
2017 ANNUAL GENERAL MEETING CEO’s address Stuart Irving 14 November 2017
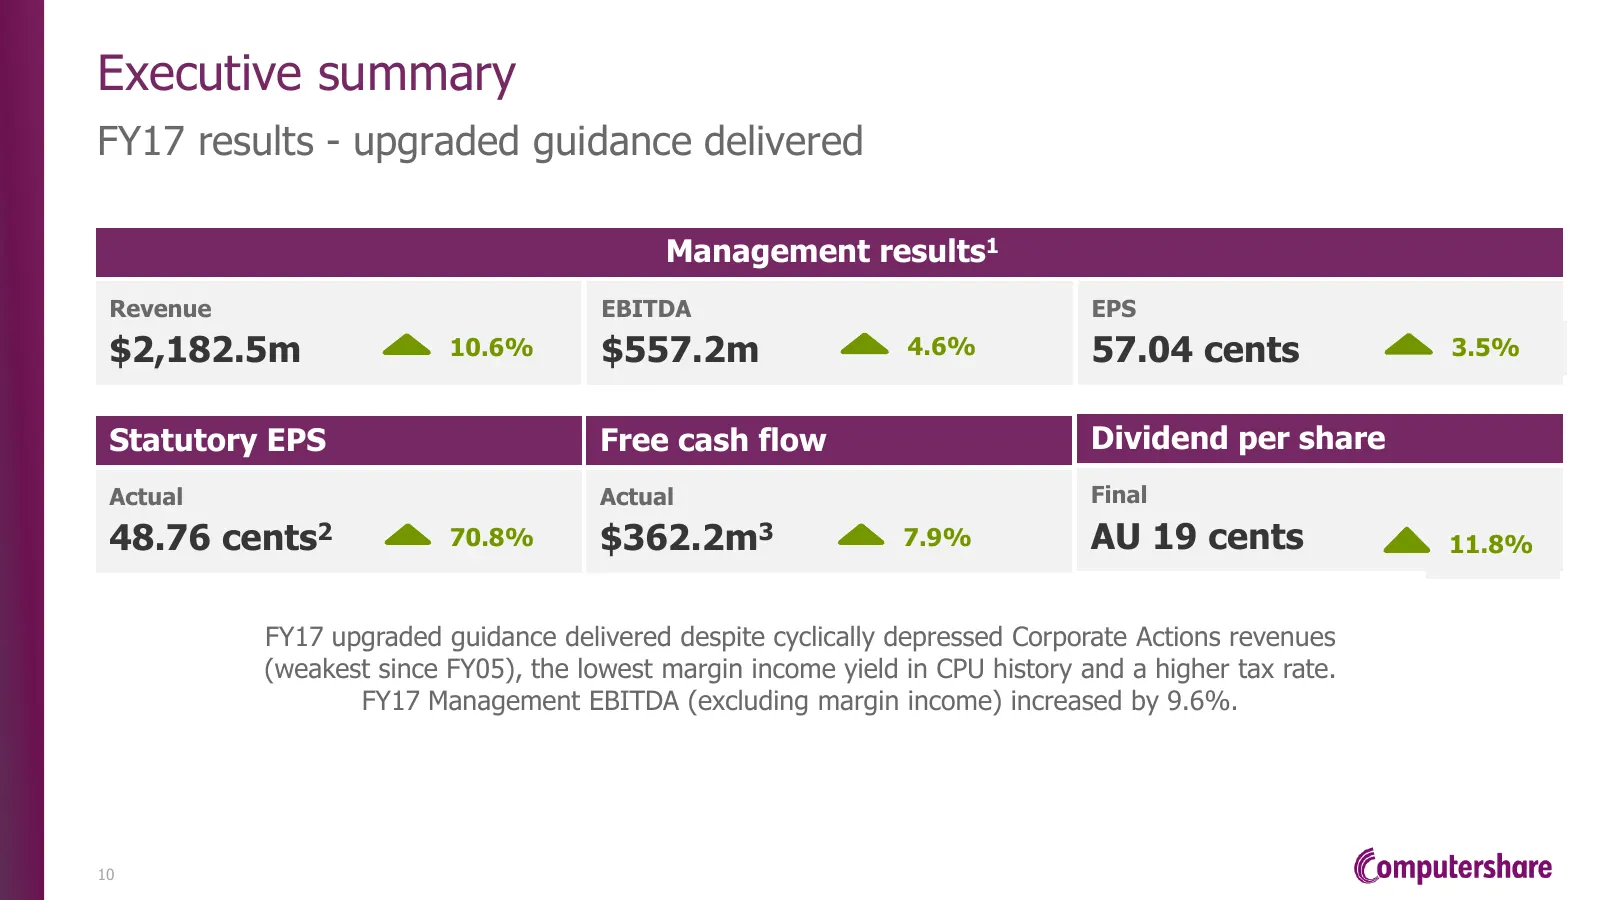
Slide 10: Executive summary
Executive summary FY17 results - upgraded guidance delivered Management results1 Revenue EBITDA EPS $2,182.5m 10.6% $557.2m 4.6% 57.04 cents 3.5% Statutory EPS Free cash flow Dividend per share Actual Actual Final 48.76 cents2 70.8% $362.2m3 7.9% AU 19 cents 11.8% FY17 upgraded guidance delivered de
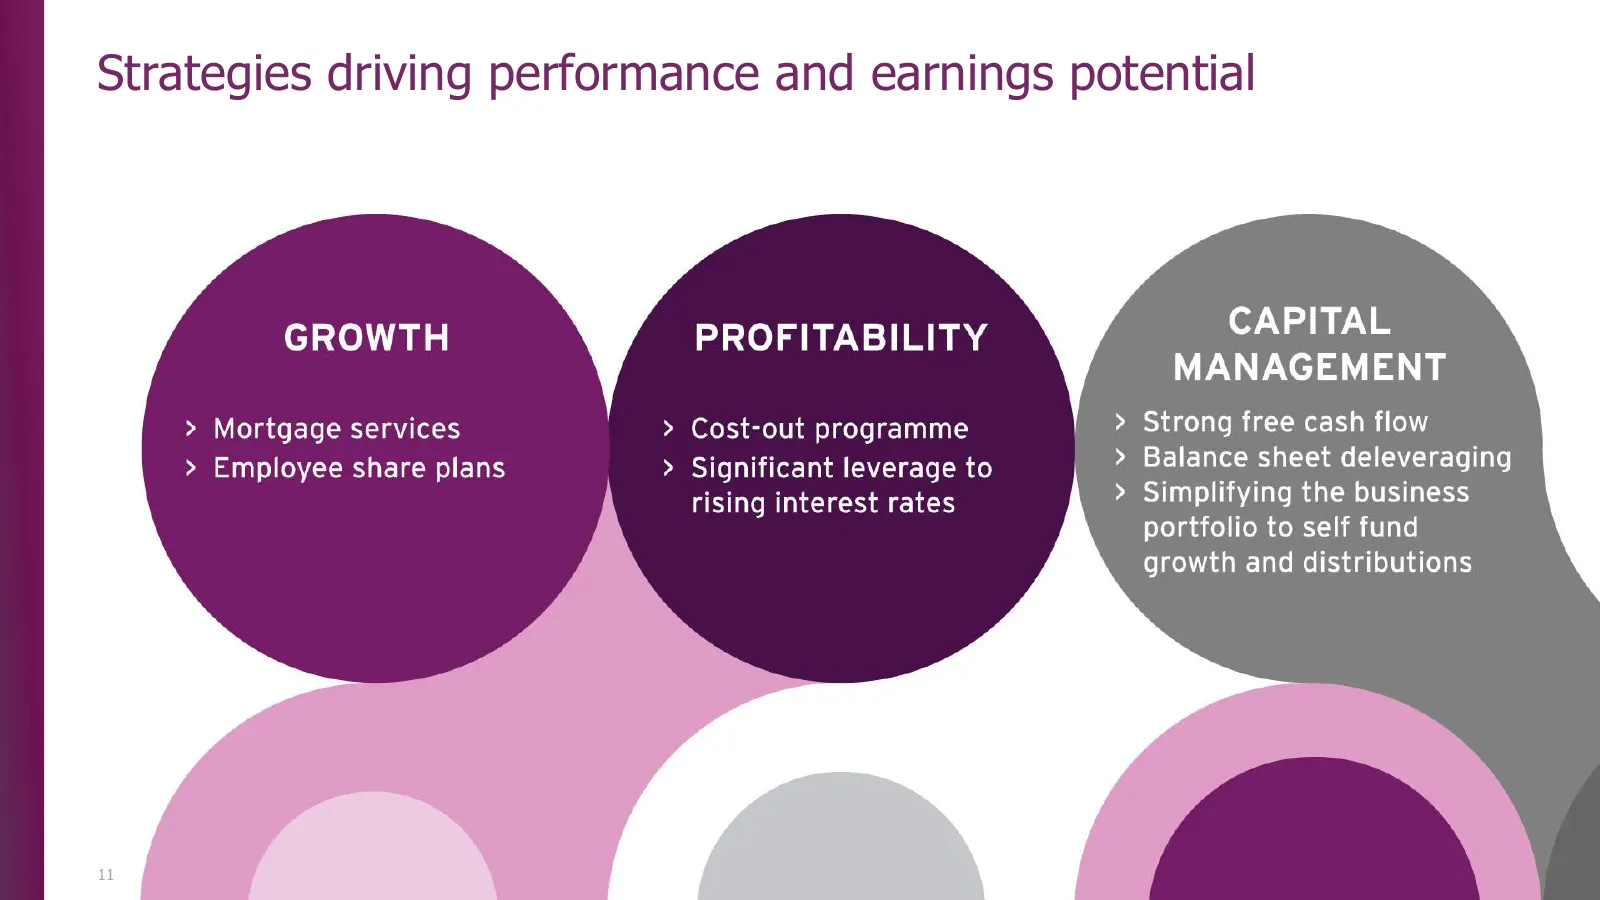
Slide 11: Strategies driving performance and earnings potential
Strategies driving performance and earnings potential 11
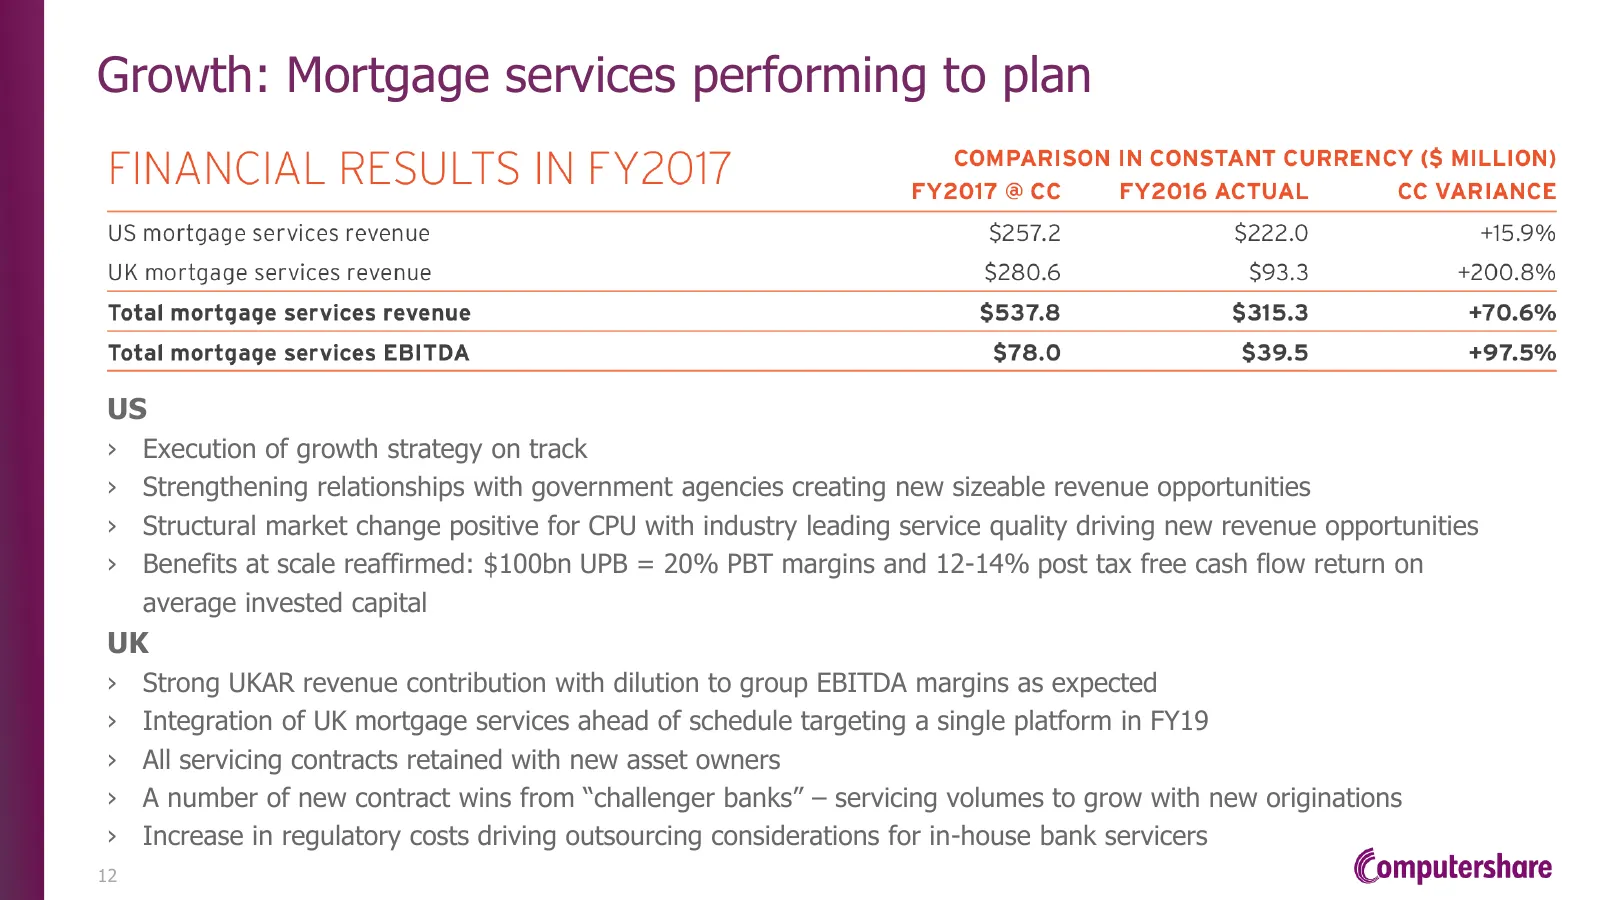
Slide 12: Growth: Mortgage services performing to plan
Growth: Mortgage services performing to plan US › Execution of growth strategy on track › Strengthening relationships with government agencies creating new sizeable revenue opportunities › Structural market change positive for CPU with industry leading service quality driving new revenue opportuniti
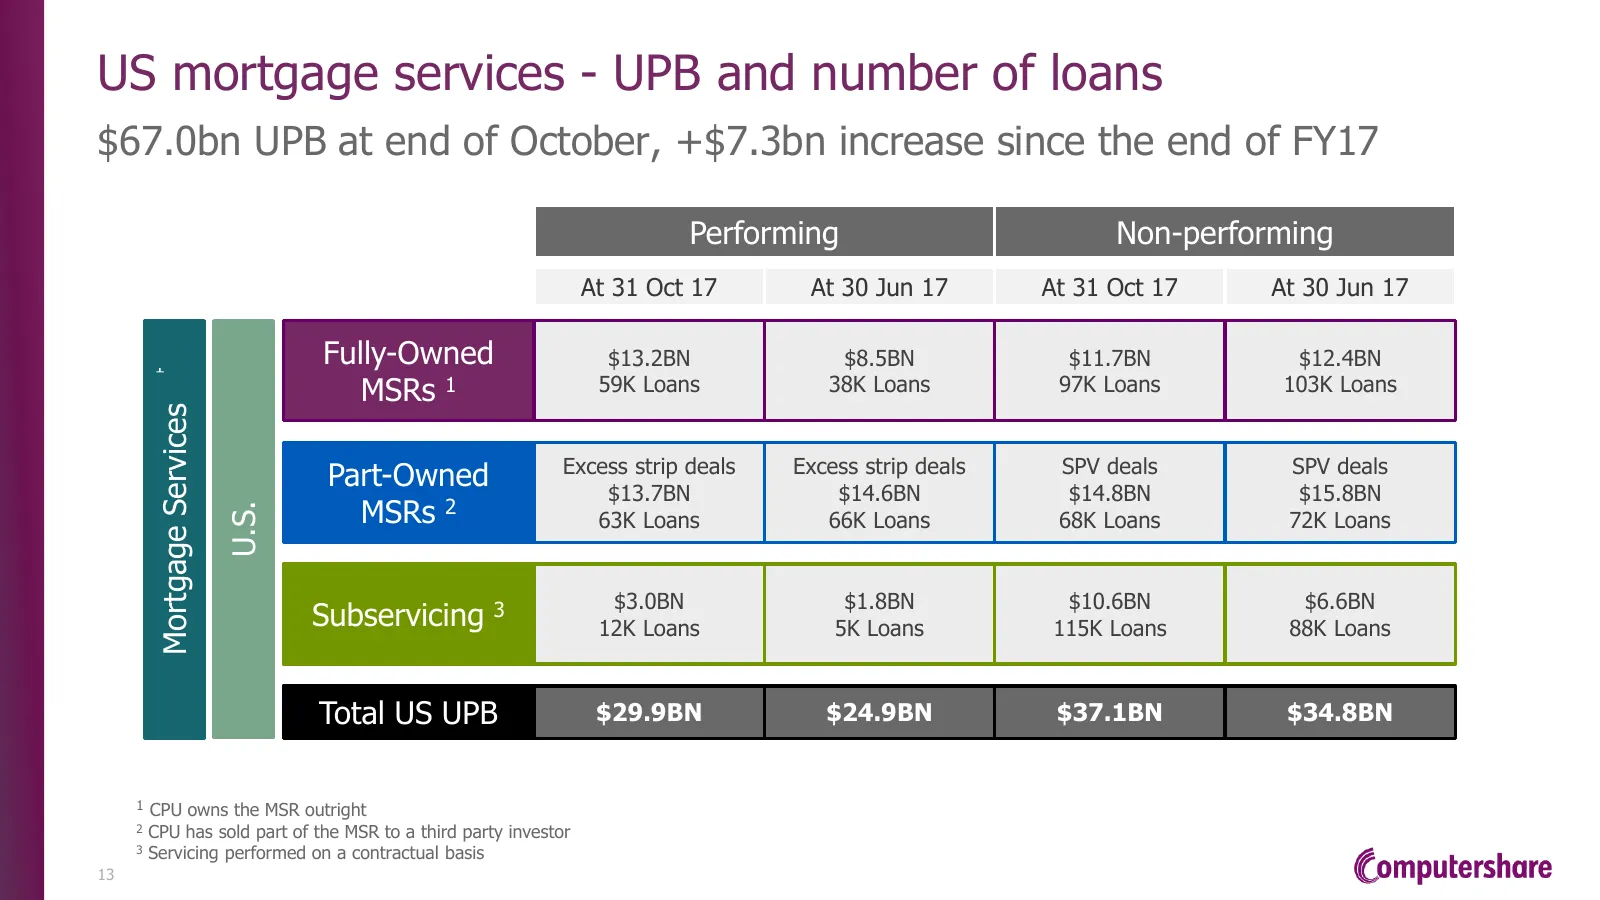
Slide 13: Mortgage Services
US mortgage services - UPB and number of loans $67.0bn UPB at end of October, +$7.3bn increase since the end of FY17 Performing Non-performing At 31 Oct 17 At 30 Jun 17 At 31 Oct 17 At 30 Jun 17 Fully-Owned $13.2BN $8.5BN $11.7BN $12.4BN MSRs 1 59K Loans 38K Loans 97K Loans 103K Loans Mortgage Servi
Slide 14: Growth: Employee share plans performing well
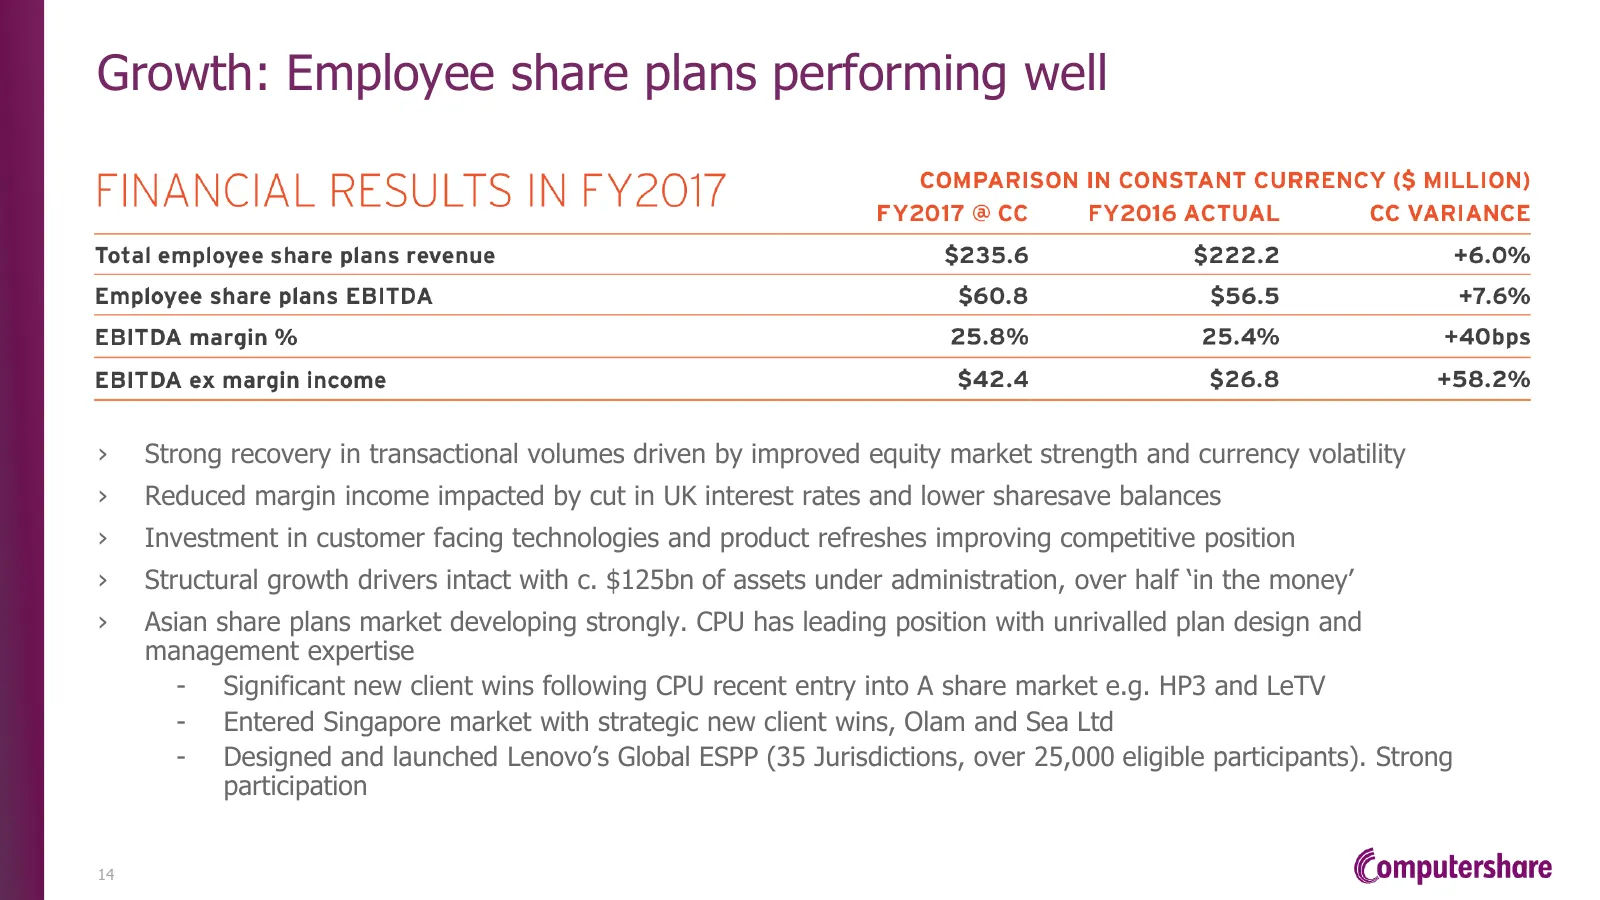
Growth: Employee share plans performing well › Strong recovery in transactional volumes driven by improved equity market strength and currency volatility › Reduced margin income impacted by cut in UK interest rates and lower sharesave balances › Investment in customer facing technologies and product
Slide 15: Profitability: Structural cost out program on track
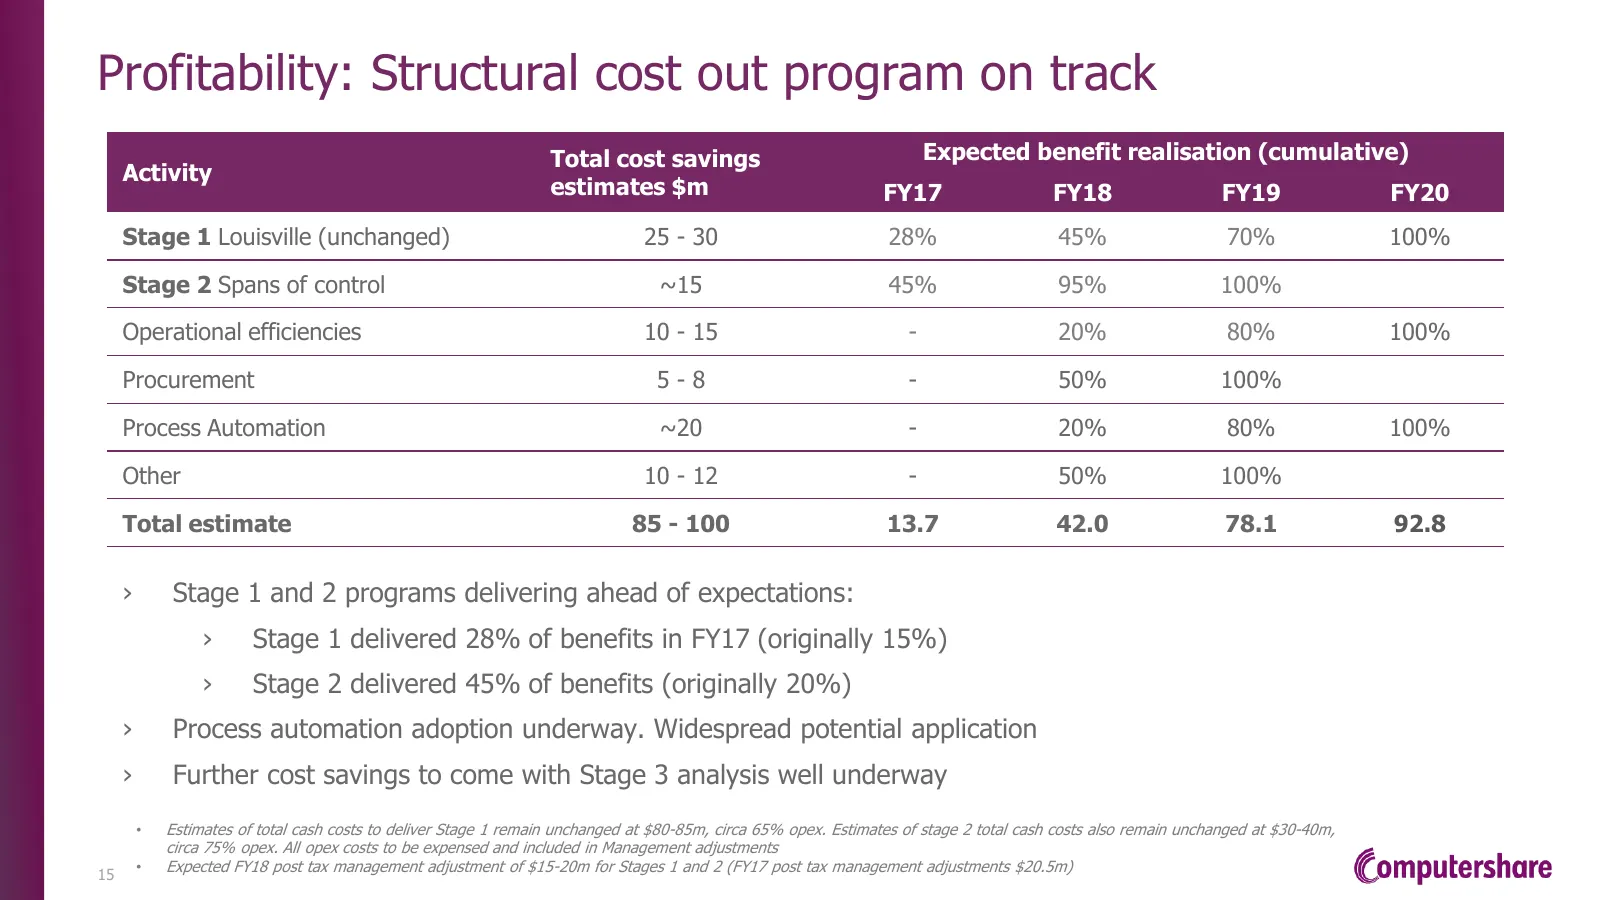
Profitability: Structural cost out program on track Total cost savings Expected benefit realisation (cumulative) Activity estimates $m FY17 FY18 FY19 FY20 Stage 1 Louisville (unchanged) 25 - 30 28% 45% 70% 100% Stage 2 Spans of control ~15 45% 95% 100% Operational efficiencies 10 - 15 - 20% 80% 100%
Slide 16: Profitability: Register Maintenance – margin expansion
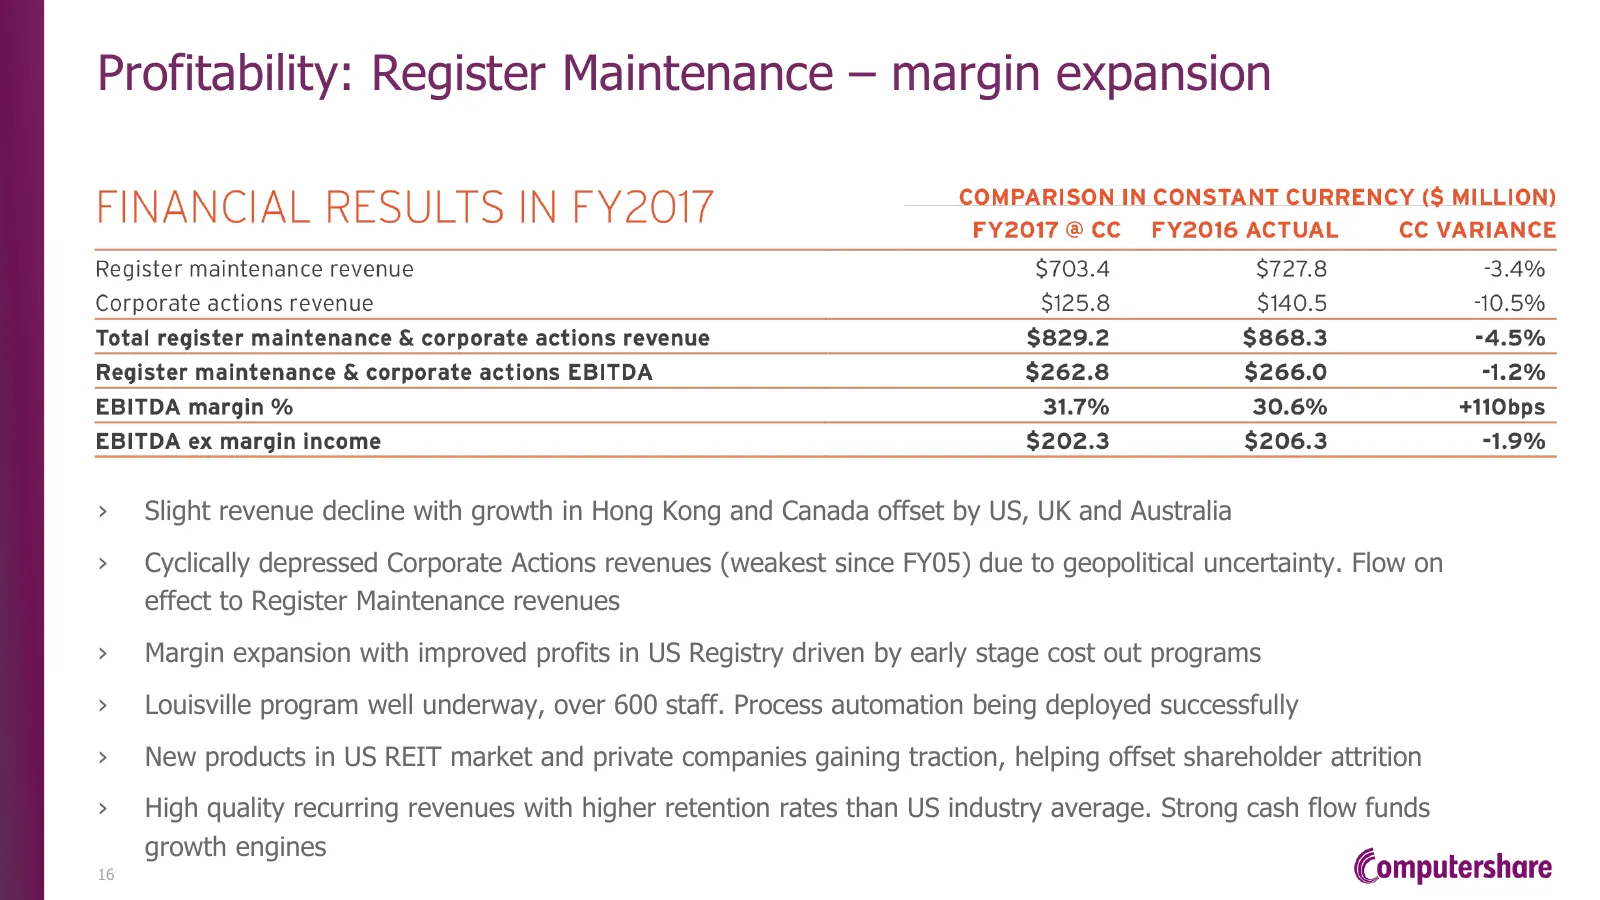
Profitability: Register Maintenance – margin expansion › Slight revenue decline with growth in Hong Kong and Canada offset by US, UK and Australia › Cyclically depressed Corporate Actions revenues (weakest since FY05) due to geopolitical uncertainty. Flow on effect to Register Maintenance revenues ›
Slide 17: Client balances and margin income
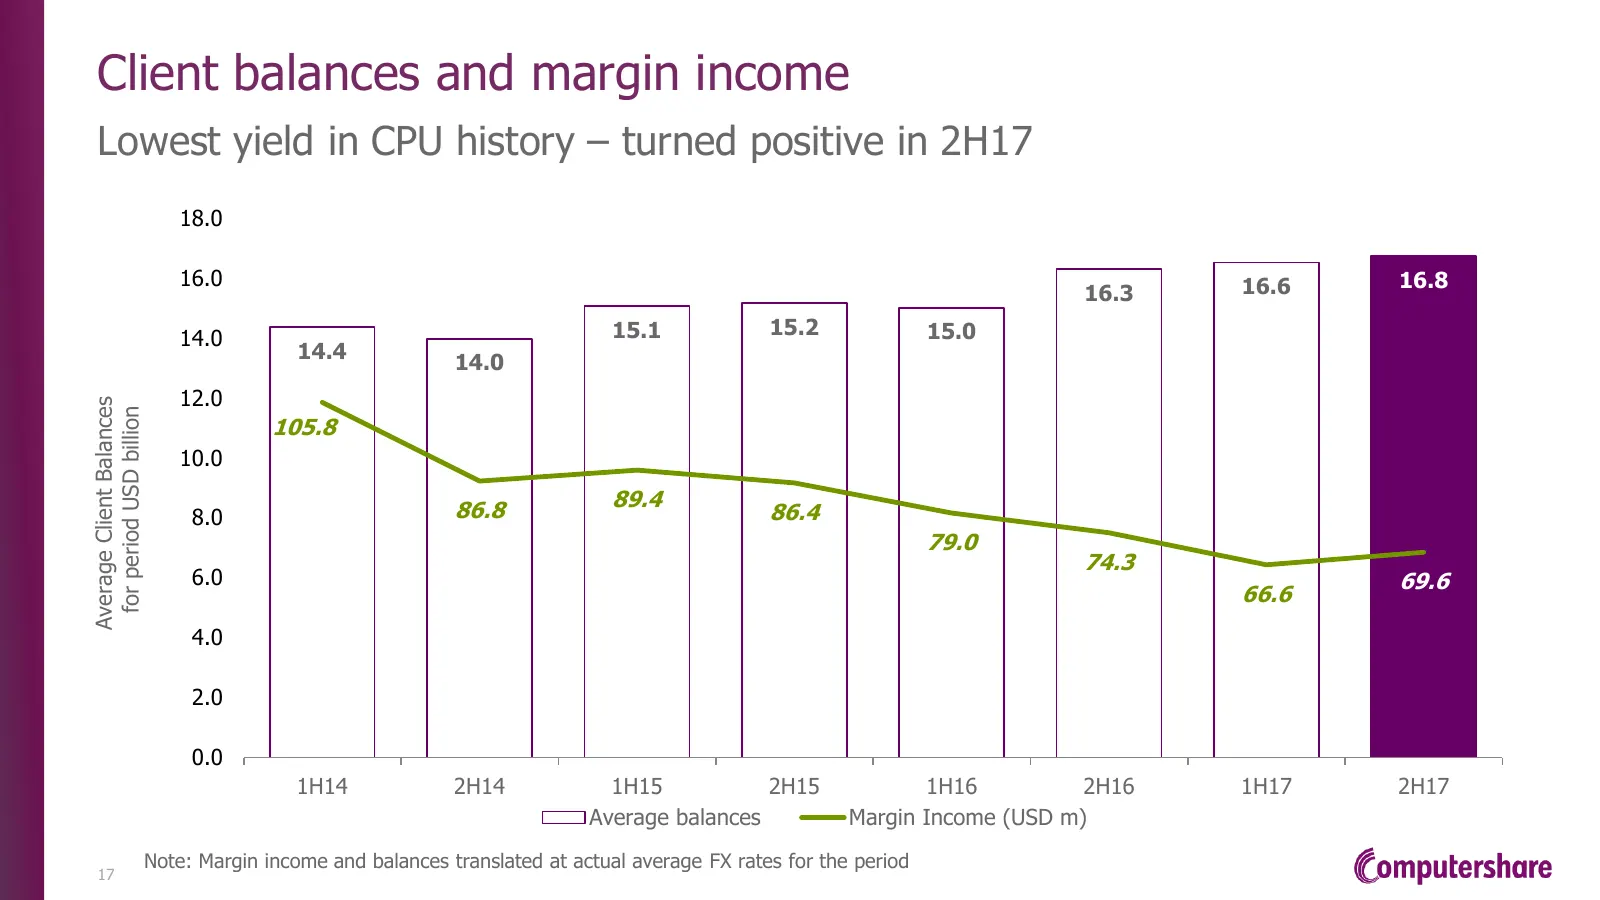
Client balances and margin income Lowest yield in CPU history – turned positive in 2H17 18.0 16.0 16.6 16.8 16.3 15.1 15.2 15.0 14.0 14.4 14.0 12.0 Average Client Balances for period USD billion 105.8 10.0 86.8 89.4 8.0 86.4 79.0 74.3 6.0 69.6 66.6 4.0 2.0 0.0 1H14 2H14 1H15 2H15 1H16 2H16 1H17 2H17
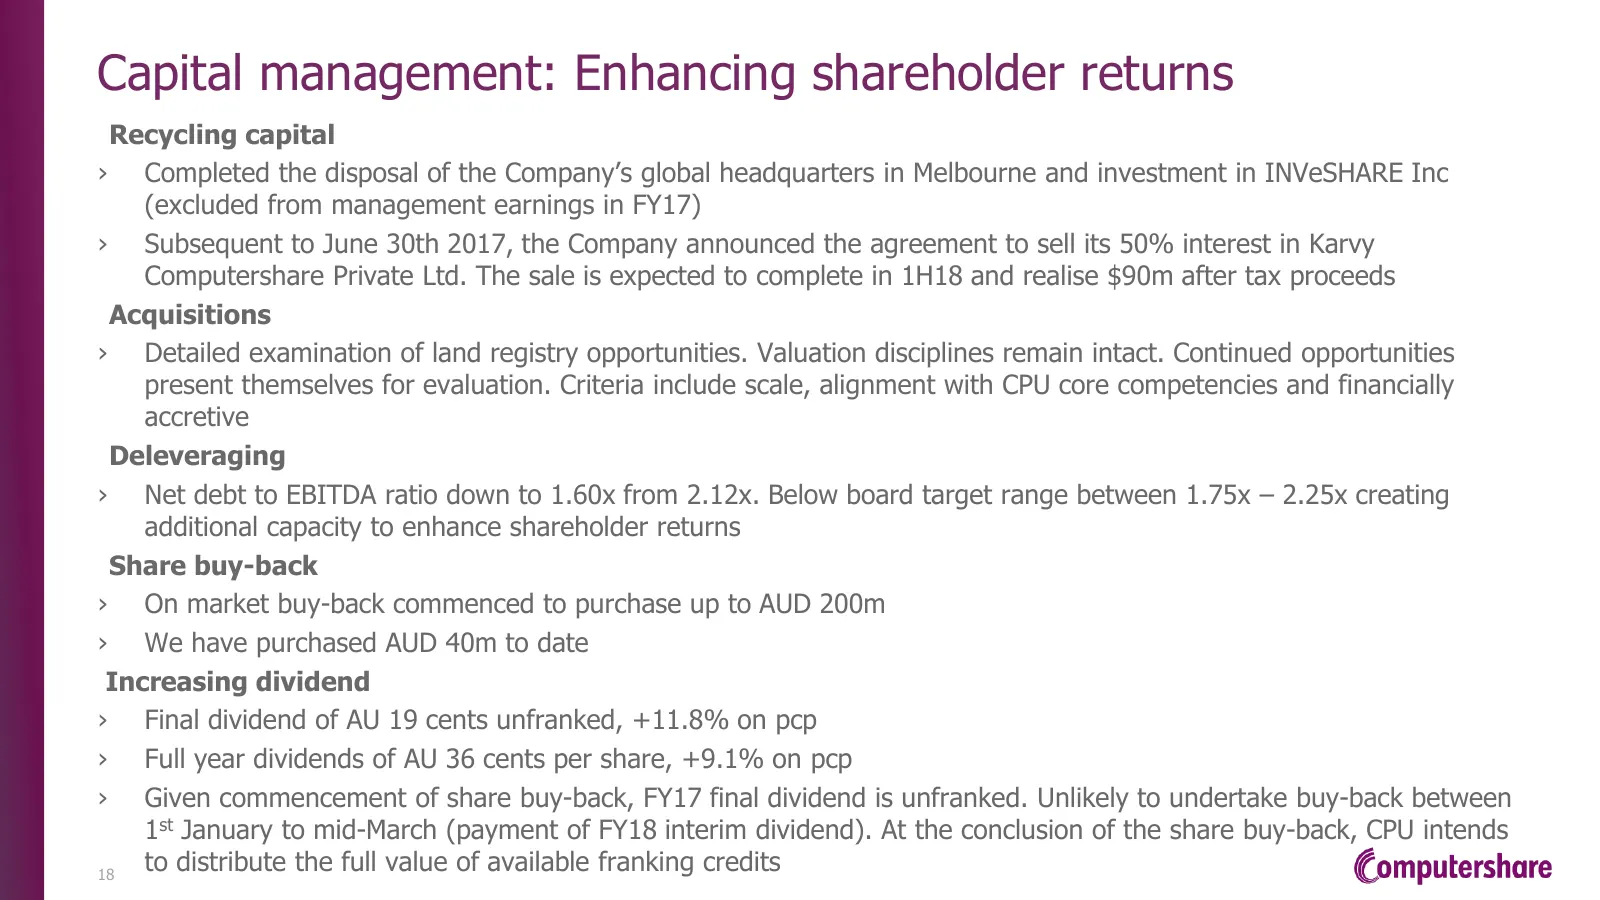
Slide 18: Capital management: Enhancing shareholder returns
Capital management: Enhancing shareholder returns Recycling capital › Completed the disposal of the Company’s global headquarters in Melbourne and investment in INVeSHARE Inc (excluded from management earnings in FY17) › Subsequent to June 30th 2017, the Company announced the agreement to sell its 5
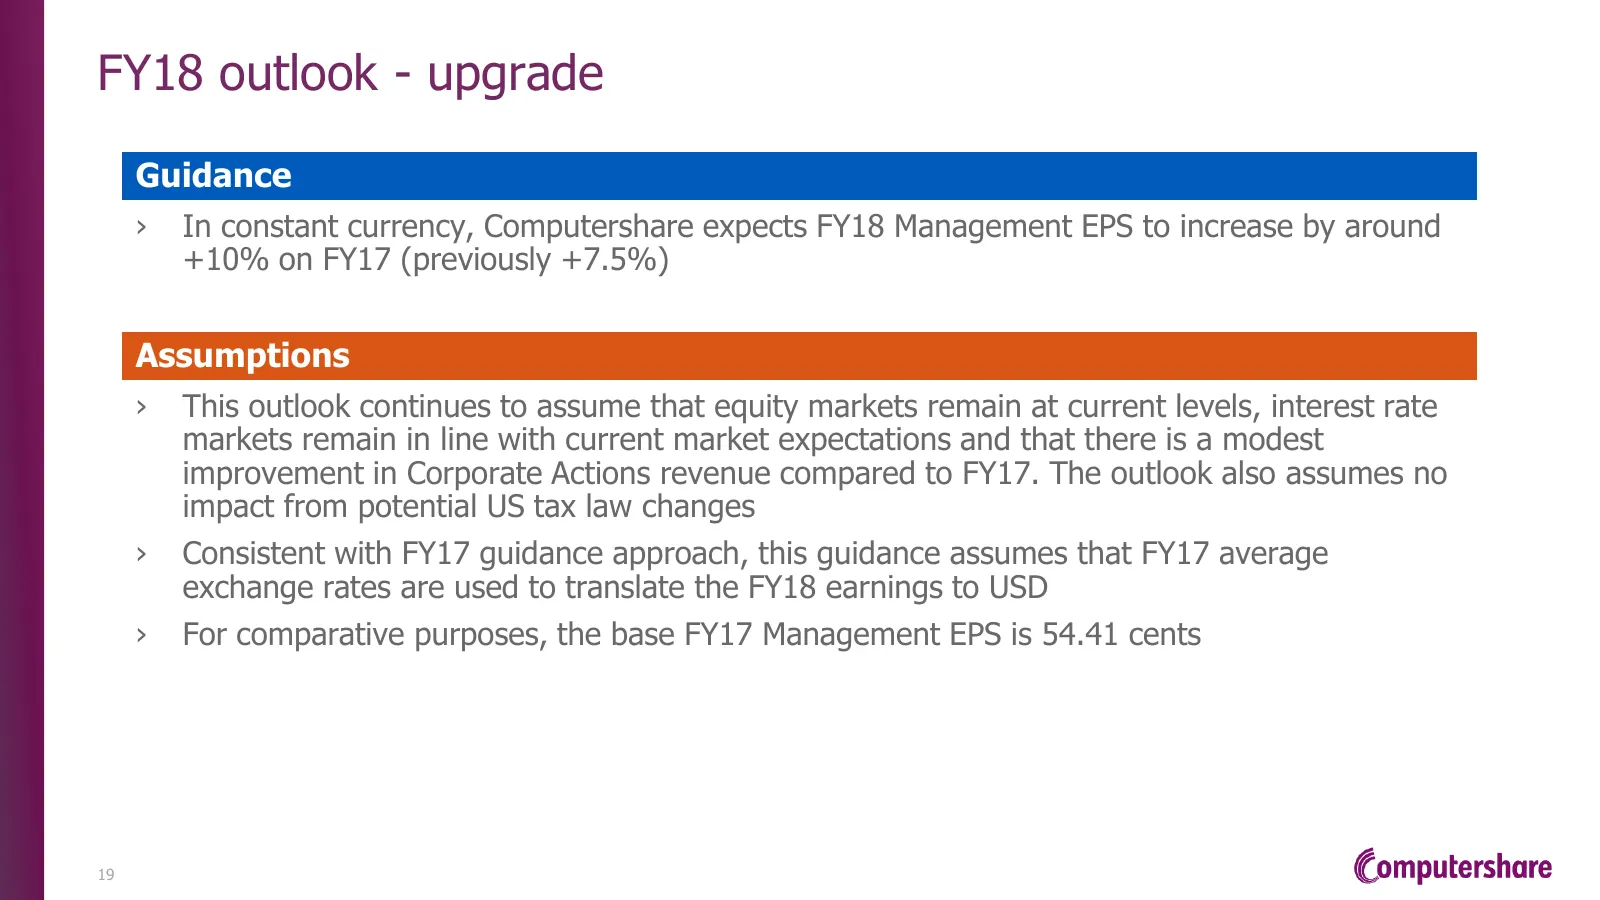
Slide 19: FY18 outlook - upgrade
FY18 outlook - upgrade Guidance › In constant currency, Computershare expects FY18 Management EPS to increase by around +10% on FY17 (previously +7.5%) Assumptions › This outlook continues to assume that equity markets remain at current levels, interest rate markets remain in line with current marke
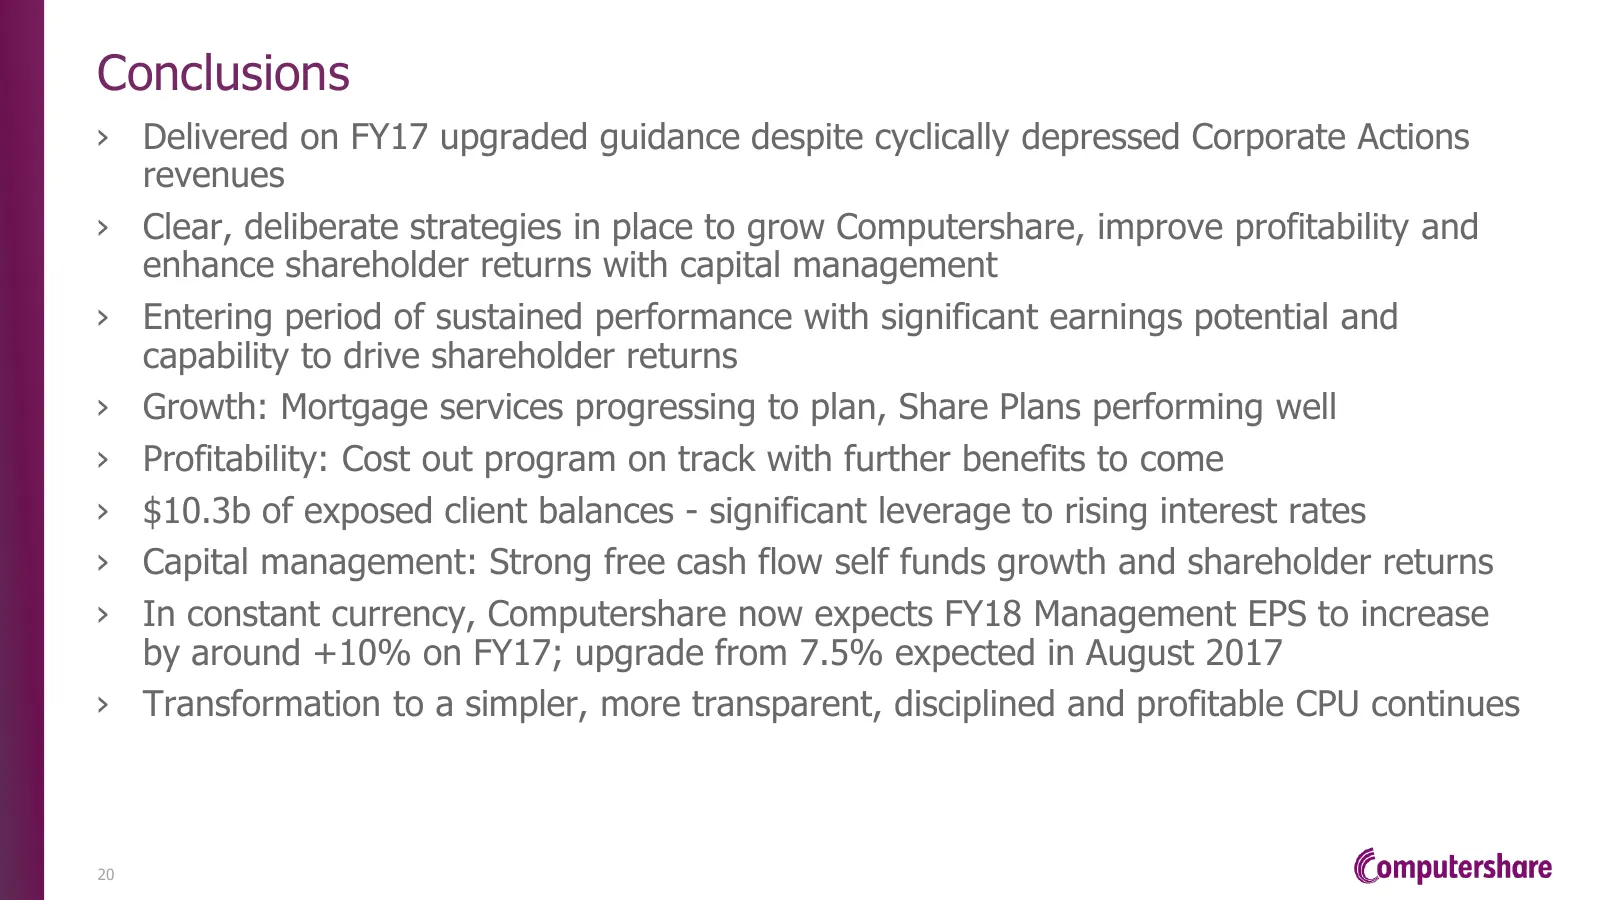
Slide 20: Conclusions
Conclusions › Delivered on FY17 upgraded guidance despite cyclically depressed Corporate Actions revenues › Clear, deliberate strategies in place to grow Computershare, improve profitability and enhance shareholder returns with capital management › Entering period of sustained performance with signi
Slide 21: Important notice
Important notice Forward-looking statements › This announcement may include 'forward-looking statements'. Such statements can generally be identified by the use of words such as 'may', 'will', 'expect', 'intend', 'plan', 'estimate', 'anticipate', 'believe', 'continue', 'objectives', 'outlook', 'guid
Source: Internet Archive copy of computershare.com
More decks from Computershare Limited
 Shareholder Meeting (November 2026)13 slides · Nov 12, 2026
 FY2026 Earnings Presentation52 slides · Aug 11, 2026
 Q2 2026 Earnings Presentation51 slides · Feb 11, 2026
 Shareholder Meeting (November 2025)16 slides · Nov 13, 2025
 FY2025 Earnings Presentation51 slides · Aug 12, 2025
 Macquarie Australia Conference 202513 slides · May 6, 2025