WashingtonFirst Bankshares Inc
WashingtonFirst Bankshares — Investor Presentation (February 2014)
32 slides from WashingtonFirst Bankshares's investor presentation, Feb 3, 2014
Slide 1: Investor Presentation February 2014
NASDAQ: WFBI www.wfbi.com Investor Presentation February 2014
Slide 2: Disclaimer
Disclaimer WashingtonFirst Bankshares, Inc. and Subsidiary (the “Company”) make forward-looking statements in this presentation that are subject to risks and uncertainties. These forward-looking statements include: statements of goals, intentions, earnings expectations, and other expectations; estim

Slide 3: Who We Are
Who We Are “People Make the Difference” 2
Slide 4: WashingtonFirst Bankshares, Inc.
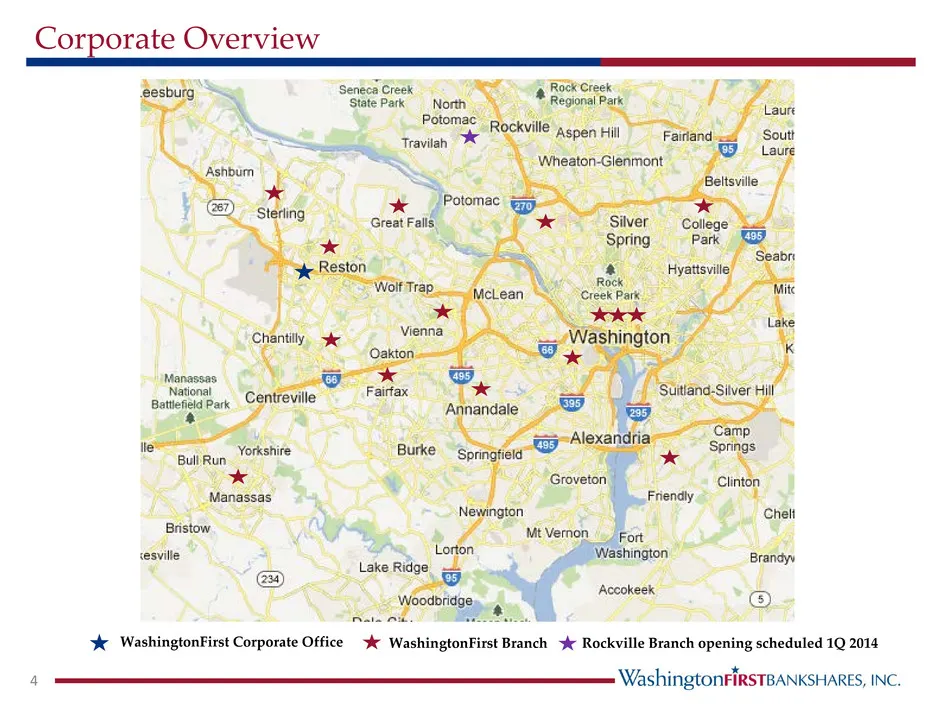
WashingtonFirst Bankshares, Inc. 3 WashingtonFirst Bankshares, Inc. is headquartered in Reston, Virginia and is the holding company for WashingtonFirst Bank, which commenced operations in 2004. WashingtonFirst Bank, which focuses on providing quality, tailored services to its customers, conducts a f
Slide 5: Corporate Overview
Corporate Overview 4 WashingtonFirst Corporate Office WashingtonFirst Branch Rockville Branch opening scheduled 1Q 2014
Slide 6: Board of Directors
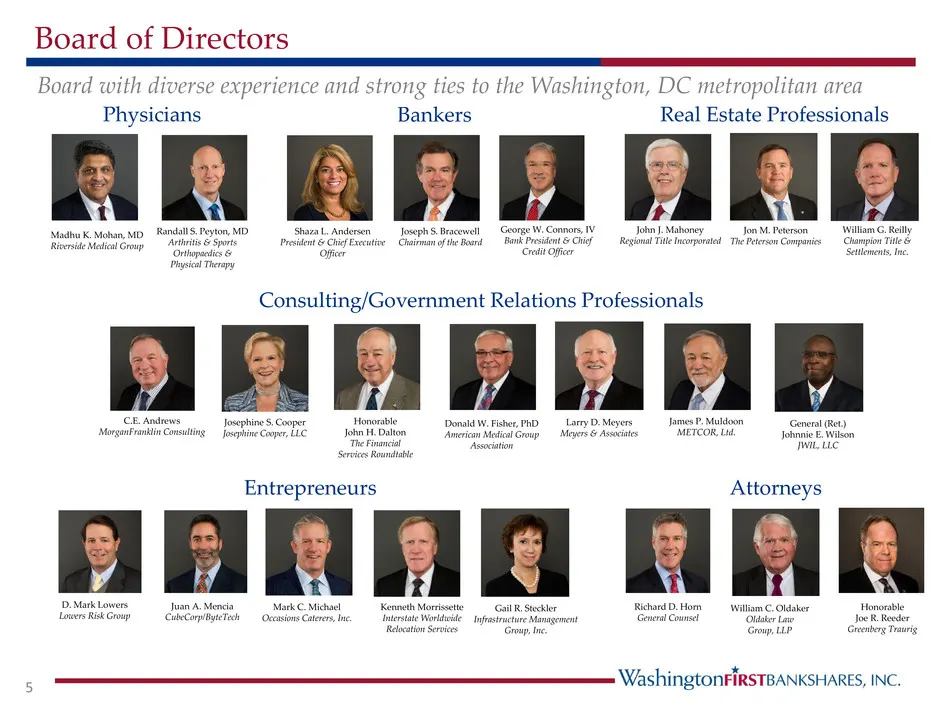
Board of Directors Physicians Attorneys Consulting/Government Relations Professionals Real Estate Professionals Entrepreneurs Joseph S. Bracewell Chairman of the Board William C. Oldaker Oldaker Law Group, LLP Honorable Joe R. Reeder Greenberg Traurig Josephine S. Cooper Josephine Cooper, LLC Honora
Slide 7: Senior Management Overview
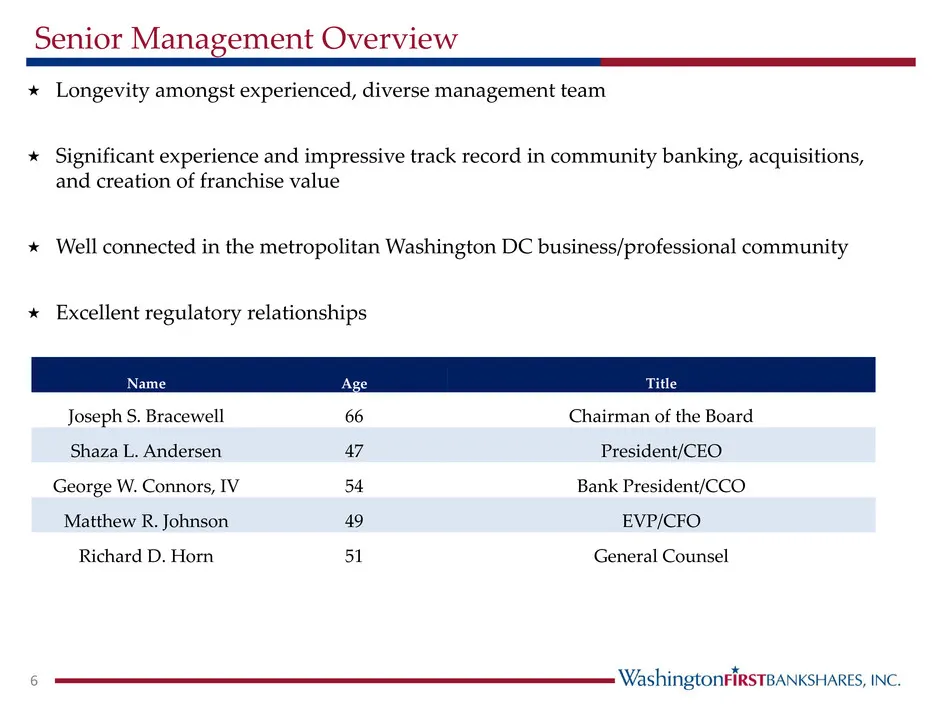
Senior Management Overview Longevity amongst experienced, diverse management team Significant experience and impressive track record in community banking, acquisitions, and creation of franchise value Well connected in the metropolitan Washington DC business/professional community Excellent
Slide 8: Senior Management Team
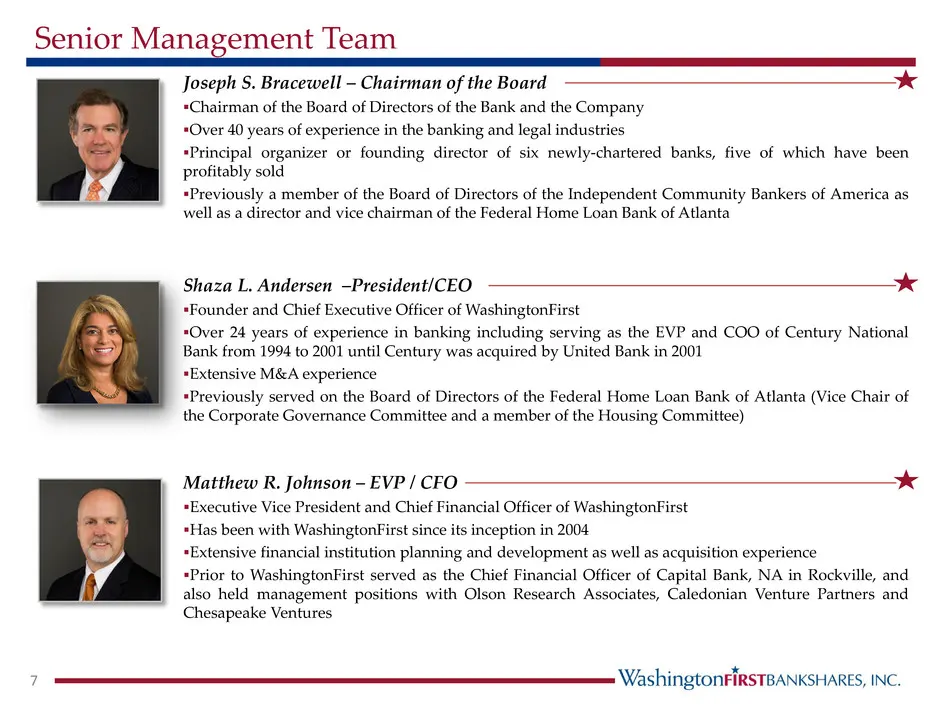
Senior Management Team Joseph S. Bracewell – Chairman of the Board Chairman of the Board of Directors of the Bank and the Company Over 40 years of experience in the banking and legal industries Principal organizer or founding director of six newly-chartered banks, five of which have been profitab
Slide 9: Senior Management Team
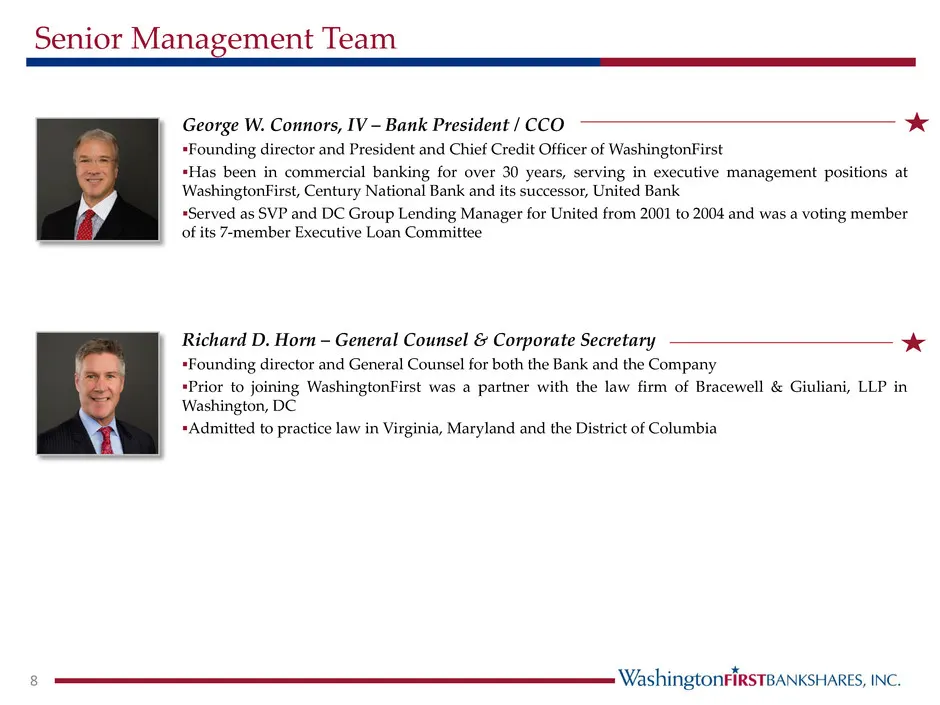
Senior Management Team Richard D. Horn – General Counsel & Corporate Secretary Founding director and General Counsel for both the Bank and the Company Prior to joining WashingtonFirst was a partner with the law firm of Bracewell & Giuliani, LLP in Washington, DC Admitted to practice law in Virgin
Slide 10: About Our Bank
About Our Bank “Consistent Positive Growth” 9
Slide 11: Value Proposition
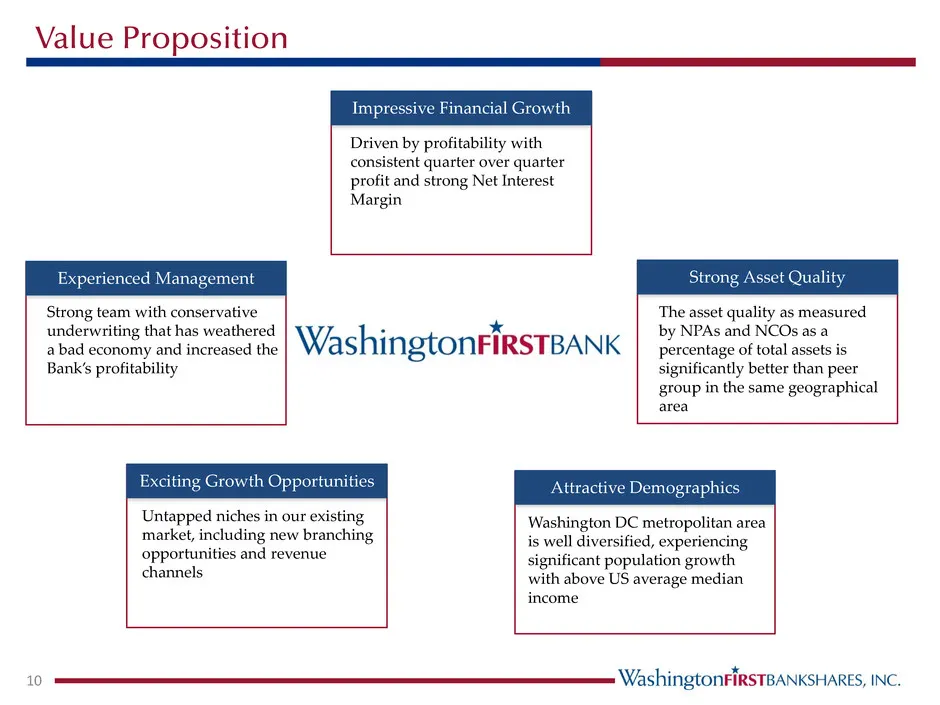
Value Proposition 10 Attractive Demographics Washington DC metropolitan area is well diversified, experiencing significant population growth with above US average median income Strong Asset Quality The asset quality as measured by NPAs and NCOs as a percentage of total assets is significantly better
Slide 12: Our Strategy
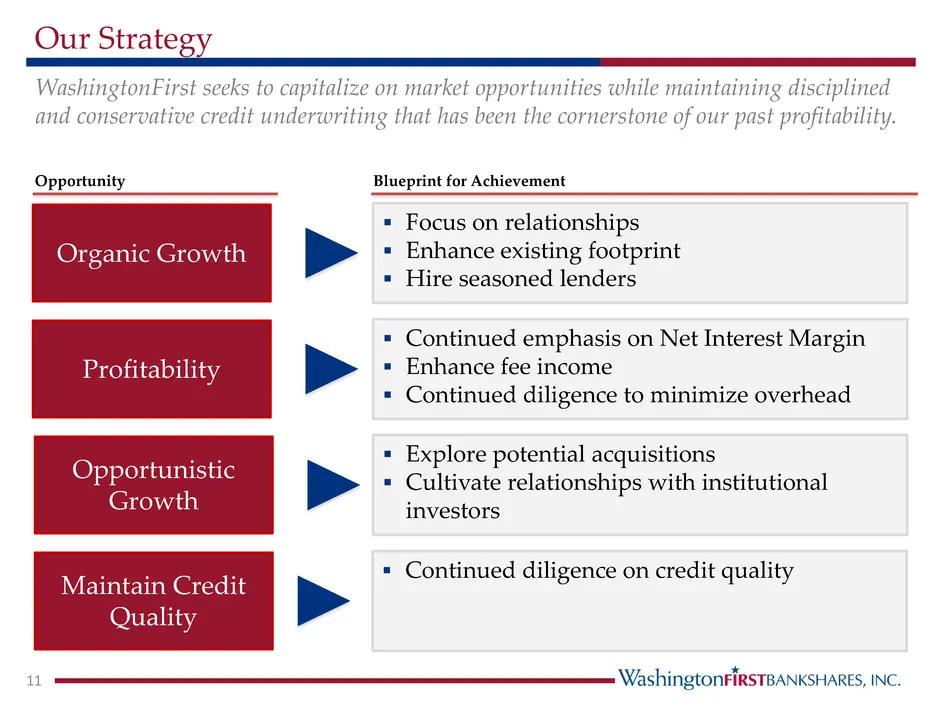
Our Strategy WashingtonFirst seeks to capitalize on market opportunities while maintaining disciplined and conservative credit underwriting that has been the cornerstone of our past profitability. Opportunity Organic Growth Focus on relationships Enhance existing footprint Hire seasoned lender
Slide 13: Market Demographics
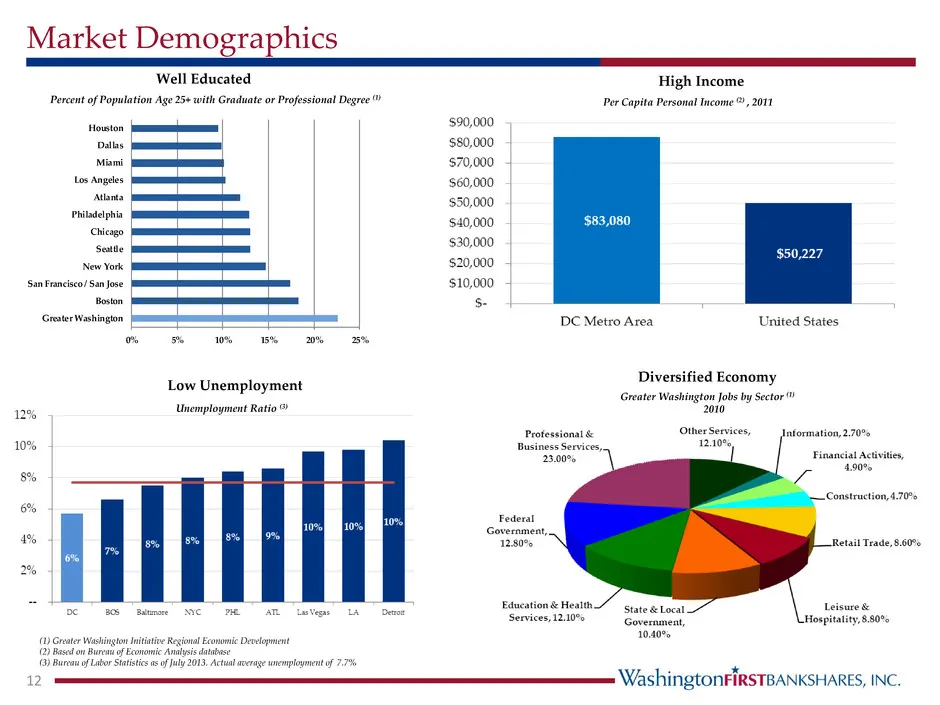
12 (1) Greater Washington Initiative Regional Economic Development (2) Based on Bureau of Economic Analysis database (3) Bureau of Labor Statistics as of July 2013. Actual average unemployment of 7.7% Greater Washington Jobs by Sector (1) 2010 0% 5% 10% 15% 20% 25% Greater Washington Boston San Fran
Slide 14: Strong Growth
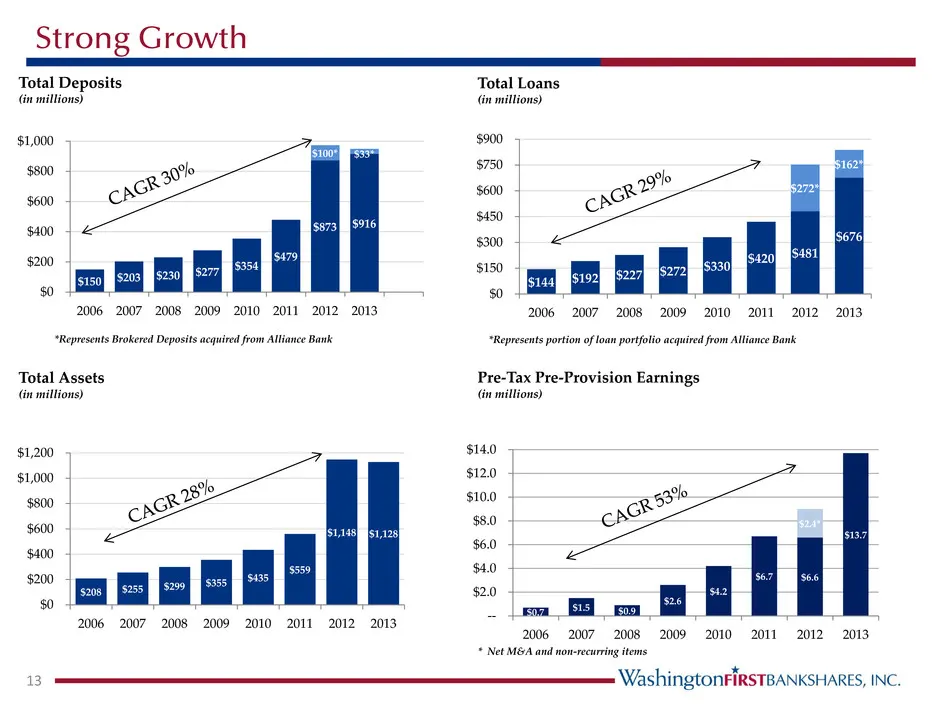
Strong Growth 13 Total Assets (in millions) Total Deposits (in millions) Pre-Tax Pre-Provision Earnings (in millions) Total Loans (in millions) $2.4* *Represents portion of loan portfolio acquired from Alliance Bank *Represents Brokered Deposits acquired from Alliance Bank * Net M&A and non-recurrin
Slide 15: Loan Composition as of December 31, 2013
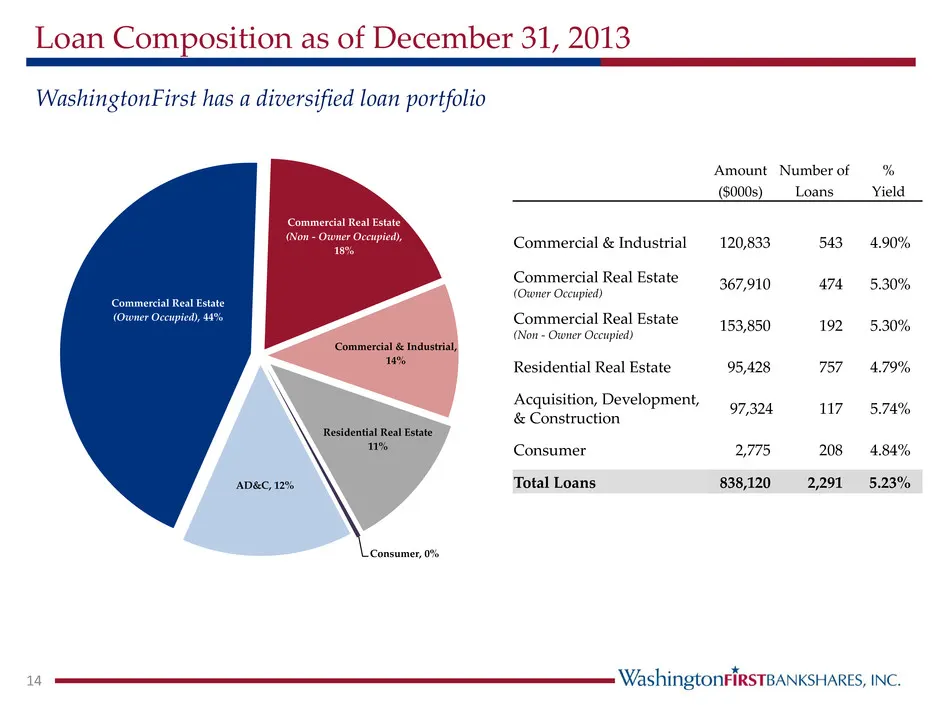
Loan Composition as of December 31, 2013 14 WashingtonFirst has a diversified loan portfolio AD&C, 12% Commercial Real Estate (Owner Occupied), 44% Commercial Real Estate (Non - Owner Occupied), 18% Commercial & Industrial, 14% Residential Real Estate 11% Consumer, 0% Amount Number of % ($000s) Loan
Slide 16: Our Credit Culture
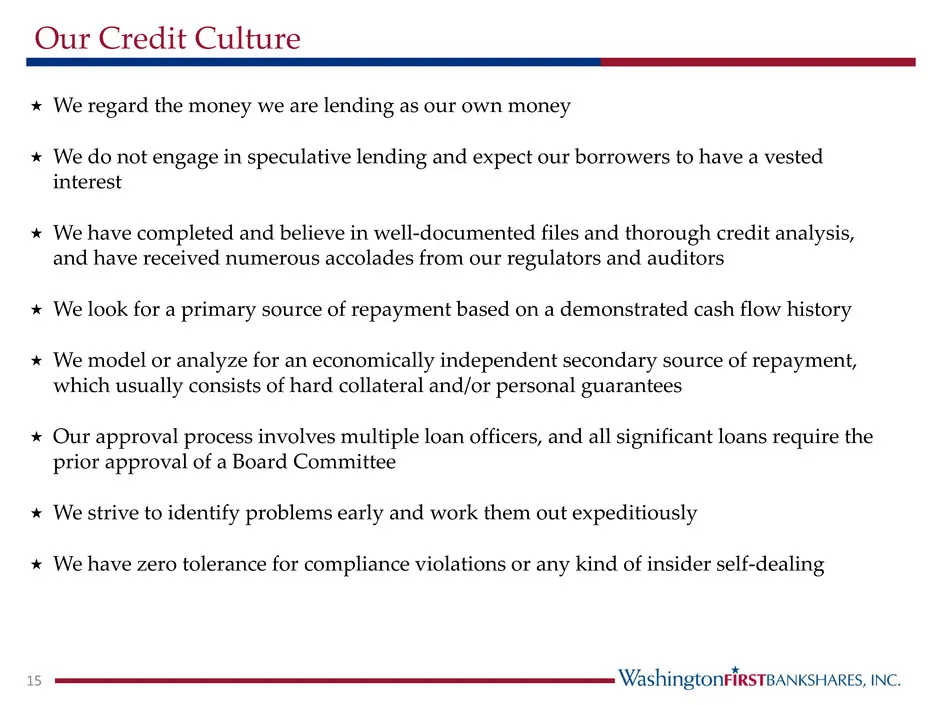
Our Credit Culture We regard the money we are lending as our own money We do not engage in speculative lending and expect our borrowers to have a vested interest We have completed and believe in well-documented files and thorough credit analysis, and have received numerous accolades from our r
Slide 17: NPAs + Days PD / Assets
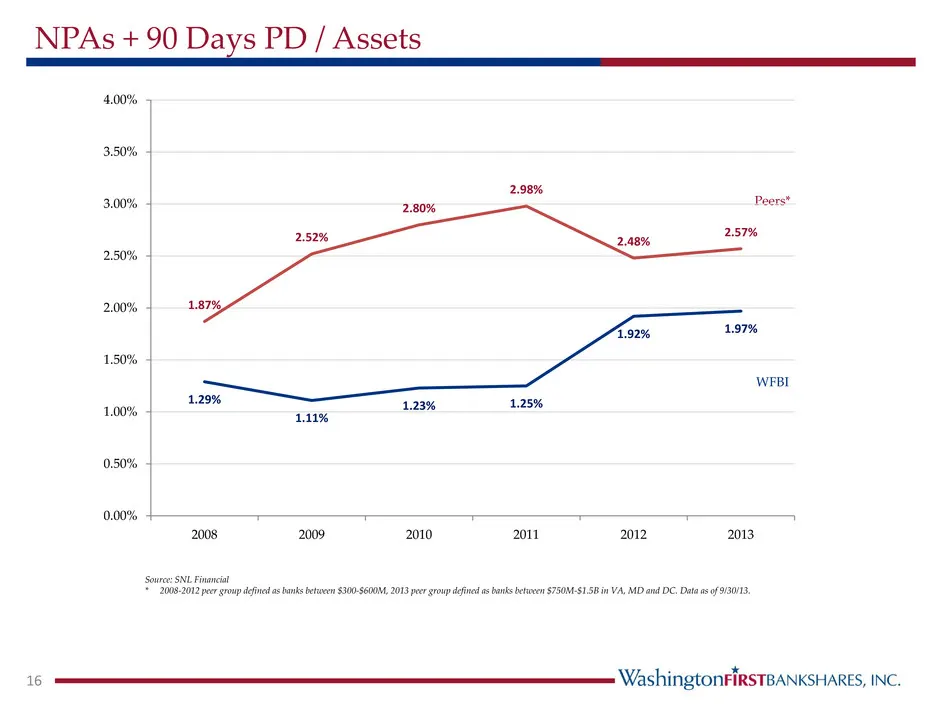
NPAs + 90 Days PD / Assets 16 Source: SNL Financial * 2008-2012 peer group defined as banks between $300-$600M, 2013 peer group defined as banks between $750M-$1.5B in VA, MD and DC. Data as of 9/30/13. WFBI Peers* 1.29% 1.11% 1.23% 1.25% 1.92% 1.97% 1.87% 2.52% 2.80% 2.98% 2.48% 2.57% 0.00% 0.50% 1
Slide 18: Deposit Composition as of December 31, 2013
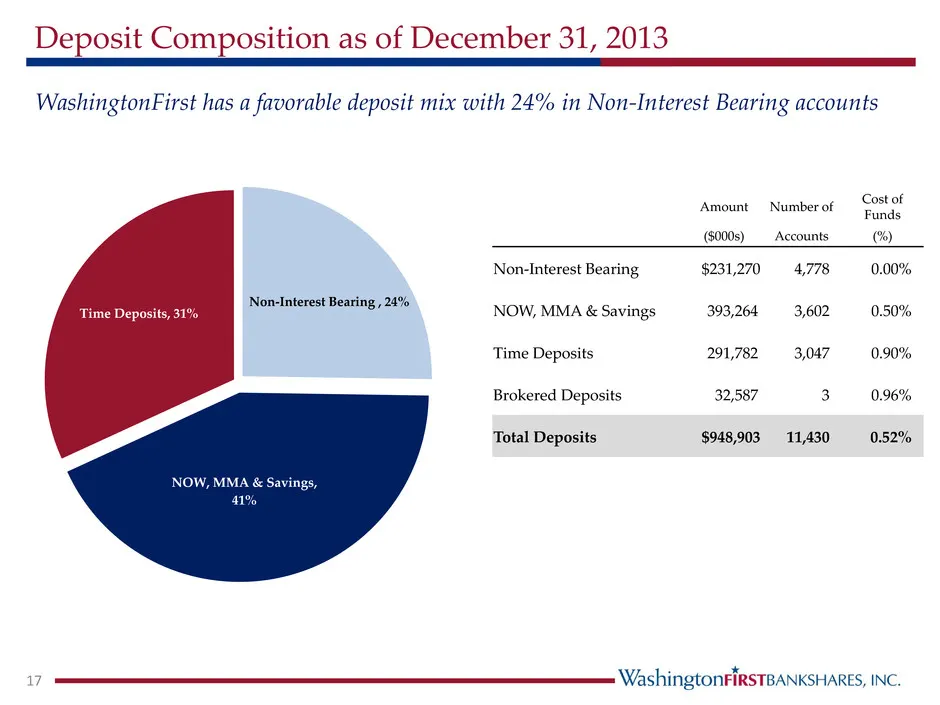
Deposit Composition as of December 31, 2013 17 WashingtonFirst has a favorable deposit mix with 24% in Non-Interest Bearing accounts Non-Interest Bearing , 24% NOW, MMA & Savings, 41% Time Deposits, 31% Amount Number of Cost of Funds ($000s) Accounts (%) Non-Interest Bearing $231,270 4,778 0.00% NOW
Slide 19: Earnings Trend
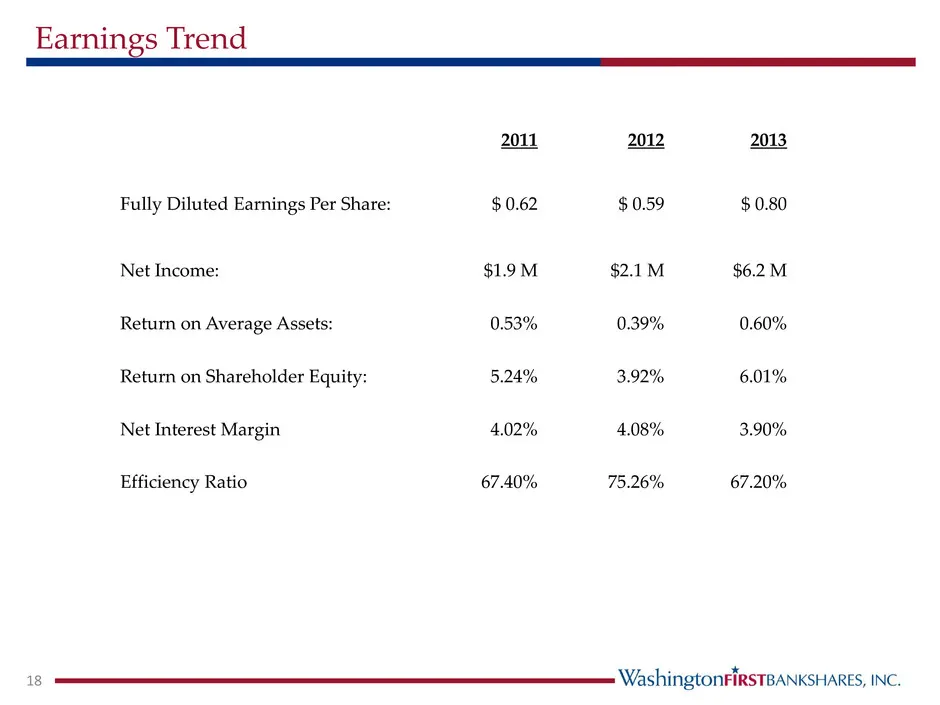
Earnings Trend 18 2011 2012 2013 Fully Diluted Earnings Per Share: $ 0.62 $ 0.59 $ 0.80 Net Income: $1.9 M $2.1 M $6.2 M Return on Average Assets: 0.53% 0.39% 0.60% Return on Shareholder Equity: 5.24% 3.92% 6.01% Net Interest Margin 4.02% 4.08% 3.90% Efficiency Ratio 67.40% 75.26% 67.20%
Slide 20: Net Interest Margin
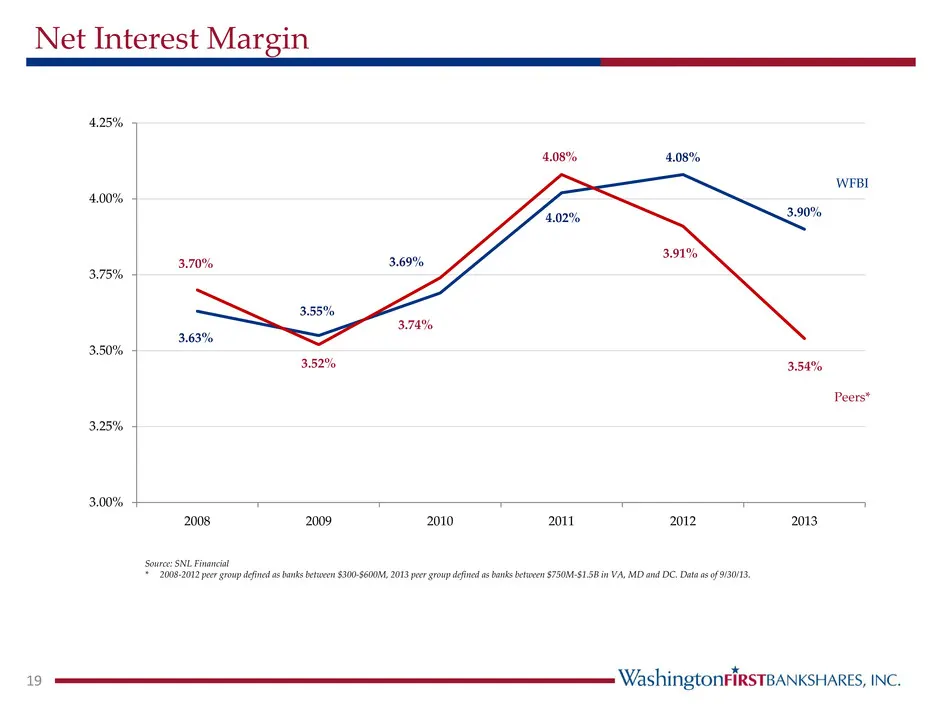
Net Interest Margin 19 3.63% 3.55% 3.69% 4.02% 4.08% 3.90% 3.70% 3.52% 3.74% 4.08% 3.91% 3.54% 3.00% 3.25% 3.50% 3.75% 4.00% 4.25% 2008 2009 2010 2011 2012 2013 WFBI Peers* Source: SNL Financial * 2008-2012 peer group defined as banks between $300-$600M, 2013 peer group defined as banks between $750
Slide 21: Efficiency Ratio
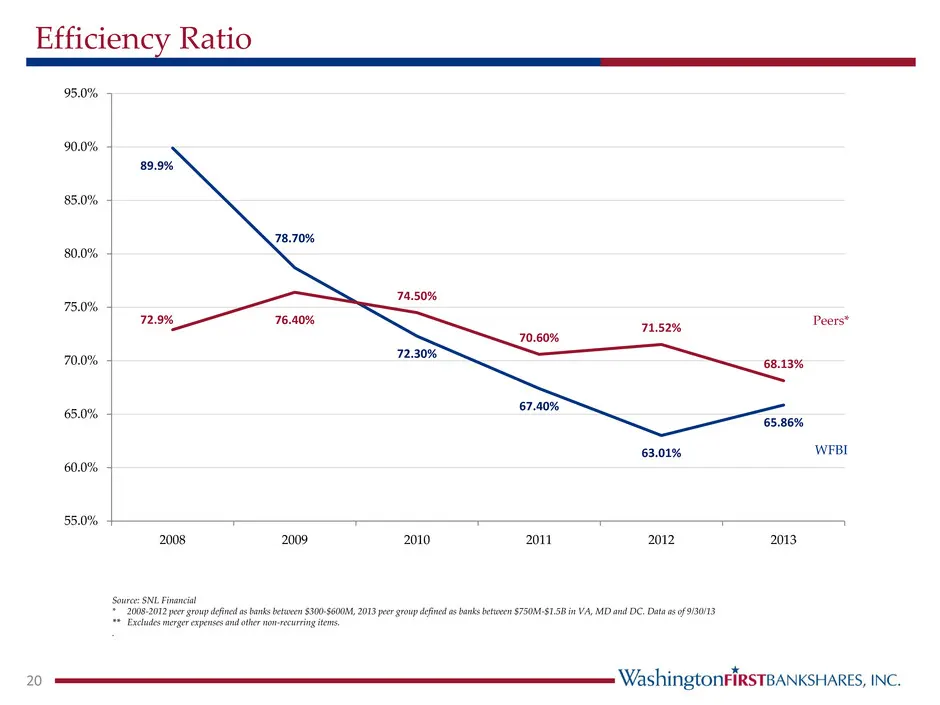
Efficiency Ratio 20 Source: SNL Financial * 2008-2012 peer group defined as banks between $300-$600M, 2013 peer group defined as banks between $750M-$1.5B in VA, MD and DC. Data as of 9/30/13 ** Excludes merger expenses and other non-recurring items. . WFBI Peers* 89.9% 78.70% 72.30% 67.40% 63.01% 6
Slide 22: Capital Strength
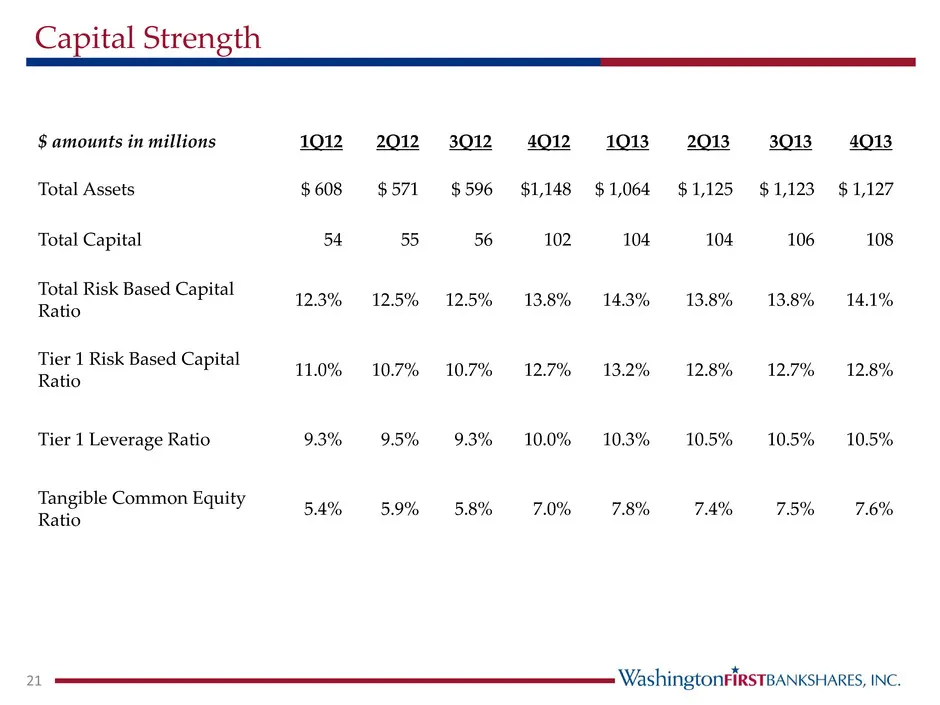
Capital Strength 21 $ amounts in millions 1Q12 2Q12 3Q12 4Q12 1Q13 2Q13 3Q13 4Q13 Total Assets $ 608 $ 571 $ 596 $1,148 $ 1,064 $ 1,125 $ 1,123 $ 1,127 Total Capital 54 55 56 102 104 104 106 108 Total Risk Based Capital Ratio 12.3% 12.5% 12.5% 13.8% 14.3% 13.8% 13.8% 14.1% Tier 1 Risk Based Capital
Slide 23: NASDAQ Listing
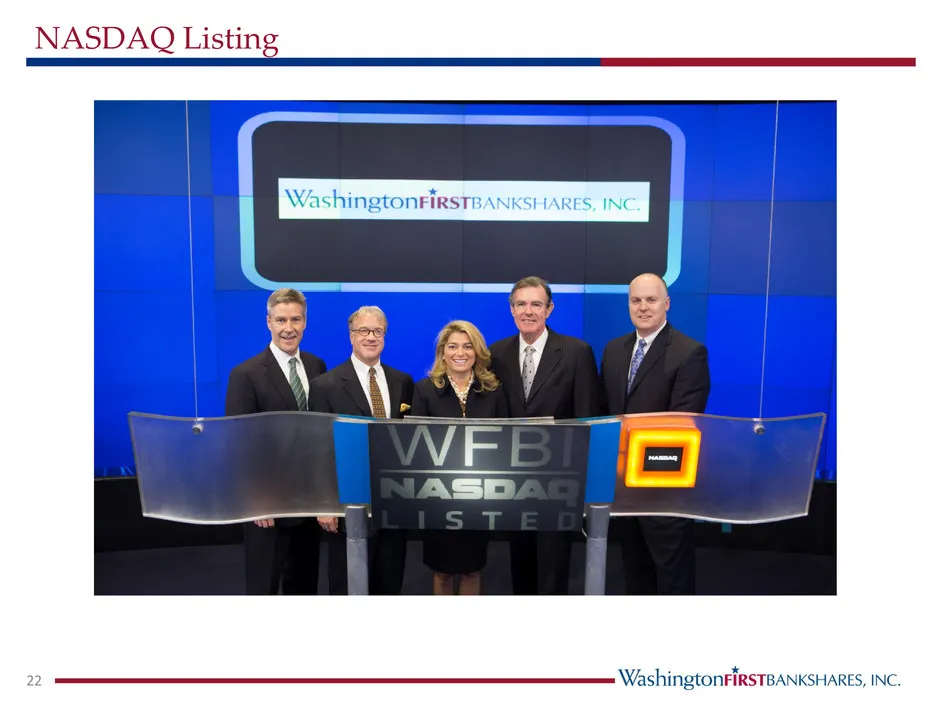
NASDAQ Listing WashingtonFiRsTBANKSHARES, INC
Slide 24: Our M&A Track Record
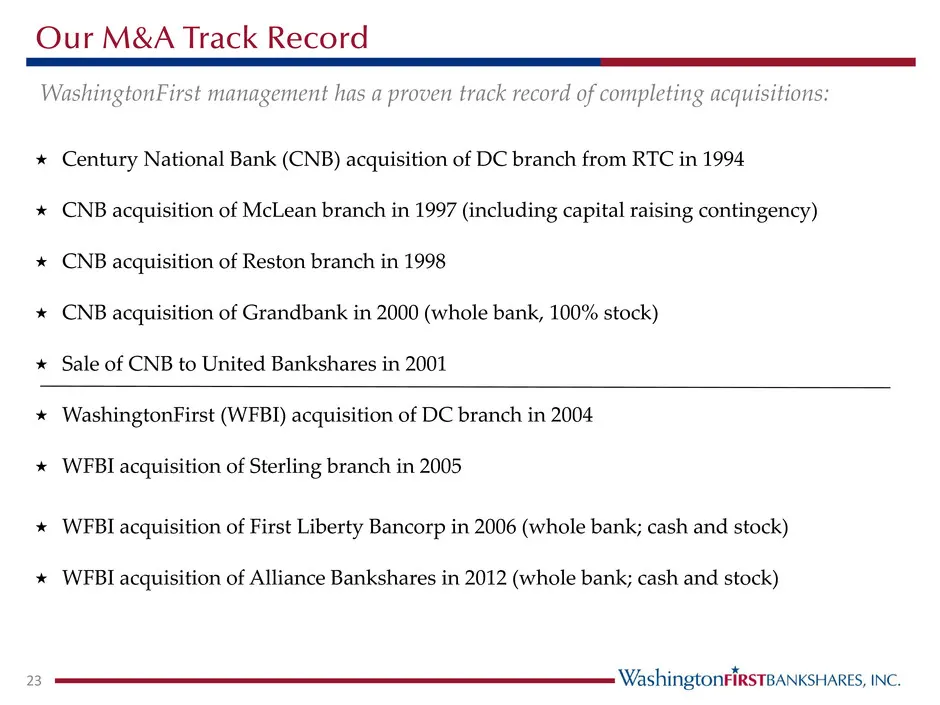
Our M&A Track Record 23 WashingtonFirst management has a proven track record of completing acquisitions: Century National Bank (CNB) acquisition of DC branch from RTC in 1994 CNB acquisition of McLean branch in 1997 (including capital raising contingency) CNB acquisition of Reston branch in 19
Slide 25: Recent M&A Activity in the Washington MSA
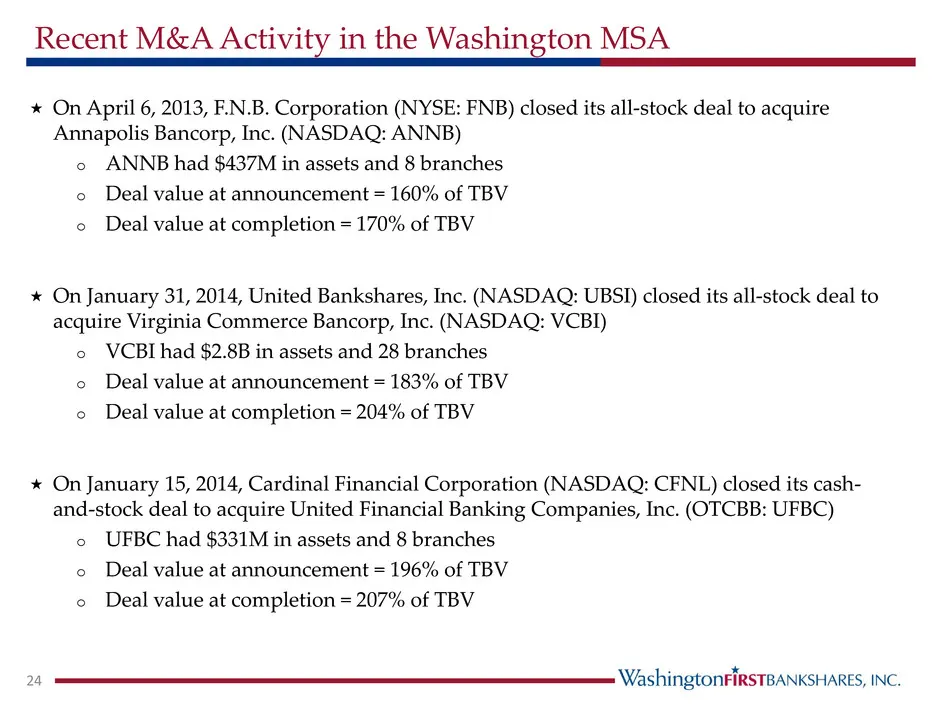
Recent M&A Activity in the Washington MSA On April 6, 2013, F.N.B. Corporation (NYSE: FNB) closed its all-stock deal to acquire Annapolis Bancorp, Inc. (NASDAQ: ANNB) o ANNB had $437M in assets and 8 branches o Deal value at announcement = 160% of TBV o Deal value at completion = 170% of TBV On
Slide 26: Facts About Our Common Stock
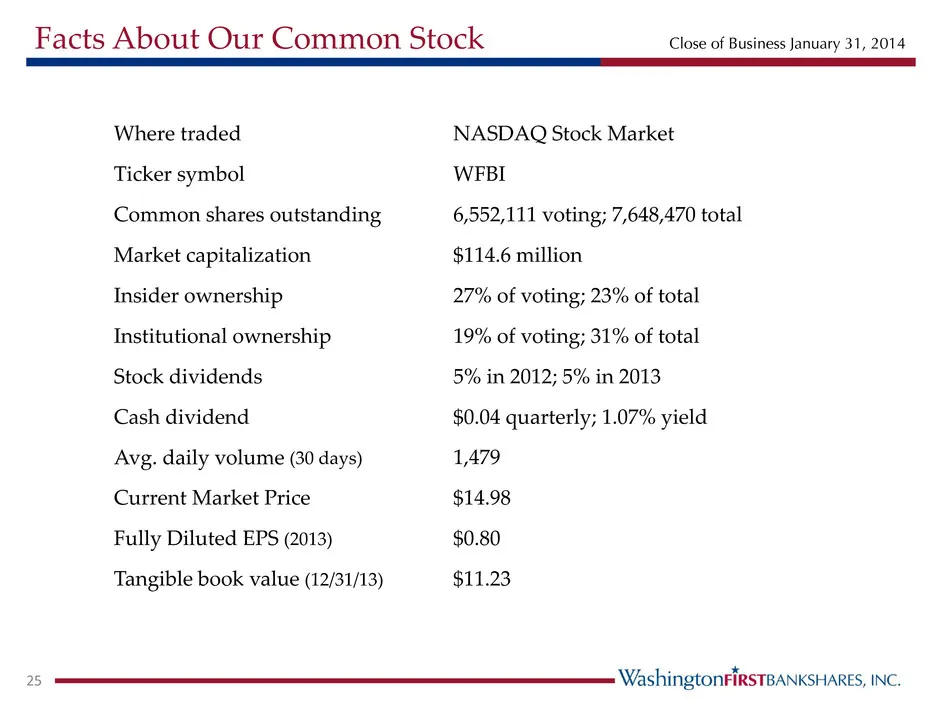
Facts About Our Common Stock Close of Business January 31, 2014 25 Where traded NASDAQ Stock Market Ticker symbol WFBI Common shares outstanding 6,552,111 voting; 7,648,470 total Market capitalization $114.6 million Insider ownership 27% of voting; 23% of total Institutional ownership 19% of voting;
Slide 27: WFBI Stock Performance (YTD)
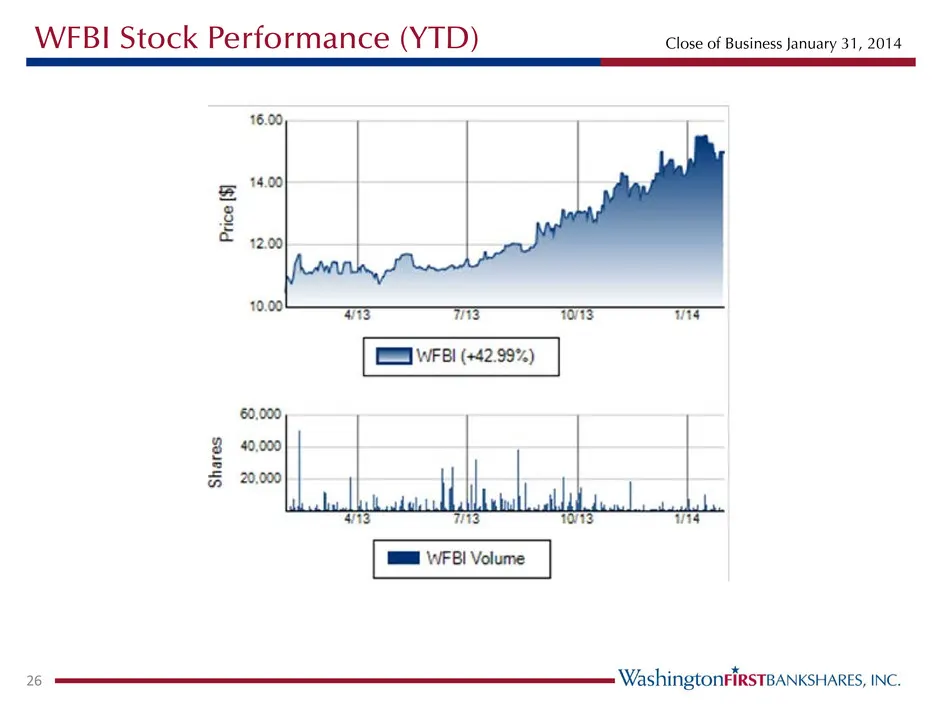
WFBI Stock Performance (YTD) 26 Close of Business January 31, 2014
Slide 28: Questions?
Questions ? 27
Slide 29: Appendix
Appendix 28
Slide 30: Historical Balance Sheet
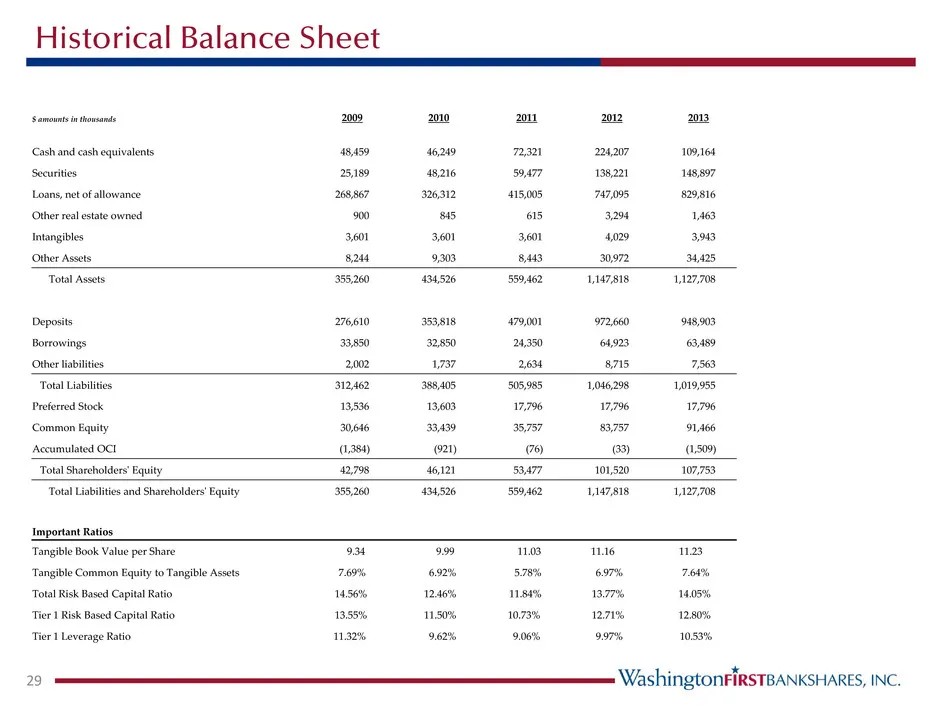
Historical Balance Sheet 29 $ amounts in thousands 2009 2010 2011 2012 2013 Cash and cash equivalents 48,459 46,249 72,321 224,207 109,164 Securities 25,189 48,216 59,477 138,221 148,897 Loans, net of allowance 268,867 326,312 415,005 747,095 829,816 Other real estate owned 900 845 615 3,294 1,463 I
Slide 31: Historical Income Statement
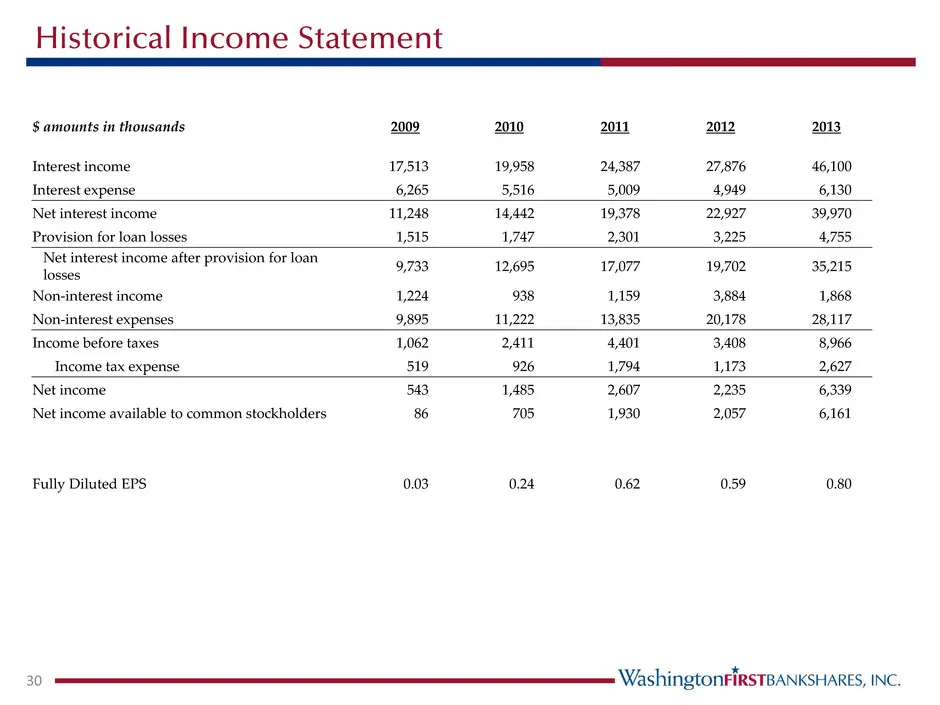
Historical Income Statement 30 $ amounts in thousands 2009 2010 2011 2012 2013 Interest income 17,513 19,958 24,387 27,876 46,100 Interest expense 6,265 5,516 5,009 4,949 6,130 Net interest income 11,248 14,442 19,378 22,927 39,970 Provision for loan losses 1,515 1,747 2,301 3,225 4,755 Net interest
Slide 32: Credit Composition and Quality
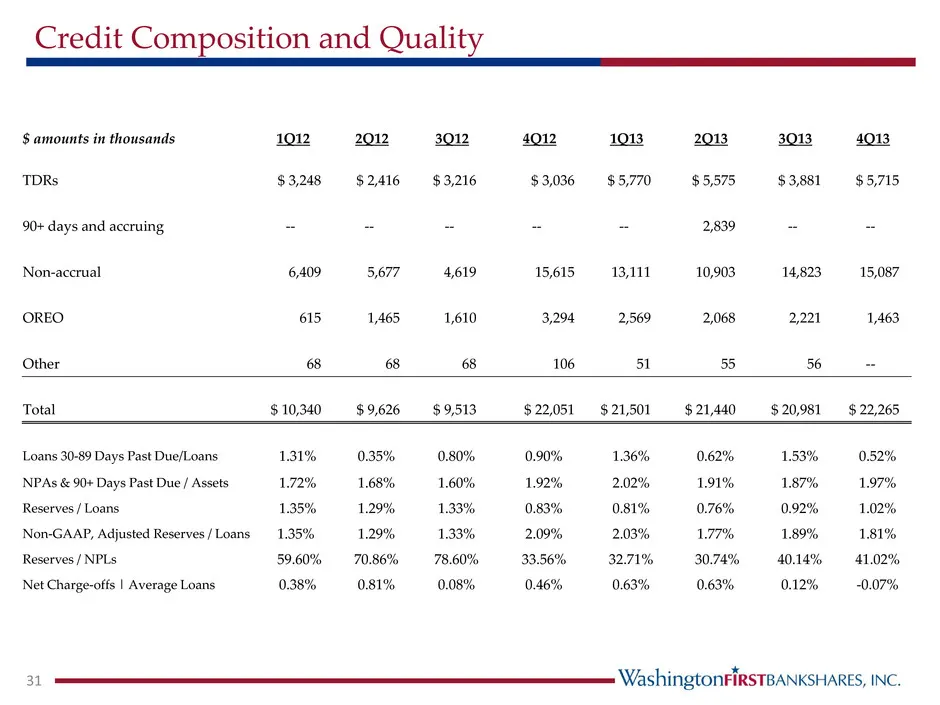
Credit Composition and Quality 31 $ amounts in thousands 1Q12 2Q12 3Q12 4Q12 1Q13 2Q13 3Q13 4Q13 TDRs $ 3,248 $ 2,416 $ 3,216 $ 3,036 $ 5,770 $ 5,575 $ 3,881 $ 5,715 90+ days and accruing -- -- -- -- -- 2,839 -- -- Non-accrual 6,409 5,677 4,619 15,615 13,111 10,903 14,823 15,087 OREO 615 1,465 1,610
Source: SEC EDGAR · 8-K filed Feb 3, 2014
More decks from WashingtonFirst Bankshares Inc
 KBW 2017 Community Bank Investor Conference43 slides · Jul 31, 2017
 Merger or Acquisition (May 2017)15 slides · May 16, 2017
 Shareholder Meeting (April 2017)21 slides · Apr 26, 2017
 Investor Presentation (February 2017)37 slides · Feb 10, 2017
 Investor Presentation (September 2016)31 slides · Sep 6, 2016
 Investor Presentation (August 2016)31 slides · Aug 17, 2016