Endurance Specialty Holdings Ltd
Endurance Specialty — Investor Presentation (November 2012)
30 slides from Endurance Specialty's investor presentation, Nov 15, 2012

Slide 1: Endurance Specialty Holdings Investor Presentation
Exhibit 99.1 Endurance Specialty Holdings Investor Presentation September 30, 2012
Slide 2: Forward-looking statements
Scme of the statemerts in this presentation may include forward-iookig statements which reflect our current views with respect to future evens and financial performance. Such statements include forward-looking statements both with respectto us in general and the insurance and ‘einsurance sectors spe
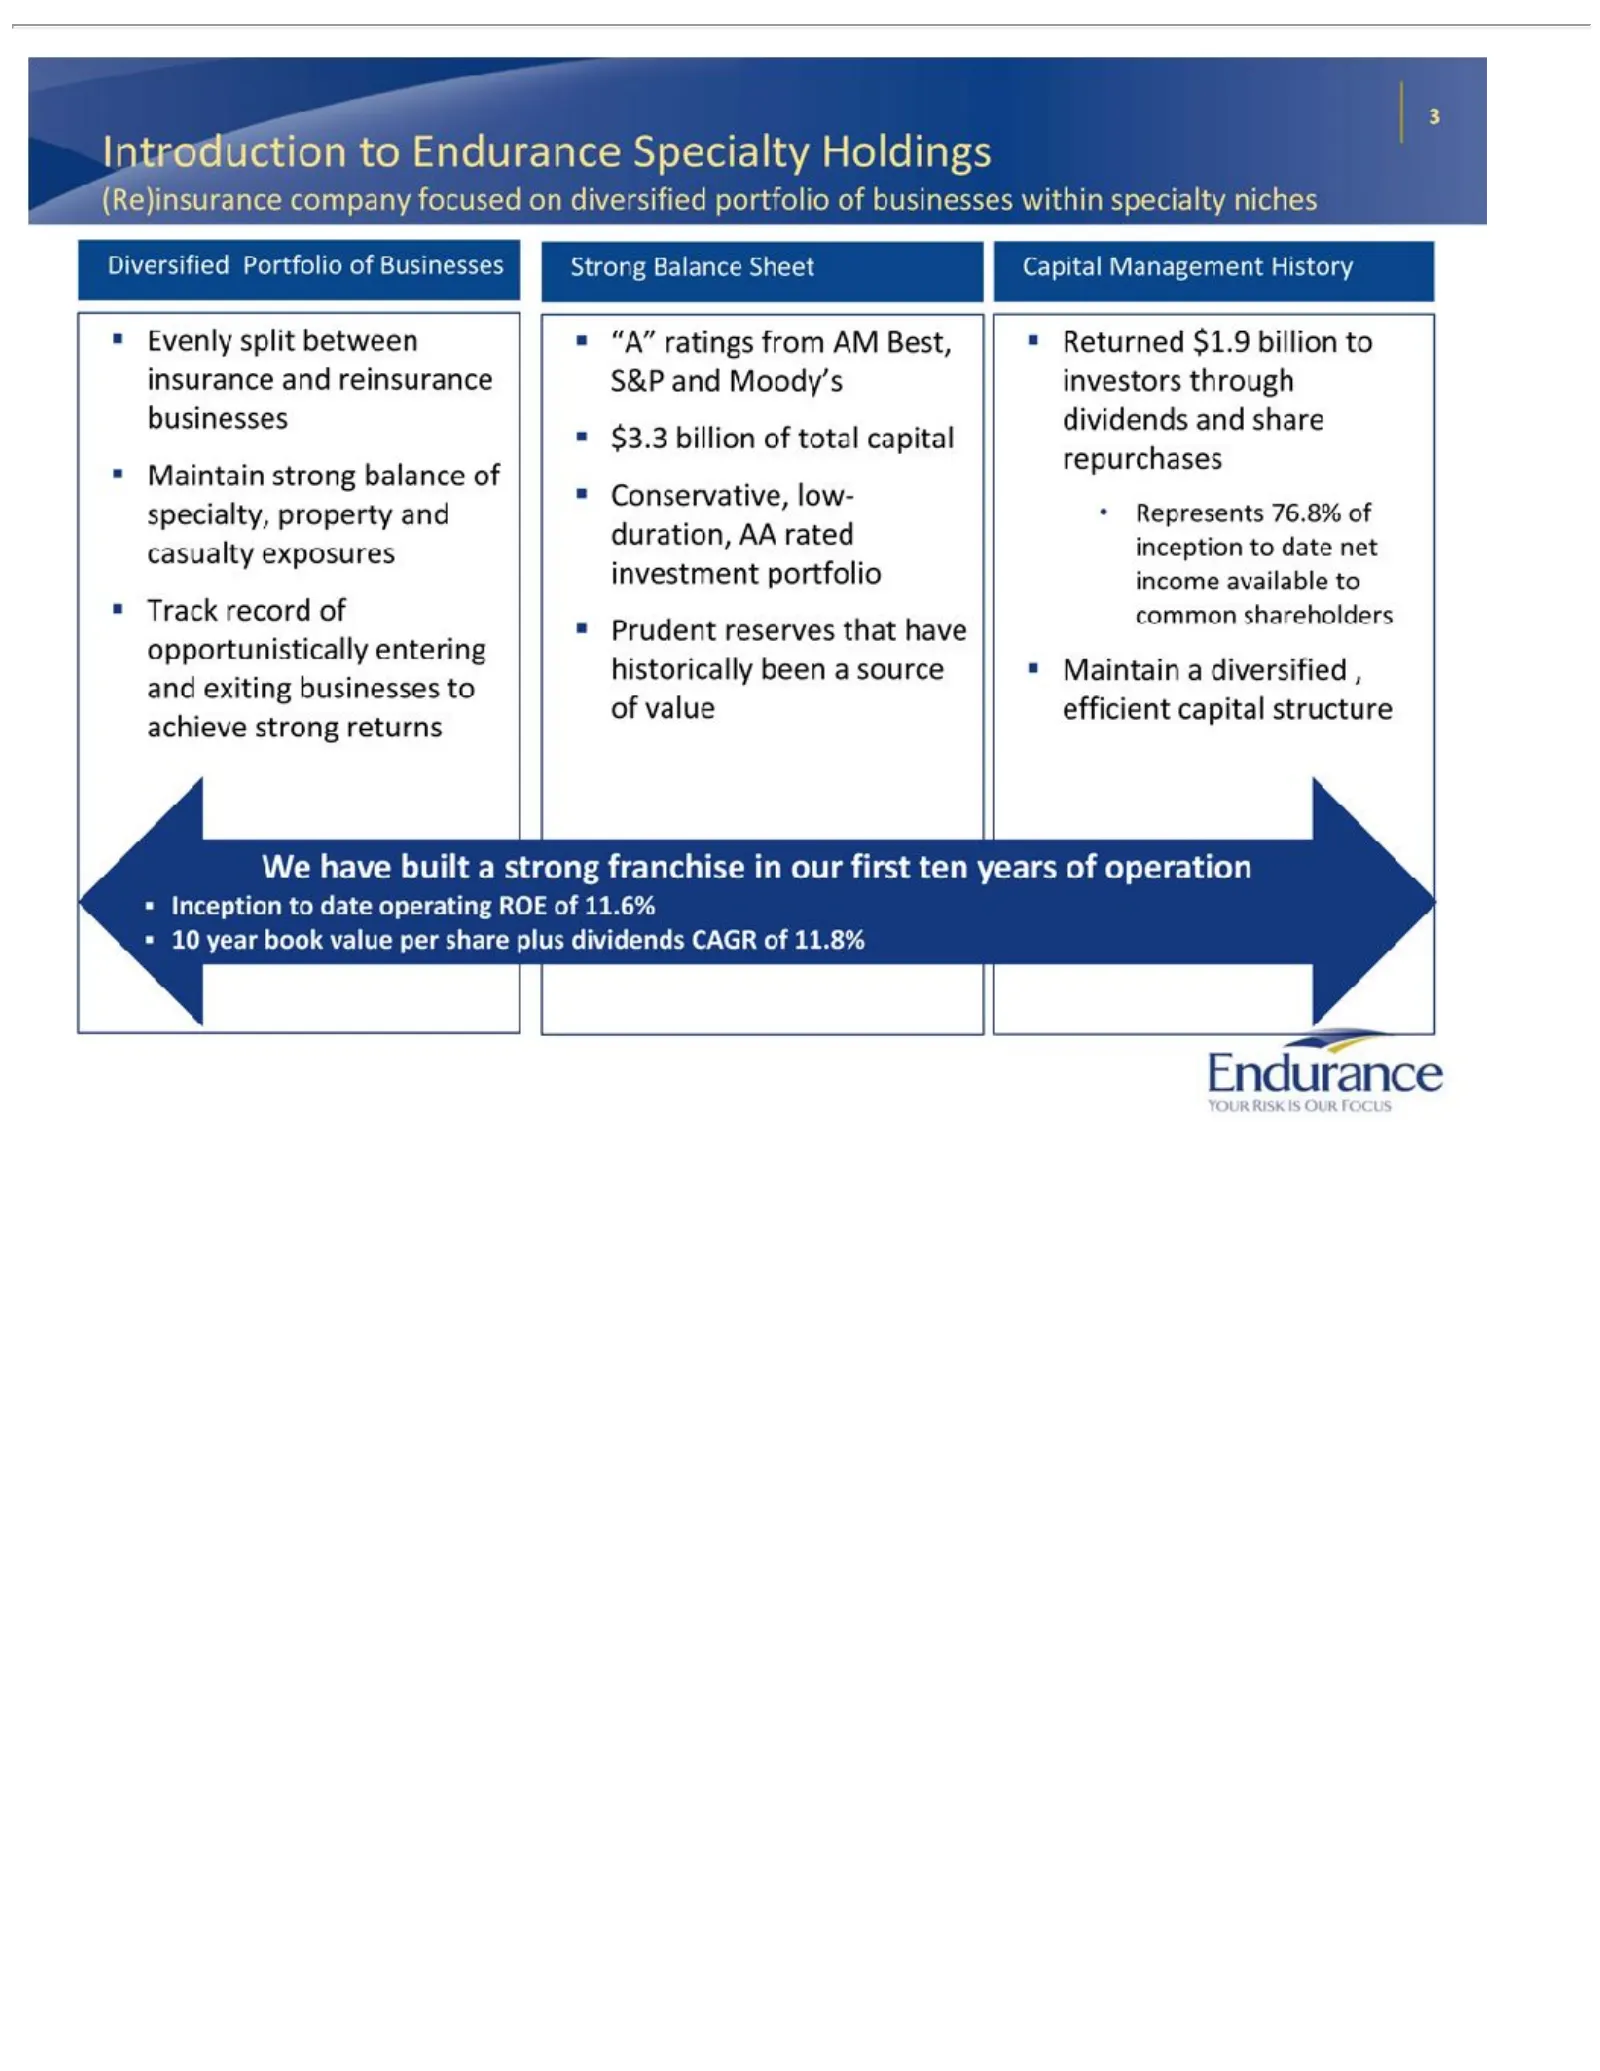
Slide 3: Strong franchise in our first ten years of operation
Diversified Portfolio of Businesses Strong Balance Sheet Capital Management History = Evenly split between insurance and reinsurance businesses * Maintain strong balance of specialty, property and casualty exposures * Track record of opportunistically entering and exiting businesses to achieve stron
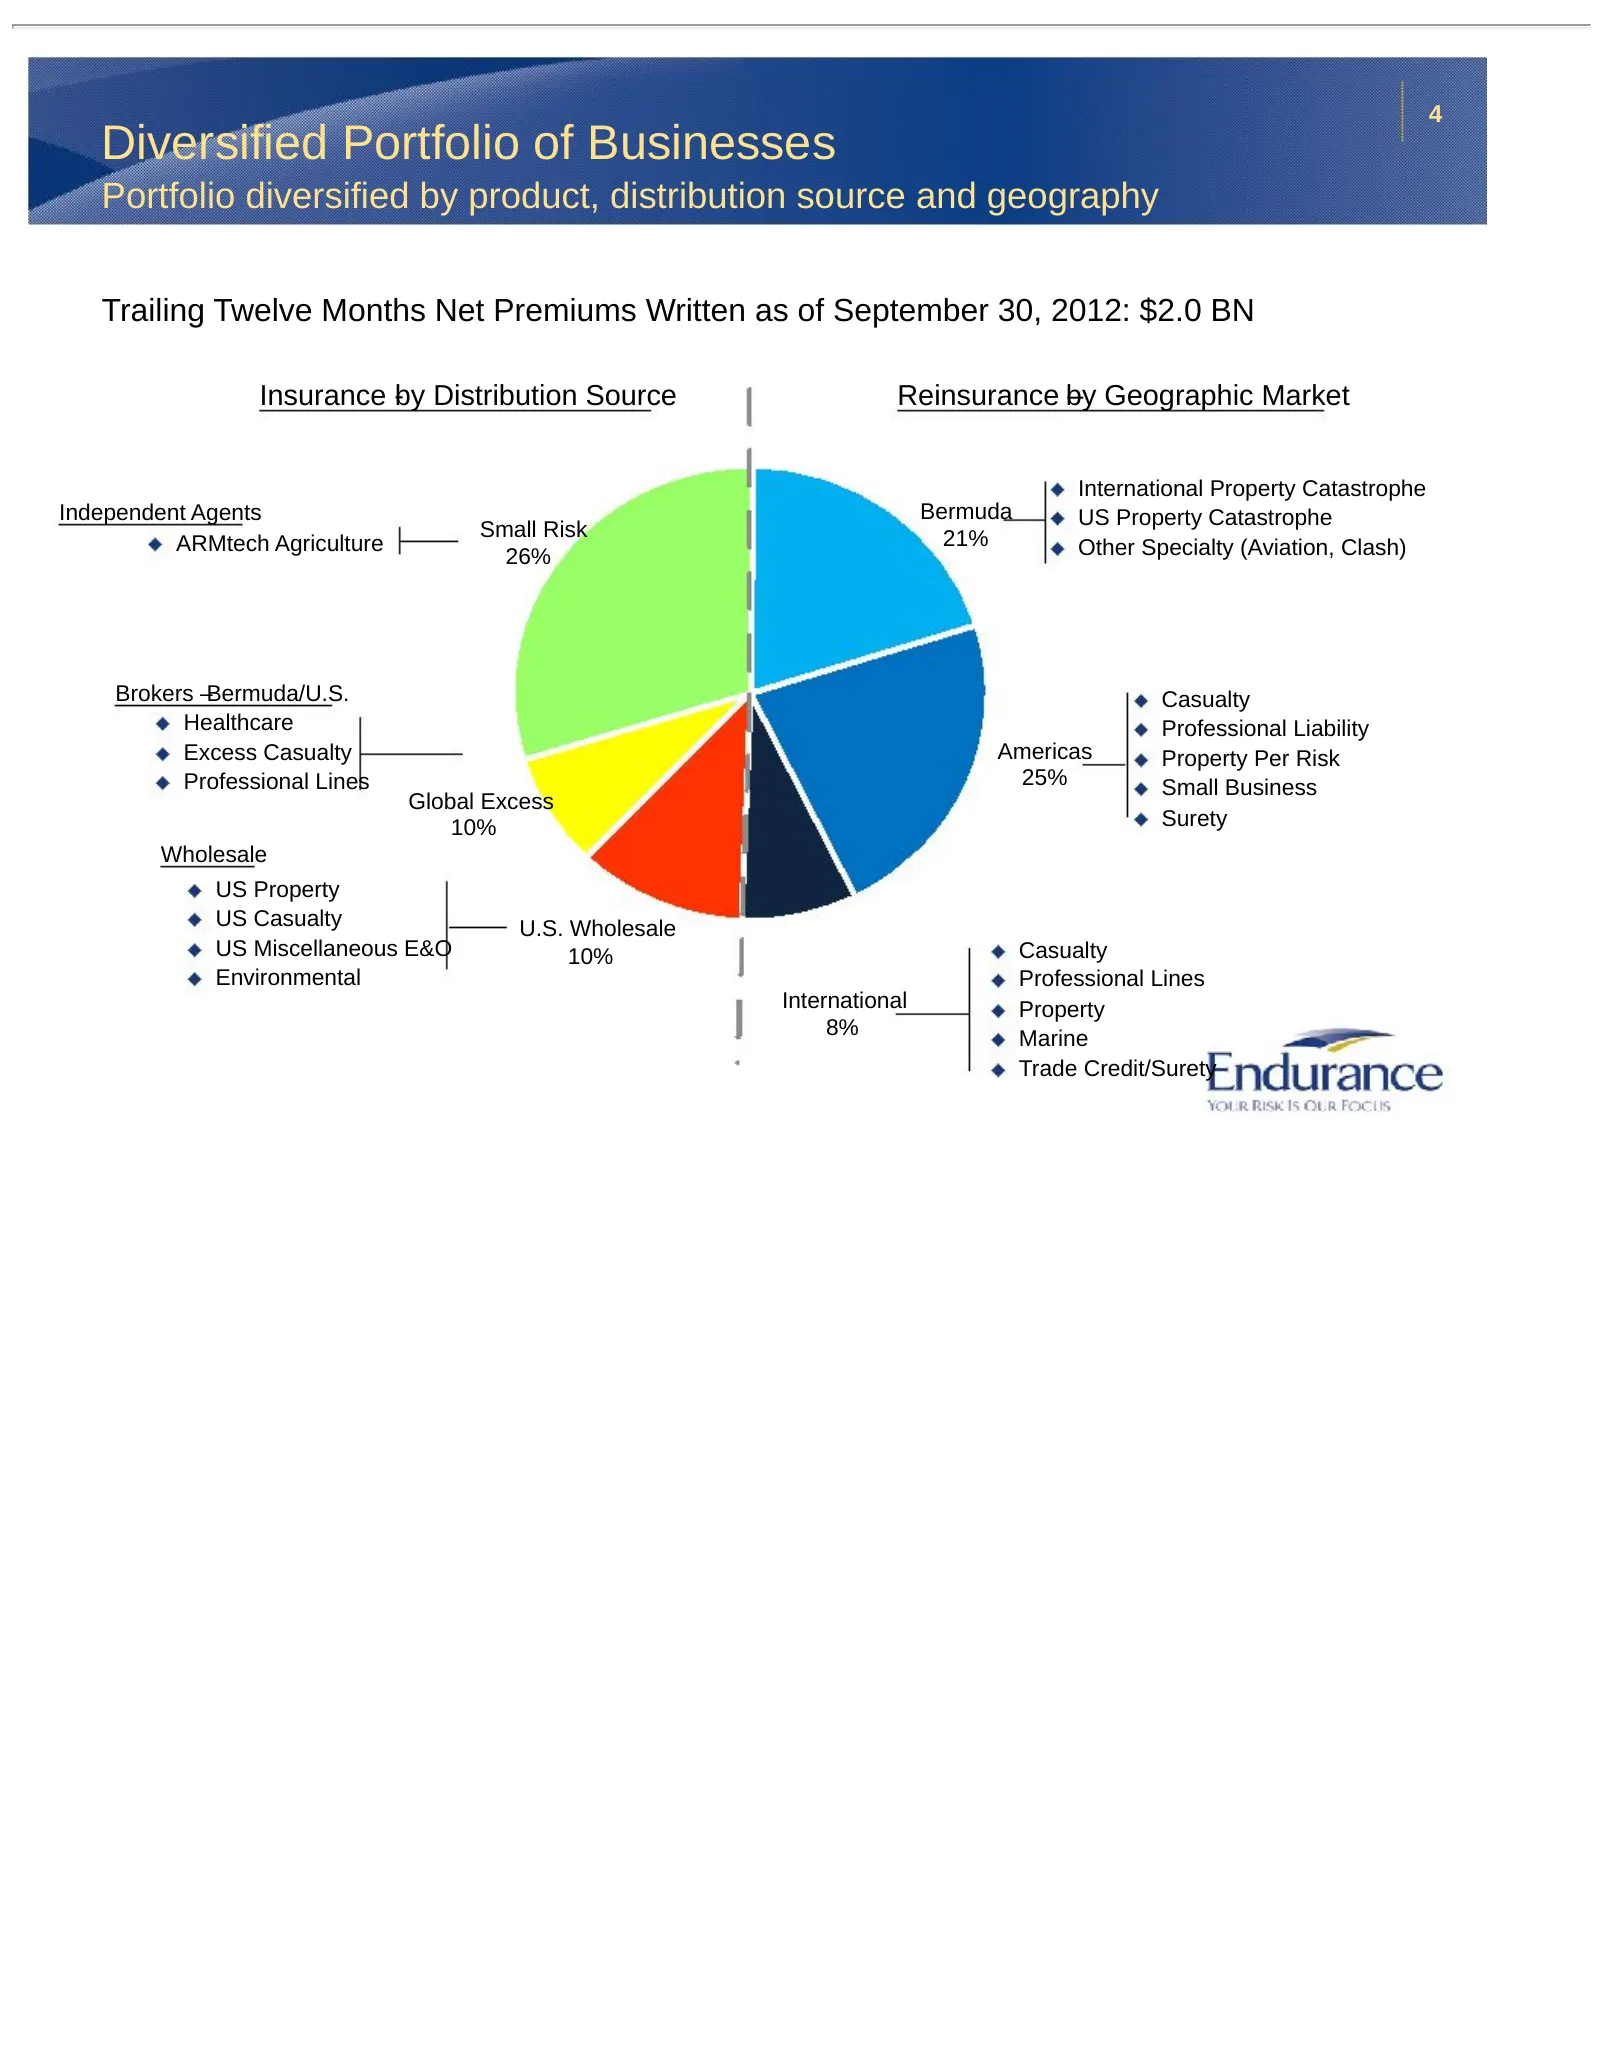
Slide 4: Diversified Portfolio of Businesses
4 Diversified Portfolio of Businesses Portfolio diversified by product, distribution source and geography Trailing Twelve Months Net Premiums Written as of September 30, 2012: $2.0 BN Insurance -by Distribution Source Reinsurance b –y Geographic Market International Property Catastrophe Independent
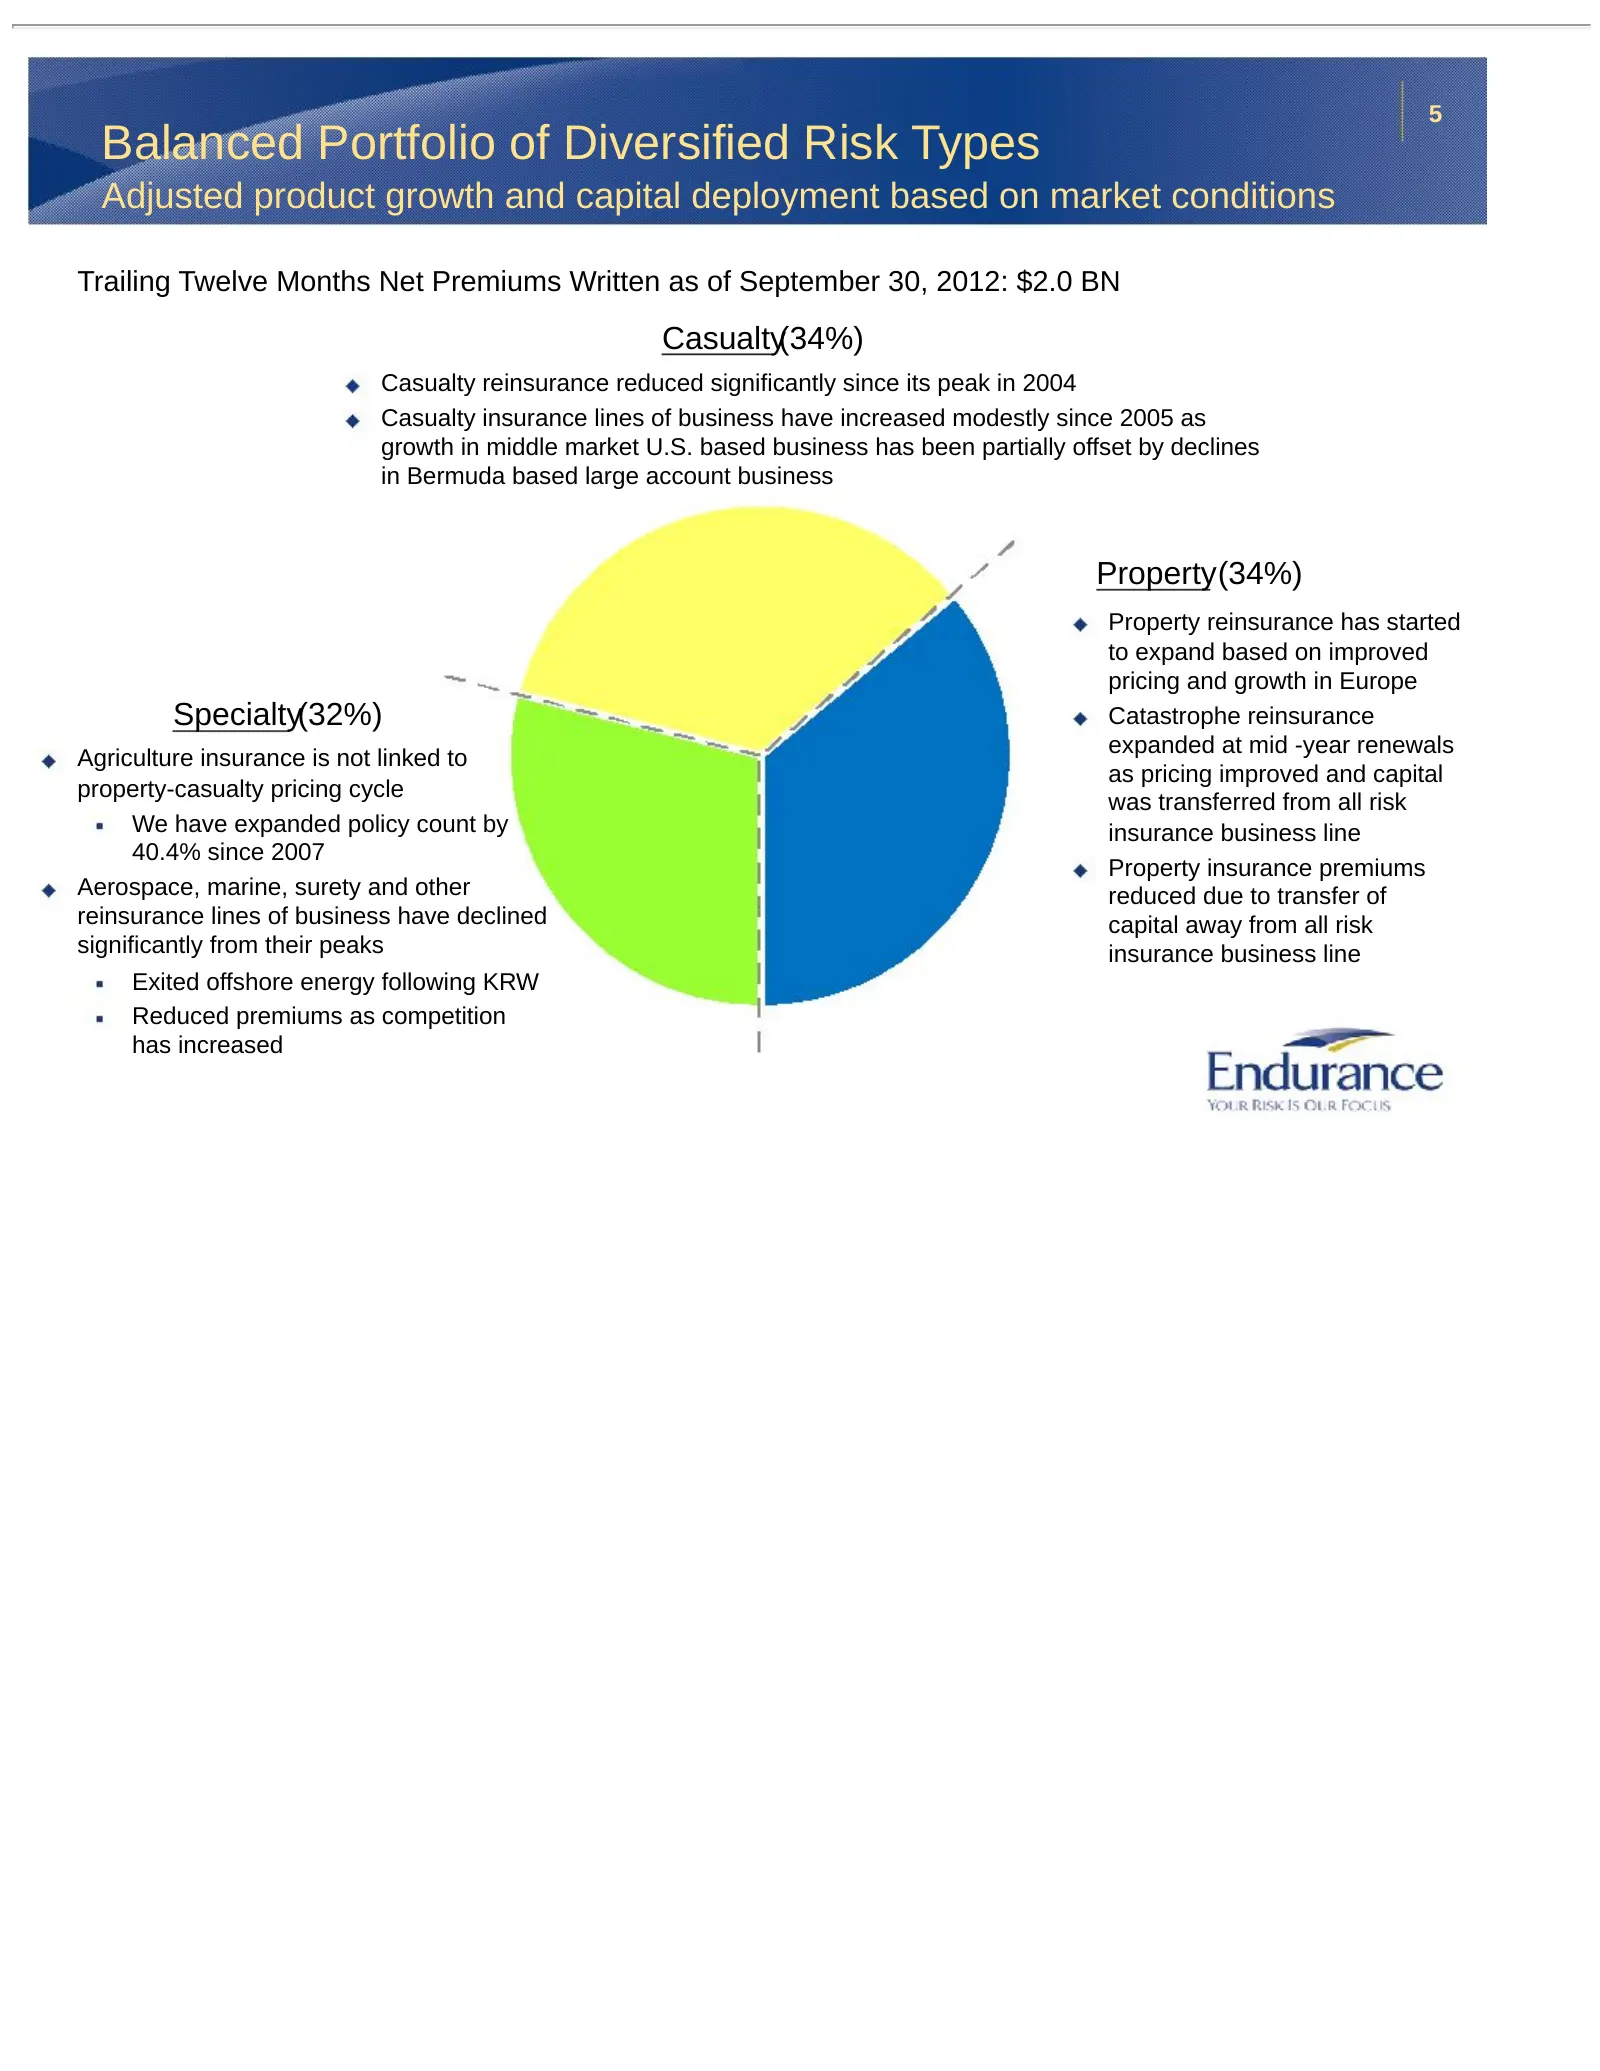
Slide 5: Balanced Portfolio of Diversified Risk Types
5 Balanced Portfolio of Diversified Risk Types Adjusted product growth and capital deployment based on market conditions Trailing Twelve Months Net Premiums Written as of September 30, 2012: $2.0 BN Casualty(34%) Casualty reinsurance reduced significantly since its peak in 2004 Casualty insurance li
Slide 6: Opportunistic Reinsurance Portfolio Management
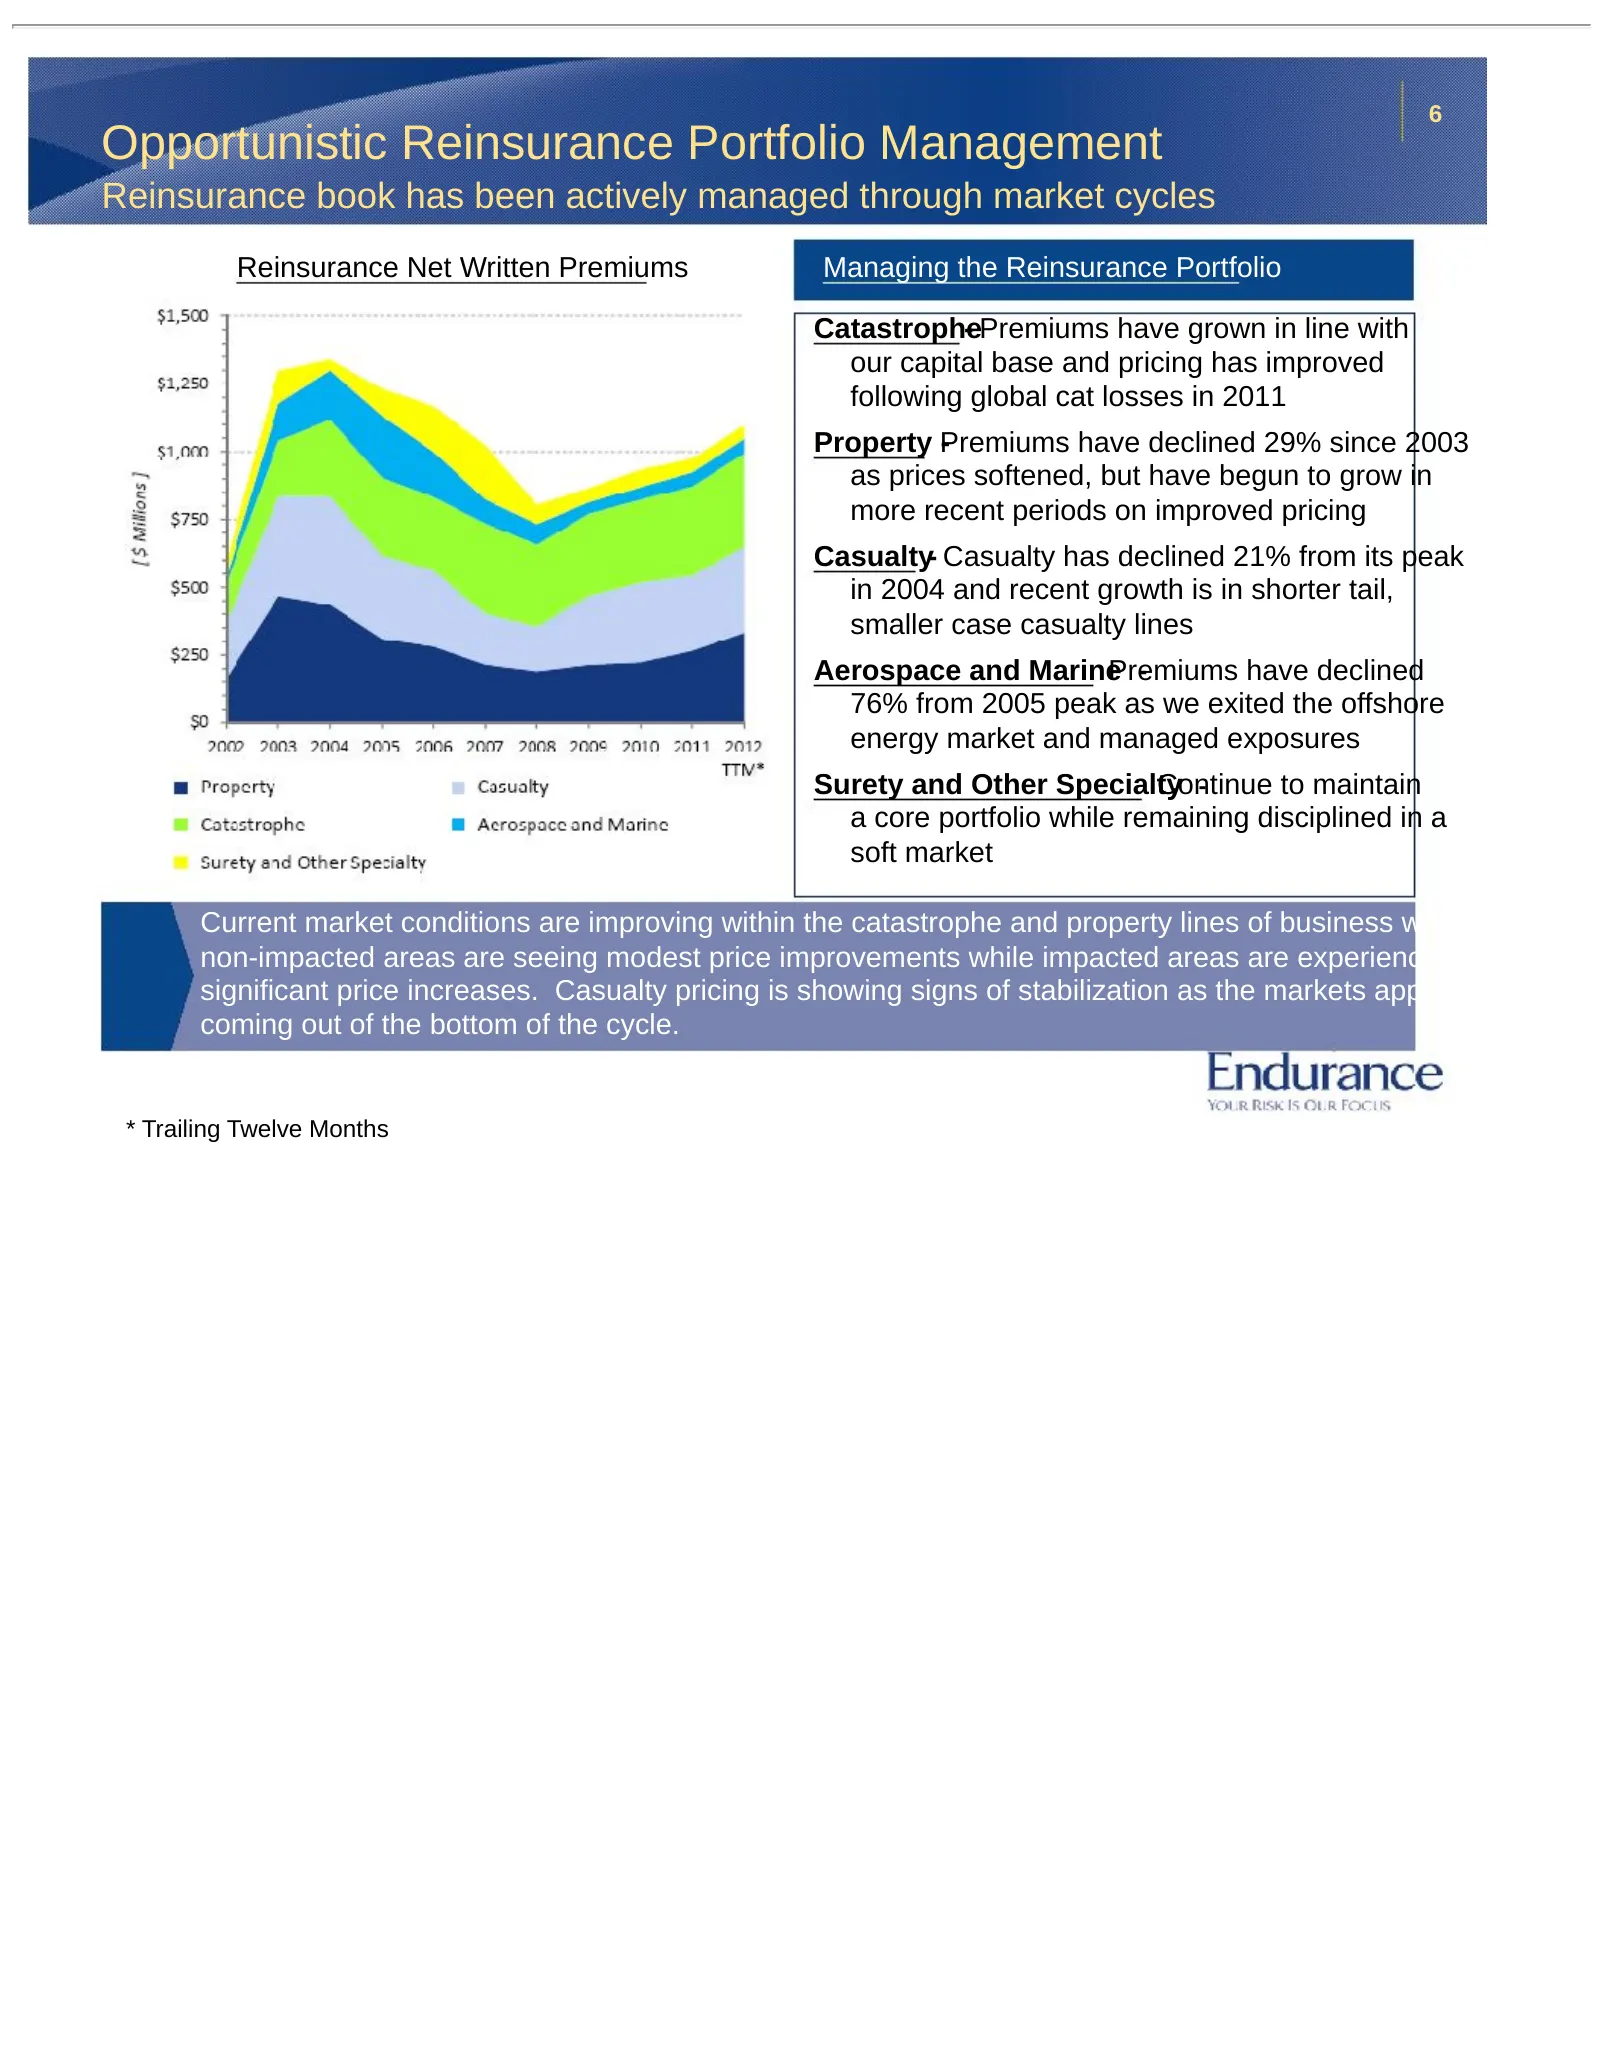
6 Opportunistic Reinsurance Portfolio Management Reinsurance book has been actively managed through market cycles Reinsurance Net Written Premiums Managing the Reinsurance Portfolio Catastrophe- Premiums have grown in line with our capital base and pricing has improved following global cat losses in
Slide 7: Diversified Insurance Portfolio
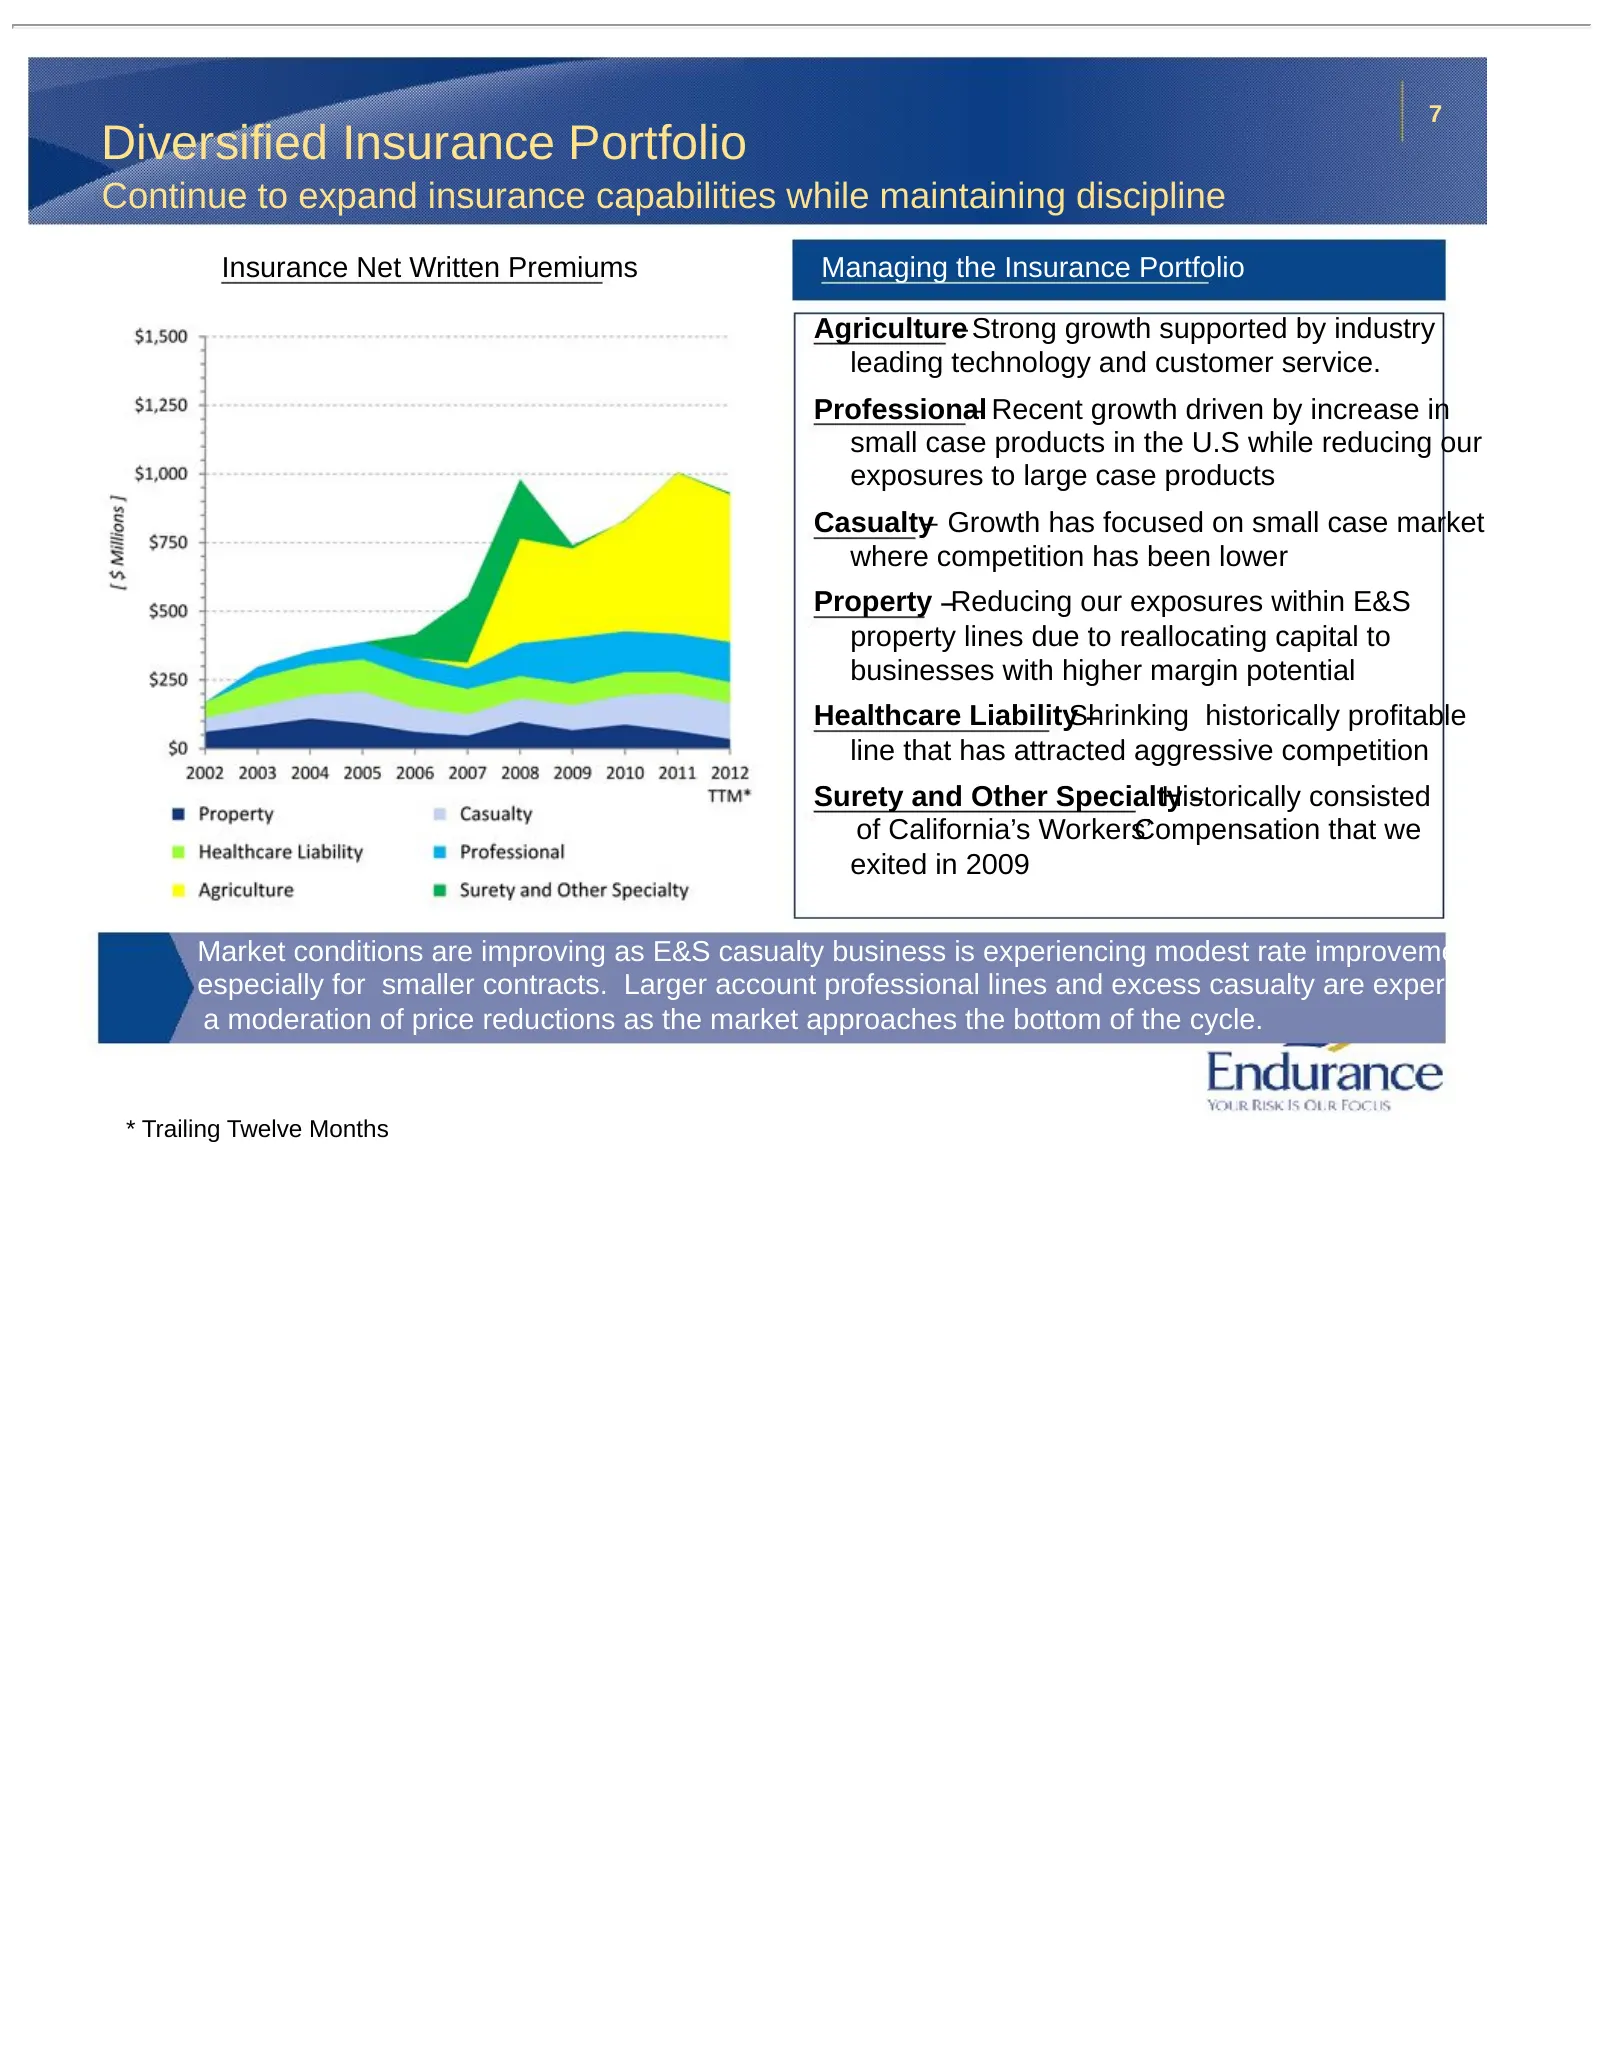
7 Diversified Insurance Portfolio Continue to expand insurance capabilities while maintaining discipline Insurance Net Written Premiums Managing the Insurance Portfolio Agriculture – Strong growth supported by industry leading technology and customer service. Professional – Recent growth driven by i
Slide 8: Endurance is World Class at Risk Management
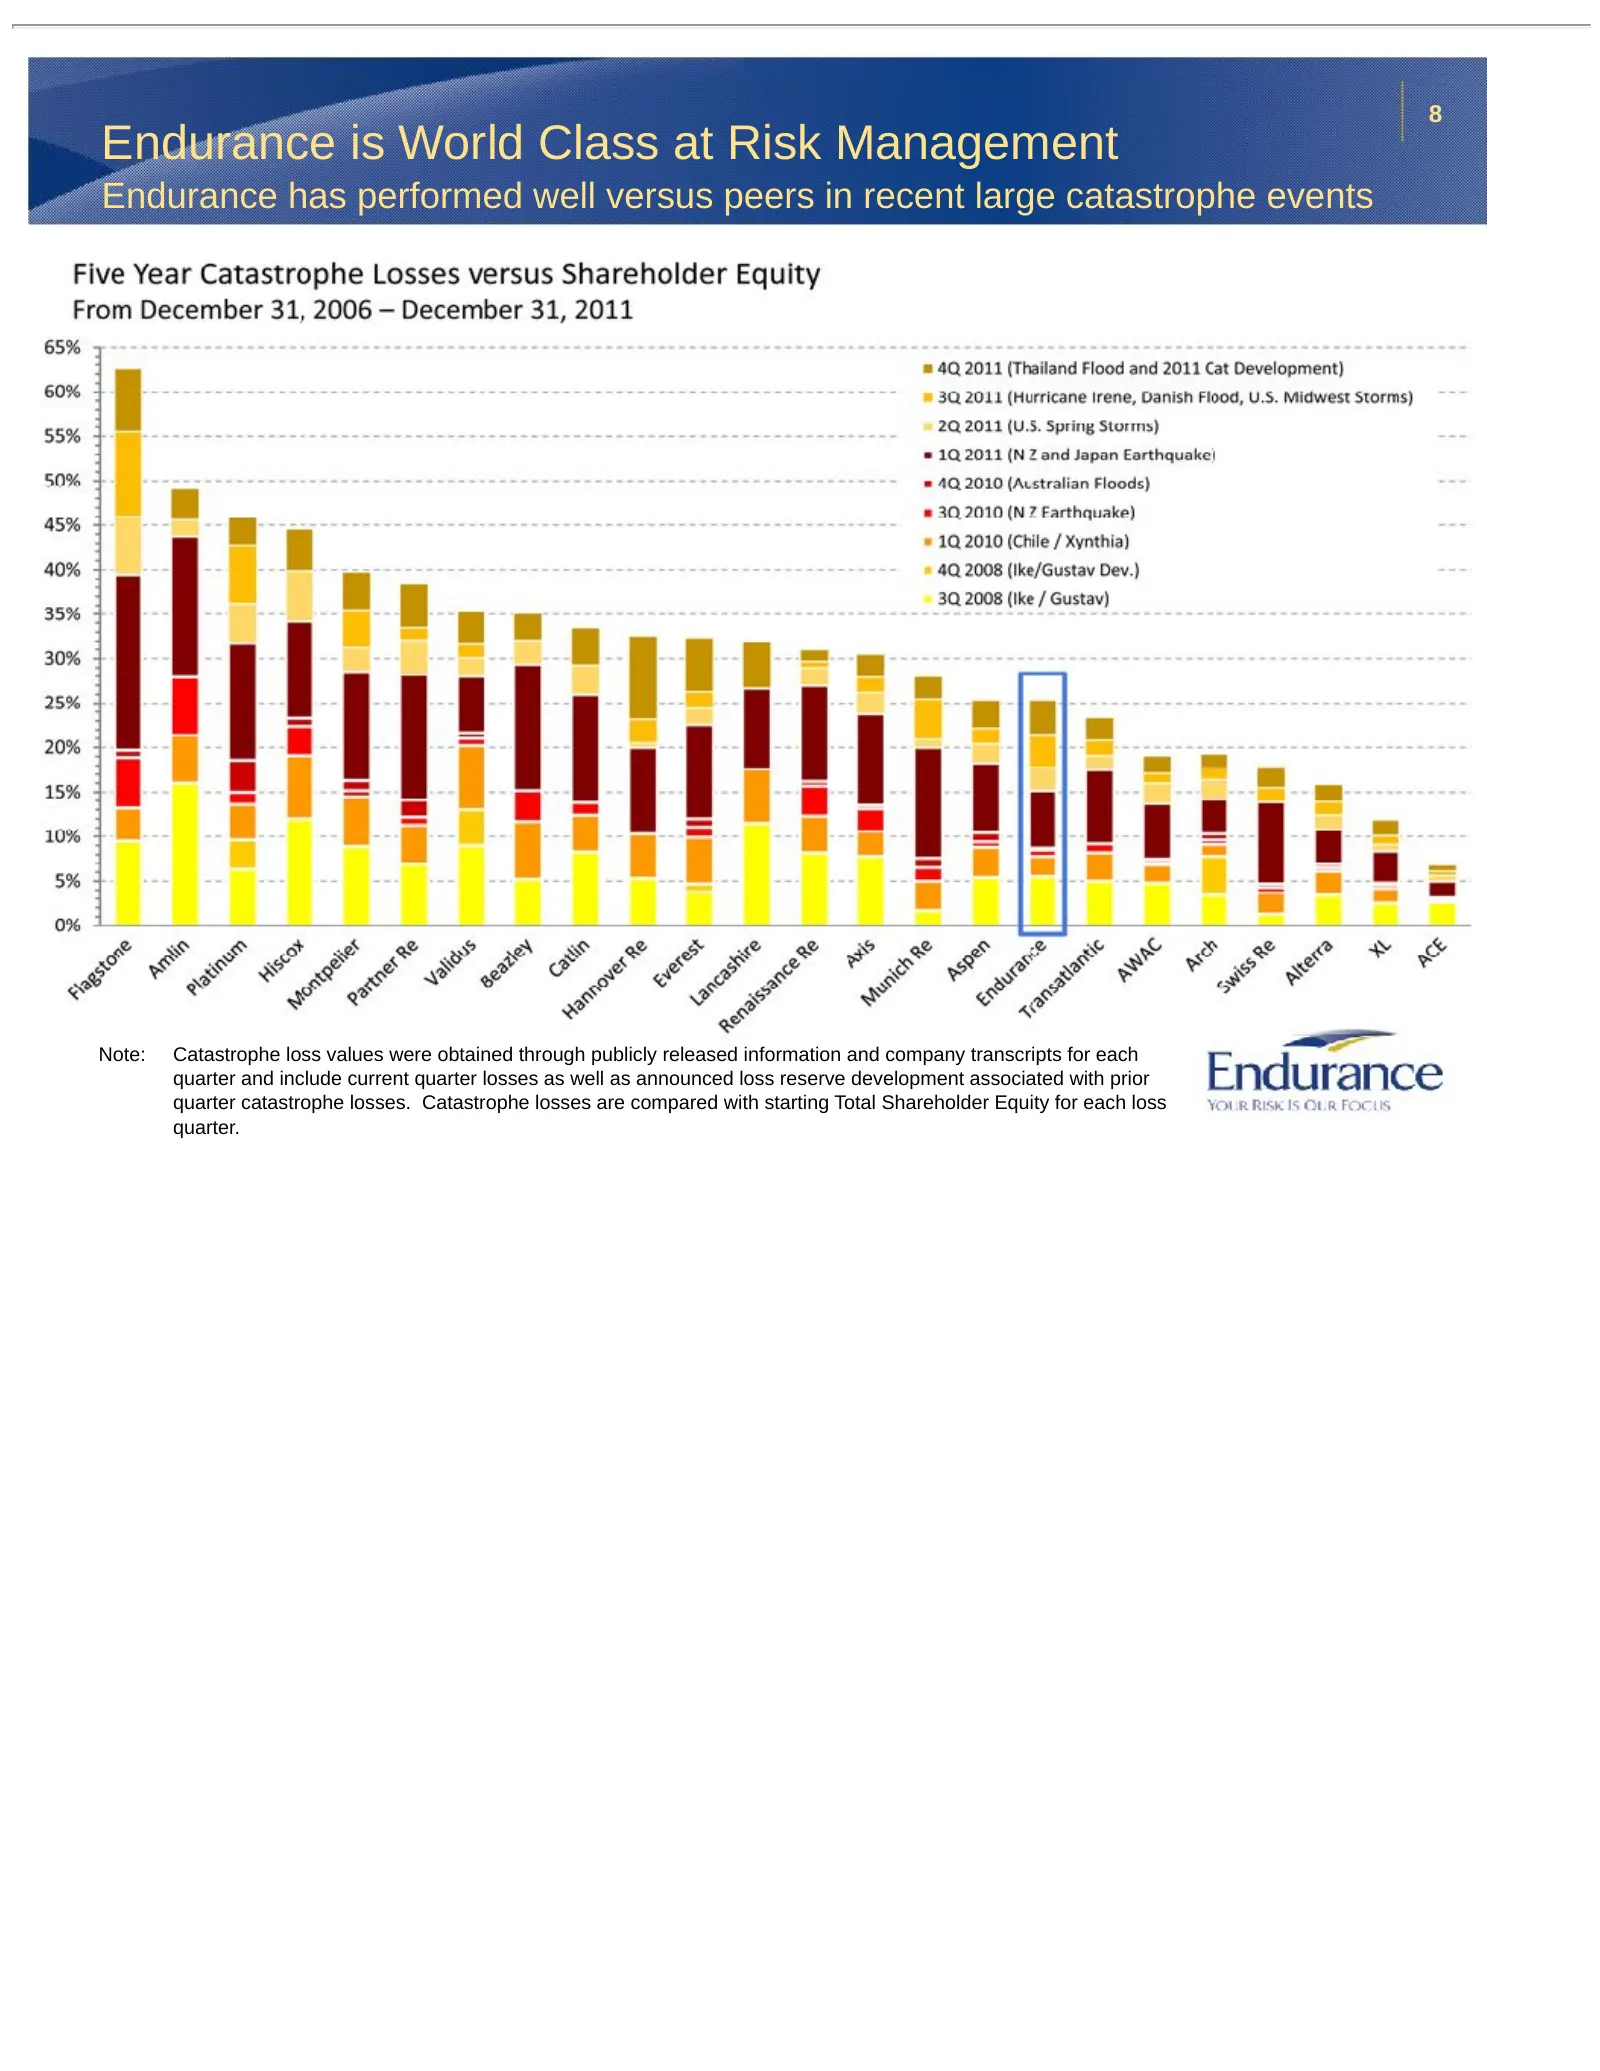
8 Endurance is World Class at Risk Management Endurance has performed well versus peers in recent large catastrophe events Note: Catastrophe loss values were obtained through publicly released information and company transcripts for each quarter and include current quarter losses as well as announce
Slide 9: Endurance's Financial Results
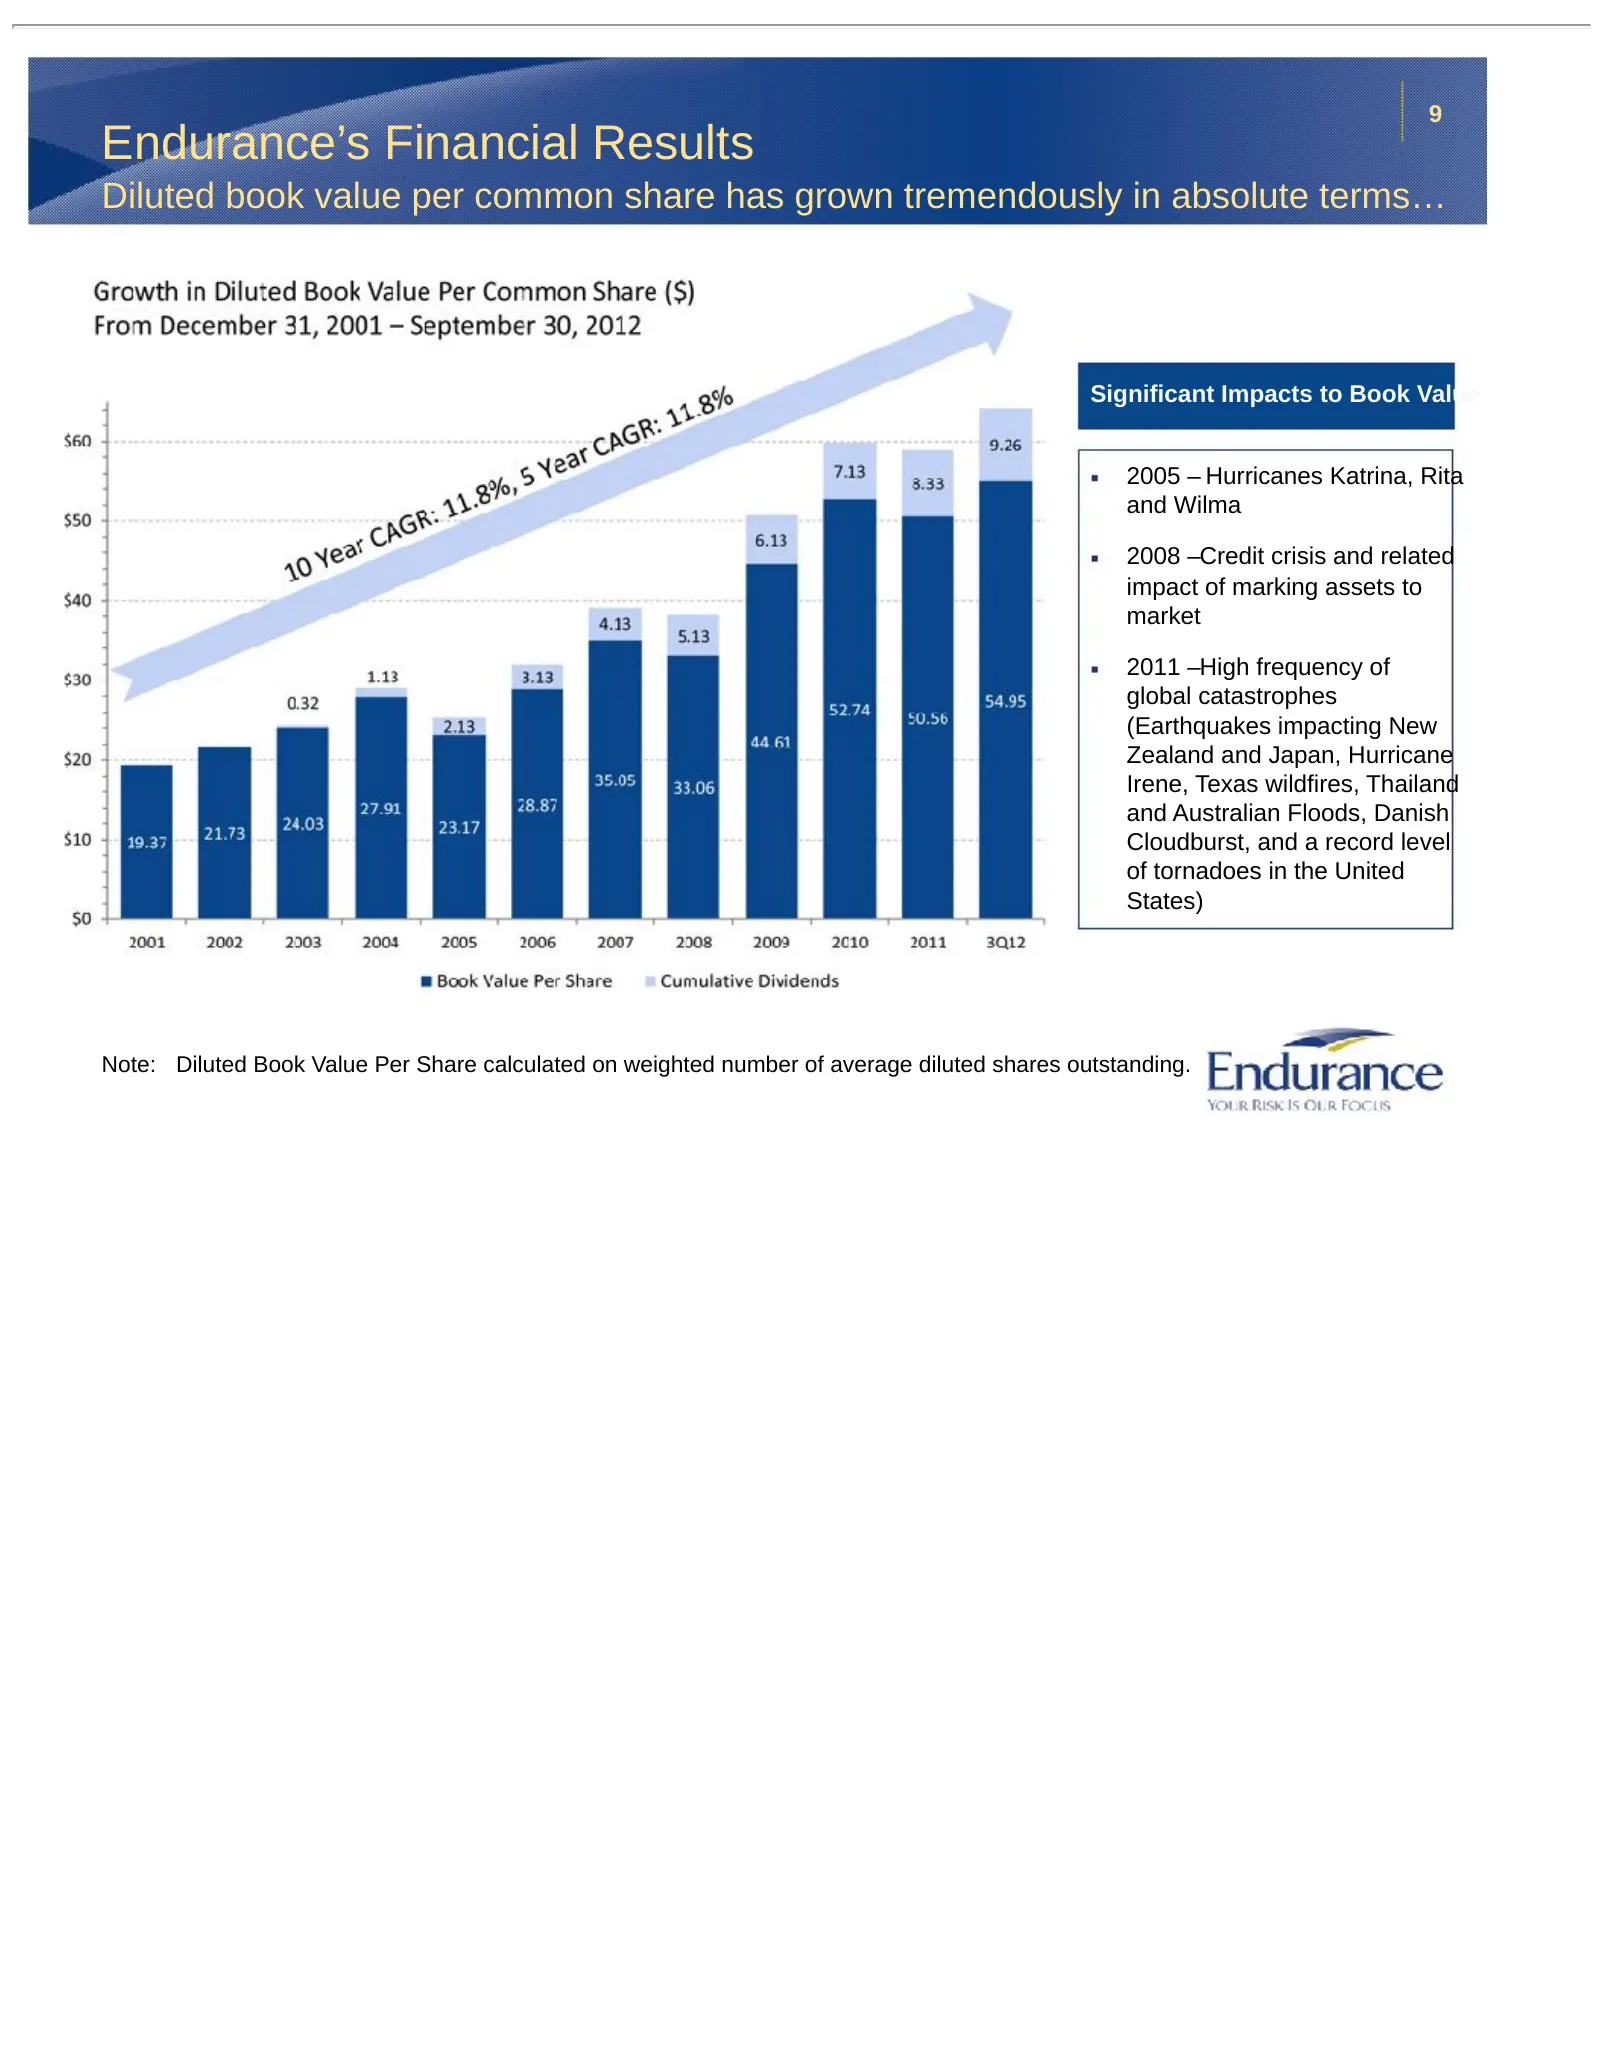
9 Endurance’s Financial Results Diluted book value per common share has grown tremendously in absolute terms… Significant Impacts to Book Value 2005 – Hurricanes Katrina, Rita and Wilma 2008 –Credit crisis and related impact of marking assets to market 2011 –High frequency of global catastrophes (Ea
Slide 10: Endurance's Financial Results
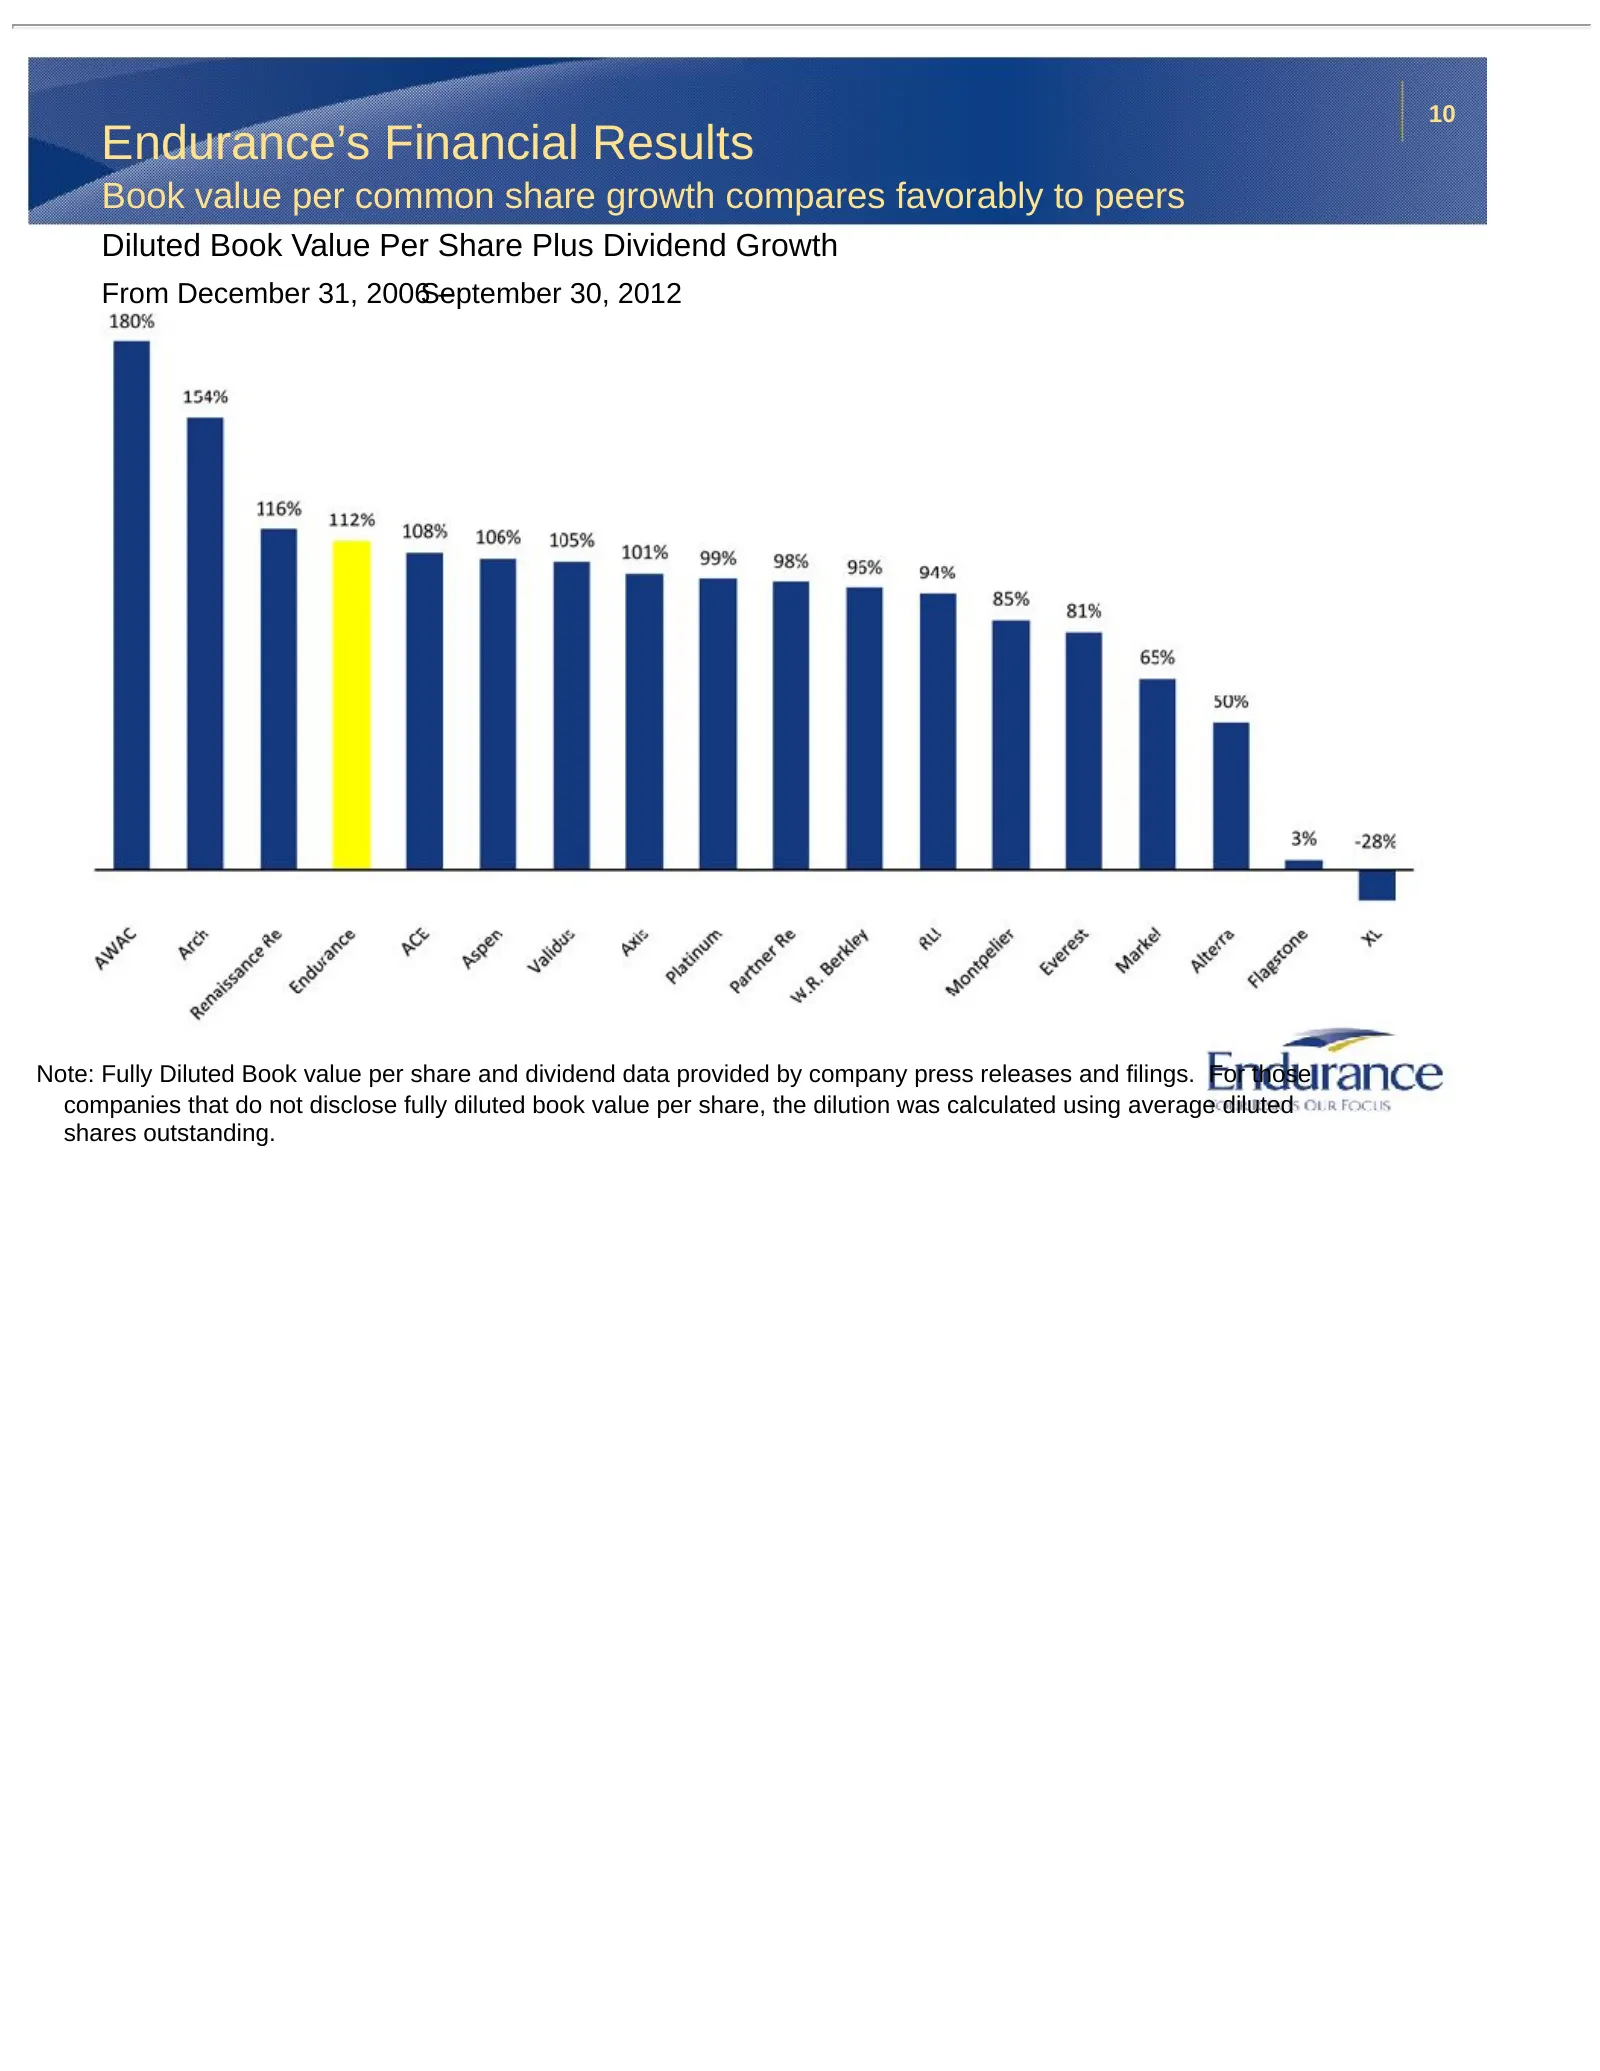
10 Endurance’s Financial Results Book value per common share growth compares favorably to peers Diluted Book Value Per Share Plus Dividend Growth From December 31, 2006September – 30, 2012 Note: Fully Diluted Book value per share and dividend data provided by company press releases and filings. For
Slide 11: Growing Capital Base while returning Capital to Investors
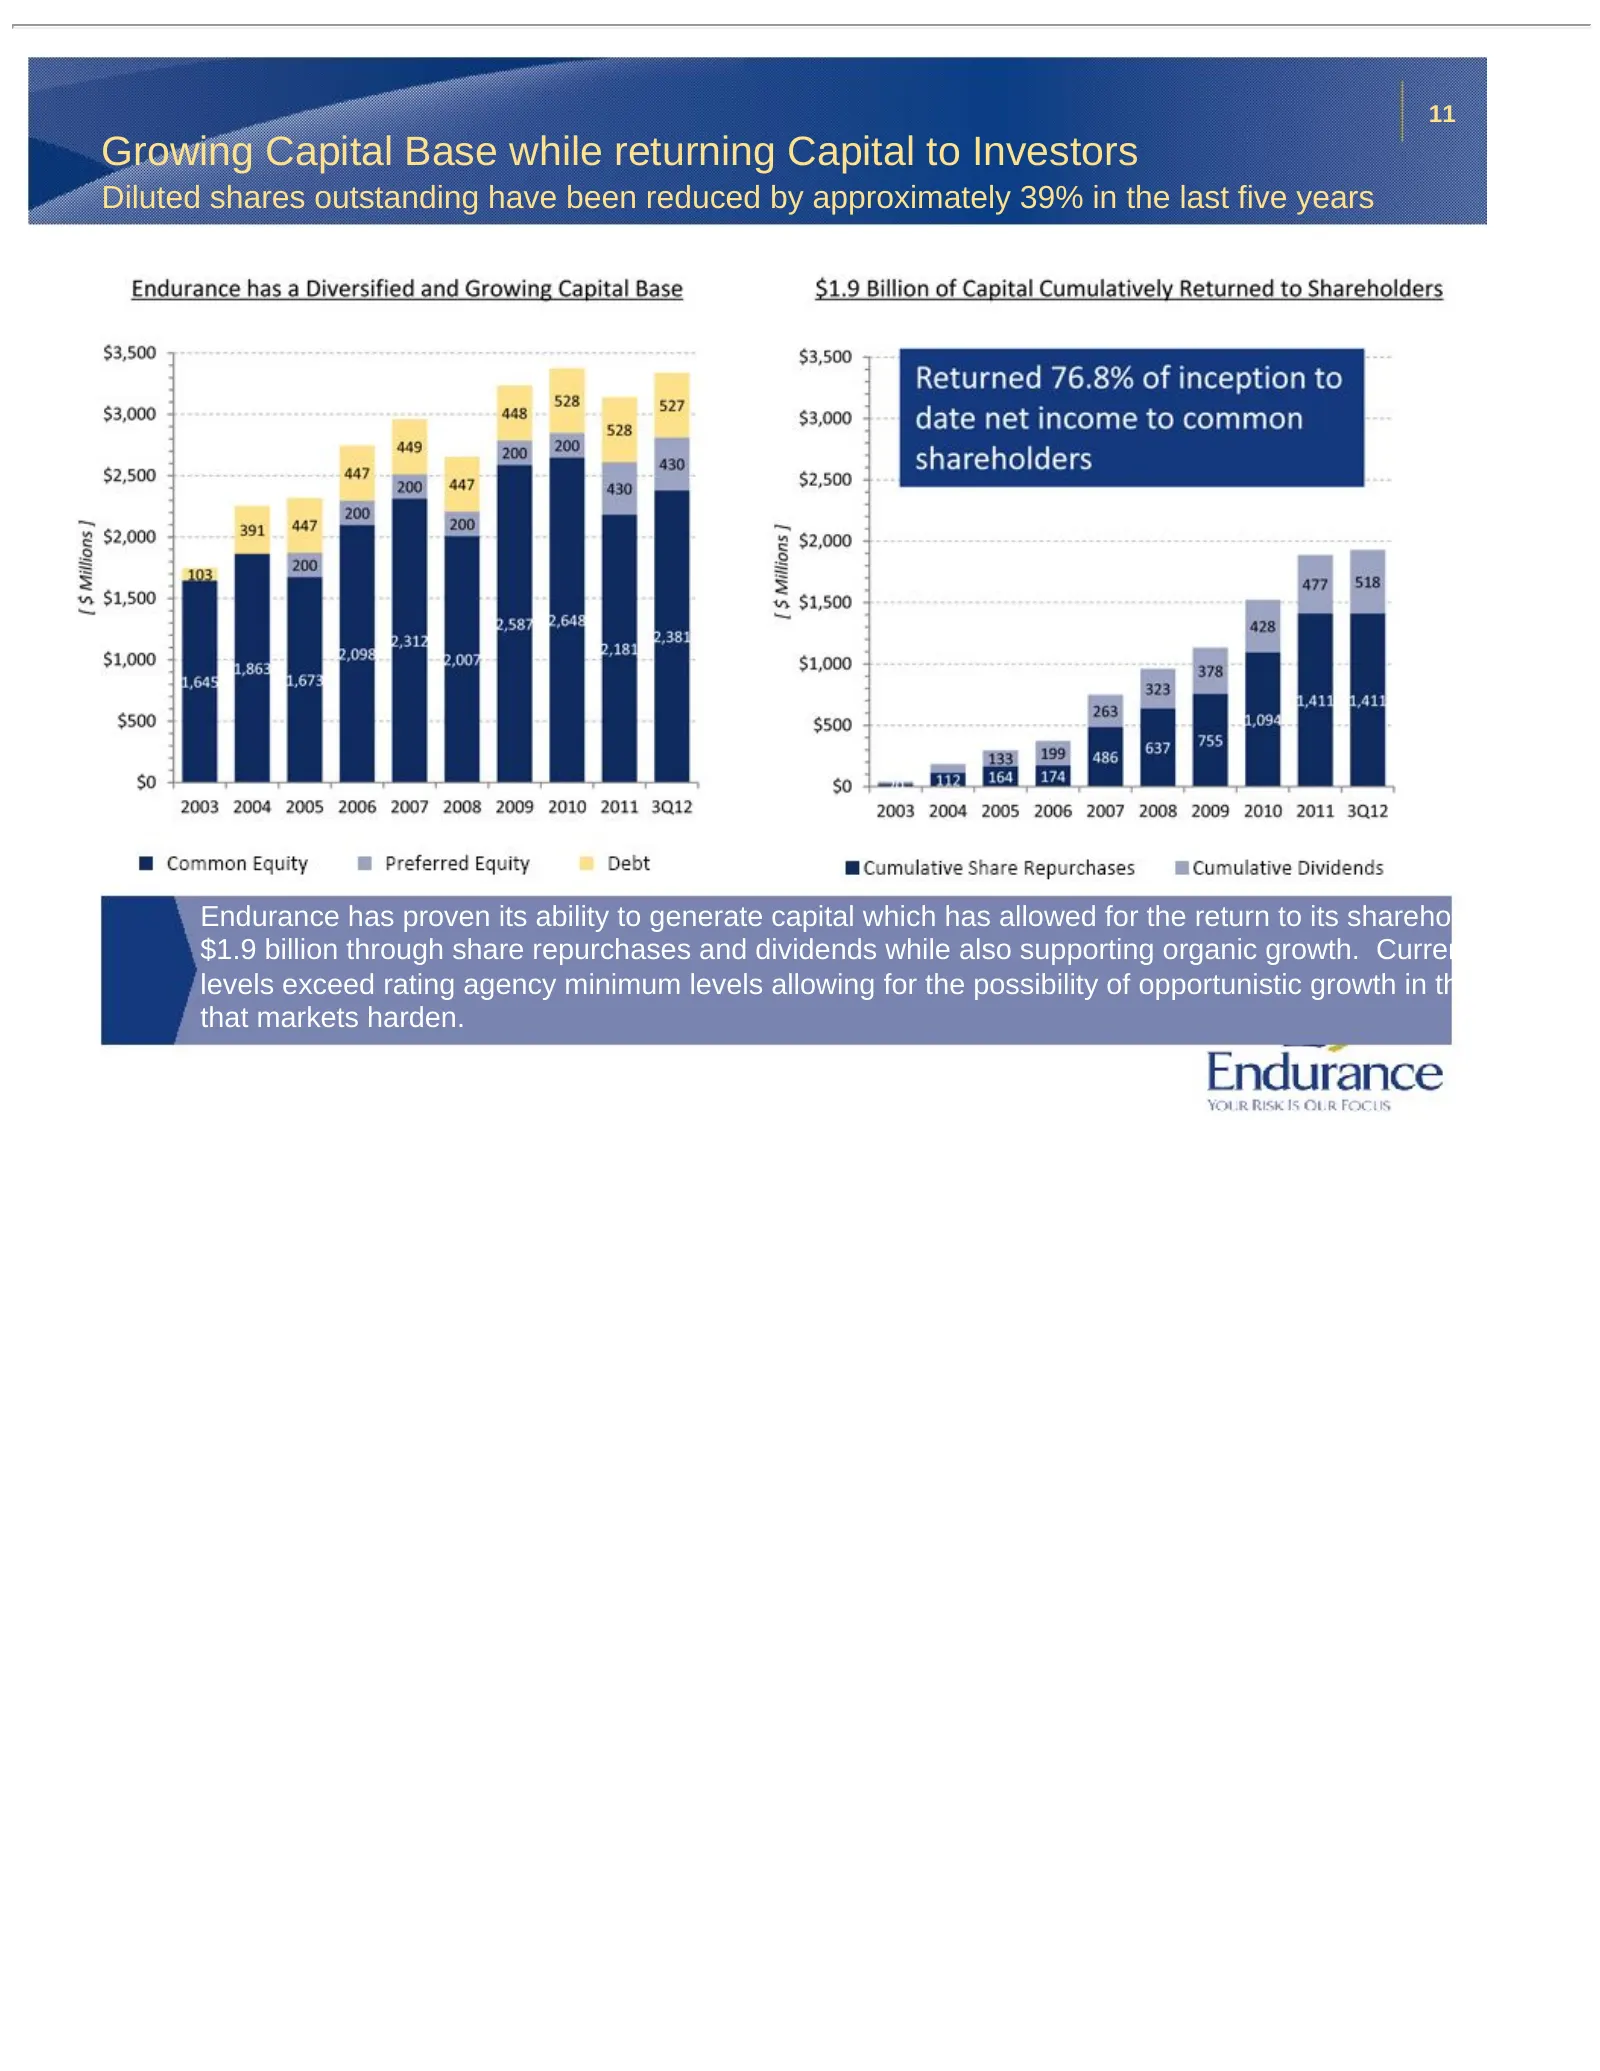
11 Growing Capital Base while returning Capital to Investors Diluted shares outstanding have been reduced by approximately 39% in the last five years Endurance has proven its ability to generate capital which has allowed for the return to its shareholders of $1.9 billion through share repurchases an
Slide 12: Strong Balance Sheet
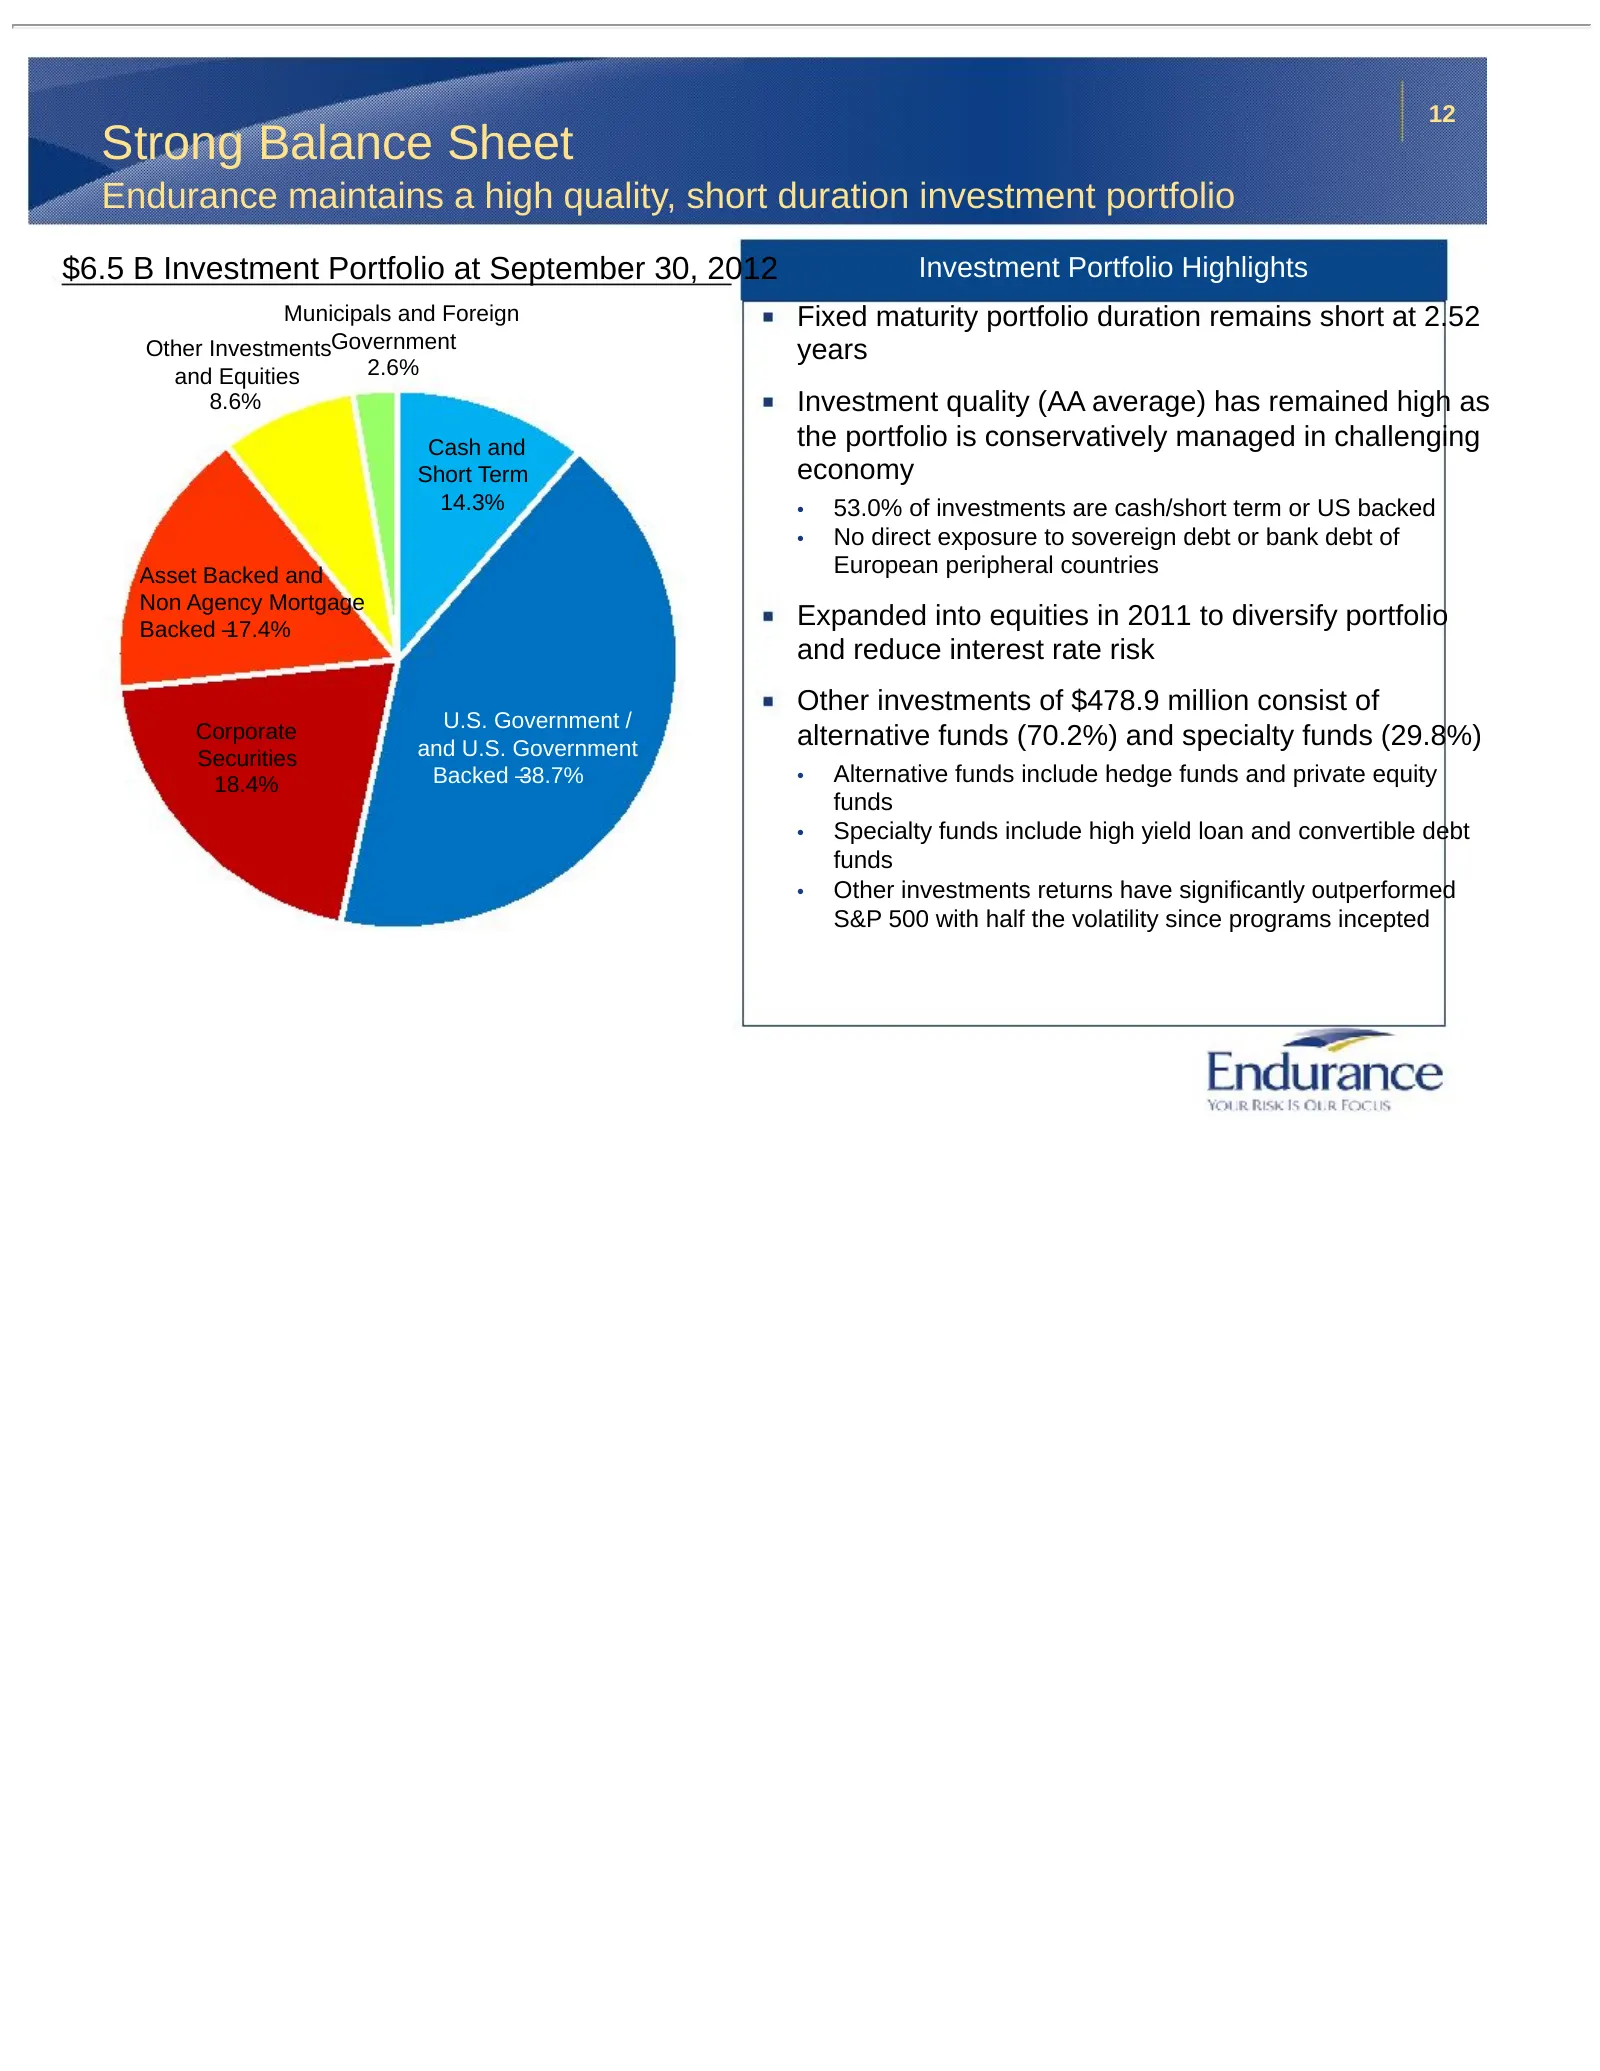
12 Strong Balance Sheet Endurance maintains a high quality, short duration investment portfolio $6.5 B Investment Portfolio at September 30, 2012 Investment Portfolio Highlights Municipals and Foreign Fixed maturity portfolio duration remains short at 2.52 Other InvestmentsGovernment years and Equit
Slide 13: Conclusion
13 Conclusion Endurance is a compelling investment opportunity Strategically manage our businesses • Selectively reduced reinsurance premiums, especially in competitive longer tail lines • Shifted capital from all risk insurance business line to property catastrophe reinsurance business line • Effic

Slide 14: Appendix
Appendix ——— Endurance

Slide 15: Overview of ARMtech
Overview of ARMtech —aa Endurance
Slide 16: Overview of ARMtech
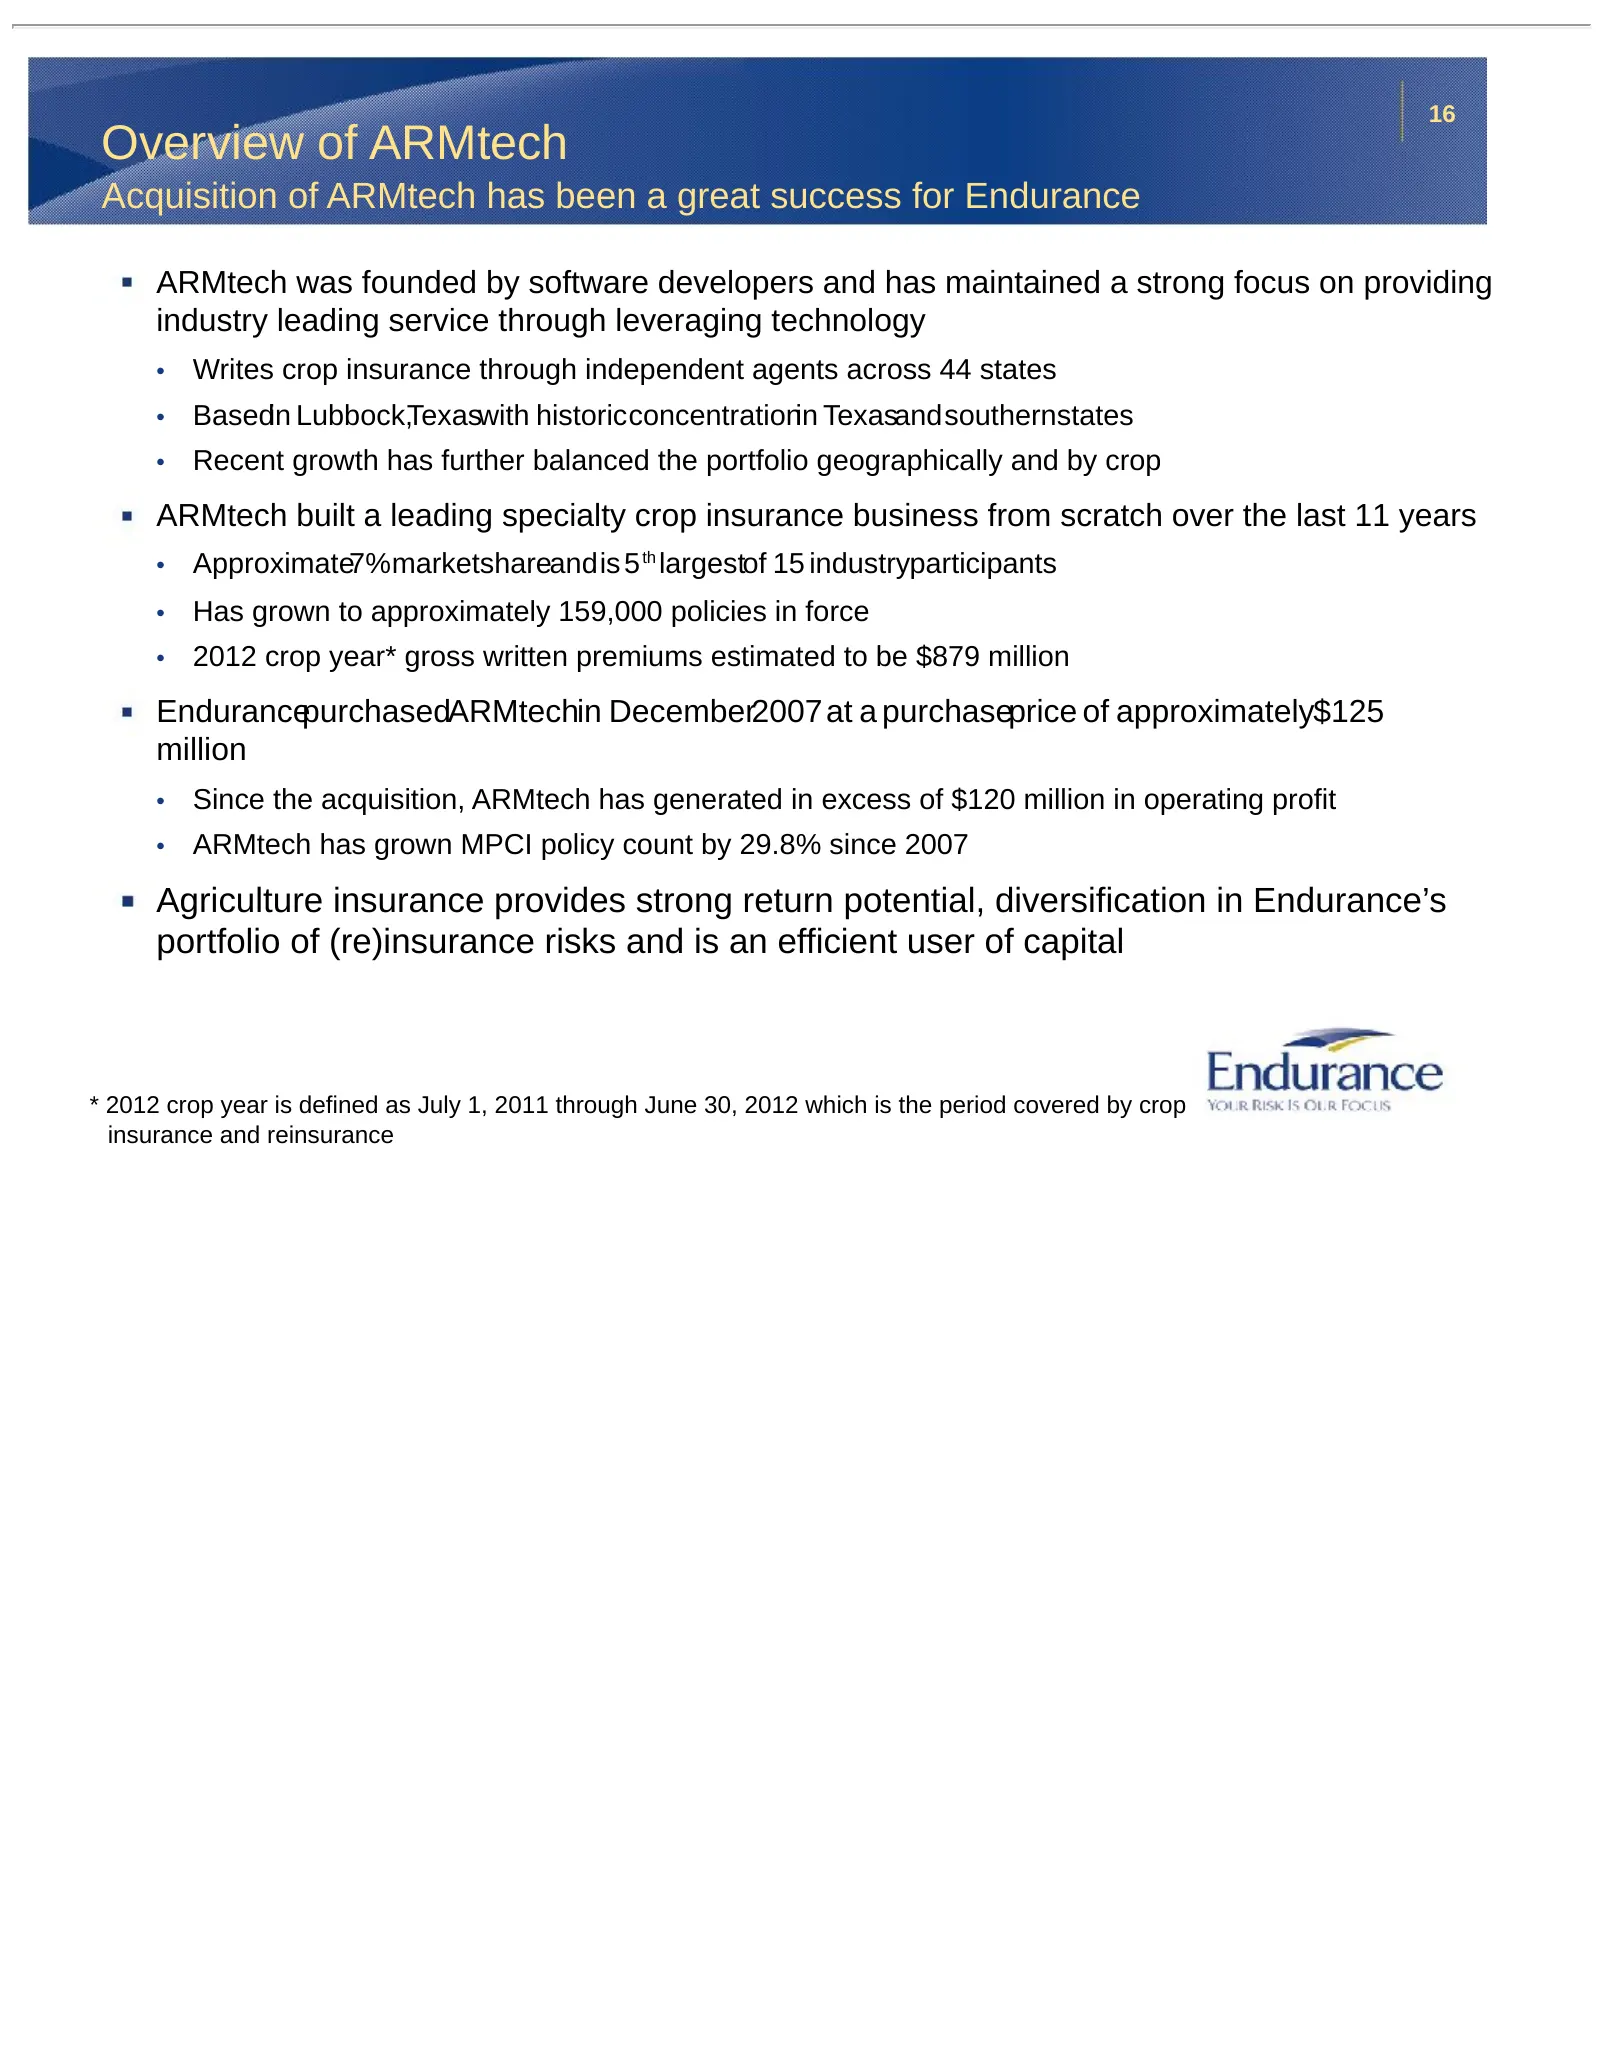
16 Overview of ARMtech Acquisition of ARMtech has been a great success for Endurance ARMtech was founded by software developers and has maintained a strong focus on providing industry leading service through leveraging technology • Writes crop insurance through independent agents across 44 states •
Slide 17: ARMtech is a Leader in the Crop Insurance Space
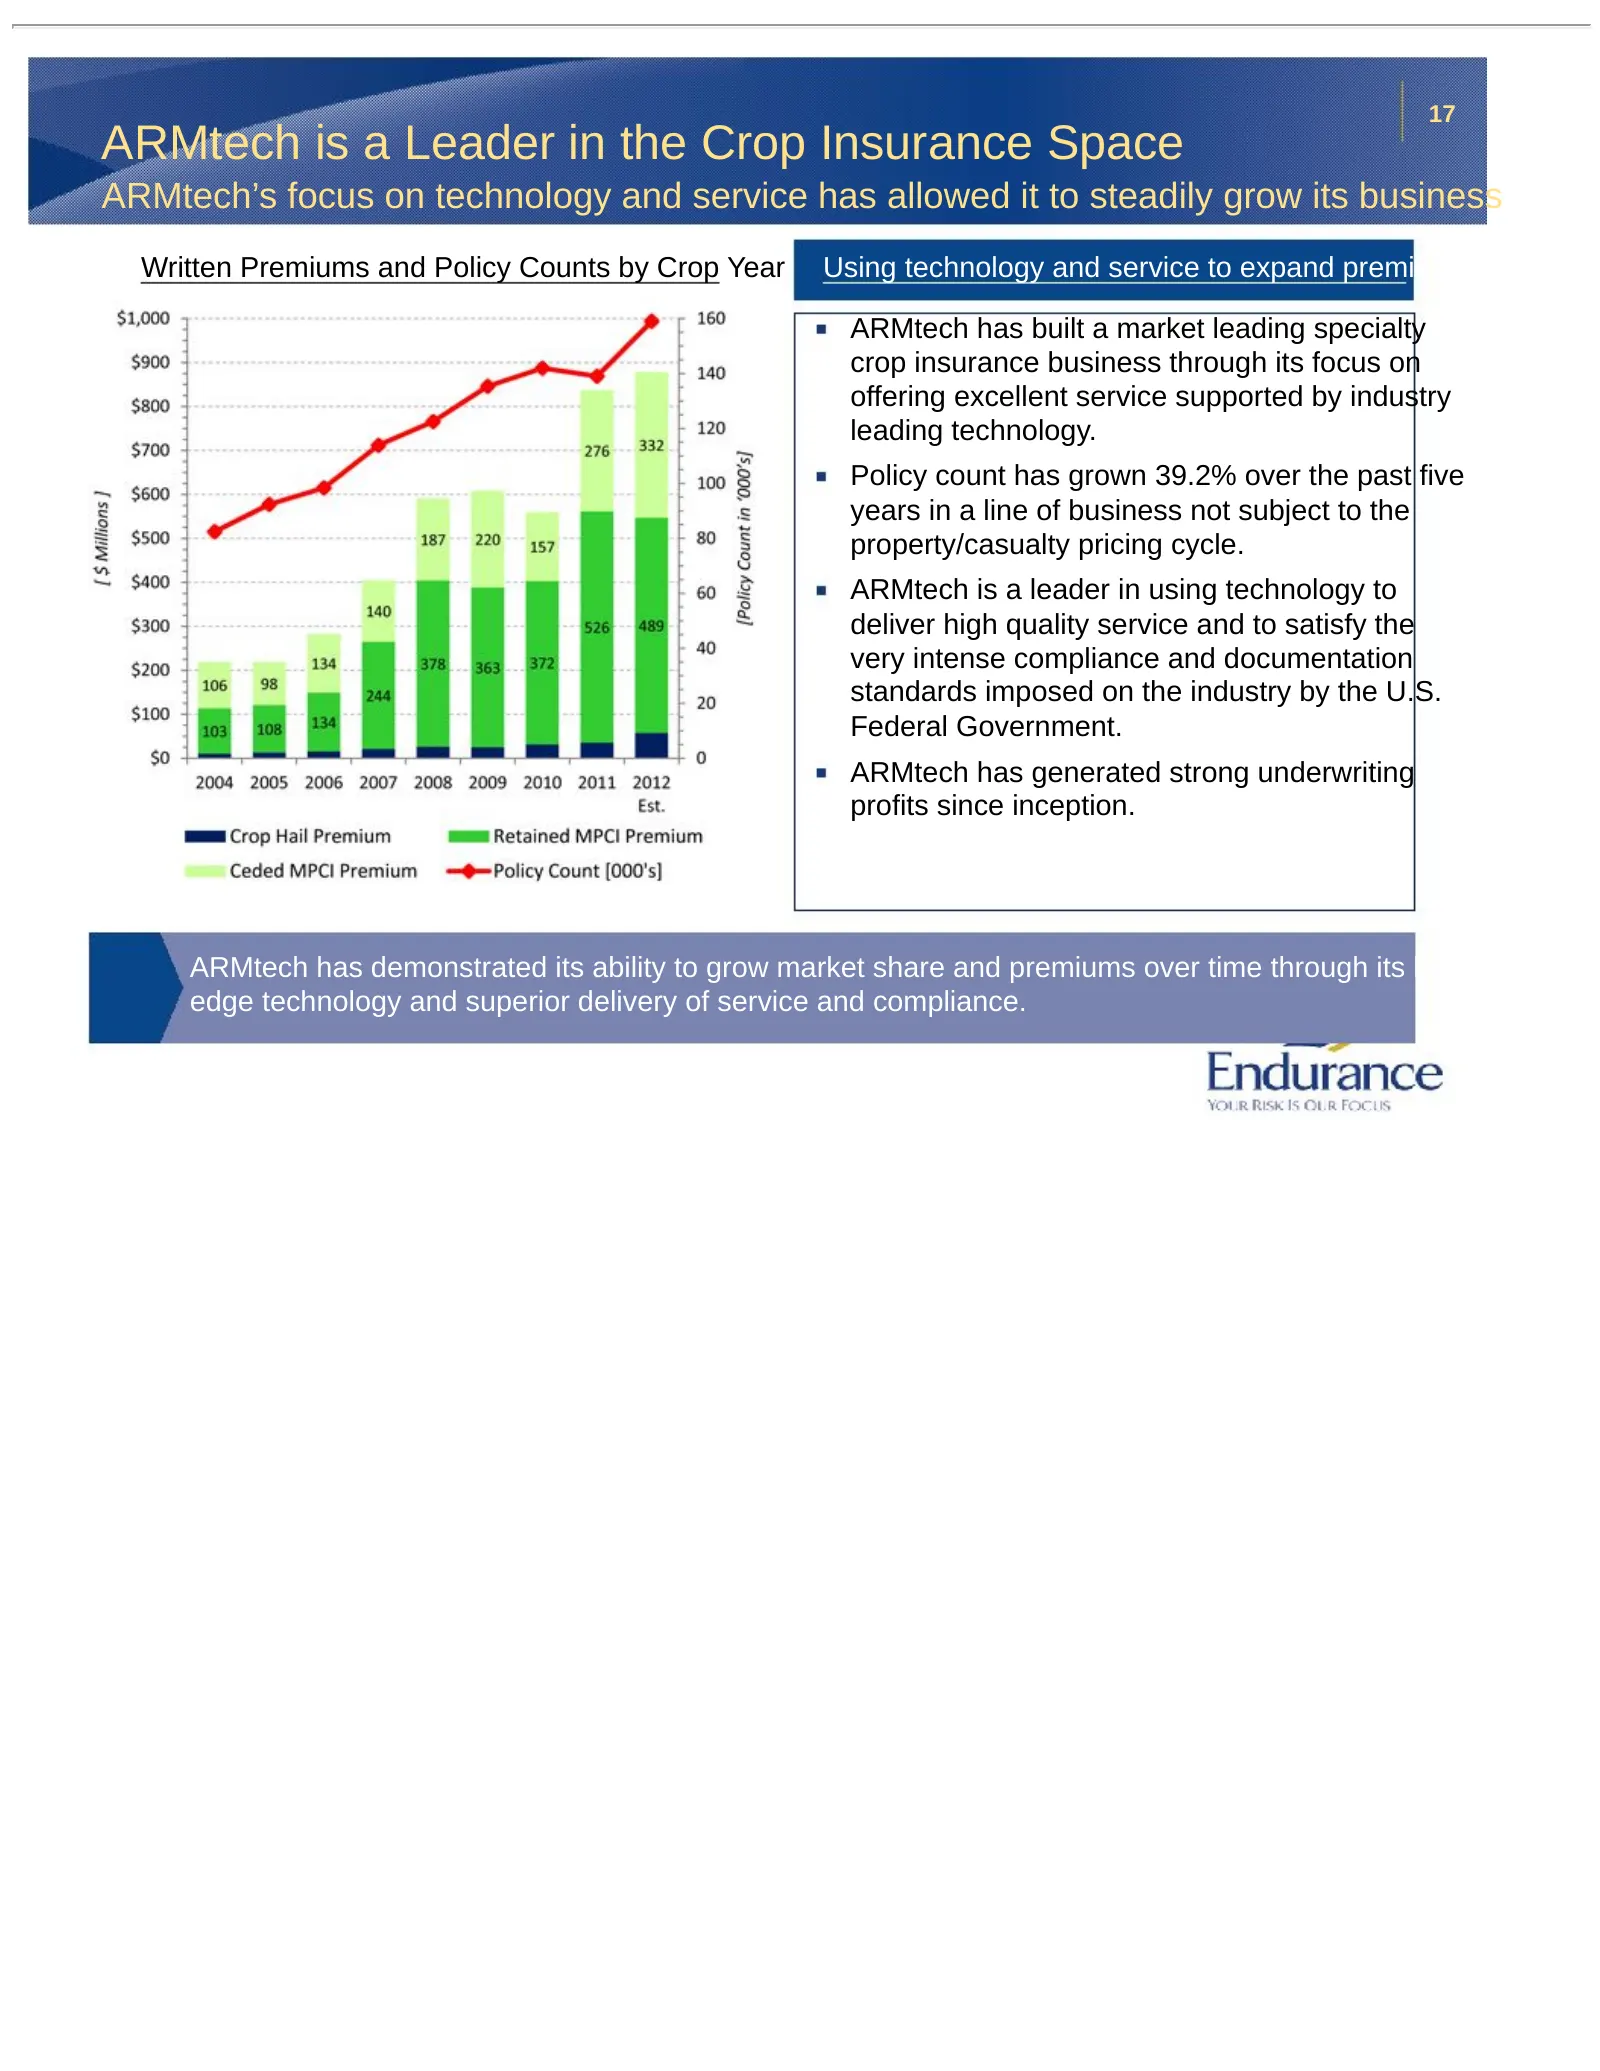
17 ARMtech is a Leader in the Crop Insurance Space ARMtech’s focus on technology and service has allowed it to steadily grow its business Written Premiums and Policy Counts by Crop Year Using technology and service to expand premiums ARMtech has built a market leading specialty crop insurance busine
Slide 18: ARMtech is Gaining Market Share in Broader Geographic Areas
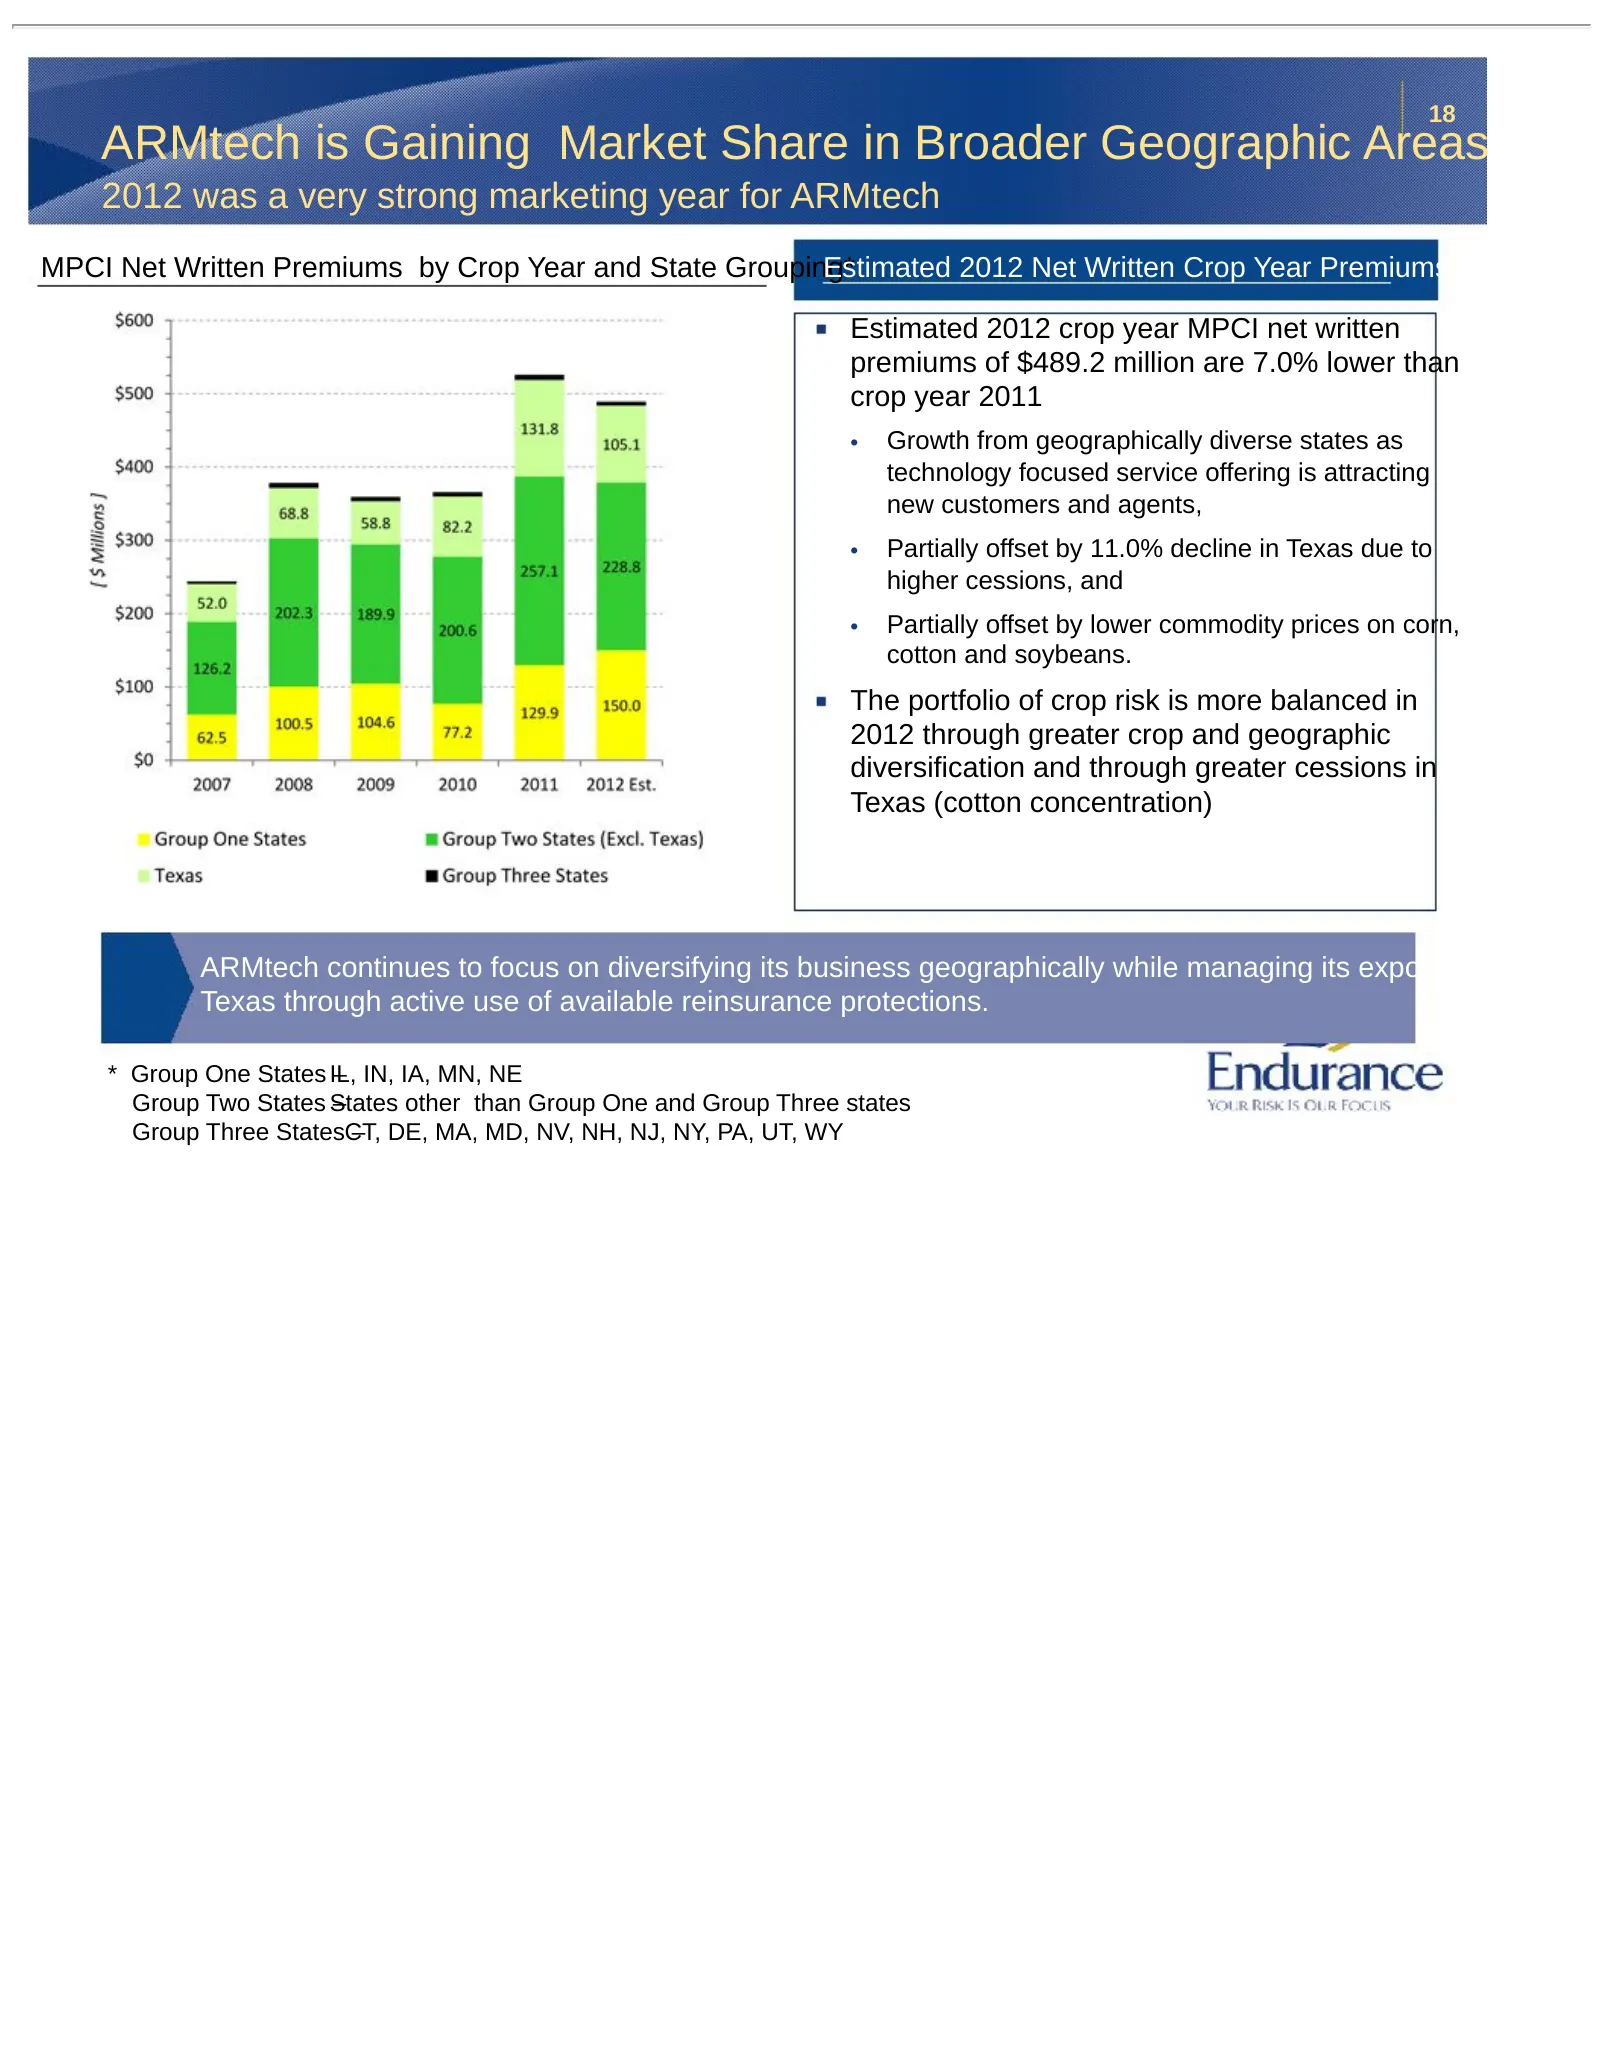
18 ARMtech is Gaining Market Share in Broader Geographic Areas 2012 was a very strong marketing year for ARMtech MPCI Net Written Premiums by Crop Year and State Grouping* Estimated 2012 Net Written Crop Year Premiums Estimated 2012 crop year MPCI net written premiums of $489.2 million are 7.0% lowe
Slide 19: Agriculture Insurance is Not Correlated with the P&C Business Cycle
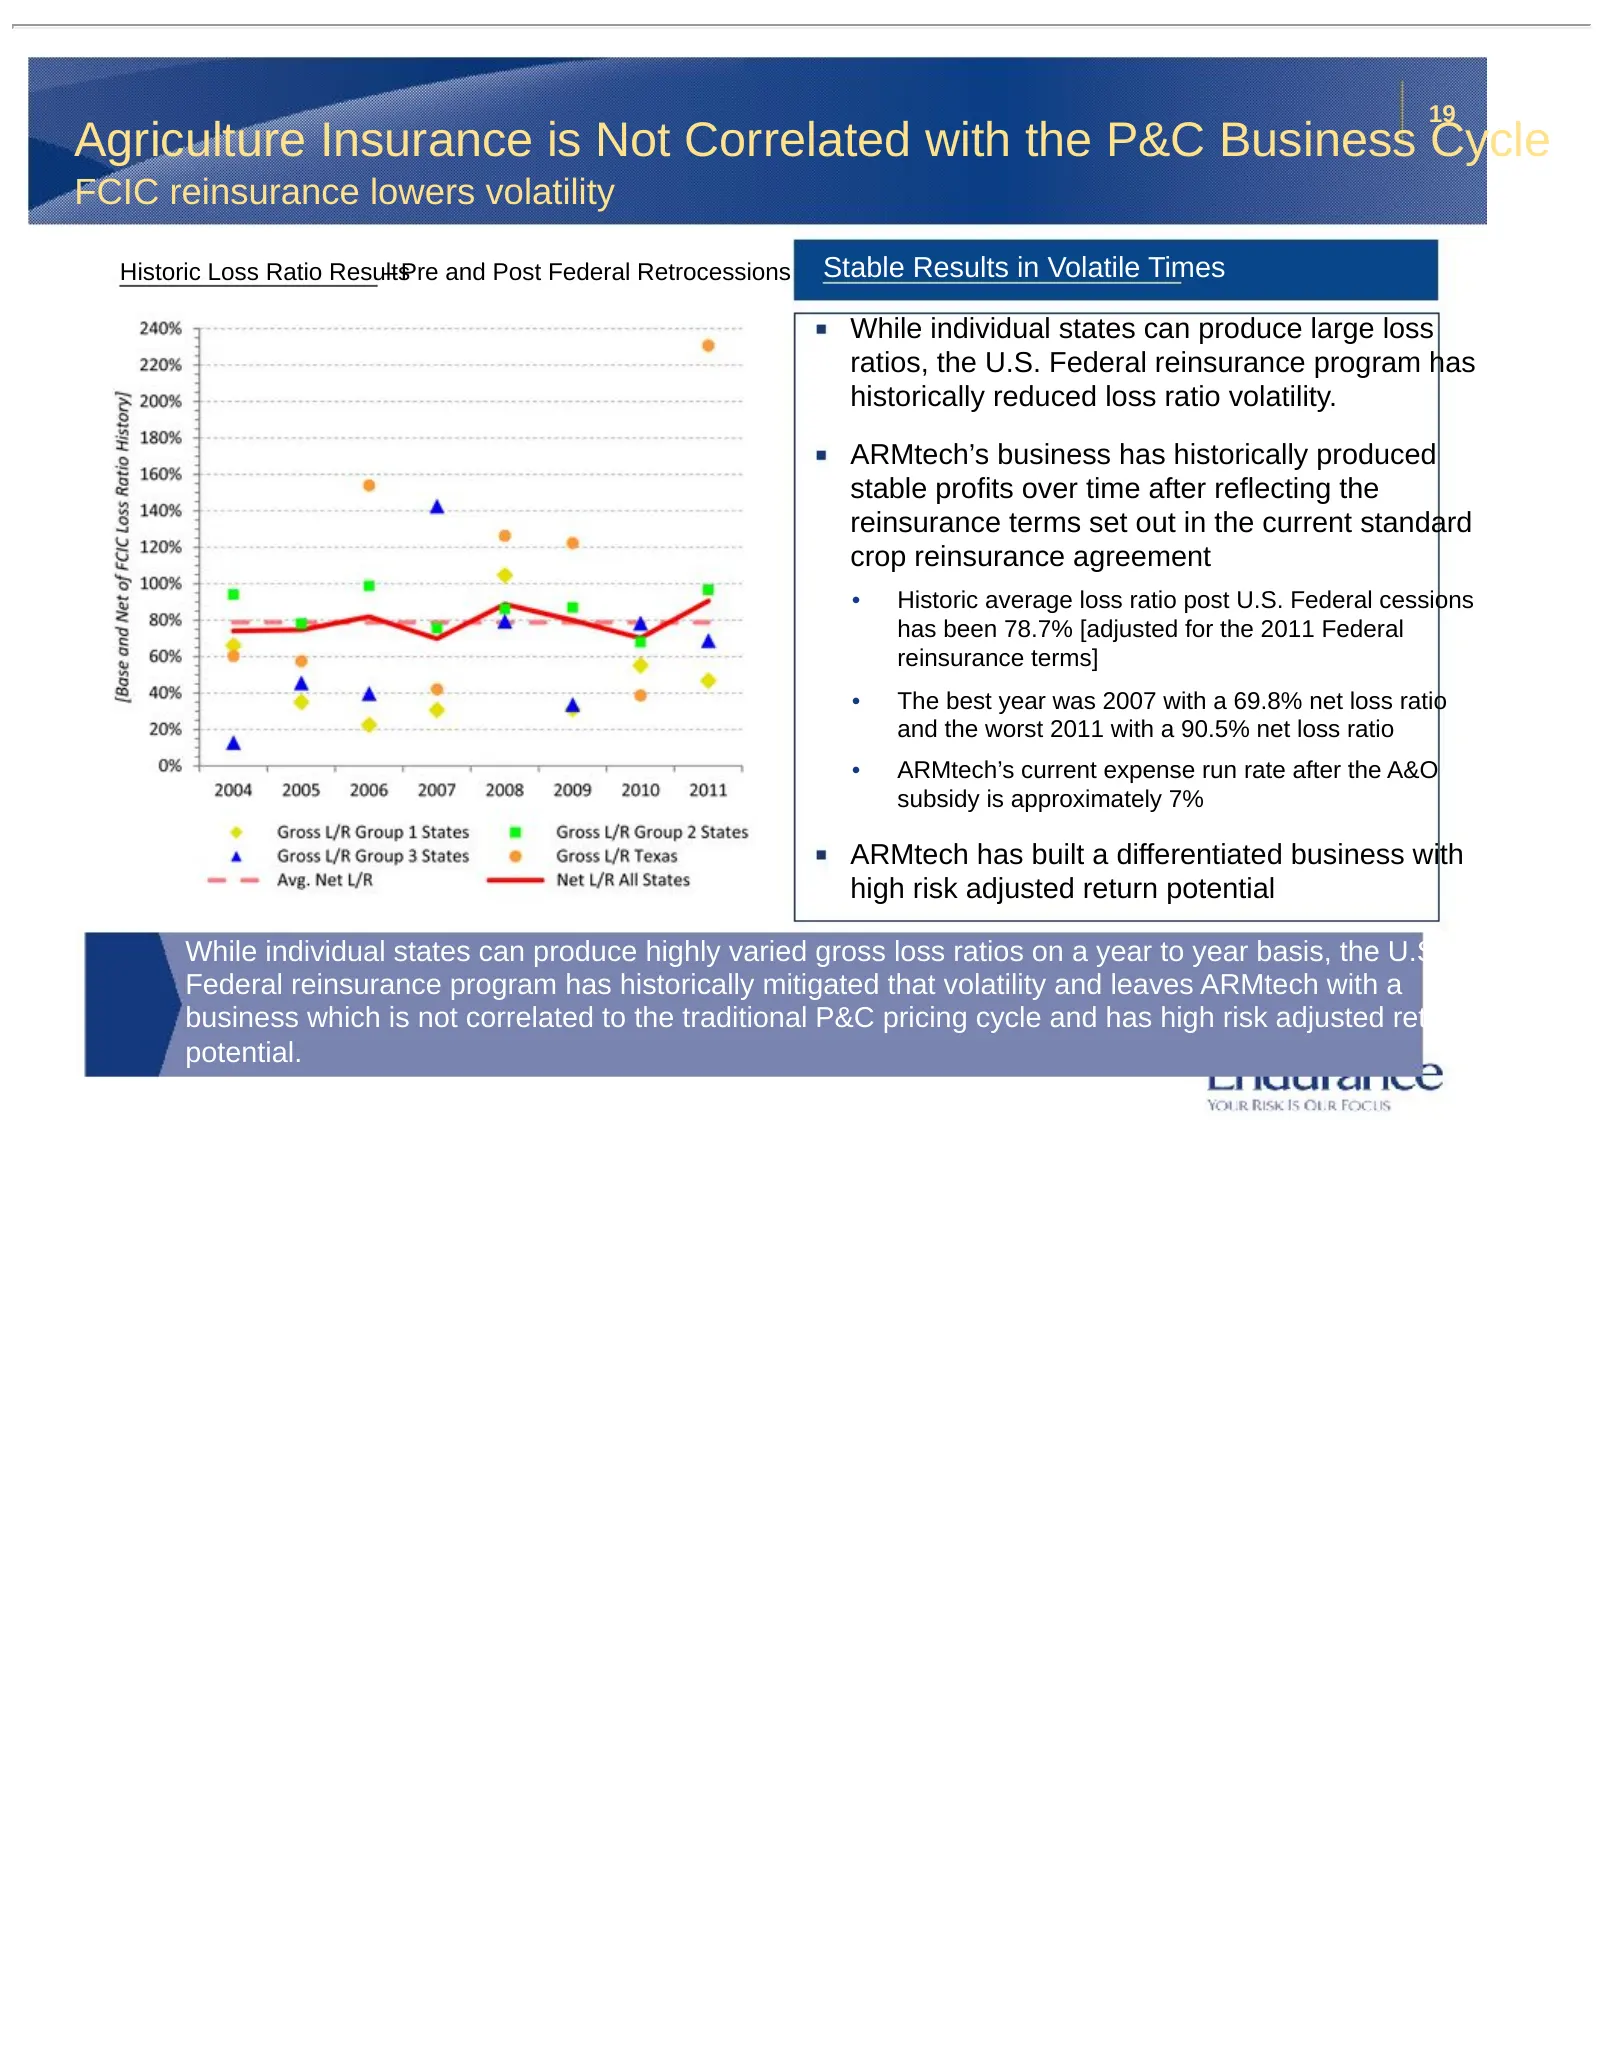
19 Agriculture Insurance is Not Correlated with the P&C Business Cycle FCIC reinsurance lowers volatility Historic Loss Ratio Results – Pre and Post Federal Retrocessions Stable Results in Volatile Times While individual states can produce large loss ratios, the U.S. Federal reinsurance program has
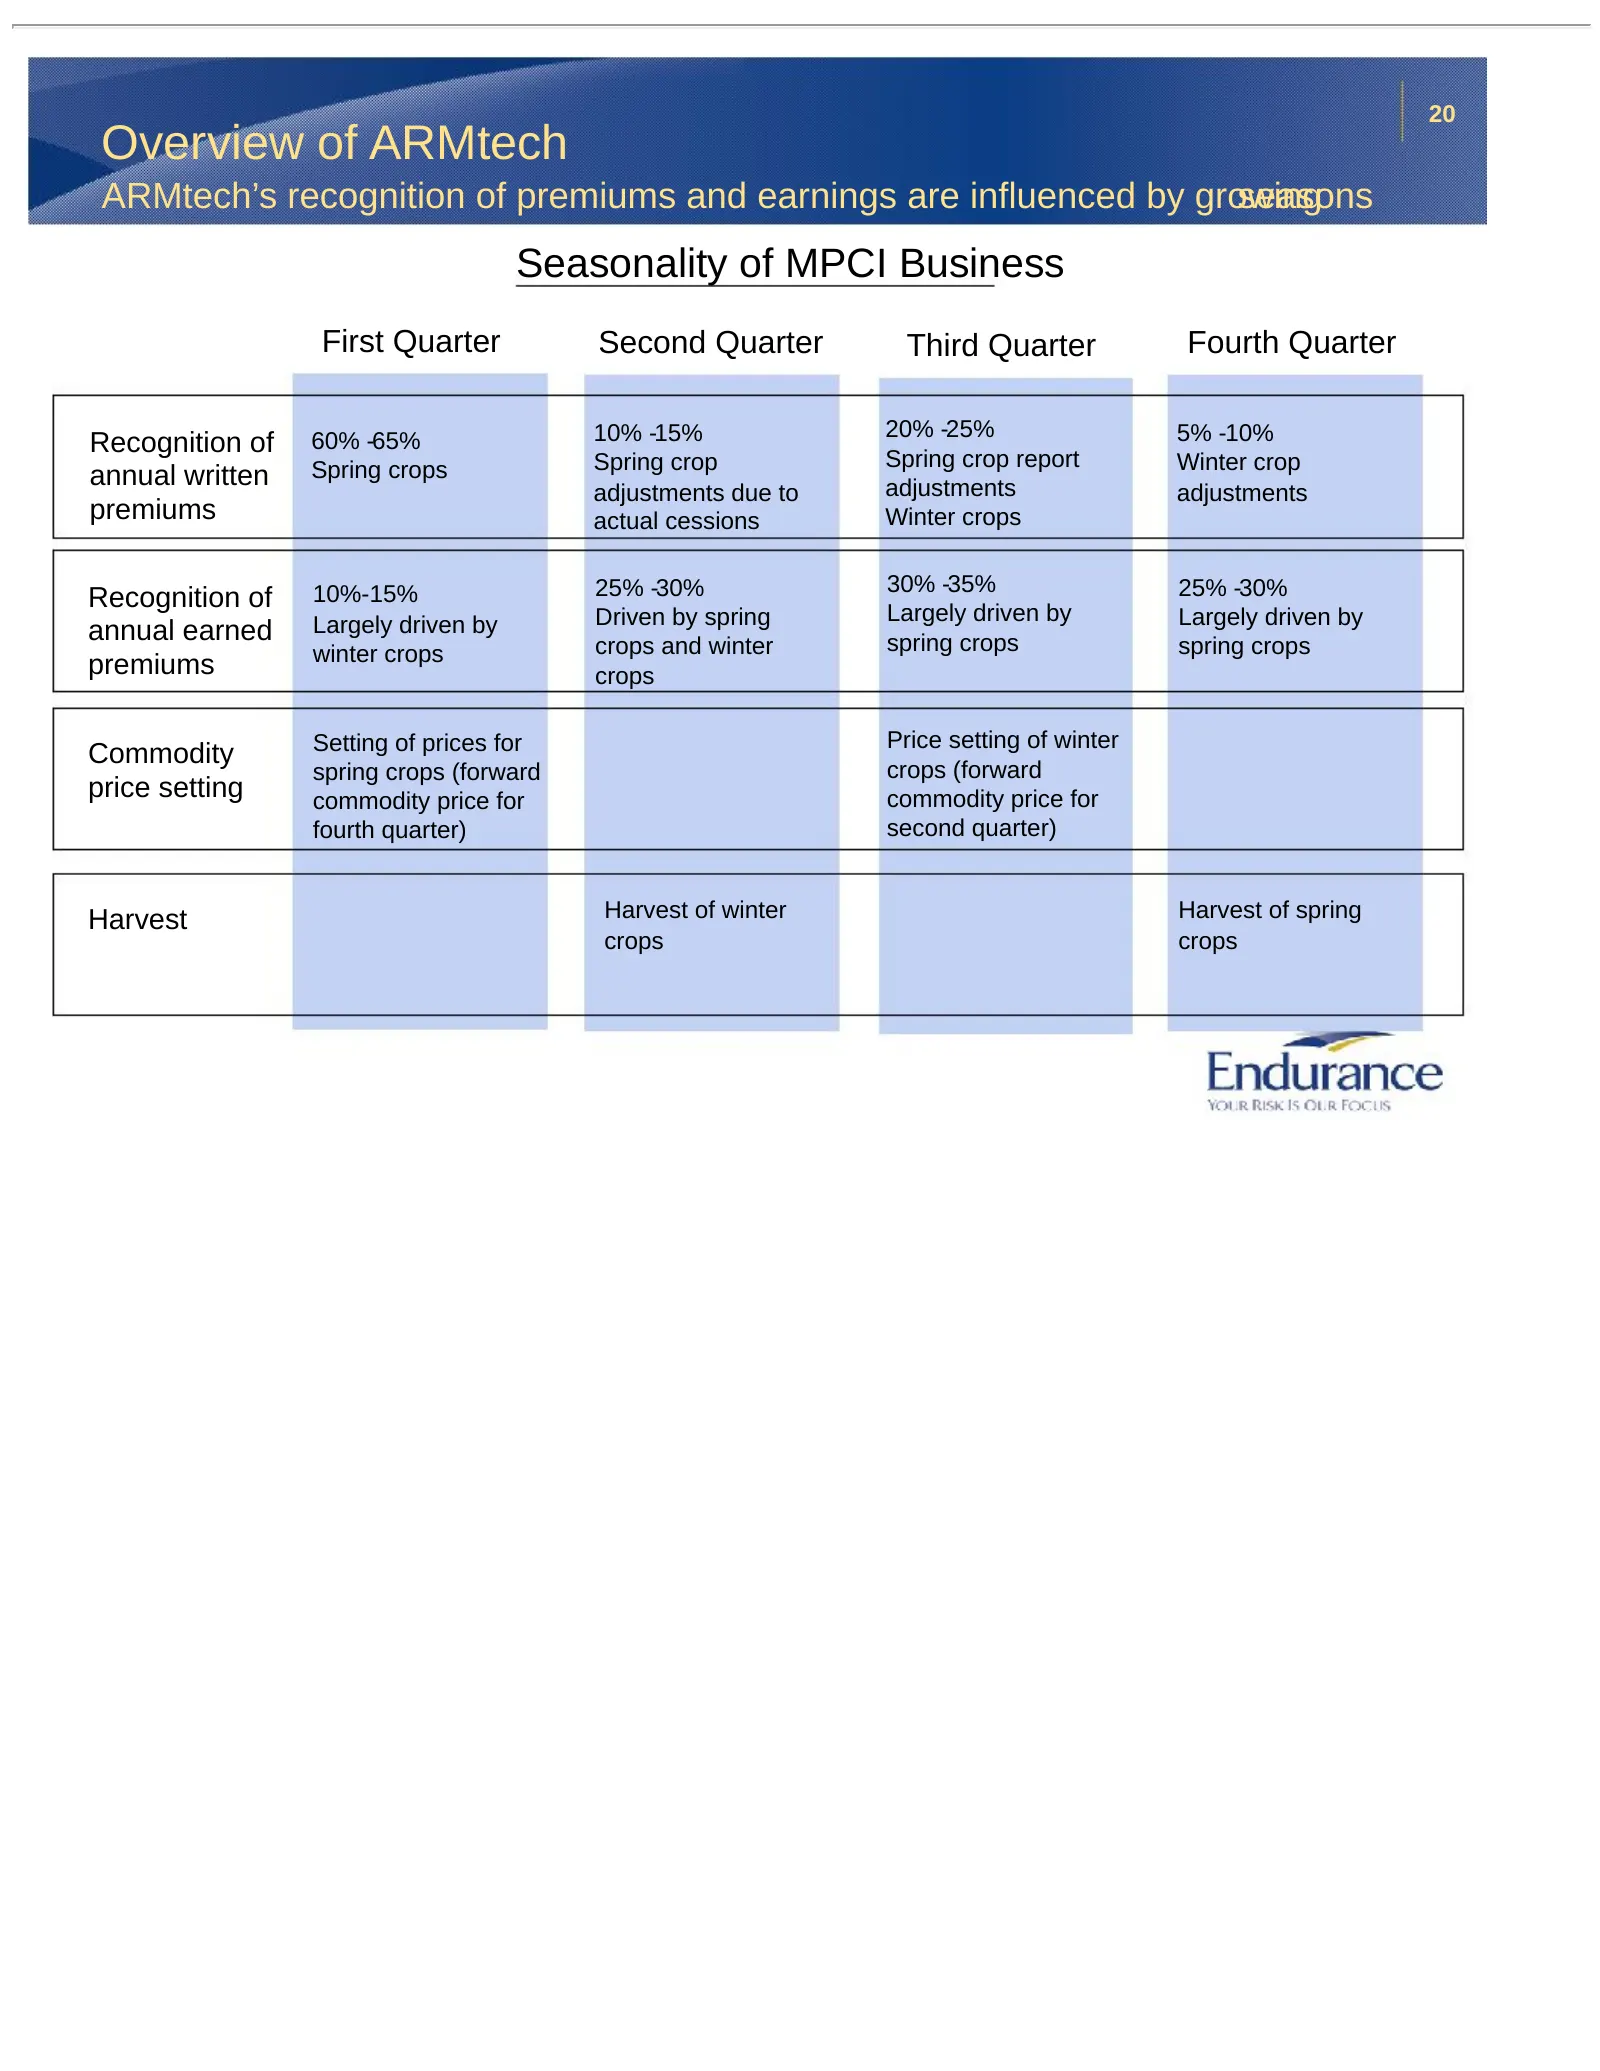
Slide 20: Overview of ARMtech: Seasonality
20 Overview of ARMtech ARMtech’s recognition of premiums and earnings are influenced by growing seasons Seasonality of MPCI Business First Quarter Second Quarter Third Quarter Fourth Quarter 10% -15% 20% -25% 5% -10% Recognition of 60% -65% Spring crops Spring crop Spring crop report Winter crop ann
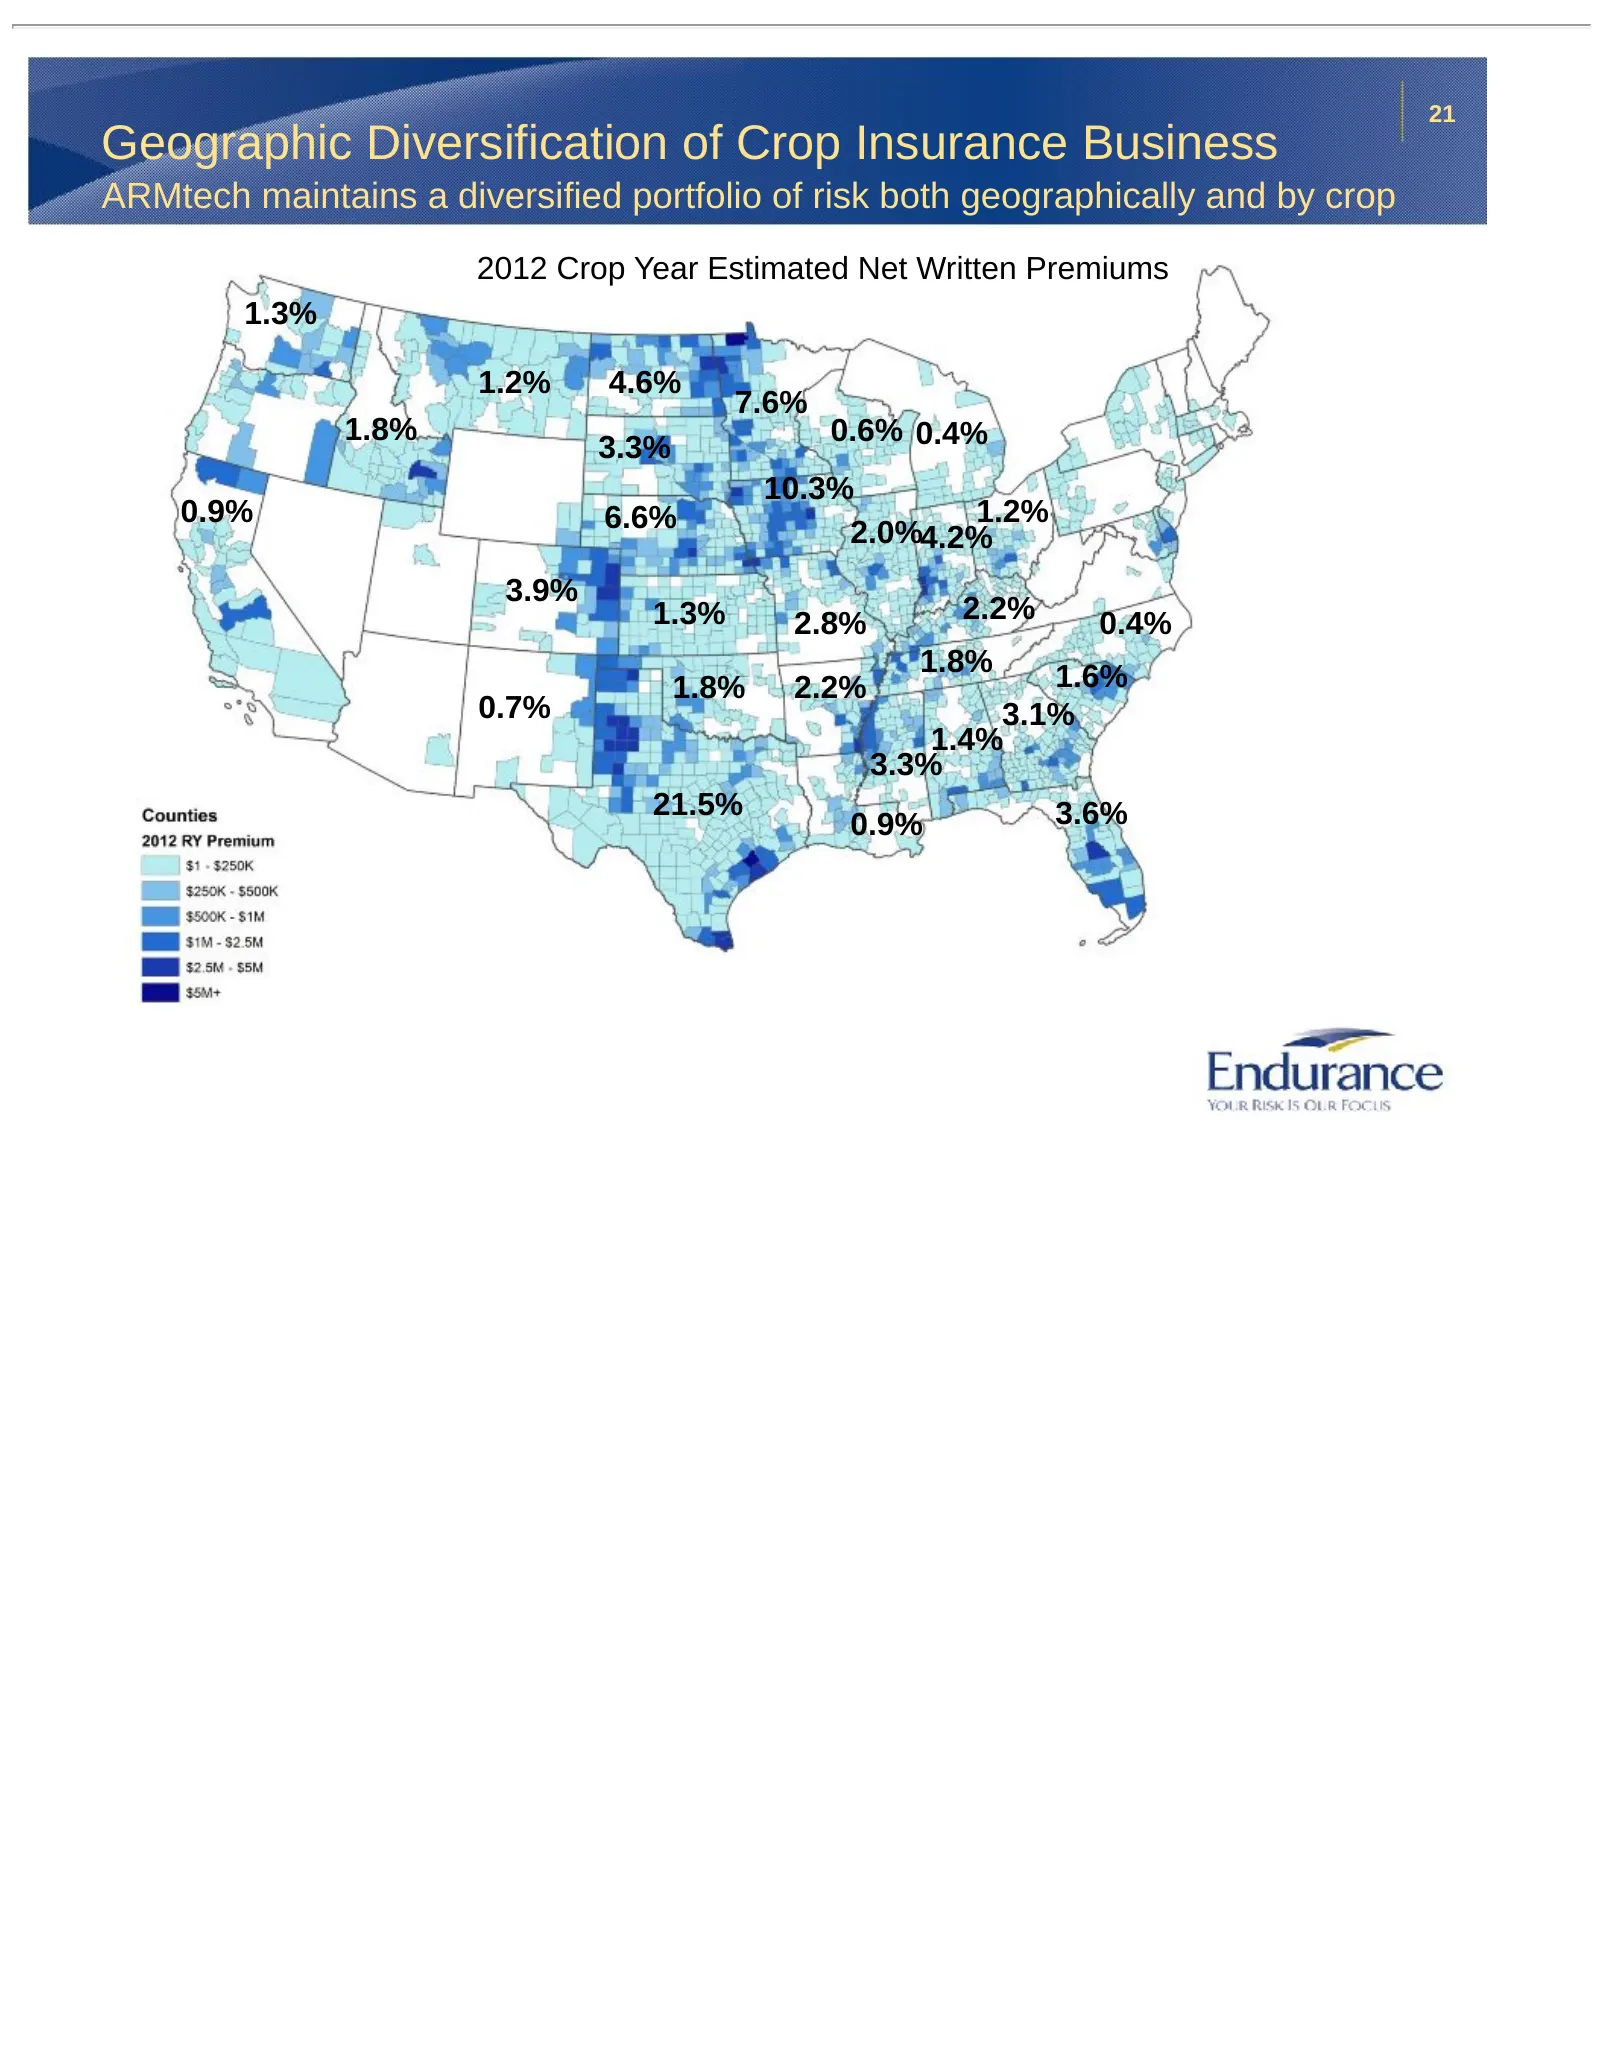
Slide 21: Geographic Diversification of Crop Insurance Business
21 Geographic Diversification of Crop Insurance Business ARMtech maintains a diversified portfolio of risk both geographically and by crop 2012 Crop Year Estimated Net Written Premiums 1.3% 1.2% 4.6% 7.6% 1.8% 0.6% 0.4% 3.3% 10.3% 0.9% 6.6% 1.2% 2.0%4.2% 3.9% 1.3% 2.8% 2.2% 0.4% 1.8% 1.6% 1.8% 2.2%
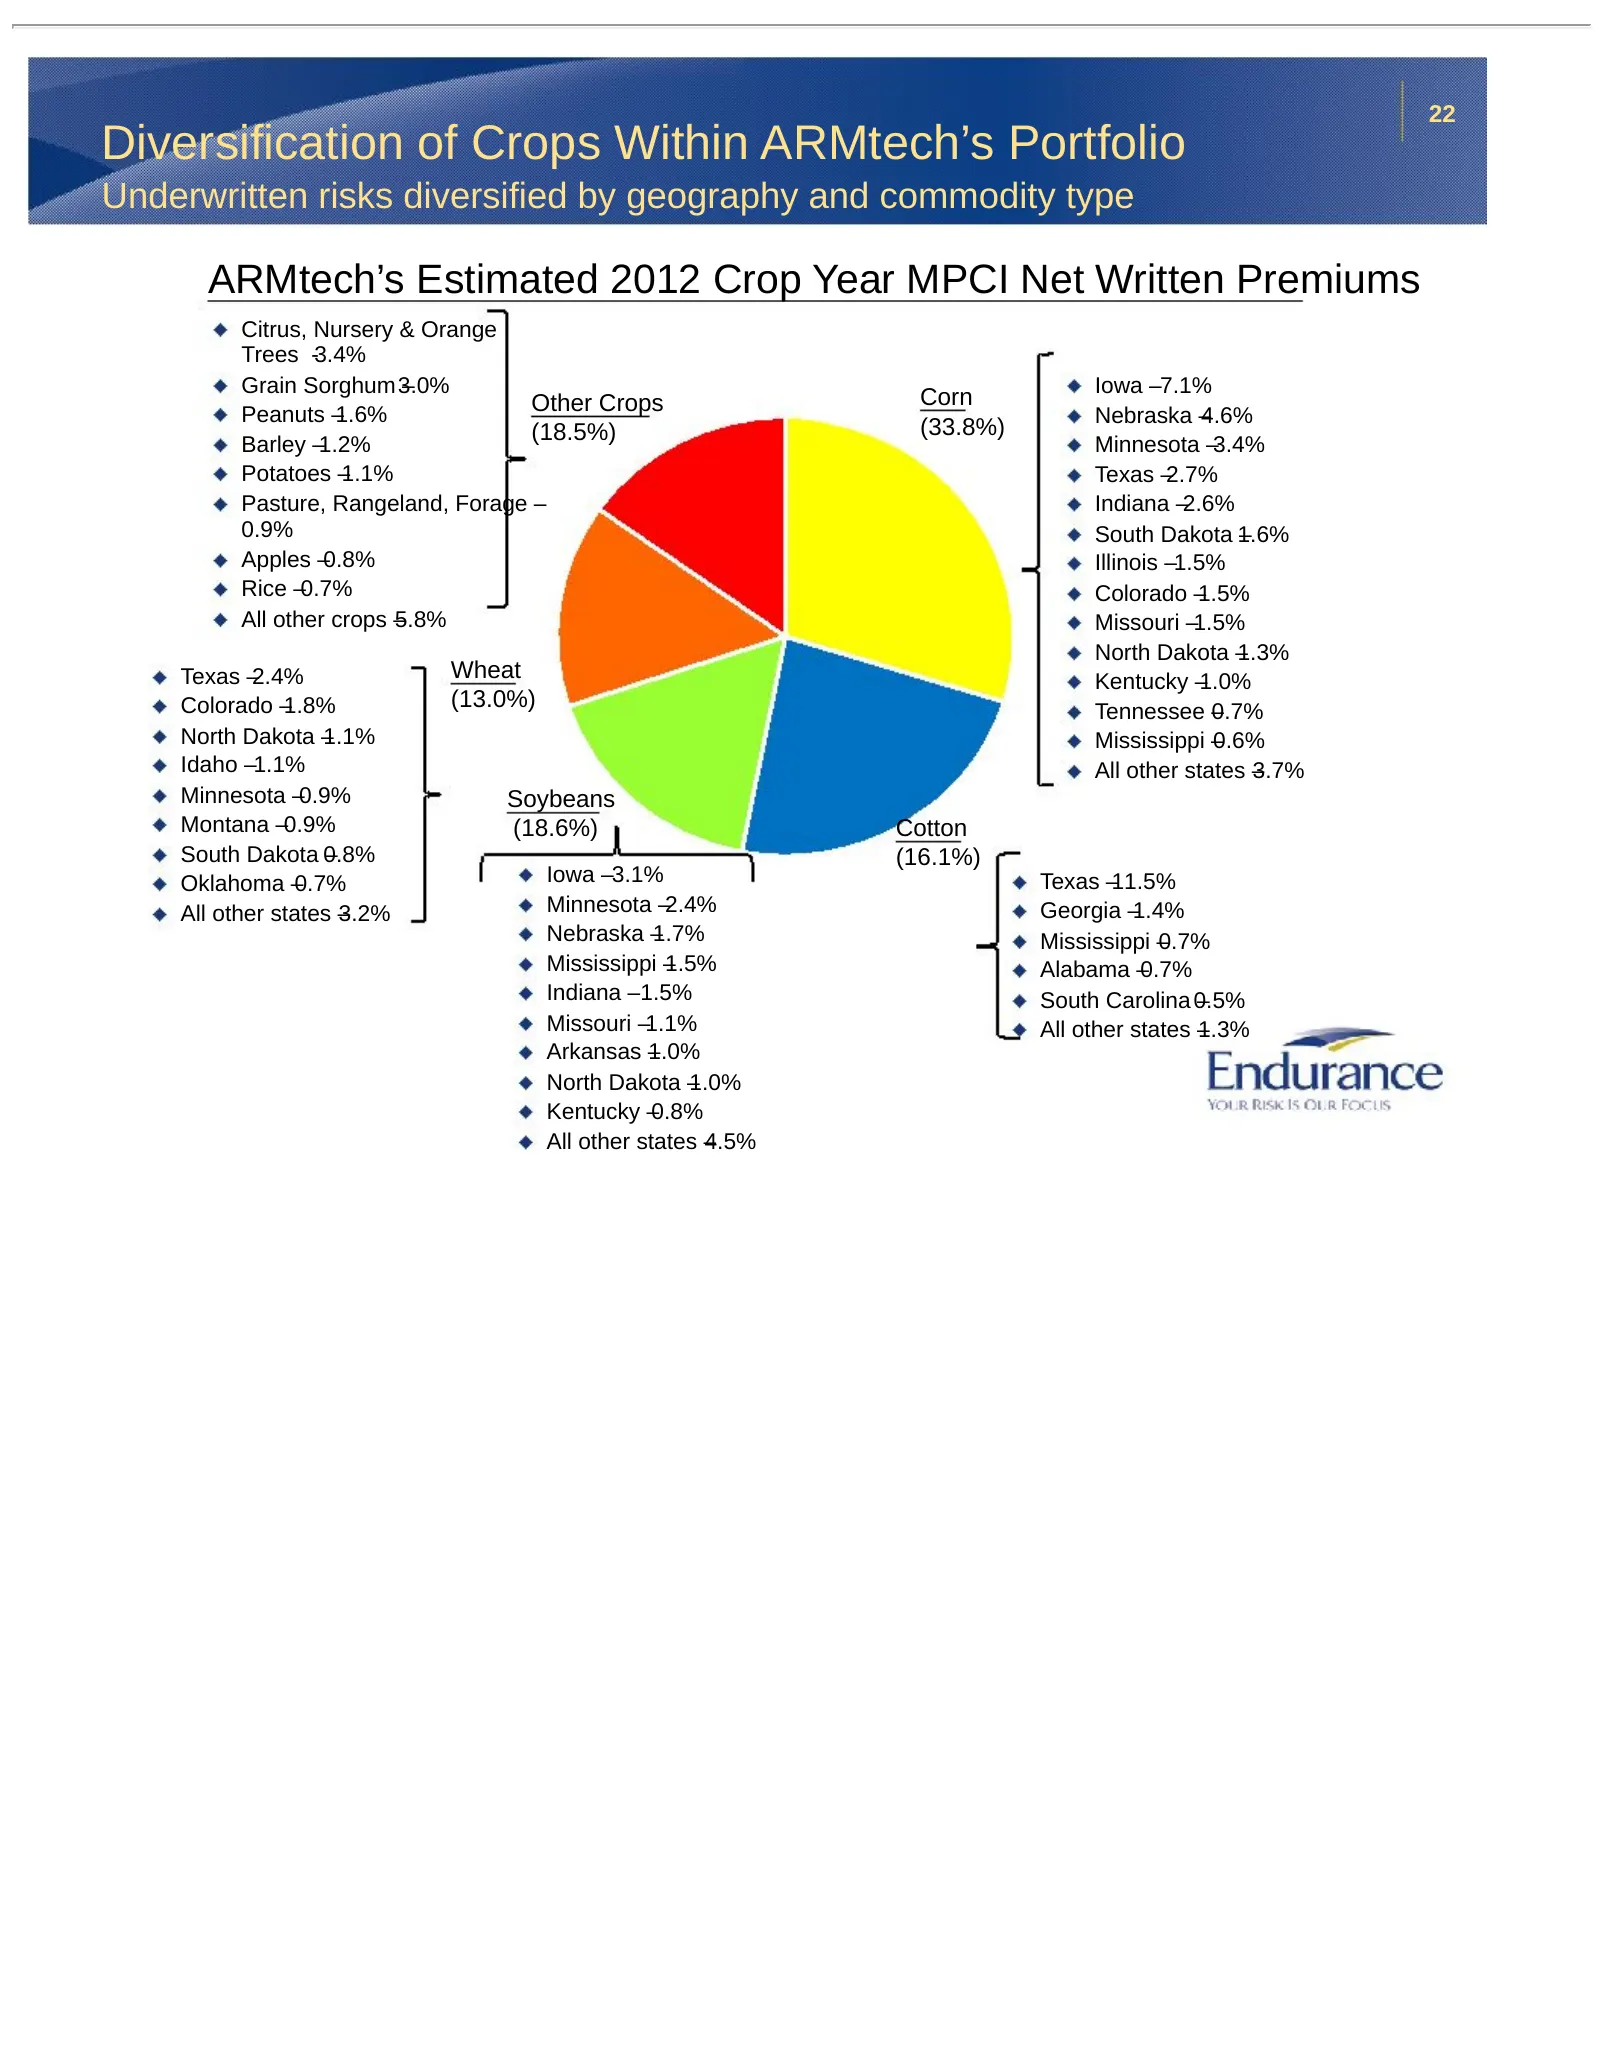
Slide 22: Diversification of Crops Within ARMtech's Portfolio
22 Diversification of Crops Within ARMtech’s Portfolio Underwritten risks diversified by geography and commodity type ARMtech’s Estimated 2012 Crop Year MPCI Net Written Premiums Citrus, Nursery & Orange Trees -3.4% Grain Sorghum 3.0%– Iowa –7.1% Other Crops Corn Peanuts –1.6% Nebraska –4.6% (18.5%)
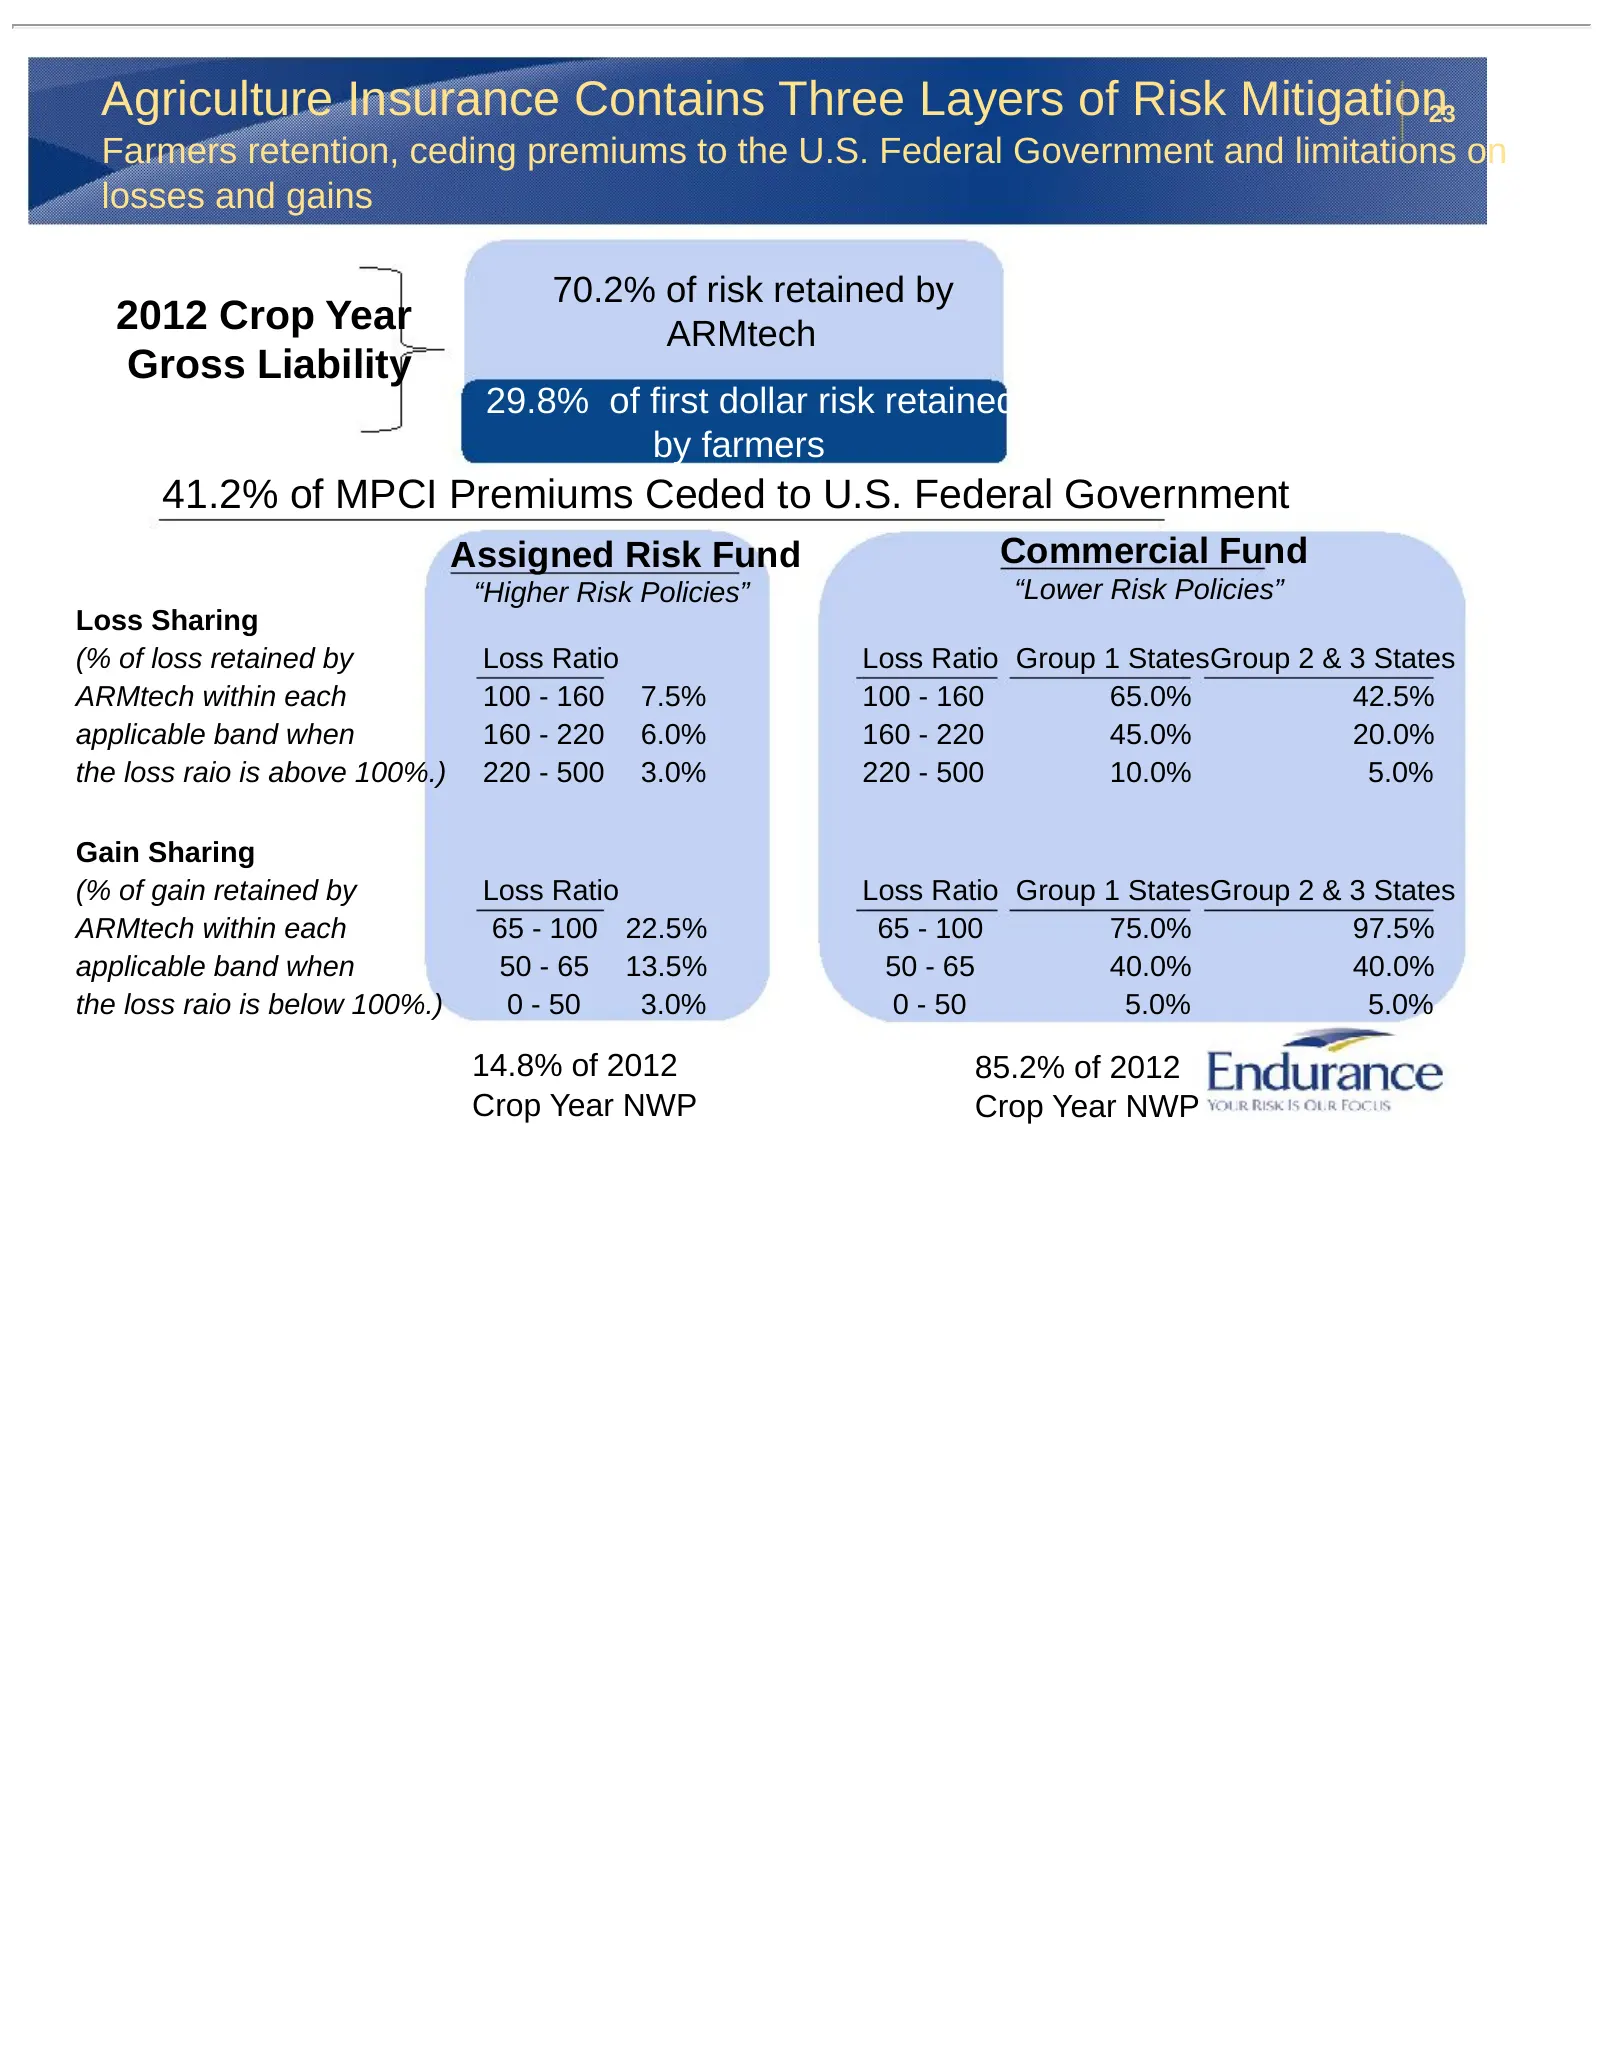
Slide 23: Agriculture Insurance Contains Three Layers of Risk Mitigation
Agriculture Insurance Contains Three Layers of Risk Mitigation23 Farmers retention, ceding premiums to the U.S. Federal Government and limitations on losses and gains 70.2% of risk retained by 2012 Crop Year ARMtech Gross Liability 29.8% of first dollar risk retained by farmers 41.2% of MPCI Premium
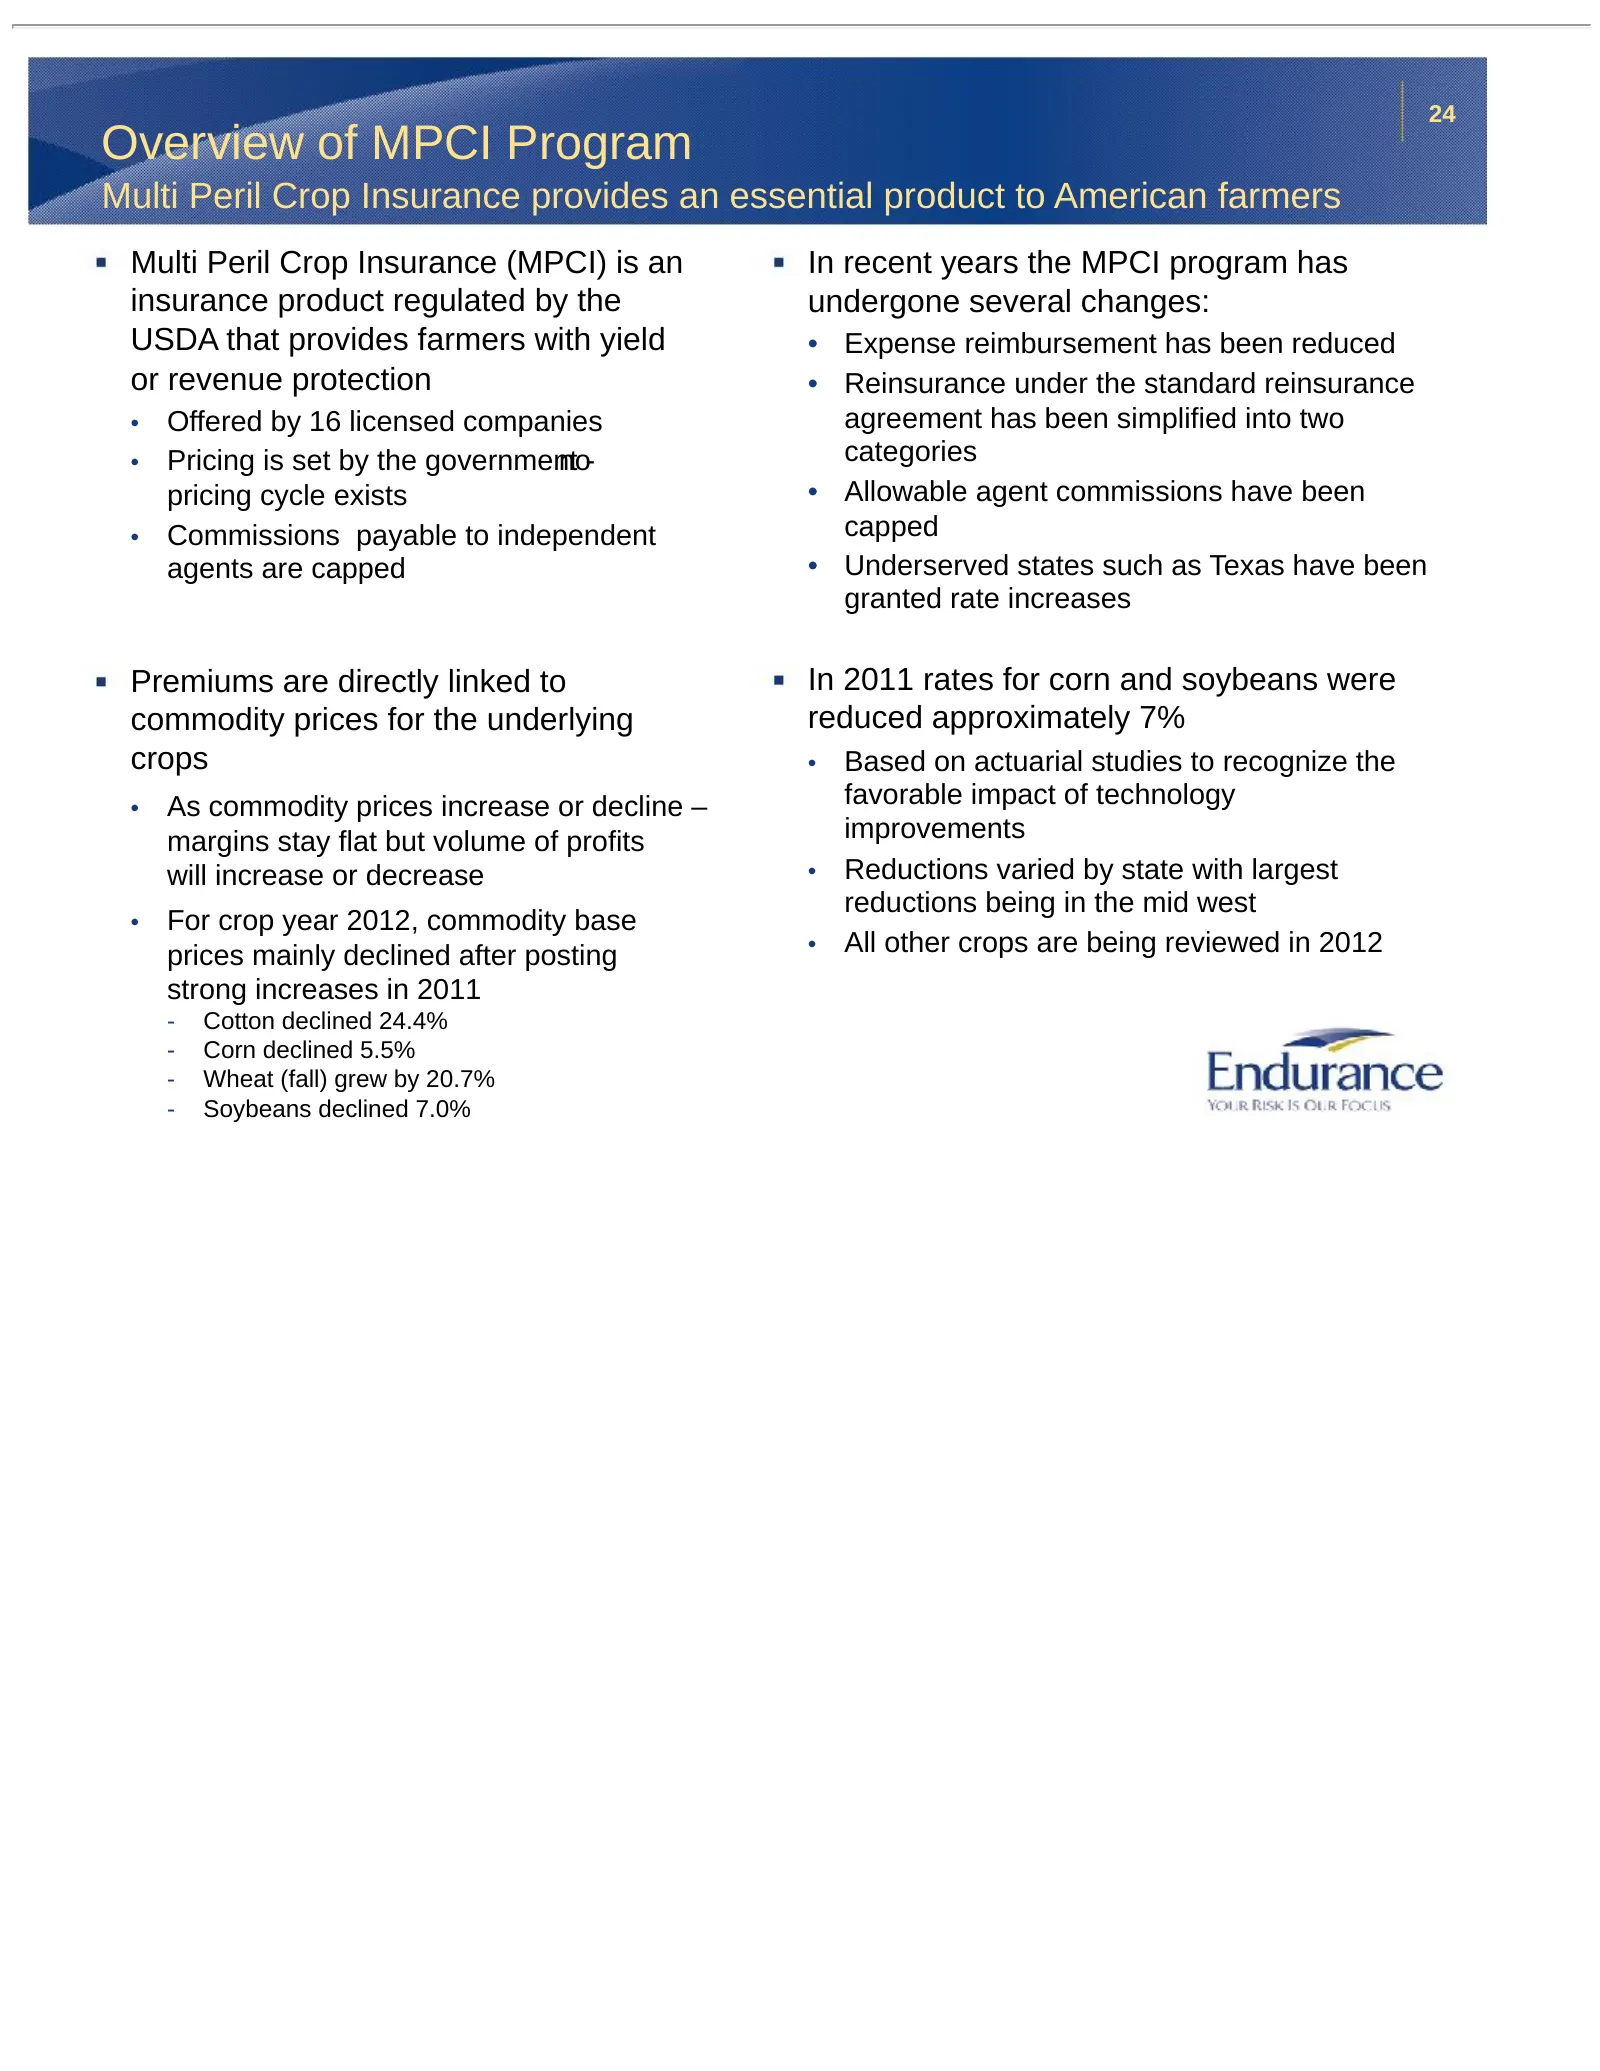
Slide 24: Overview of MPCI Program
24 Overview of MPCI Program Multi Peril Crop Insurance provides an essential product to American farmers Multi Peril Crop Insurance (MPCI) is an In recent years the MPCI program has insurance product regulated by the undergone several changes: USDA that provides farmers with yield • Expense reimburs

Slide 25: Other Miscellaneous Information
Other Miscellaneous Information
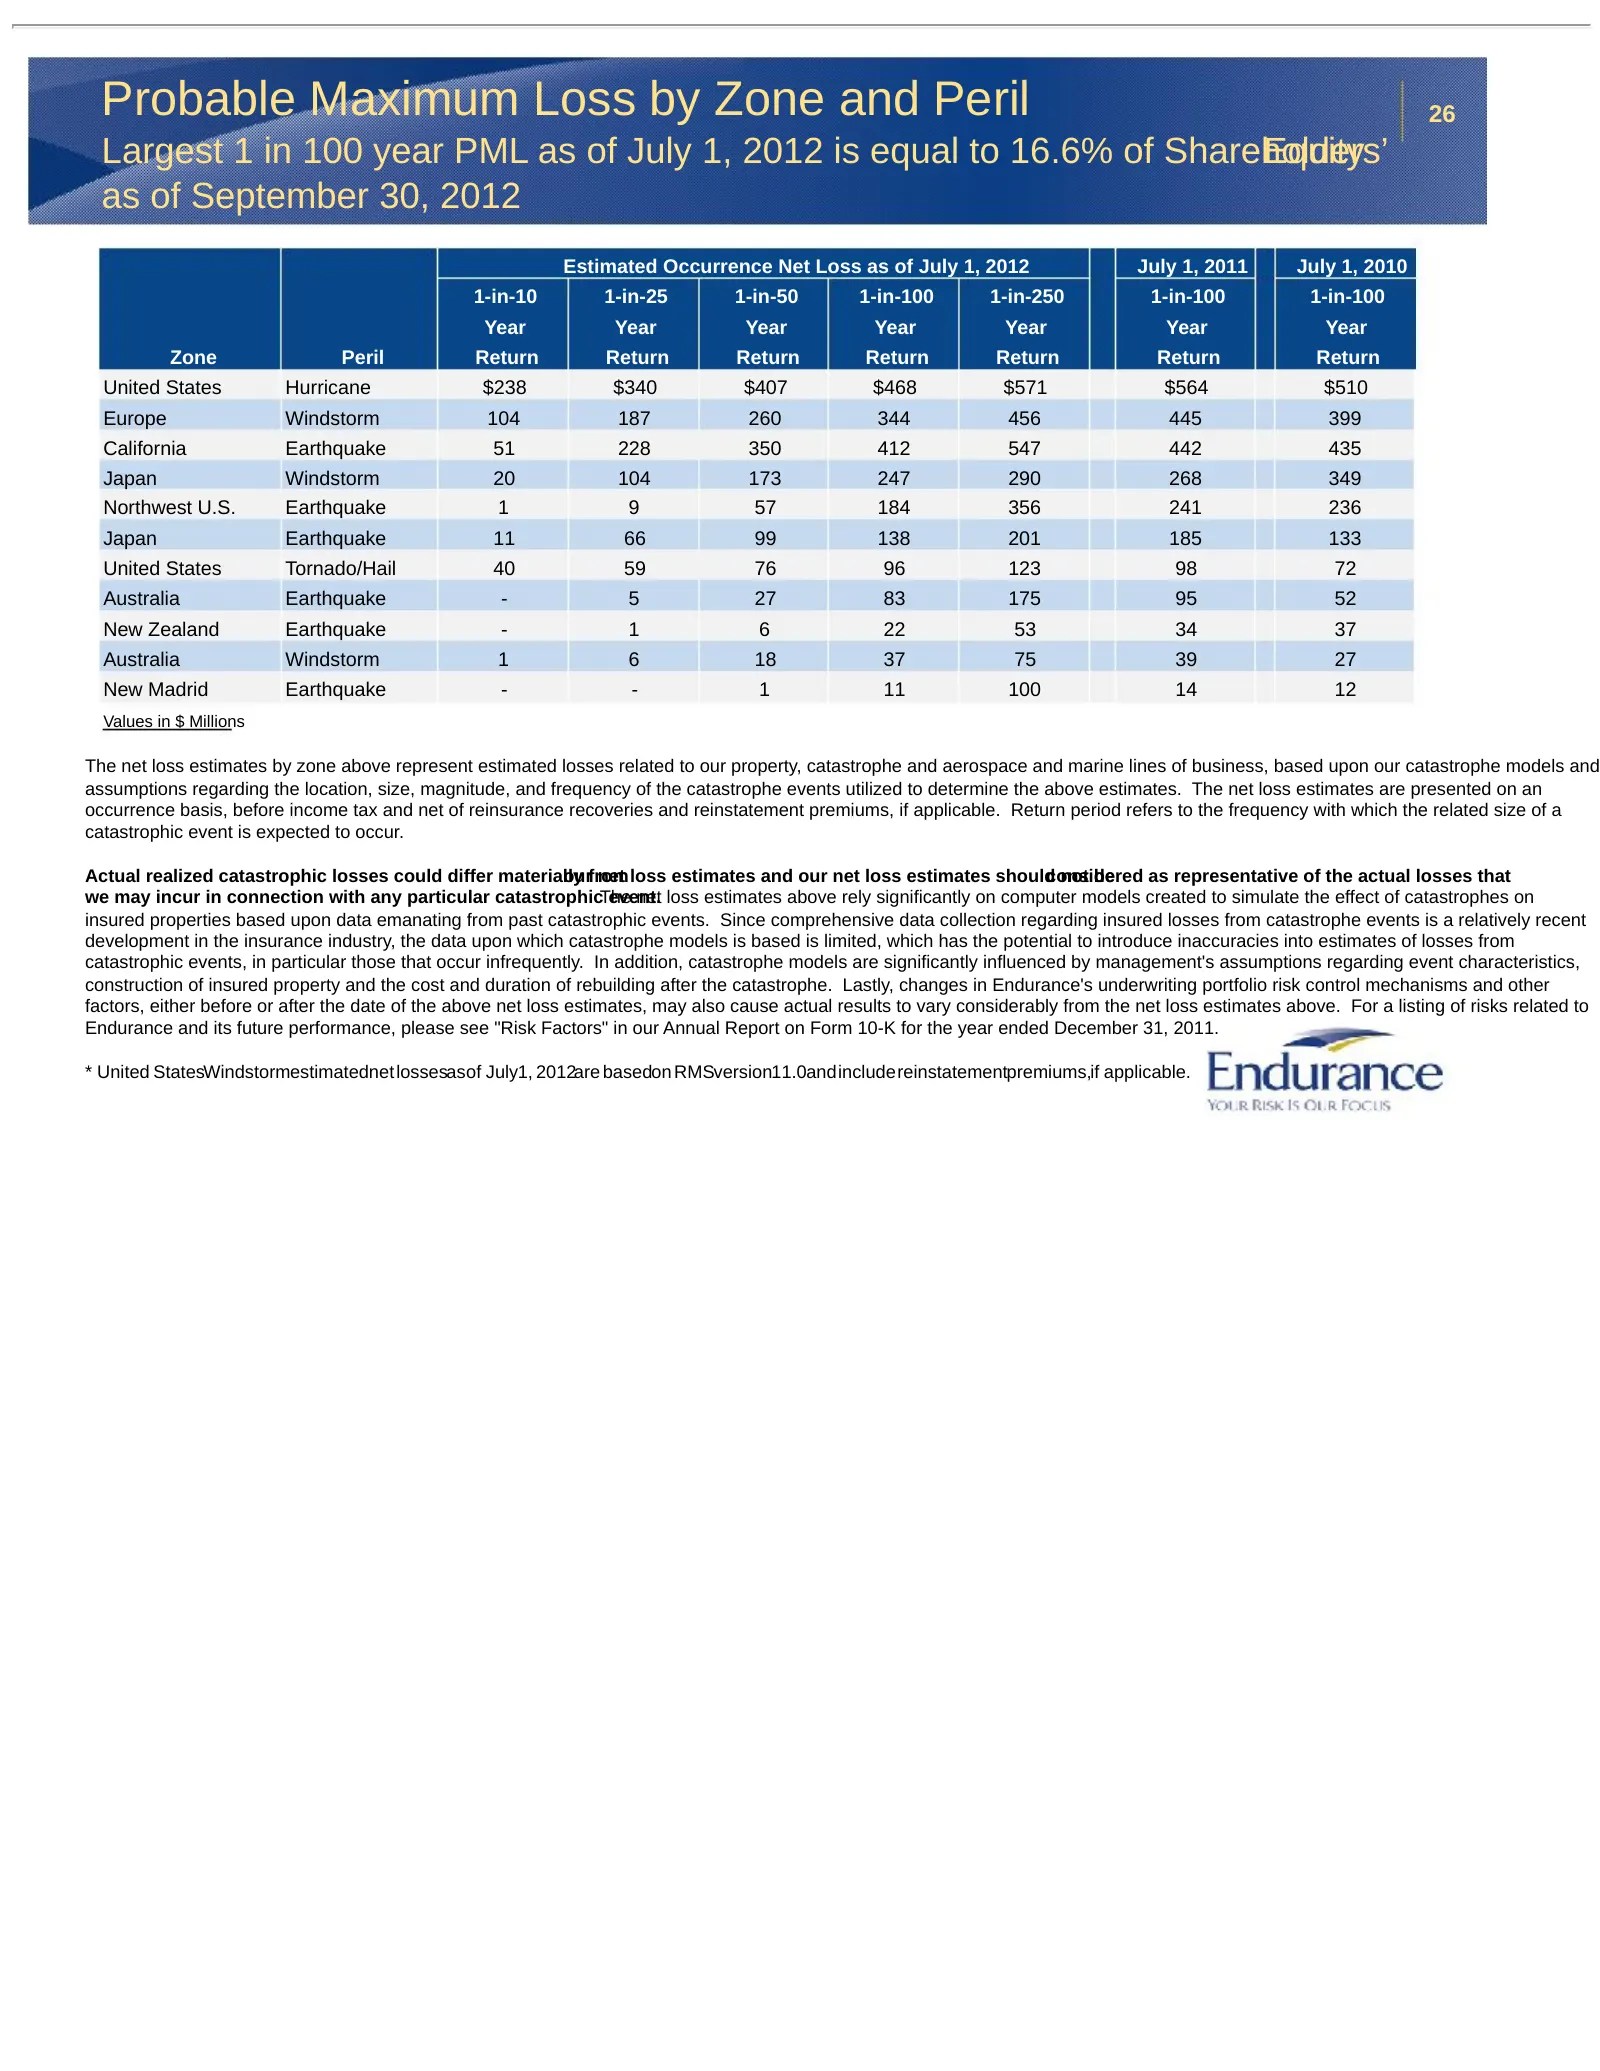
Slide 26: Probable Maximum Loss by Zone and Peril
Probable Maximum Loss by Zone and Peril 26 Largest 1 in 100 year PML as of July 1, 2012 is equal to 16.6% of Shareholders’ Equity as of September 30, 2012 Estimated Occurrence Net Loss as of July 1, 2012 July 1, 2011 July 1, 2010 1-in-10 1-in-25 1-in-50 1-in-100 1-in-250 1-in-100 1-in-100 Year Year
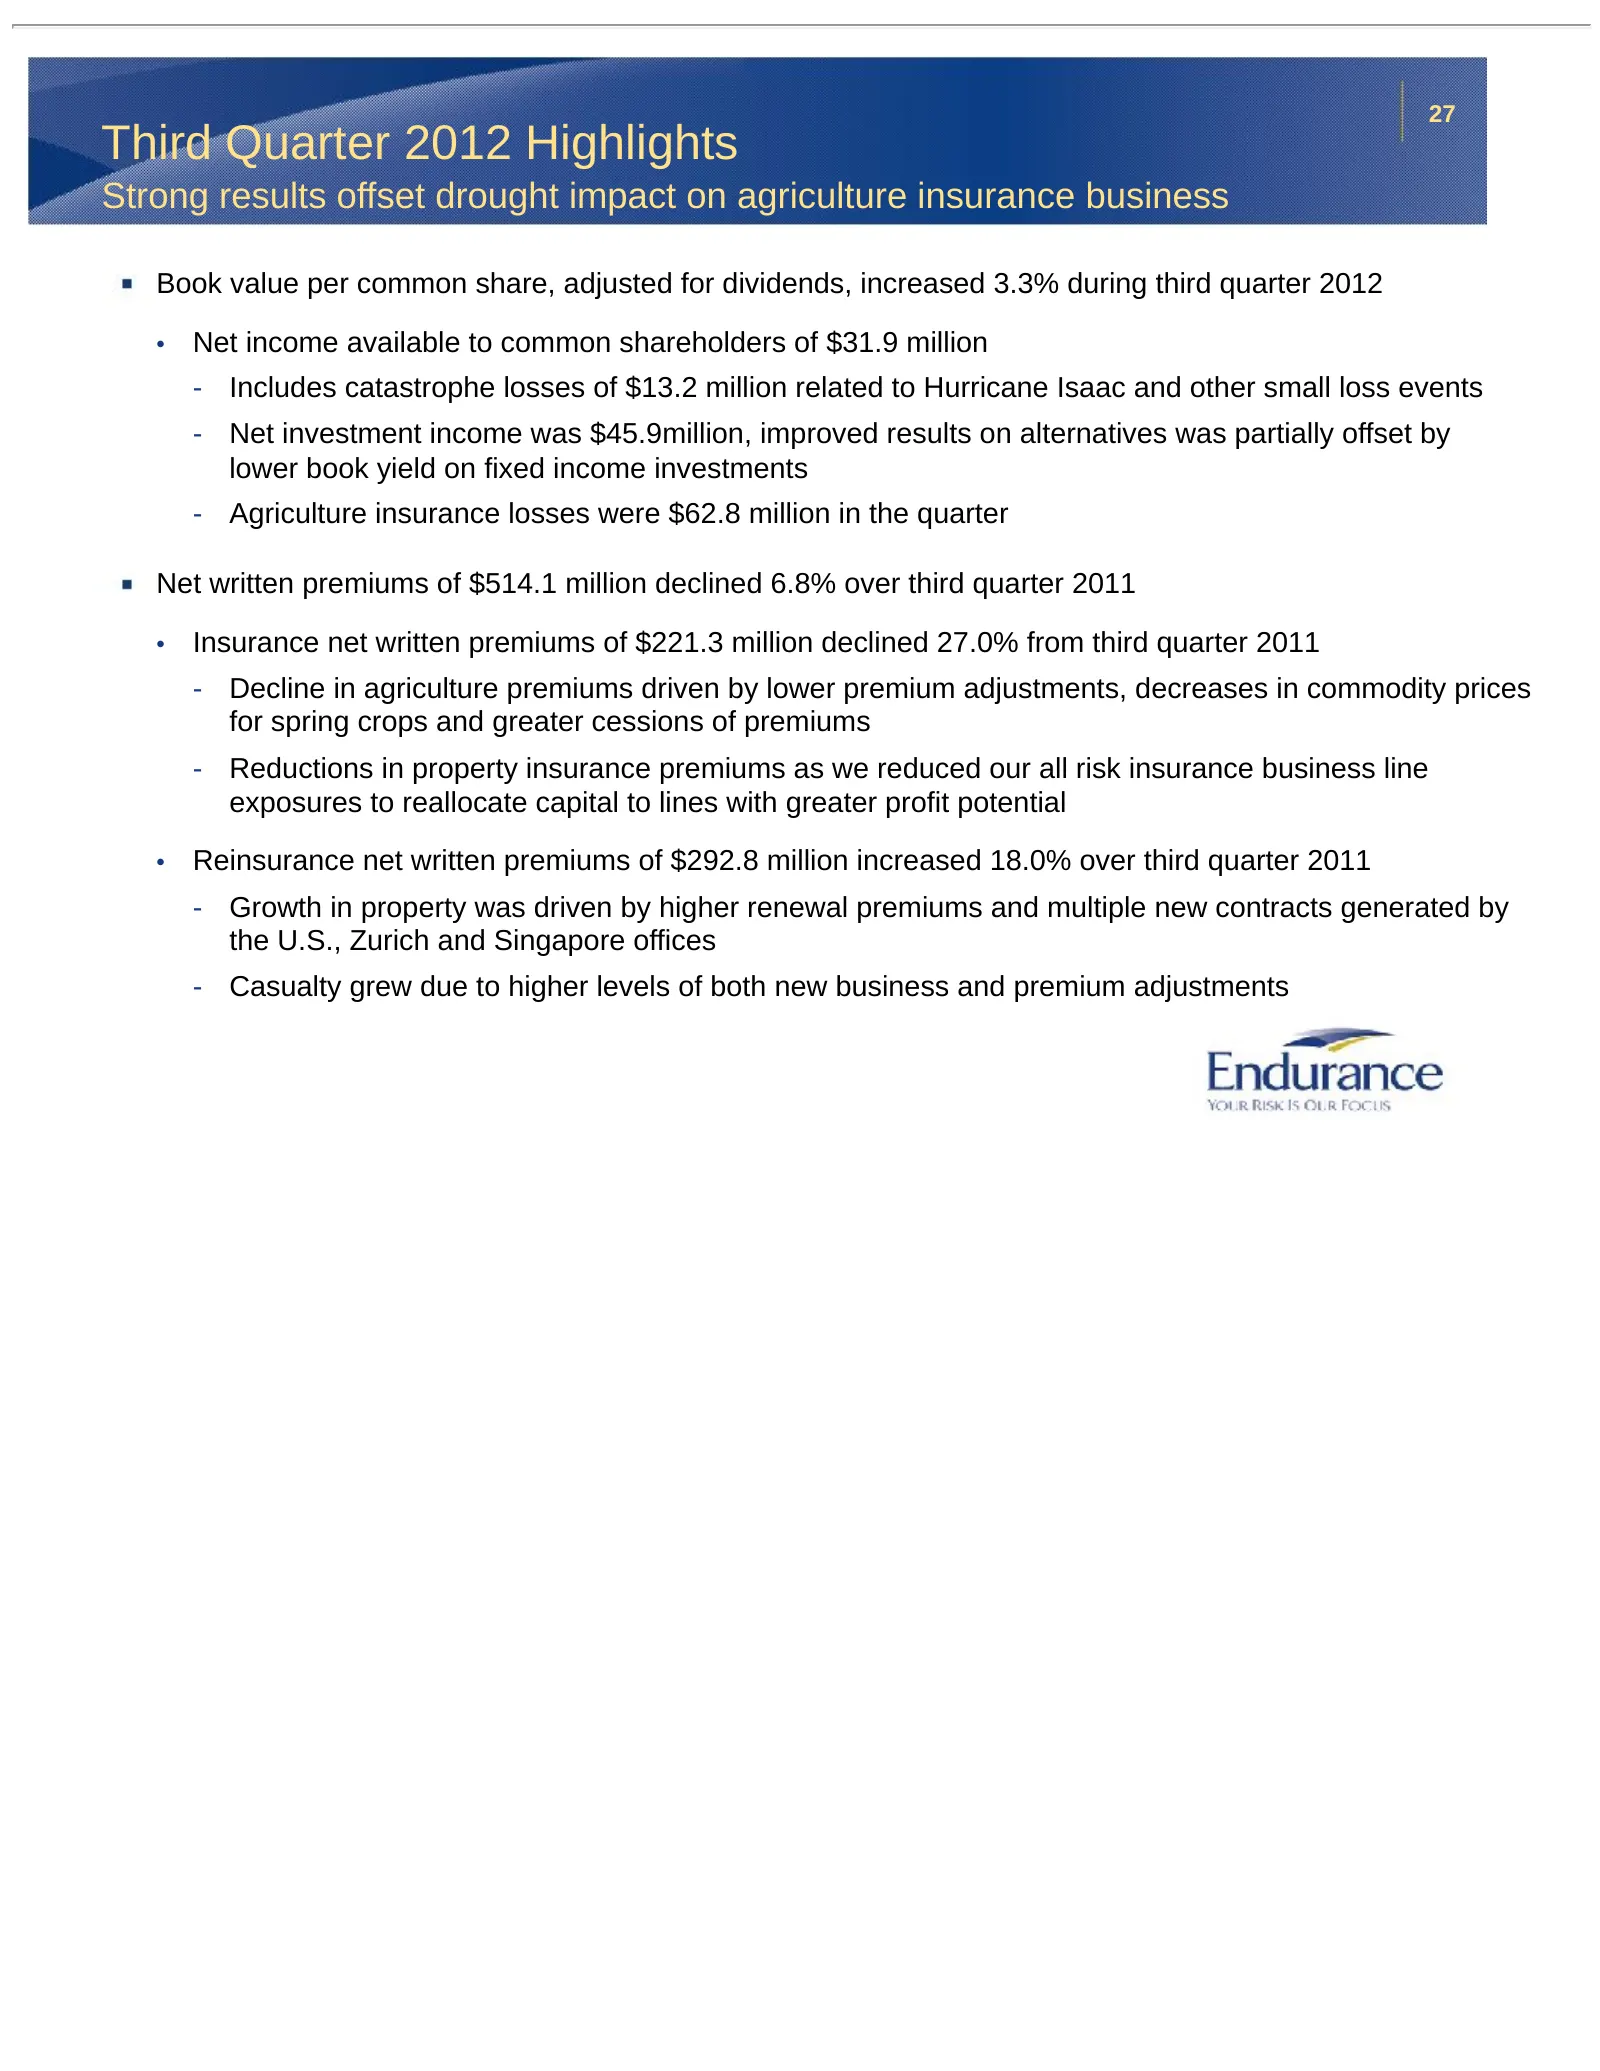
Slide 27: Third Quarter 2012 Highlights
27 Third Quarter 2012 Highlights Strong results offset drought impact on agriculture insurance business Book value per common share, adjusted for dividends, increased 3.3% during third quarter 2012 • Net income available to common shareholders of $31.9 million - Includes catastrophe losses of $13.2
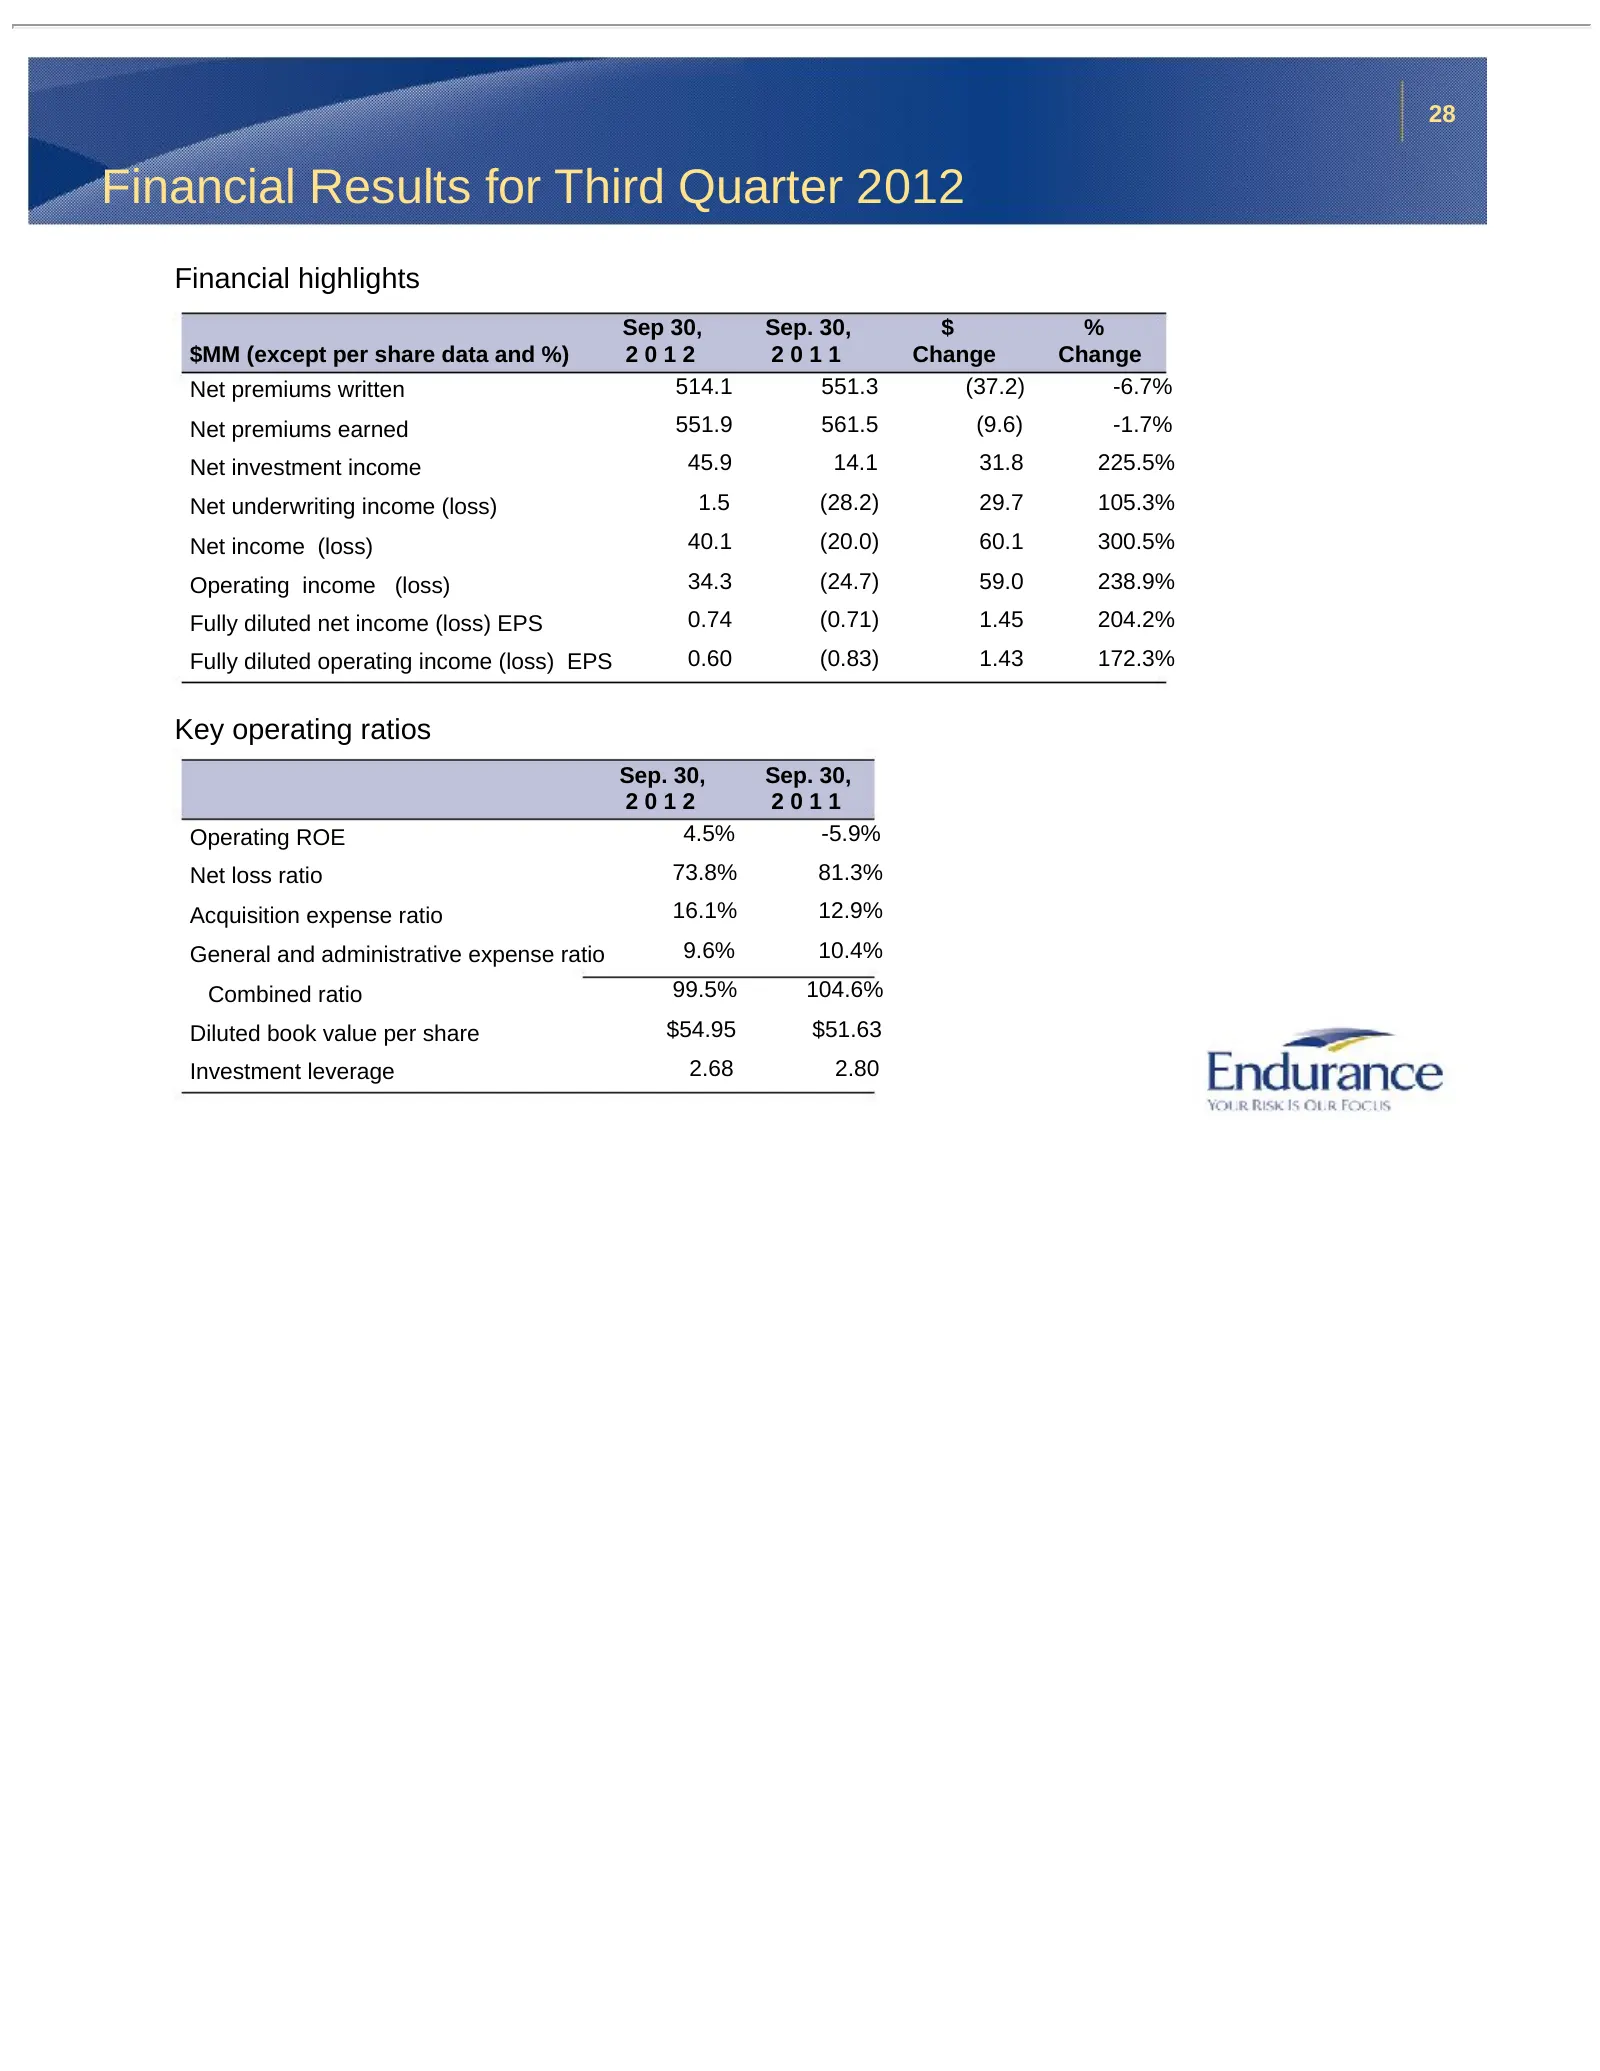
Slide 28: Financial Results for Third Quarter 2012
28 Financial Results for Third Quarter 2012 Financial highlights Sep 30, Sep. 30, $ % $MM (except per share data and %) 2012 2011 Change Change Net premiums written 514.1 551.3 (37.2) -6.7% Net premiums earned 551.9 561.5 (9.6) -1.7% Net investment income 45.9 14.1 31.8 225.5% Net underwriting incom
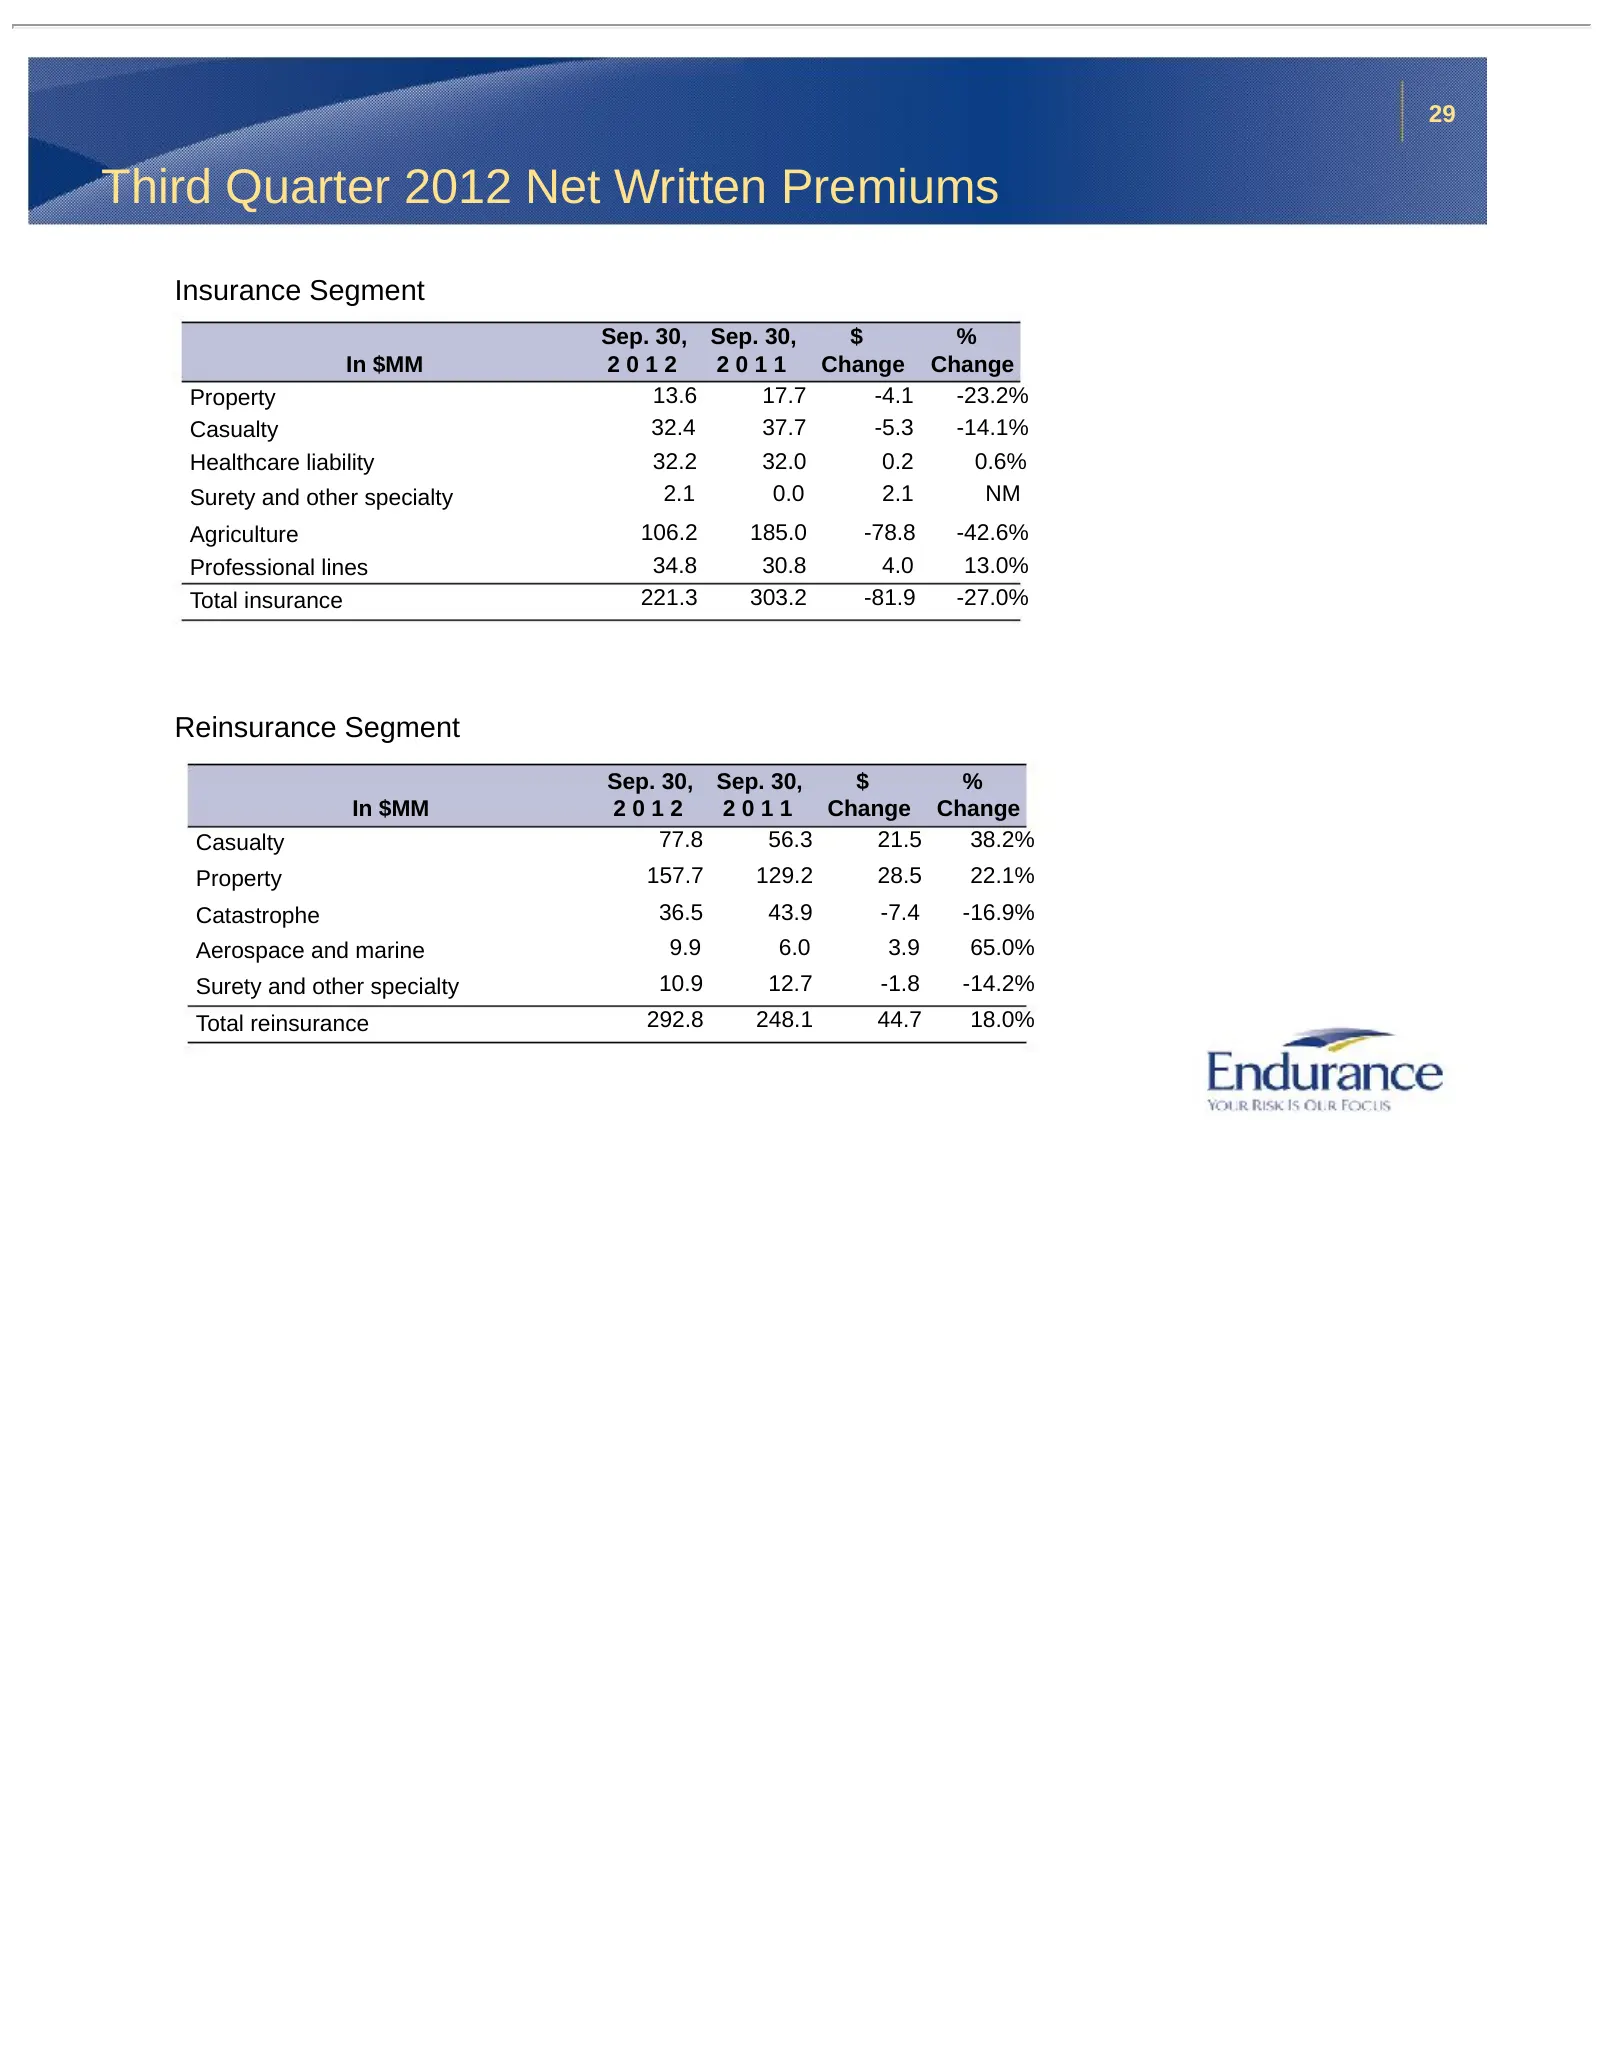
Slide 29: Third Quarter 2012 Net Written Premiums
29 Third Quarter 2012 Net Written Premiums Insurance Segment Sep. 30, Sep. 30, $ % In $MM 2012 2011 Change Change Property 13.6 17.7 -4.1 -23.2% Casualty 32.4 37.7 -5.3 -14.1% Healthcare liability 32.2 32.0 0.2 0.6% Surety and other specialty 2.1 0.0 2.1 NM Agriculture 106.2 185.0 -78.8 -42.6% Profe
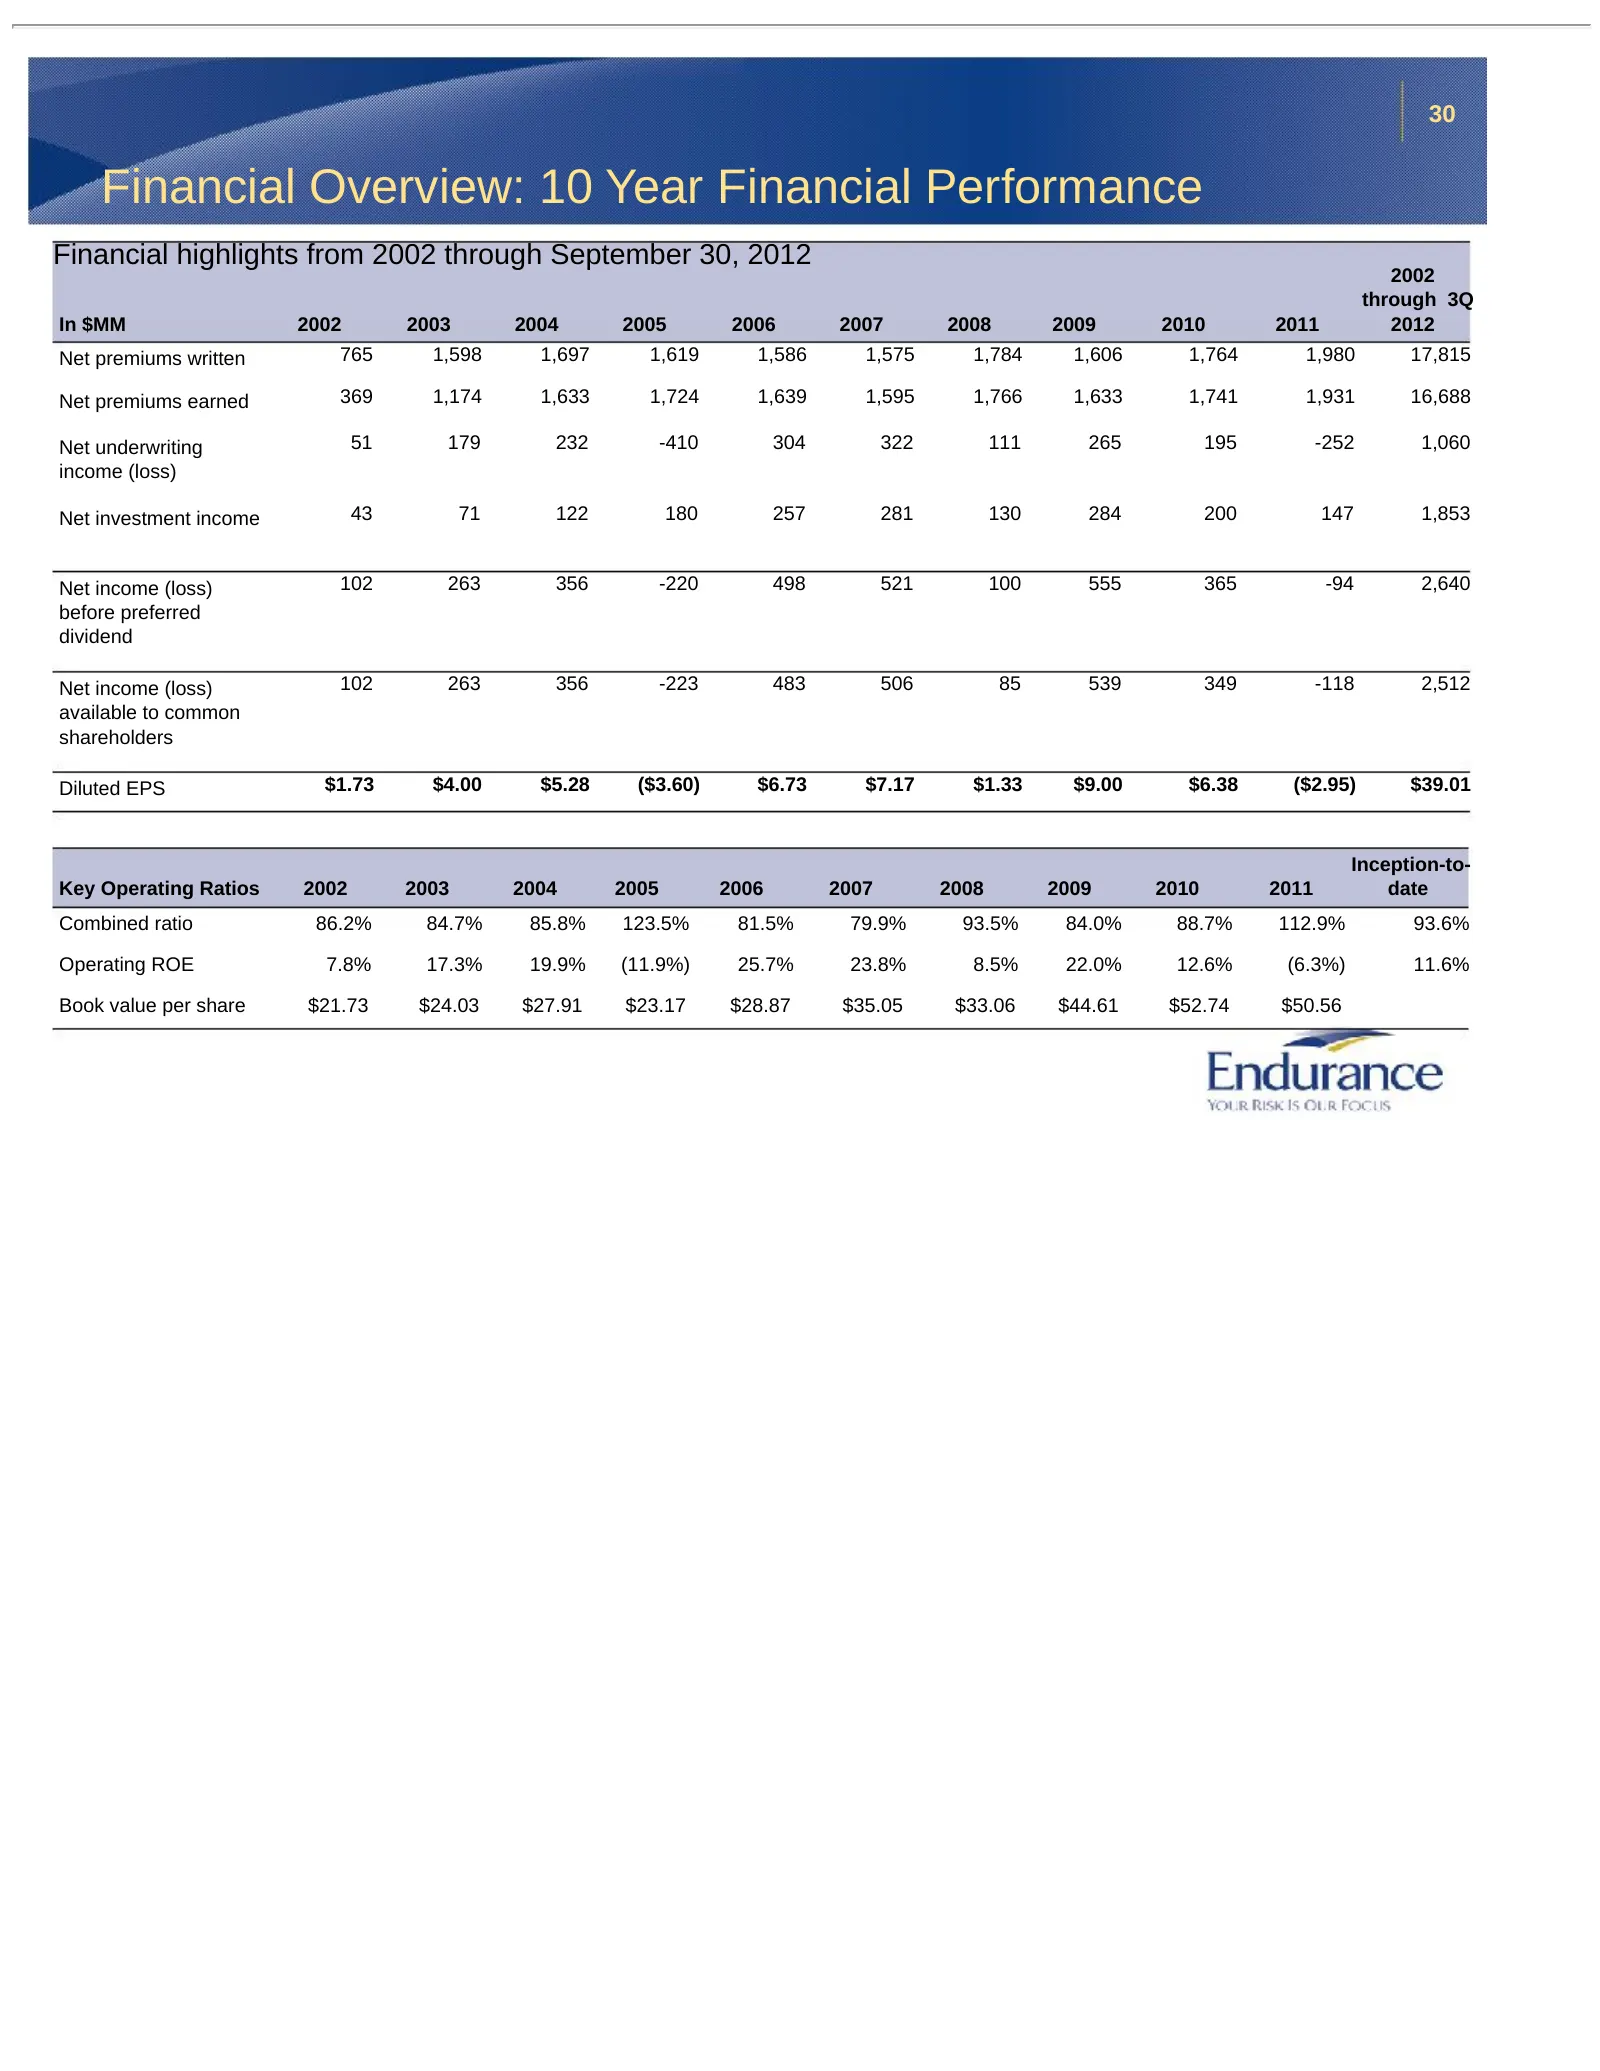
Slide 30: Financial Overview: 10 Year Financial Performance
30 Financial Overview: 10 Year Financial Performance Financial highlights from 2002 through September 30, 2012 2002 through 3Q In $MM 2002 2003 2004 2005 2006 2007 2008 2009 2010 2011 2012 Net premiums written 765 1,598 1,697 1,619 1,586 1,575 1,784 1,606 1,764 1,980 17,815 Net premiums earned 369 1
Source: SEC EDGAR · 8-K filed Nov 15, 2012
More decks from Endurance Specialty Holdings Ltd
 Merger or Acquisition (October 2016)17 slides · Oct 12, 2016
 Investor Presentation (August 2016)29 slides · Aug 9, 2016
 Investor Presentation (May 2016)28 slides · May 10, 2016
 Investor Presentation (February 2016)29 slides · Feb 9, 2016
 Investor Presentation (February 2015)28 slides · Feb 11, 2015
 Merger or Acquisition (April 2014)22 slides · Apr 14, 2014