NHPC Limited · NSE:NHPC
NHPC — Investor Presentation (February 2015)
28 slides from NHPC's investor presentation, February 2015
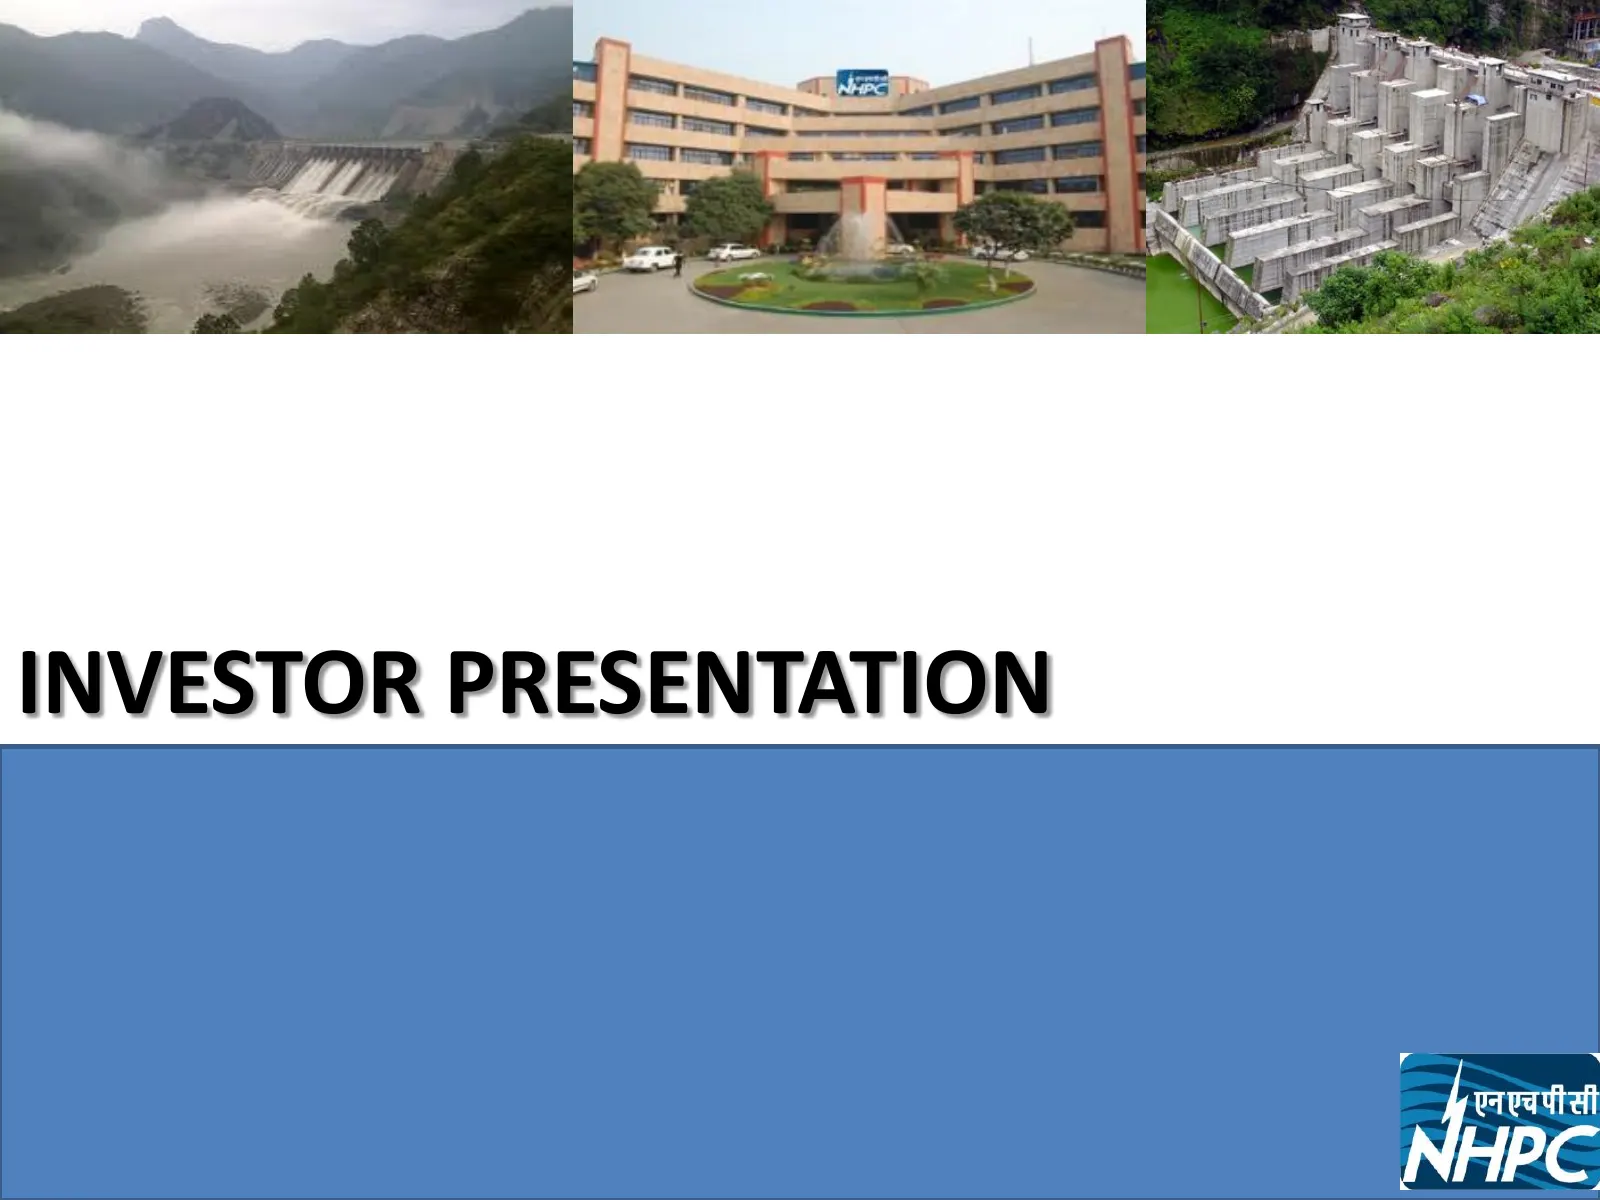
Slide 1: Investor Presentation
INVESTOR PRESENTATION
Slide 2: Outline
Outline NHPC Today Financial Highlights Other Business Development Initiatives Financial Ratios Projects At a Glance
Slide 3: NHPC Today
NHPC-Today A Mini Ratna Category–I Enterprise of Govt. of India with a Paid Up Capital of Rs. 11070.67 Crore.
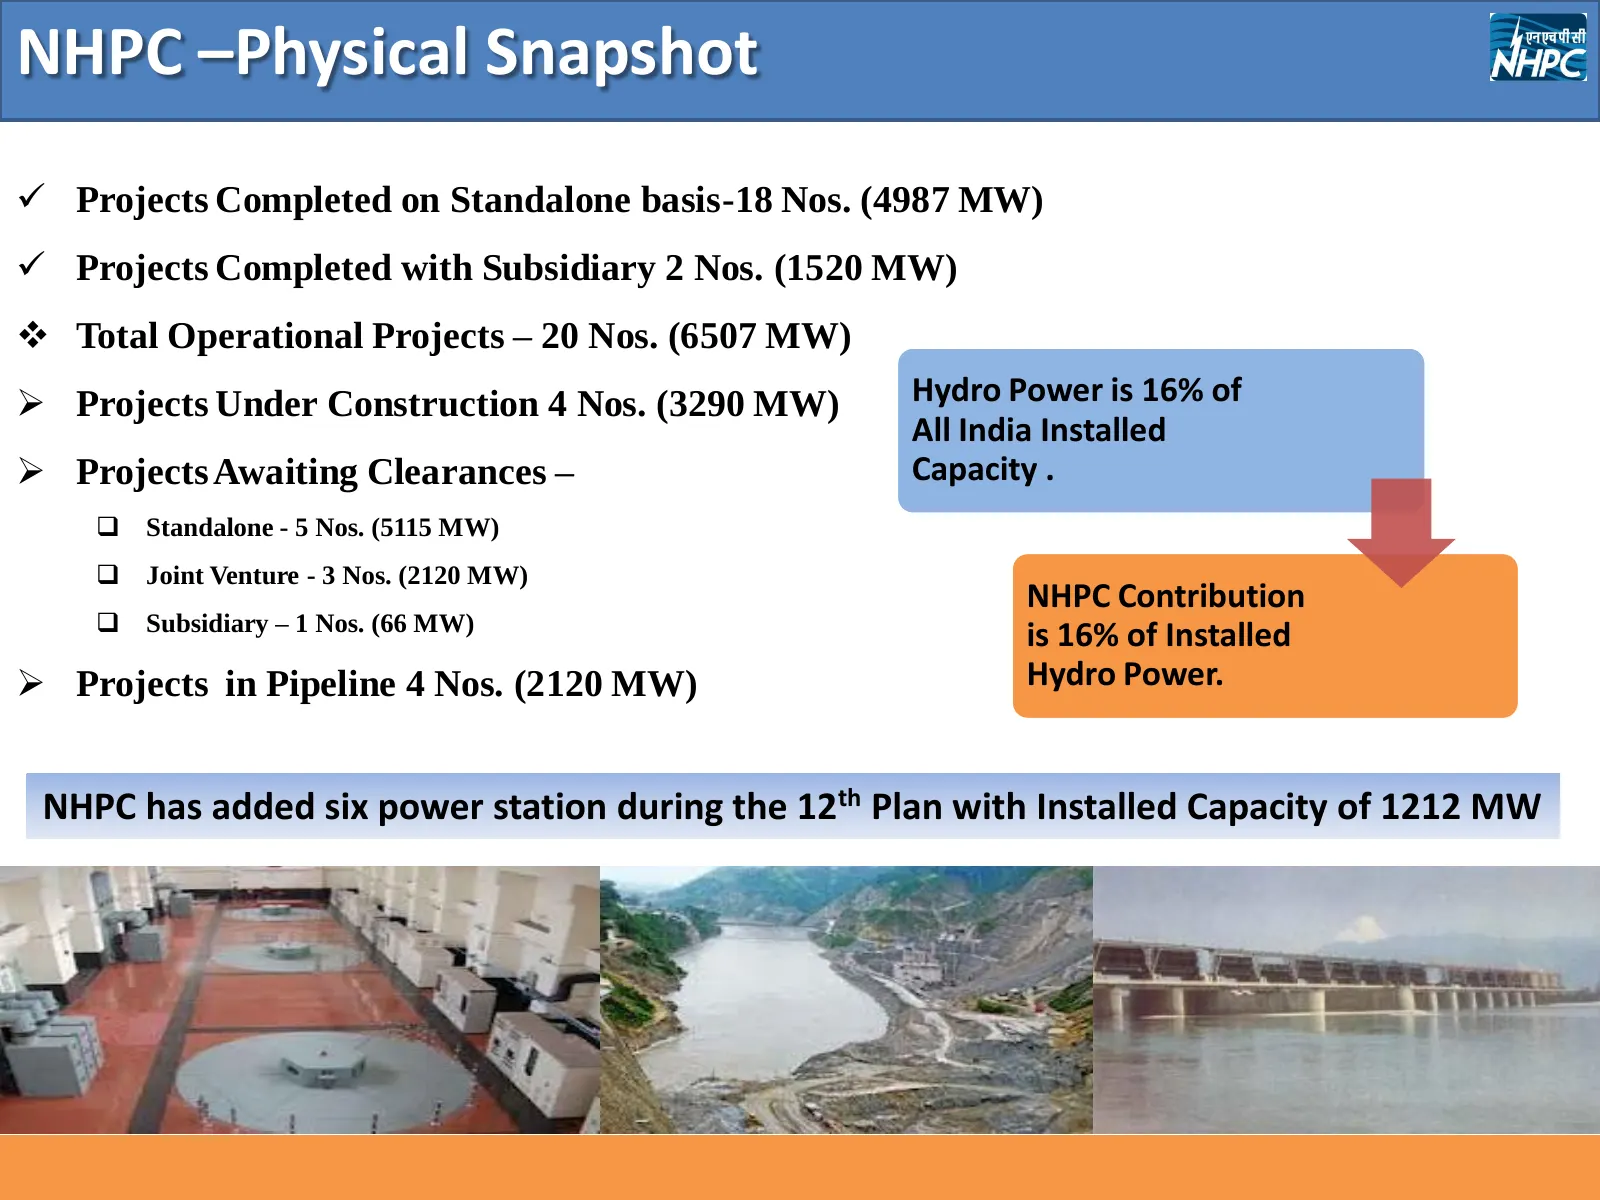
Slide 4: NHPC – Physical Snapshot
NHPC –Physical Snapshot Projects Completed on Standalone basis-18 Nos. (4987 MW) Projects Completed with Subsidiary 2 Nos. (1520 MW) Total Operational Projects – 20 Nos. (6507 MW) Projects Under Construction 4 Nos. (3290 MW) Hydro Power is 16% of All India Installed Projects Awaiting Clear
Slide 5: NHPC's Track Record – A Ten Year Digest
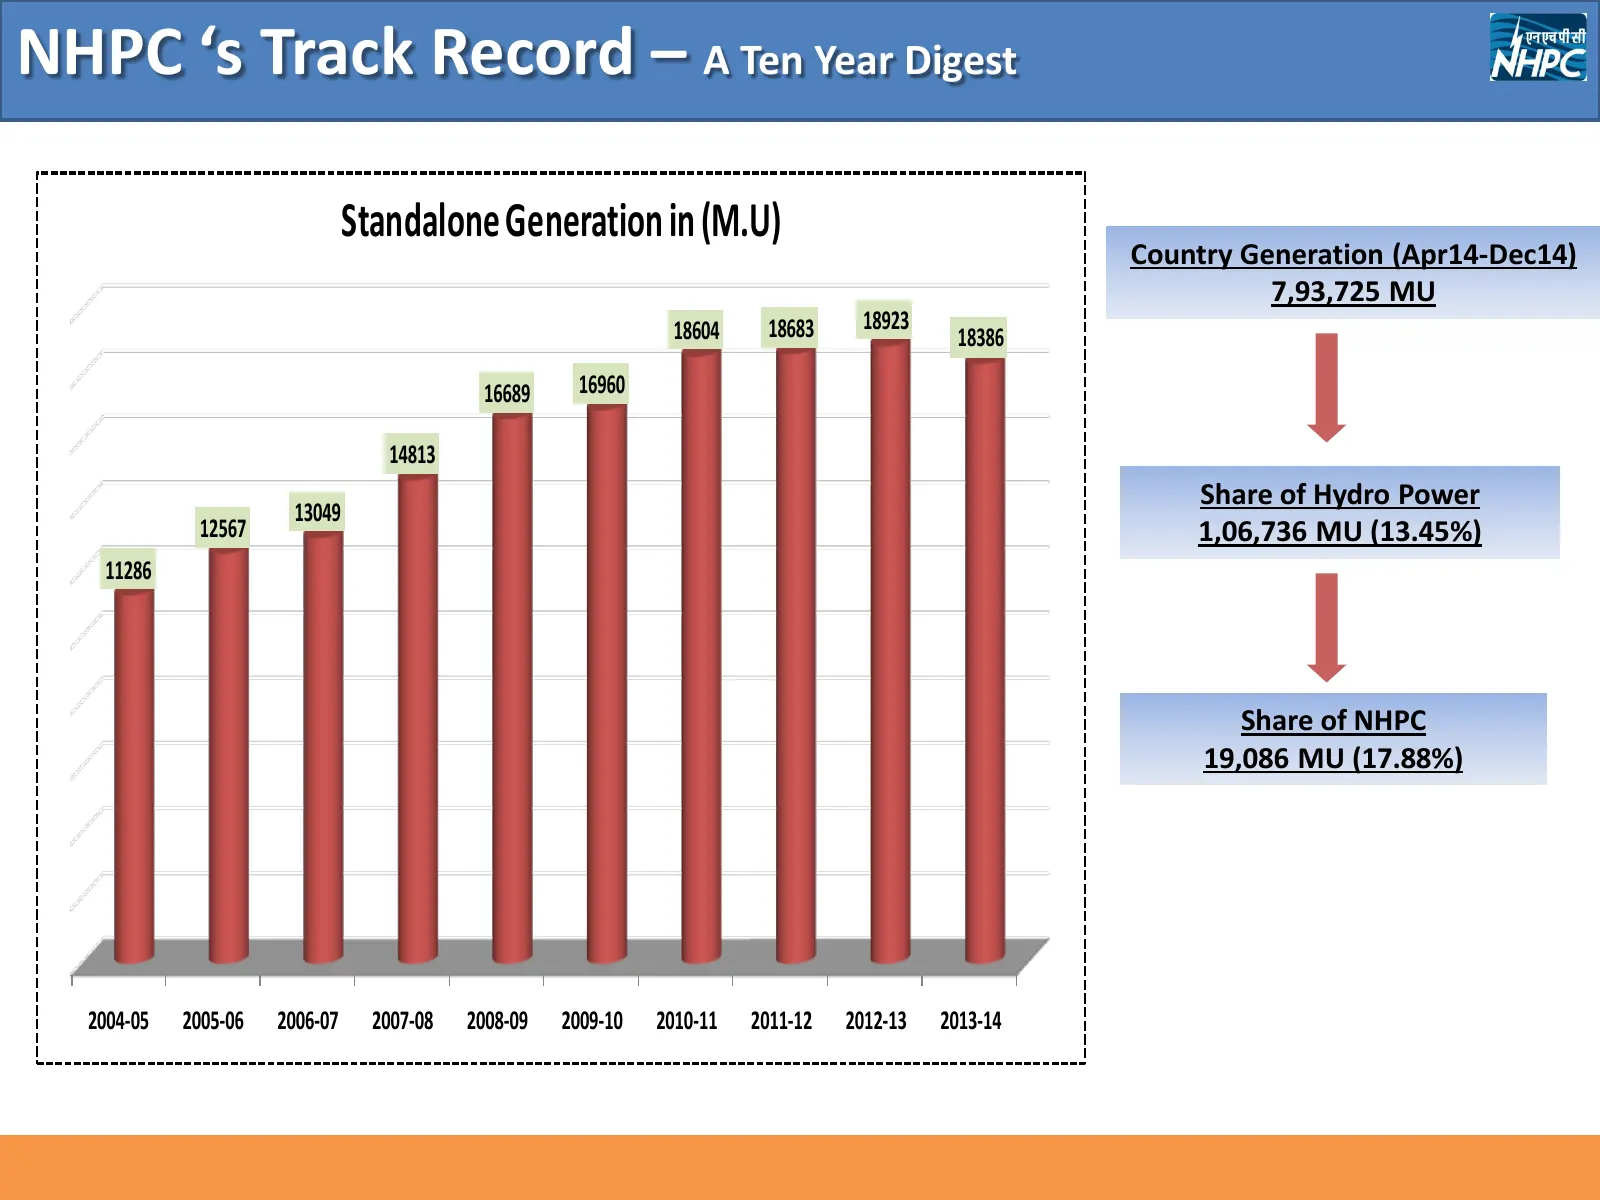
NHPC ‘s Track Record – A Ten Year Digest Standalone Generation in (M.U) Country Generation (Apr14-Dec14) 7,93,725 MU 18604 18683 18923 18386 16689 16960 14813 Share of Hydro Power 13049 12567 1,06,736 MU (13.45%) 11286 Share of NHPC 19,086 MU (17.88%) 2004-05 2005-06 2006-07 2007-08 2008-09 2009-10
Slide 6: NHPC - Financial Highlights
NHPC- Financial Highlights
Slide 7: Profit & Loss FY2014-15
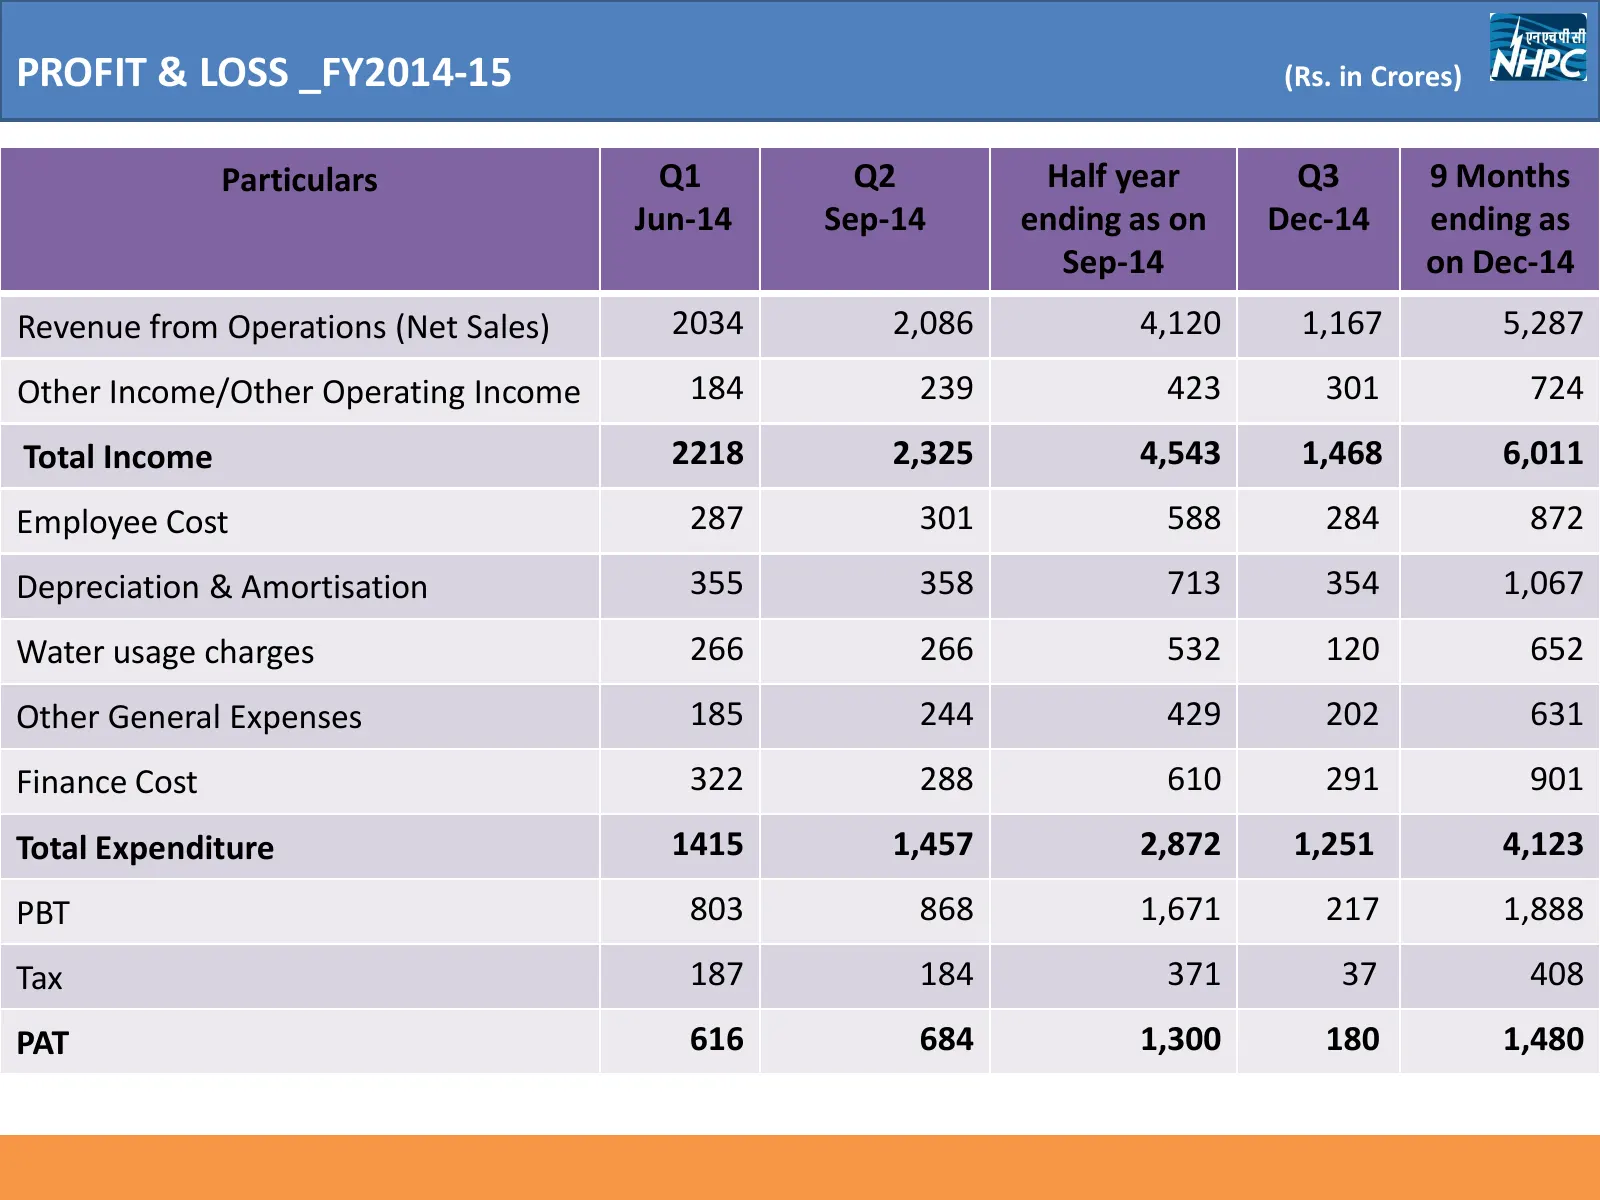
PROFIT & LOSS _FY2014-15 (Rs. in Crores) Particulars Q1 Q2 Half year Q3 9 Months Jun-14 Sep-14 ending as on Dec-14 ending as Sep-14 on Dec-14 Revenue from Operations (Net Sales) 2034 2,086 4,120 1,167 5,287 Other Income/Other Operating Income 184 239 423 301 724 Total Income 2218 2,325 4,543 1,468 6
Slide 8: Sale of Power - Debtor Details
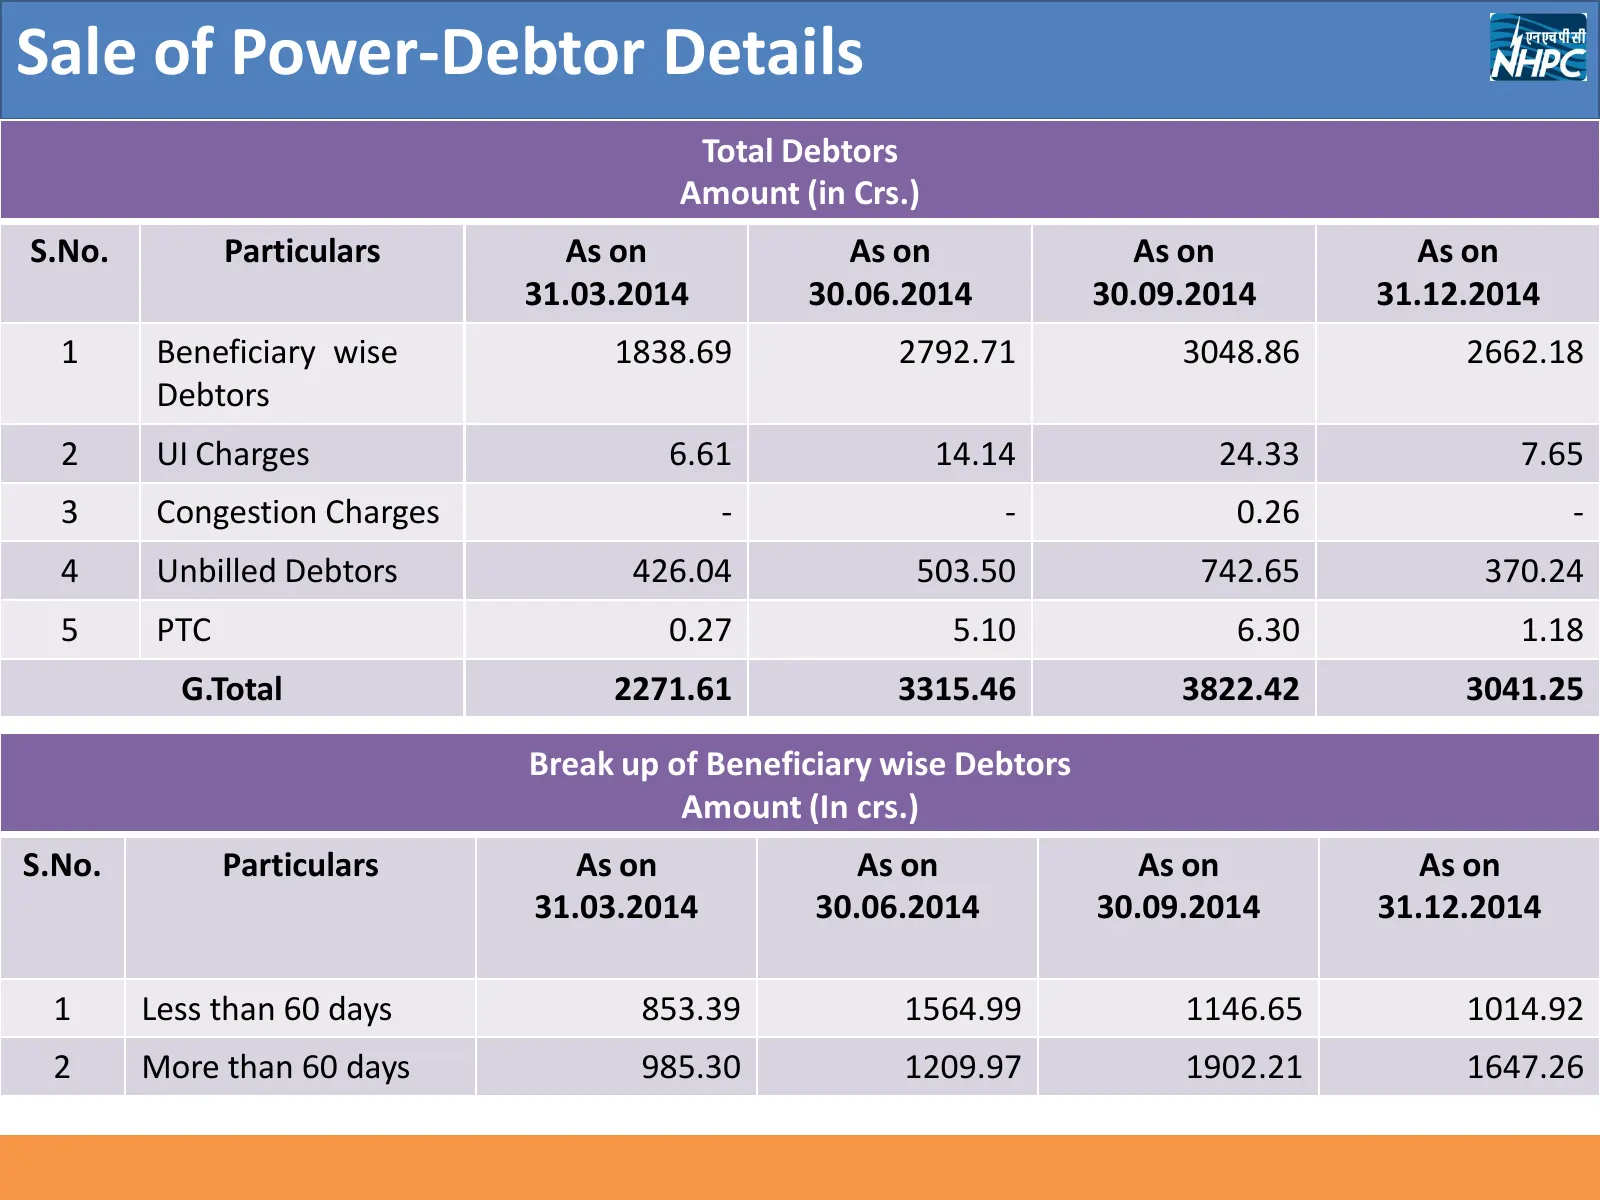
Sale of Power-Debtor Details Total Debtors Amount (in Crs.) S.No. Particulars As on As on As on As on 31.03.2014 30.06.2014 30.09.2014 31.12.2014 1 Beneficiary wise 1838.69 2792.71 3048.86 2662.18 Debtors 2 UI Charges 6.61 14.14 24.33 7.65 3 Congestion Charges - - 0.26 - 4 Unbilled Debtors 426.04 50
Slide 9: Sale of Power - Debtor Details
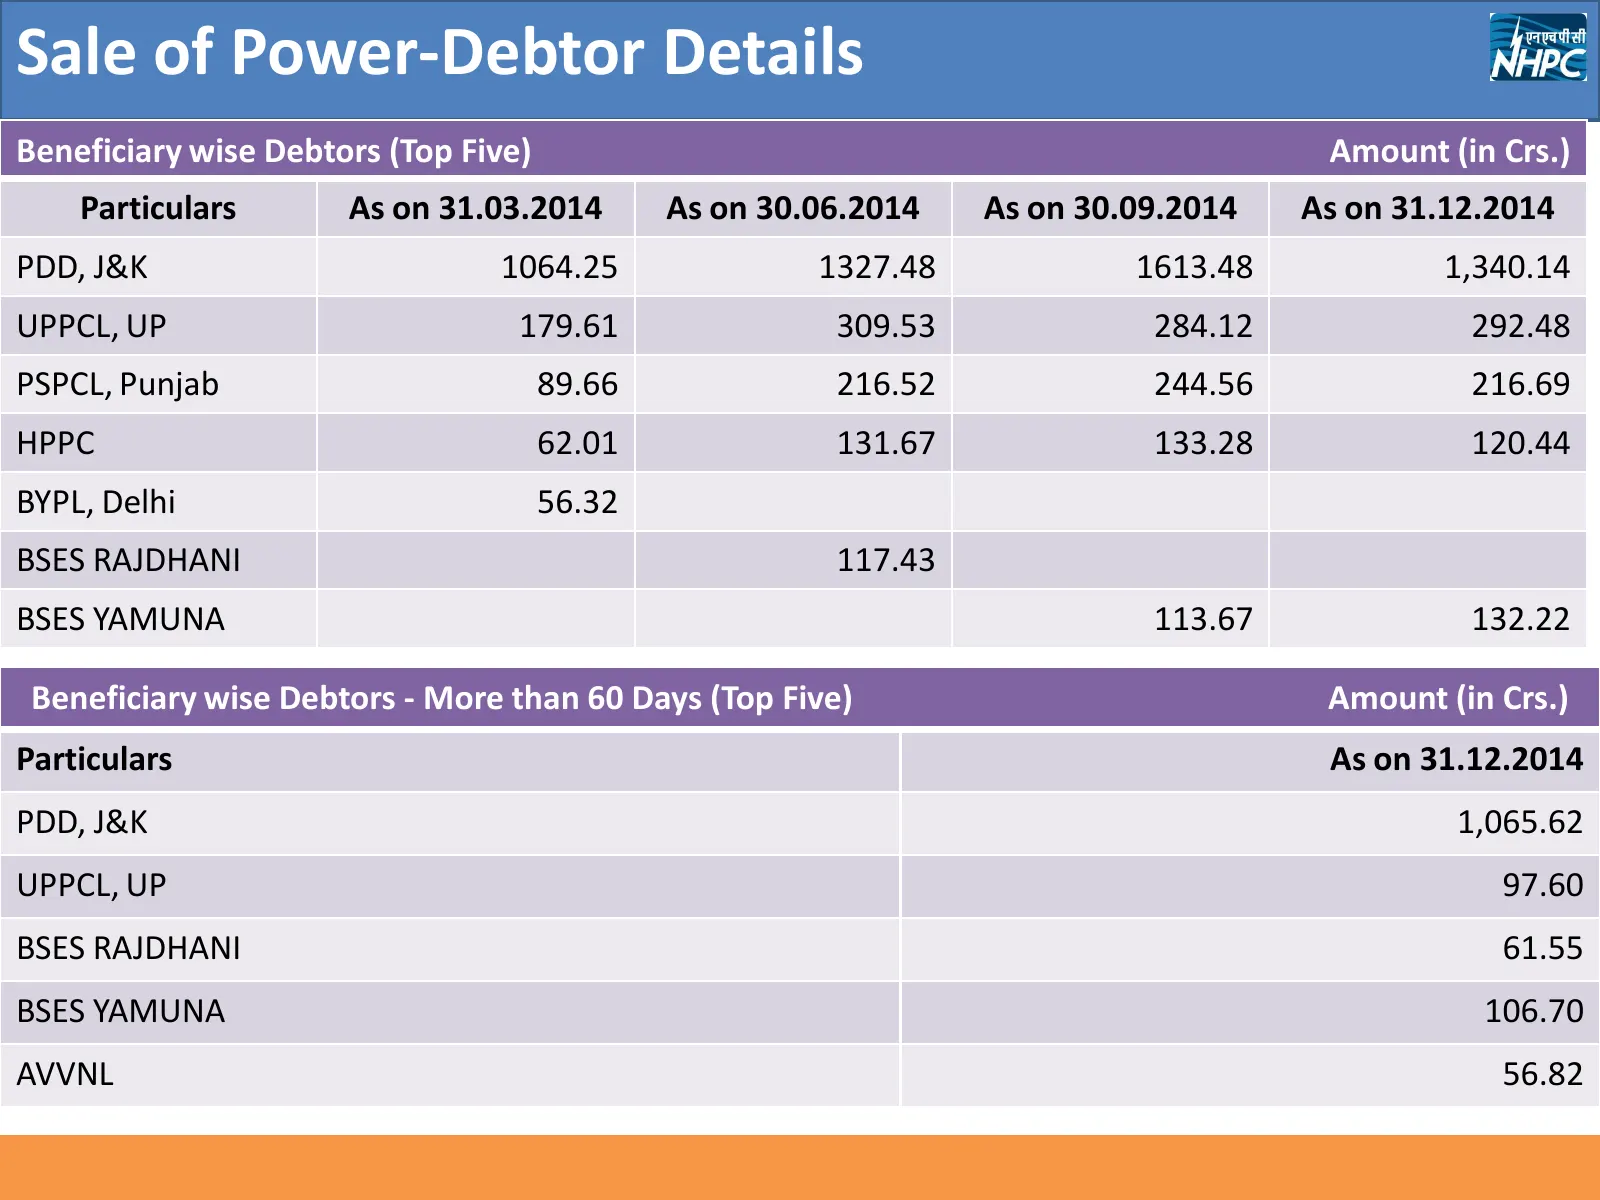
Sale of Power-Debtor Details Beneficiary wise Debtors (Top Five) Amount (in Crs.) Particulars As on 31.03.2014 As on 30.06.2014 As on 30.09.2014 As on 31.12.2014 PDD, J&K 1064.25 1327.48 1613.48 1,340.14 UPPCL, UP 179.61 309.53 284.12 292.48 PSPCL, Punjab 89.66 216.52 244.56 216.69 HPPC 62.01 131.67
Slide 10: Incentive Position
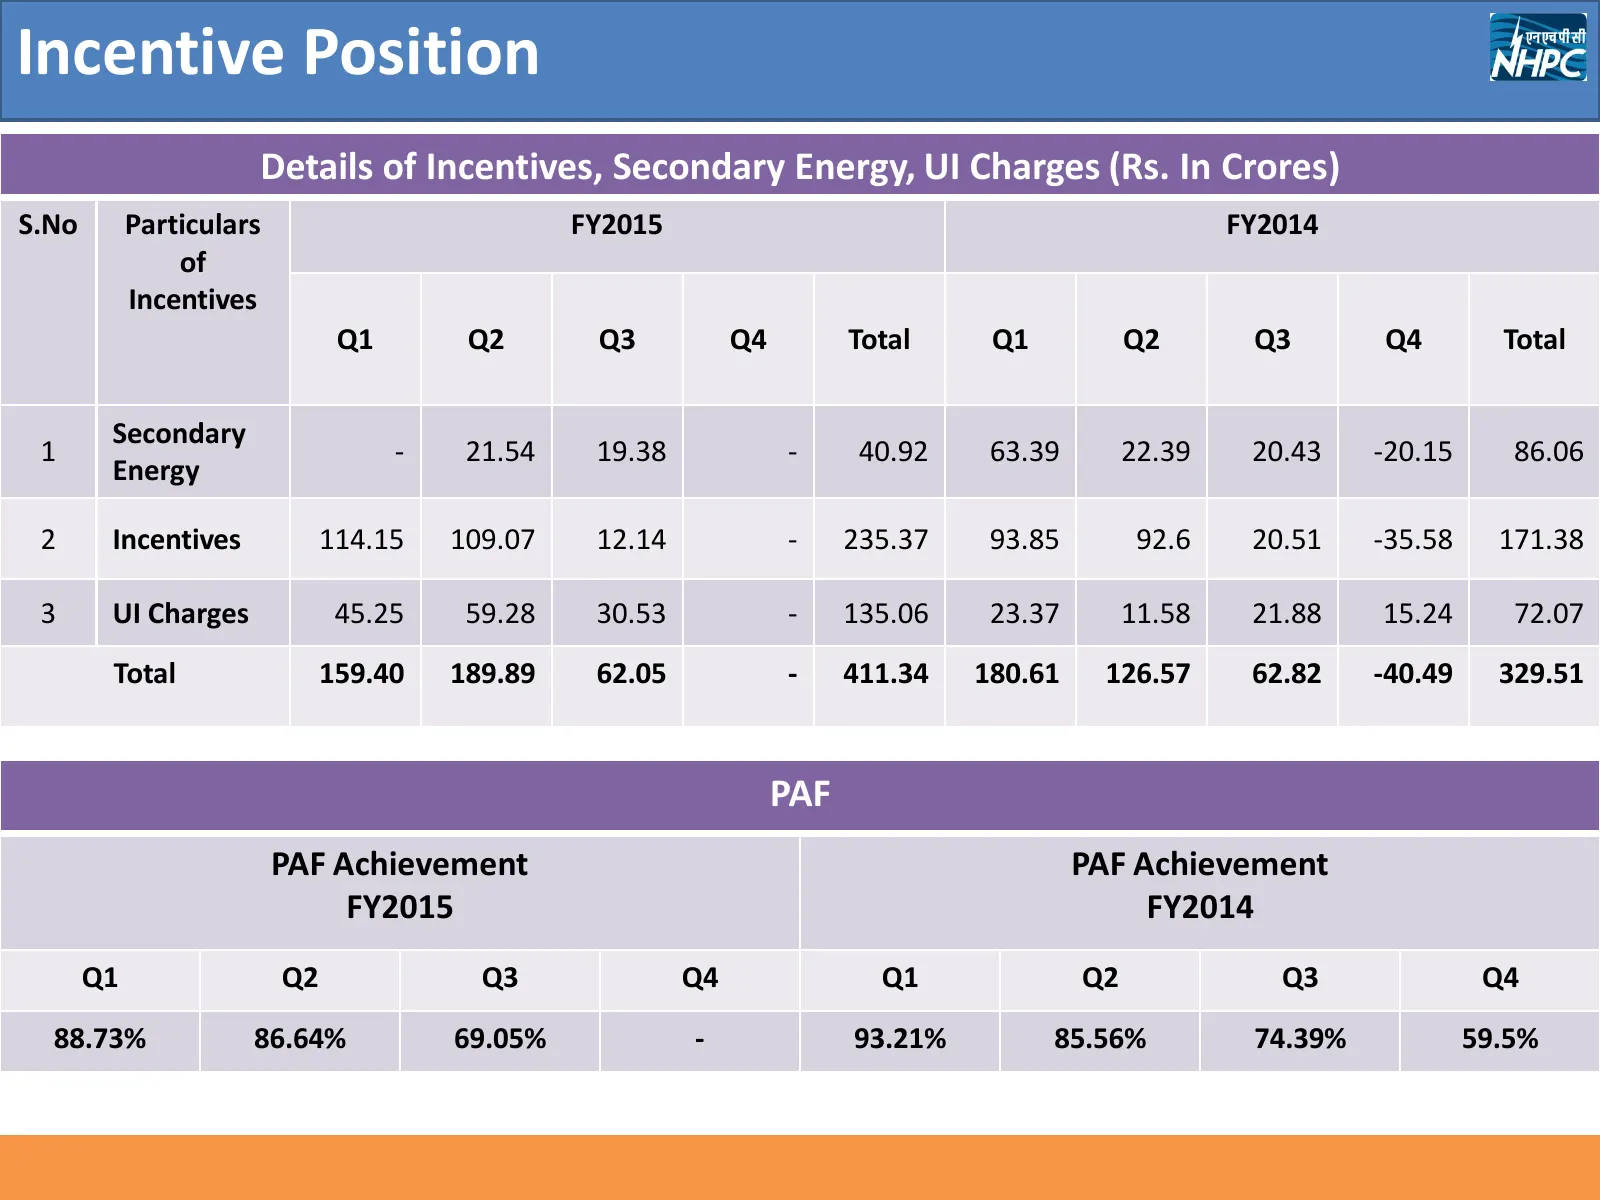
Incentive Position Details of Incentives, Secondary Energy, UI Charges (Rs. In Crores) S.No Particulars FY2015 FY2014 of Incentives Q1 Q2 Q3 Q4 Total Q1 Q2 Q3 Q4 Total Secondary 1 - 21.54 19.38 - 40.92 63.39 22.39 20.43 -20.15 86.06 Energy 2 Incentives 114.15 109.07 12.14 - 235.37 93.85 92.6 20.51 -
Slide 11: Gross Block V/s CWIP
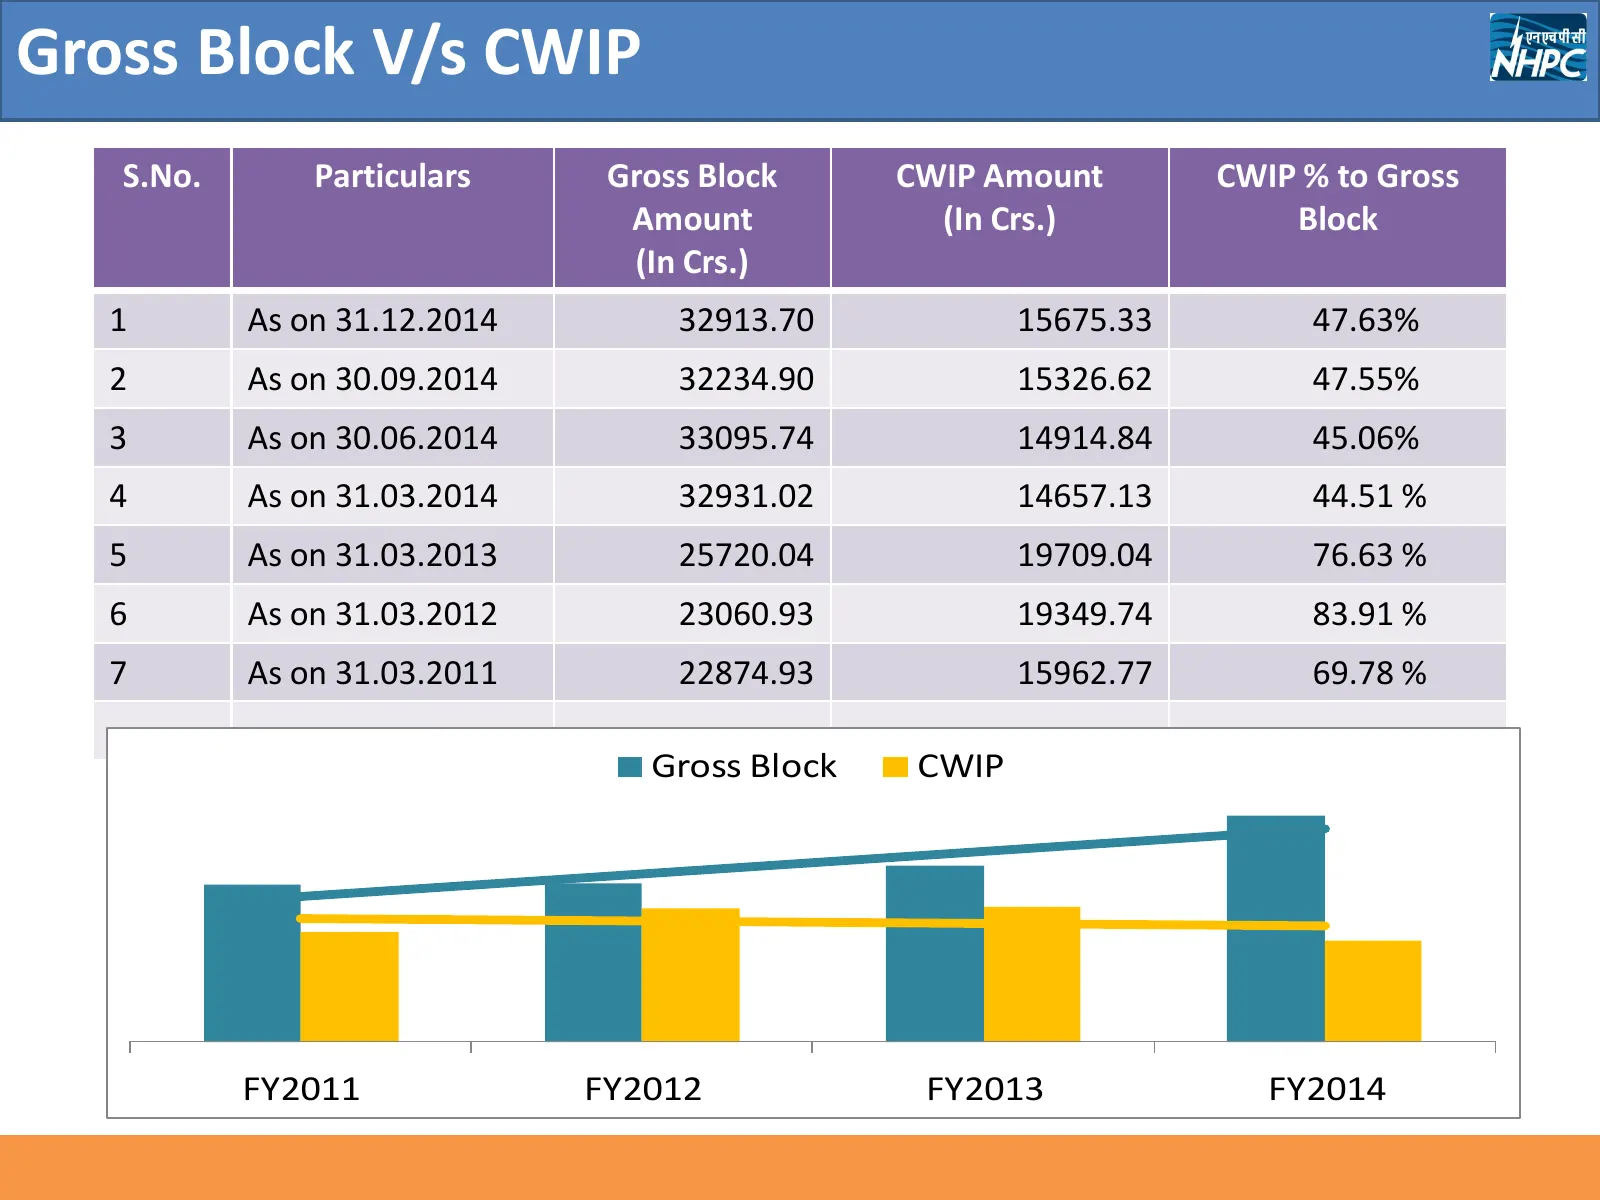
Gross Block V/s CWIP S.No. Particulars Gross Block CWIP Amount CWIP % to Gross Amount (In Crs.) Block (In Crs.) 1 As on 31.12.2014 32913.70 15675.33 47.63% 2 As on 30.09.2014 32234.90 15326.62 47.55% 3 As on 30.06.2014 33095.74 14914.84 45.06% 4 As on 31.03.2014 32931.02 14657.13 44.51 % 5 As on 31.
Slide 12: NHPC – Regulated Equity
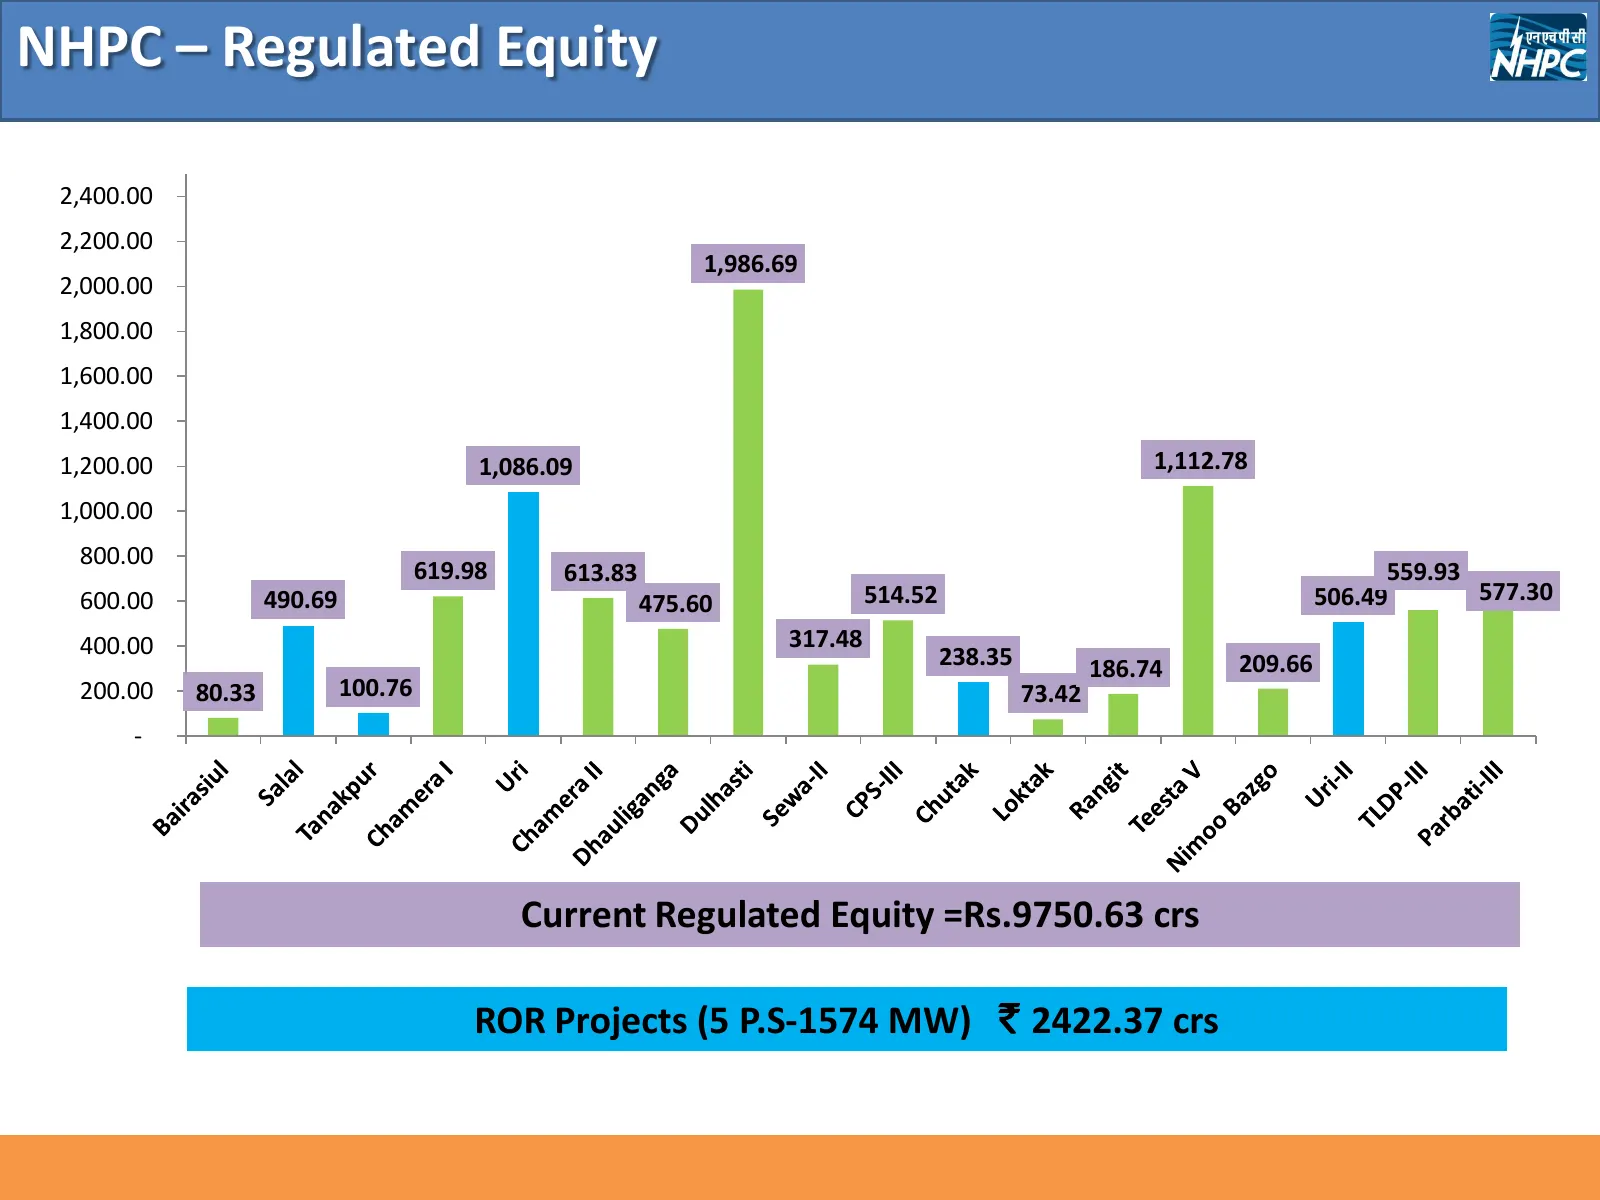
NHPC – Regulated Equity 2,400.00 2,200.00 1,986.69 2,000.00 1,800.00 1,600.00 1,400.00 1,200.00 1,086.09 1,112.78 1,000.00 800.00 619.98 613.83 559.93 600.00 490.69 475.60 514.52 506.49 577.30 400.00 317.48 238.35 186.74 209.66 200.00 80.33 100.76 73.42 - Current Regulated Equity =Rs.9750.63 crs ROR
Slide 13: NHPC - Achievements During the Current Fiscal
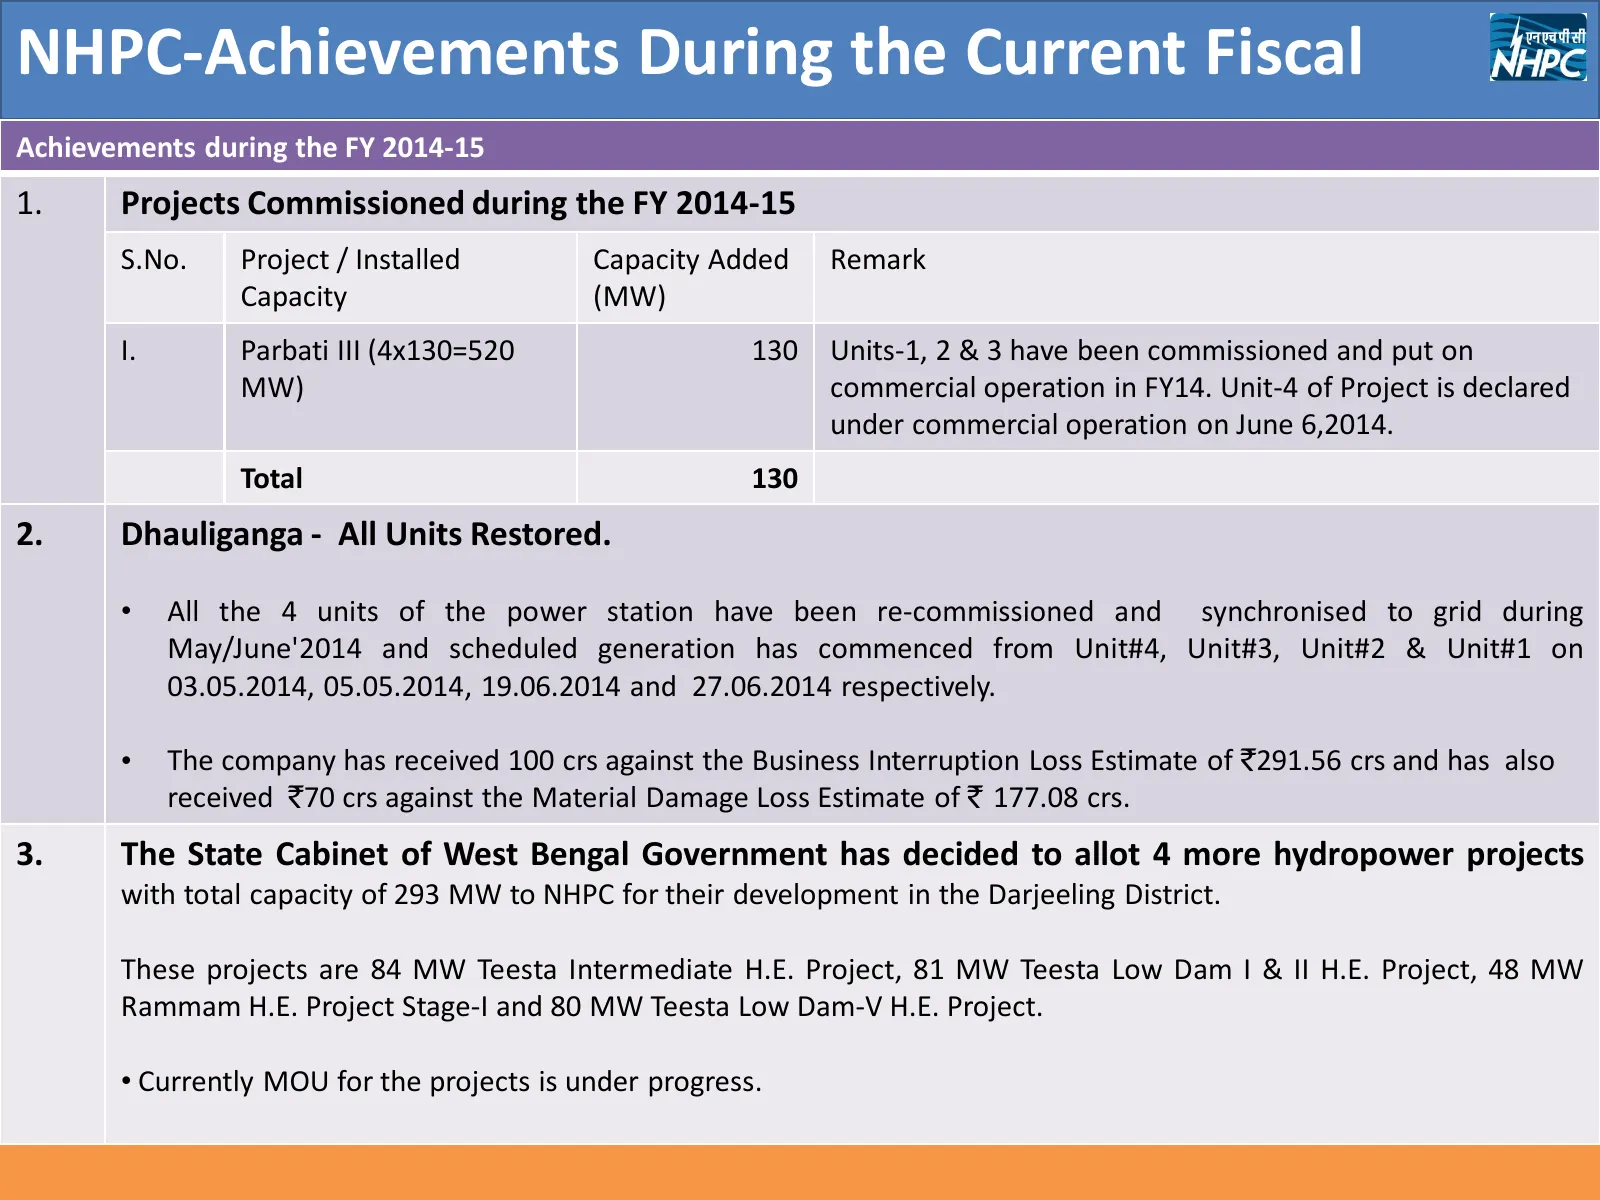
NHPC-Achievements During the Current Fiscal Achievements during the FY 2014-15 1. Projects Commissioned during the FY 2014-15 S.No. Project / Installed Capacity Added Remark Capacity (MW) I. Parbati III (4x130=520 130 Units-1, 2 & 3 have been commissioned and put on MW) commercial operation in FY14.
Slide 14: NHPC - Other Business Development Initiatives
NHPC- Other Business Development Initiatives Solar Energy Wind Energy Thermal Energy
Slide 15: Renewable Energy Initiatives – Solar Power
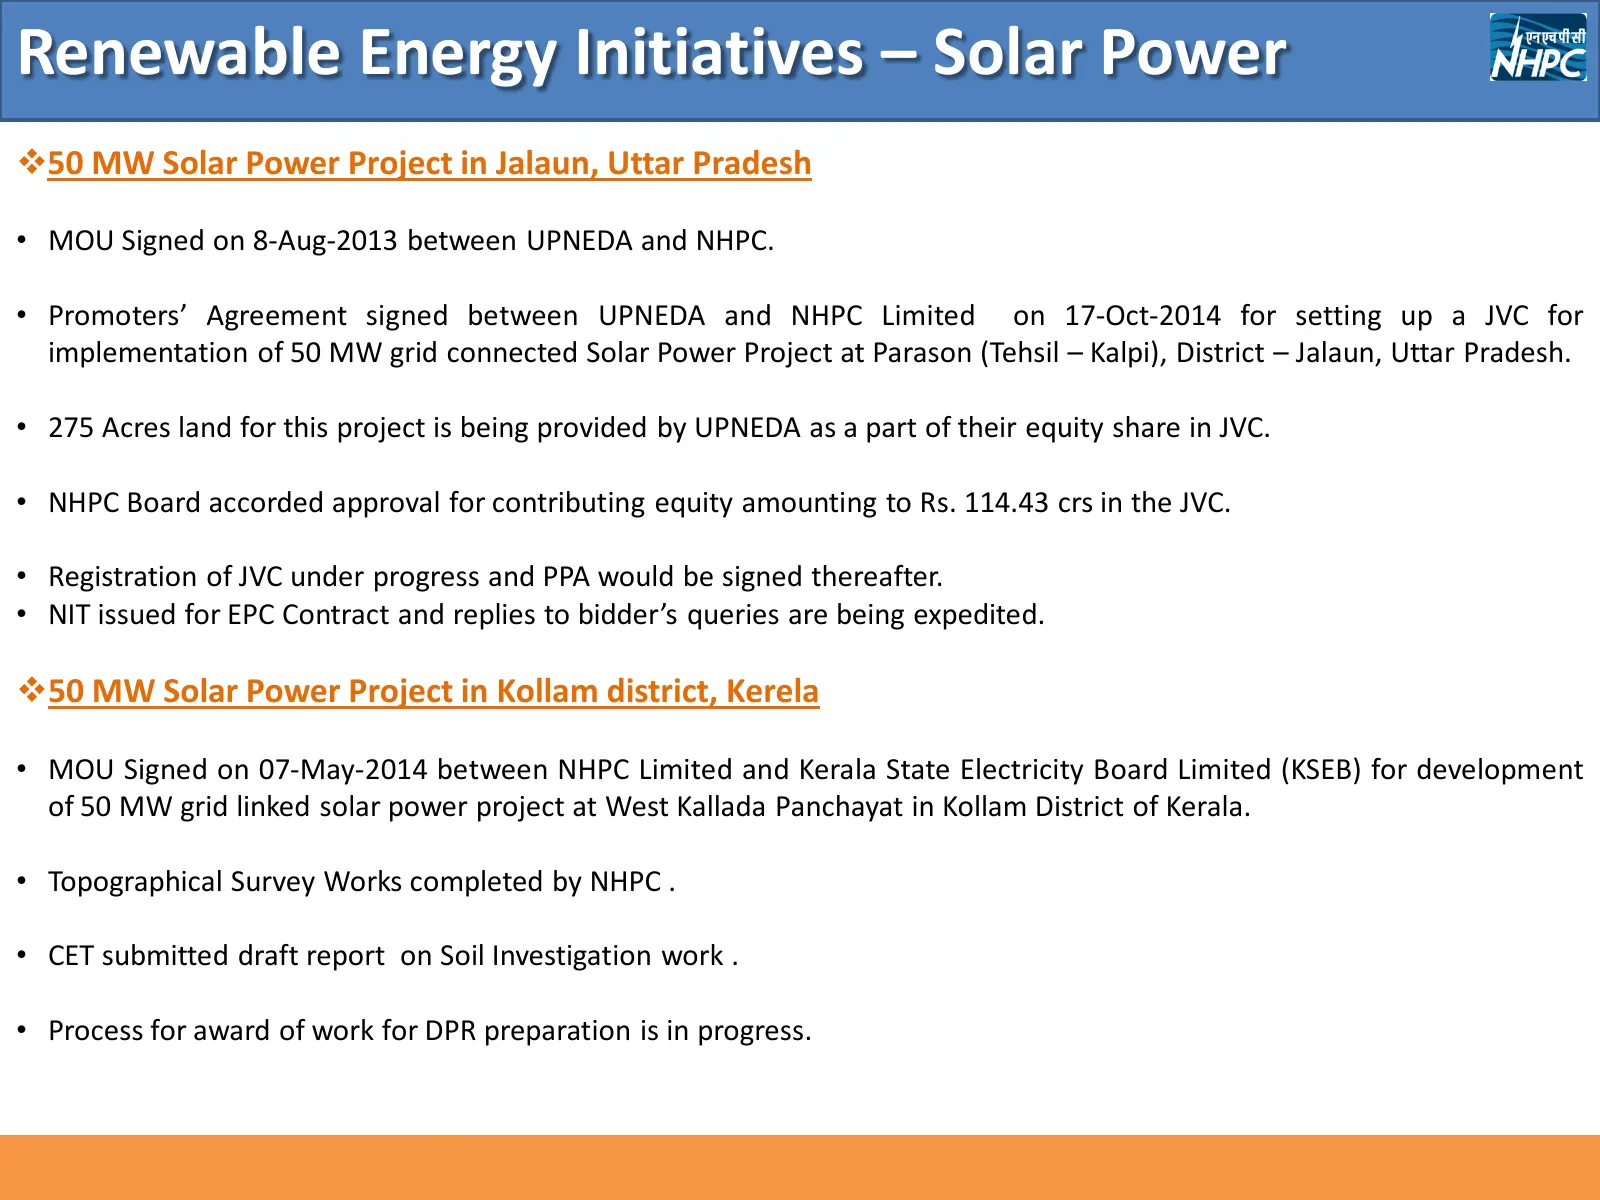
Renewable Energy Initiatives – Solar Power 50 MW Solar Power Project in Jalaun, Uttar Pradesh • MOU Signed on 8-Aug-2013 between UPNEDA and NHPC. • Promoters’ Agreement signed between UPNEDA and NHPC Limited on 17-Oct-2014 for setting up a JVC for implementation of 50 MW grid connected Solar Power
Slide 16: Renewable Energy Initiatives – Wind Power
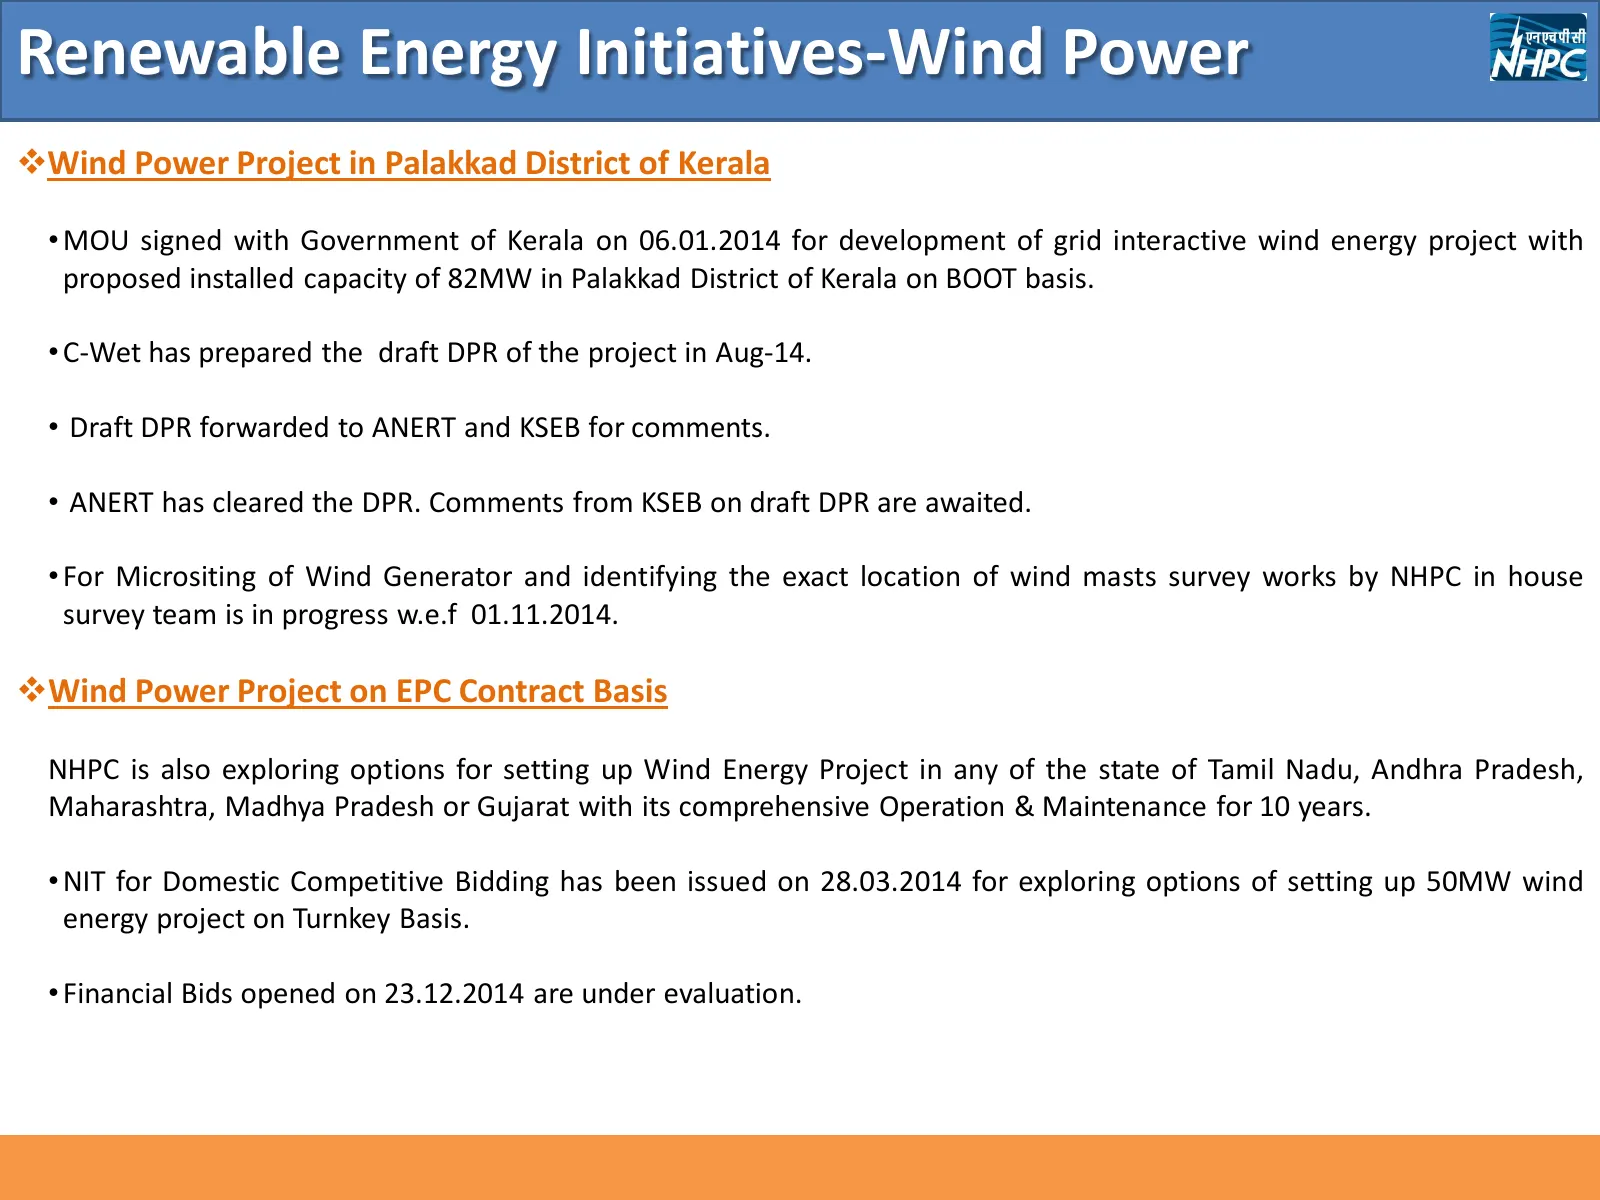
Renewable Energy Initiatives-Wind Power Wind Power Project in Palakkad District of Kerala • MOU signed with Government of Kerala on 06.01.2014 for development of grid interactive wind energy project with proposed installed capacity of 82MW in Palakkad District of Kerala on BOOT basis. • C-Wet has p
Slide 17: Thermal Power
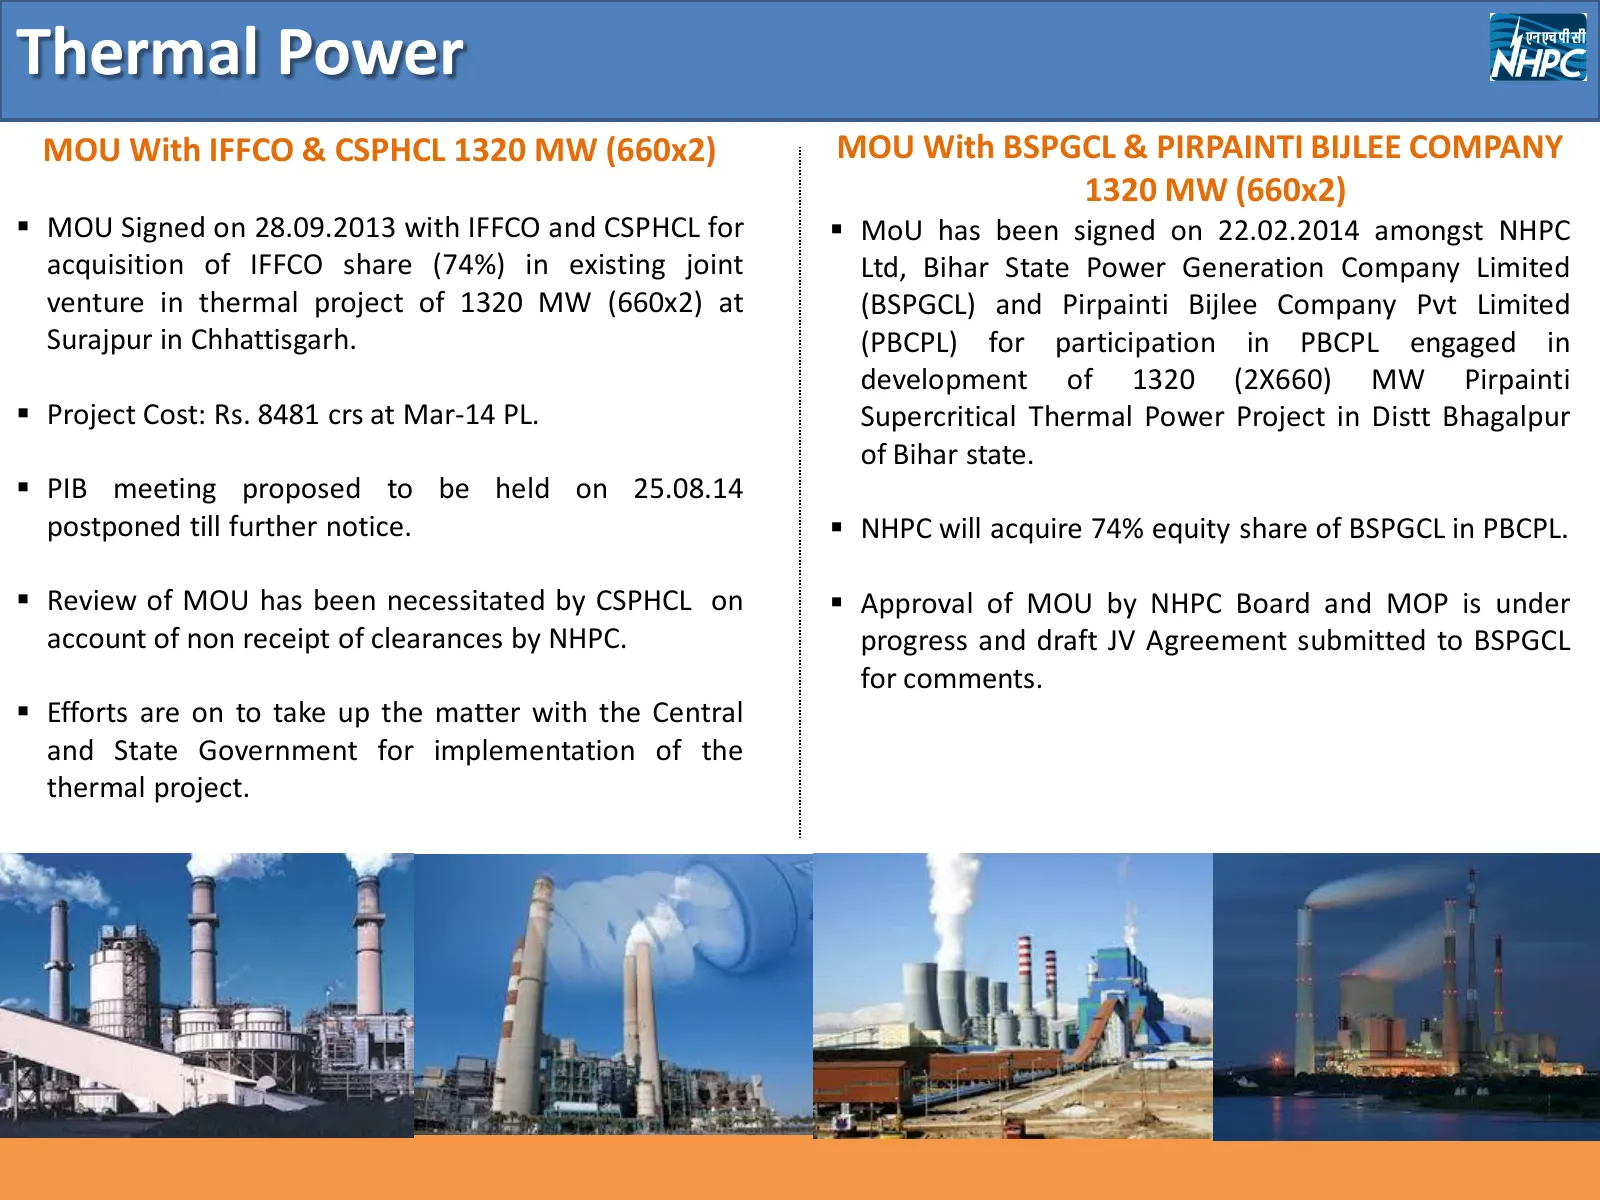
Thermal Power MOU With IFFCO & CSPHCL 1320 MW (660x2) MOU With BSPGCL & PIRPAINTI BIJLEE COMPANY 1320 MW (660x2) MOU Signed on 28.09.2013 with IFFCO and CSPHCL for MoU has been signed on 22.02.2014 amongst NHPC acquisition of IFFCO share (74%) in existing joint Ltd, Bihar State Power Generation
Slide 18: NHPC - Financial Ratios
NHPC- Financial Ratios
Slide 19: NHPC – Financial Ratios
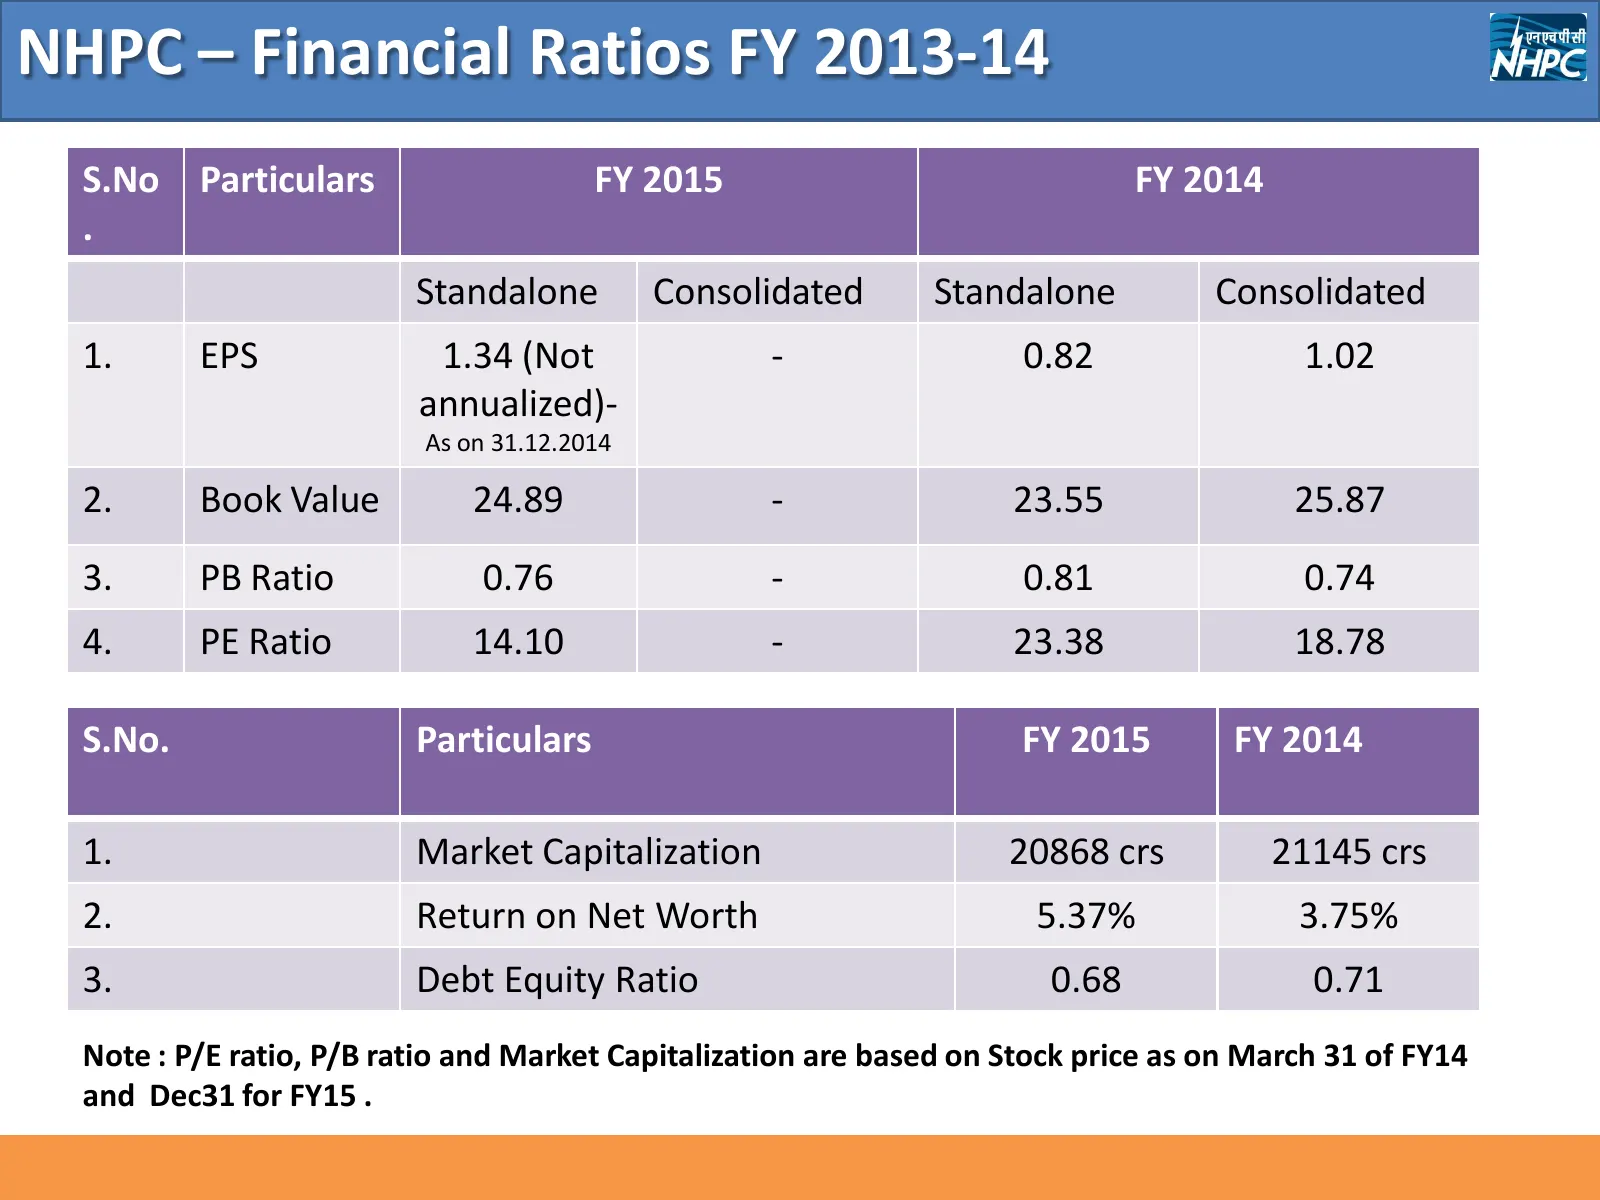
NHPC – Financial Ratios FY 2013-14 S.No Particulars FY 2015 FY 2014 . Standalone Consolidated Standalone Consolidated 1. EPS 1.34 (Not - 0.82 1.02 annualized)- As on 31.12.2014 2. Book Value 24.89 - 23.55 25.87 3. PB Ratio 0.76 - 0.81 0.74 4. PE Ratio 14.10 - 23.38 18.78 S.No. Particulars FY 2015 FY
Slide 20: NHPC - Projects At Glance
NHPC- Projects At Glance
Slide 21: NHPC – Projects in Operation
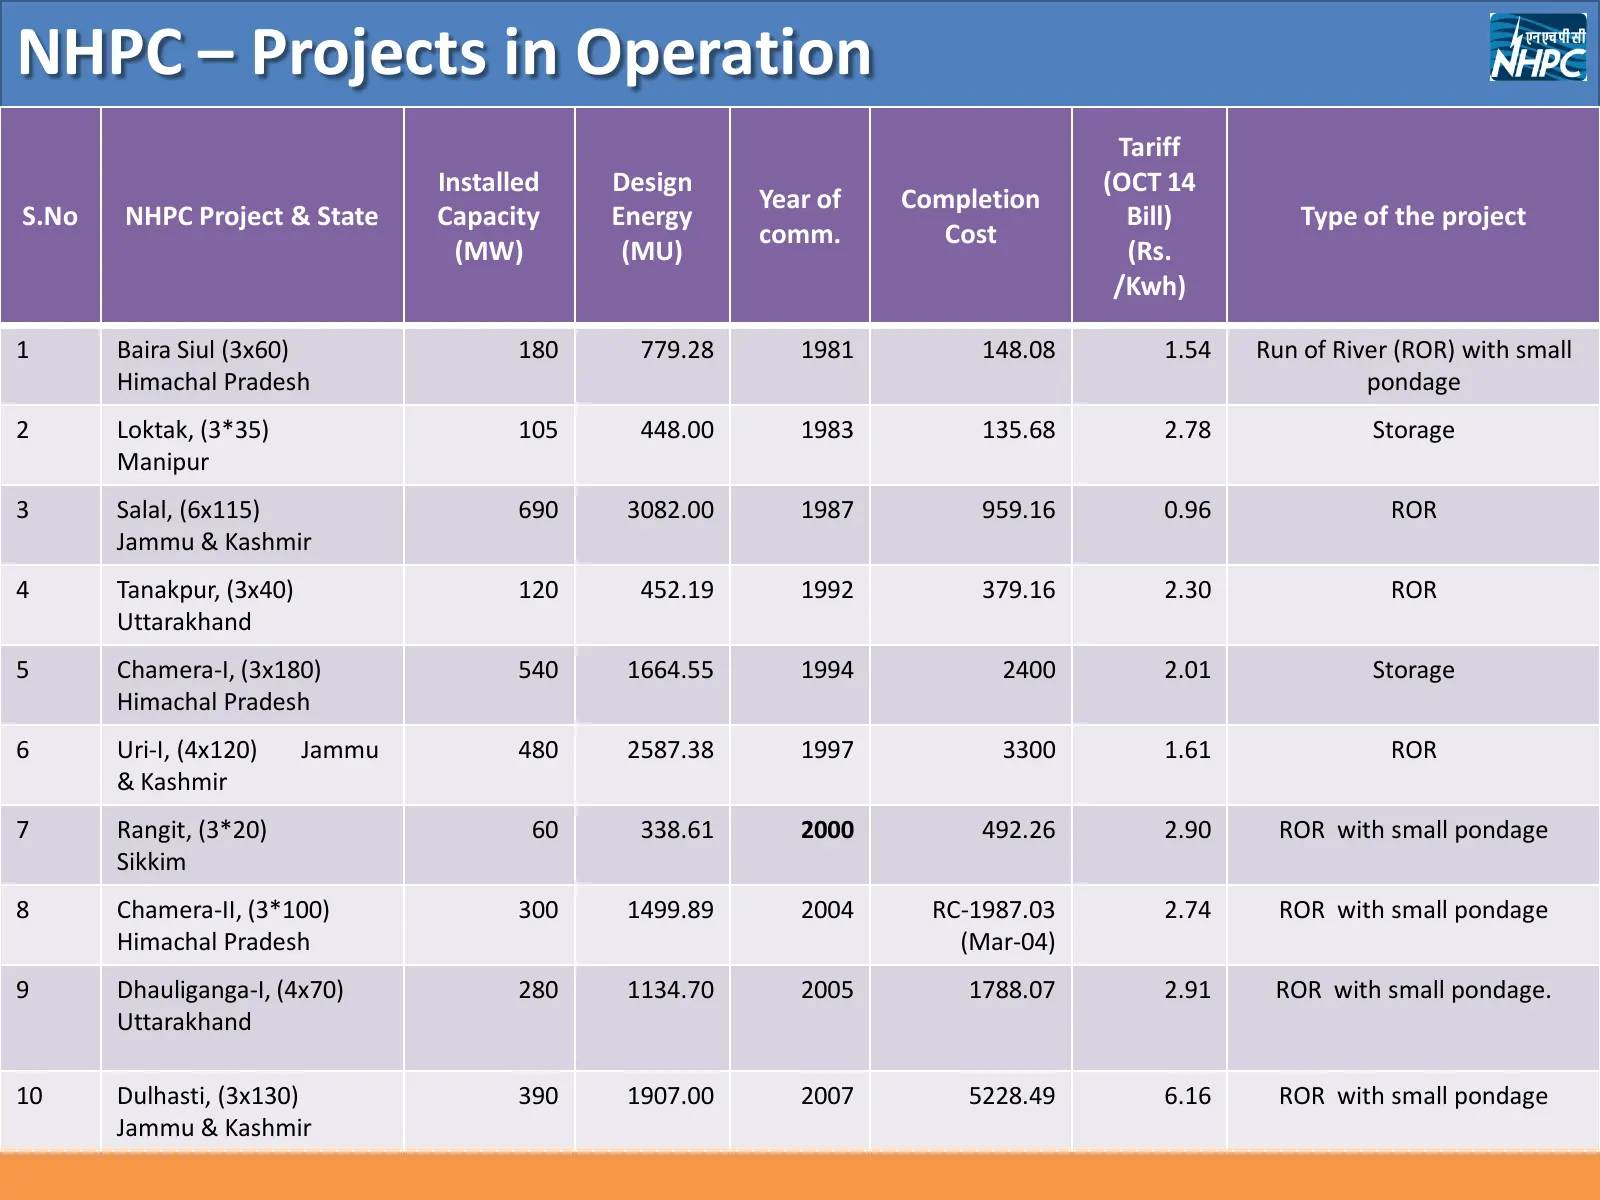
NHPC – Projects in Operation Tariff Installed Design (OCT 14 Year of Completion S.No NHPC Project & State Capacity Energy Bill) Type of the project comm. Cost (MW) (MU) (Rs. /Kwh) 1 Baira Siul (3x60) 180 779.28 1981 148.08 1.54 Run of River (ROR) with small Himachal Pradesh pondage 2 Loktak, (3*35)
Slide 22: NHPC – Projects in Operation
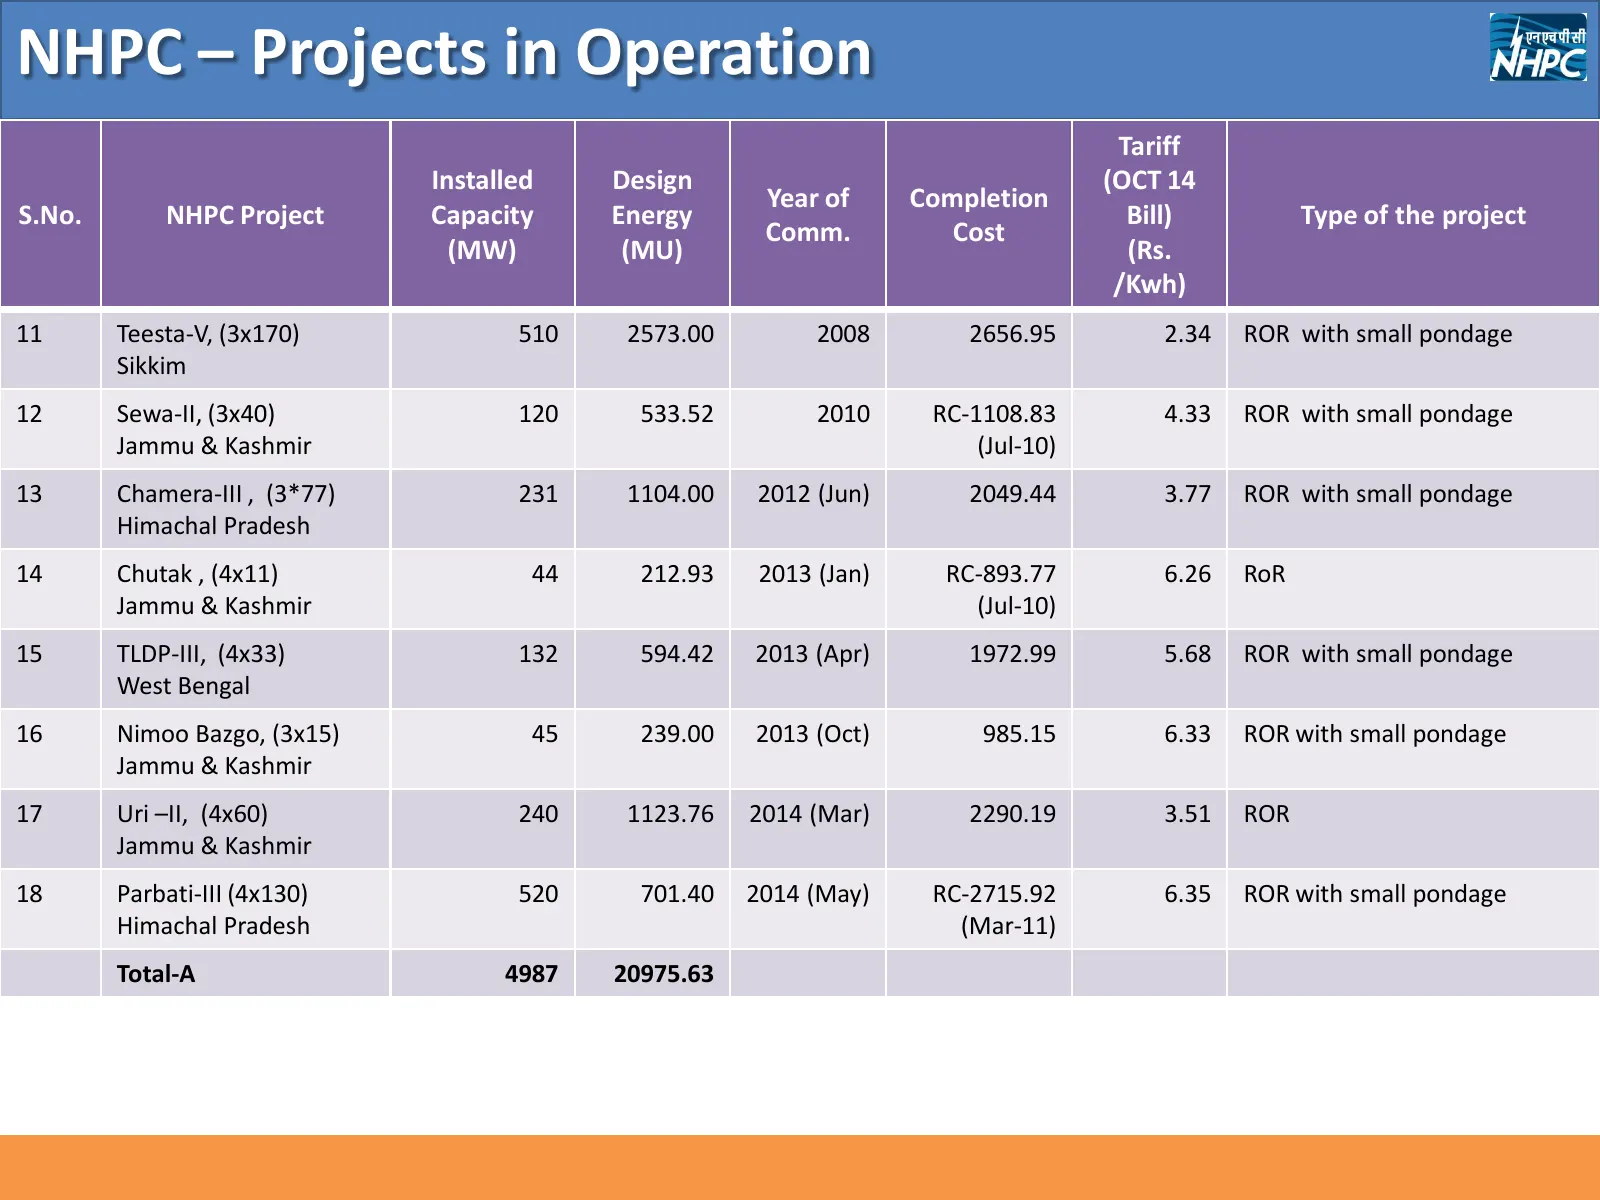
NHPC – Projects in Operation Tariff Installed Design (OCT 14 Year of Completion S.No. NHPC Project Capacity Energy Bill) Type of the project Comm. Cost (MW) (MU) (Rs. /Kwh) 11 Teesta-V, (3x170) 510 2573.00 2008 2656.95 2.34 ROR with small pondage Sikkim 12 Sewa-II, (3x40) 120 533.52 2010 RC-1108.83
Slide 23: NHPC – Operational Projects with Subsidiary
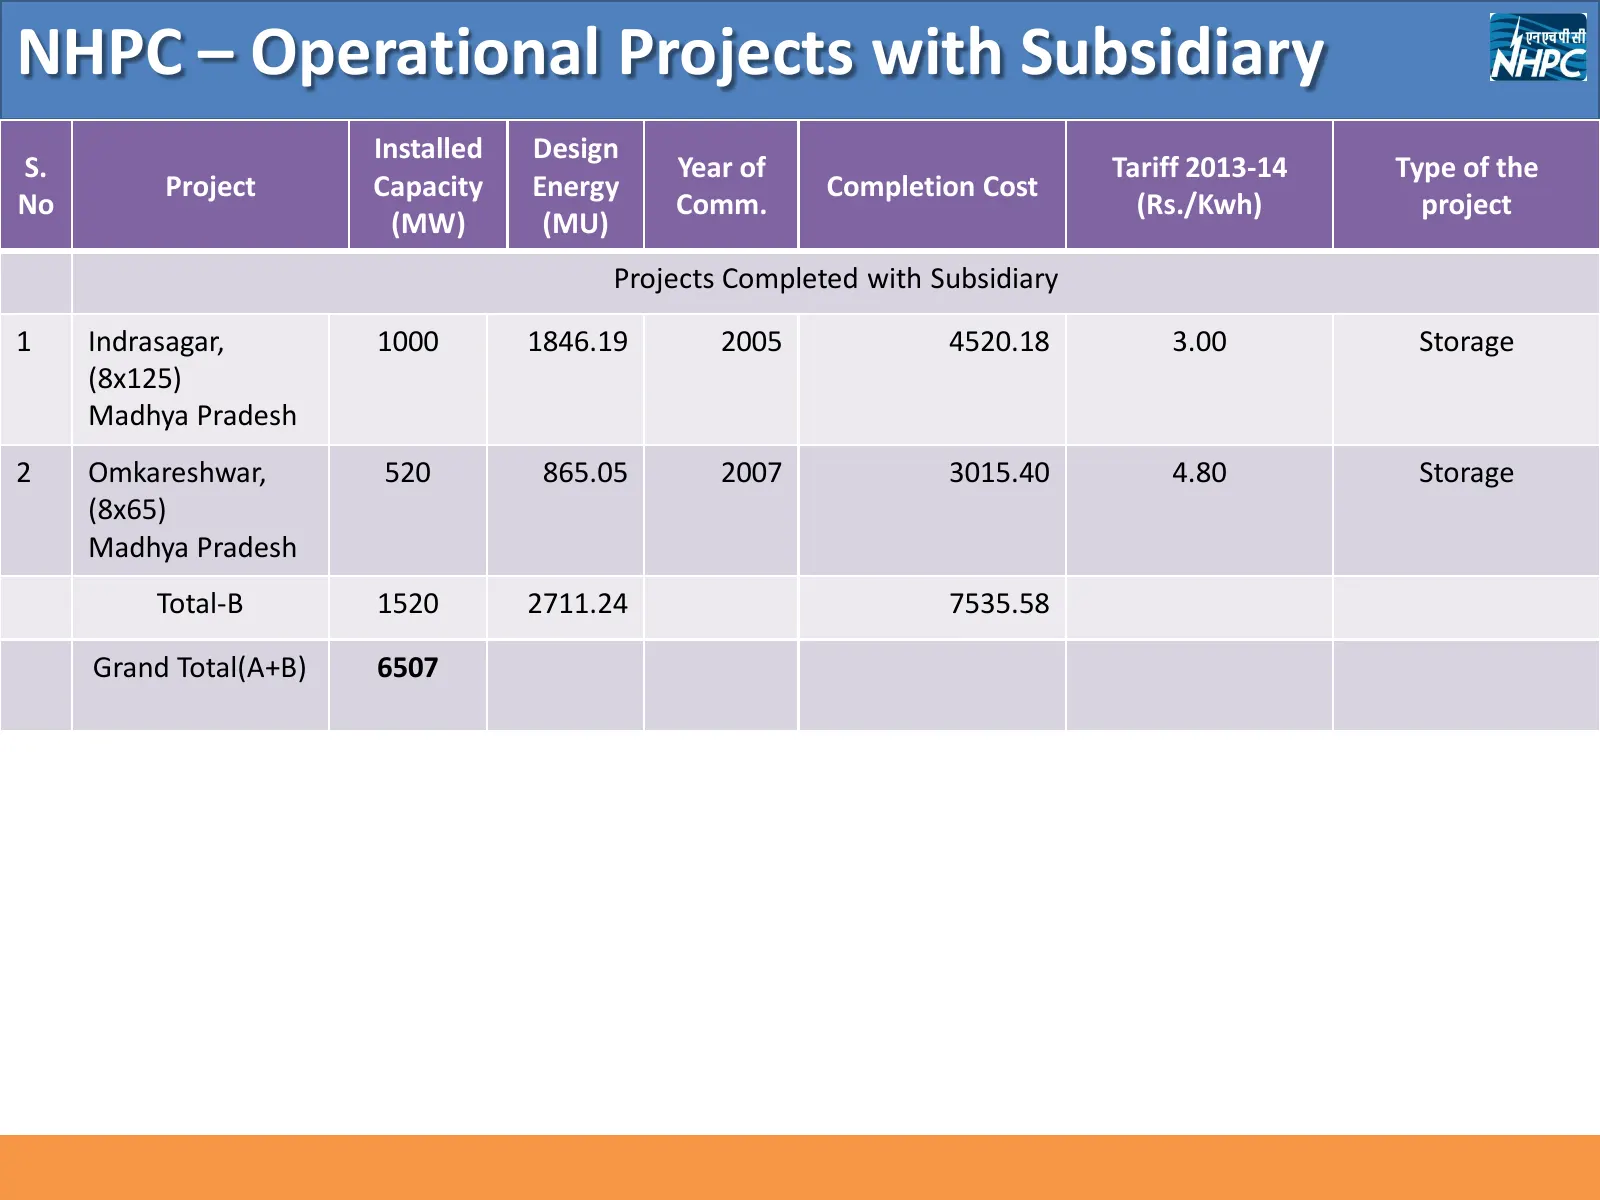
NHPC – Operational Projects with Subsidiary Installed Design S. Year of Tariff 2013-14 Type of the Project Capacity Energy Completion Cost No Comm. (Rs./Kwh) project (MW) (MU) Projects Completed with Subsidiary 1 Indrasagar, 1000 1846.19 2005 4520.18 3.00 Storage (8x125) Madhya Pradesh 2 Omkareshwar
Slide 24: NHPC – Projects Under Construction
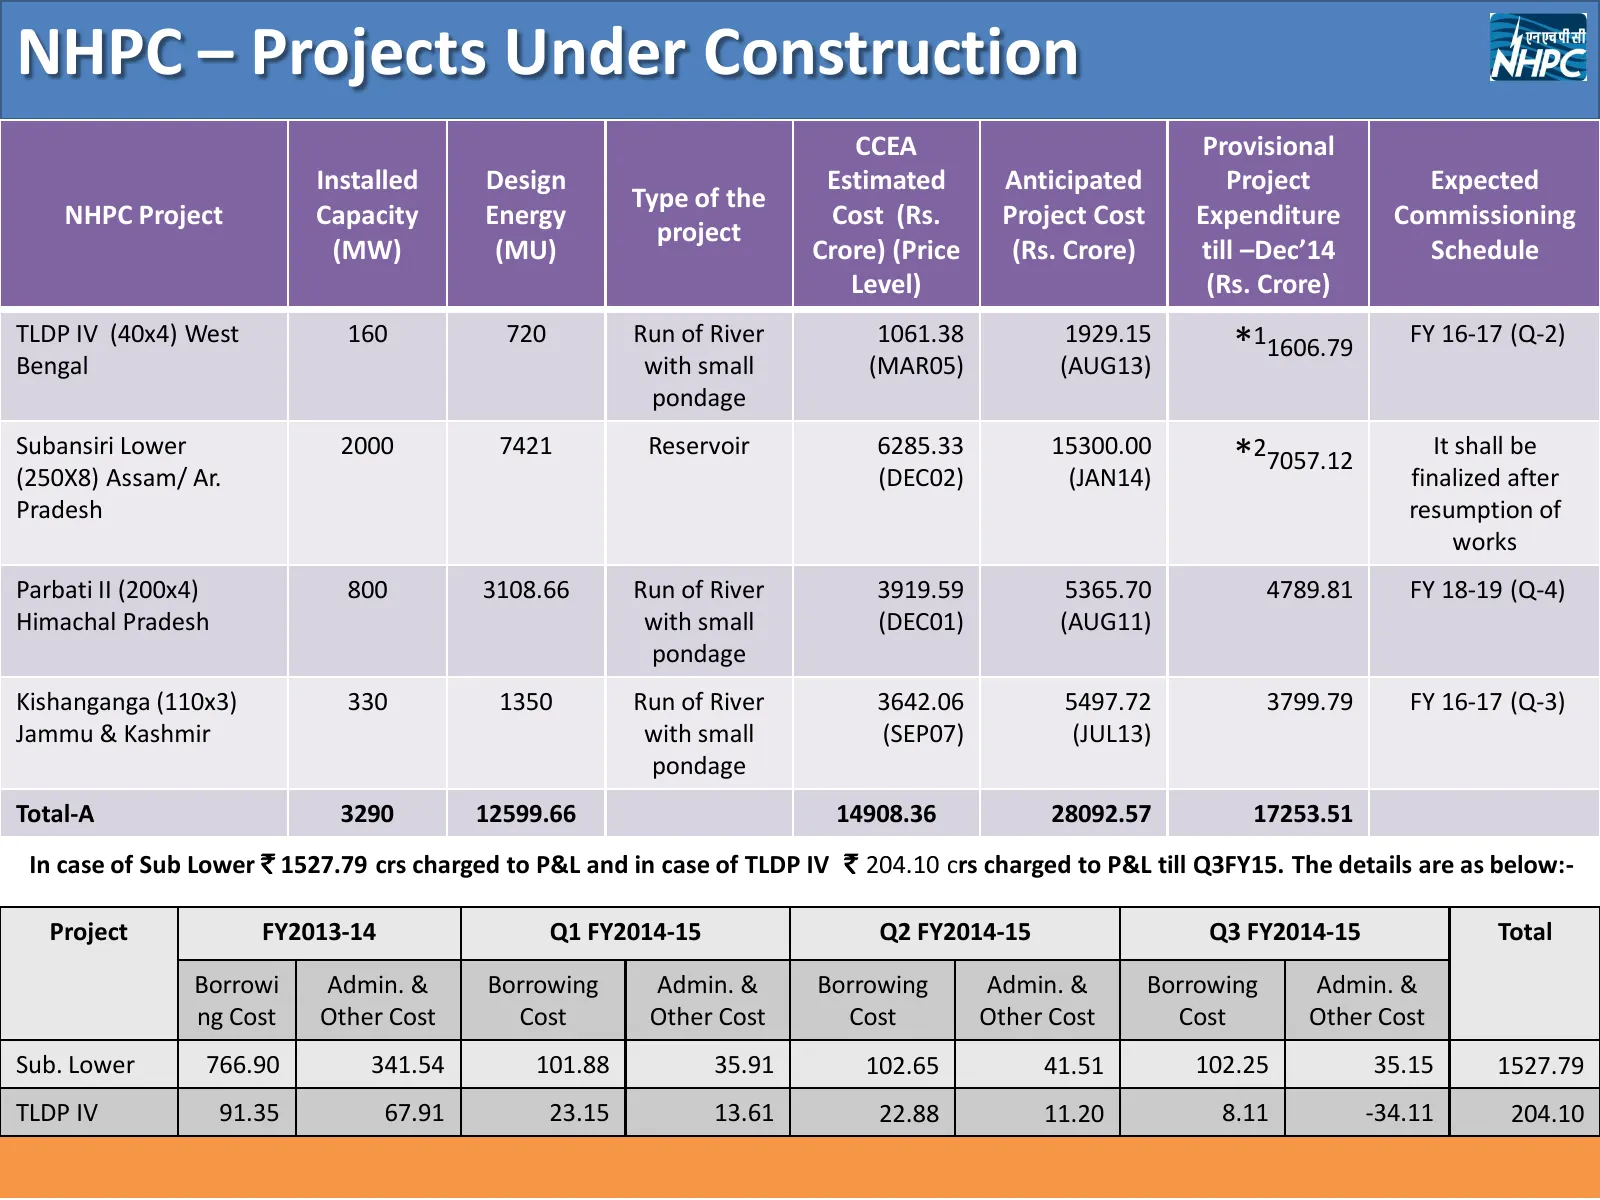
NHPC – Projects Under Construction CCEA Provisional Installed Design Estimated Anticipated Project Expected Type of the NHPC Project Capacity Energy Cost (Rs. Project Cost Expenditure Commissioning project (MW) (MU) Crore) (Price (Rs. Crore) till –Dec’14 Schedule Level) (Rs. Crore) TLDP IV (40x4) We
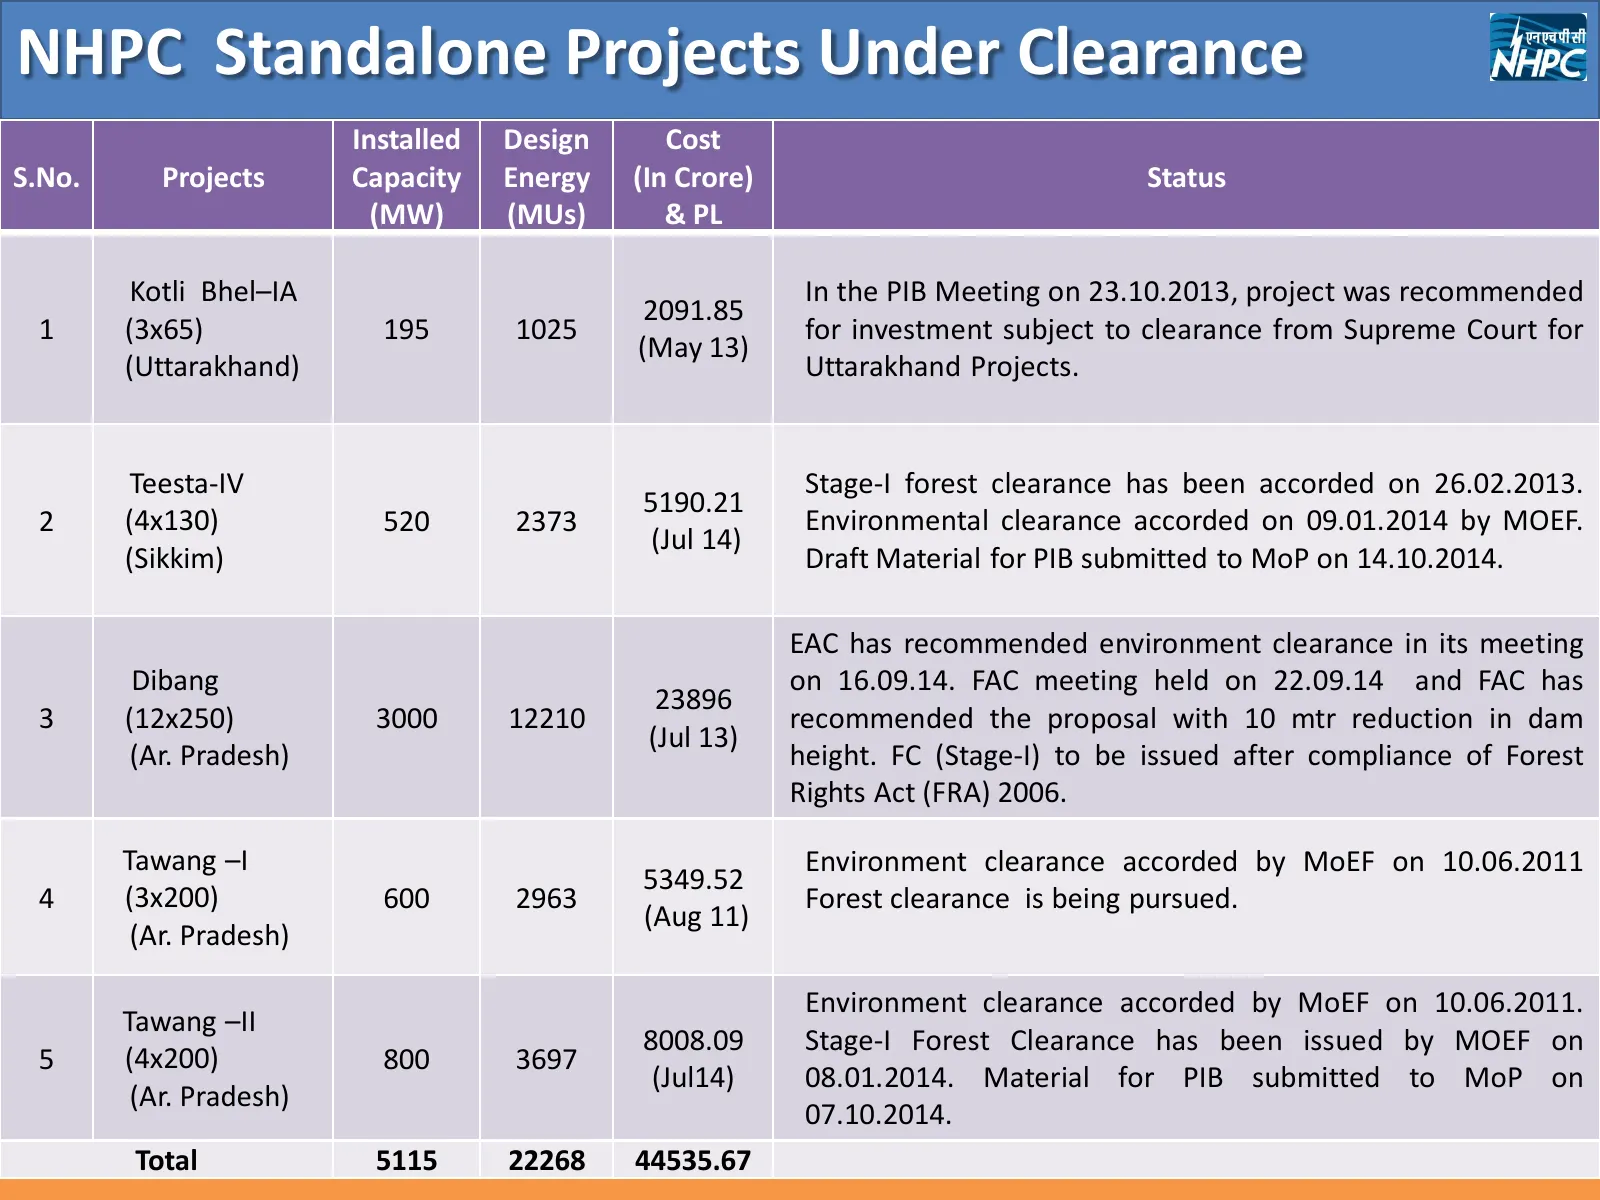
Slide 25: NHPC Standalone Projects Under Clearance
NHPC Standalone Projects Under Clearance Installed Design Cost S.No. Projects Capacity Energy (In Crore) Status (MW) (MUs) & PL Kotli Bhel–IA In the PIB Meeting on 23.10.2013, project was recommended 2091.85 1 (3x65) 195 1025 for investment subject to clearance from Supreme Court for (May 13) (Uttar
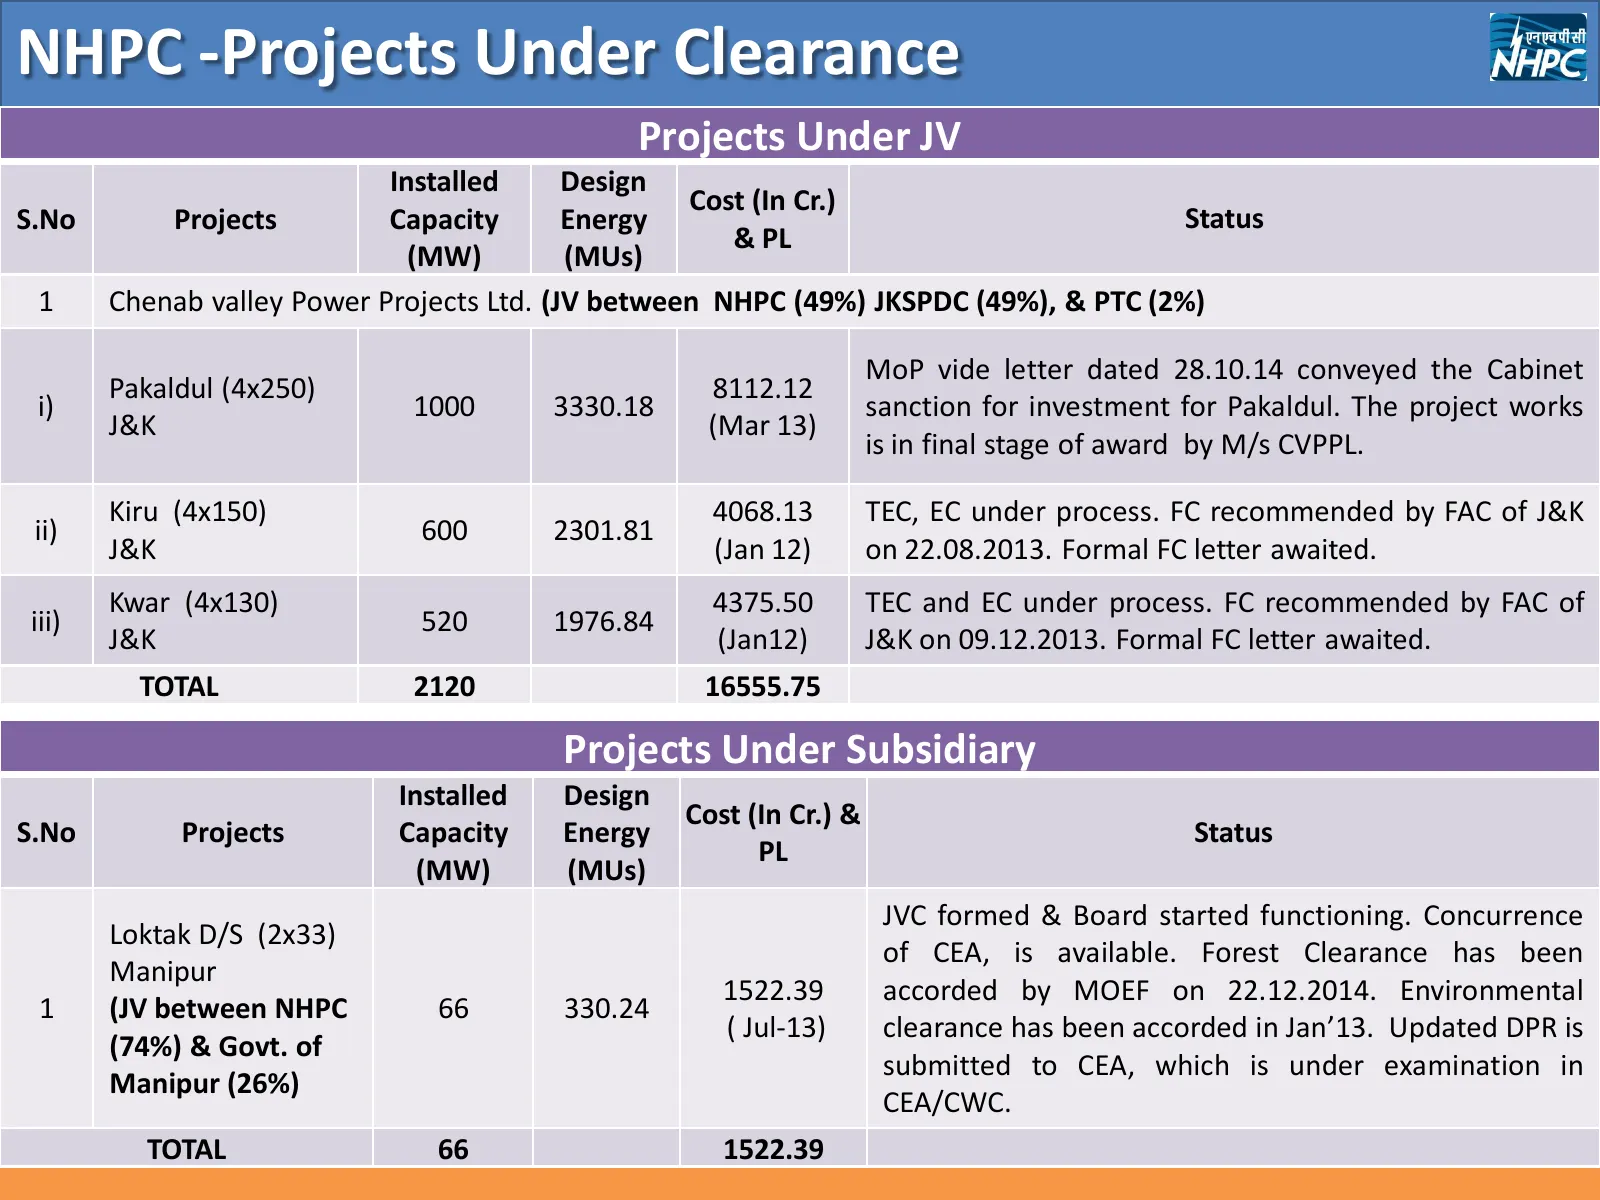
Slide 26: NHPC - Projects Under Clearance
NHPC -Projects Under Clearance Projects Under JV Installed Design Cost (In Cr.) S.No Projects Capacity Energy Status & PL (MW) (MUs) 1 Chenab valley Power Projects Ltd. (JV between NHPC (49%) JKSPDC (49%), & PTC (2%) MoP vide letter dated 28.10.14 conveyed the Cabinet Pakaldul (4x250) 8112.12 i) 100
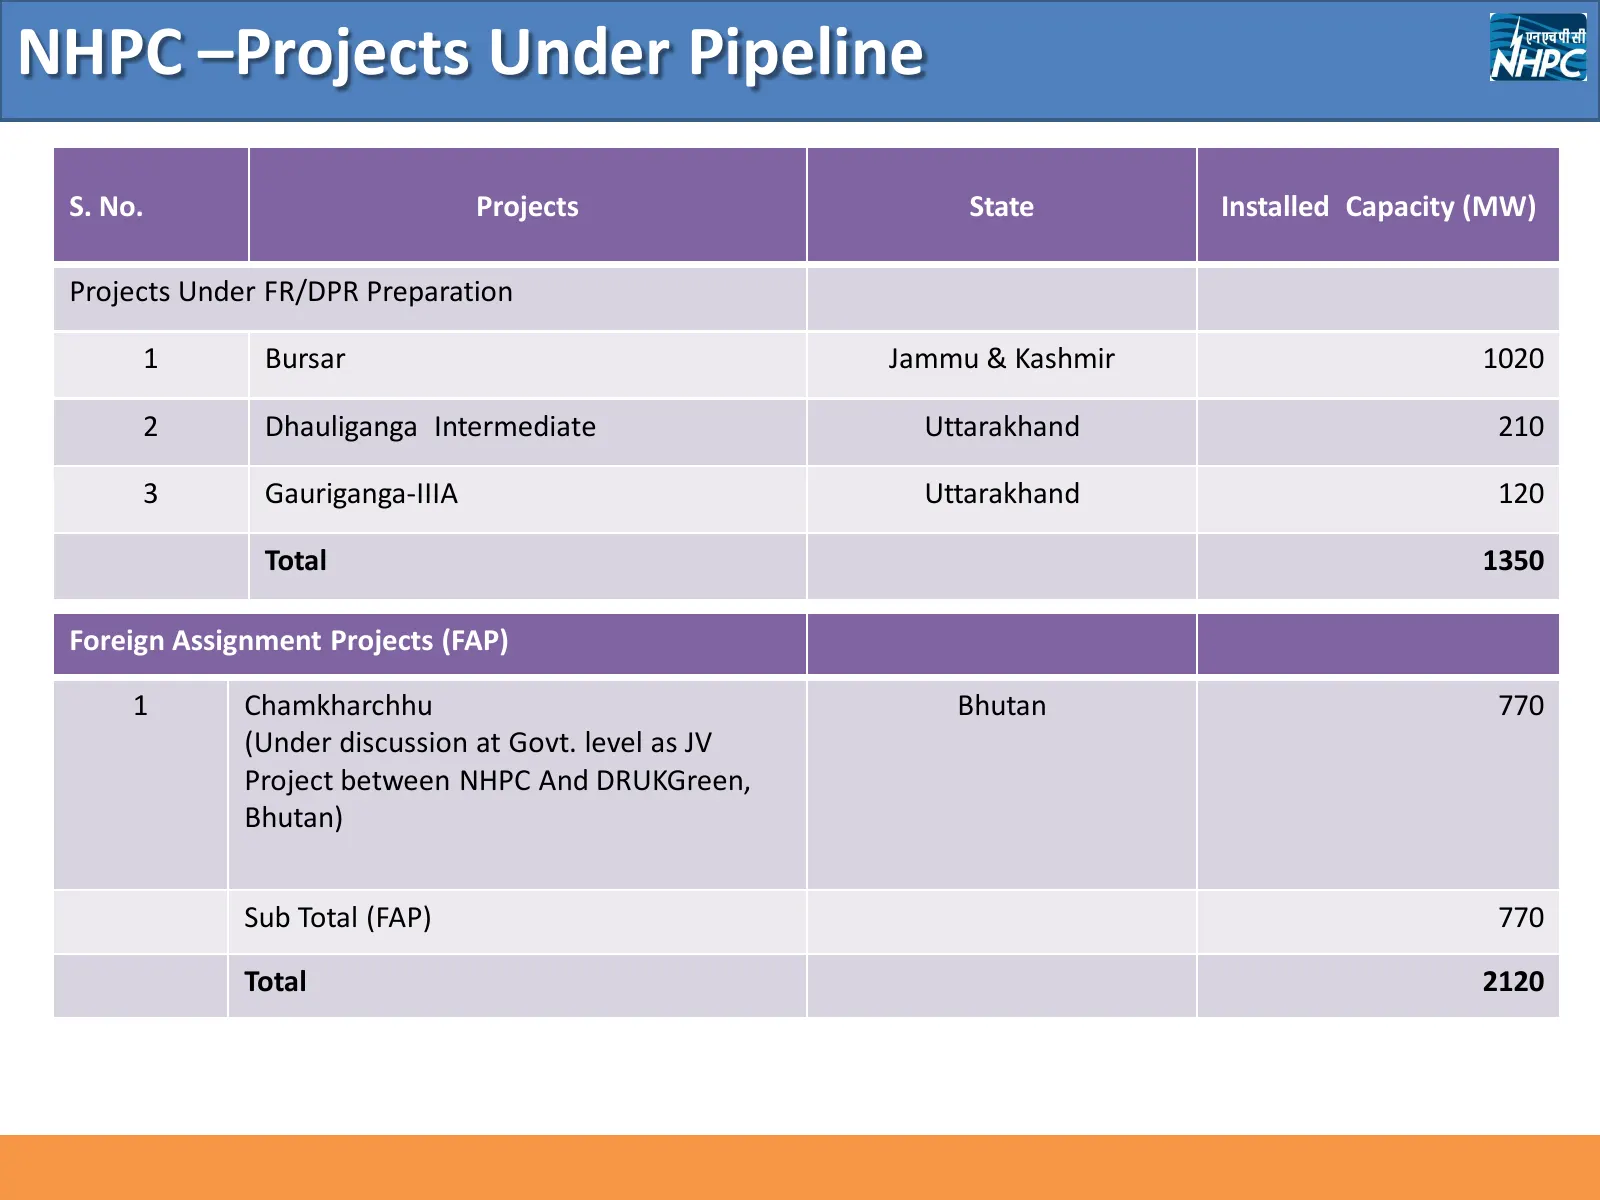
Slide 27: NHPC – Projects Under Pipeline
NHPC –Projects Under Pipeline S. No. Projects State Installed Capacity (MW) Projects Under FR/DPR Preparation 1 Bursar Jammu & Kashmir 1020 2 Dhauliganga Intermediate Uttarakhand 210 3 Gauriganga-IIIA Uttarakhand 120 Total 1350 Foreign Assignment Projects (FAP) 1 Chamkharchhu Bhutan 770 (Under discu

Slide 28: Thank You
Source: Internet Archive copy of nhpcindia.com
More decks from NHPC Limited
 Investor Presentation (June 2026)49 slides · June 2026
 Investor Presentation (March 2026)48 slides · March 2026
 Investor Presentation (December 2025)49 slides · December 2025
 Investor Presentation (September 2025)49 slides · September 2025
 Investor Presentation (June 2025)51 slides · June 2025
 Investor Presentation (May 2025)49 slides · May 2025