Evonik Industries AG · XETR:EVK
Evonik Industries — Q1 2018 Earnings Presentation
89 slides from Evonik Industries's earnings presentation, May 2018
Slide 1: Evonik Company presentation Q1 2018 Results Roadshow
Evonik Power to create. Portfolio Company presentation Profitable Growth Q1 2018 Results Roadshow Innovation Culture 1
Slide 2: Table of contents
Table of contents 1. Evonik at a glance 2. Strategy 3. Financials Q1 2018 4. Appendix 2
Slide 3: A strong basis in Specialty Chemicals
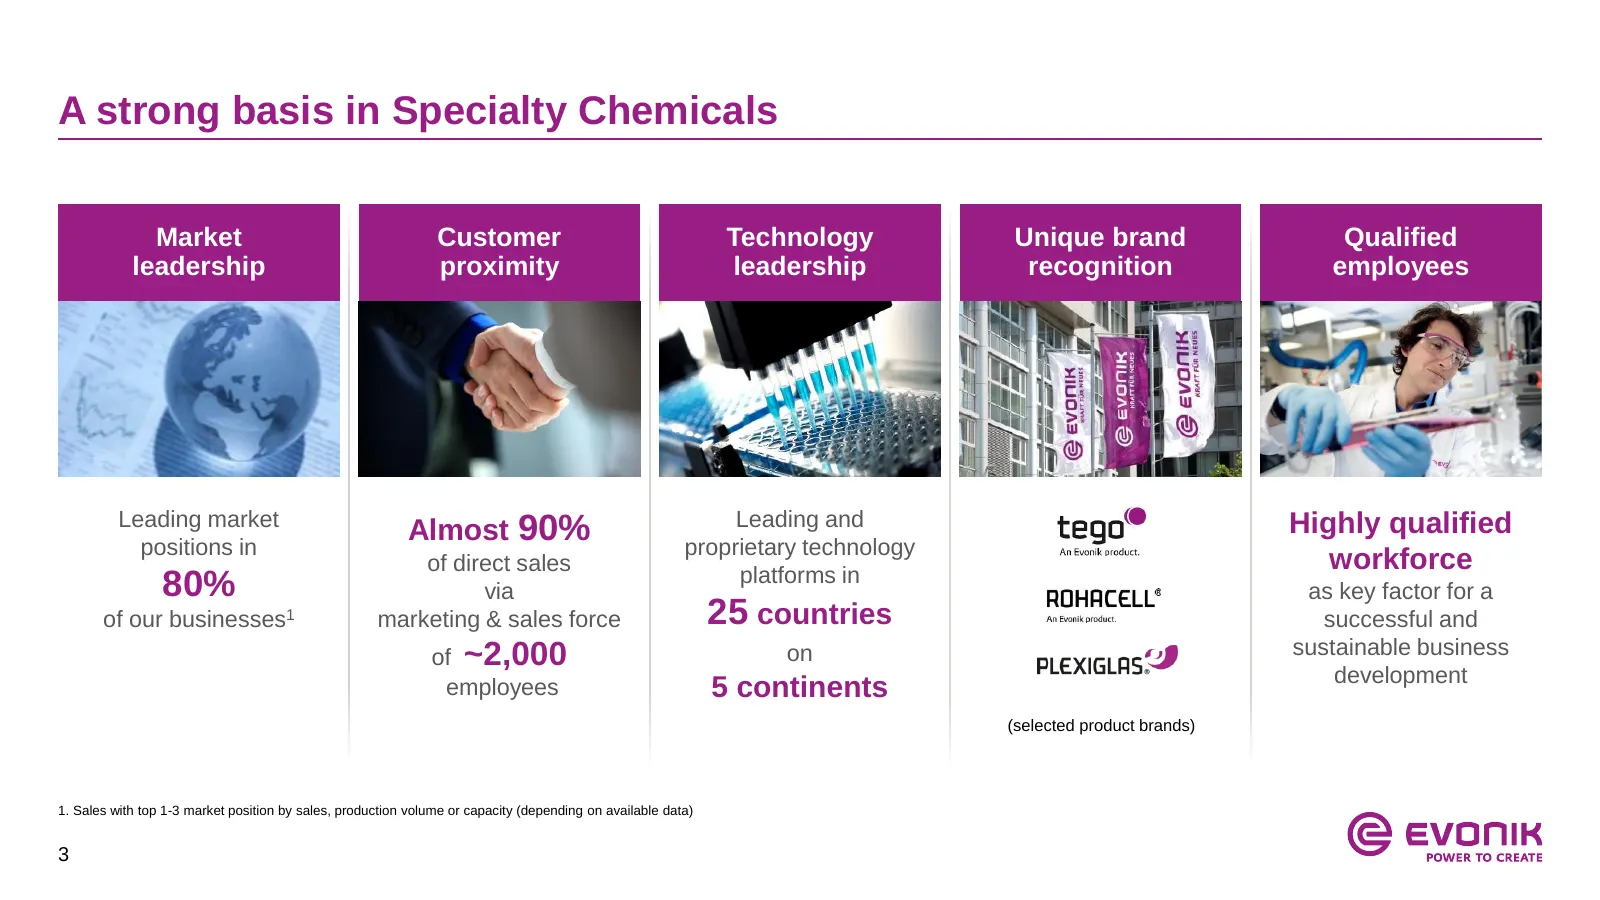
A strong basis in Specialty Chemicals Market Customer Technology Unique brand Qualified leadership proximity leadership recognition employees Leading market Leading and Highly qualified Almost 90% positions in proprietary technology of direct sales platforms in workforce 80% via as key factor for a
Slide 4: Three segments with differentiated management
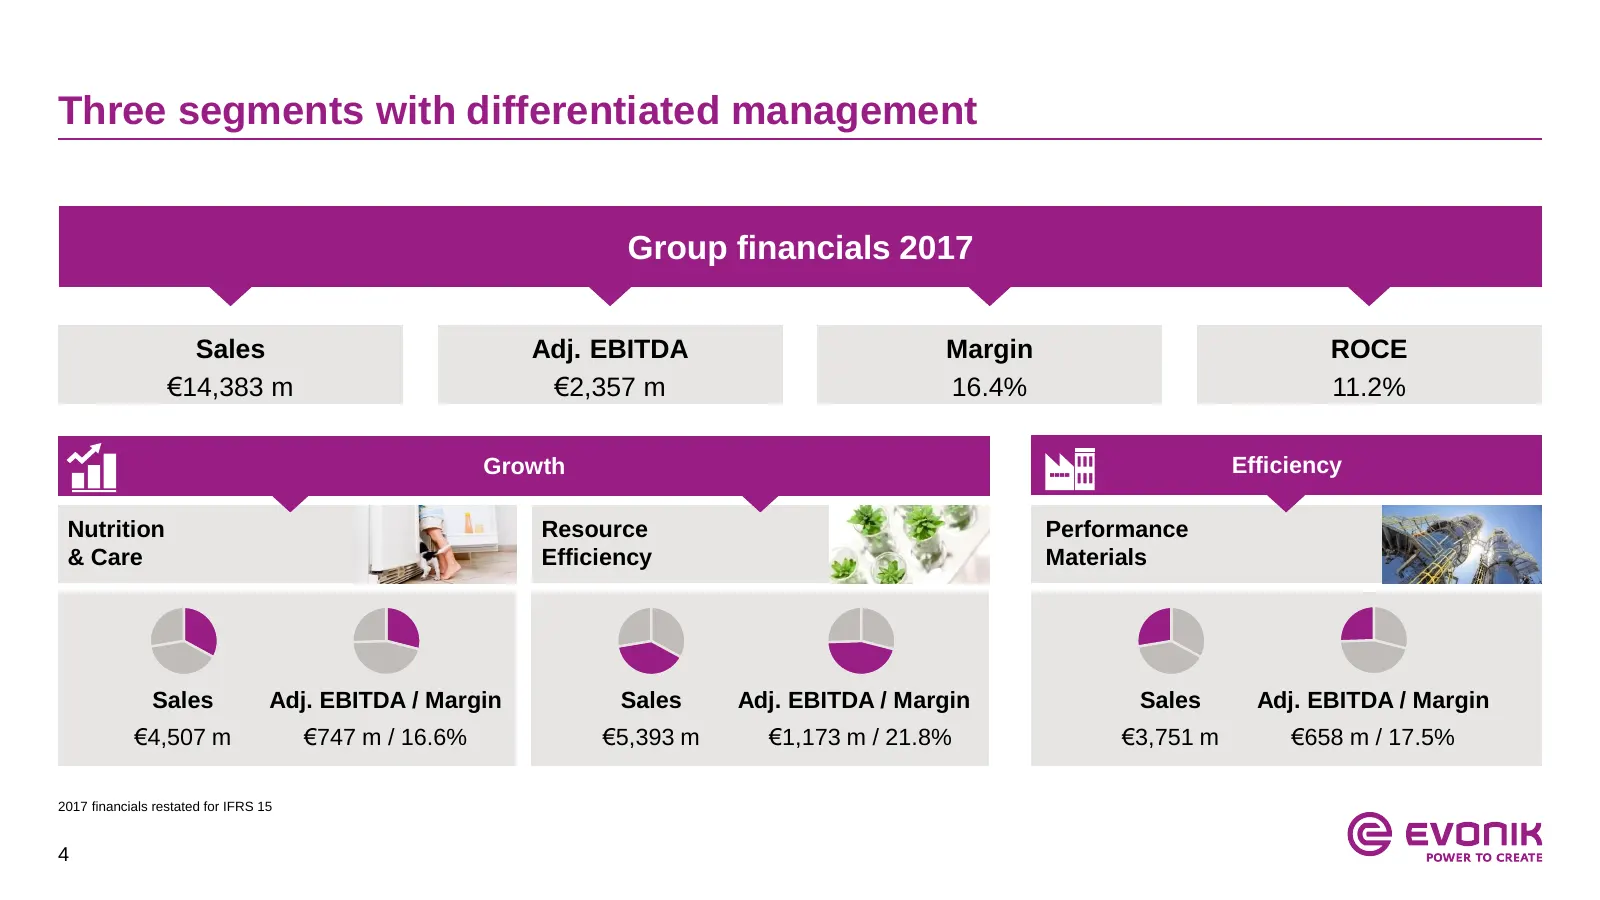
Three segments with differentiated management Group financials 2017 Sales Adj. EBITDA Margin ROCE €14,383 m €2,357 m 16.4% 11.2% Growth Efficiency Nutrition Resource Performance & Care Efficiency Materials Sales Adj. EBITDA / Margin Sales Adj. EBITDA / Margin Sales Adj. EBITDA / Margin €4,507 m €747
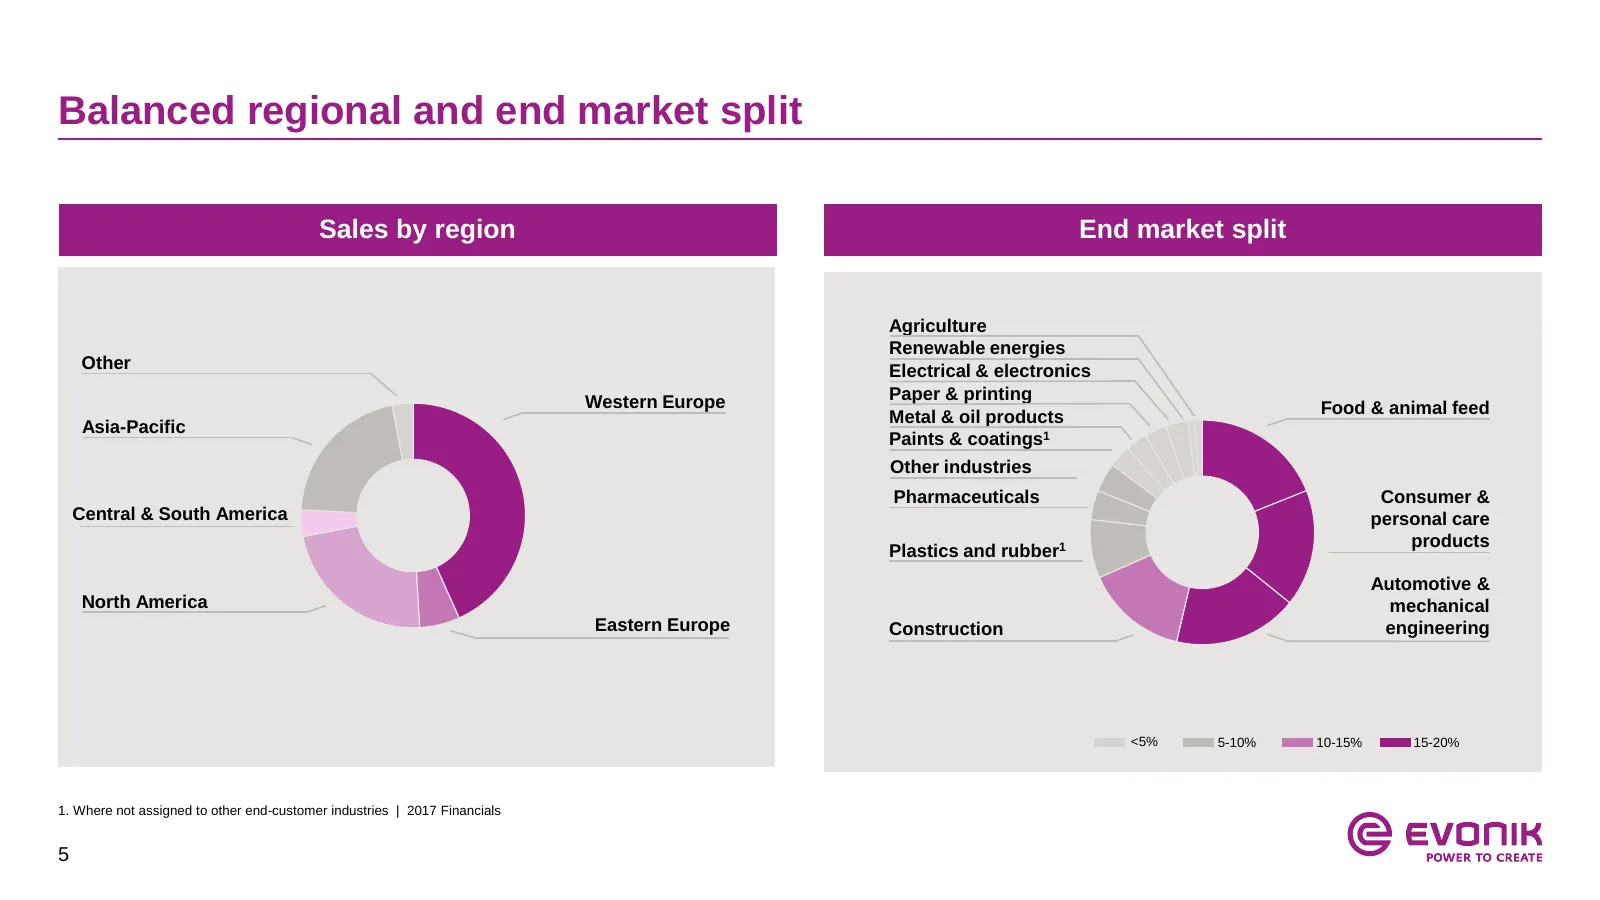
Slide 5: Balanced regional and end market split
Balanced regional and end market split Sales by region End market split Agriculture Renewable energies Other Electrical & electronics Western Europe Paper & printing Metal & oil products Food & animal feed Asia-Pacific Paints & coatings1 Other industries Pharmaceuticals Consumer & Central & South Am
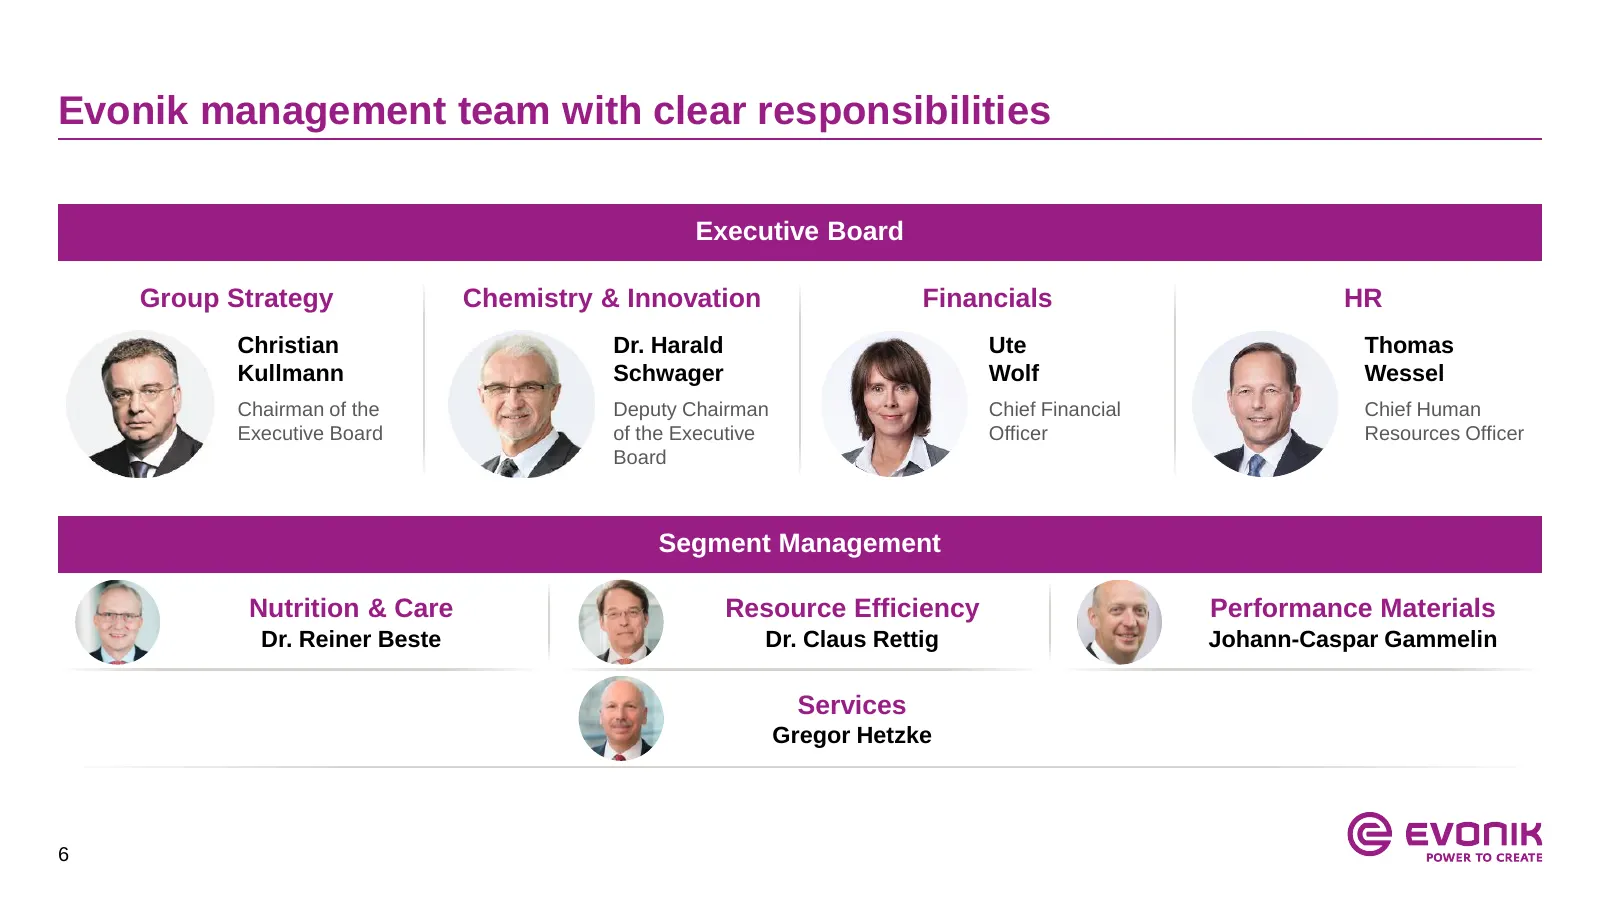
Slide 6: Evonik management team with clear responsibilities
Evonik management team with clear responsibilities Executive Board Group Strategy Chemistry & Innovation Financials HR Christian Dr. Harald Ute Thomas Kullmann Schwager Wolf Wessel Chairman of the Deputy Chairman Chief Financial Chief Human Executive Board of the Executive Officer Resources Officer
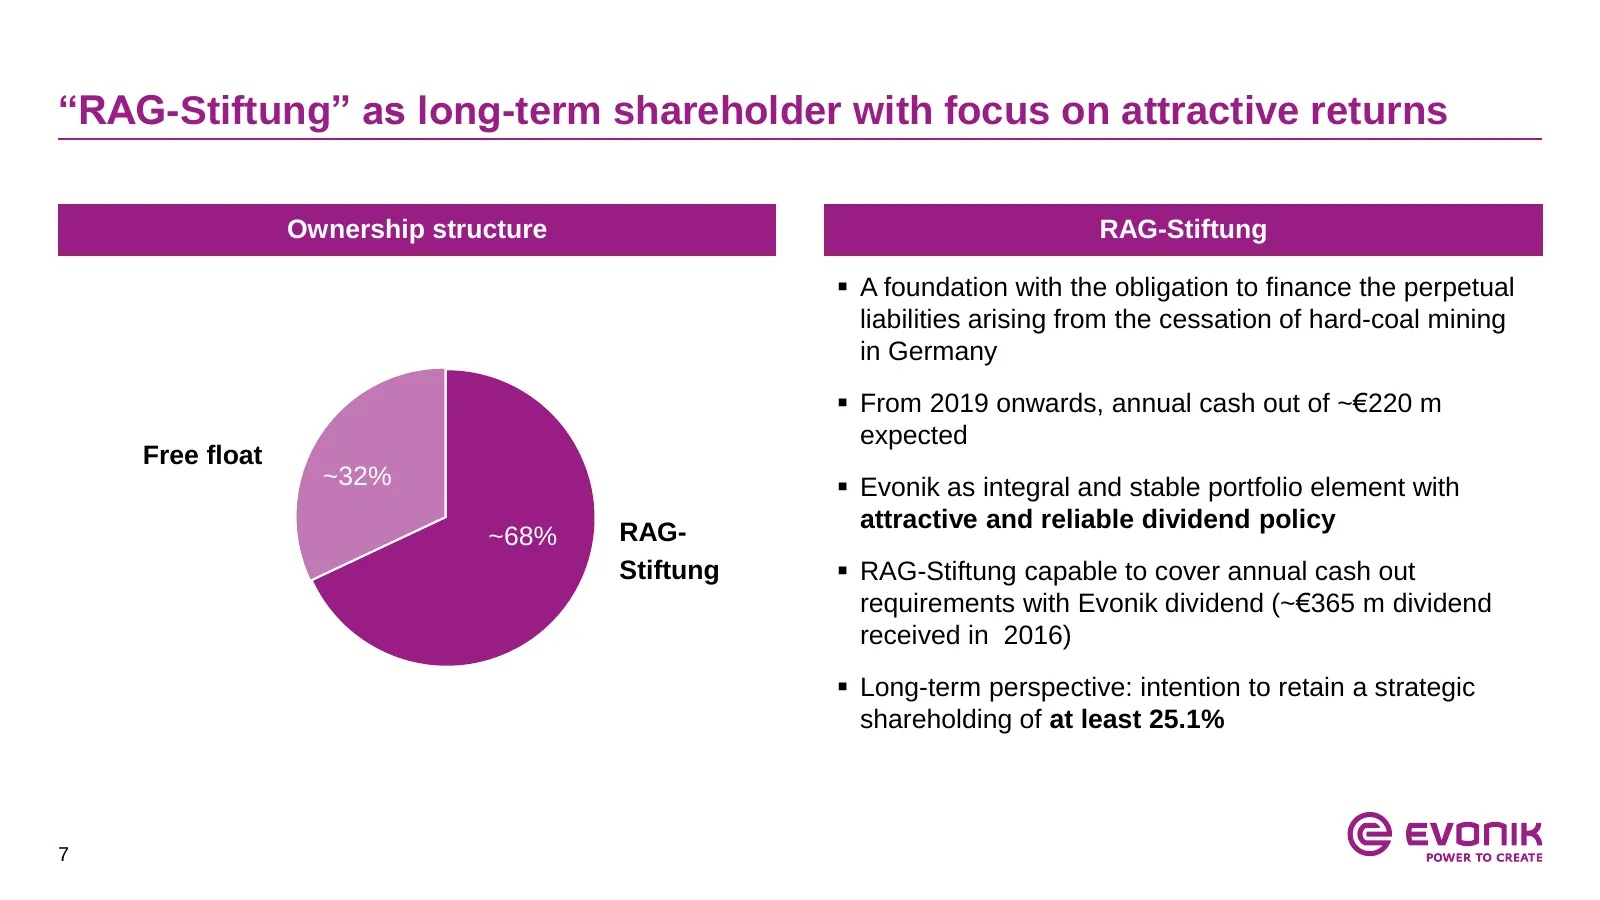
Slide 7: RAG-Stiftung as long-term shareholder
“RAG-Stiftung” as long-term shareholder with focus on attractive returns Ownership structure RAG-Stiftung A foundation with the obligation to finance the perpetual liabilities arising from the cessation of hard-coal mining in Germany From 2019 onwards, annual cash out of ~€220 m expected Free fl
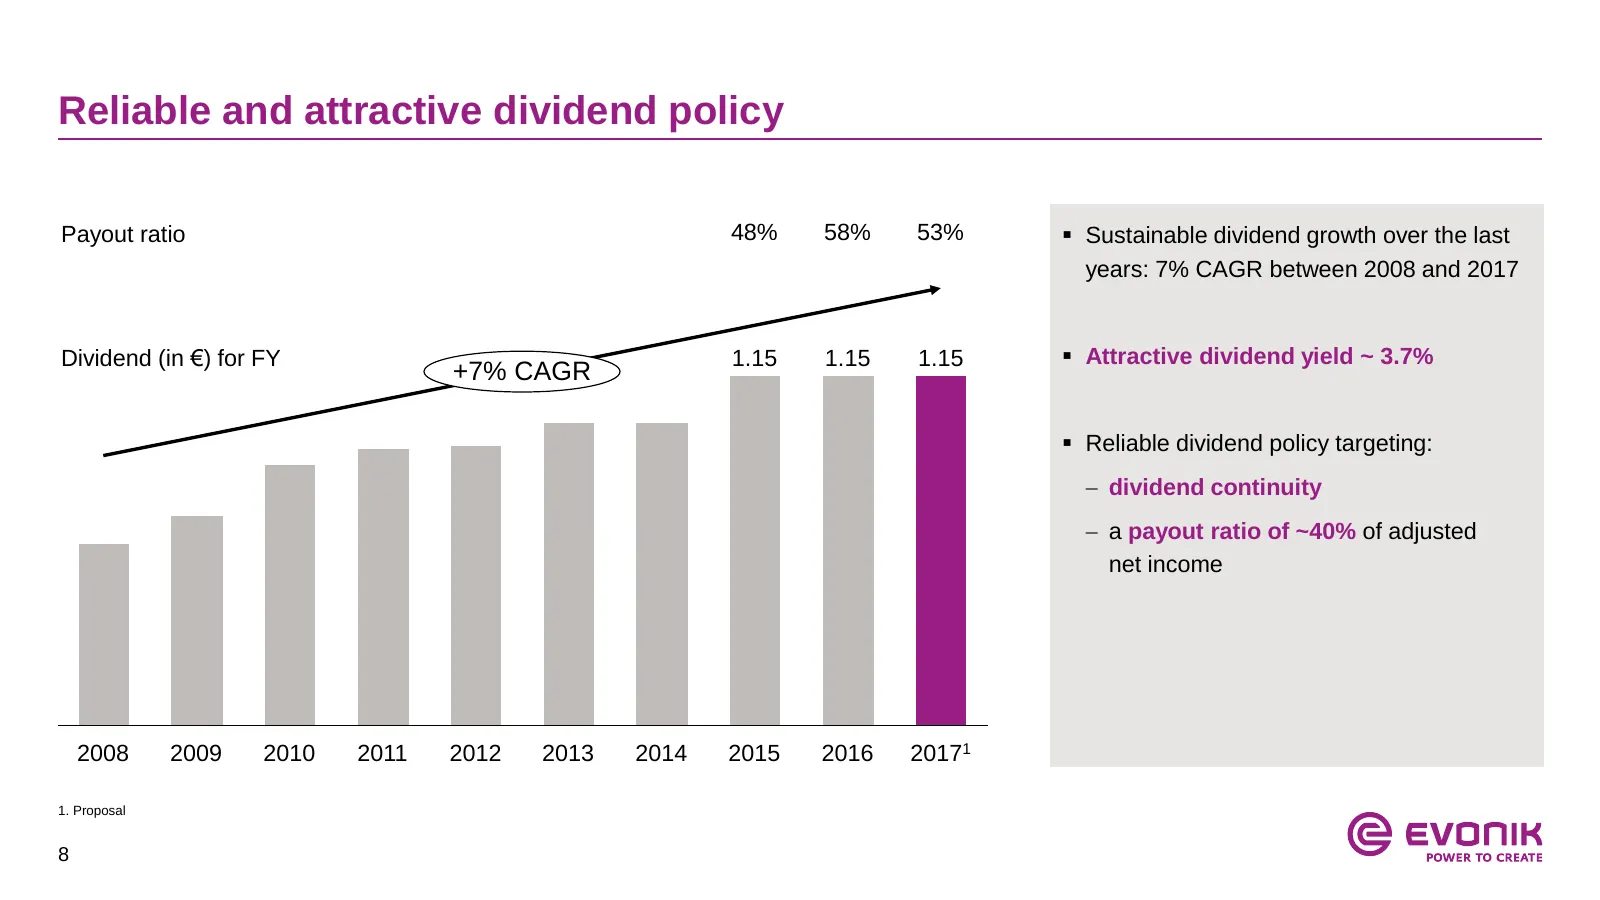
Slide 8: Reliable and attractive dividend policy
Reliable and attractive dividend policy Payout ratio 48% 58% 53% Sustainable dividend growth over the last years: 7% CAGR between 2008 and 2017 Dividend (in €) for FY 1.15 1.15 1.15 Attractive dividend yield ~ 3.7% +7% CAGR Reliable dividend policy targeting: dividend continuity a payout r
Slide 9: Table of contents
Table of contents 1. Evonik at a glance 2. Strategy 3. Financials Q1 2018 4. Appendix 9
Slide 10: Building a best-in-class specialty chemicals company
Building a best-in-class specialty chemicals company 10
Slide 11: Targeting excellence in three strategic focus areas
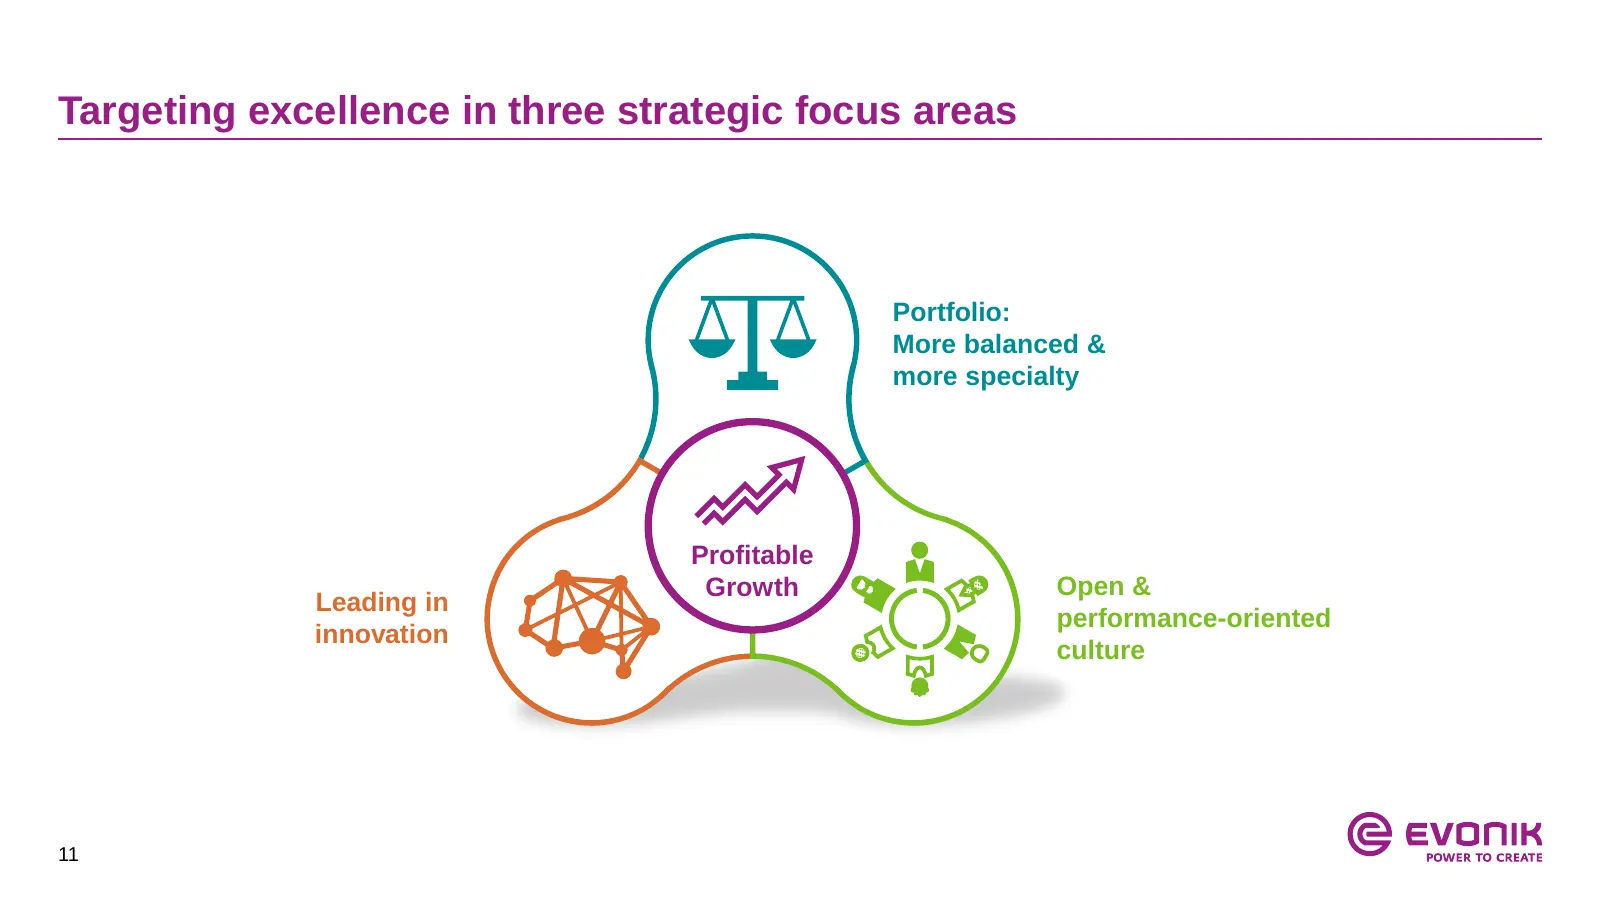
Targeting excellence in three strategic focus areas Portfolio: More balanced & more specialty Profitable Growth Open & Leading in performance-oriented innovation culture 11
Slide 12: Building on our strengths
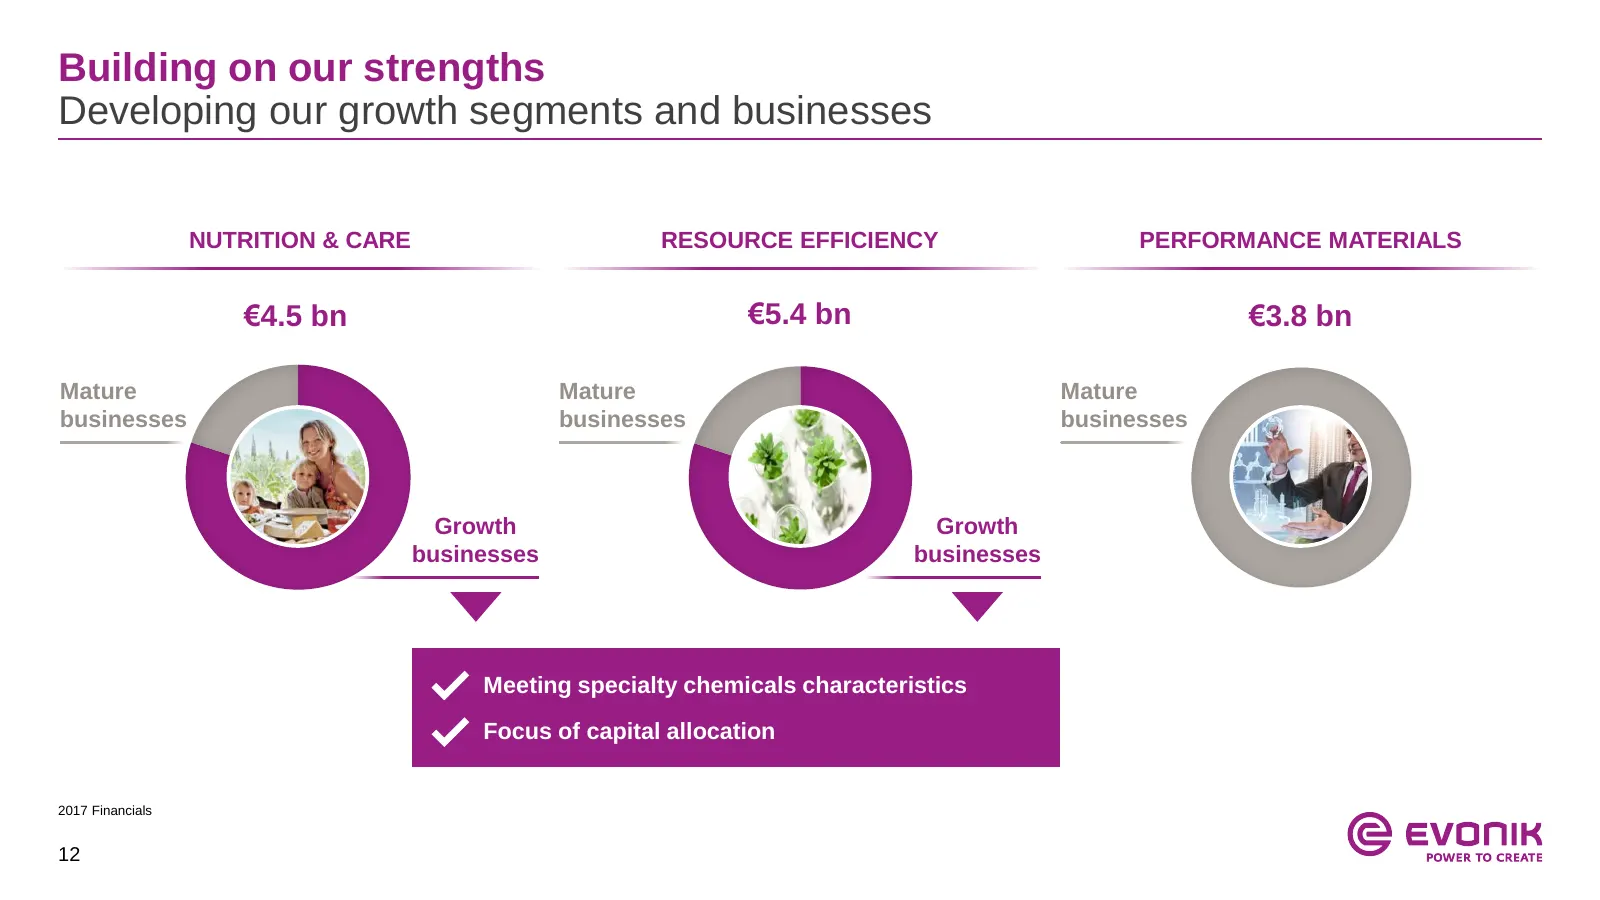
Building on our strengths Developing our growth segments and businesses NUTRITION & CARE RESOURCE EFFICIENCY PERFORMANCE MATERIALS €4.5 bn €5.4 bn €3.8 bn Mature Mature Mature businesses businesses businesses Growth Growth businesses businesses Meeting specialty chemicals characteristics Focus of ca
Slide 13: Strategic growth focus: four growth engines
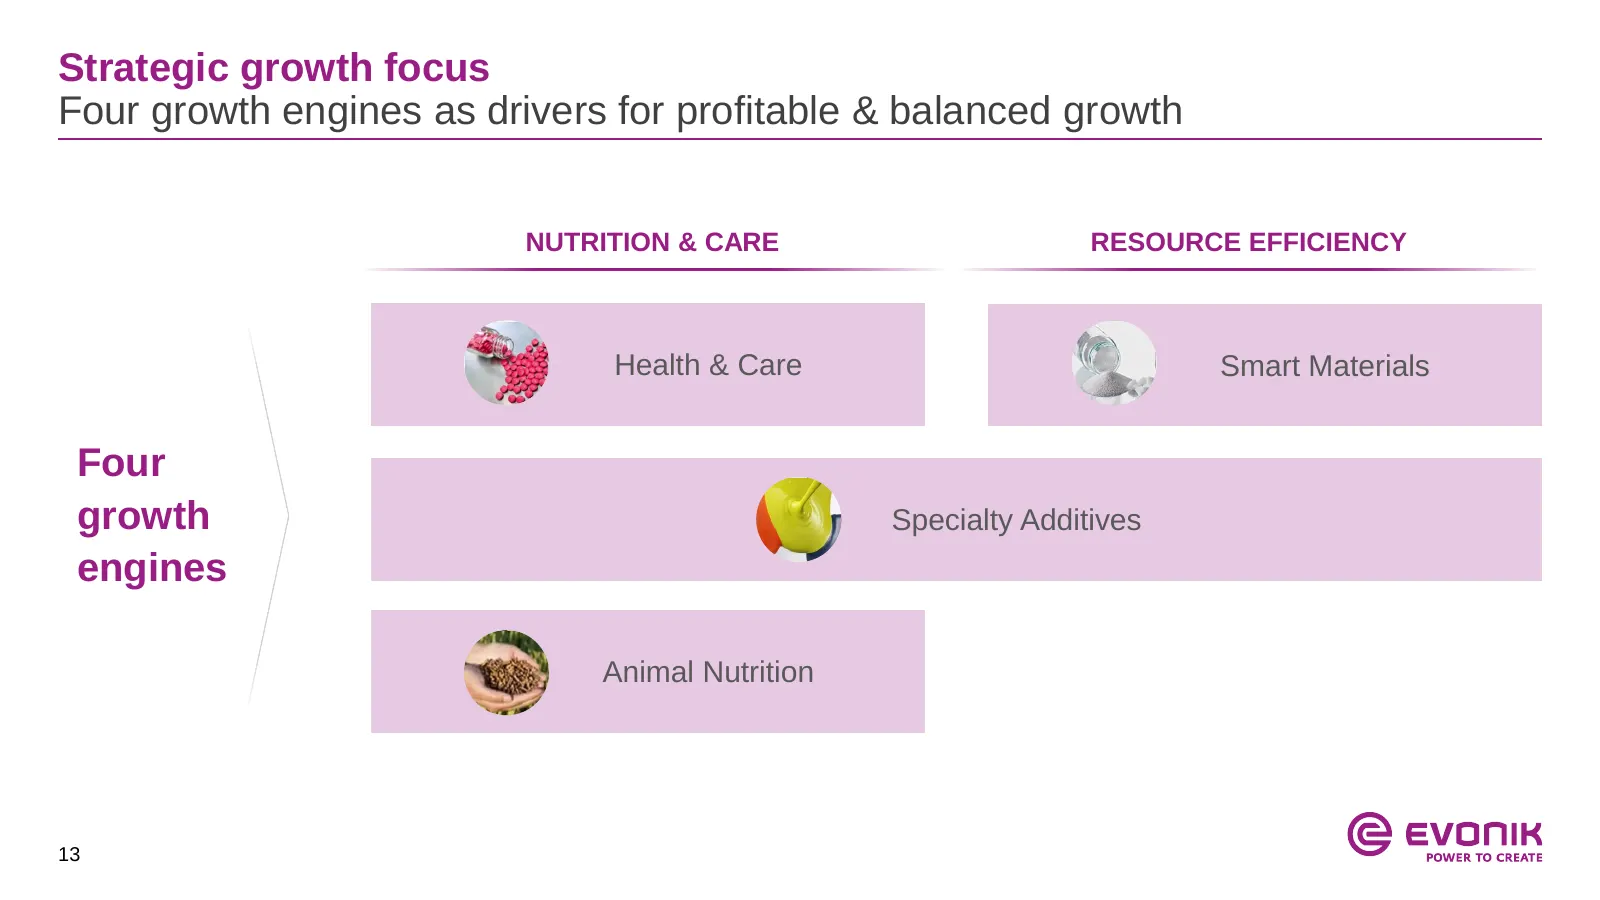
Strategic growth focus Four growth engines as drivers for profitable & balanced growth NUTRITION & CARE RESOURCE EFFICIENCY Health & Care Smart Materials Four growth Specialty Additives engines Animal Nutrition 13
Slide 14: Strategic agenda reflected in ambitious financial targets
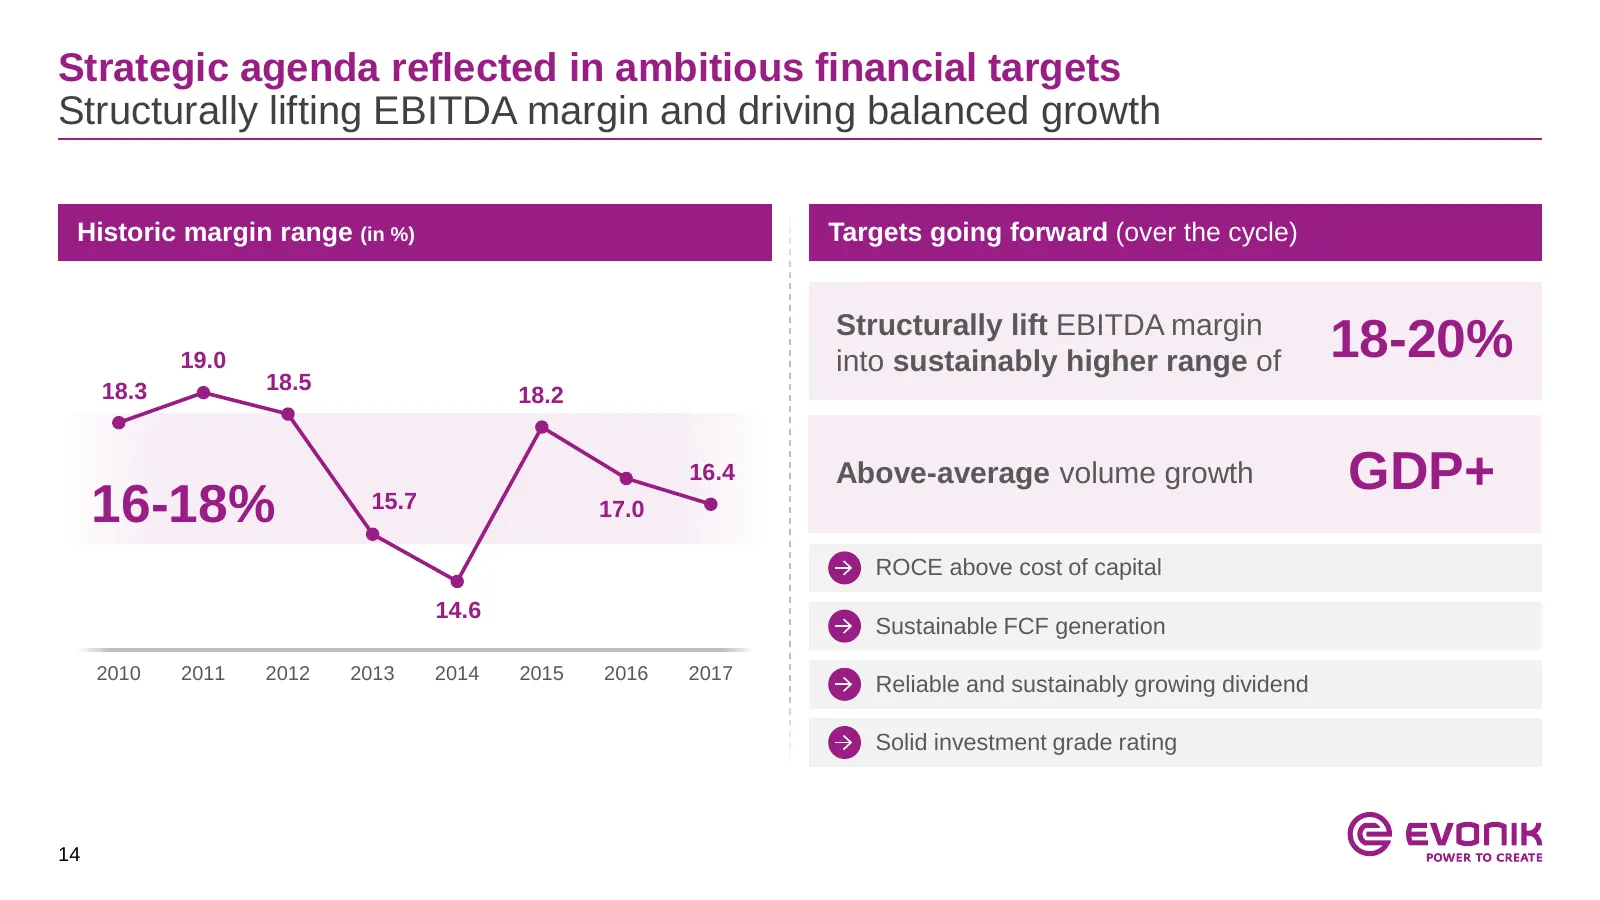
Strategic agenda reflected in ambitious financial targets Structurally lifting EBITDA margin and driving balanced growth Historic margin range (in %) Targets going forward (over the cycle) Structurally lift EBITDA margin 19.0 into sustainably higher range of 18-20% 18.3 18.5 18.2 16.4 Above-average
Slide 15: Consistently executing our strategic agenda
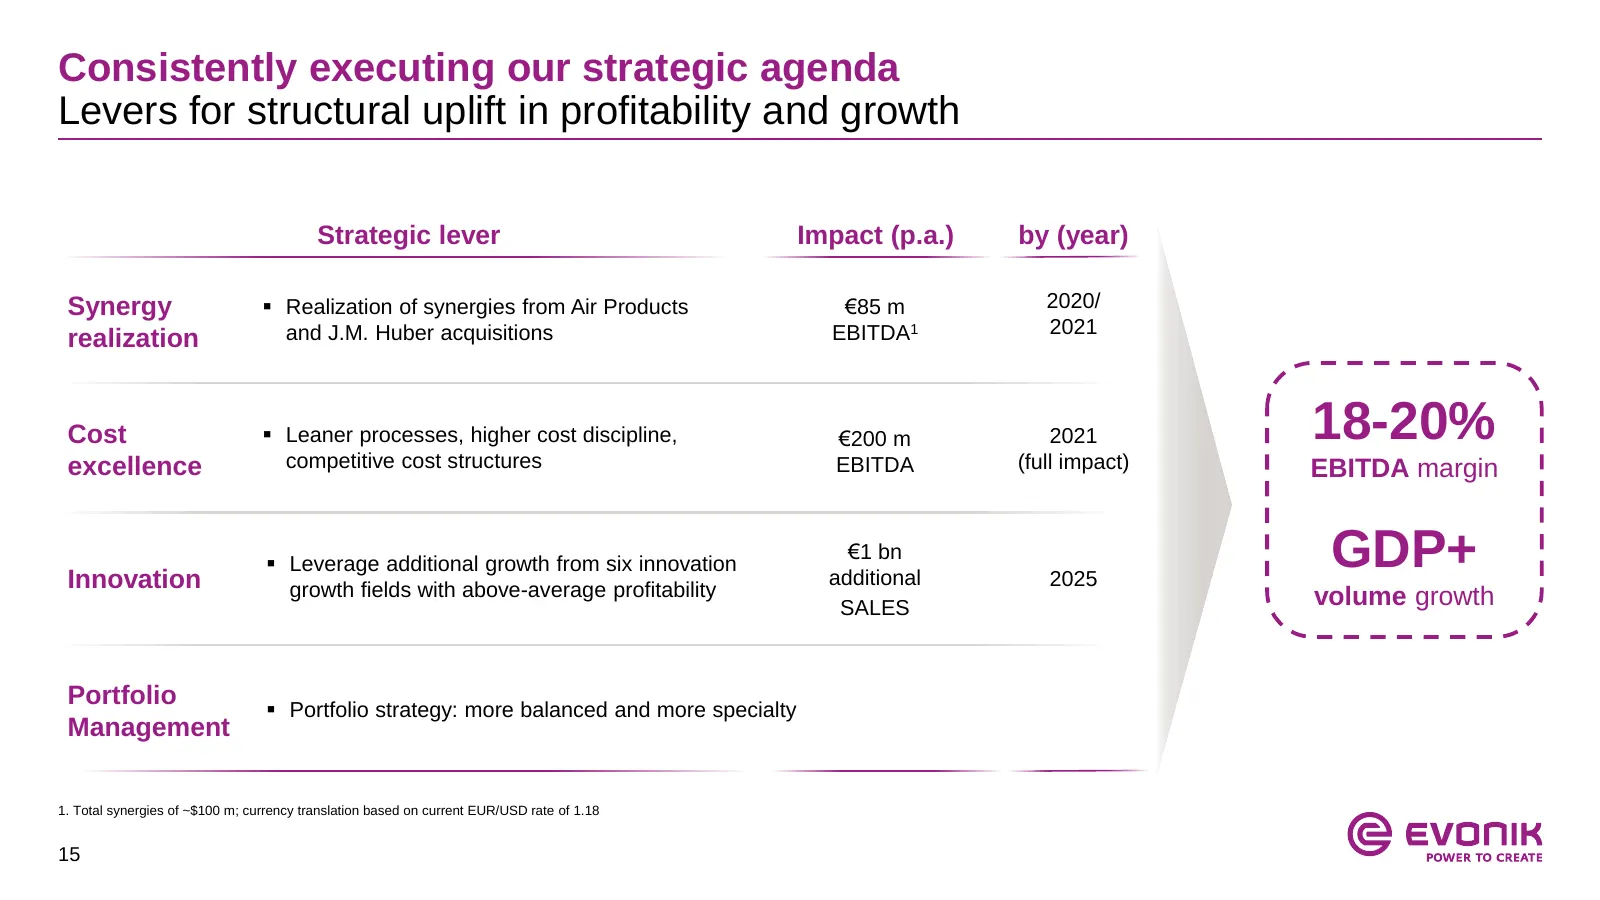
Consistently executing our strategic agenda Levers for structural uplift in profitability and growth Strategic lever Impact (p.a.) by (year) Synergy Realization of synergies from Air Products €85 m 2020/ and J.M. Huber acquisitions EBITDA1 2021 realization Cost Leaner processes, higher cost disc
Slide 16: Table of contents
Table of contents 1. Evonik at a glance 2. Strategy 3. Financials Q1 2018 4. Appendix 16
Slide 17: Our agenda for 2018 – Driving the change
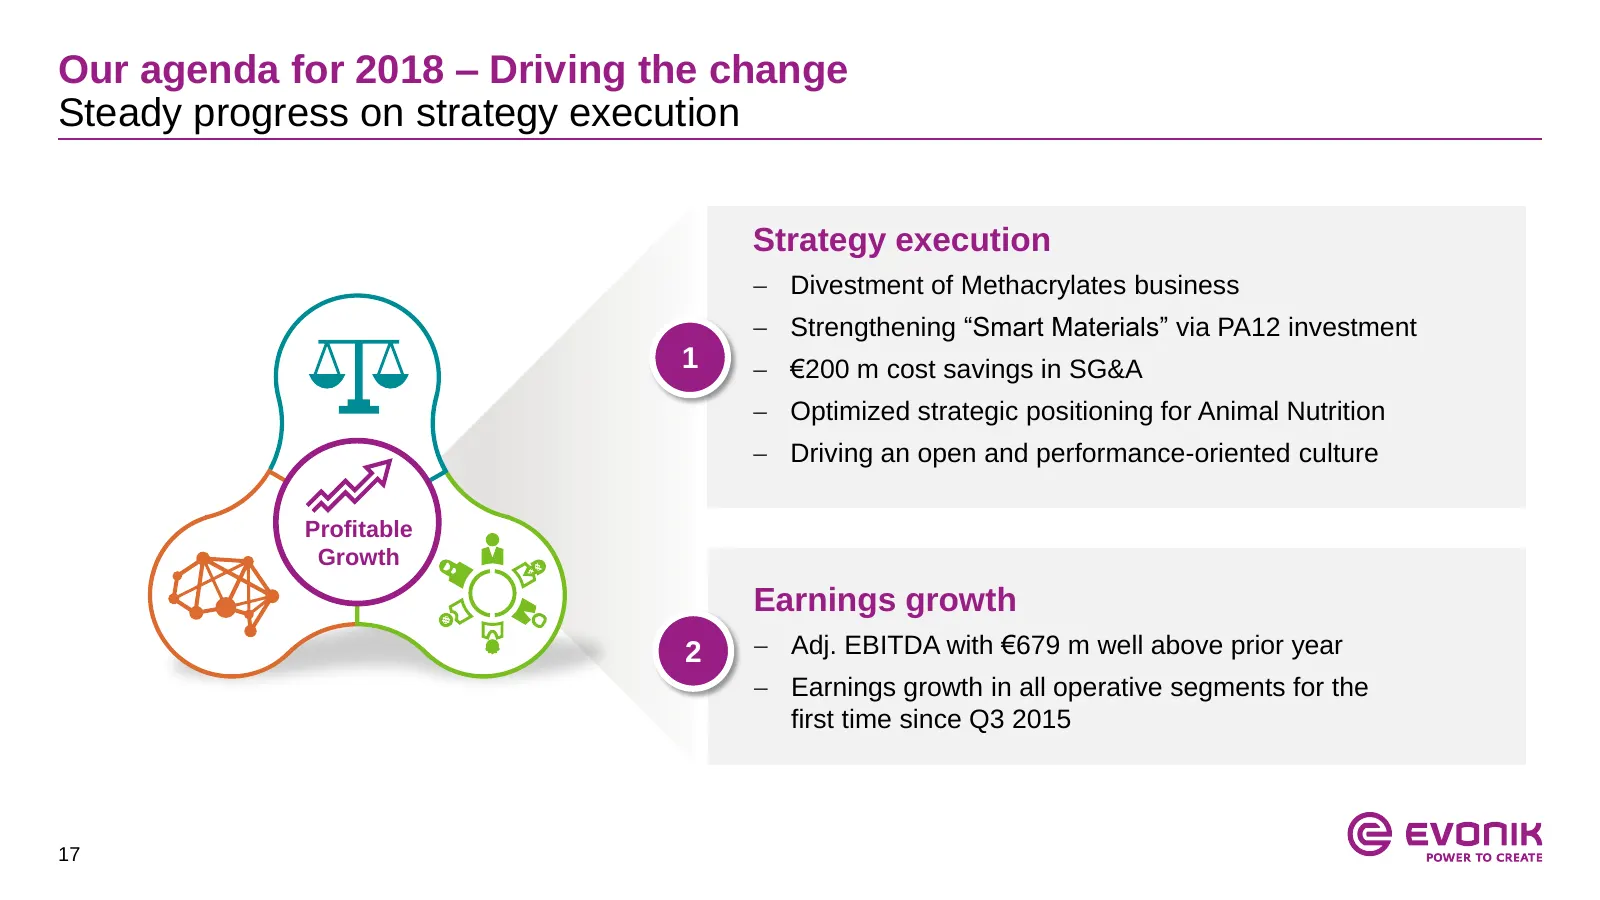
Our agenda for 2018 – Driving the change Steady progress on strategy execution Strategy execution Divestment of Methacrylates business Strengthening “Smart Materials” via PA12 investment 1 €200 m cost savings in SG&A Optimized strategic positioning for Animal Nutrition Driving an open and
Slide 18: Highlights Q1 2018
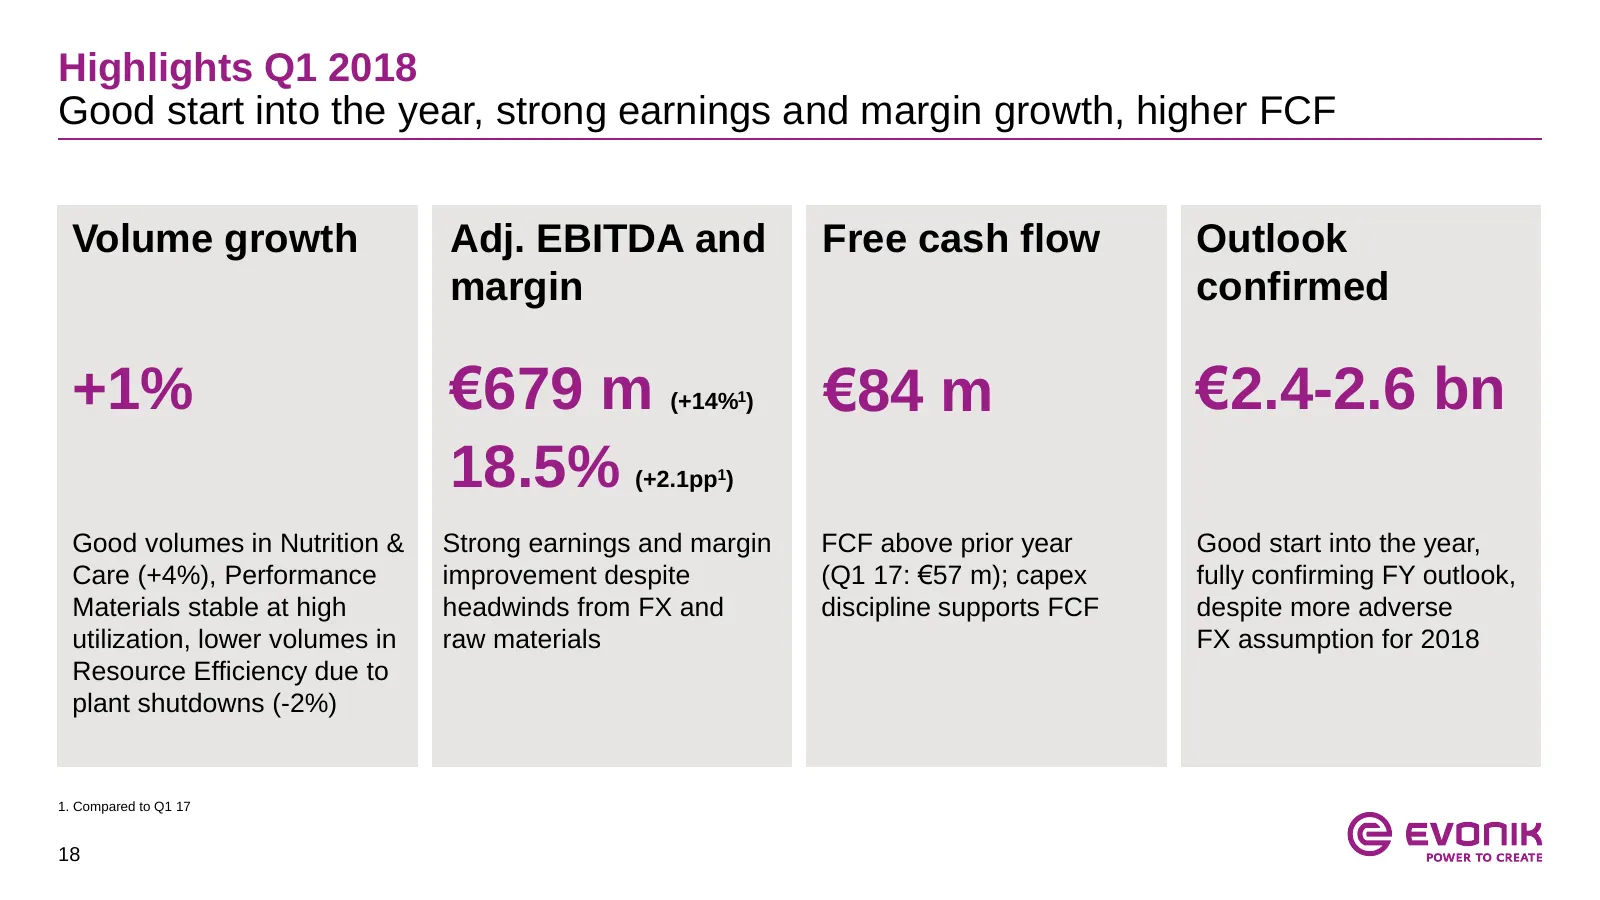
Highlights Q1 2018 Good start into the year, strong earnings and margin growth, higher FCF Volume growth Adj. EBITDA and Free cash flow Outlook margin confirmed +1% €679 m (+14%1) €84 m €2.4-2.6 bn 18.5% (+2.1pp1) Good volumes in Nutrition & Strong earnings and margin FCF above prior year Good start
Slide 19: Financial highlights Q1 2018
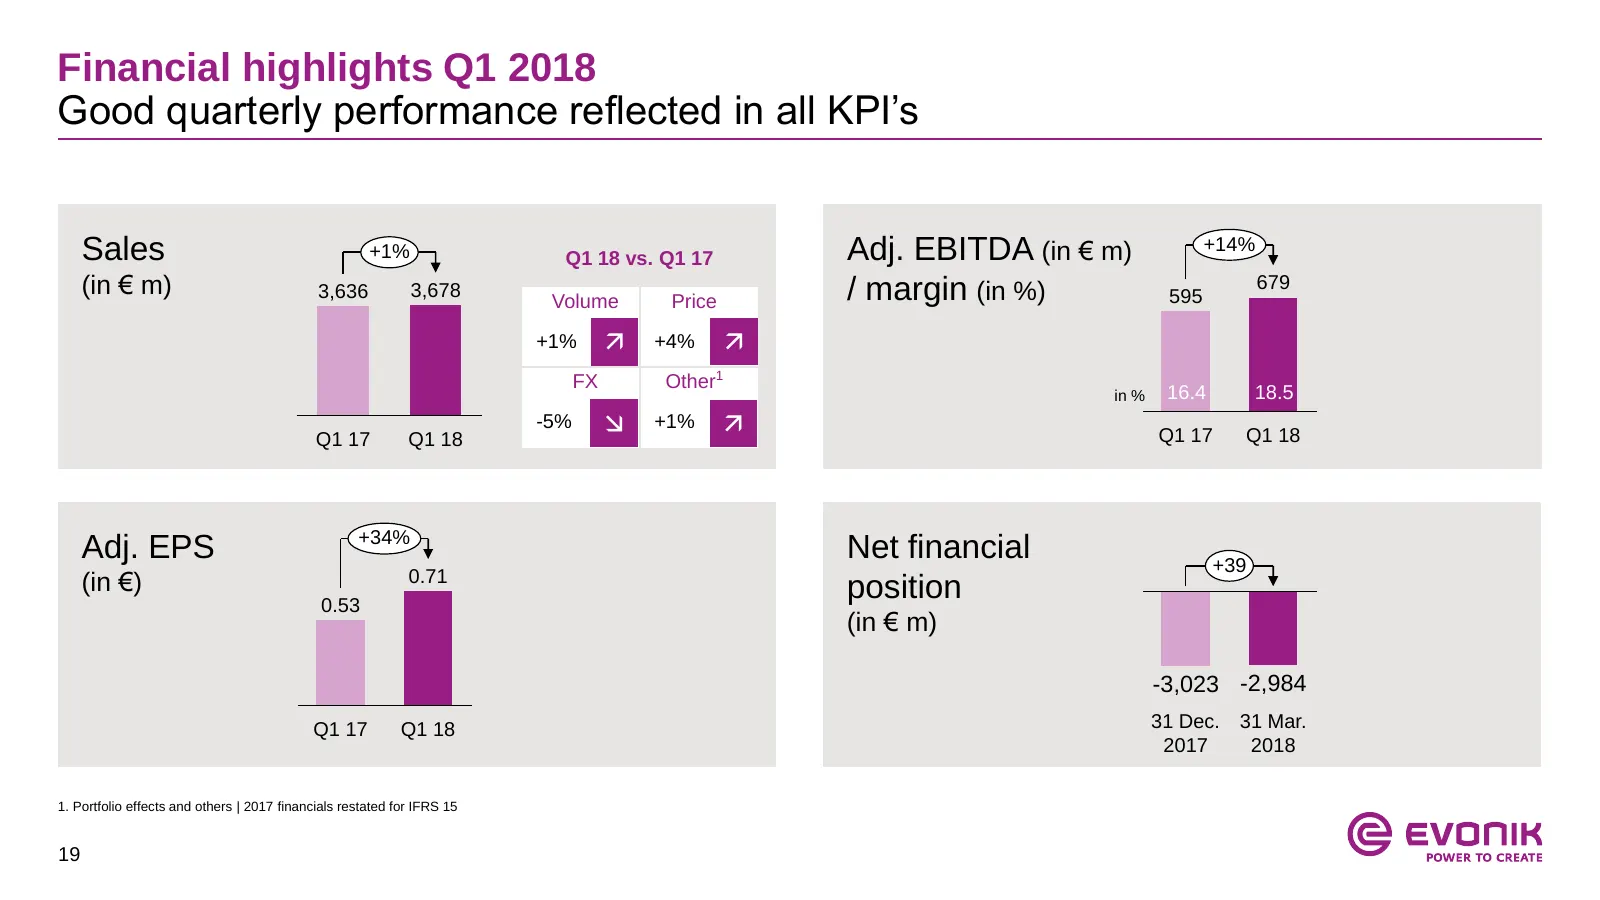
Financial highlights Q1 2018 Good quarterly performance reflected in all KPI’s Sales +1% Q1 18 vs. Q1 17 Adj. EBITDA (in € m) +14% (in € m) 3,636 3,678 / margin (in %) 595 679 Volume Price +1% +4% FX Other1 in % 16.4 18.5 Q1 17 Q1 18 -5% +1% Q1 17 Q1 18 +34% Adj. EPS Net financial +39 (i
Slide 20: Earnings development Q1 2018
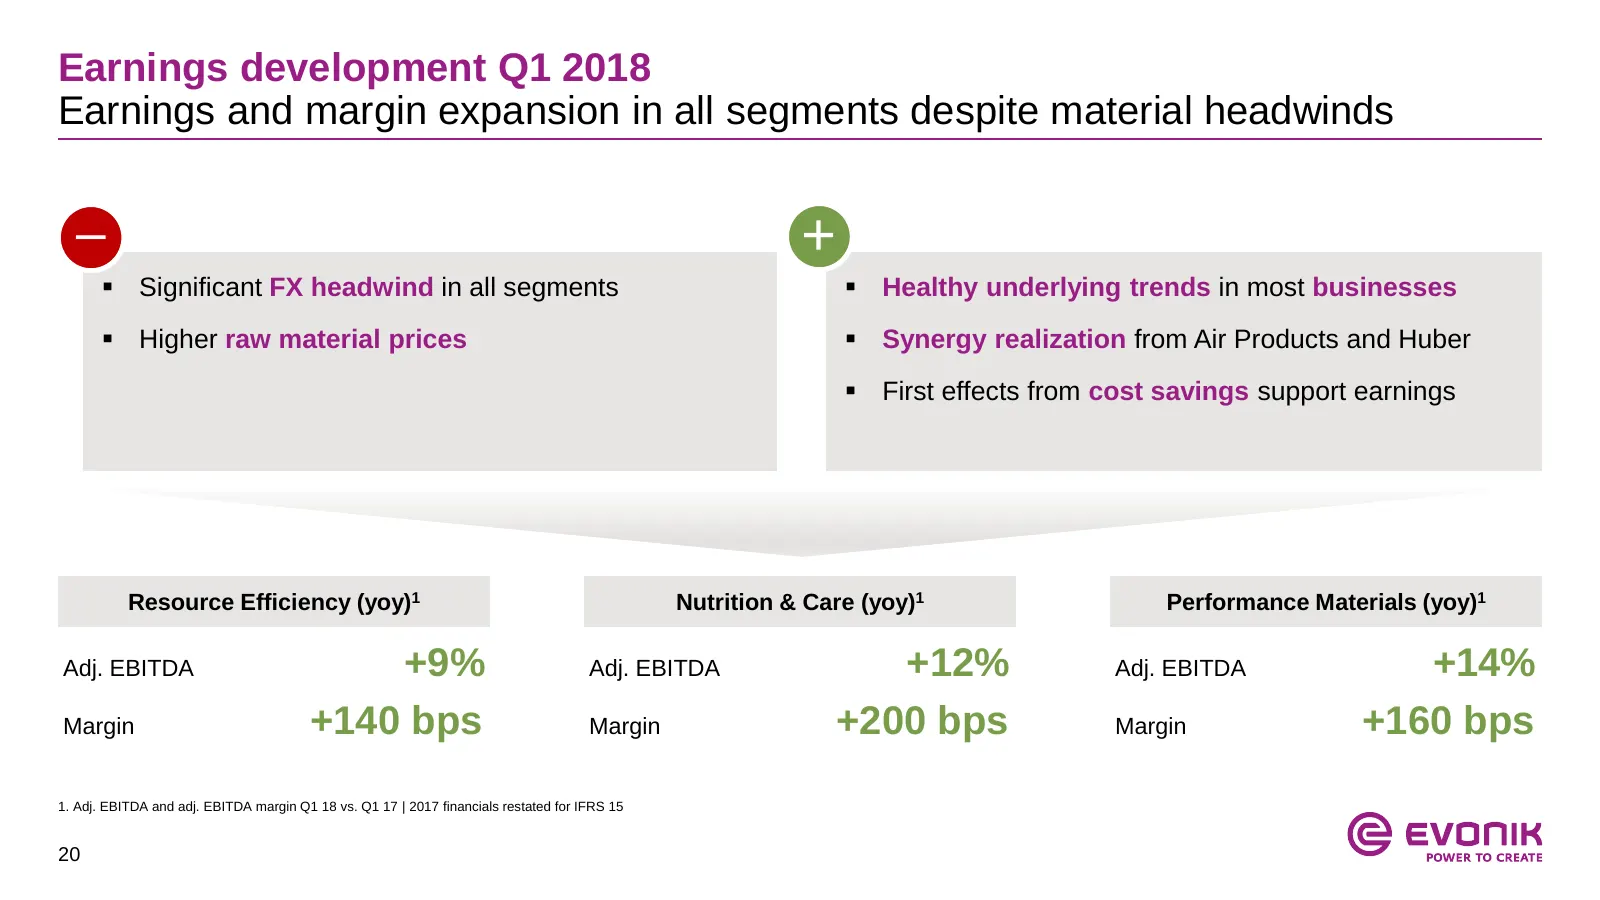
Earnings development Q1 2018 Earnings and margin expansion in all segments despite material headwinds – + Significant FX headwind in all segments Healthy underlying trends in most businesses Higher raw material prices Synergy realization from Air Products and Huber First effects from cost
Slide 21: Resource Efficiency
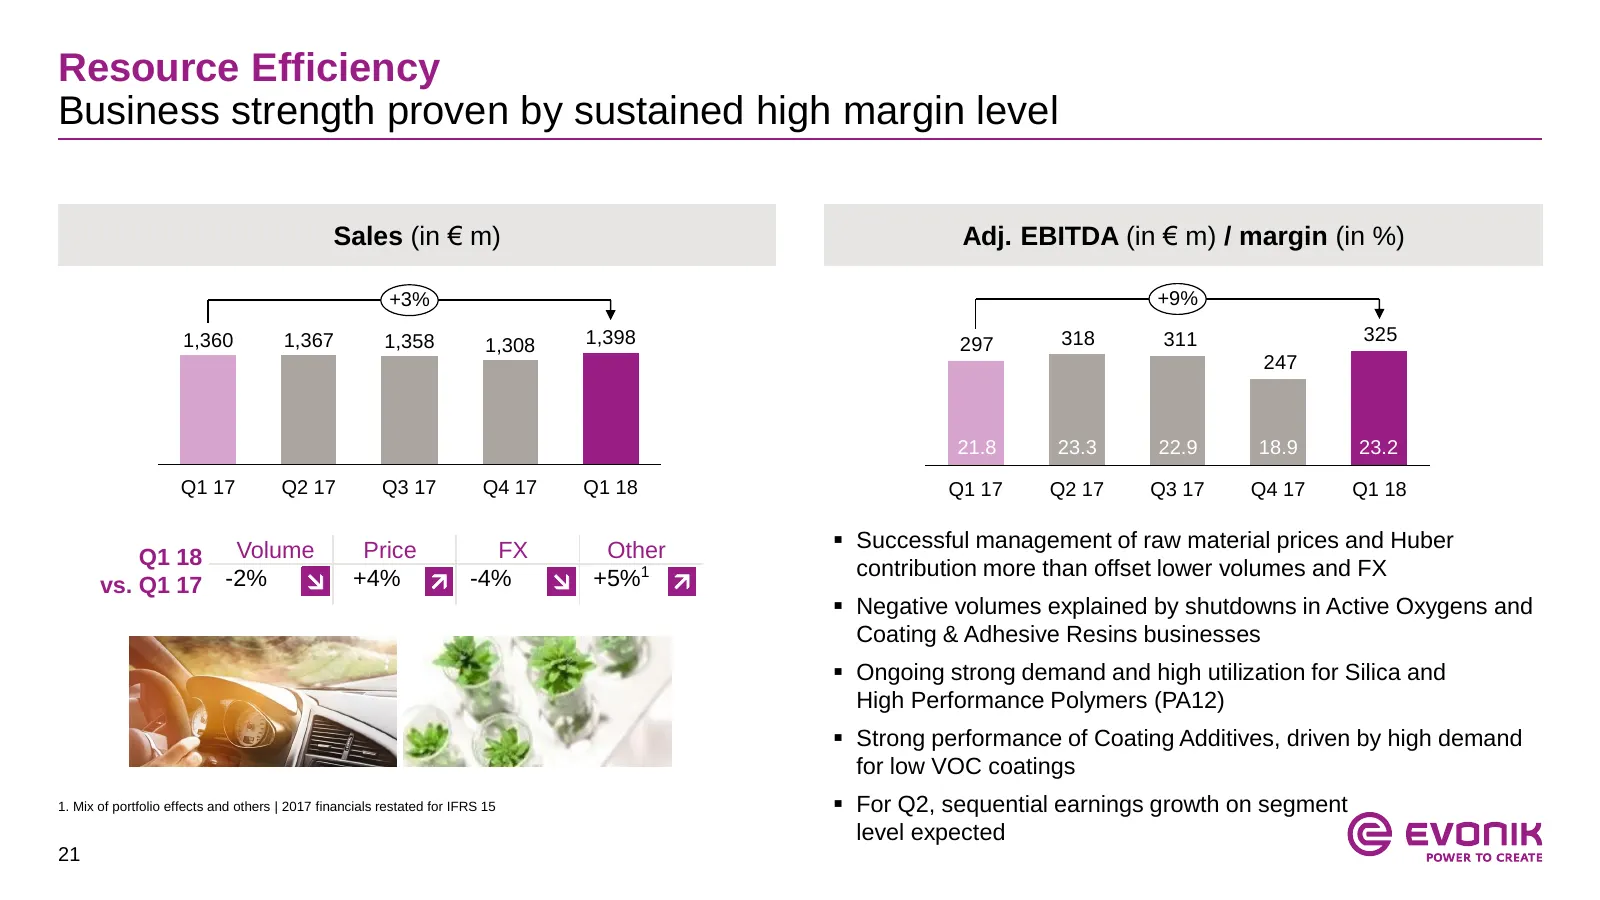
Resource Efficiency Business strength proven by sustained high margin level Sales (in € m) Adj. EBITDA (in € m) / margin (in %) +3% +9% 1,360 1,367 1,358 1,398 318 311 325 1,308 297 247 21.8 23.3 22.9 18.9 23.2 Q1 17 Q2 17 Q3 17 Q4 17 Q1 18 Q1 17 Q2 17 Q3 17 Q4 17 Q1 18 Successful management of ra
Slide 22: Nutrition & Care
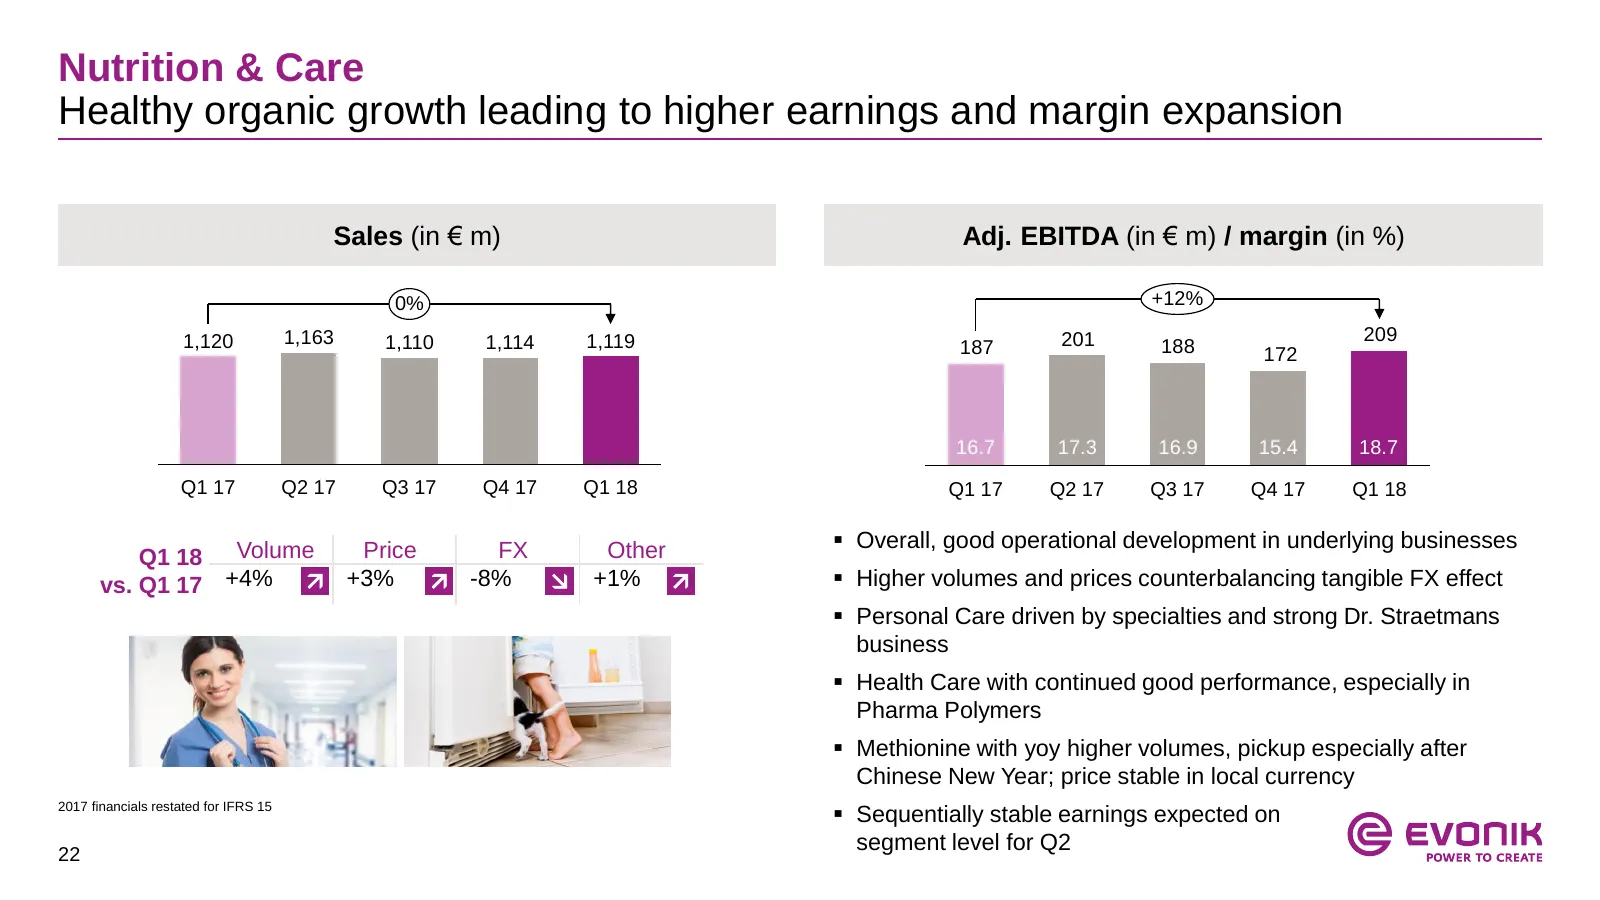
Nutrition & Care Healthy organic growth leading to higher earnings and margin expansion Sales (in € m) Adj. EBITDA (in € m) / margin (in %) 0% +12% 1,120 1,163 1,110 1,114 1,119 201 209 187 188 172 16.7 17.3 16.9 15.4 18.7 Q1 17 Q2 17 Q3 17 Q4 17 Q1 18 Q1 17 Q2 17 Q3 17 Q4 17 Q1 18 Overall, good o
Slide 23: Performance Materials
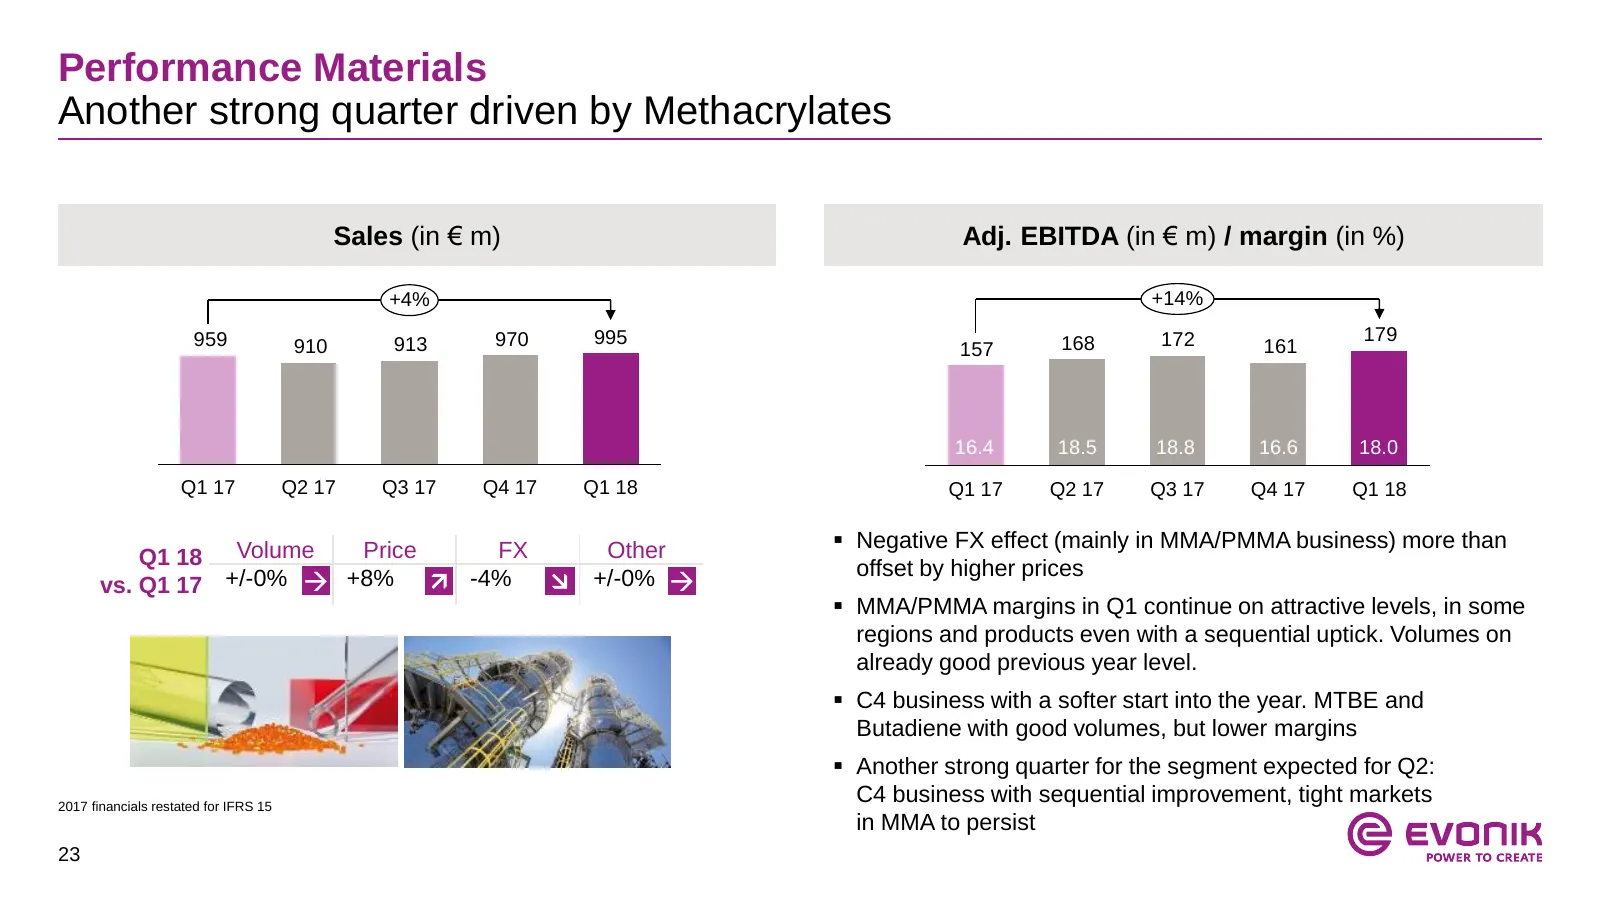
Performance Materials Another strong quarter driven by Methacrylates Sales (in € m) Adj. EBITDA (in € m) / margin (in %) +4% +14% 959 970 995 168 172 179 910 913 157 161 16.4 18.5 18.8 16.6 18.0 Q1 17 Q2 17 Q3 17 Q4 17 Q1 18 Q1 17 Q2 17 Q3 17 Q4 17 Q1 18 Negative FX effect (mainly in MMA/PMMA busi
Slide 24: Outlook 2018
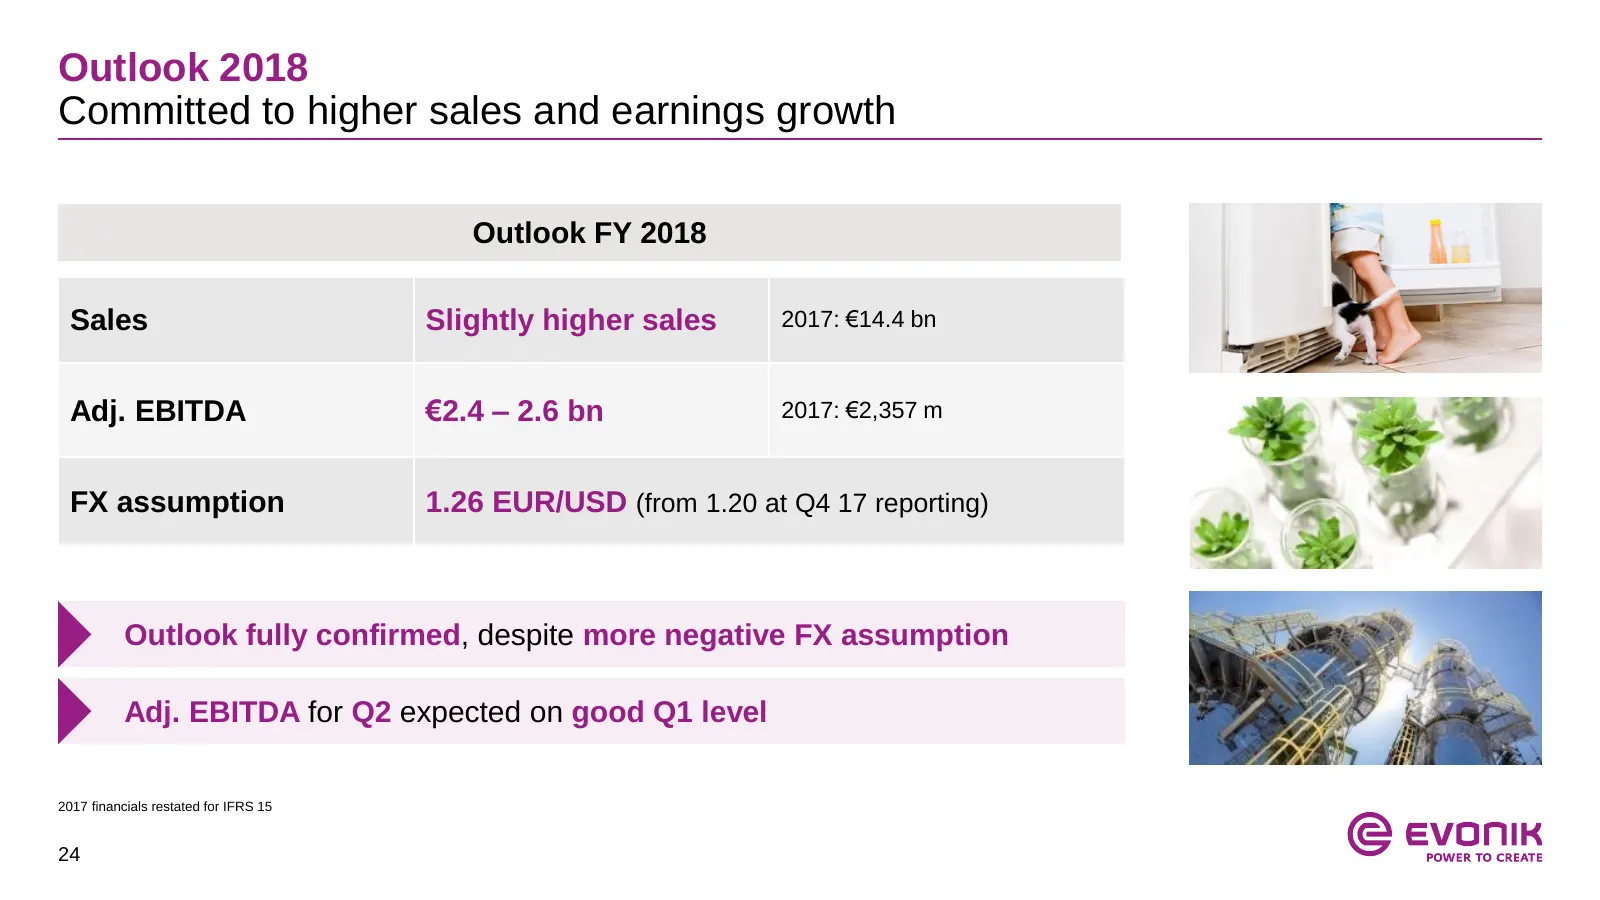
Outlook 2018 Committed to higher sales and earnings growth Outlook FY 2018 Sales Slightly higher sales 2017: €14.4 bn Adj. EBITDA €2.4 – 2.6 bn 2017: €2,357 m FX assumption 1.26 EUR/USD (from 1.20 at Q4 17 reporting) Outlook fully confirmed, despite more negative FX assumption Adj. EBITDA for Q2 exp
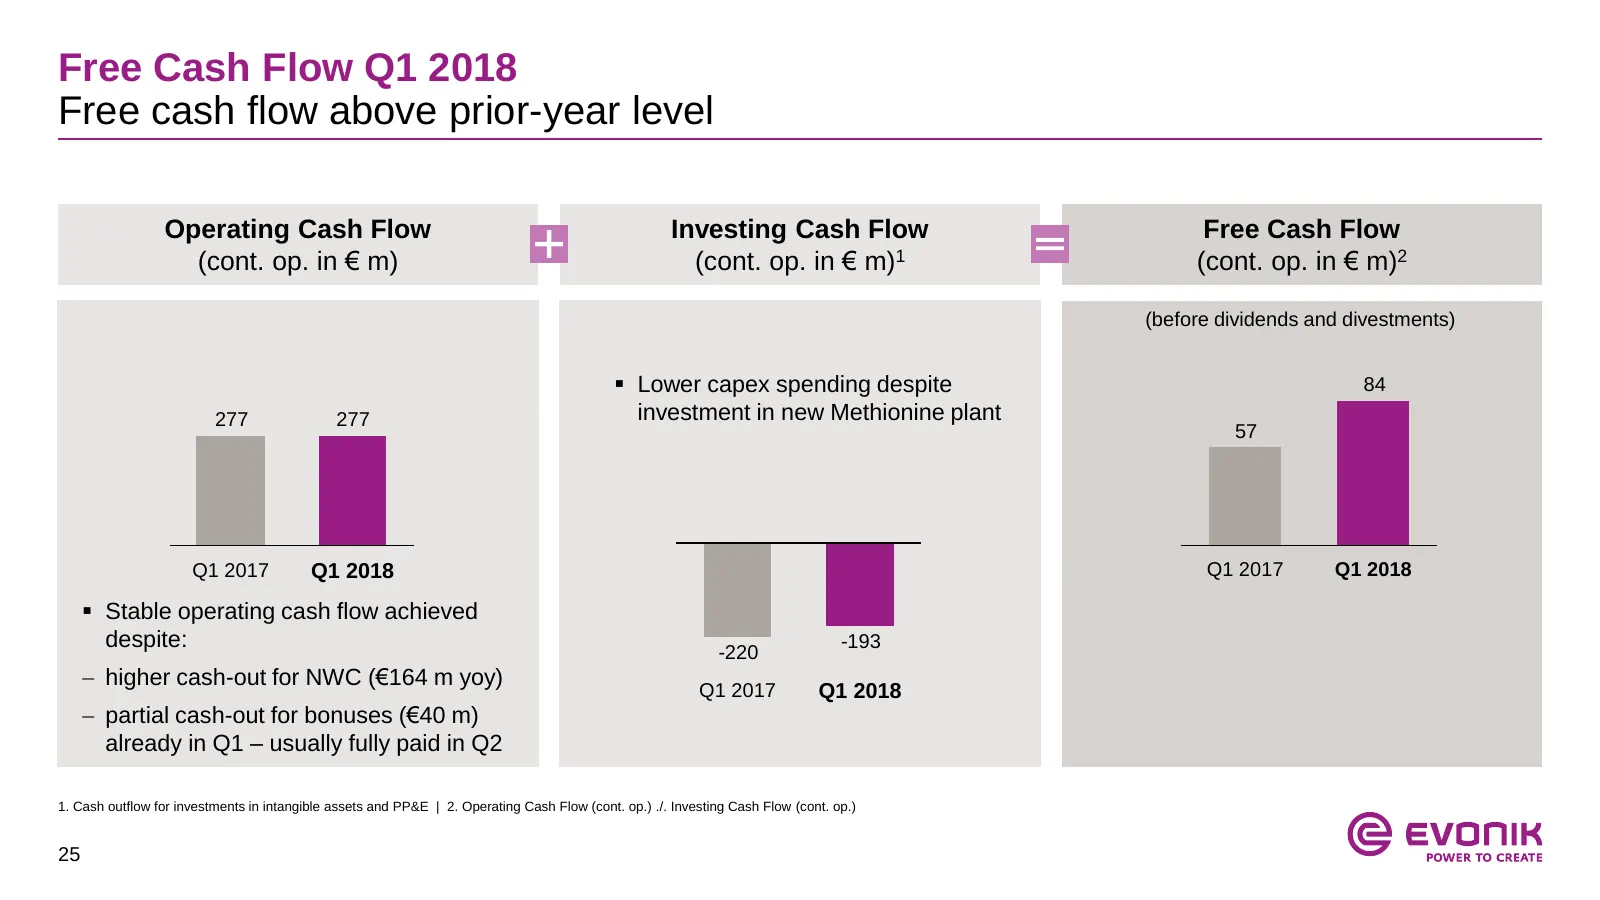
Slide 25: Free Cash Flow Q1 2018
Free Cash Flow Q1 2018 Free cash flow above prior-year level Operating Cash Flow Investing Cash Flow Free Cash Flow (cont. op. in € m) (cont. op. in € m)1 (cont. op. in € m)2 (before dividends and divestments) Lower capex spending despite 84 277 277 investment in new Methionine plant 57 Q1 2017 Q1
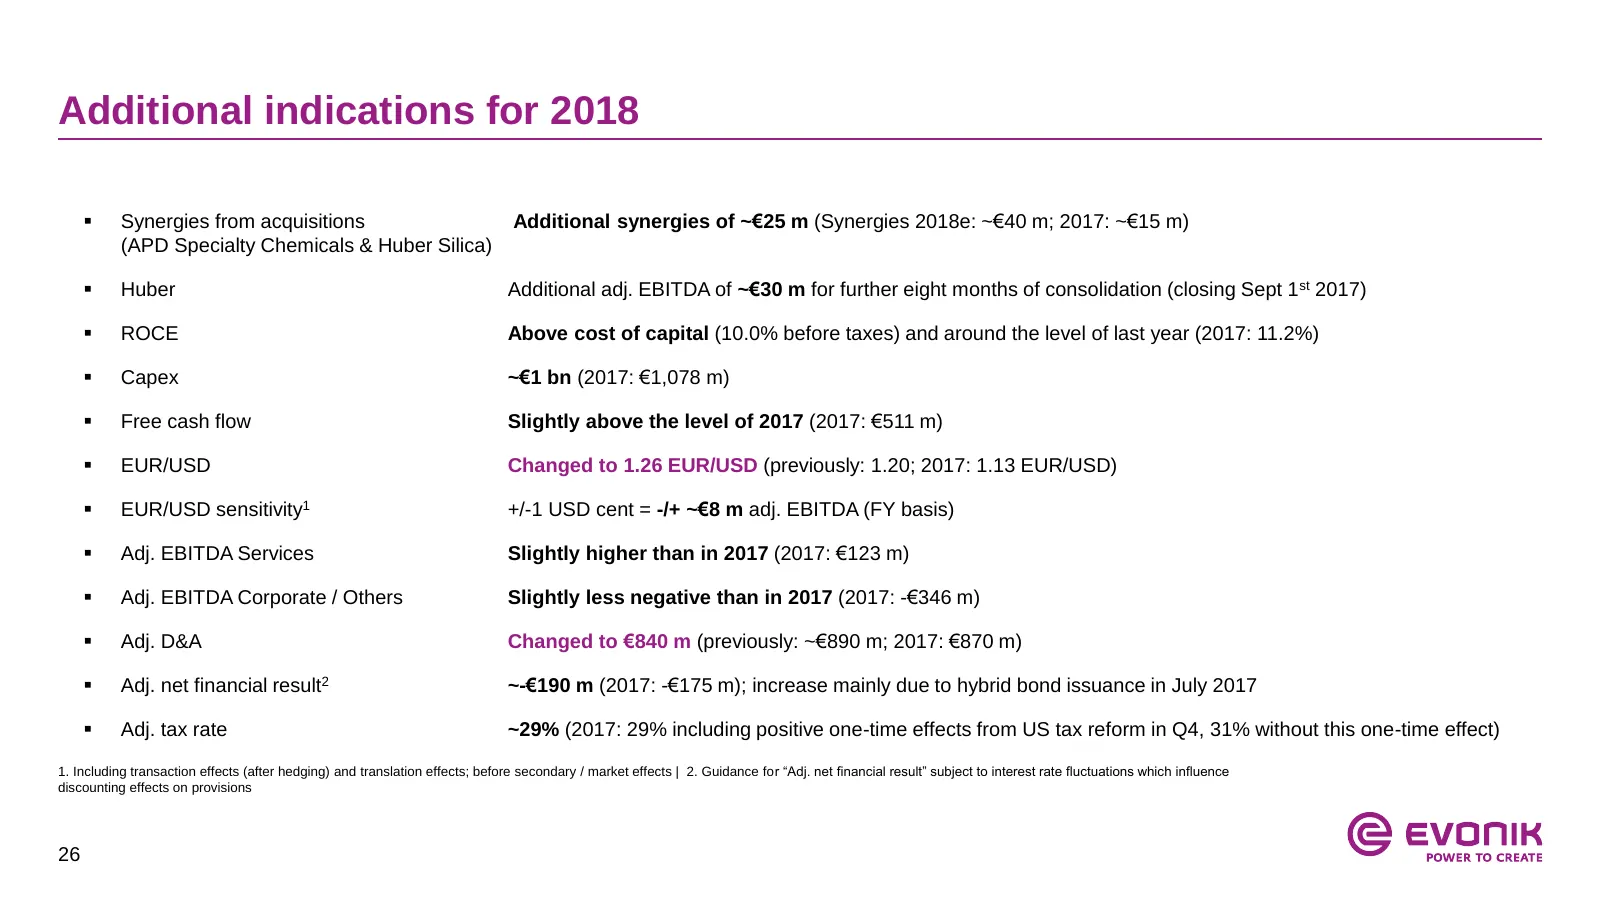
Slide 26: Additional indications for 2018
Additional indications for 2018 Synergies from acquisitions Additional synergies of ~€25 m (Synergies 2018e: ~€40 m; 2017: ~€15 m) (APD Specialty Chemicals & Huber Silica) Huber Additional adj. EBITDA of ~€30 m for further eight months of consolidation (closing Sept 1st 2017) ROCE Above cost o
Slide 27: © evonik
© evonik
Slide 28: Appendix
Appendix 1. Strategy Details 2. Segment overview 3. Financials 4. Upcoming events 28
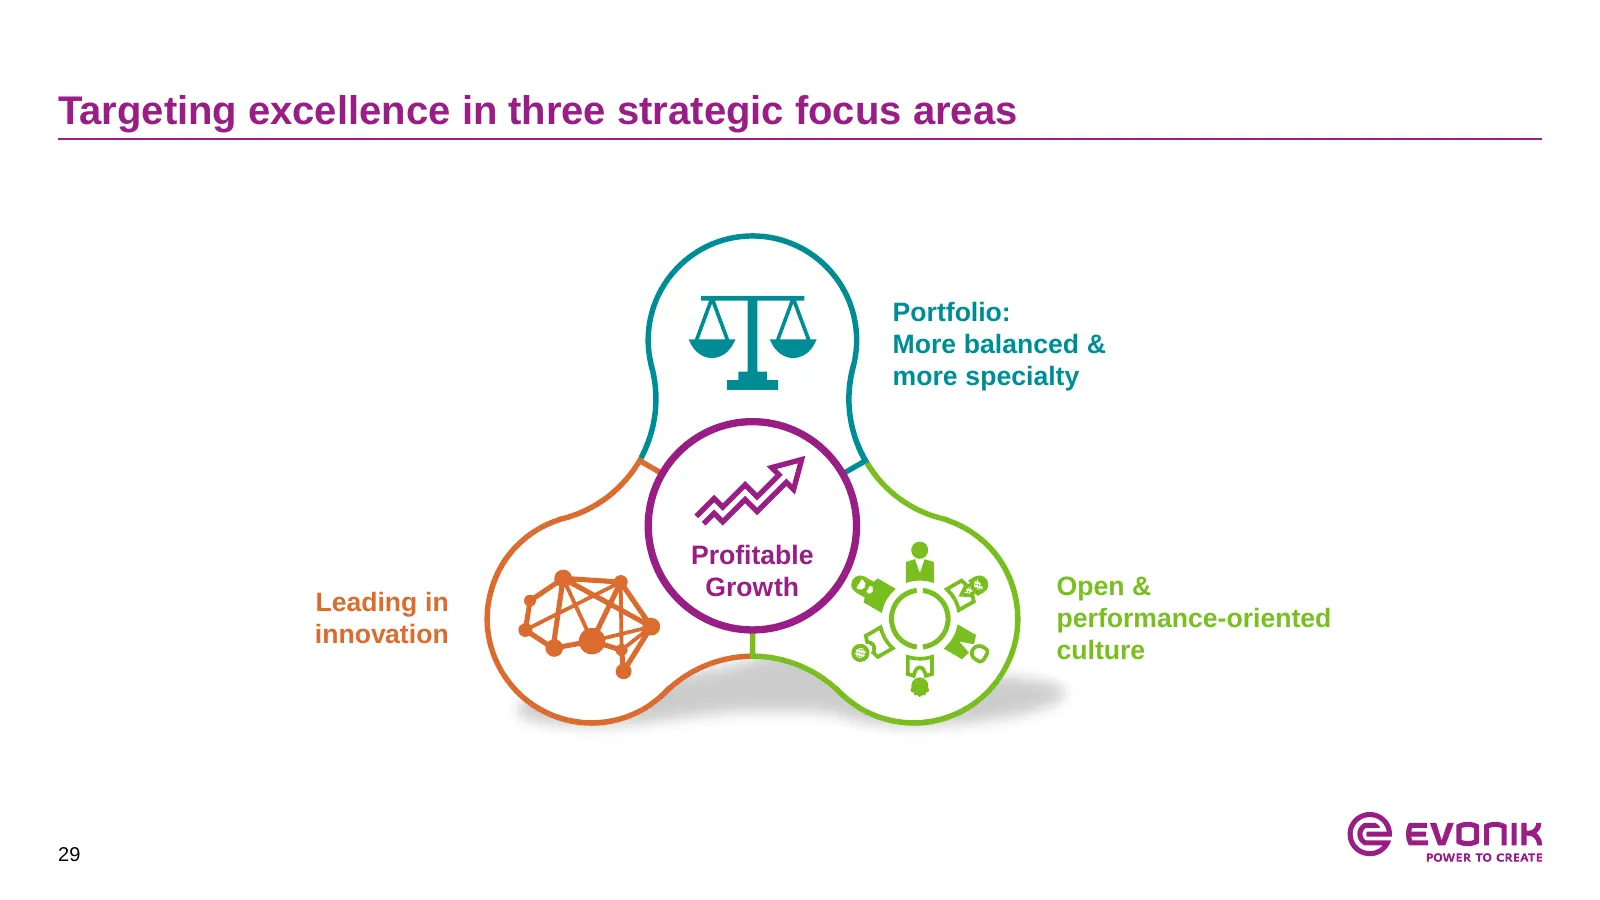
Slide 29: Targeting excellence in three strategic focus areas
Targeting excellence in three strategic focus areas Portfolio: More balanced & more specialty Profitable Growth Open & Leading in performance-oriented innovation culture 29
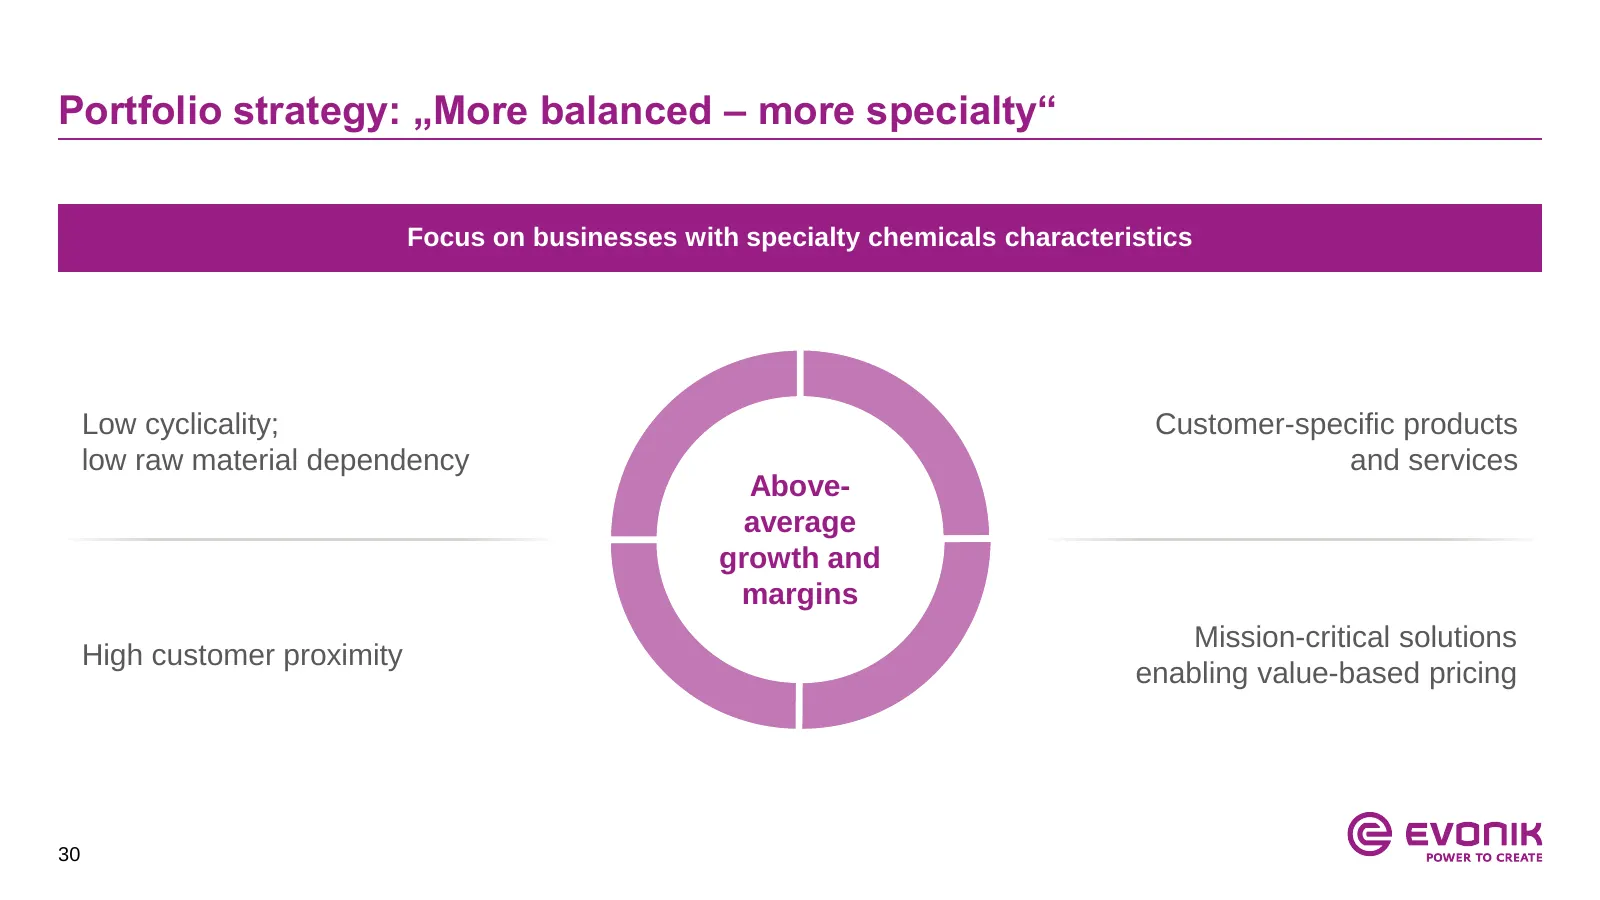
Slide 30: Portfolio strategy: More balanced – more specialty
Portfolio strategy: „More balanced – more specialty“ Focus on businesses with specialty chemicals characteristics Low cyclicality; Customer-specific products low raw material dependency and services Above- average growth and margins Mission-critical solutions High customer proximity enabling value-b
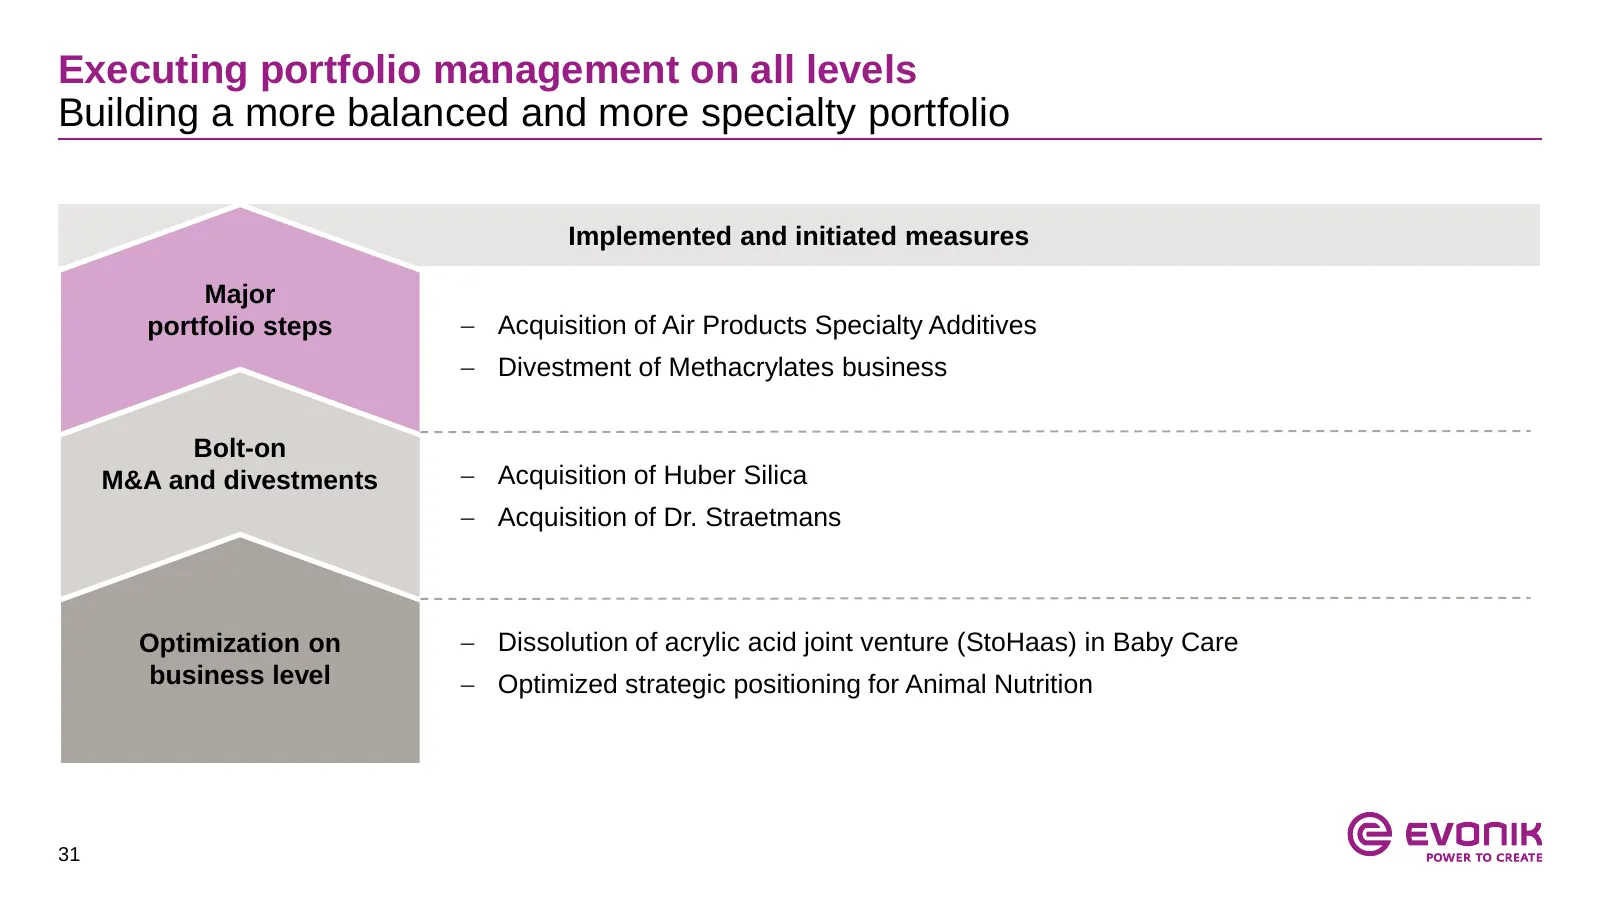
Slide 31: Executing portfolio management on all levels
Executing portfolio management on all levels Building a more balanced and more specialty portfolio Implemented and initiated measures Major portfolio steps Acquisition of Air Products Specialty Additives Divestment of Methacrylates business Bolt-on M&A and divestments Acquisition of Huber Sili
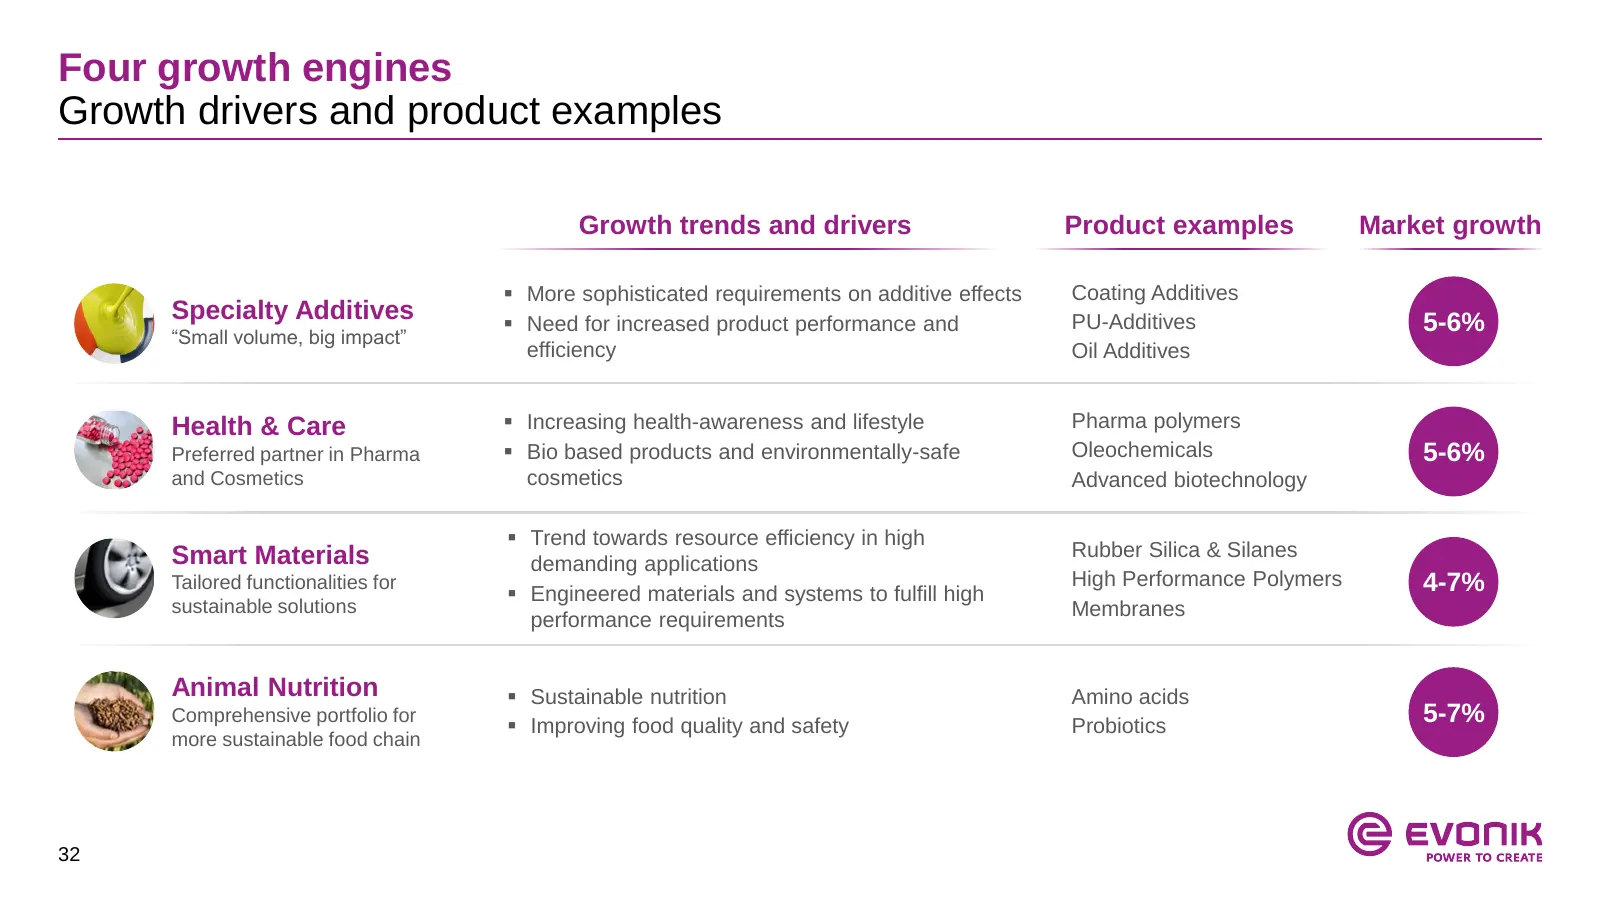
Slide 32: Four growth engines
Four growth engines Growth drivers and product examples Growth trends and drivers Product examples Market growth More sophisticated requirements on additive effects Coating Additives Specialty Additives Need for increased product performance and PU-Additives 5-6% “Small volume, big impact” effic
Slide 33: Targeted and disciplined M&A approach
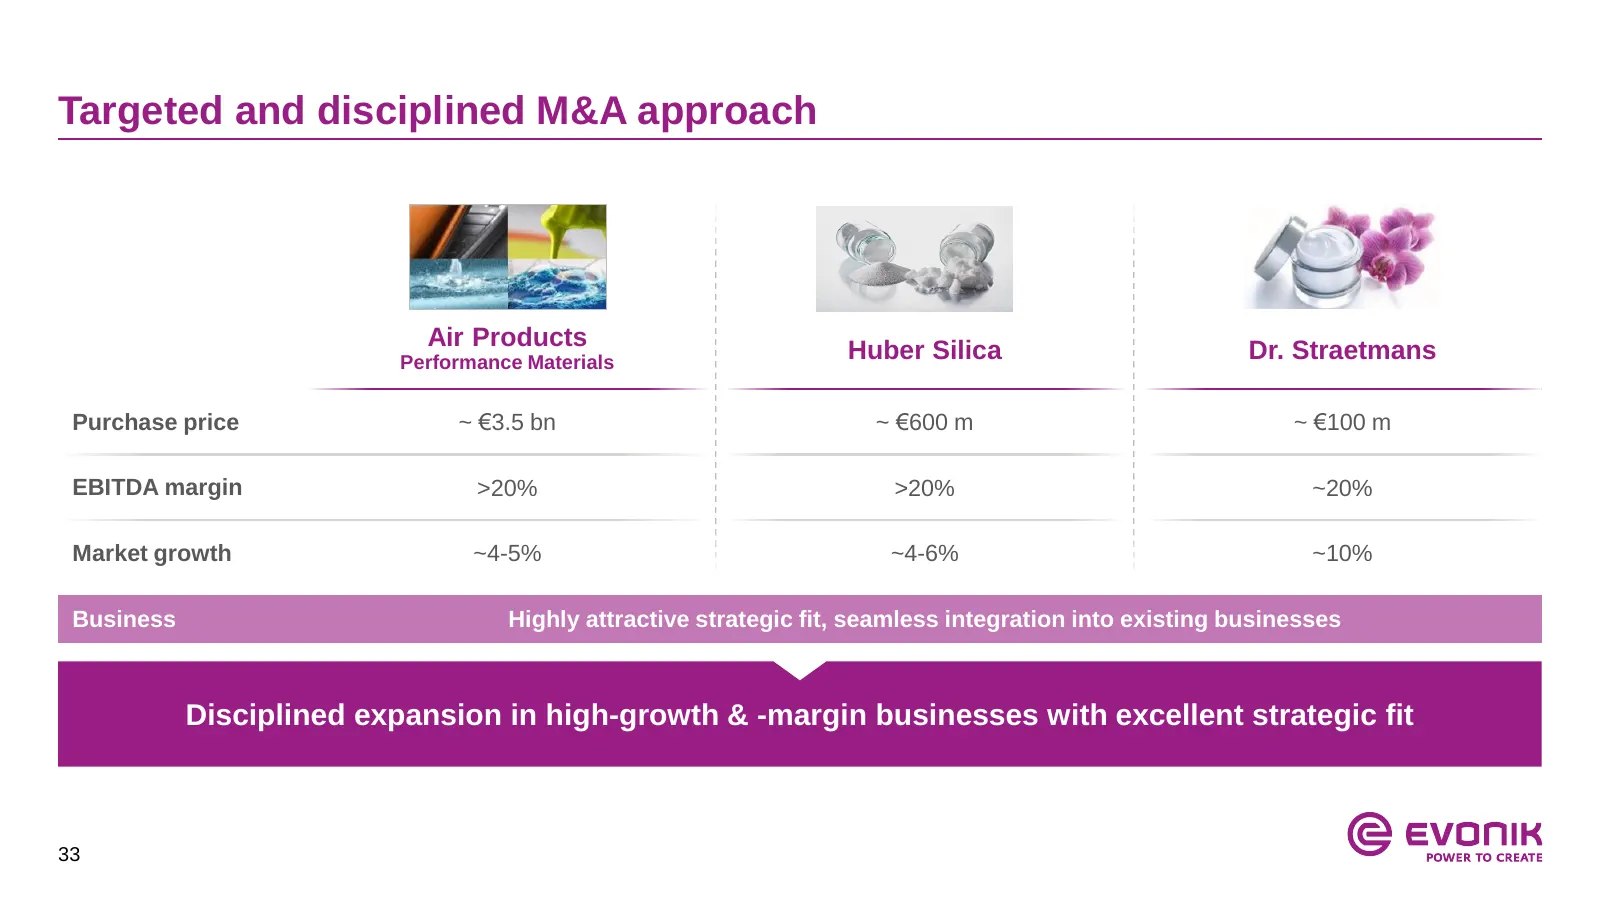
Targeted and disciplined M&A approach Air Products Huber Silica Dr. Straetmans Performance Materials Purchase price ~ €3.5 bn ~ €600 m ~ €100 m EBITDA margin >20% >20% ~20% Market growth ~4-5% ~4-6% ~10% Business Highly attractive strategic fit, seamless integration into existing businesses Discipli
Slide 34: Achieving cost excellence
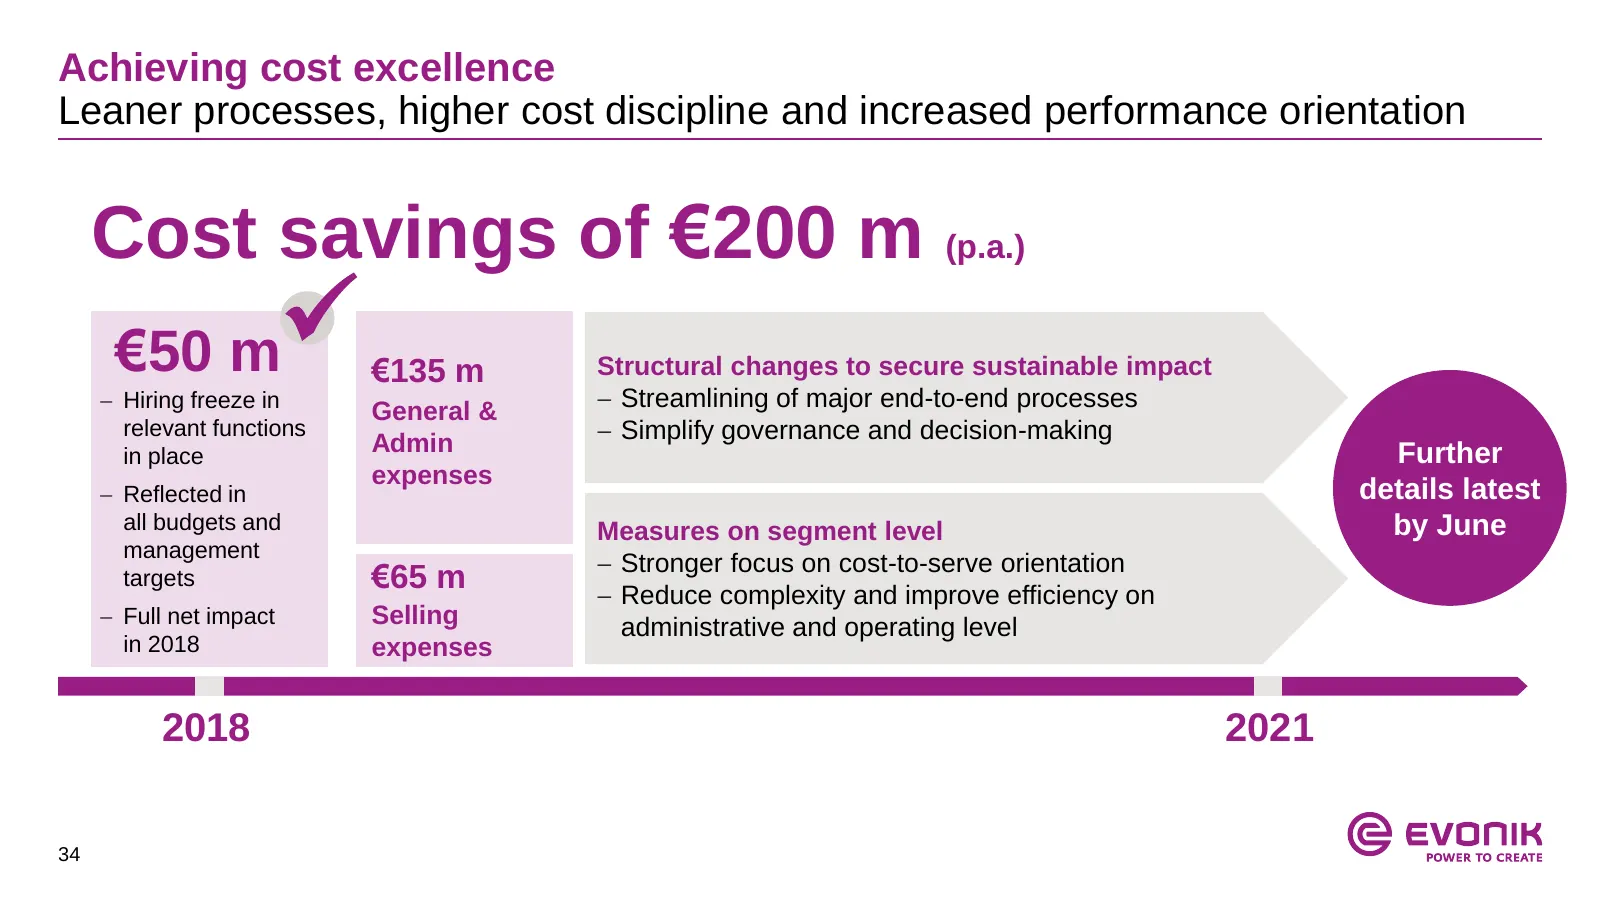
Achieving cost excellence Leaner processes, higher cost discipline and increased performance orientation Cost savings of €200 m (p.a.) €50 m €135 m Structural changes to secure sustainable impact Hiring freeze in General & Streamlining of major end-to-end processes relevant functions Admin S
Slide 35: Implementation schedule for acquisition synergies
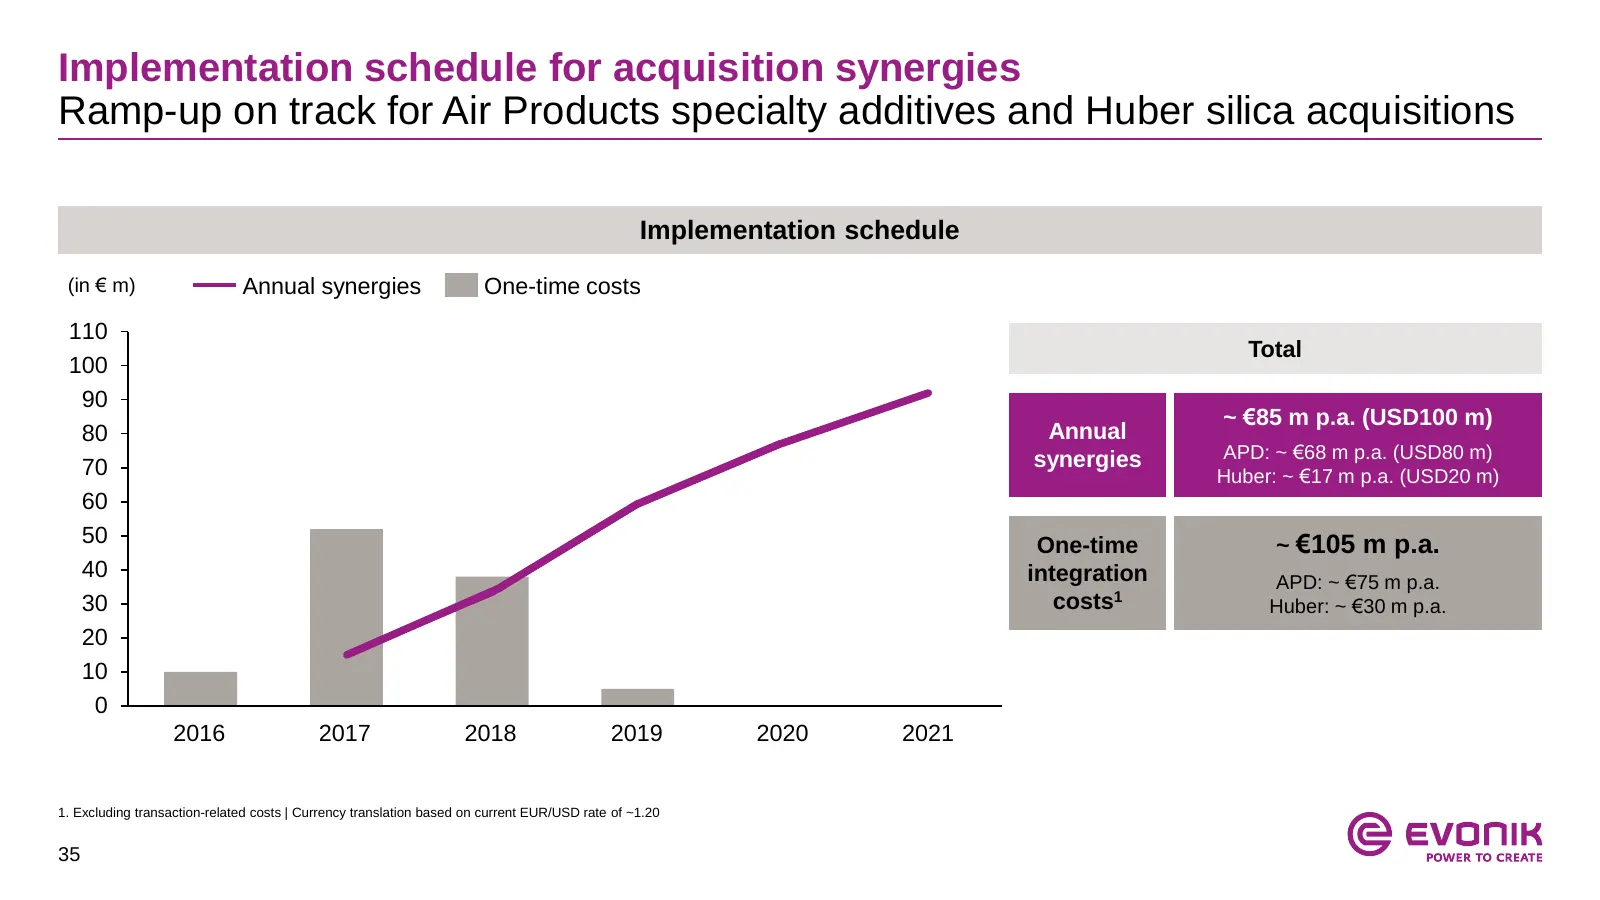
Implementation schedule for acquisition synergies Ramp-up on track for Air Products specialty additives and Huber silica acquisitions Implementation schedule (in € m) Annual synergies One-time costs 110 Total 100 90 ~ €85 m p.a. (USD100 m) 80 Annual synergies APD: ~ €68 m p.a. (USD80 m) 70 Huber: ~
Slide 36: Acquisition of Air Products Performance Materials activities
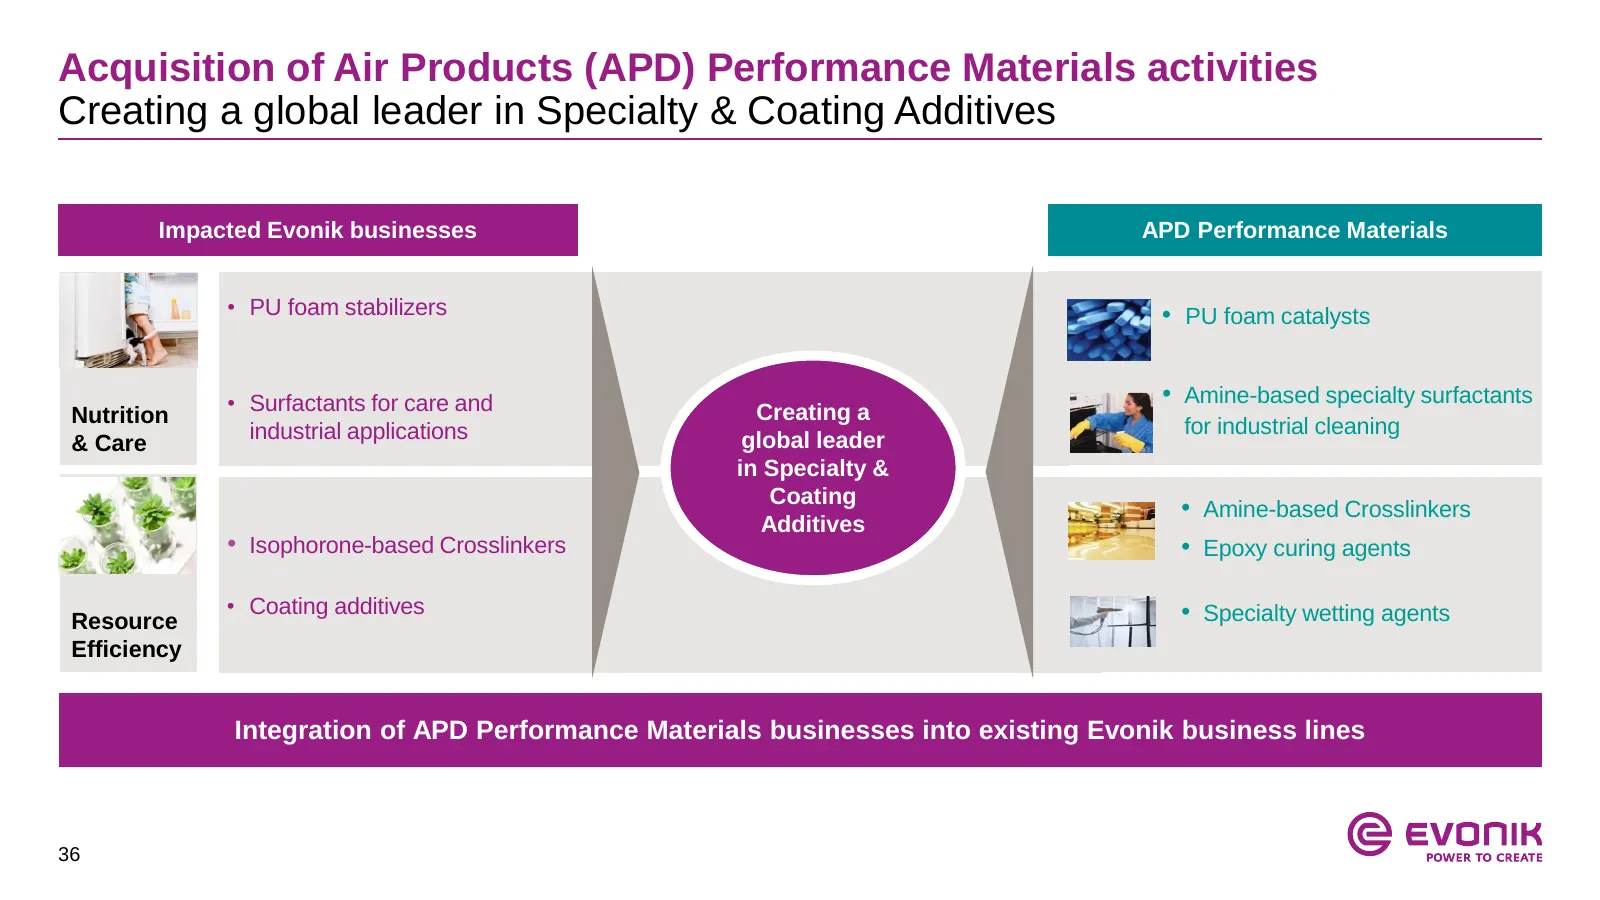
Acquisition of Air Products (APD) Performance Materials activities Creating a global leader in Specialty & Coating Additives Impacted Evonik businesses APD Performance Materials • PU foam stabilizers • PU foam catalysts • Surfactants for care and • Amine-based specialty surfactants Nutrition Creatin
Slide 37: Acquisition of Huber Silica
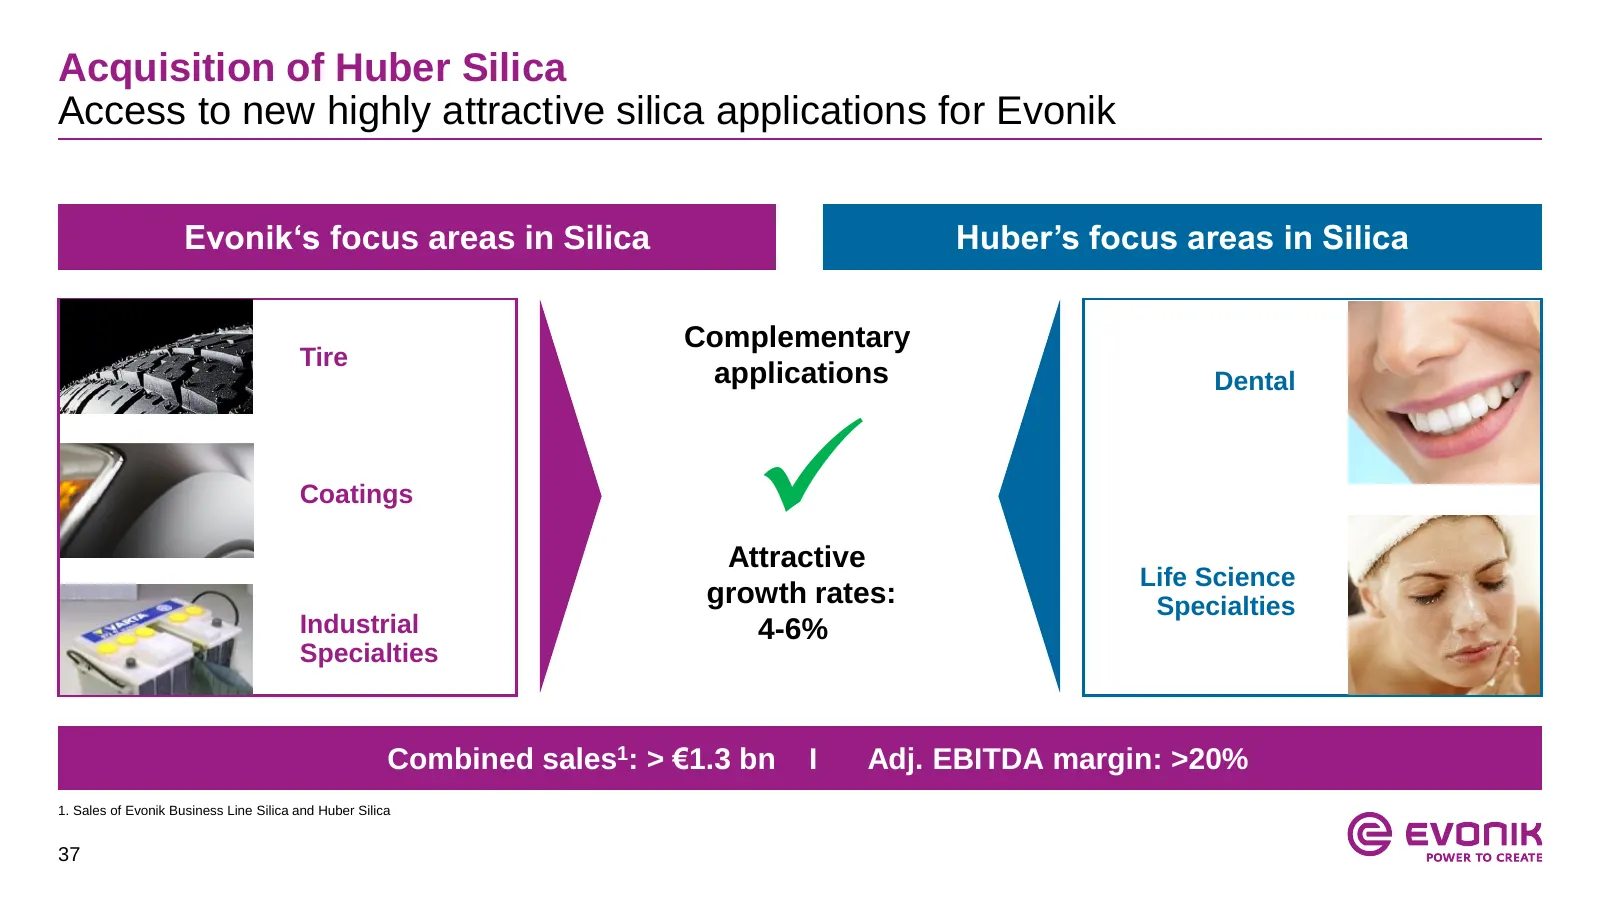
Acquisition of Huber Silica Access to new highly attractive silica applications for Evonik Evonik‘s focus areas in Silica Huber’s focus areas in Silica Complementary Tire applications Dental Coatings Attractive growth rates: Life Science Specialties Industrial 4-6% Specialties Combined sales1: > €
Slide 38: Leading in Innovation
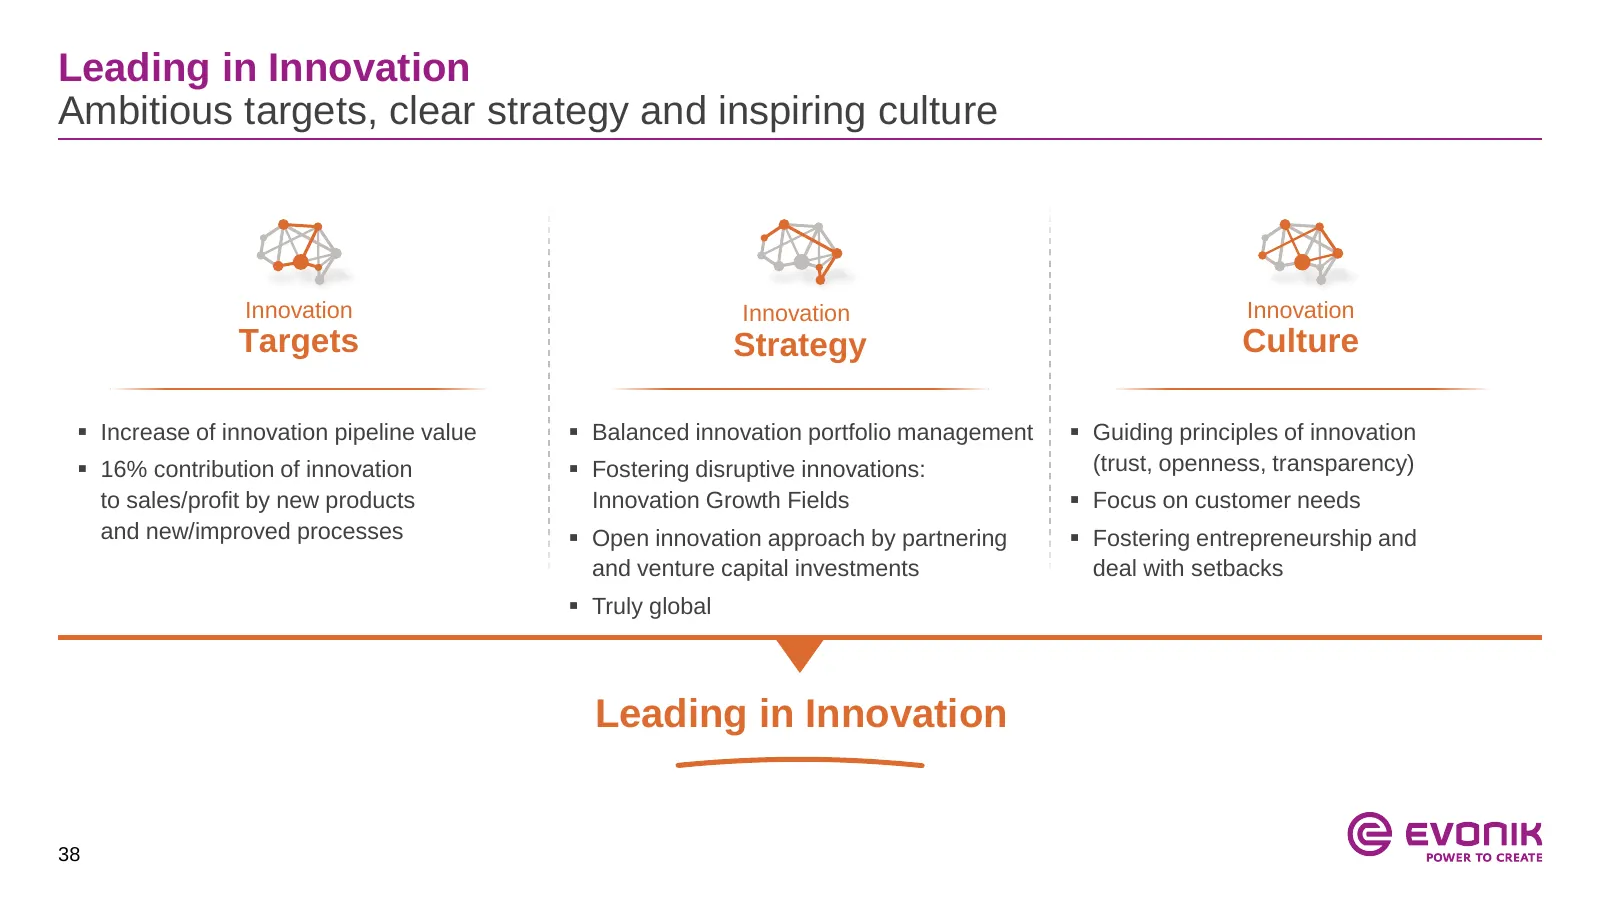
Leading in Innovation Ambitious targets, clear strategy and inspiring culture Innovation Innovation Innovation Targets Strategy Culture Increase of innovation pipeline value Balanced innovation portfolio management Guiding principles of innovation 16% contribution of innovation Fostering d
Slide 39: Innovation: Our goals
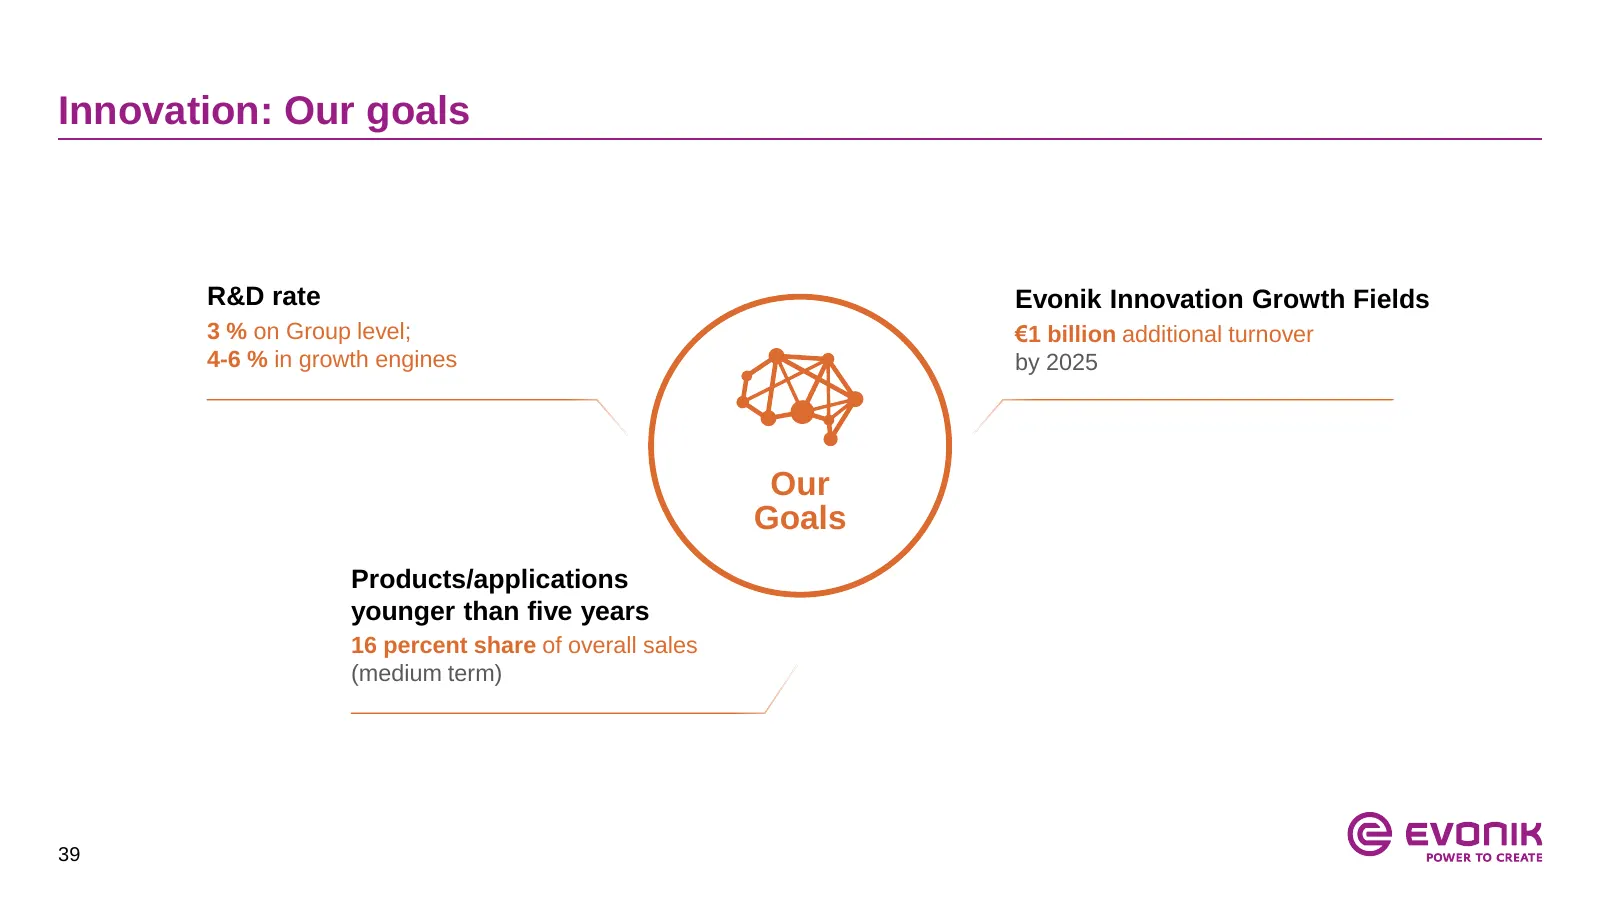
Innovation: Our goals R&D rate Evonik Innovation Growth Fields 3 % on Group level; €1 billion additional turnover 4-6 % in growth engines by 2025 Our Goals Products/applications younger than five years 16 percent share of overall sales (medium term) 39
Slide 40: Corporate culture drives performance
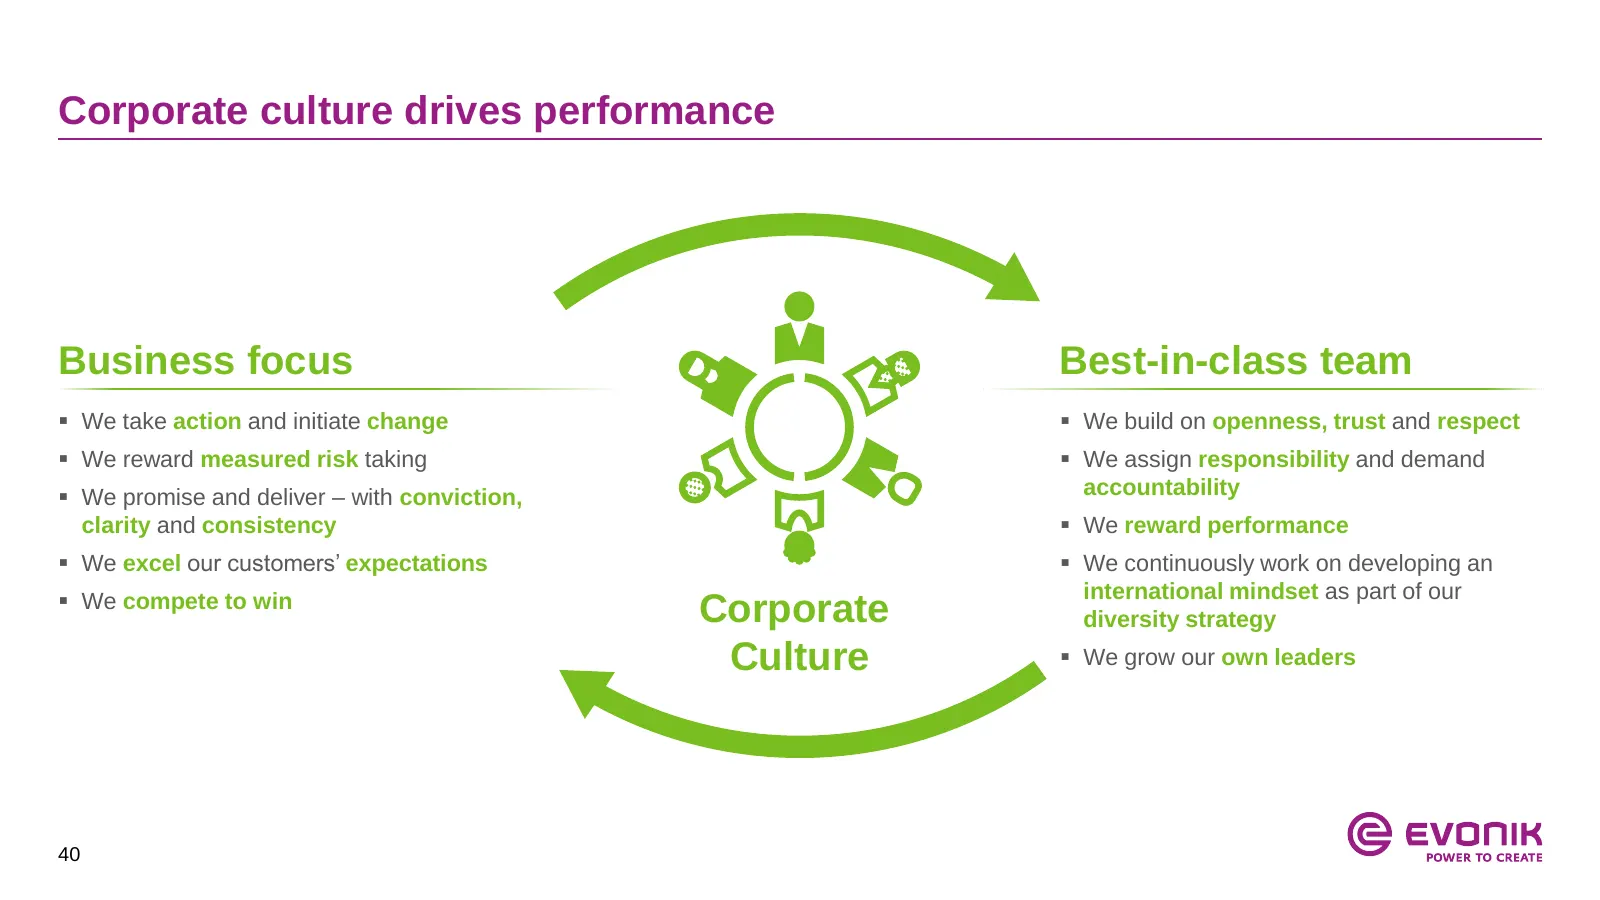
Corporate culture drives performance Business focus Best-in-class team We take action and initiate change We build on openness, trust and respect We reward measured risk taking We assign responsibility and demand We promise and deliver – with conviction, accountability clarity and consiste
Slide 41: Appendix
Appendix 1. Strategy Details 2. Segment overview 3. Financials 4. Upcoming events 41
Slide 42: Evonik Group: 22 Business Lines grouped in 3 segments
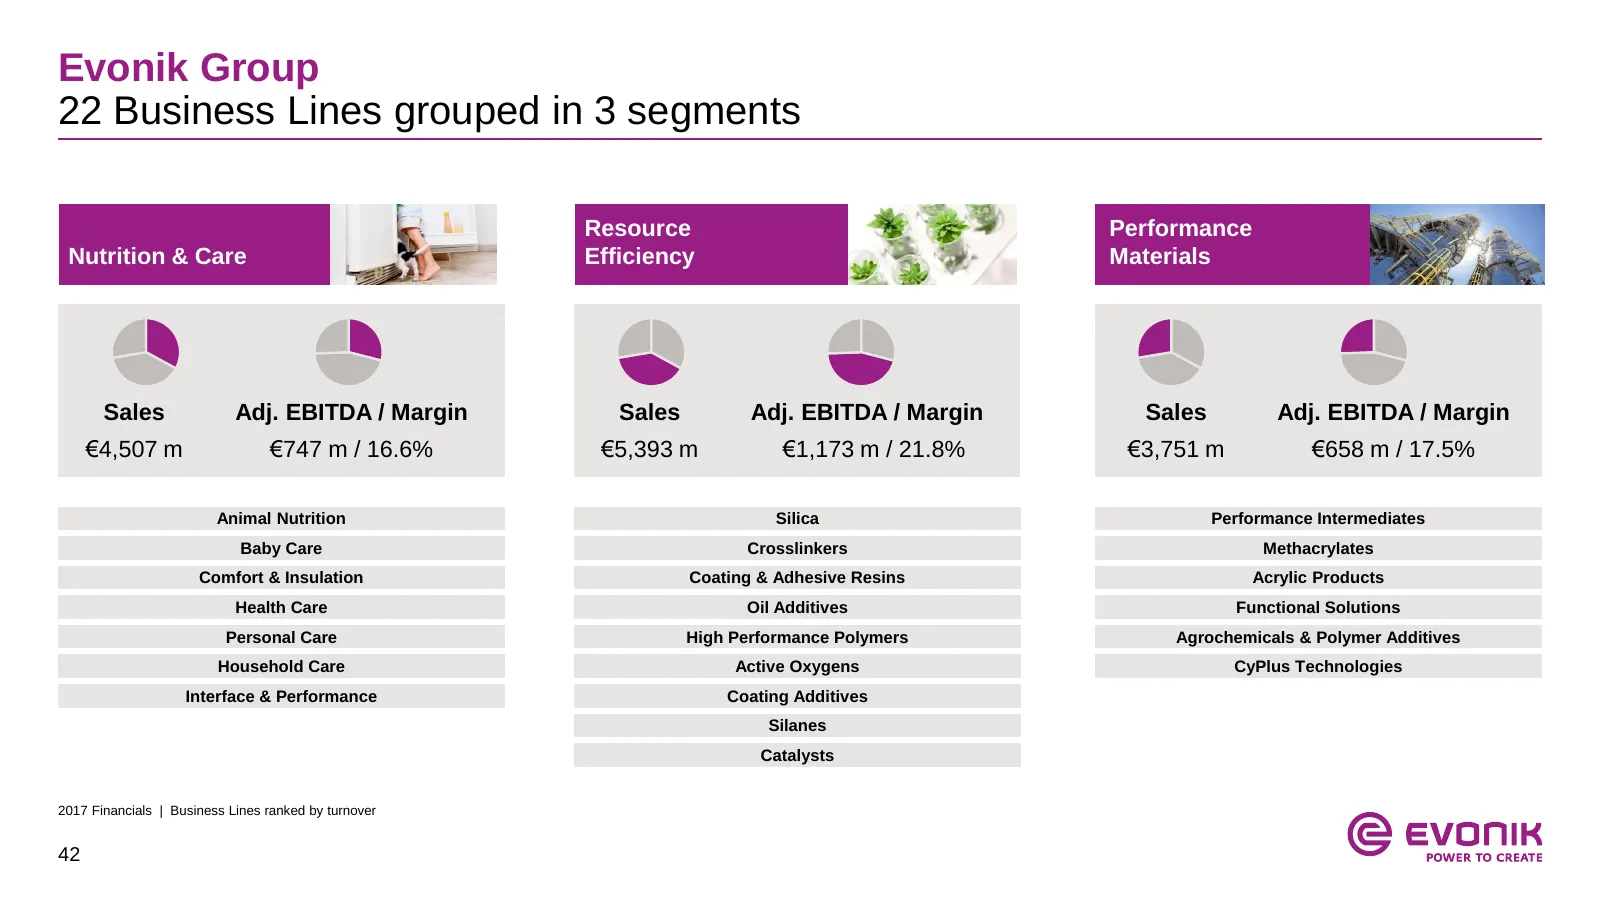
Evonik Group 22 Business Lines grouped in 3 segments Resource Performance Nutrition & Care Efficiency Materials Sales Adj. EBITDA / Margin Sales Adj. EBITDA / Margin Sales Adj. EBITDA / Margin €4,507 m €747 m / 16.6% €5,393 m €1,173 m / 21.8% €3,751 m €658 m / 17.5% Animal Nutrition Silica Performan
Slide 43: Nutrition & Care
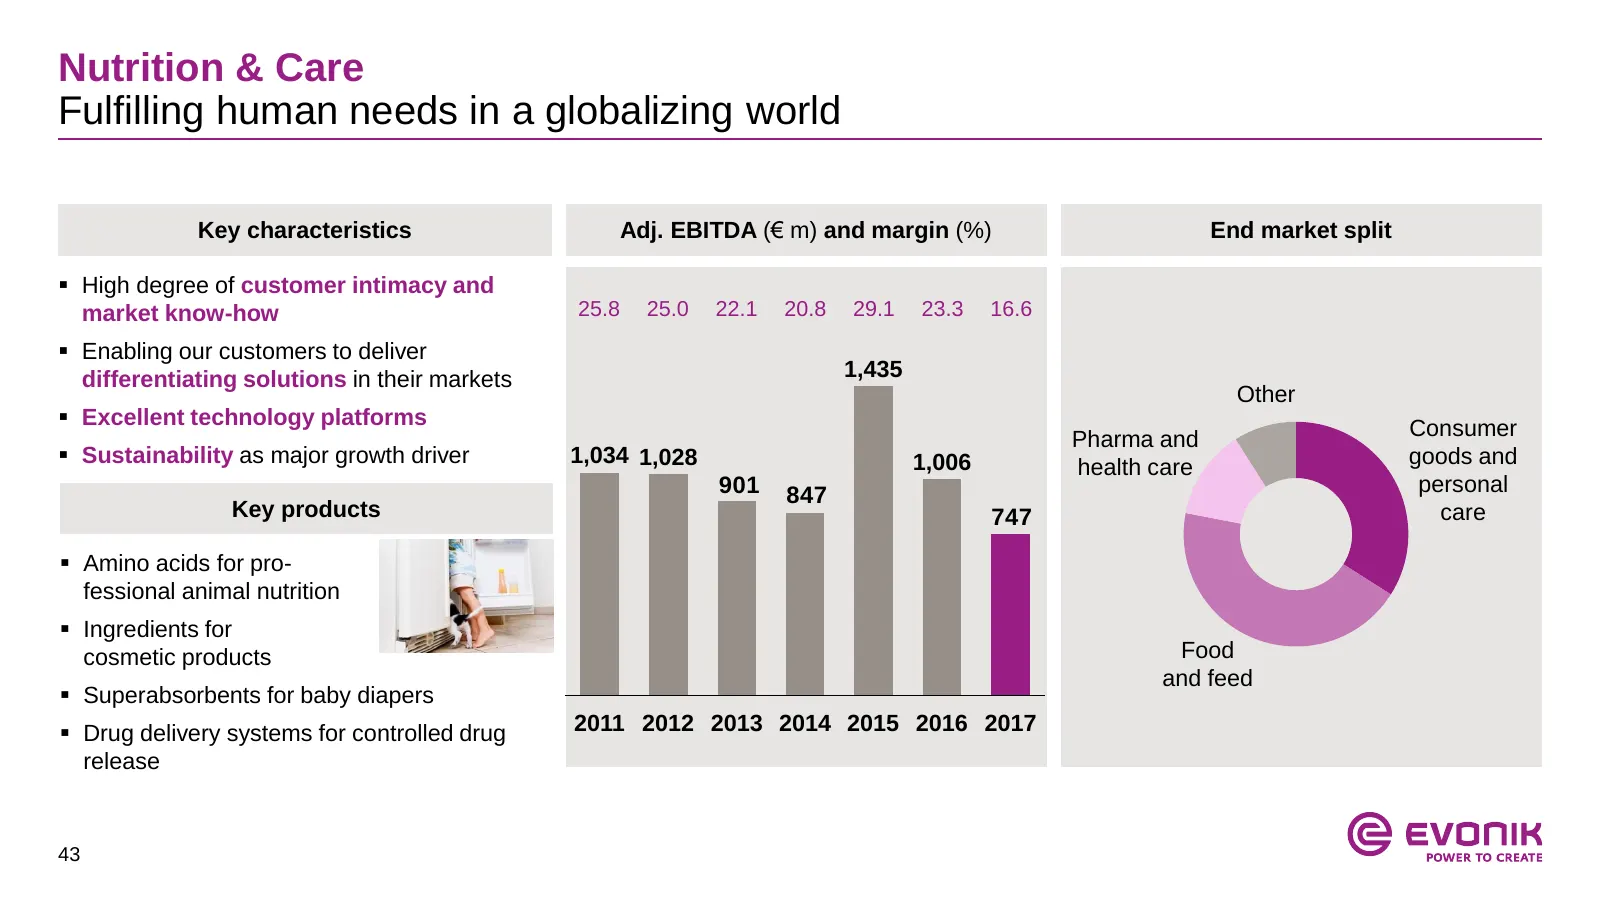
Nutrition & Care Fulfilling human needs in a globalizing world Key characteristics Adj. EBITDA (€ m) and margin (%) End market split High degree of customer intimacy and market know-how 25.8 25.0 22.1 20.8 29.1 23.3 16.6 Enabling our customers to deliver differentiating solutions in their market
Slide 44: Nutrition & Care Business Line overview (1/2)
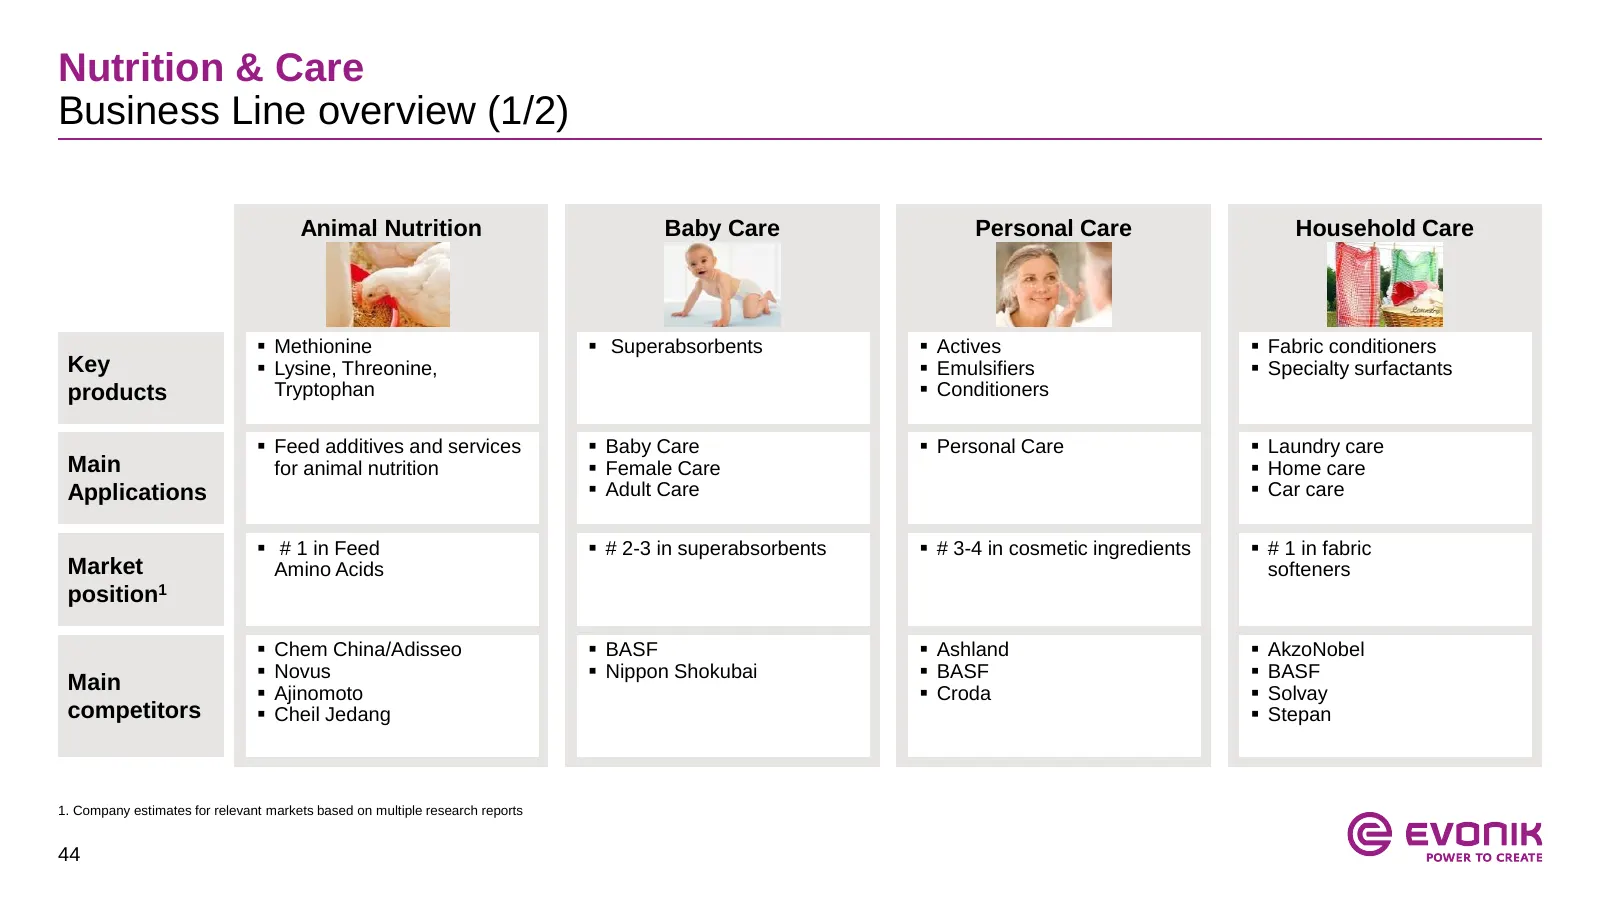
Nutrition & Care Business Line overview (1/2) Animal Nutrition Baby Care Personal Care Household Care Methionine Superabsorbents Actives Fabric conditioners Key Lysine, Threonine, Emulsifiers Specialty surfactants products Tryptophan Conditioners Feed additives and services Baby
Slide 45: Nutrition & Care Business Line overview (2/2)
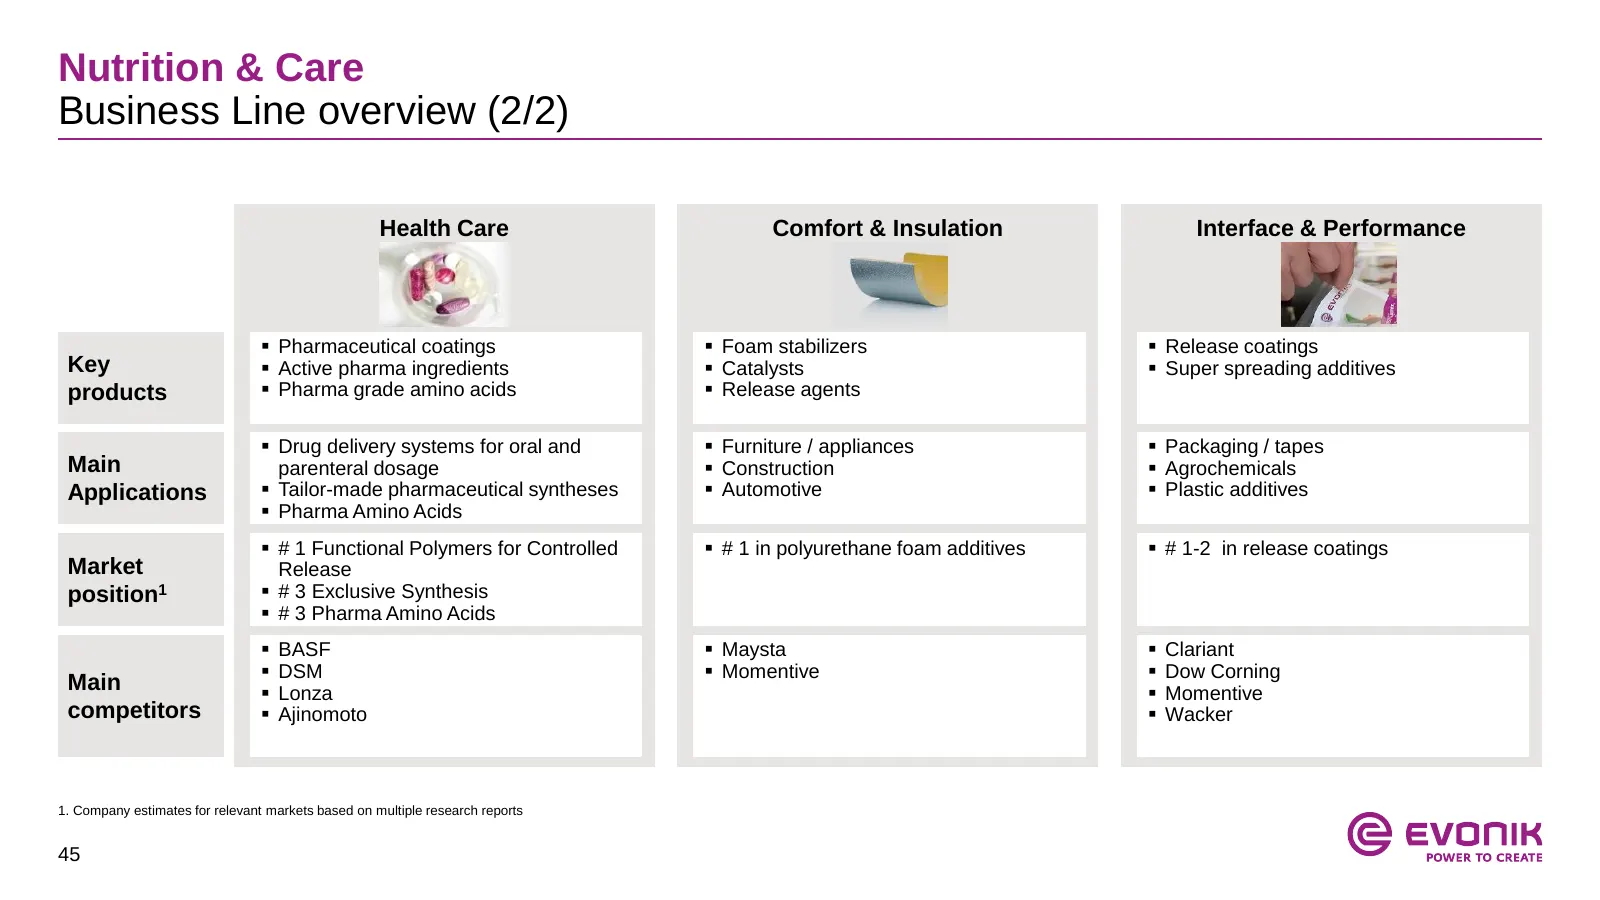
Nutrition & Care Business Line overview (2/2) Health Care Comfort & Insulation Interface & Performance Pharmaceutical coatings Foam stabilizers Release coatings Key Active pharma ingredients Catalysts Super spreading additives products Pharma grade amino acids Release agents Drug d
Slide 46: Portfolio Management – Animal Nutrition
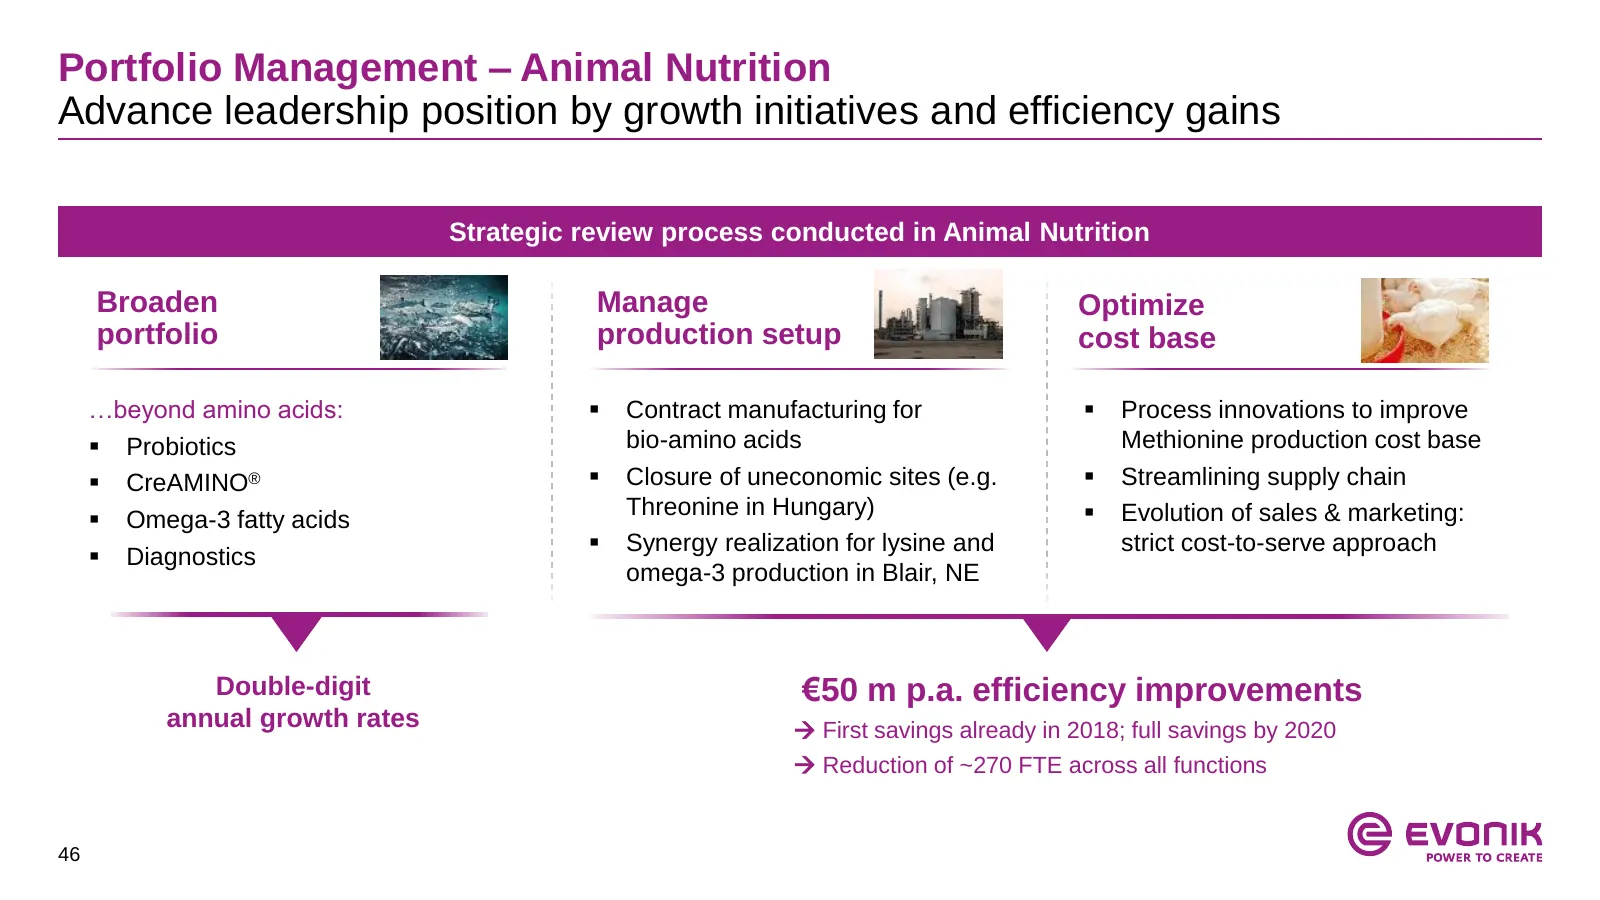
Portfolio Management – Animal Nutrition Advance leadership position by growth initiatives and efficiency gains Strategic review process conducted in Animal Nutrition Broaden Manage Optimize portfolio production setup cost base …beyond amino acids: Contract manufacturing for Process innovations t
Slide 47: Investment in digital skin technology start-up mySkin
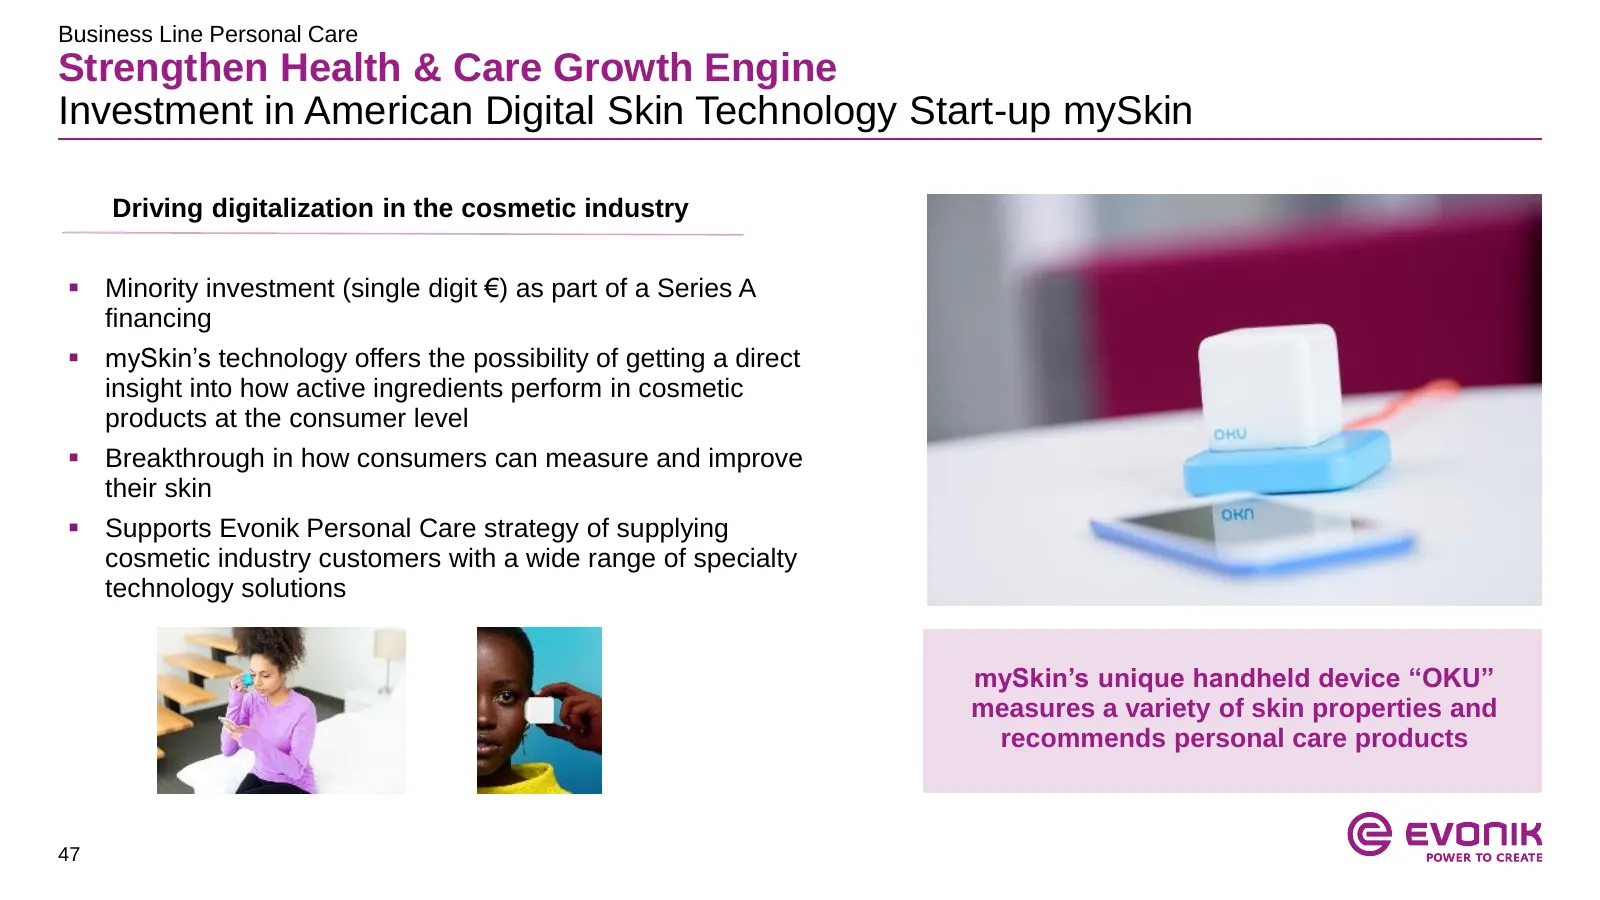
Business Line Personal Care Strengthen Health & Care Growth Engine Investment in American Digital Skin Technology Start-up mySkin Driving digitalization in the cosmetic industry Minority investment (single digit €) as part of a Series A financing mySkin’s technology offers the possibility of get
Slide 48: Health Care Pharma Polymers & Services
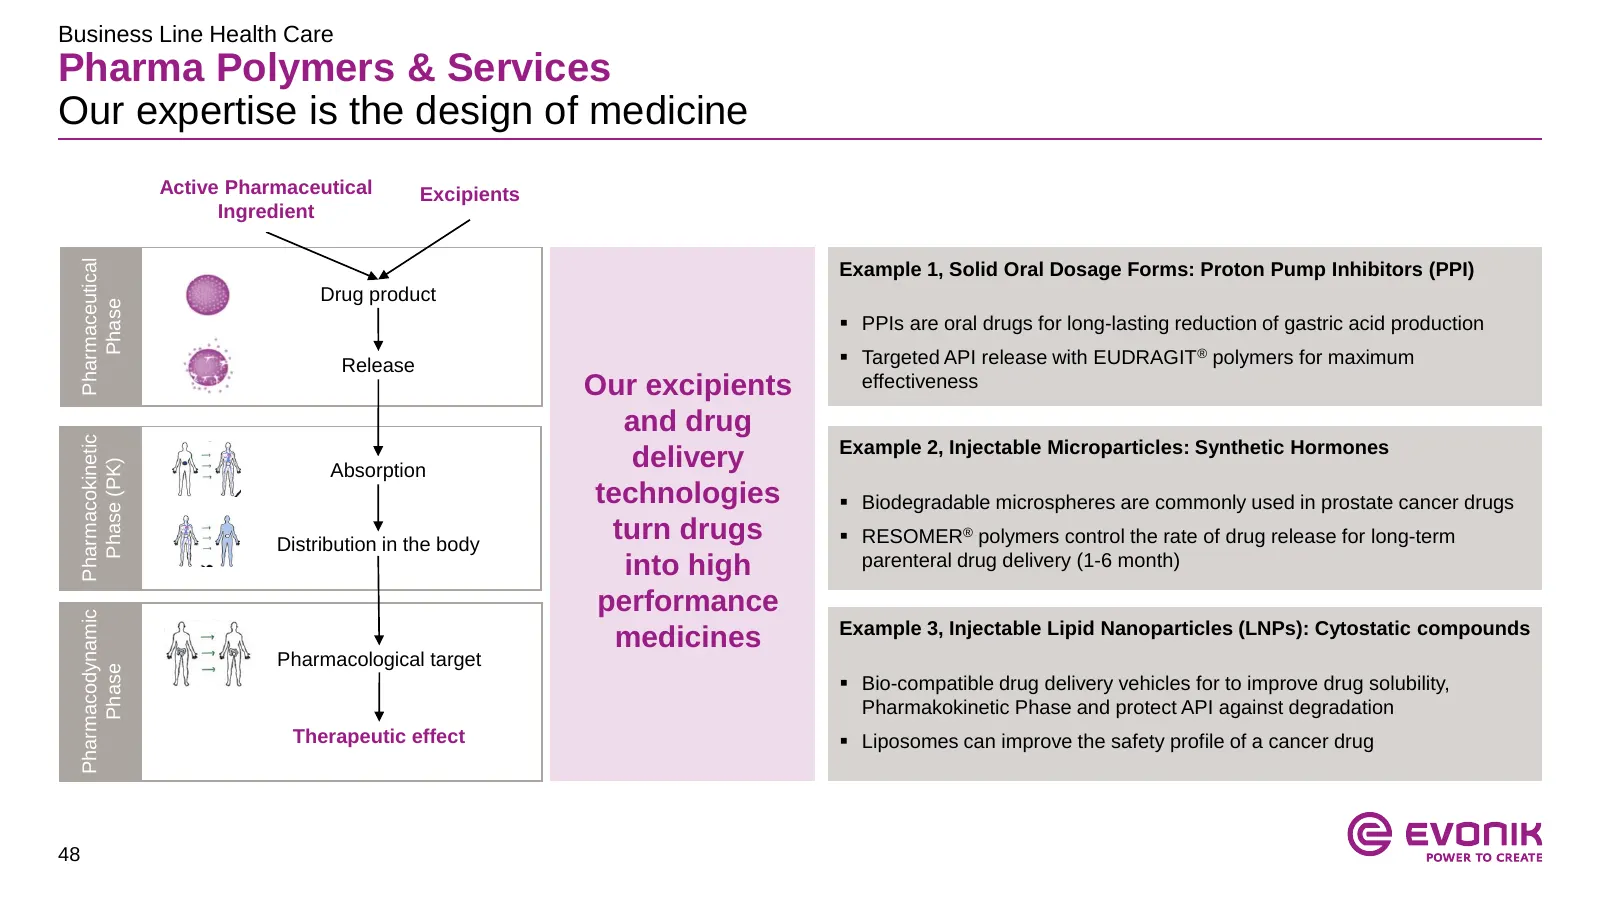
Business Line Health Care Pharma Polymers & Services Our expertise is the design of medicine Active Pharmaceutical Excipients Ingredient Pharmaceutical Example 1, Solid Oral Dosage Forms: Proton Pump Inhibitors (PPI) Drug product Phase PPIs are oral drugs for long-lasting reduction of gastric acid
Slide 49: Resource Efficiency
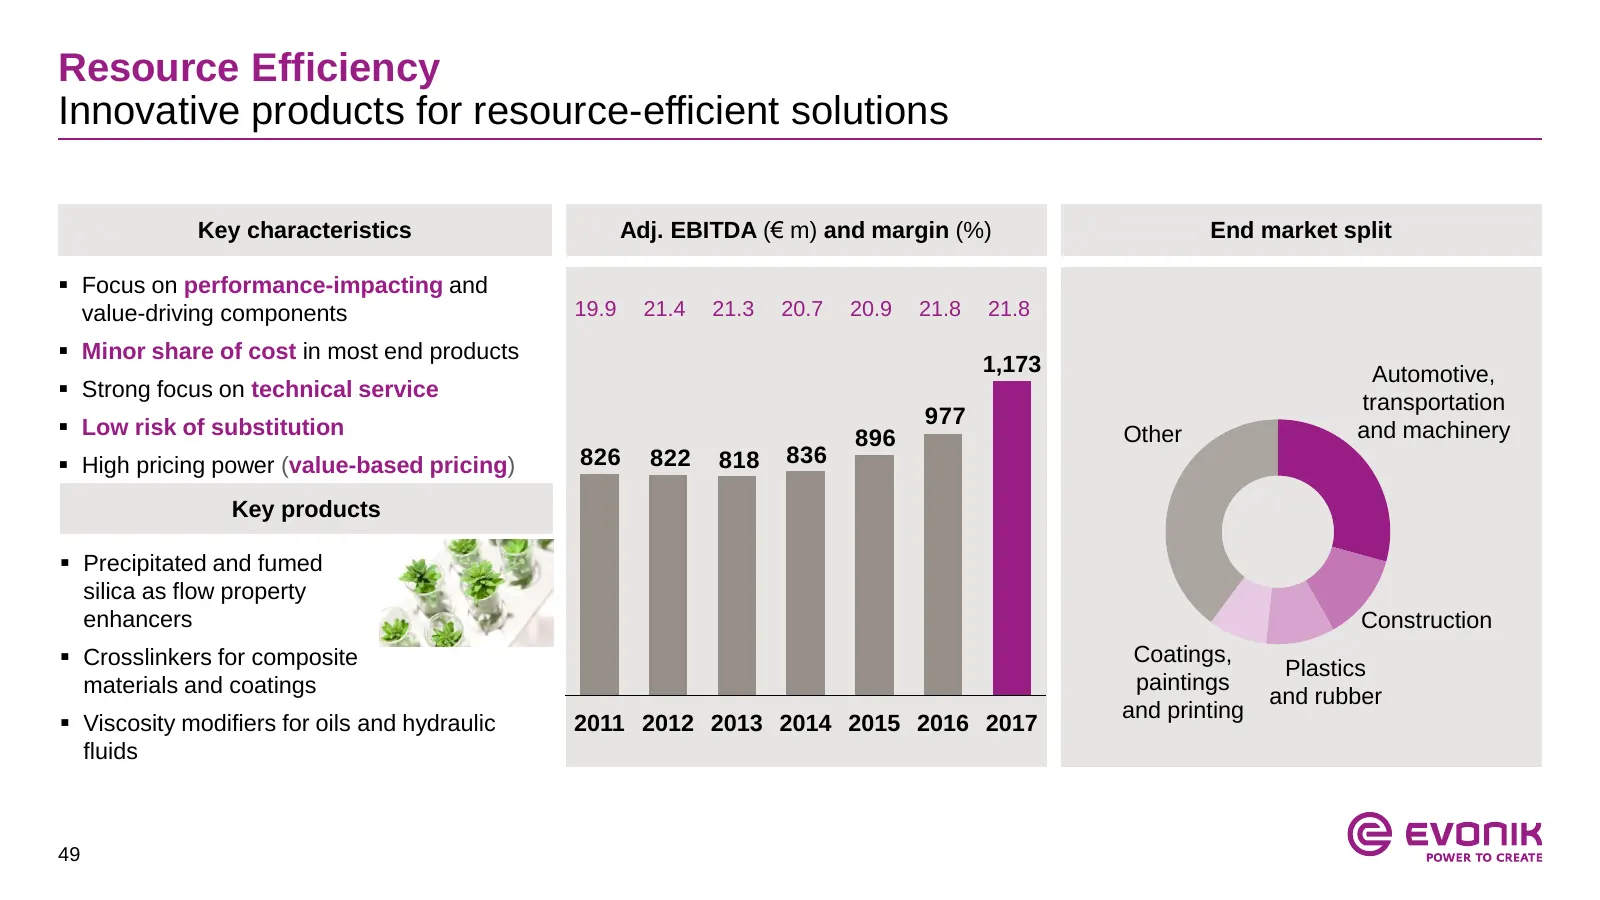
Resource Efficiency Innovative products for resource-efficient solutions Key characteristics Adj. EBITDA (€ m) and margin (%) End market split Focus on performance-impacting and value-driving components 19.9 21.4 21.3 20.7 20.9 21.8 21.8 Minor share of cost in most end products 1,173 Automotive,
Slide 50: Resource Efficiency Business Line overview (1/3)
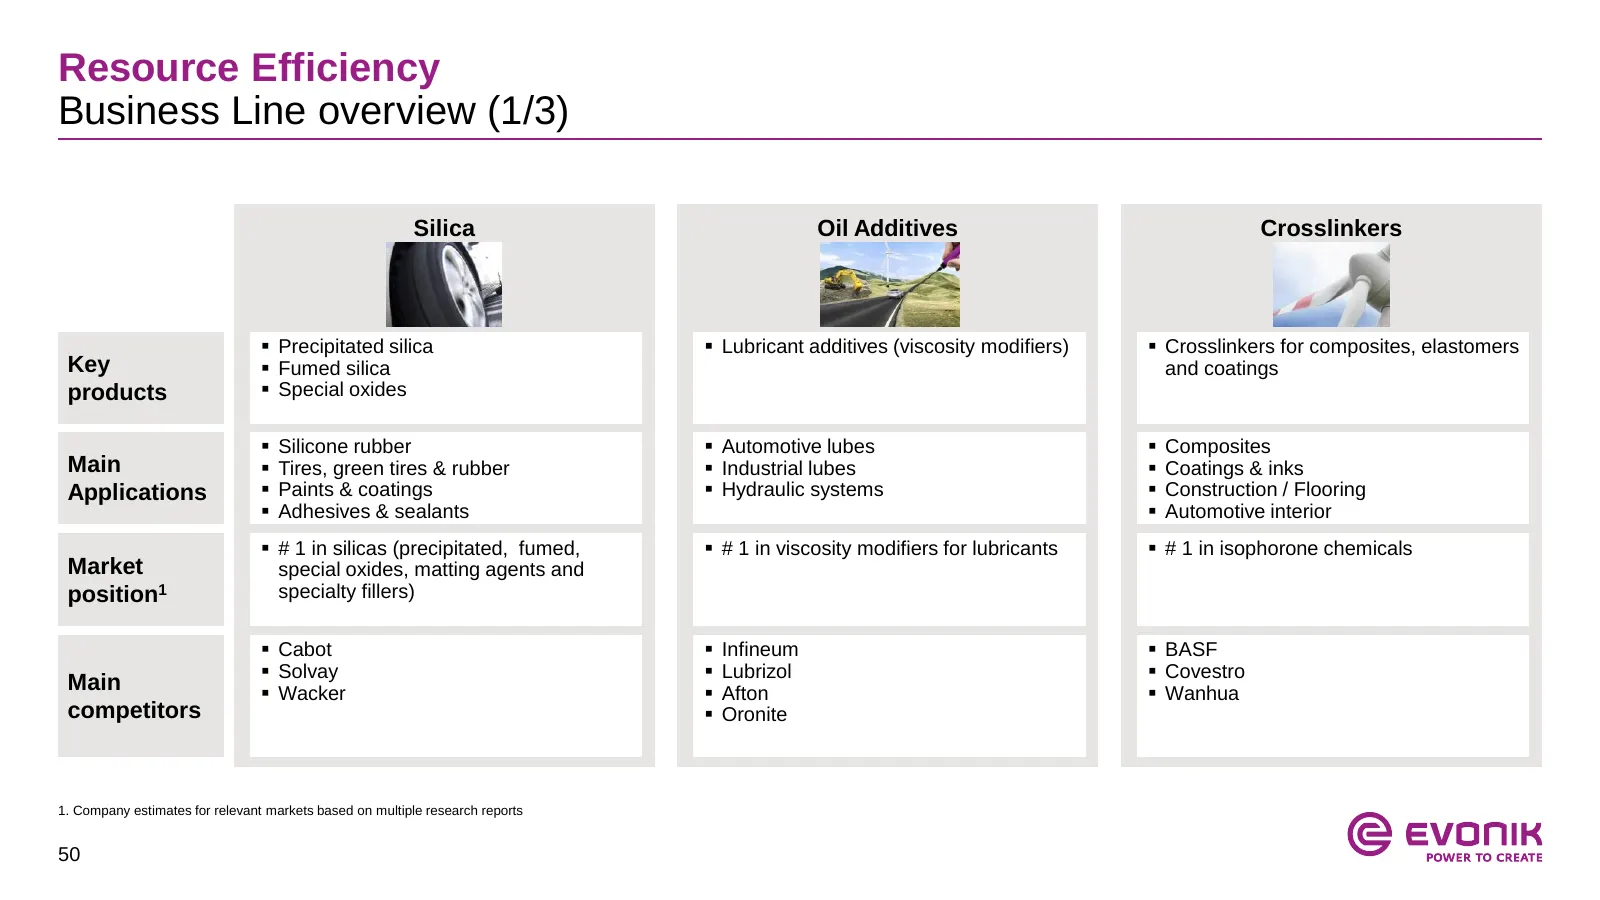
Resource Efficiency Business Line overview (1/3) Silica Oil Additives Crosslinkers Precipitated silica Lubricant additives (viscosity modifiers) Crosslinkers for composites, elastomers Key Fumed silica and coatings products Special oxides Silicone rubber Automotive lubes Composites M
Slide 51: Resource Efficiency Business Line overview (2/3)
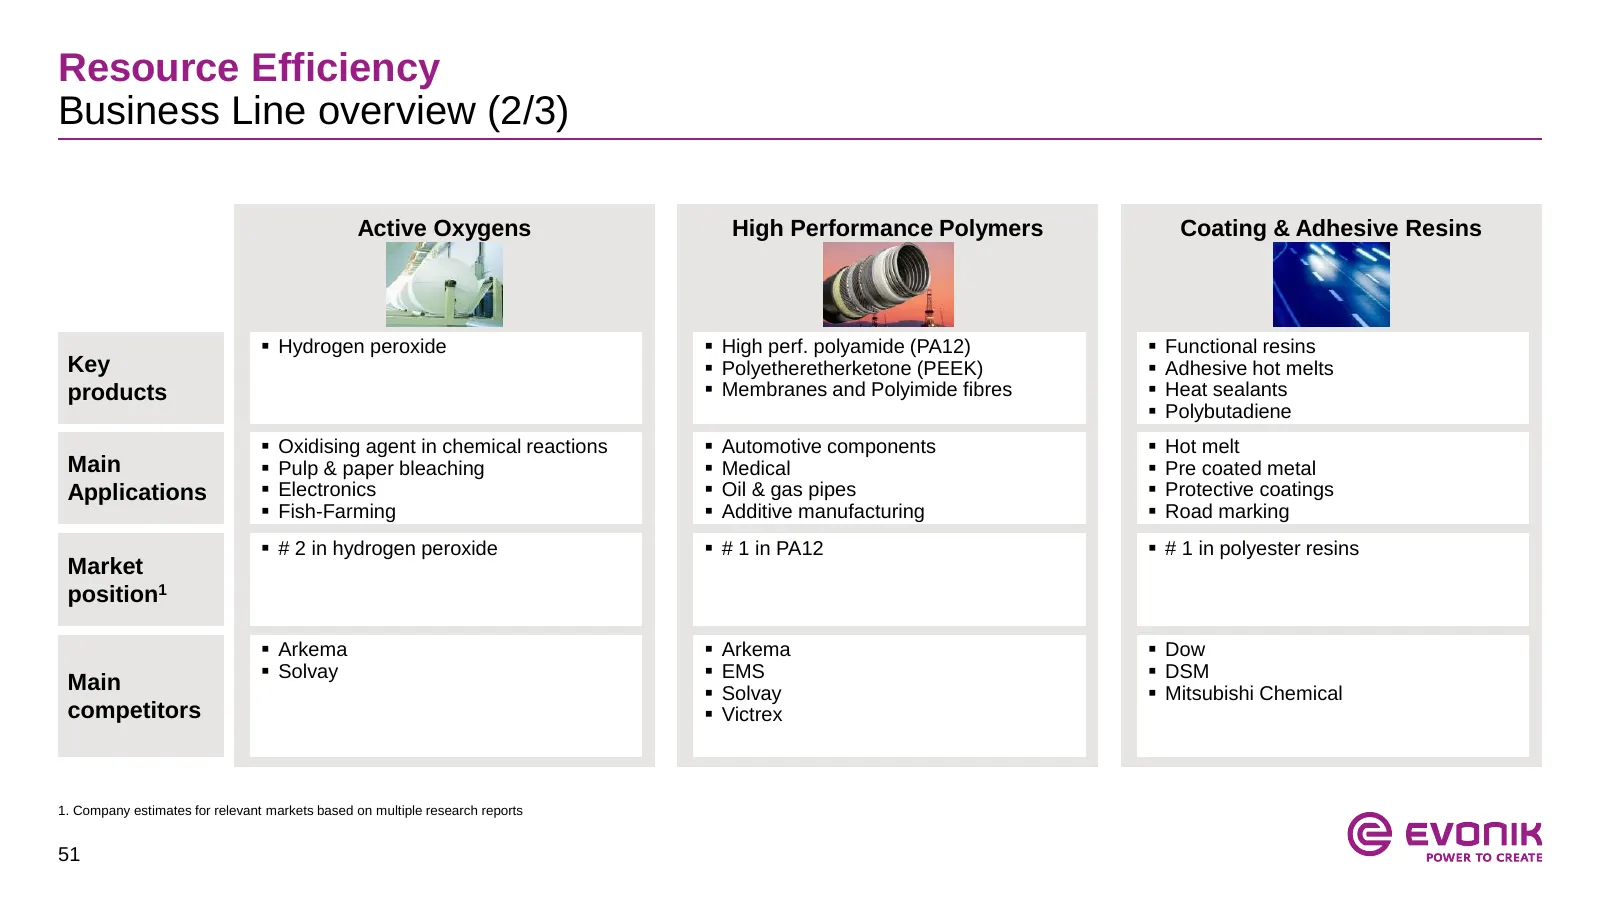
Resource Efficiency Business Line overview (2/3) Active Oxygens High Performance Polymers Coating & Adhesive Resins Hydrogen peroxide High perf. polyamide (PA12) Functional resins Key Polyetheretherketone (PEEK) Adhesive hot melts products Membranes and Polyimide fibres Heat sealants
Slide 52: Resource Efficiency Business Line overview (3/3)
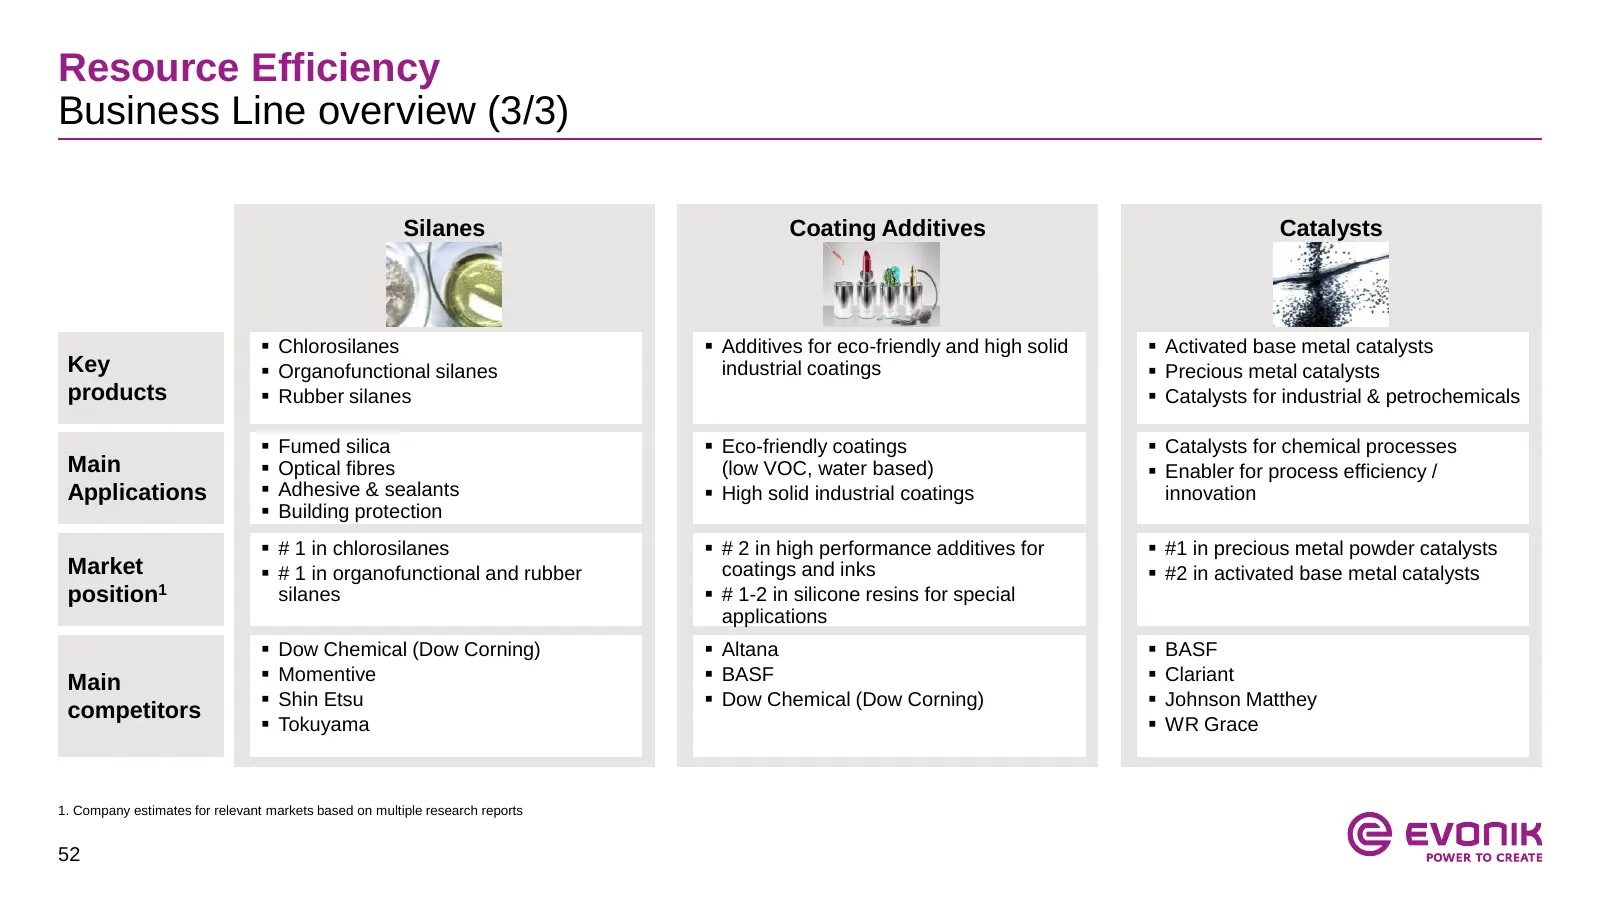
Resource Efficiency Business Line overview (3/3) Silanes Coating Additives Catalysts Chlorosilanes Additives for eco-friendly and high solid Activated base metal catalysts Key Organofunctional silanes industrial coatings Precious metal catalysts products Rubber silanes Catalysts for in
Slide 53: Extending Smart Materials growth engine
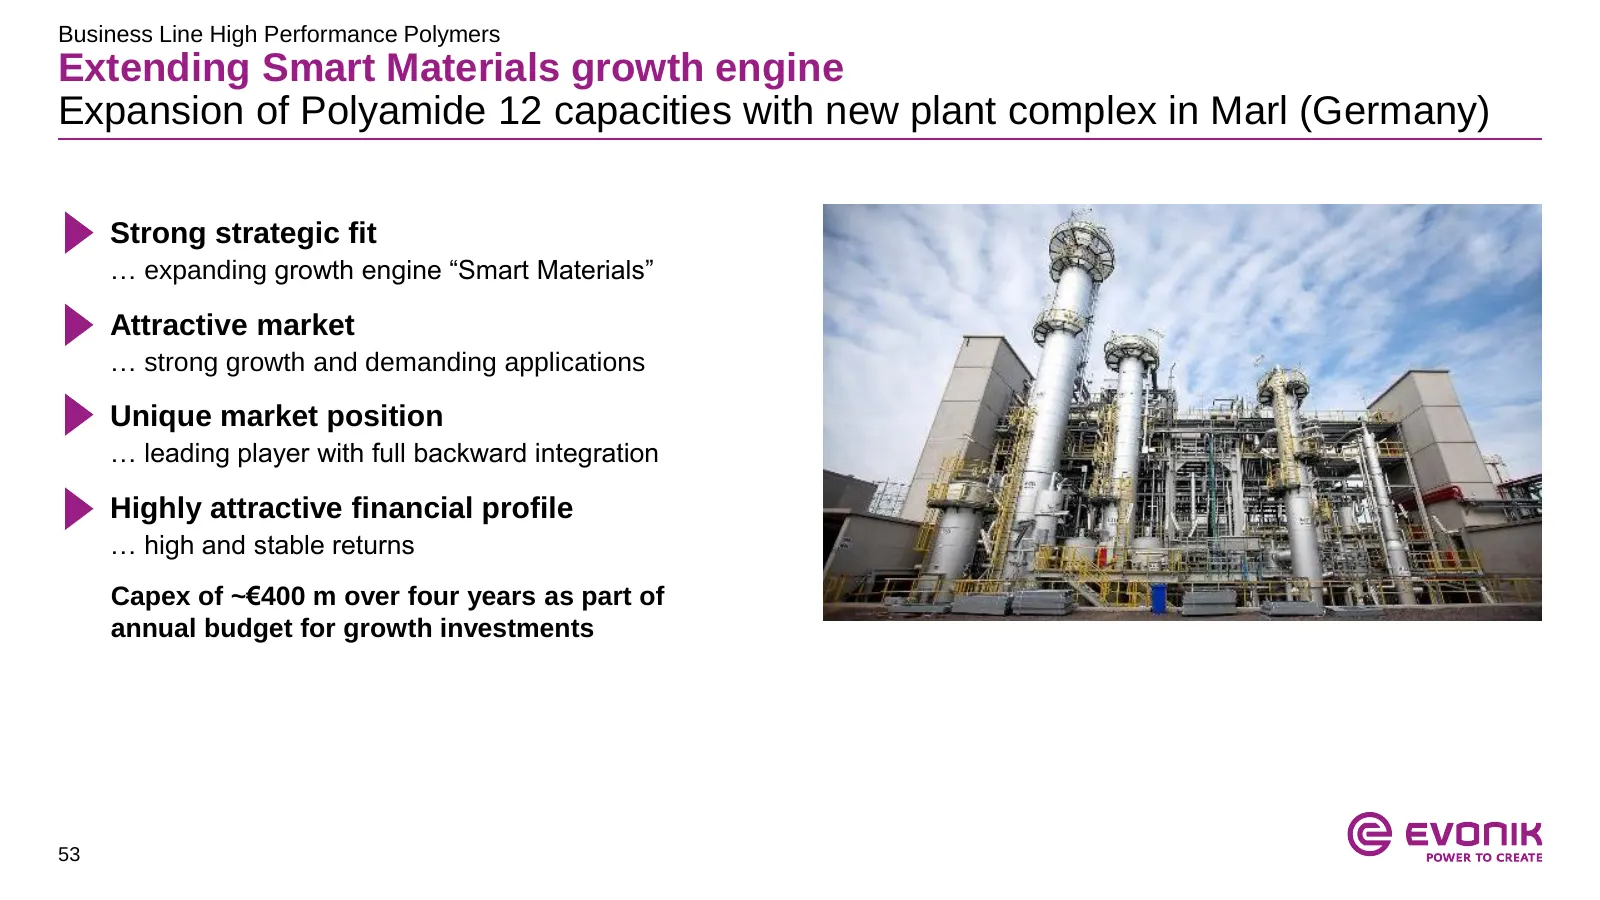
Business Line High Performance Polymers Extending Smart Materials growth engine Expansion of Polyamide 12 capacities with new plant complex in Marl (Germany) Strong strategic fit … expanding growth engine “Smart Materials” Attractive market … strong growth and demanding applications Unique mar
Slide 54: PA12 key market examples – Automotive and e-mobility
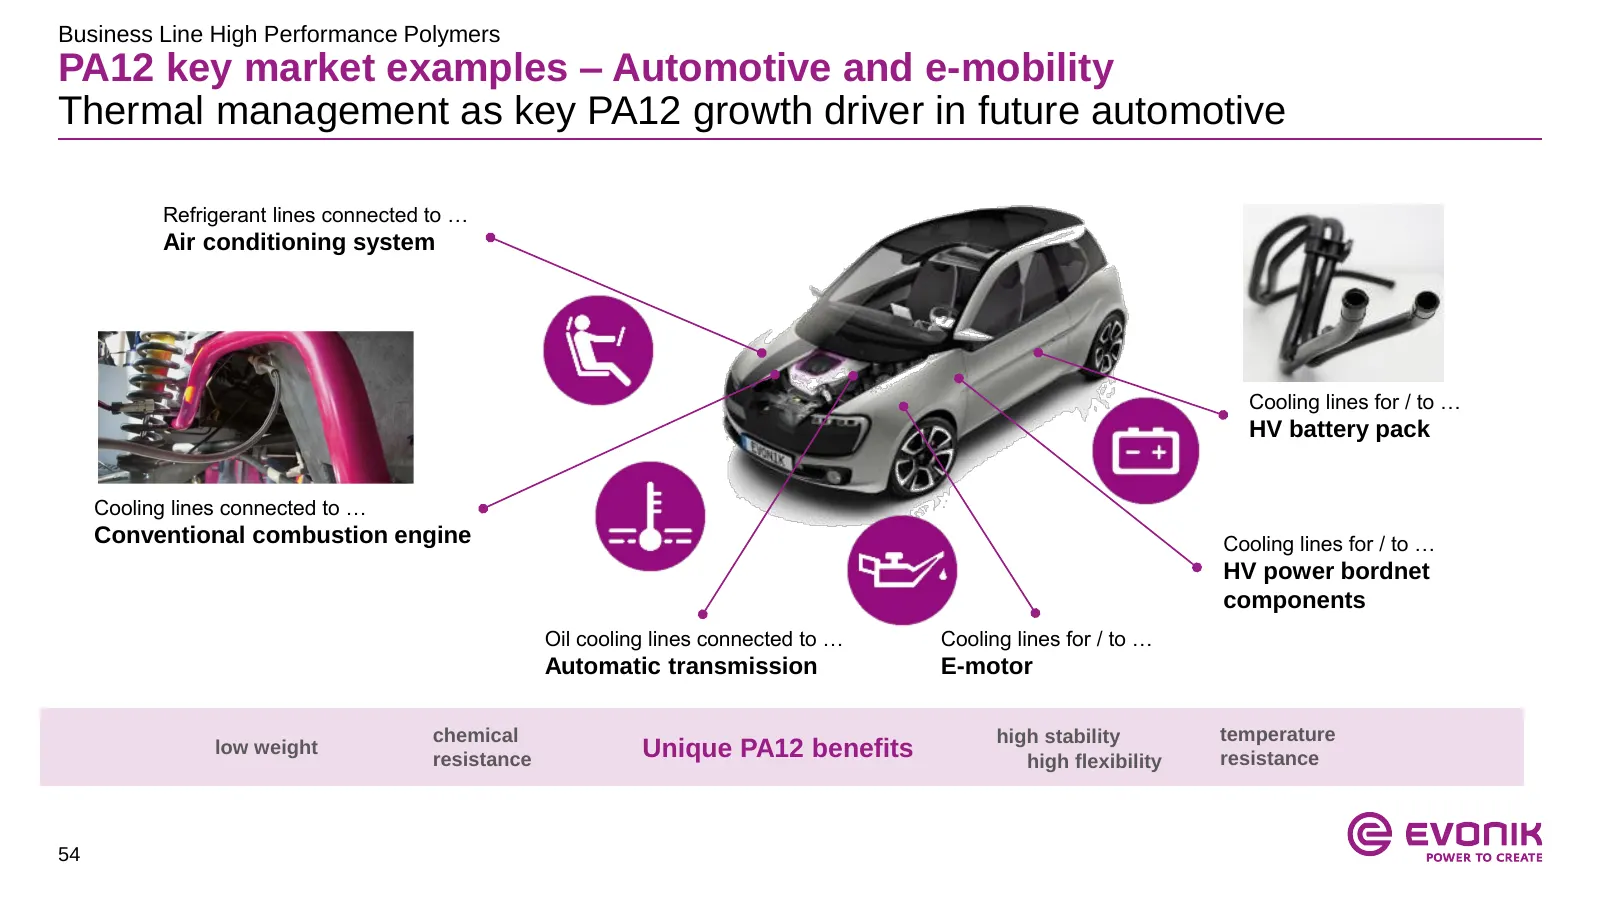
Business Line High Performance Polymers PA12 key market examples – Automotive and e-mobility Thermal management as key PA12 growth driver in future automotive Refrigerant lines connected to … Air conditioning system Cooling lines for / to … HV battery pack Cooling lines connected to … Conventional c
Slide 55: PA12 key market examples – 3D Printing
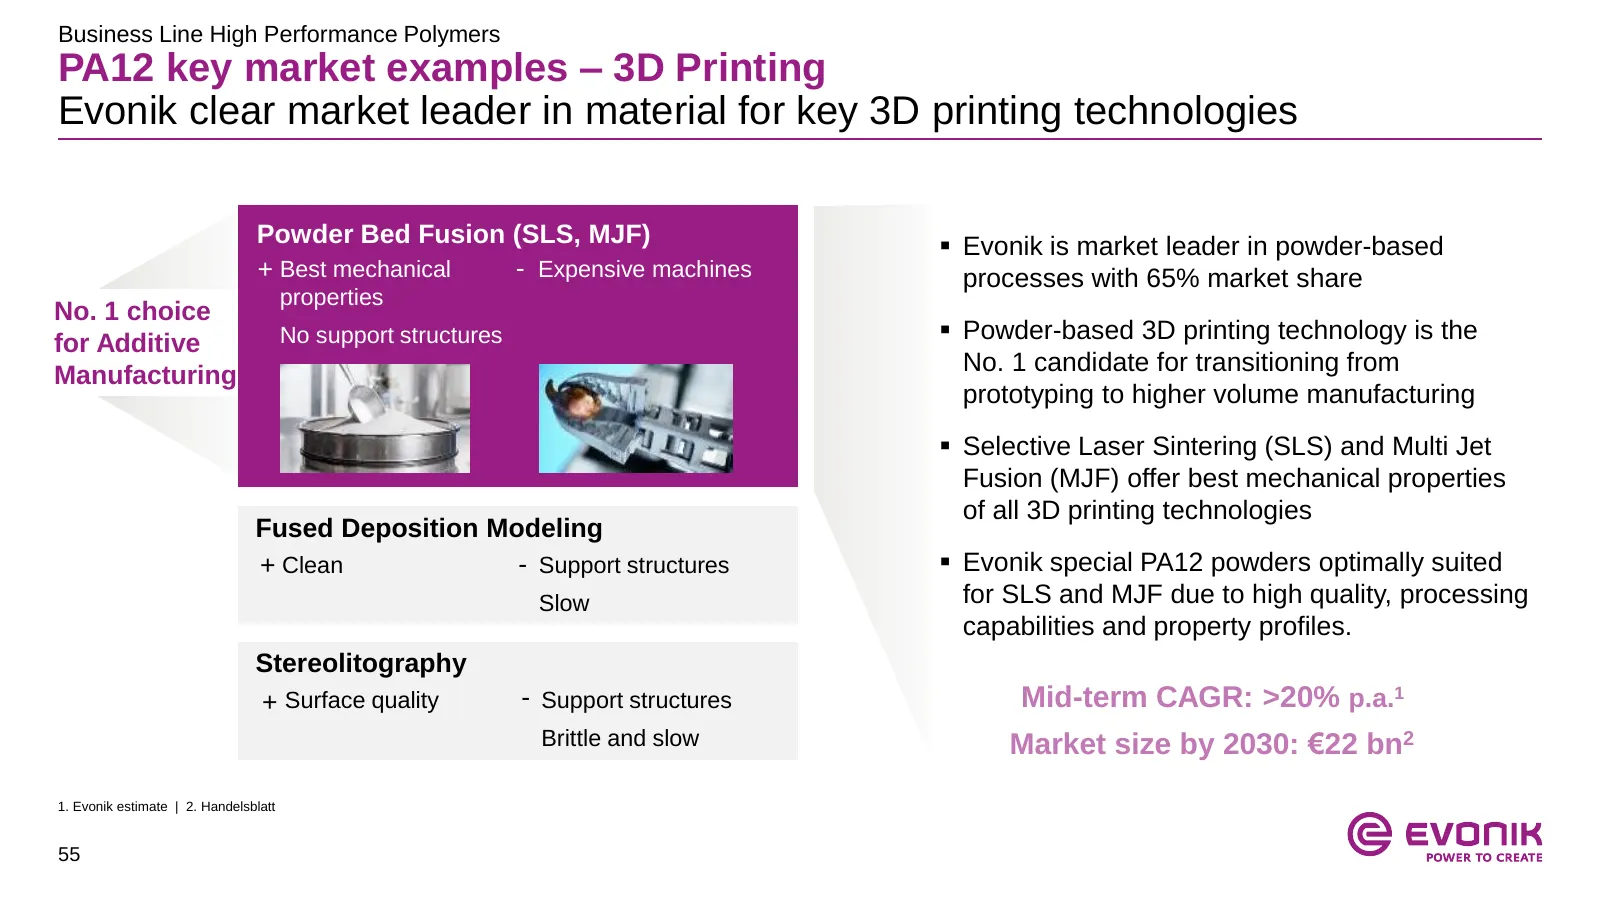
Business Line High Performance Polymers PA12 key market examples – 3D Printing Evonik clear market leader in material for key 3D printing technologies Powder Bed Fusion (SLS, MJF) Evonik is market leader in powder-based + Best mechanical - Expensive machines processes with 65% market share propert
Slide 56: Strengthening Green Tire Product Portfolio
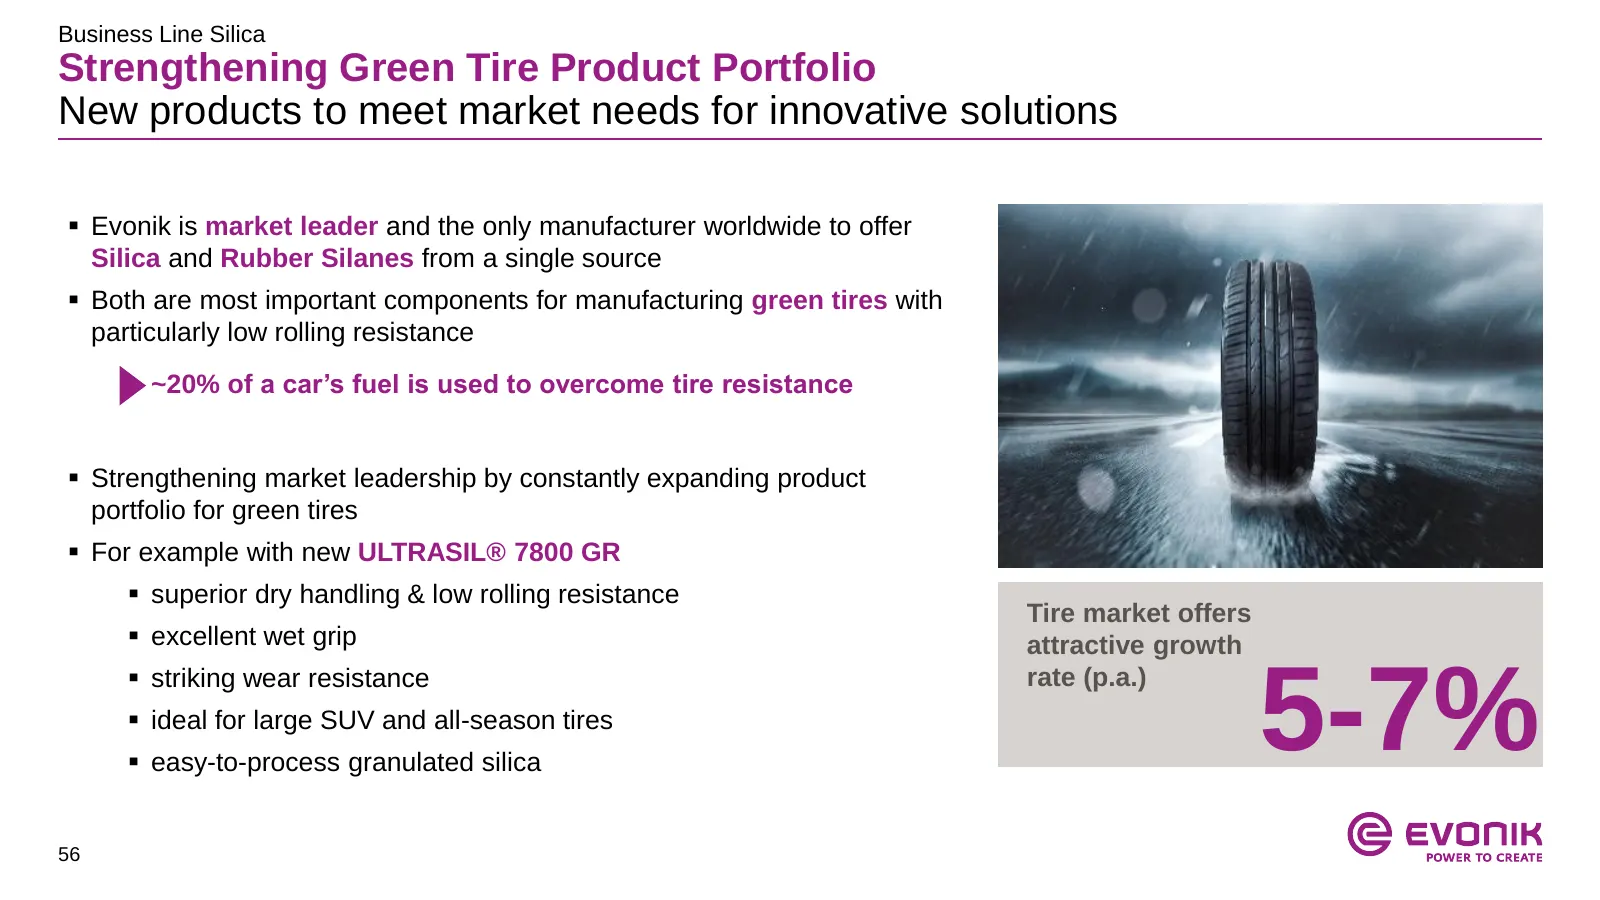
Business Line Silica Strengthening Green Tire Product Portfolio New products to meet market needs for innovative solutions Evonik is market leader and the only manufacturer worldwide to offer Silica and Rubber Silanes from a single source Both are most important components for manufacturing gree
Slide 57: Performance Materials
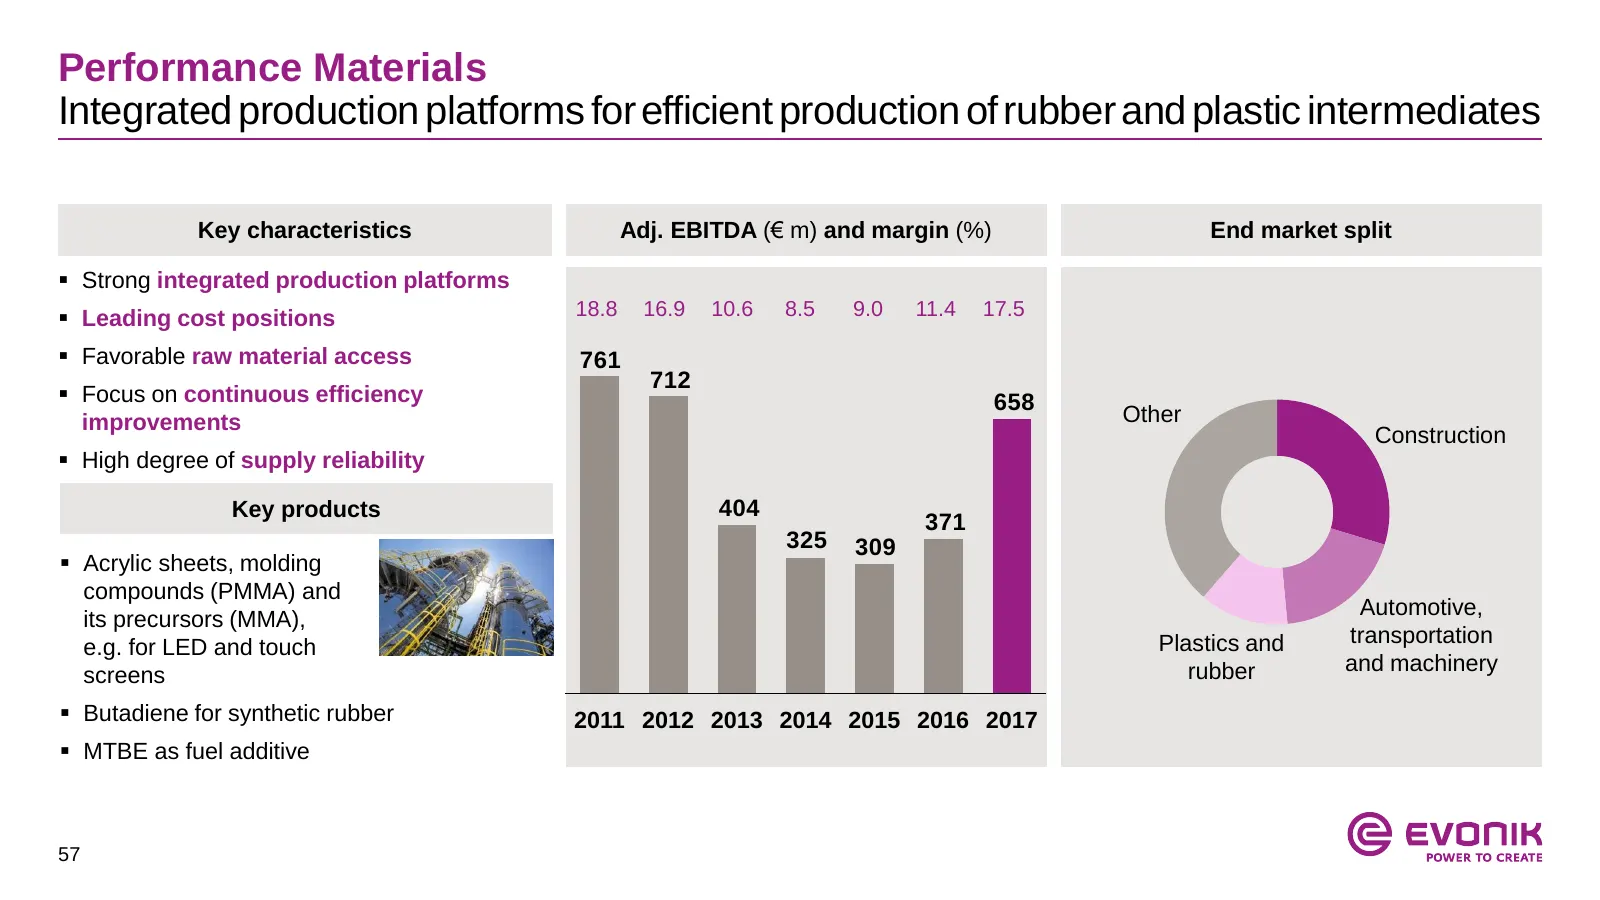
Performance Materials Integrated production platforms for efficient production of rubber and plastic intermediates Key characteristics Adj. EBITDA (€ m) and margin (%) End market split Strong integrated production platforms Leading cost positions 18.8 16.9 10.6 8.5 9.0 11.4 17.5 Favorable raw
Slide 58: Performance Materials Business Line overview (1/2)
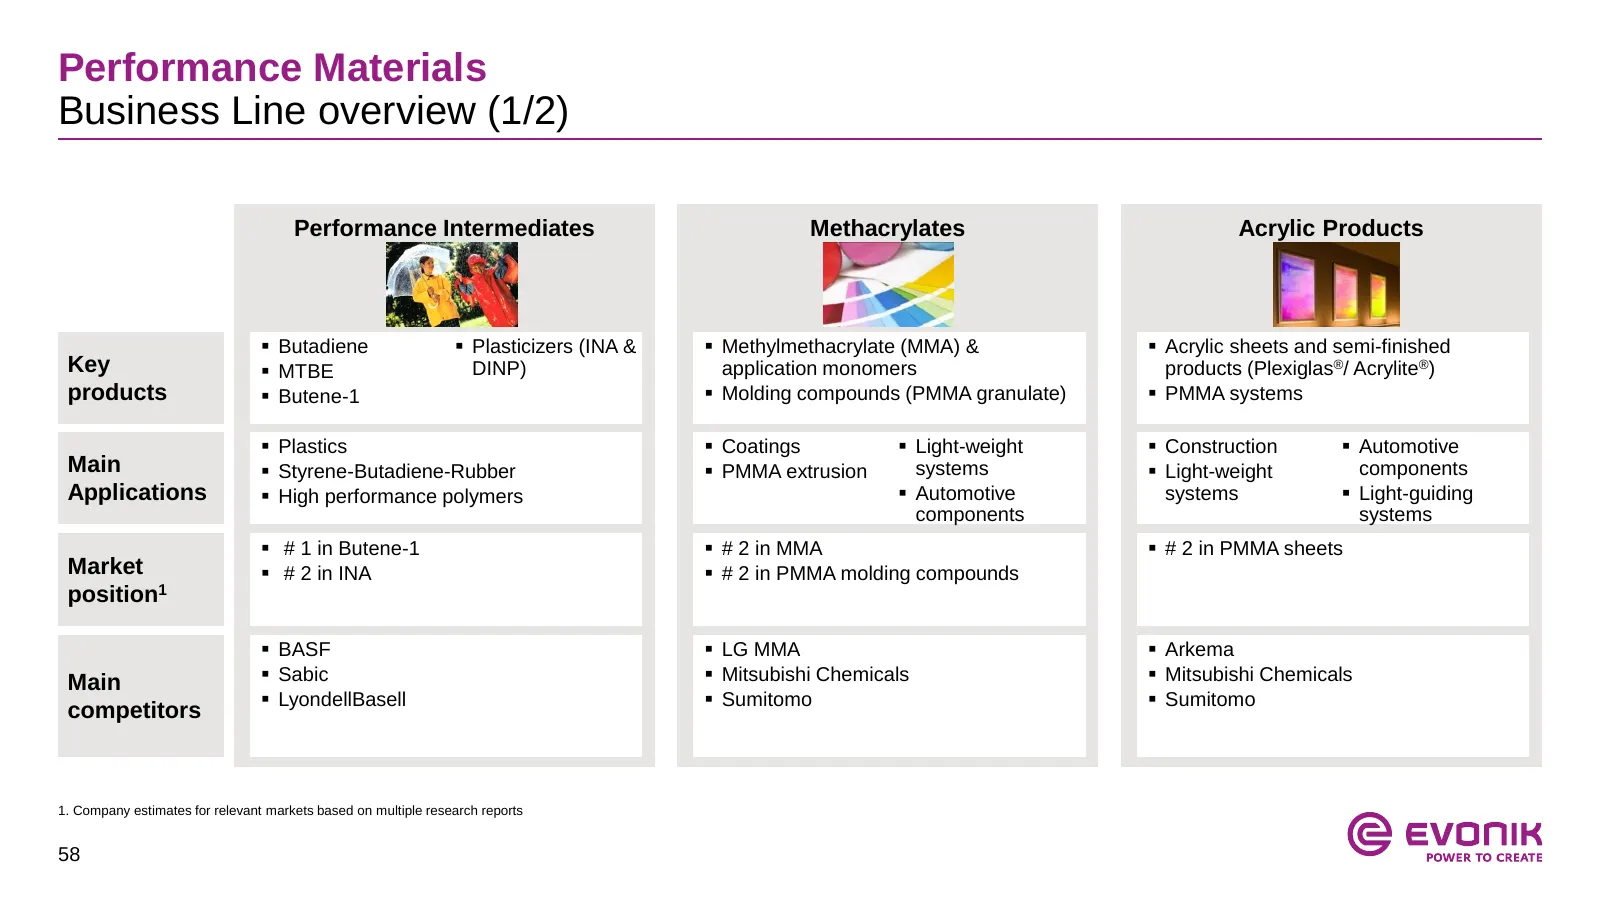
Performance Materials Business Line overview (1/2) Performance Intermediates Methacrylates Acrylic Products Butadiene Plasticizers (INA & Methylmethacrylate (MMA) & Acrylic sheets and semi-finished Key MTBE DINP) application monomers products (Plexiglas®/ Acrylite®) products Butene-1 M
Slide 59: Performance Materials Business Line overview (2/2)
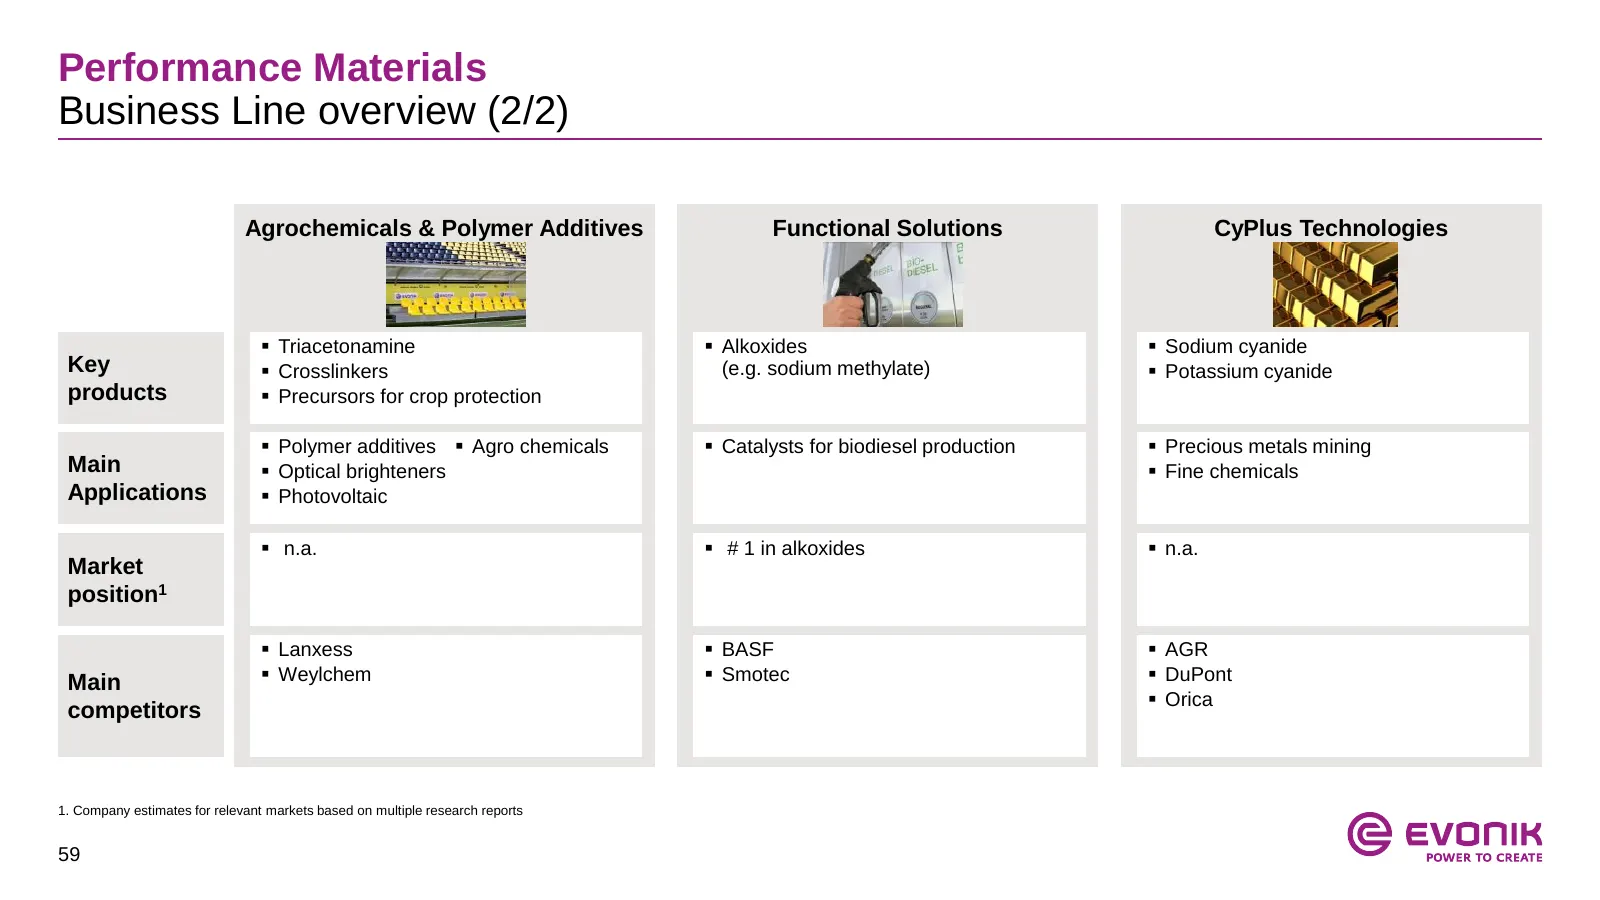
Performance Materials Business Line overview (2/2) Agrochemicals & Polymer Additives Functional Solutions CyPlus Technologies Triacetonamine Alkoxides Sodium cyanide Key Crosslinkers (e.g. sodium methylate) Potassium cyanide products Precursors for crop protection Polymer additives A
Slide 60: Portfolio Management – Methacrylates
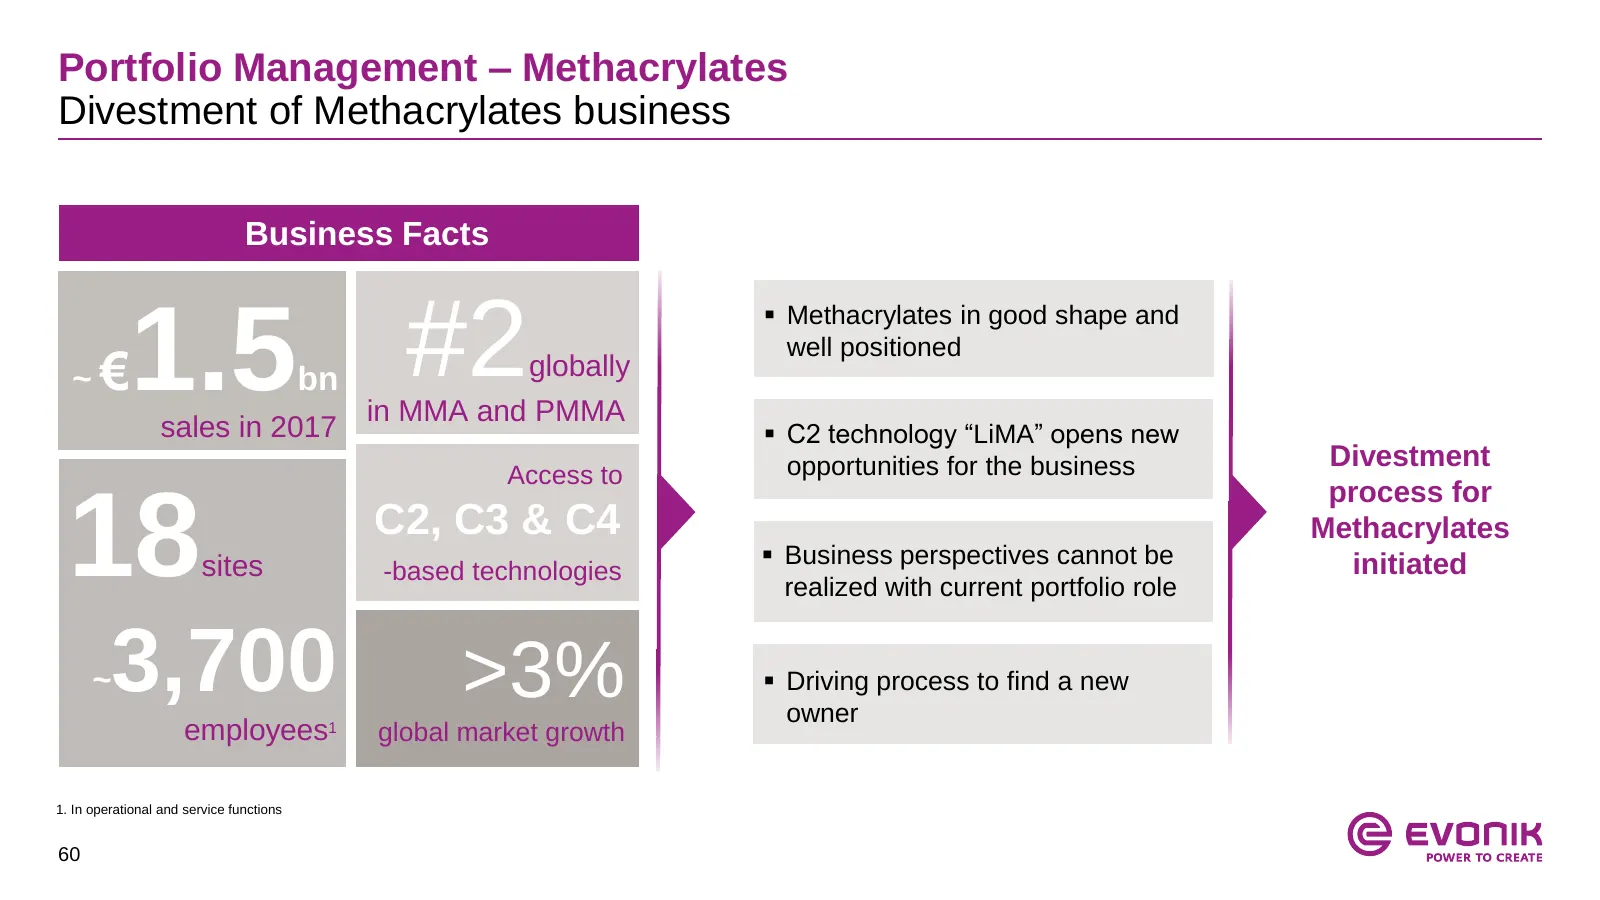
Portfolio Management – Methacrylates Divestment of Methacrylates business Business Facts 1.5 #2 Methacrylates in good shape and well positioned ~€ bn globally in MMA and PMMA sales in 2017 C2 technology “LiMA” opens new opportunities for the business Divestment Access to process for 18 sites C2,
Slide 61: Evonik's new C2 technology LiMA
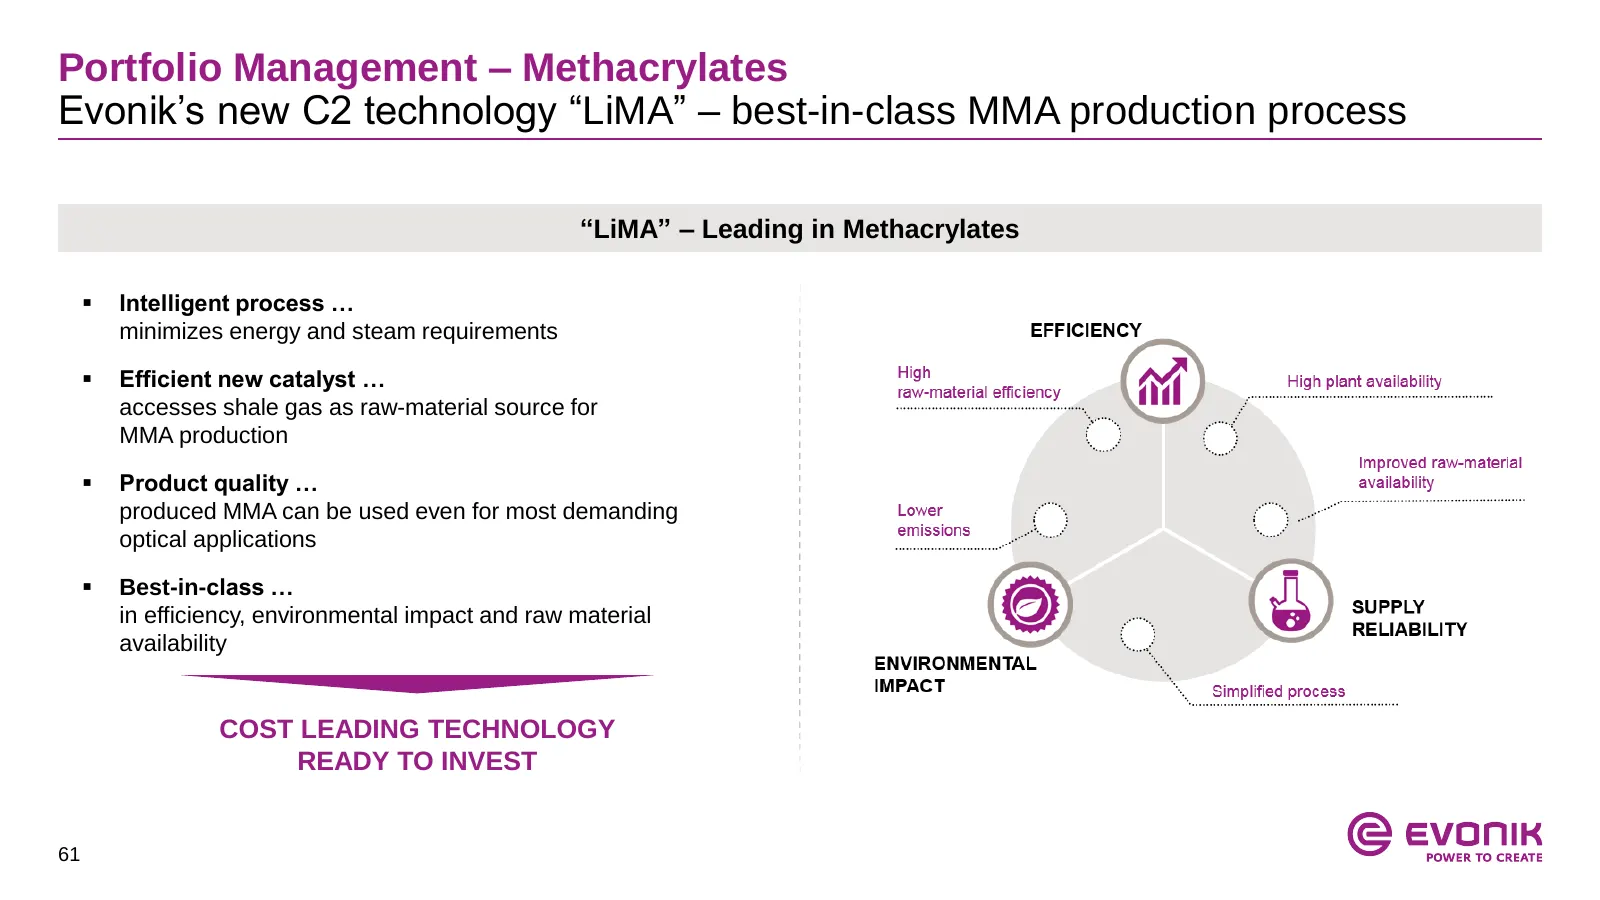
Portfolio Management – Methacrylates Evonik’s new C2 technology “LiMA” – best-in-class MMA production process “LiMA” – Leading in Methacrylates Intelligent process … minimizes energy and steam requirements Efficient new catalyst … accesses shale gas as raw-material source for MMA production Pr
Slide 62: Performance Materials increases productivity
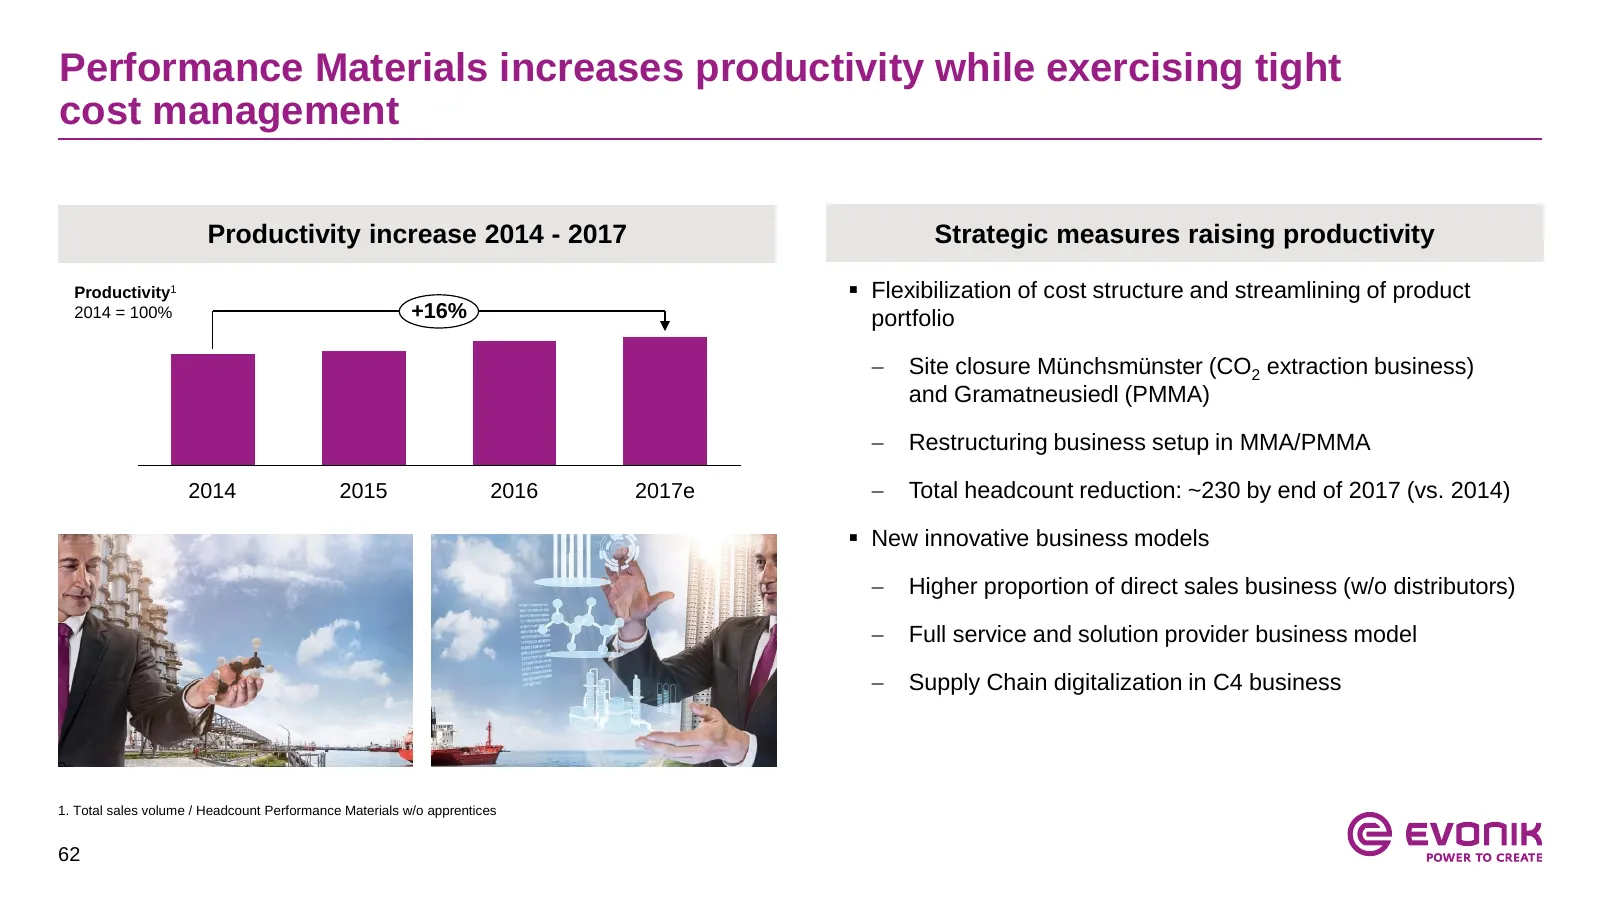
Performance Materials increases productivity while exercising tight cost management Productivity increase 2014 - 2017 Strategic measures raising productivity Productivity1 Flexibilization of cost structure and streamlining of product 2014 = 100% +16% portfolio Site closure Münchsmünster (CO2 ext
Slide 63: Performance Intermediates (C4 chain)
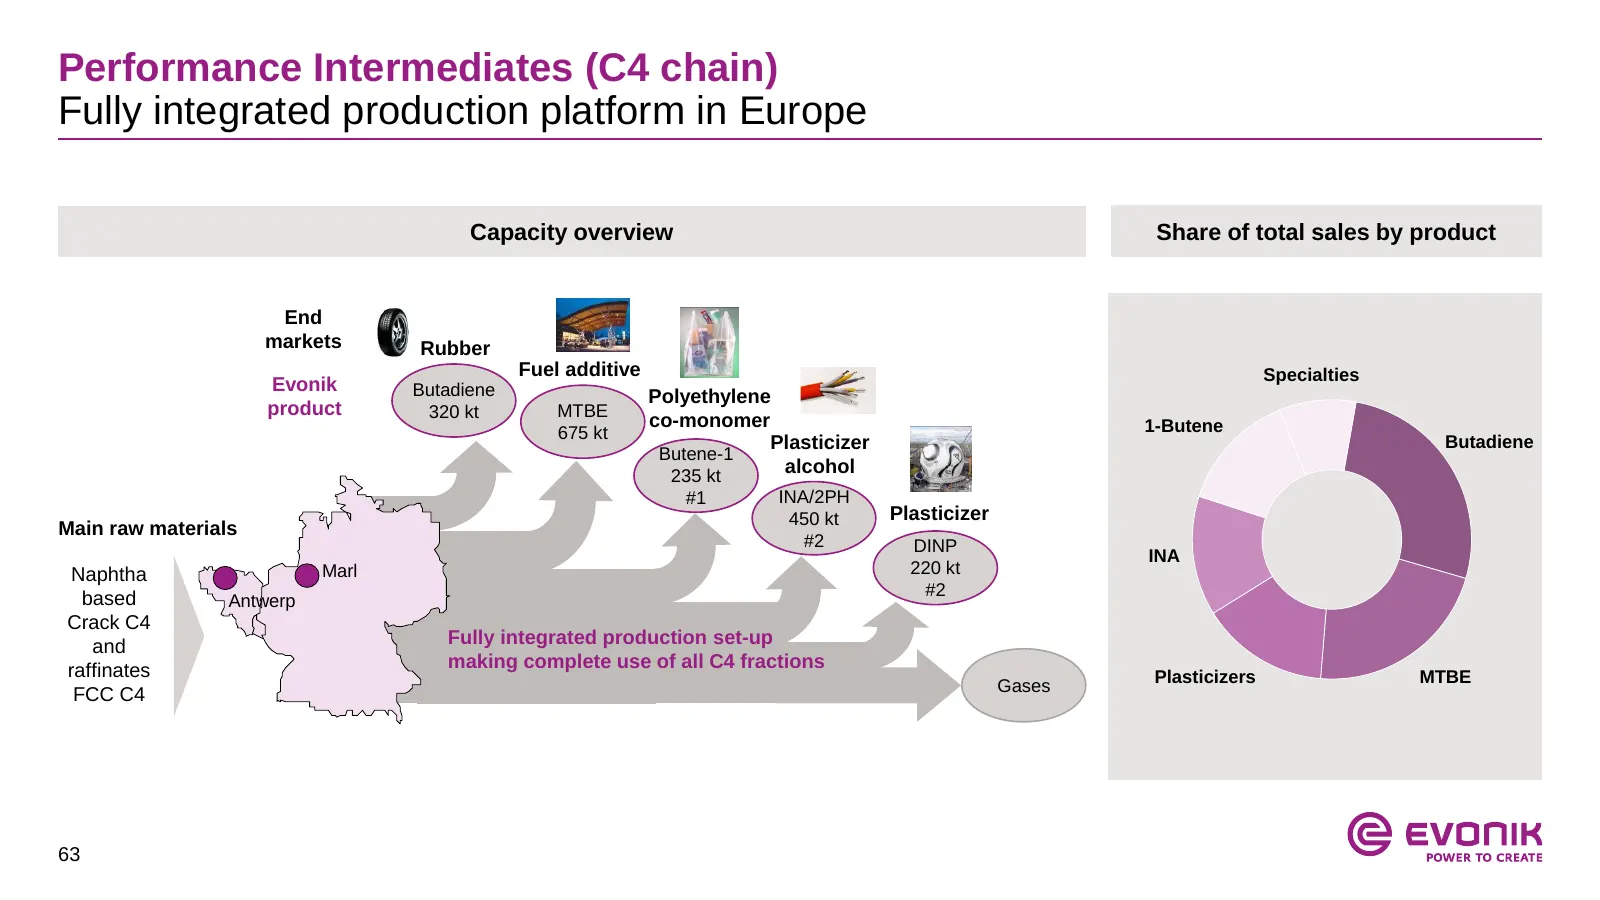
Performance Intermediates (C4 chain) Fully integrated production platform in Europe Capacity overview Share of total sales by product End markets Rubber Fuel additive Specialties Evonik Butadiene Polyethylene product 320 kt MTBE co-monomer 1-Butene 675 kt Plasticizer Butadiene Butene-1 235 kt alcoho
Slide 64: Appendix
Appendix 1. Strategy Details 2. Segment overview 3. Financials 4. Upcoming events 64
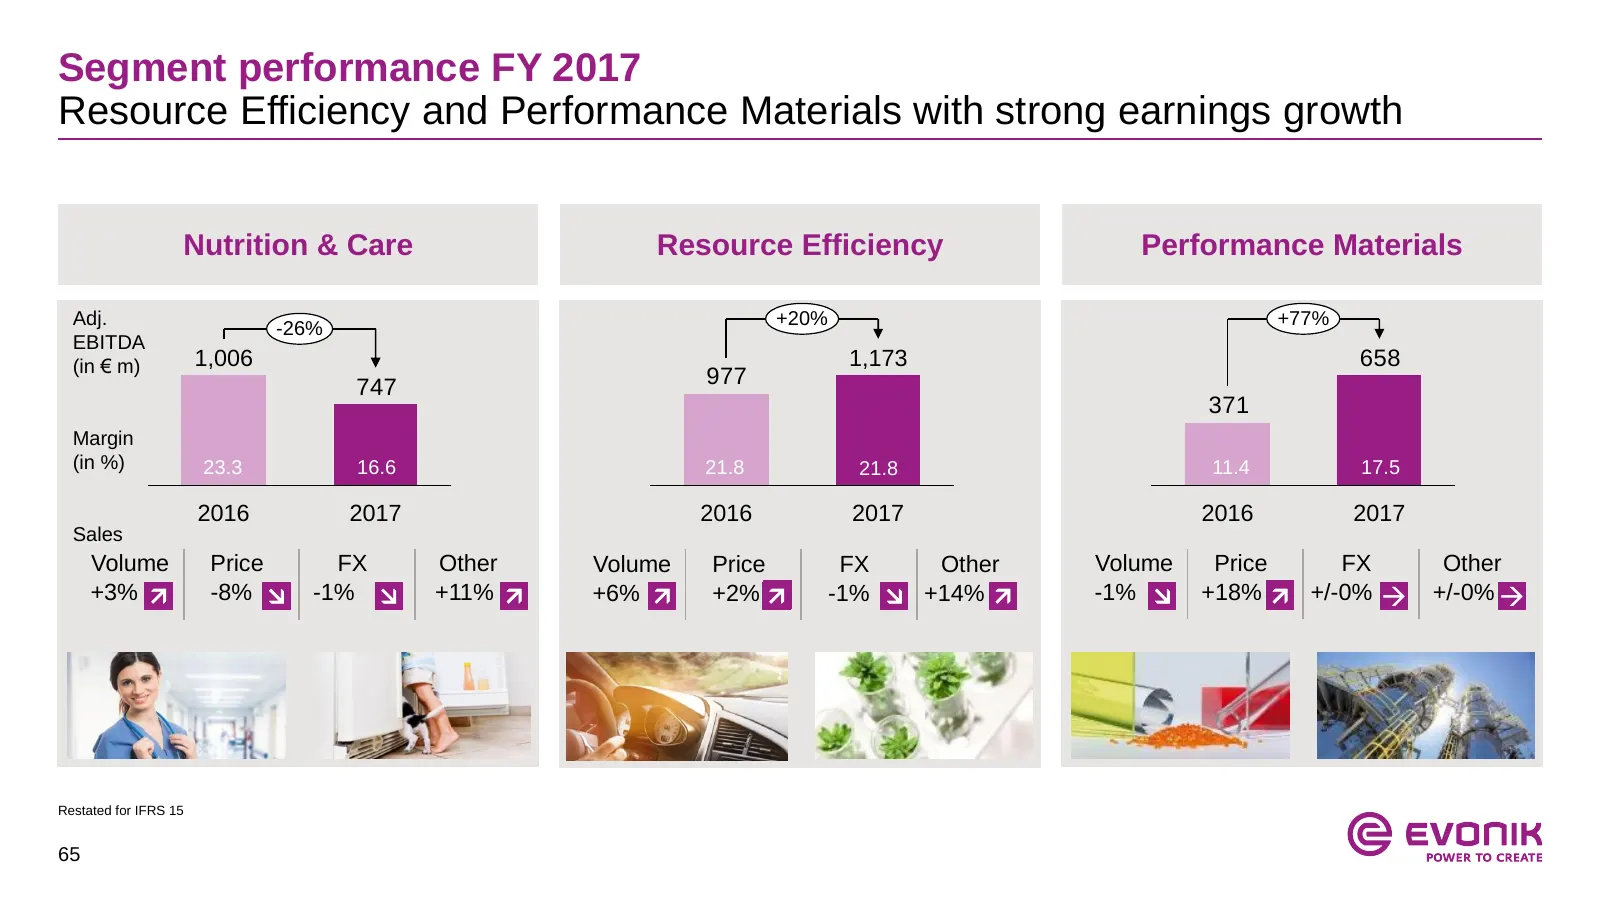
Slide 65: Segment performance FY 2017
Segment performance FY 2017 Resource Efficiency and Performance Materials with strong earnings growth Nutrition & Care Resource Efficiency Performance Materials Adj. +20% +77% -26% EBITDA (in € m) 1,006 1,173 658 747 977 371 Margin (in %) 23.3 16.6 21.8 21.8 11.4 17.5 2016 2017 2016 2017 2016 2017 S
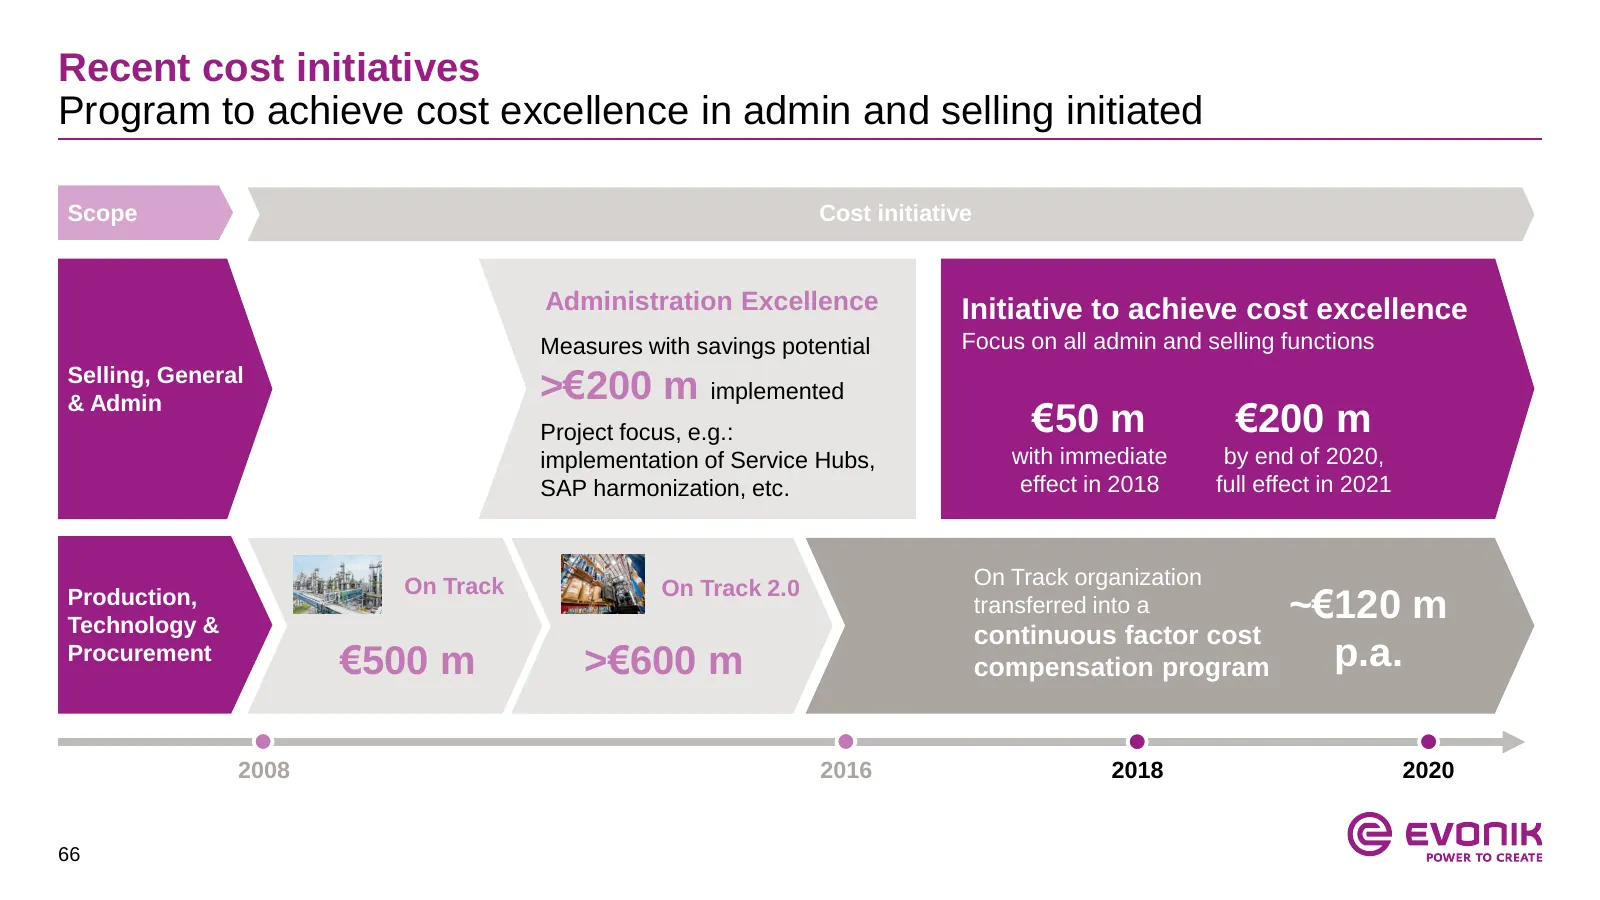
Slide 66: Recent cost initiatives
Recent cost initiatives Program to achieve cost excellence in admin and selling initiated Scope Cost initiative Administration Excellence Initiative to achieve cost excellence Measures with savings potential Focus on all admin and selling functions Selling, General & Admin >€200 m implemented Projec
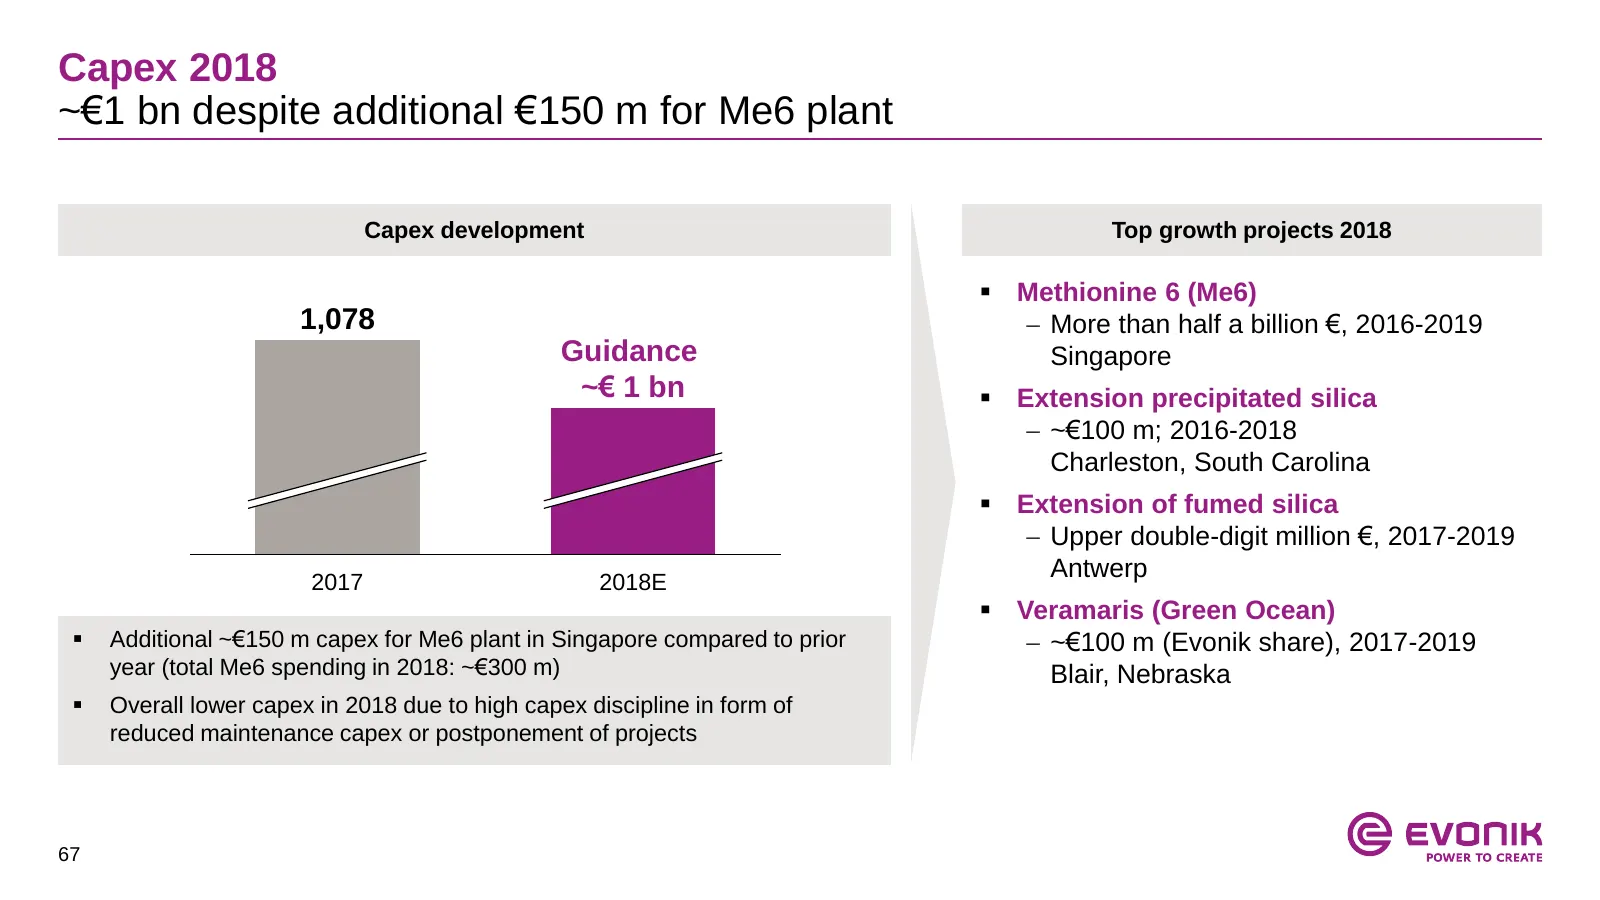
Slide 67: Capex 2018
Capex 2018 ~€1 bn despite additional €150 m for Me6 plant Capex development Top growth projects 2018 Methionine 6 (Me6) 1,078 More than half a billion €, 2016-2019 Guidance Singapore ~€ 1 bn Extension precipitated silica ~€100 m; 2016-2018 Charleston, South Carolina Extension of fumed sili
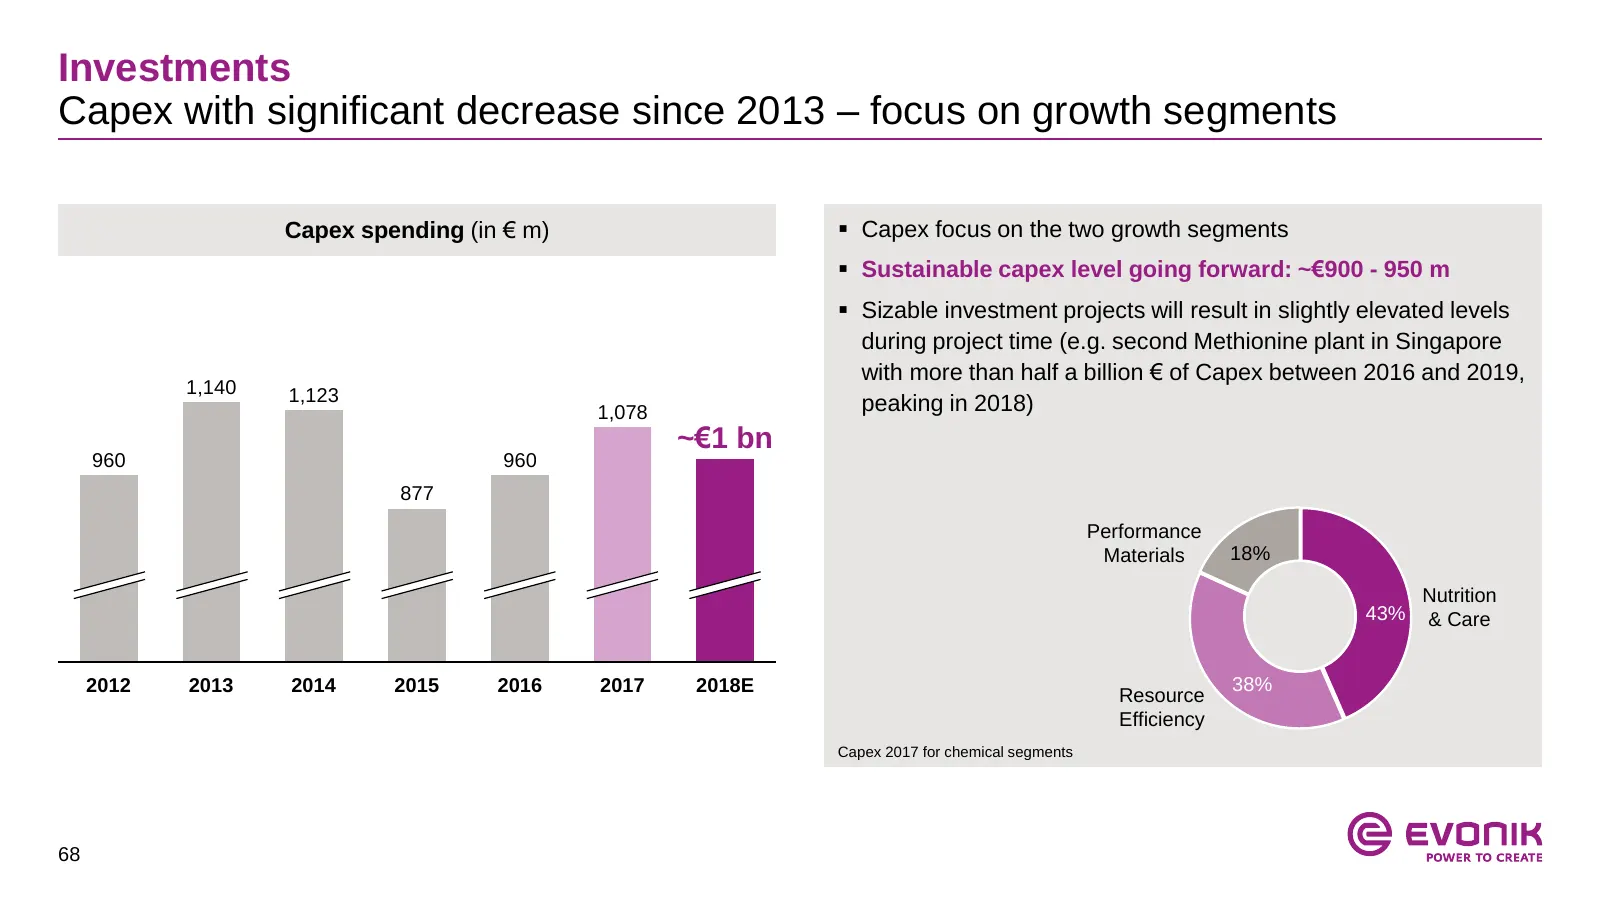
Slide 68: Capex with significant decrease since 2013
Investments Capex with significant decrease since 2013 – focus on growth segments Capex spending (in € m) Capex focus on the two growth segments Sustainable capex level going forward: ~€900 - 950 m Sizable investment projects will result in slightly elevated levels during project time (e.g. se
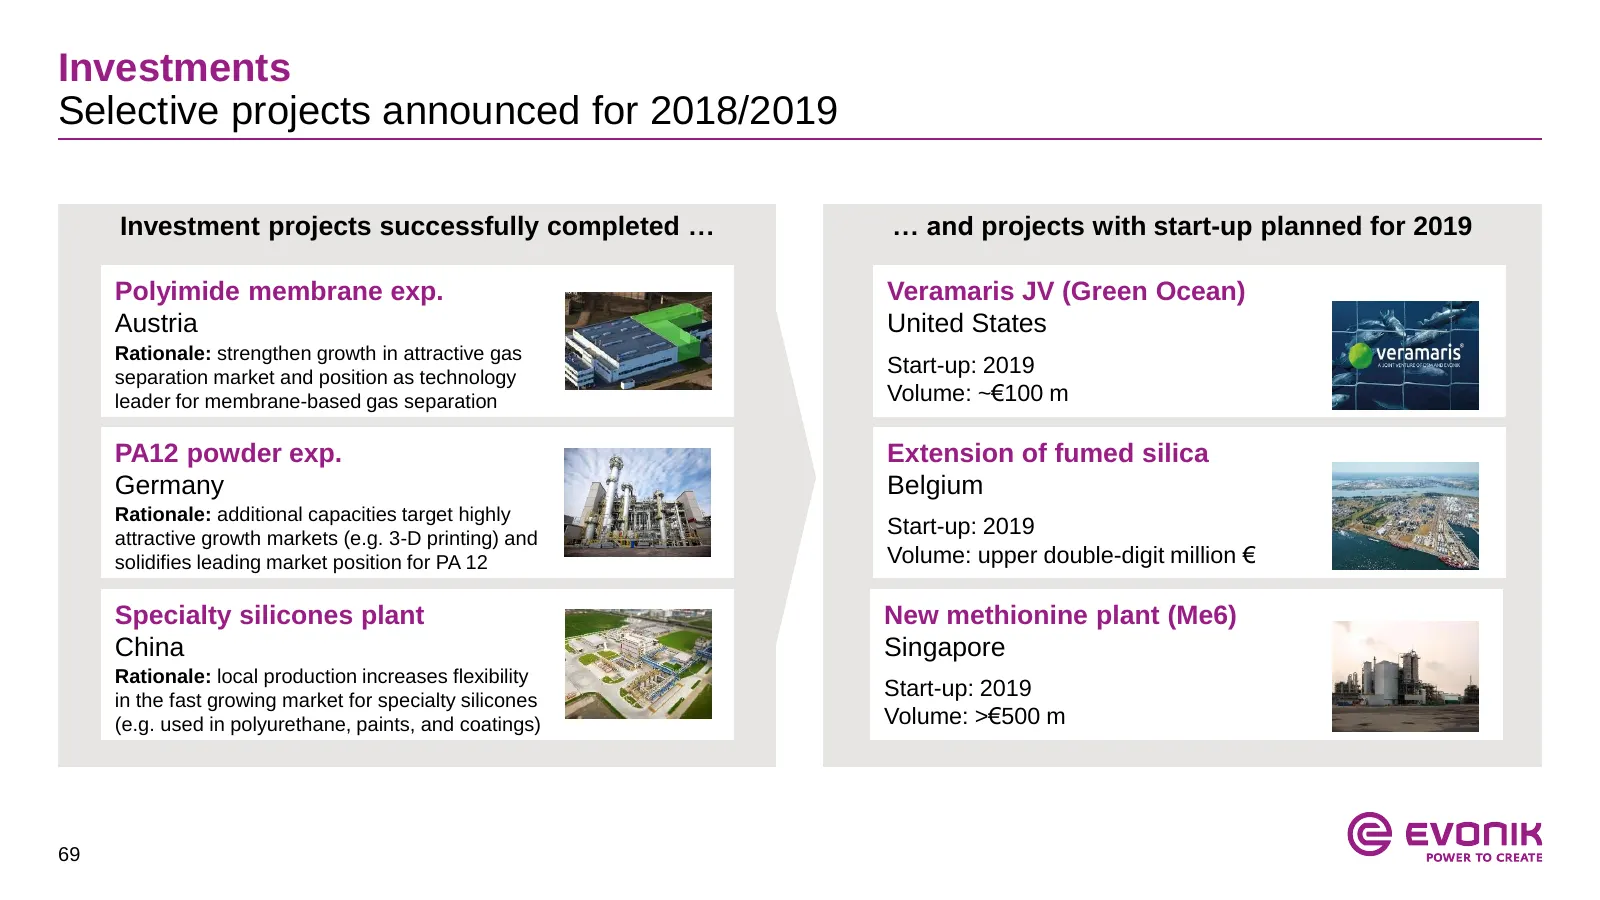
Slide 69: Investments: Selective projects announced for 2018/2019
Investments Selective projects announced for 2018/2019 Investment projects successfully completed … … and projects with start-up planned for 2019 Polyimide membrane exp. Veramaris JV (Green Ocean) Austria United States Rationale: strengthen growth in attractive gas separation market and position as
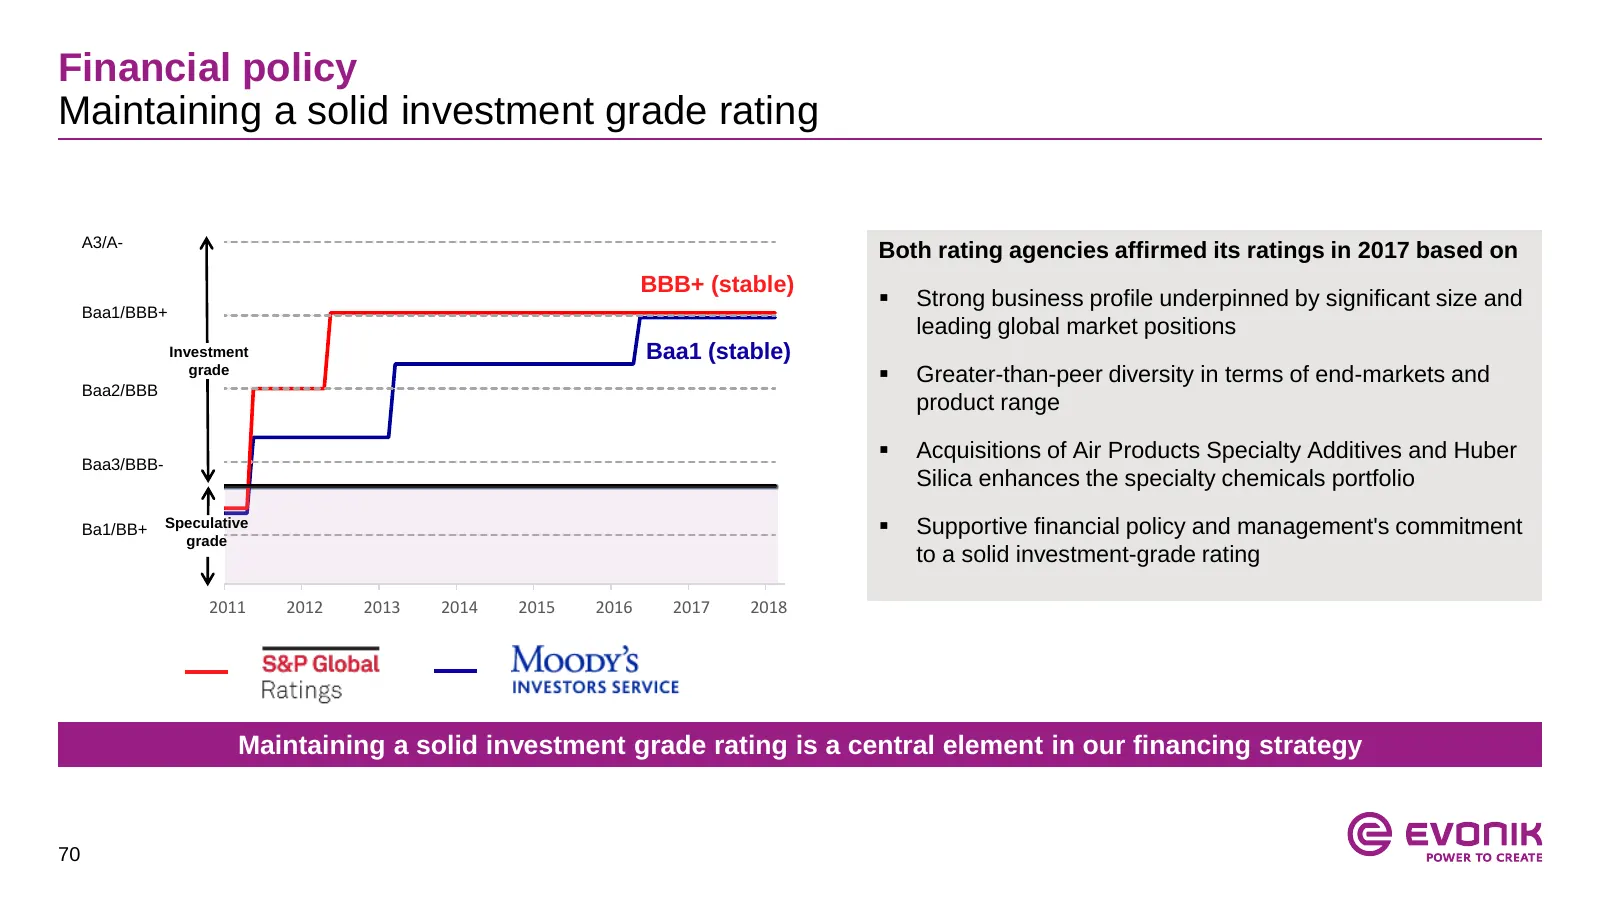
Slide 70: Financial policy
Financial policy Maintaining a solid investment grade rating A3/A- Both rating agencies affirmed its ratings in 2017 based on BBB+ (stable) Strong business profile underpinned by significant size and Baa1/BBB+ leading global market positions Investment Baa1 (stable) grade Greater-than-peer diver
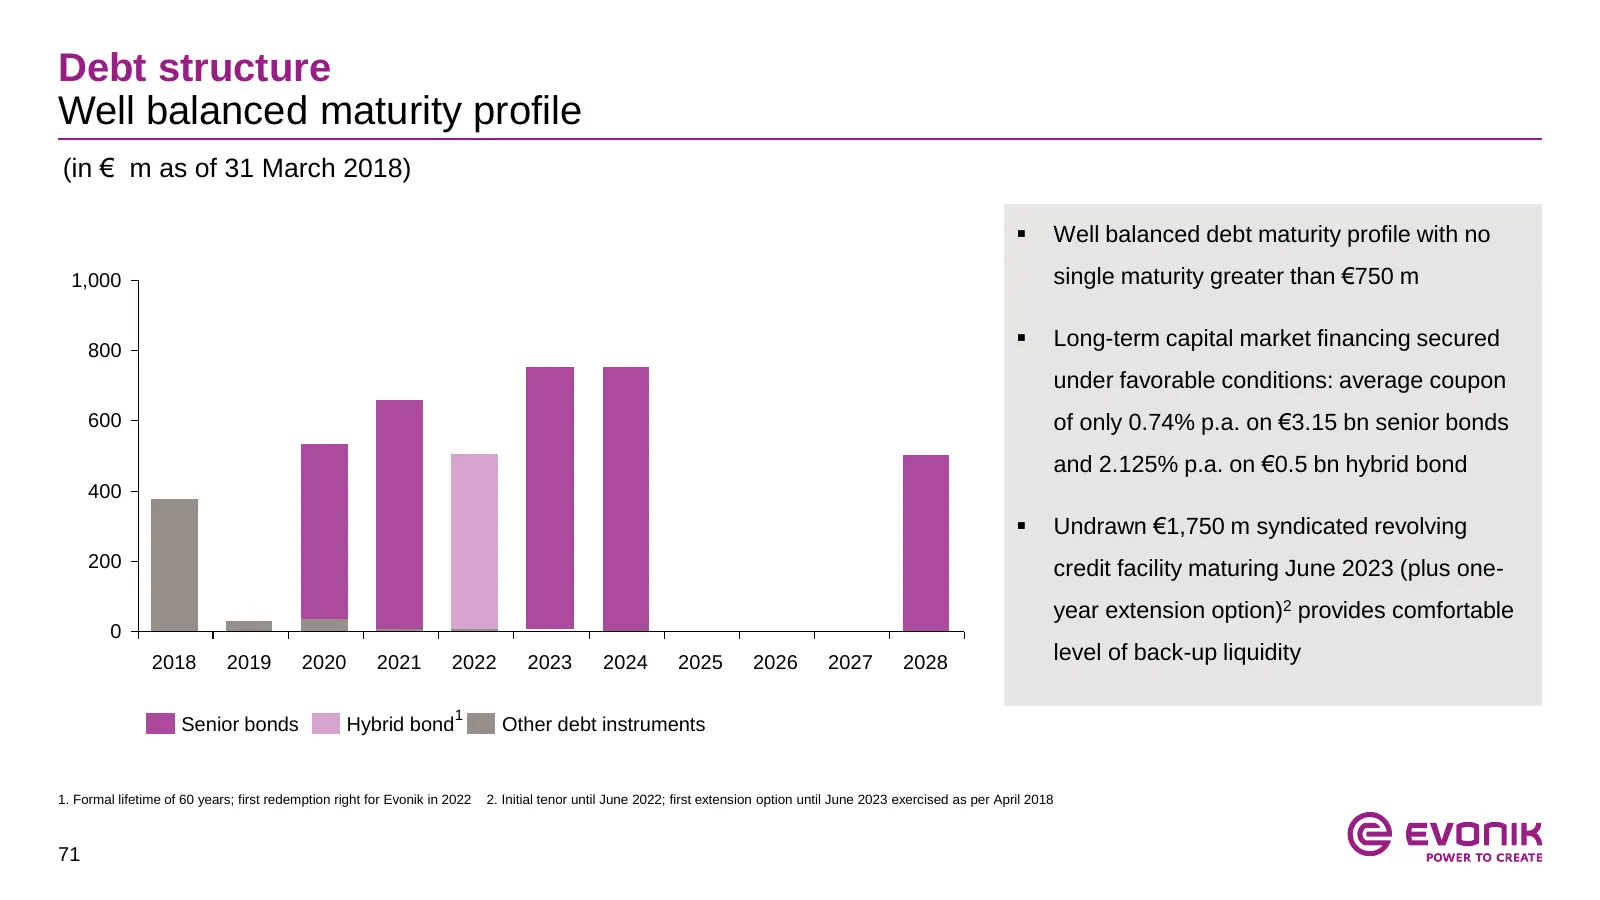
Slide 71: Debt structure
Debt structure Well balanced maturity profile (in € m as of 31 March 2018) Well balanced debt maturity profile with no 1,000 single maturity greater than €750 m 800 Long-term capital market financing secured under favorable conditions: average coupon 600 of only 0.74% p.a. on €3.15 bn senior bon
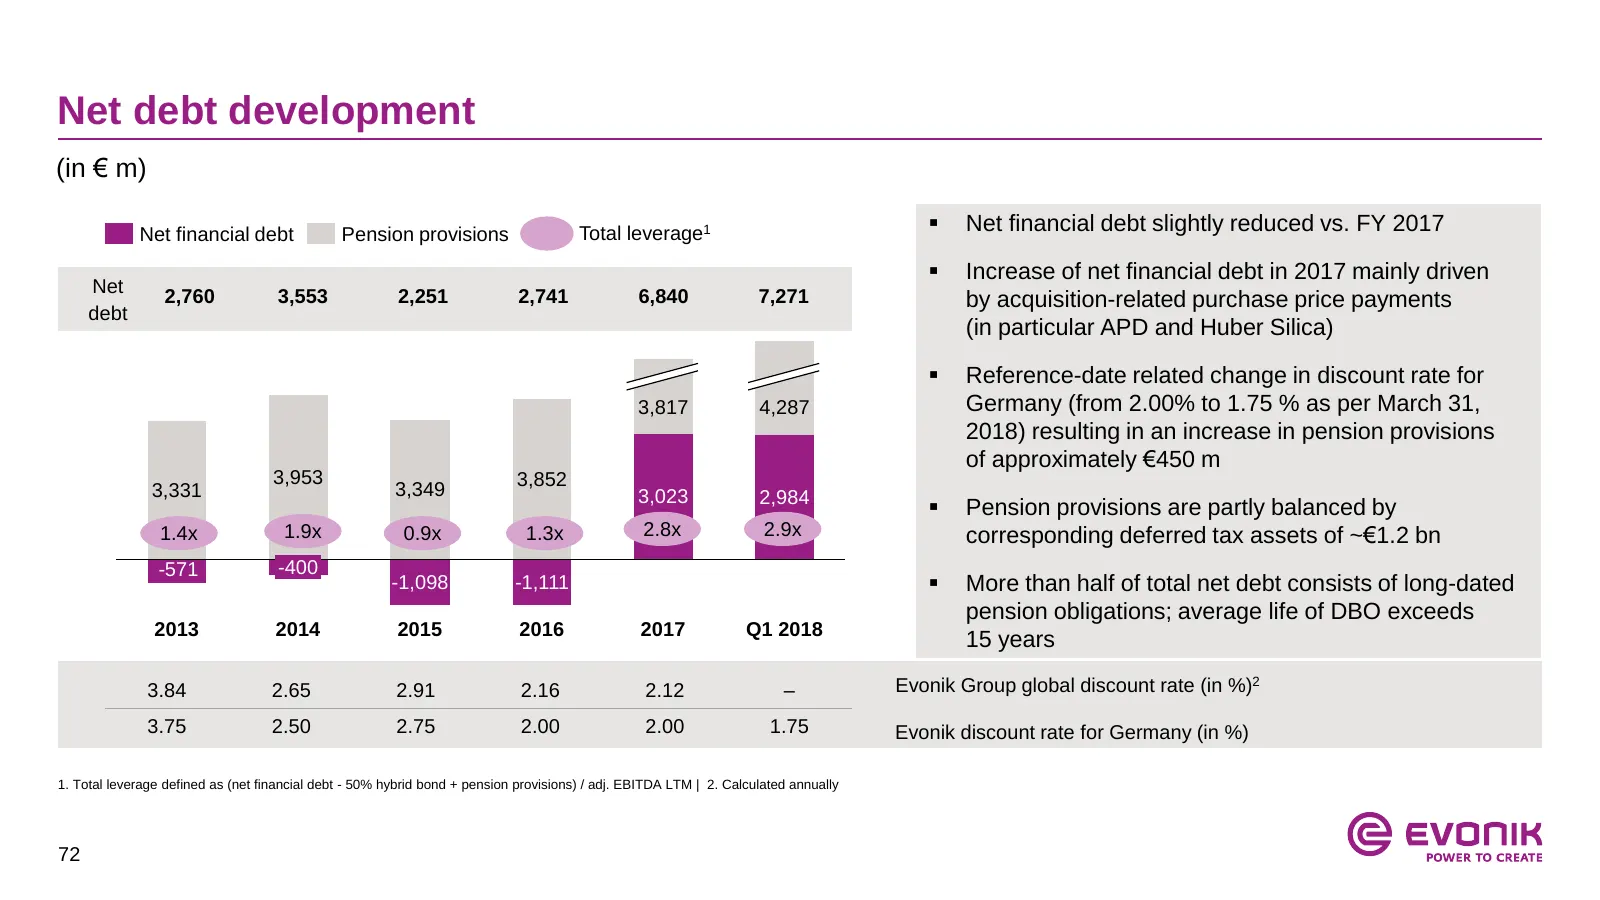
Slide 72: Net debt development
Net debt development (in € m) Net financial debt Pension provisions Total leverage1 Net financial debt slightly reduced vs. FY 2017 Increase of net financial debt in 2017 mainly driven Net 2,760 3,553 2,251 2,741 6,840 7,271 by acquisition-related purchase price payments debt (in particular APD
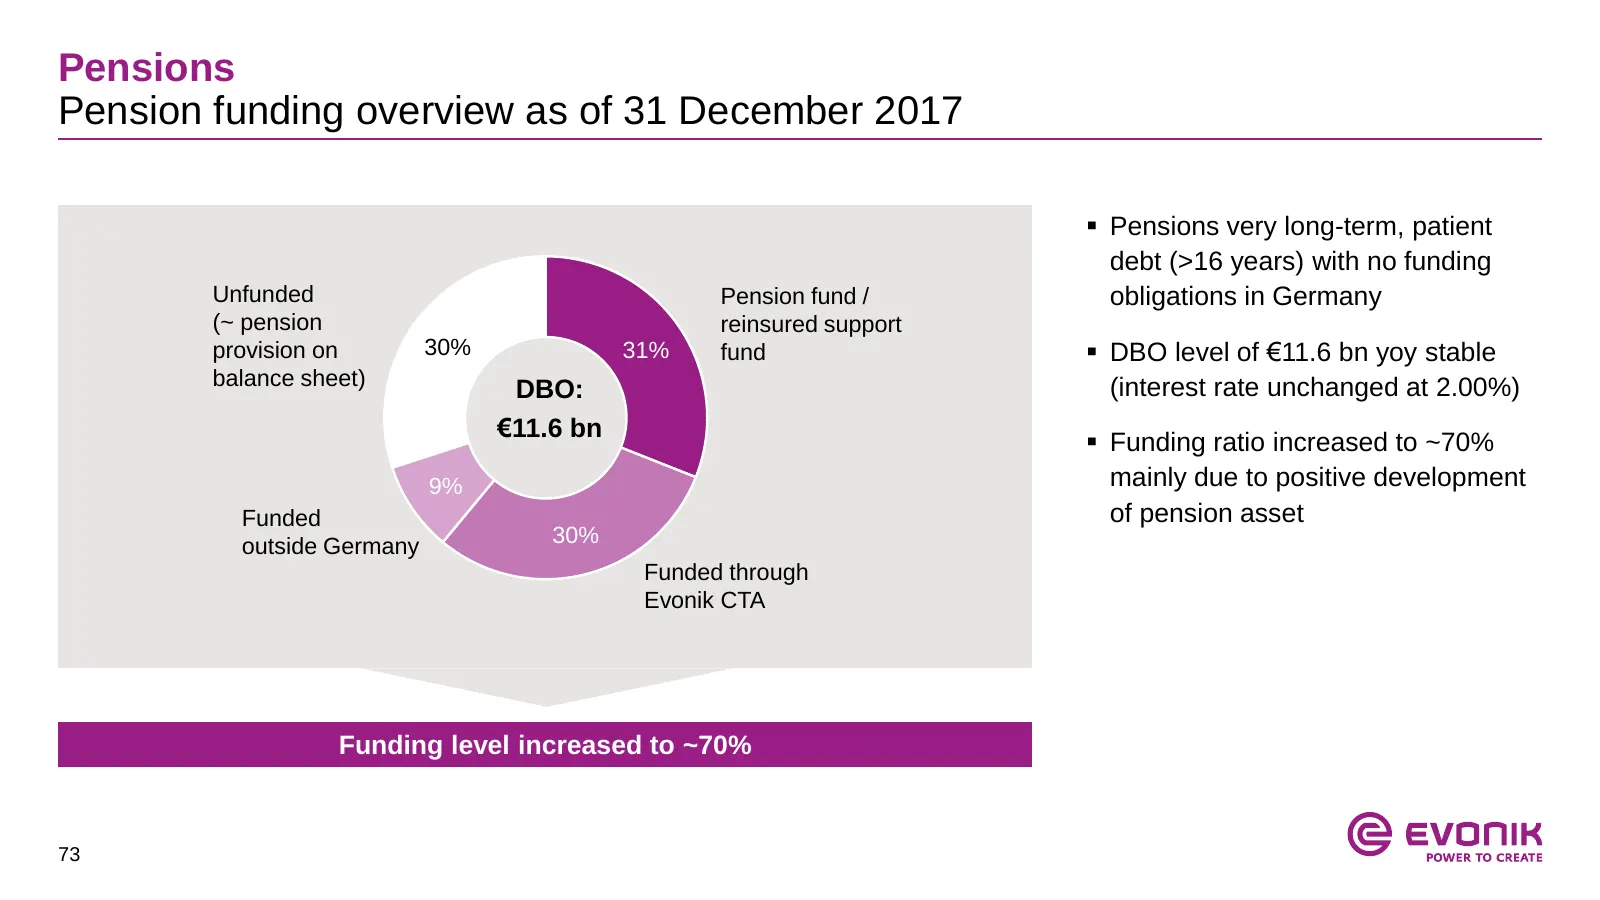
Slide 73: Pensions
Pensions Pension funding overview as of 31 December 2017 Pensions very long-term, patient debt (>16 years) with no funding Unfunded Pension fund / obligations in Germany (~ pension reinsured support provision on 30% 31% fund DBO level of €11.6 bn yoy stable balance sheet) (interest rate unchange
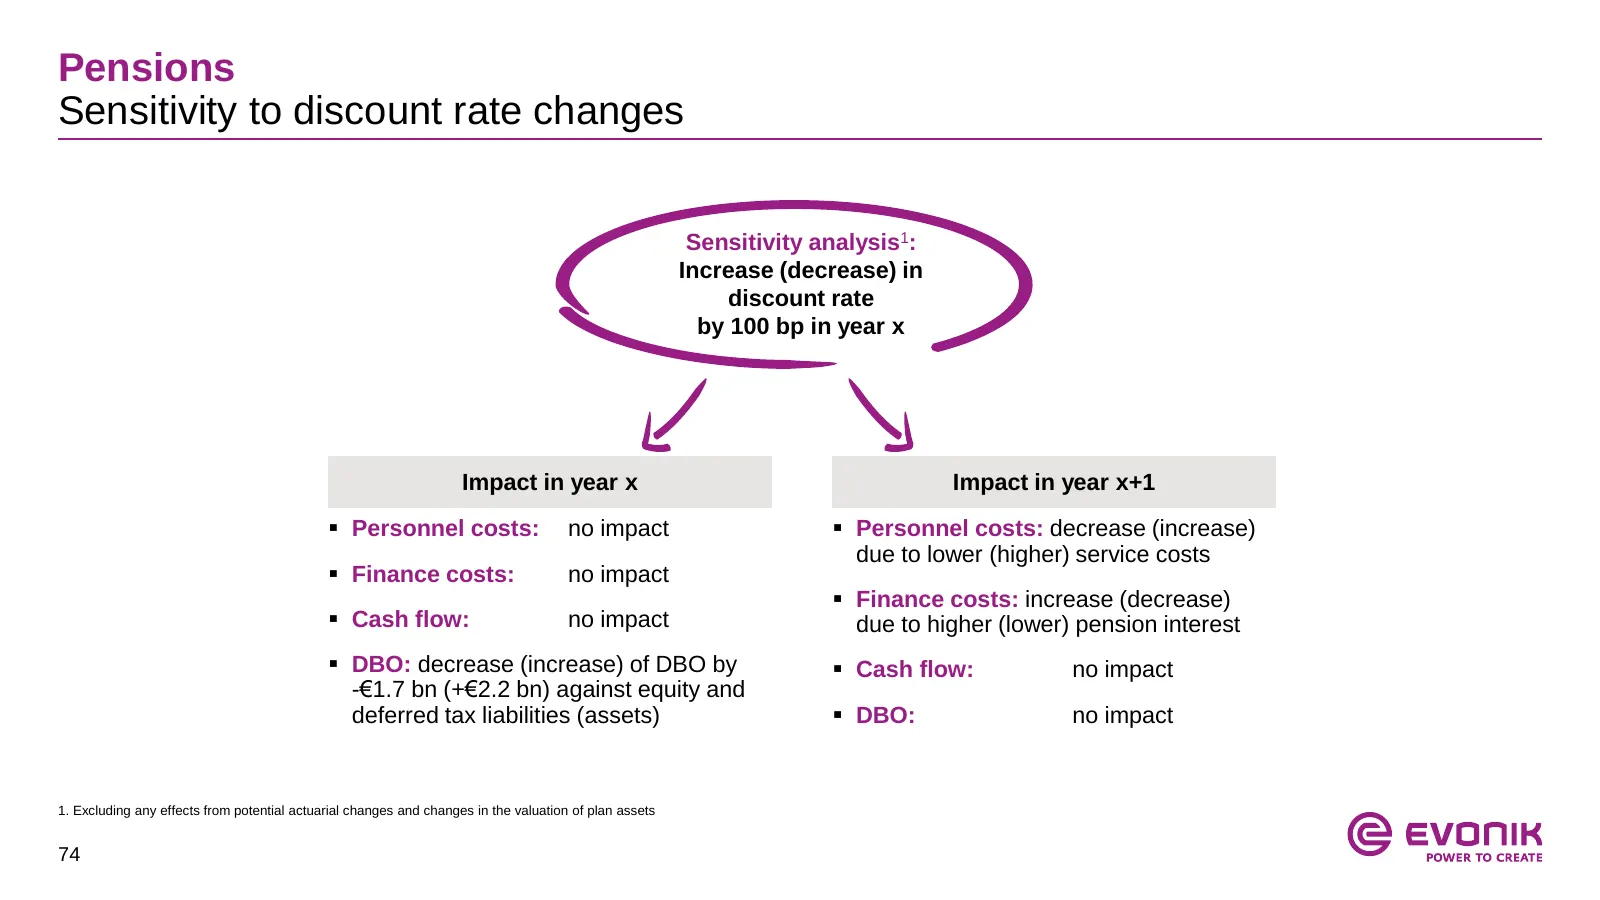
Slide 74: Pensions: Sensitivity to discount rate changes
Pensions Sensitivity to discount rate changes Sensitivity analysis1: Increase (decrease) in discount rate by 100 bp in year x Impact in year x Impact in year x+1 Personnel costs: no impact Personnel costs: decrease (increase) due to lower (higher) service costs Finance costs: no impact Finan
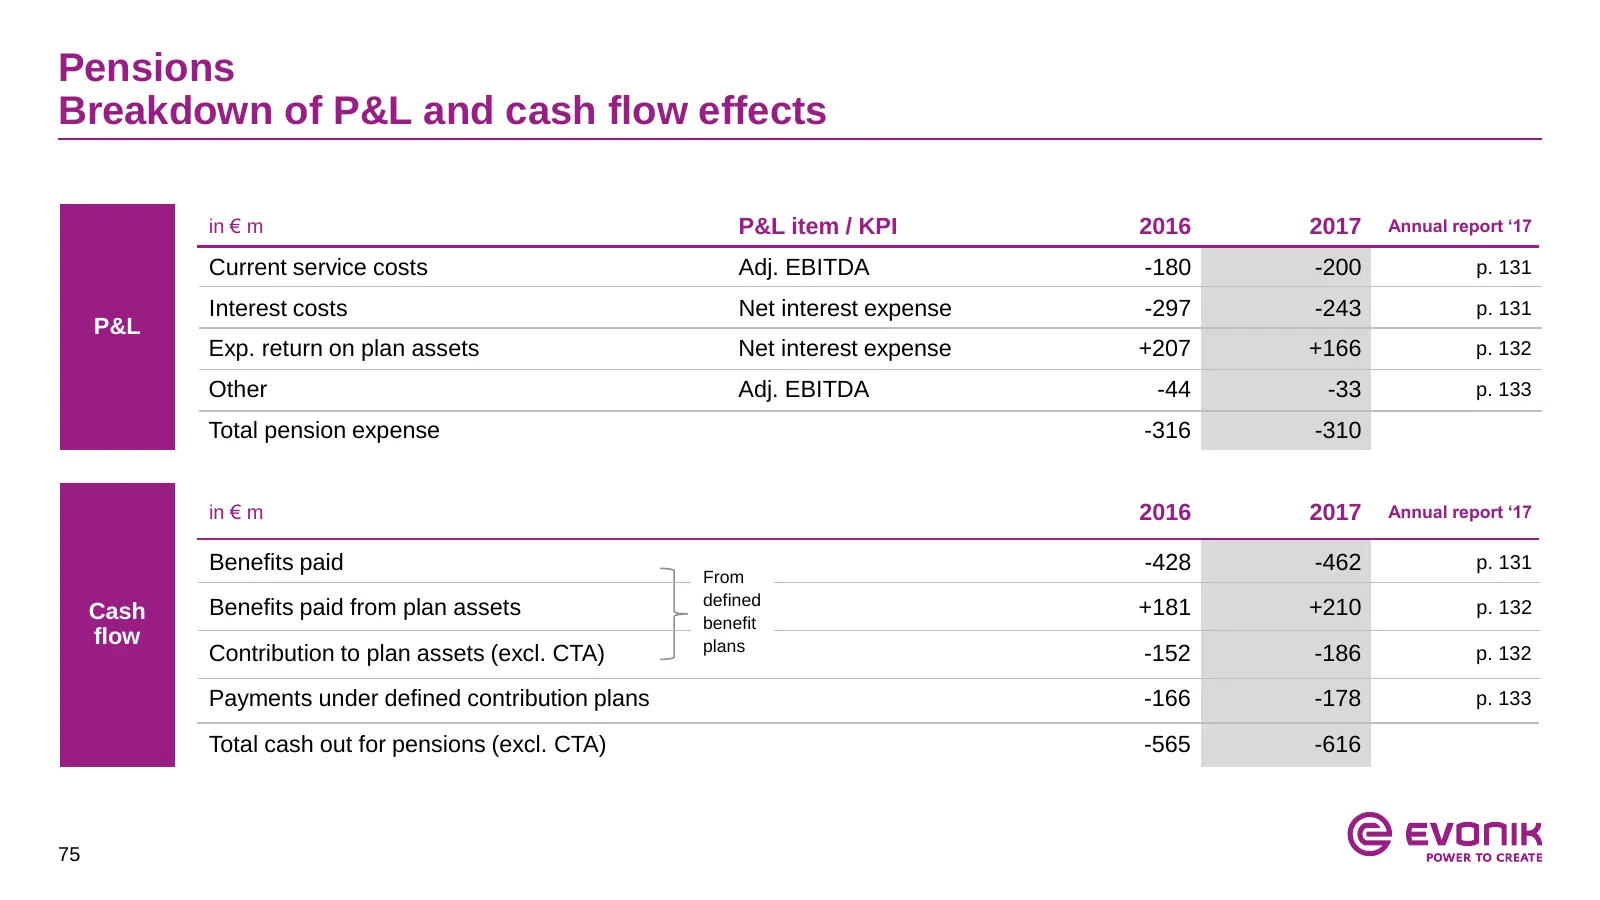
Slide 75: Pensions: Breakdown of P&L and cash flow effects
Pensions Breakdown of P&L and cash flow effects in € m P&L item / KPI 2016 2017 Annual report ‘17 Current service costs Adj. EBITDA -180 -200 p. 131 Interest costs Net interest expense -297 -243 p. 131 P&L Exp. return on plan assets Net interest expense +207 +166 p. 132 Other Adj. EBITDA -44 -33 p.
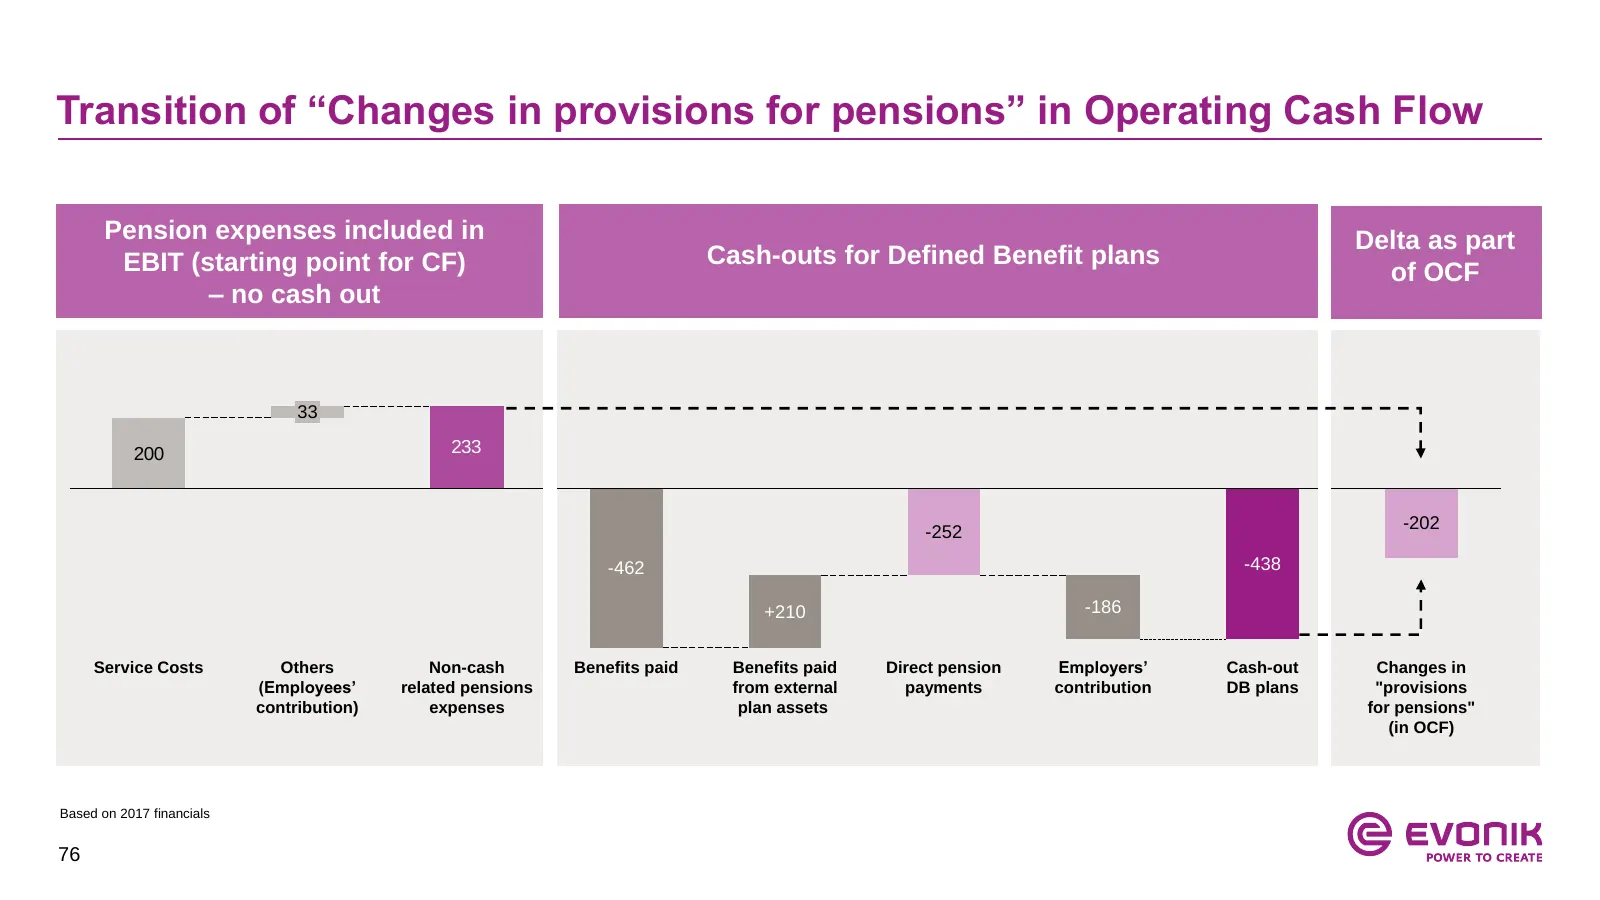
Slide 76: Transition of changes in provisions for pensions
Transition of “Changes in provisions for pensions” in Operating Cash Flow Pension expenses included in Delta as part EBIT (starting point for CF) Cash-outs for Defined Benefit plans of OCF – no cash out 33 200 233 -252 -202 -462 -438 +210 -186 Service Costs Others Non-cash Benefits paid Benefits pai
Slide 77: Financial track record
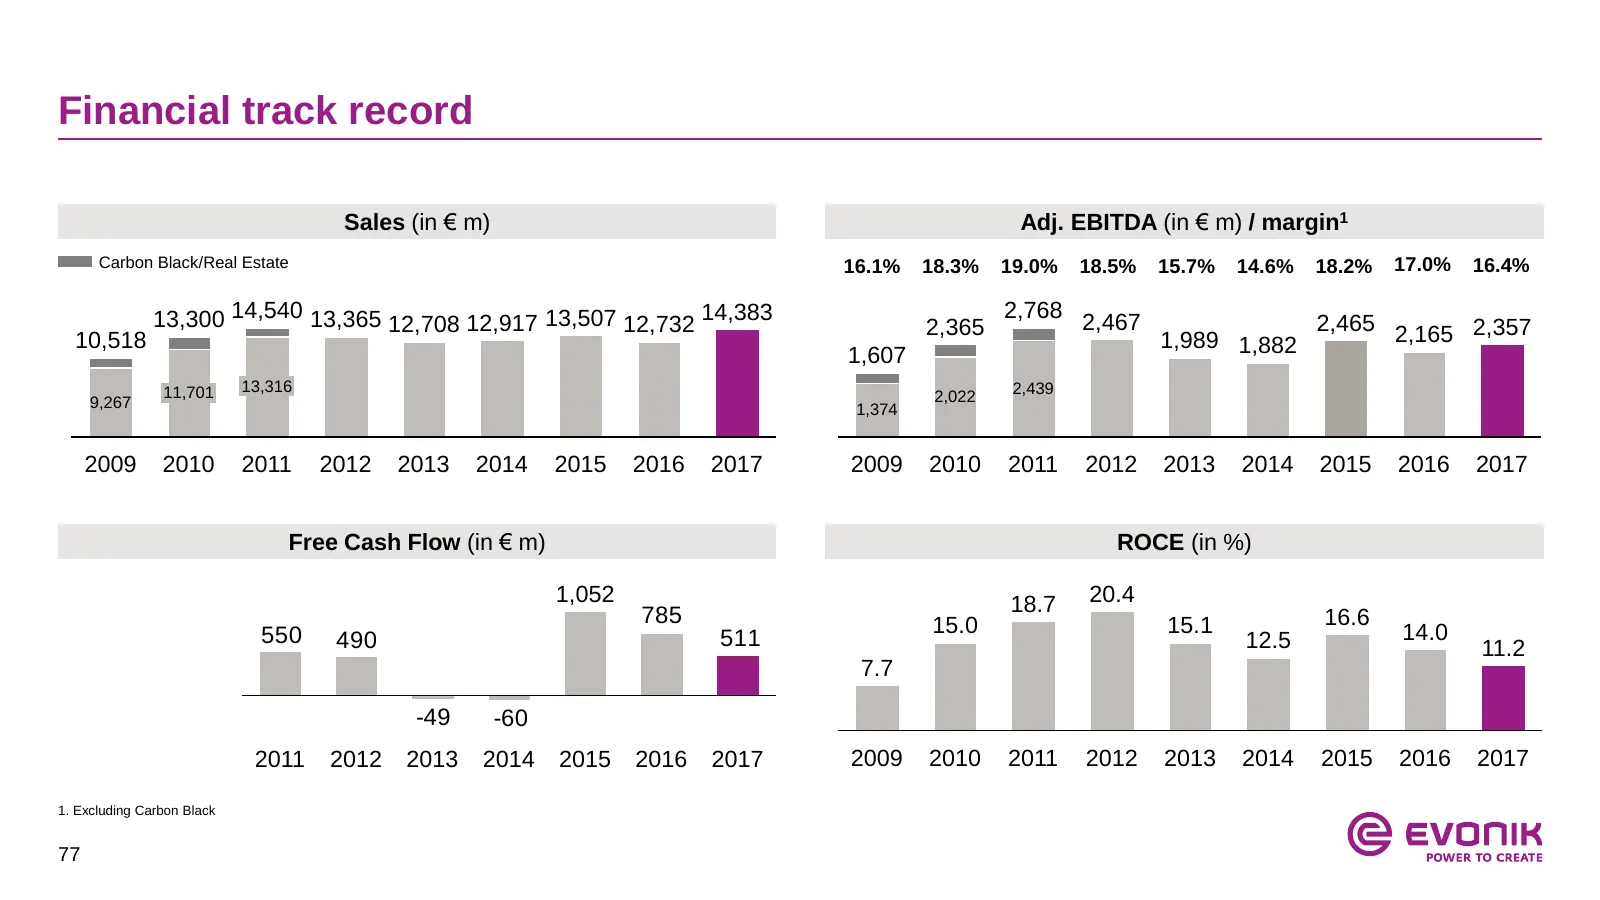
Financial track record Sales (in € m) Adj. EBITDA (in € m) / margin1 Carbon Black/Real Estate 16.1% 18.3% 19.0% 18.5% 15.7% 14.6% 18.2% 17.0% 16.4% 13,300 14,540 13,365 12,708 12,917 13,507 12,732 14,383 2,365 2,768 2,467 2,465 2,165 2,357 10,518 1,989 1,882 1,607 11,701 13,316 2,439 9,267 2,022 1,3
Slide 78: Segment overview by quarter
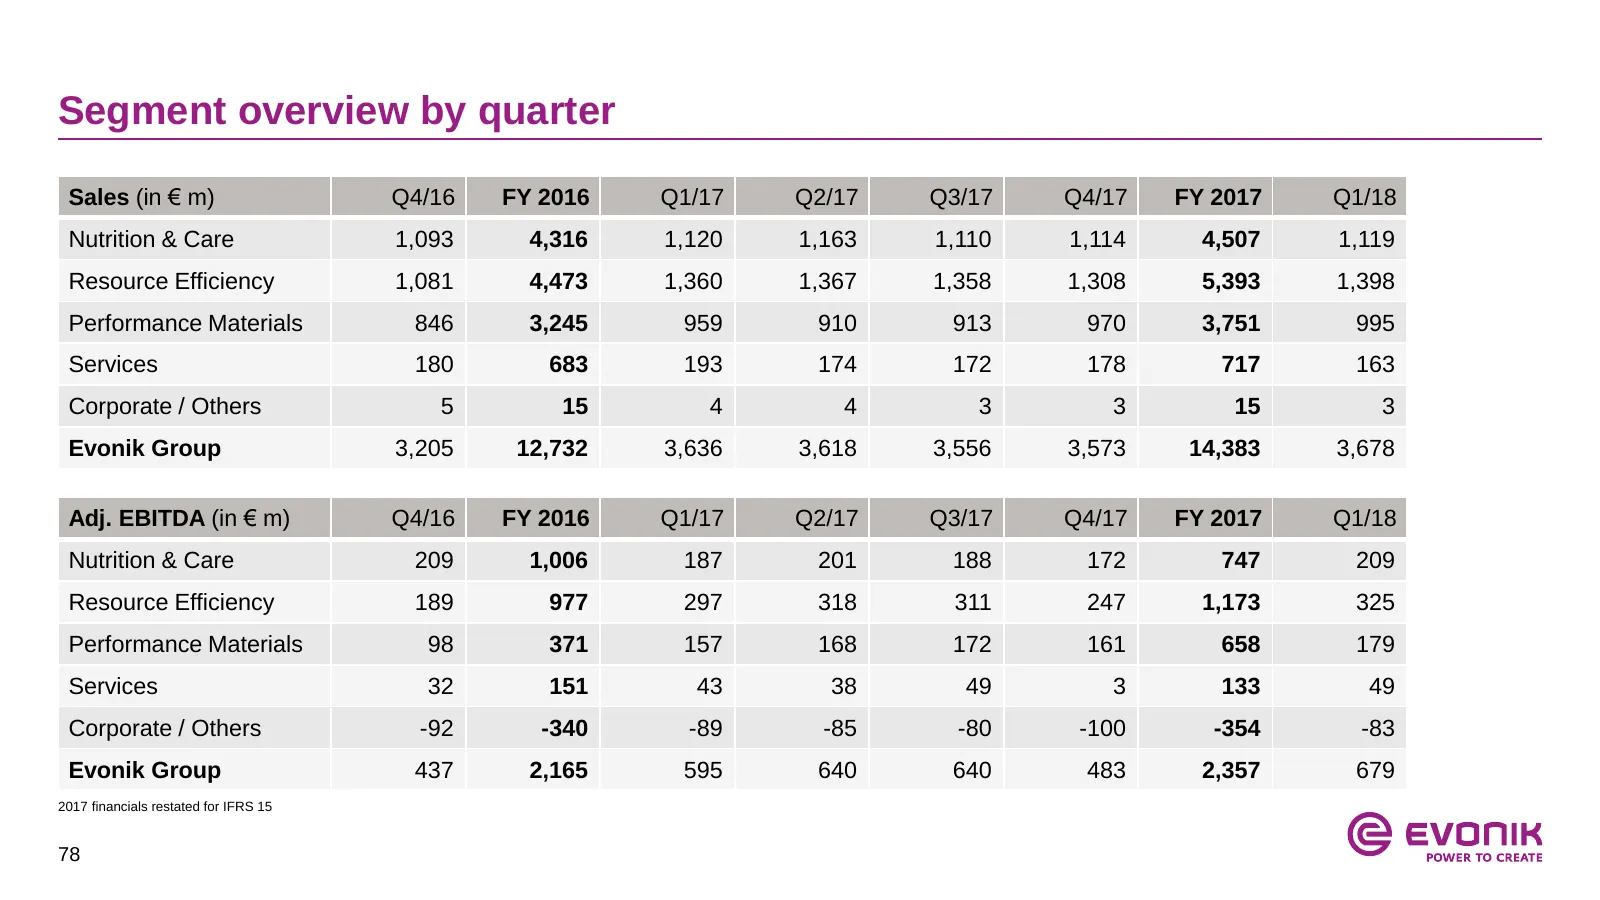
Segment overview by quarter Sales (in € m) Q4/16 FY 2016 Q1/17 Q2/17 Q3/17 Q4/17 FY 2017 Q1/18 Nutrition & Care 1,093 4,316 1,120 1,163 1,110 1,114 4,507 1,119 Resource Efficiency 1,081 4,473 1,360 1,367 1,358 1,308 5,393 1,398 Performance Materials 846 3,245 959 910 913 970 3,751 995 Services 180 6
Slide 79: Raw material split
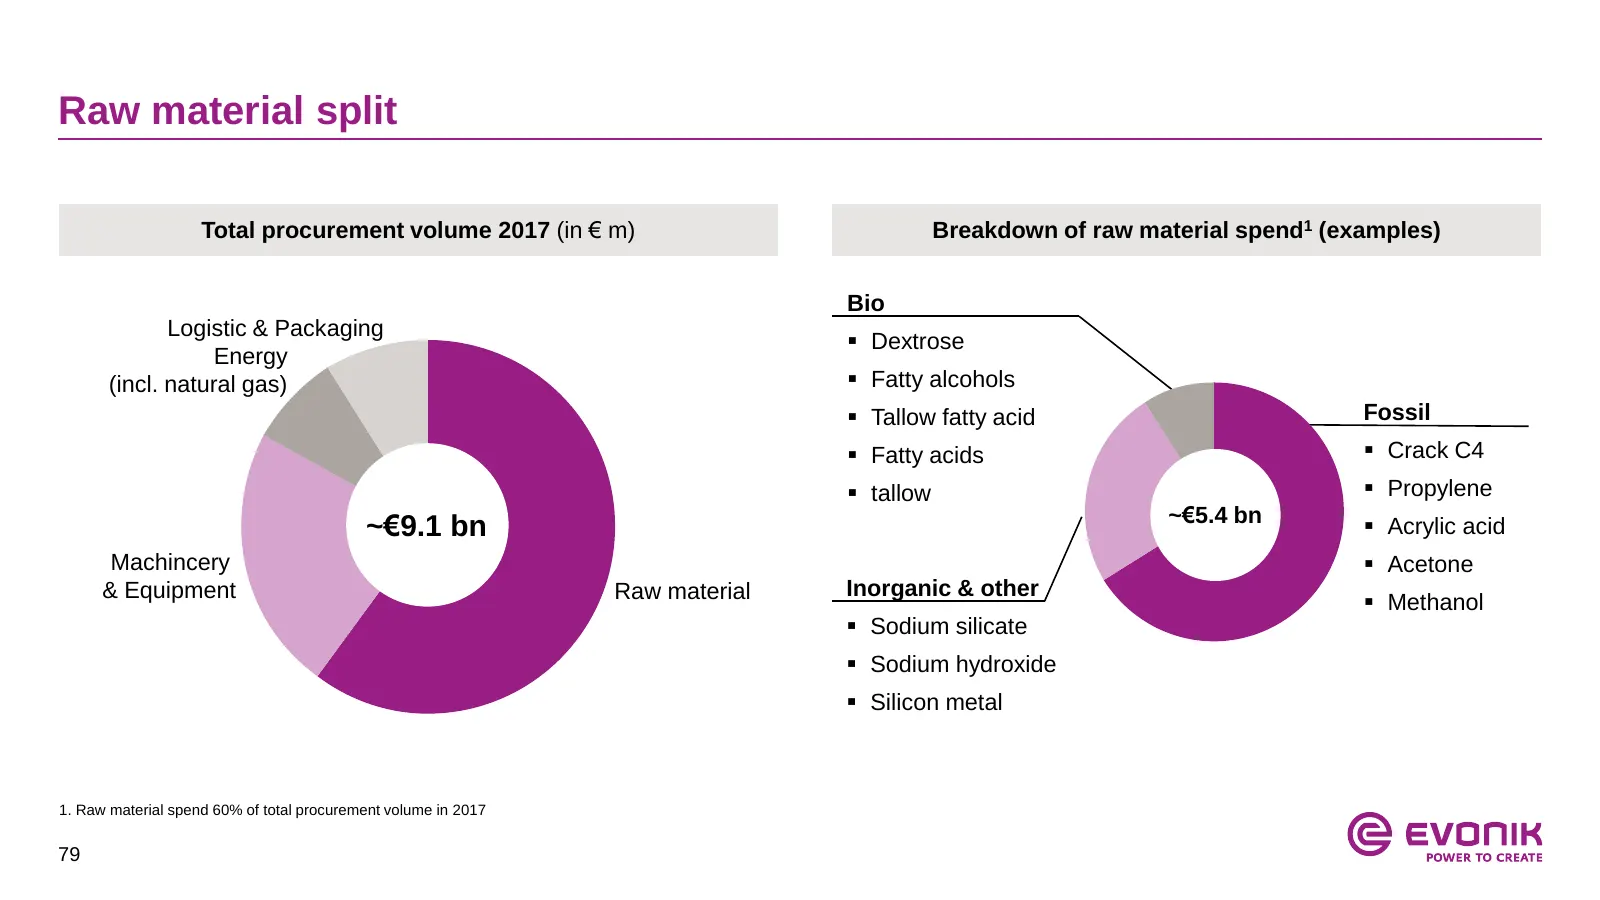
Raw material split Total procurement volume 2017 (in € m) Breakdown of raw material spend1 (examples) Bio Logistic & Packaging Dextrose Energy (incl. natural gas) Fatty alcohols Tallow fatty acid Fossil Fatty acids Crack C4 tallow Propylene ~€5.4 bn Acrylic acid ~€9.1 bn Machincery
Slide 80: Management compensation
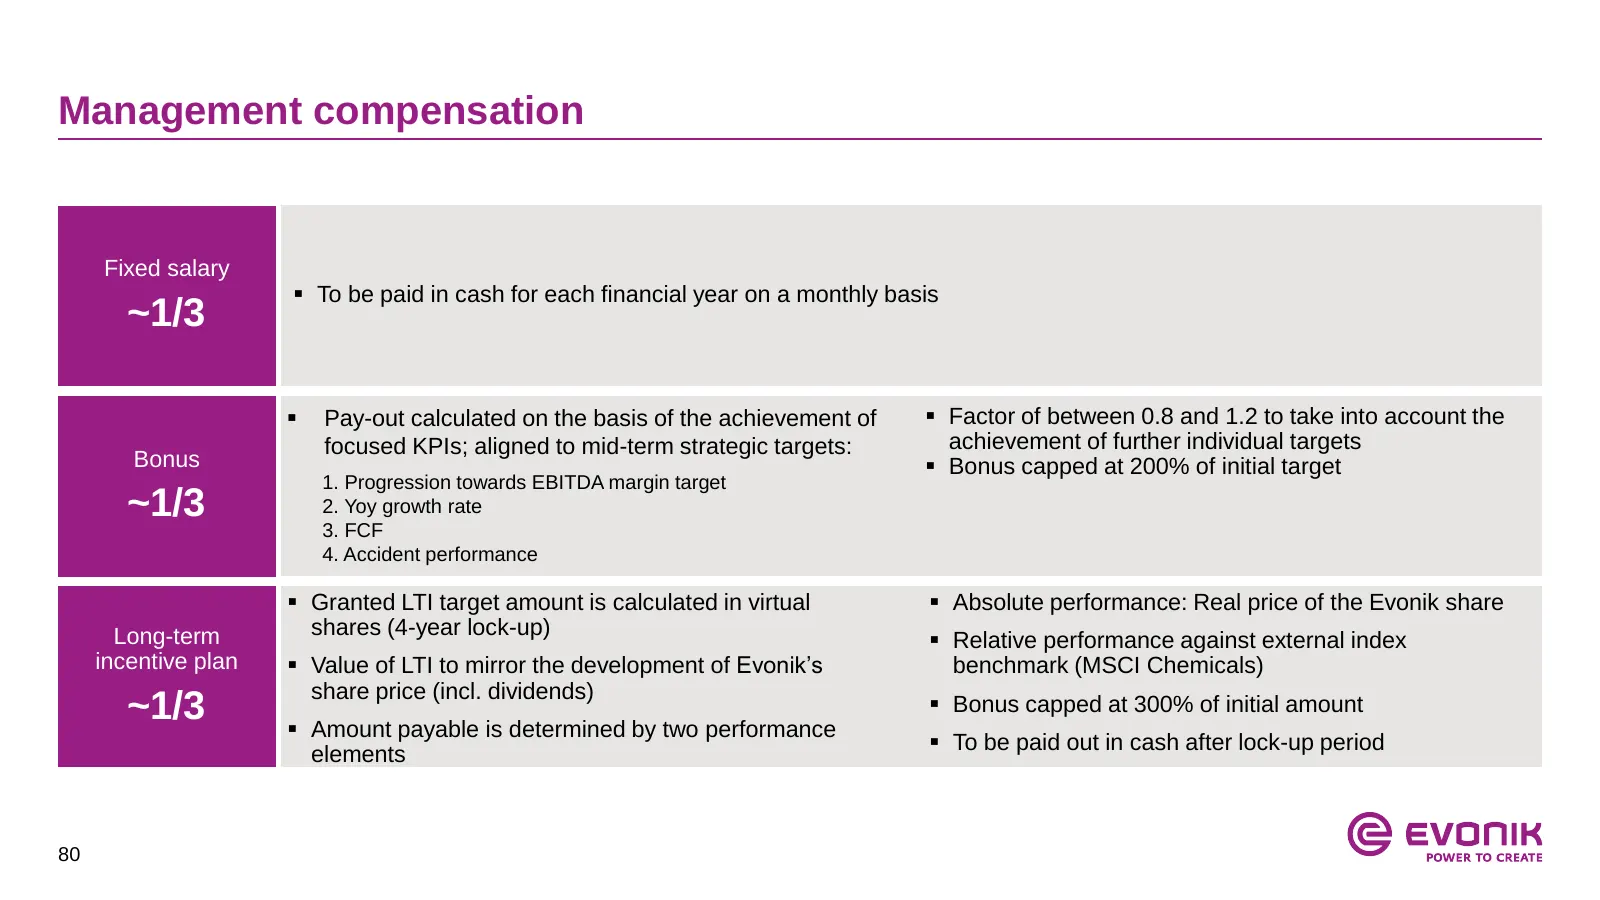
Management compensation Fixed salary To be paid in cash for each financial year on a monthly basis ~1/3 Pay-out calculated on the basis of the achievement of Factor of between 0.8 and 1.2 to take into account the focused KPIs; aligned to mid-term strategic targets: achievement of further indiv
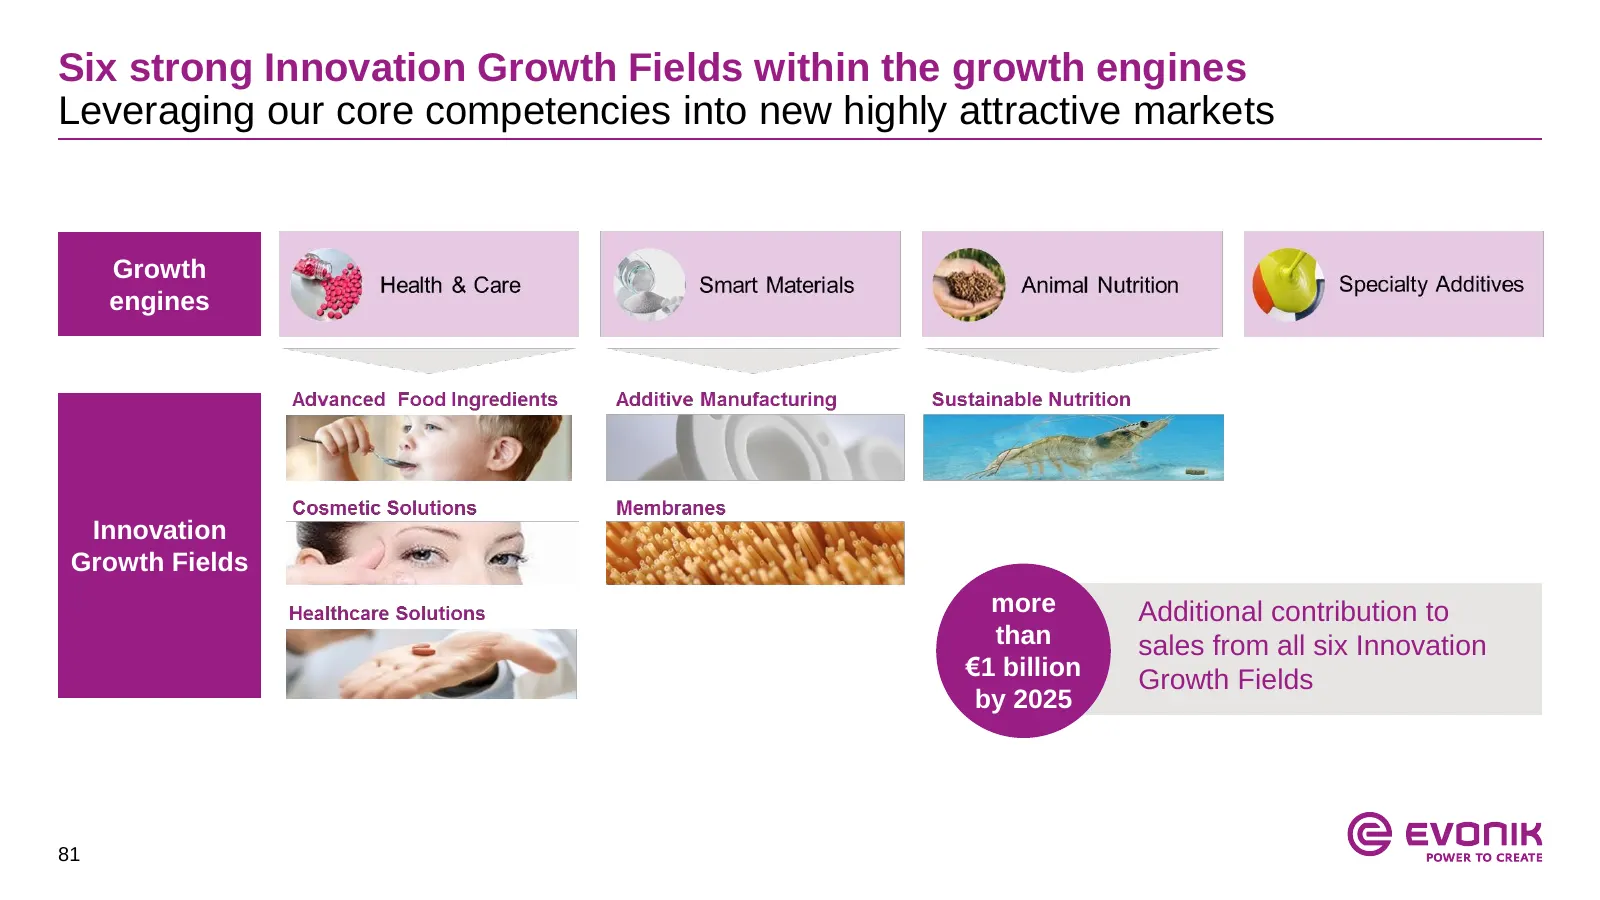
Slide 81: Six strong Innovation Growth Fields
Six strong Innovation Growth Fields within the growth engines Leveraging our core competencies into new highly attractive markets Growth engines Innovation Growth Fields more Additional contribution to than sales from all six Innovation €1 billion Growth Fields by 2025 81
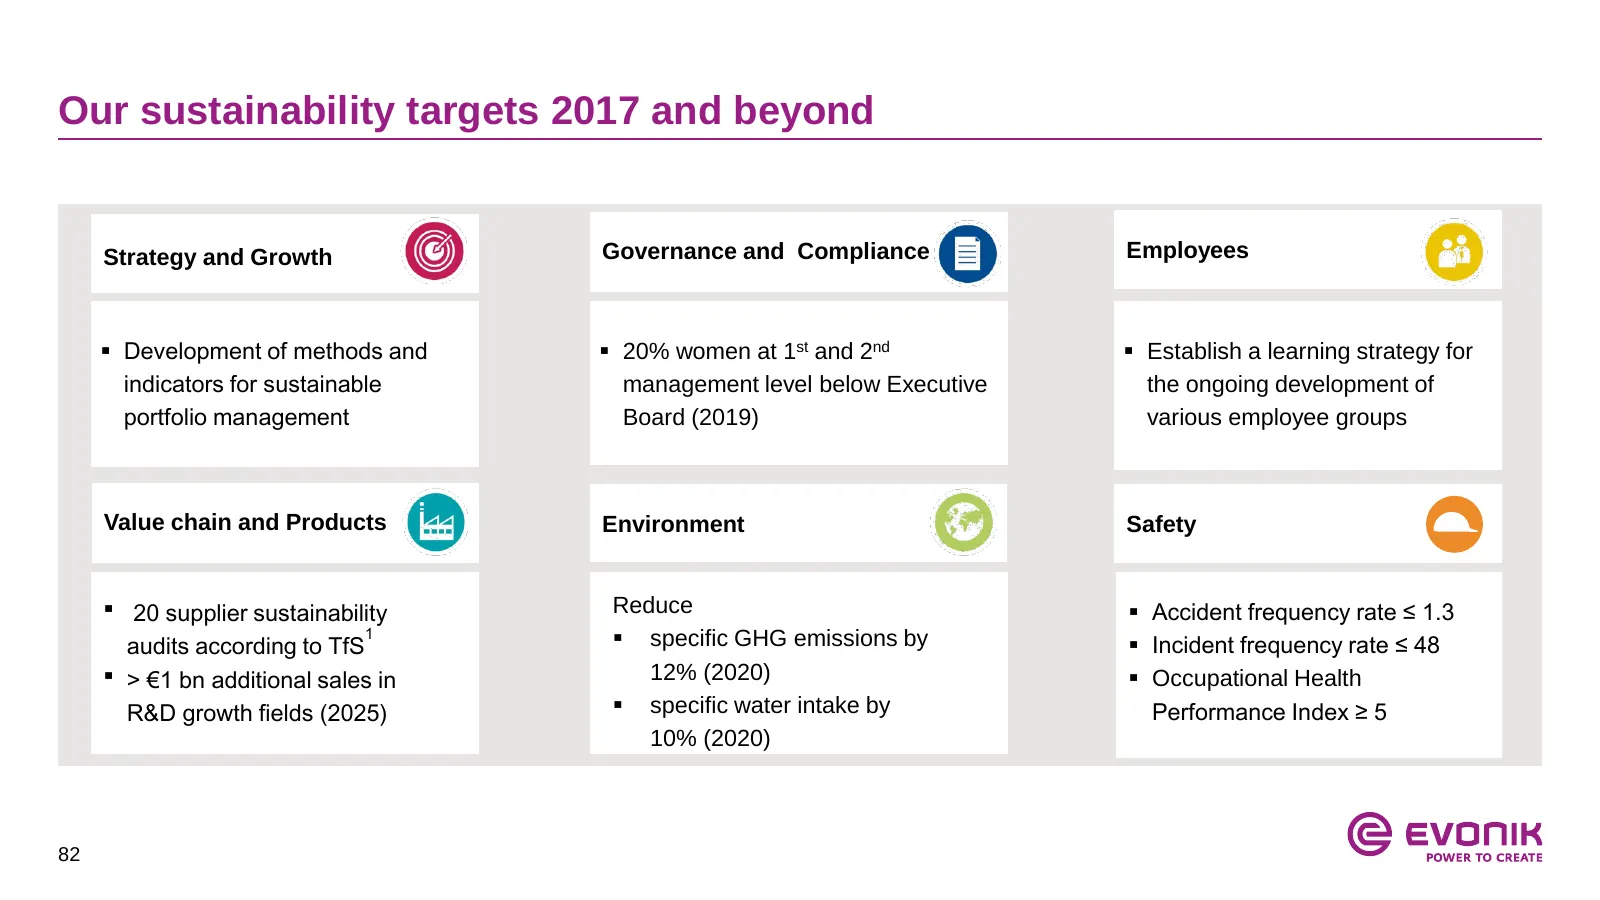
Slide 82: Our sustainability targets 2017 and beyond
Our sustainability targets 2017 and beyond Strategy and Growth Governance and Compliance Employees Development of methods and 20% women at 1st and 2nd Establish a learning strategy for indicators for sustainable management level below Executive the ongoing development of portfolio management B
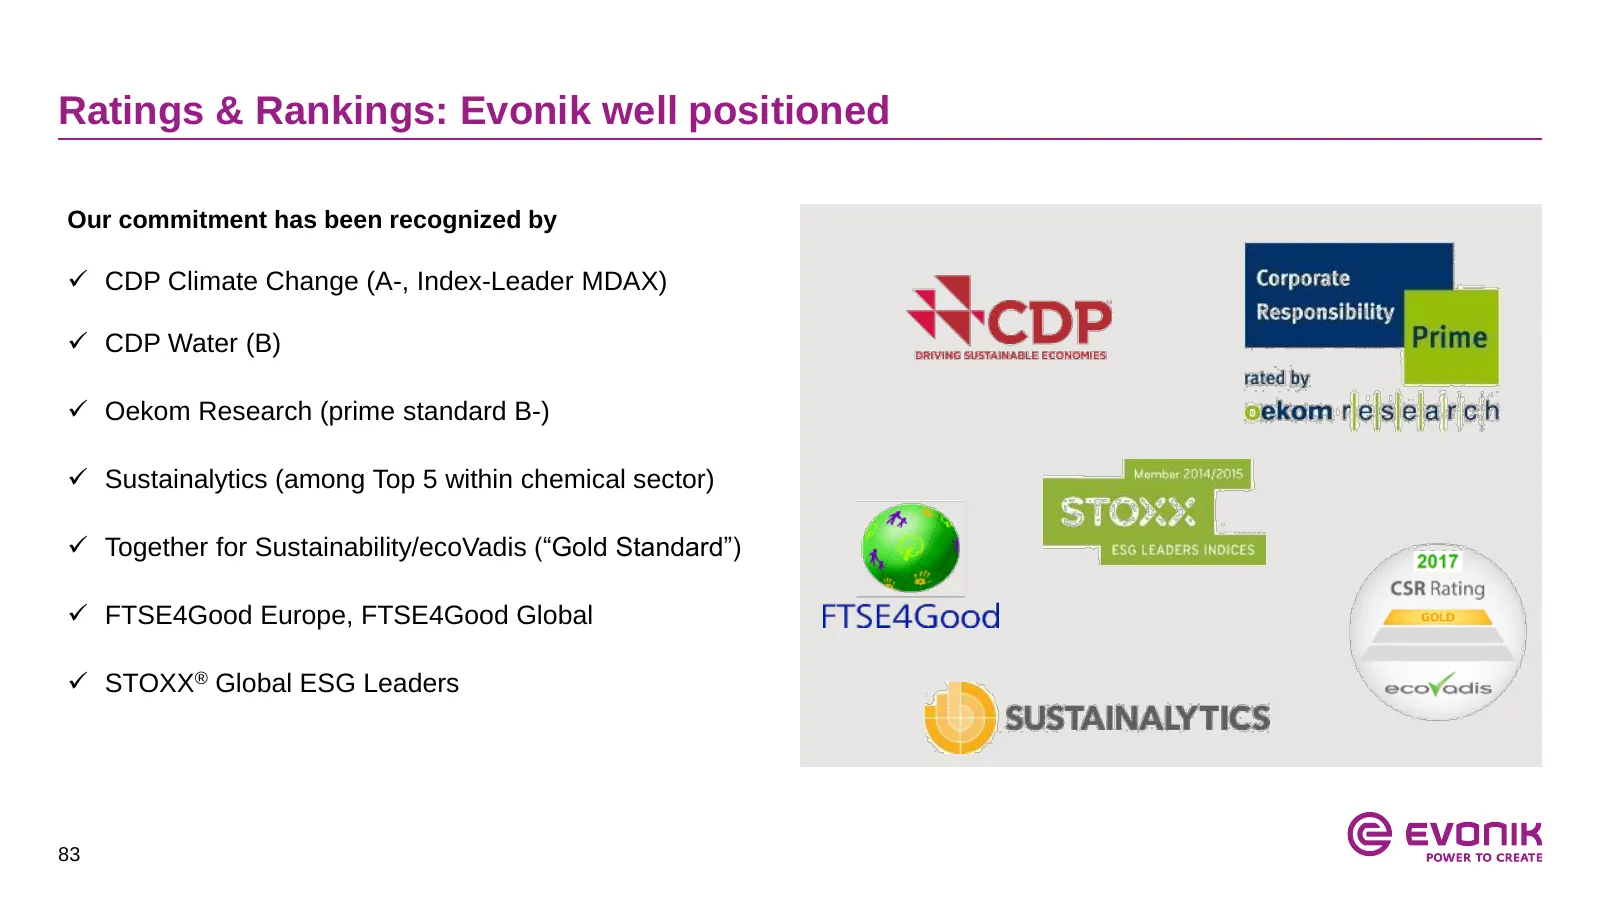
Slide 83: Ratings & Rankings: Evonik well positioned
Ratings & Rankings: Evonik well positioned Our commitment has been recognized by CDP Climate Change (A-, Index-Leader MDAX) CDP Water (B) Oekom Research (prime standard B-) Sustainalytics (among Top 5 within chemical sector) Together for Sustainability/ecoVadis (“Gold Standard”) FTSE4Goo
Slide 84: Appendix
Appendix 1. Strategy 2. Segment overview 3. Financials 4. Upcoming events 84
Slide 85: Capital Markets Day
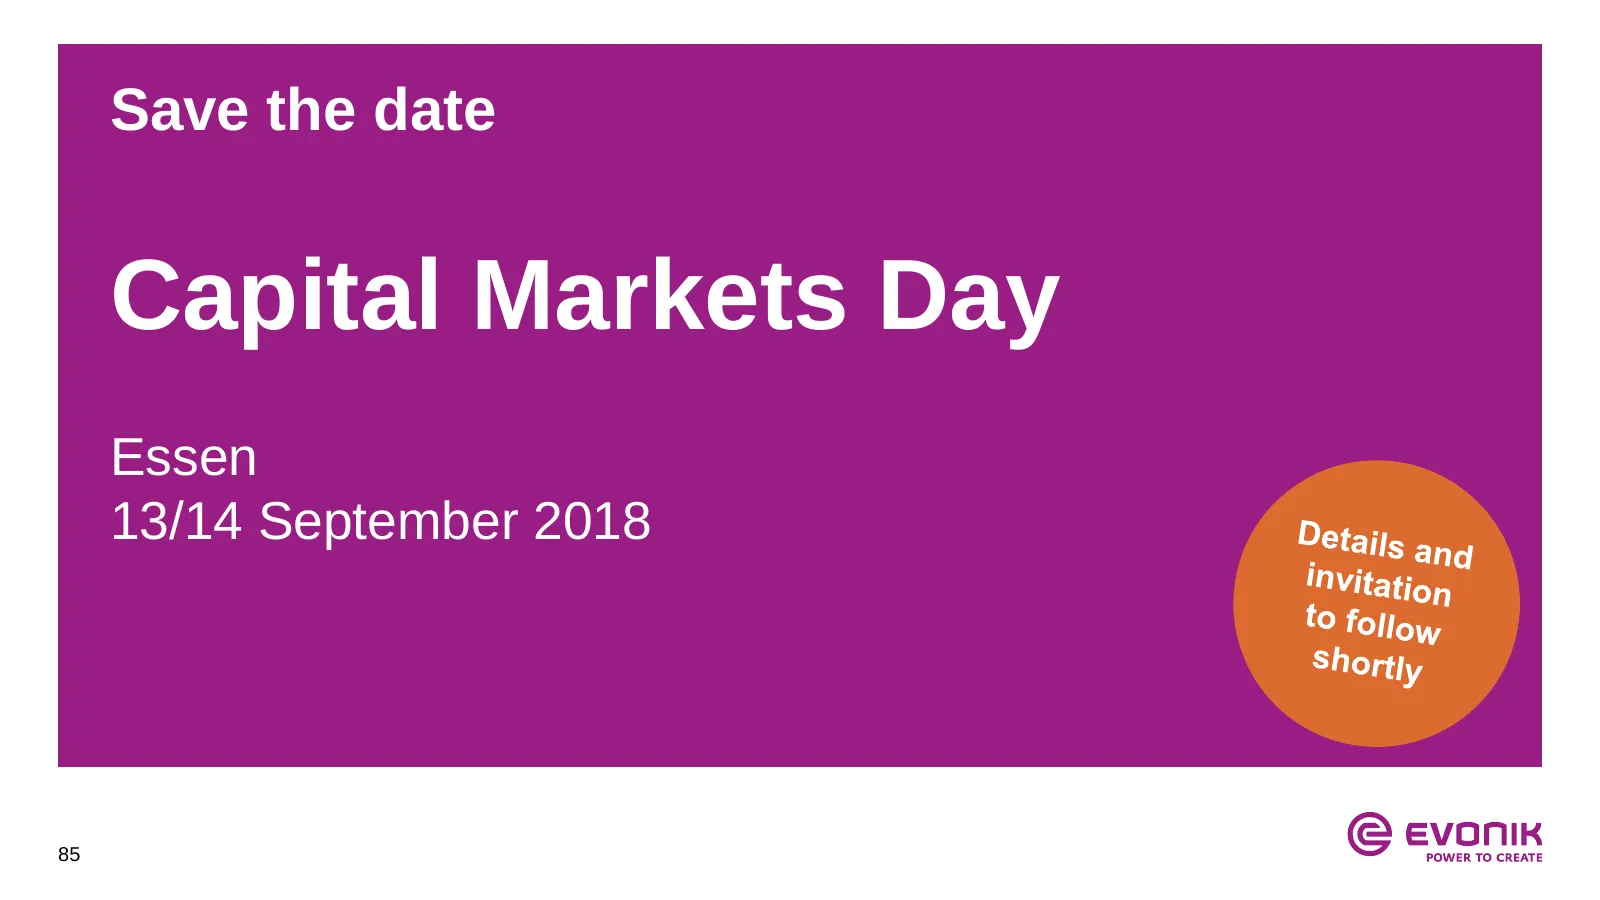
Save the date Capital Markets Day Essen 13/14 September 2018 85
Slide 86: Upcoming IR events
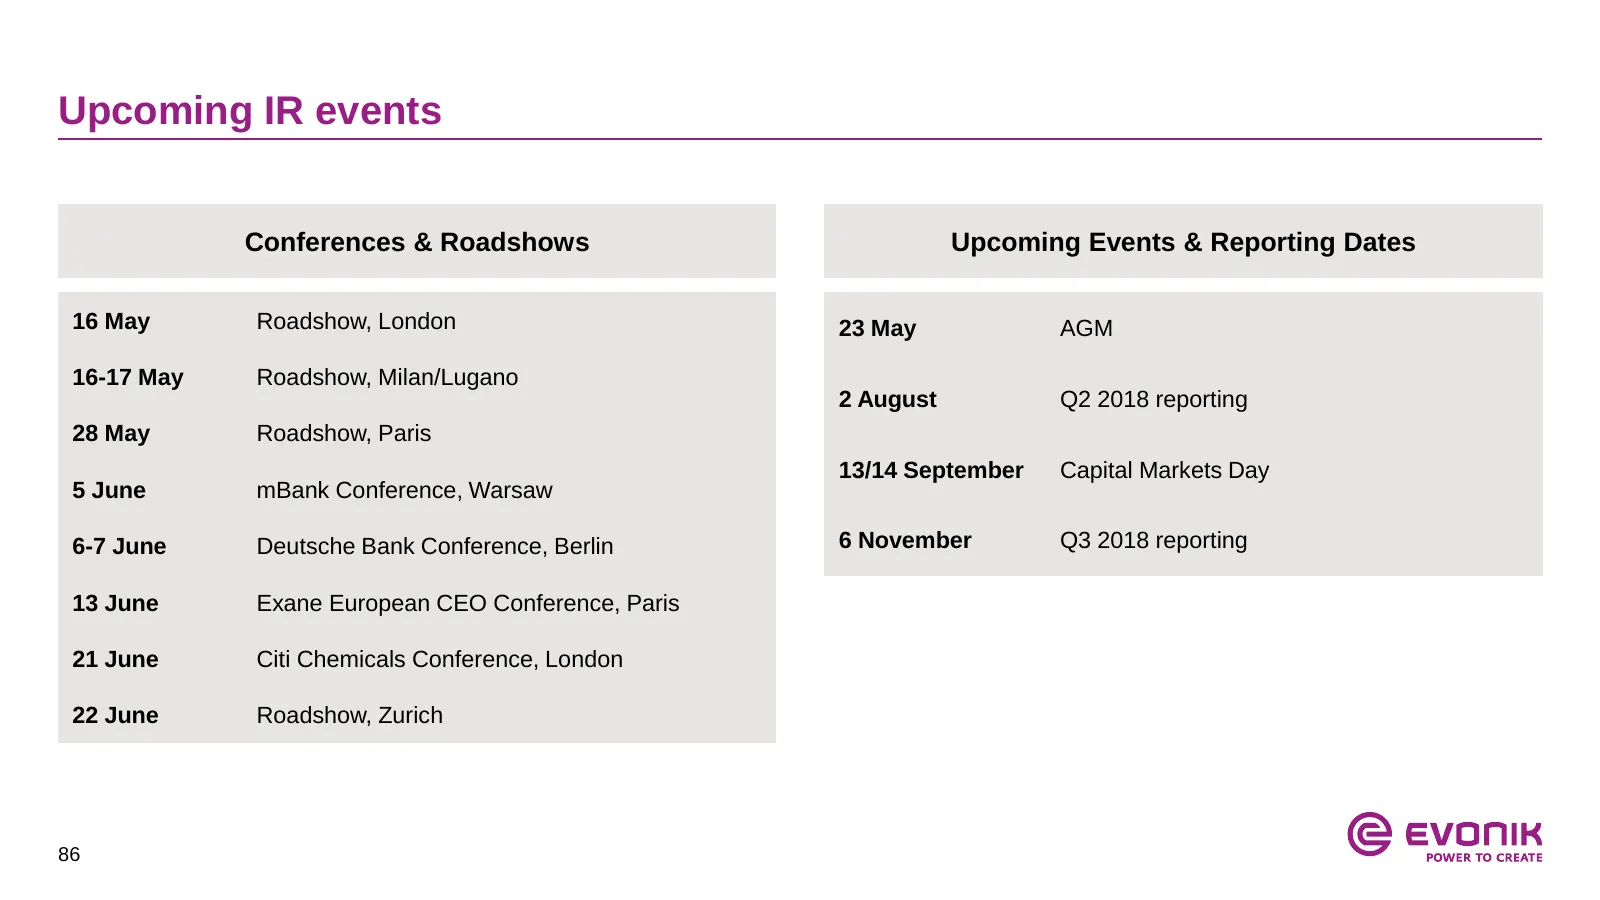
Upcoming IR events Conferences & Roadshows Upcoming Events & Reporting Dates 16 May Roadshow, London 23 May AGM 16-17 May Roadshow, Milan/Lugano 2 August Q2 2018 reporting 28 May Roadshow, Paris 13/14 September Capital Markets Day 5 June mBank Conference, Warsaw 6-7 June Deutsche Bank Conference, Be
Slide 87: Evonik Investor Relations team
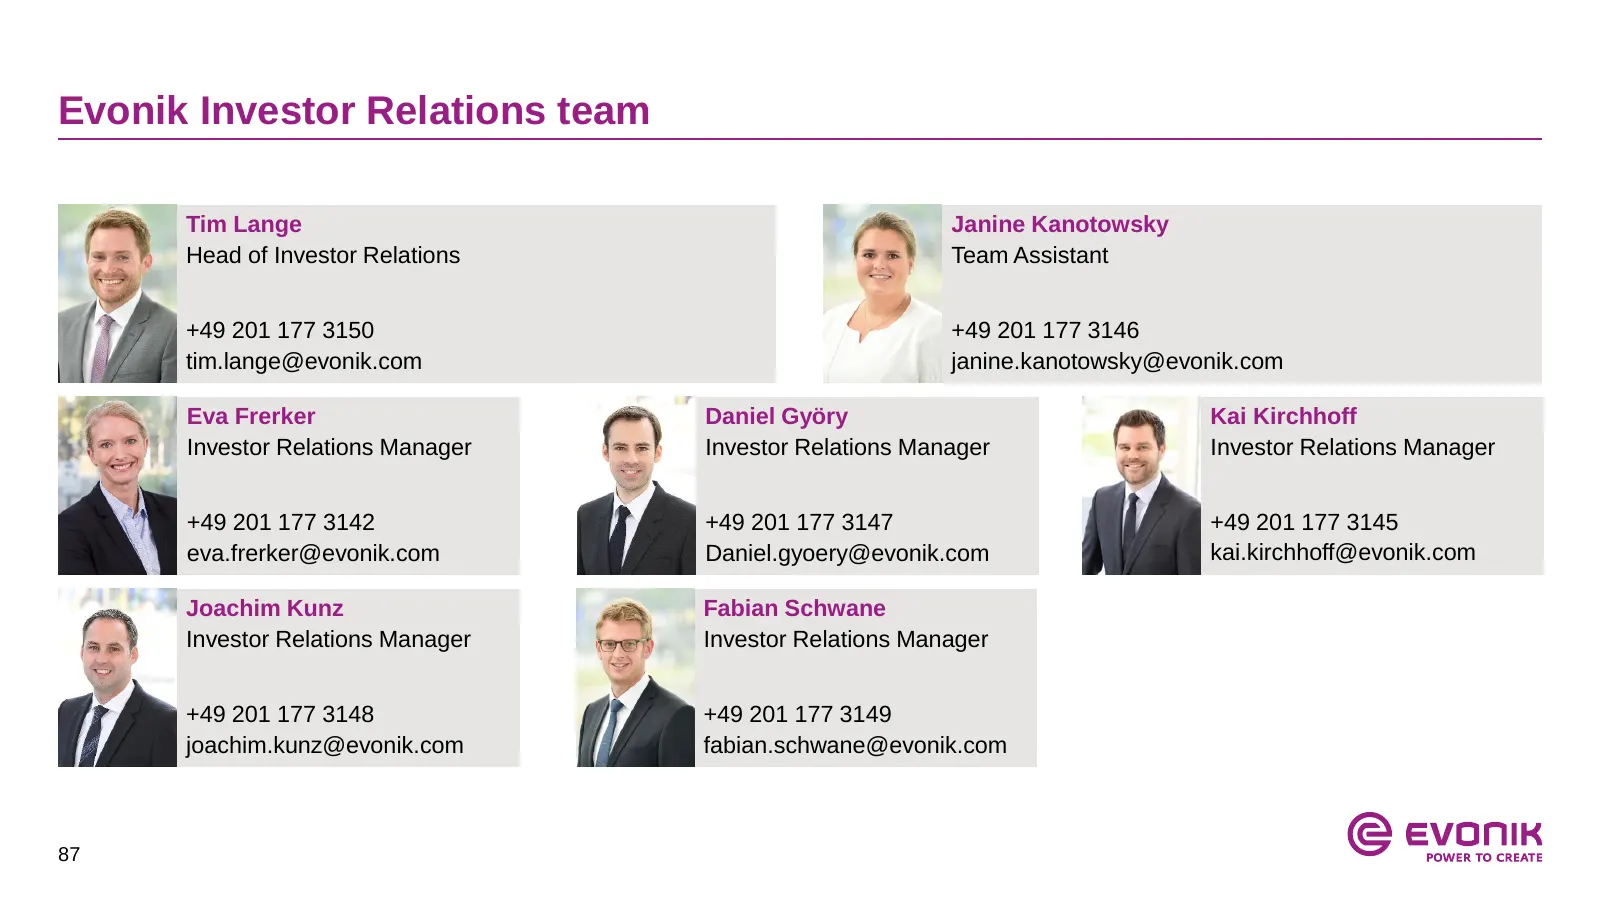
Evonik Investor Relations team Tim Lange Janine Kanotowsky Head of Investor Relations Team Assistant +49 201 177 3150 +49 201 177 3146 tim.lange@evonik.com janine.kanotowsky@evonik.com Eva Frerker Daniel Györy Kai Kirchhoff Investor Relations Manager Investor Relations Manager Investor Relations Man
Slide 88: Disclaimer
Disclaimer In so far as forecasts or expectations are expressed in this presentation or where our statements concern the future, these forecasts, expectations or statements may involve known or unknown risks and uncertainties. Actual results or developments may vary, depending on changes in the oper
Slide 89: © evonik
© evonik
Source: Internet Archive copy of corporate.evonik.de
More decks from Evonik Industries AG
 Q3 2026 Earnings Presentation34 slides · Nov 3, 2026
 Q2 2026 Earnings Presentation27 slides · Aug 4, 2026
 Q2 2026 Earnings Presentation39 slides · August 2026
 Q1 2026 Earnings Presentation26 slides · May 8, 2026
 Q4 2025 Earnings Presentation44 slides · Feb 5, 2026
 Q3 2025 Earnings Presentation35 slides · Nov 4, 2025