SLM Corporation · NASDAQ:SLM
SLM — Sallie Mae — Investor Day (December 2025)
34 slides from SLM's investor day presentation, Dec 8, 2025

Slide 1: Sallie Mae Investor Forum
Sallie Mae Investor Forum December 8, 2025 © 2025 Sallie Mae Bank. All rights reserved. 1

Slide 2: Cautionary Note and Disclaimer Regarding Forward-Looking Statements
CAUTIONARY NOTE AND DISCLAIMER REGARDING FORWARD-LOOKING STATEMENTS This Presentation of SLM Corporation (the “Company”) includes forward-looking statements within the meaning of the Securities Act of 1933, as amended, the Securities Exchange Act of 1934, as amended, and the Private Securities Litig
Slide 3: Sallie Mae is a Unique Franchise
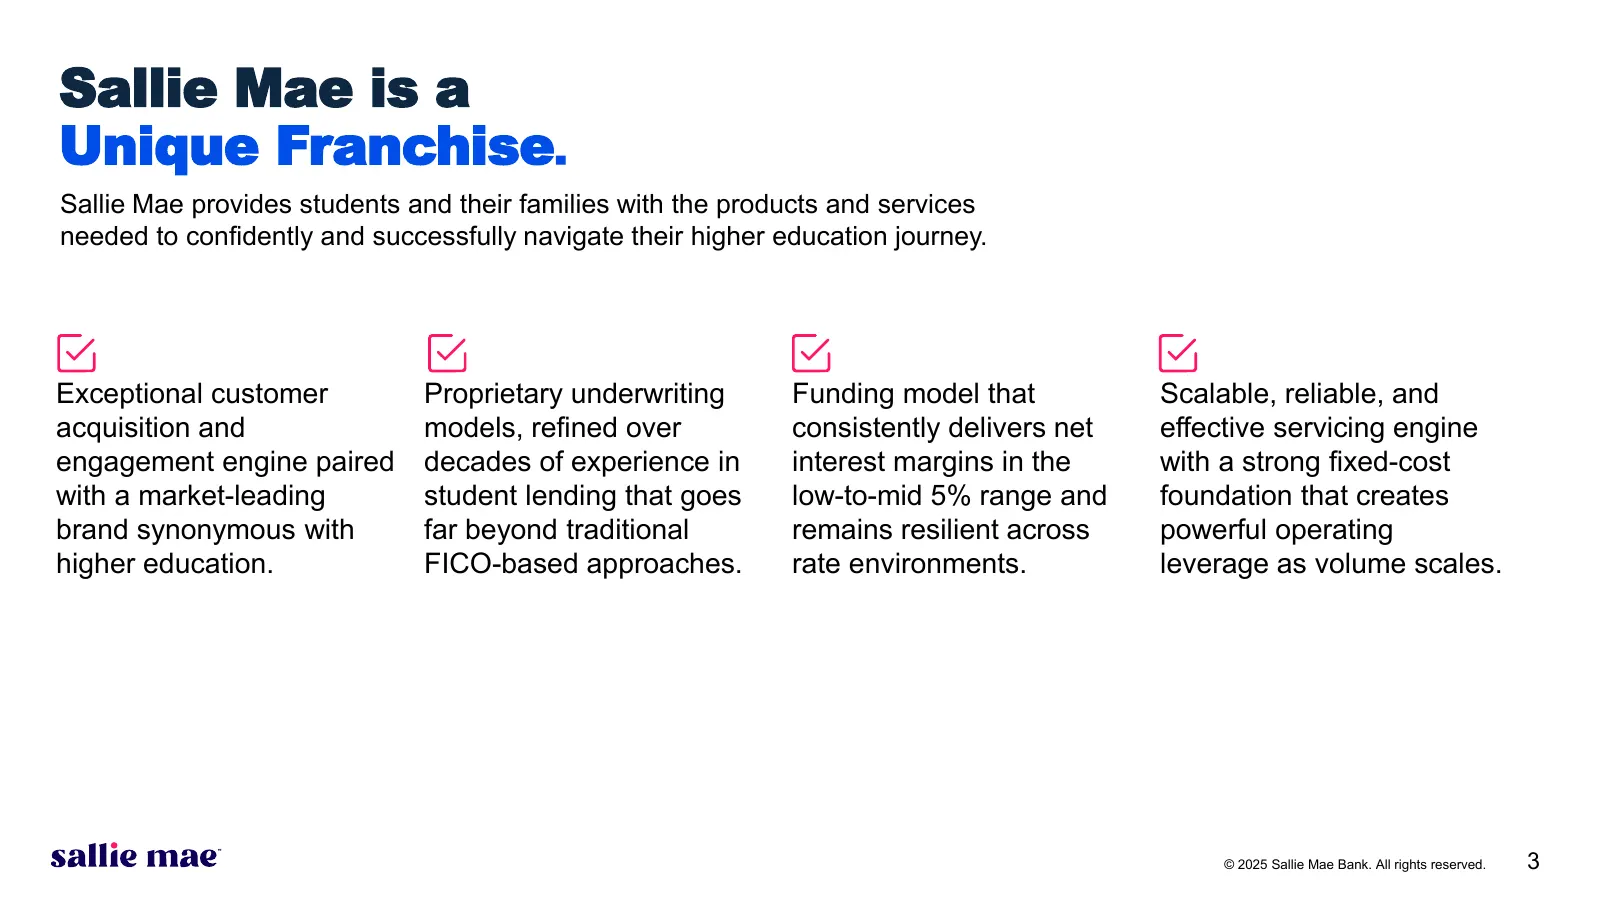
Sallie Mae is a Unique Franchise. Sallie Mae provides students and their families with the products and services needed to confidently and successfully navigate their higher education journey. Exceptional customer Proprietary underwriting Funding model that Scalable, reliable, and acquisition and mo
Slide 4: Two years ago, we outlined our strategy for returning to balance sheet growth
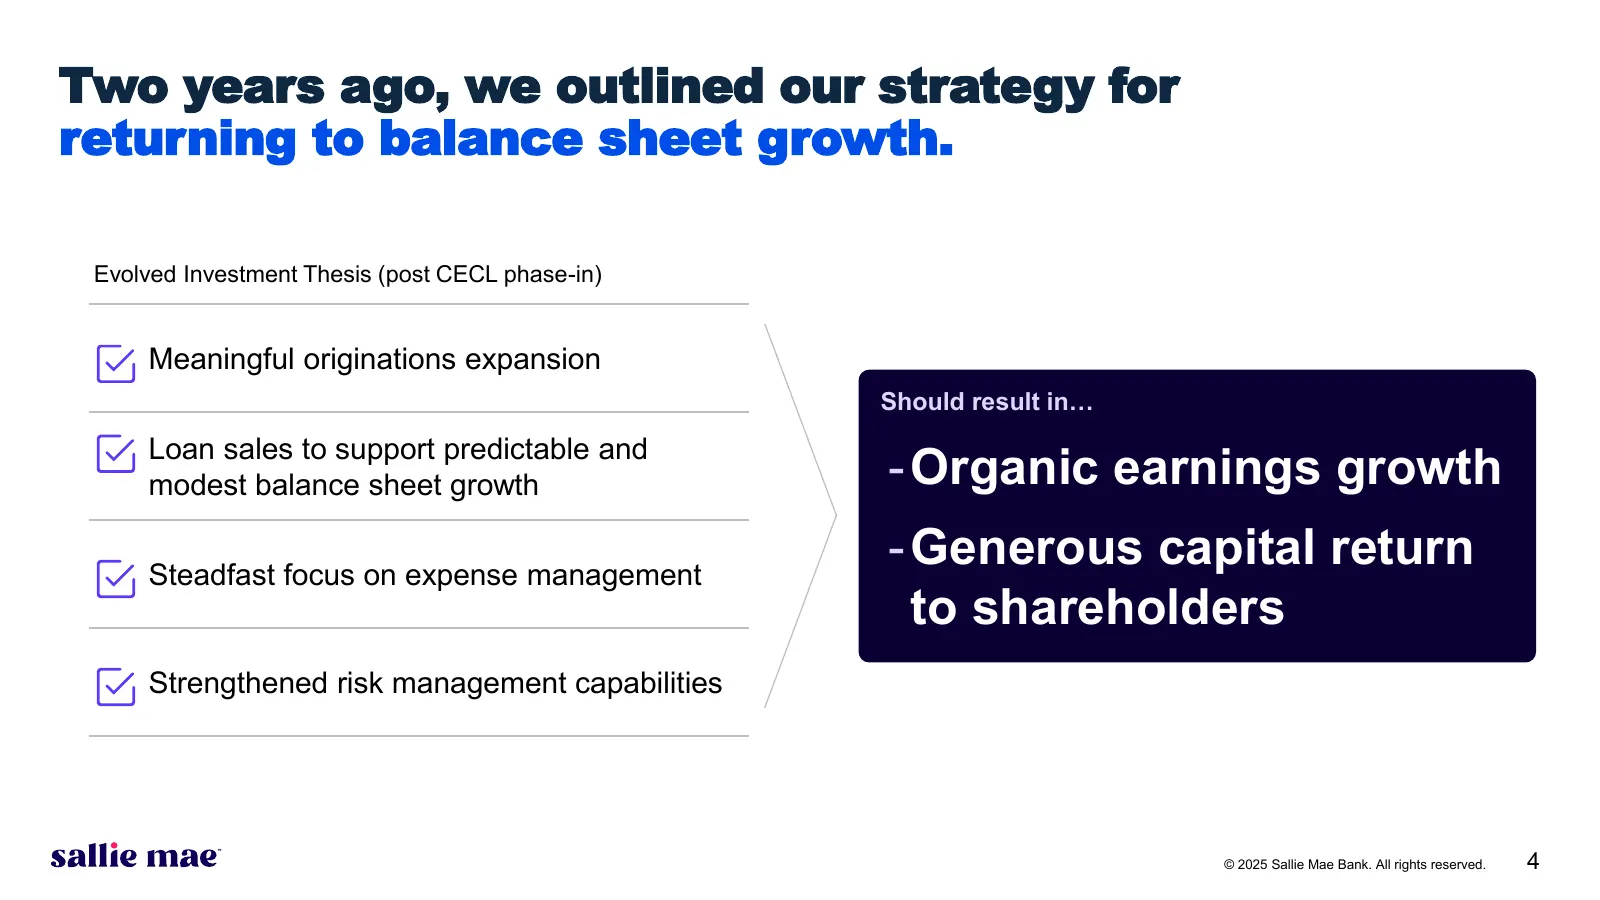
Two years ago, we outlined our strategy for returning to balance sheet growth. Evolved Investment Thesis (post CECL phase-in) Meaningful originations expansion Should result in… Loan sales to support predictable and modest balance sheet growth - Organic earnings growth Steadfast focus on expense man
Slide 5: We have strengthened our franchise as a market-leading private student loan lender
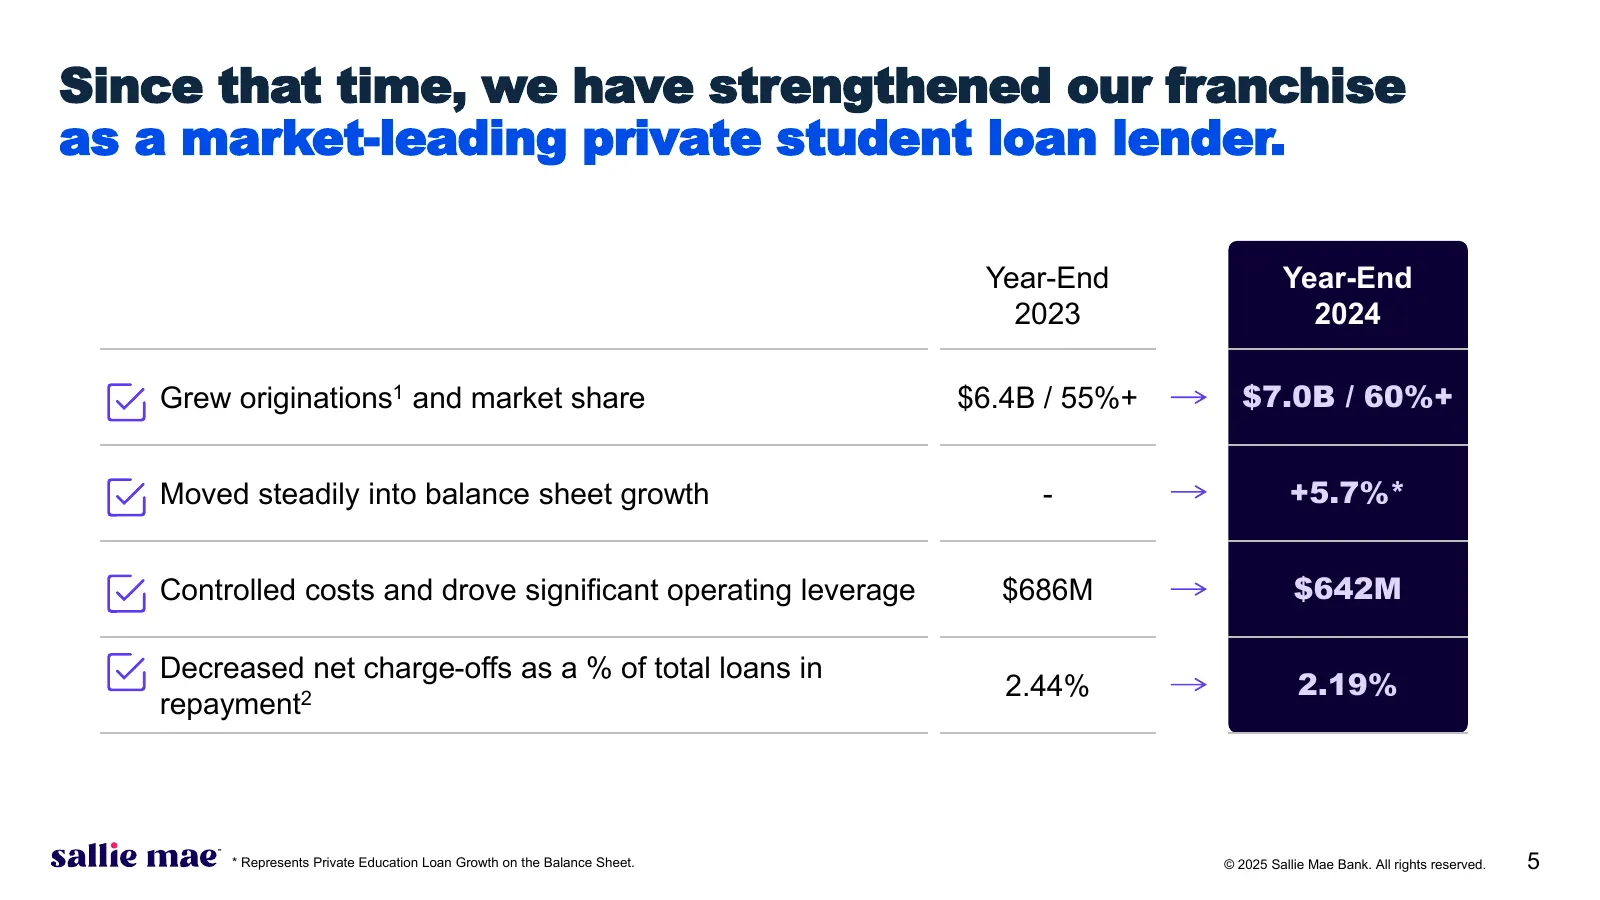
Since that time, we have strengthened our franchise as a market-leading private student loan lender. Year-End Year-End 2023 2024 Grew originations1 and market share $6.4B / 55%+ $7.0B / 60%+ Moved steadily into balance sheet growth - +5.7%* Controlled costs and drove significant operating leverage $
Slide 6: Returned a significant amount of capital through dividends and share repurchases
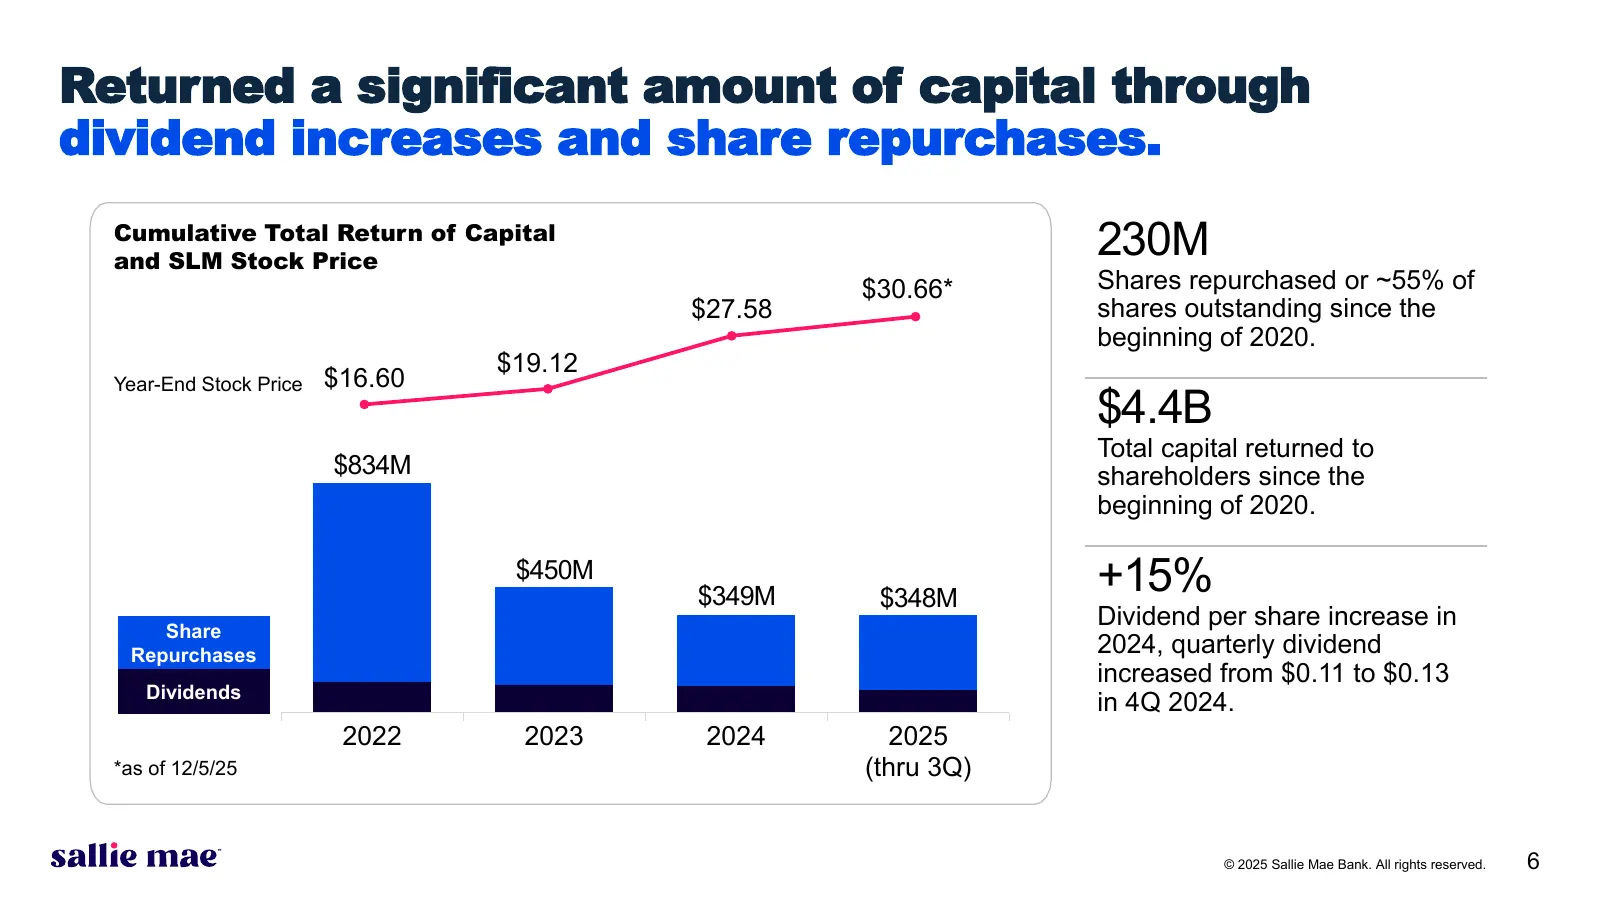
Returned a significant amount of capital through dividend increases and share repurchases. Cumulative Total Return of Capital and SLM Stock Price 230M $30.66* Shares repurchased or ~55% of $27.58 shares outstanding since the beginning of 2020. $19.12 Year-End Stock Price $16.60 $4.4B Total capital r
Slide 7: Underwriting enhancements have reduced credit risk and earnings volatility
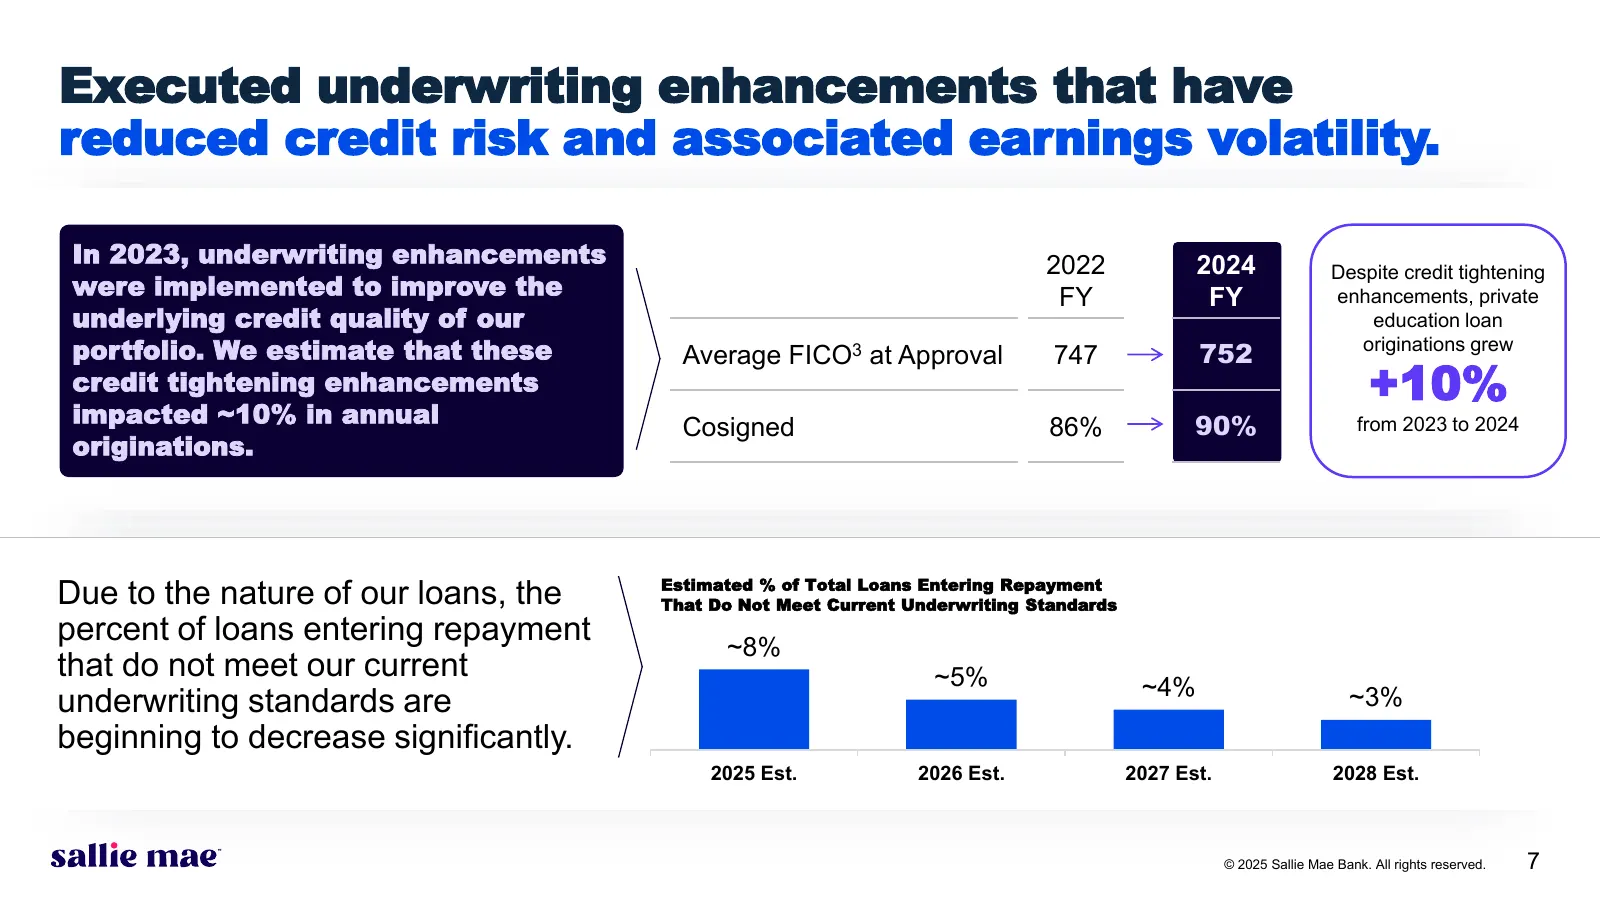
Executed underwriting enhancements that have reduced credit risk and associated earnings volatility. In 2023, underwriting enhancements 2022 2024 Despite credit tightening were implemented to improve the FY FY enhancements, private underlying credit quality of our education loan portfolio. We estima
Slide 8: Proven track record of meeting commitments, reflected in TSR
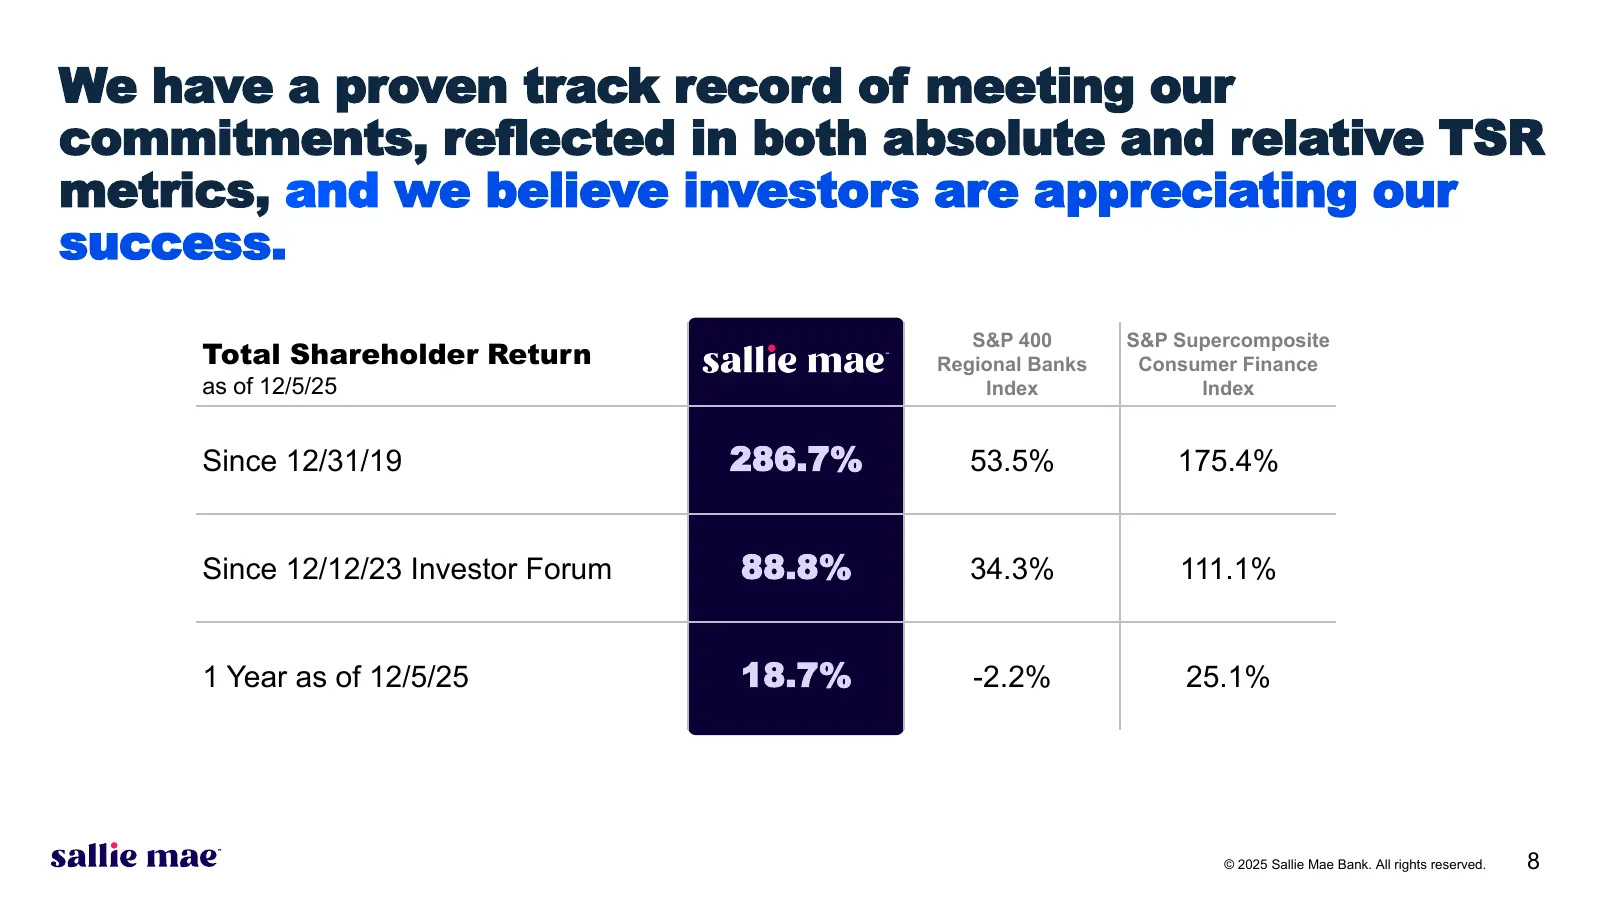
We have a proven track record of meeting our commitments, reflected in both absolute and relative TSR metrics, and we believe investors are appreciating our success. S&P 400 S&P Supercomposite Total Shareholder Return Regional Banks Consumer Finance as of 12/5/25 Index Index Since 12/31/19 286.7% 53
Slide 9: Meaningful developments are evolving our strategy
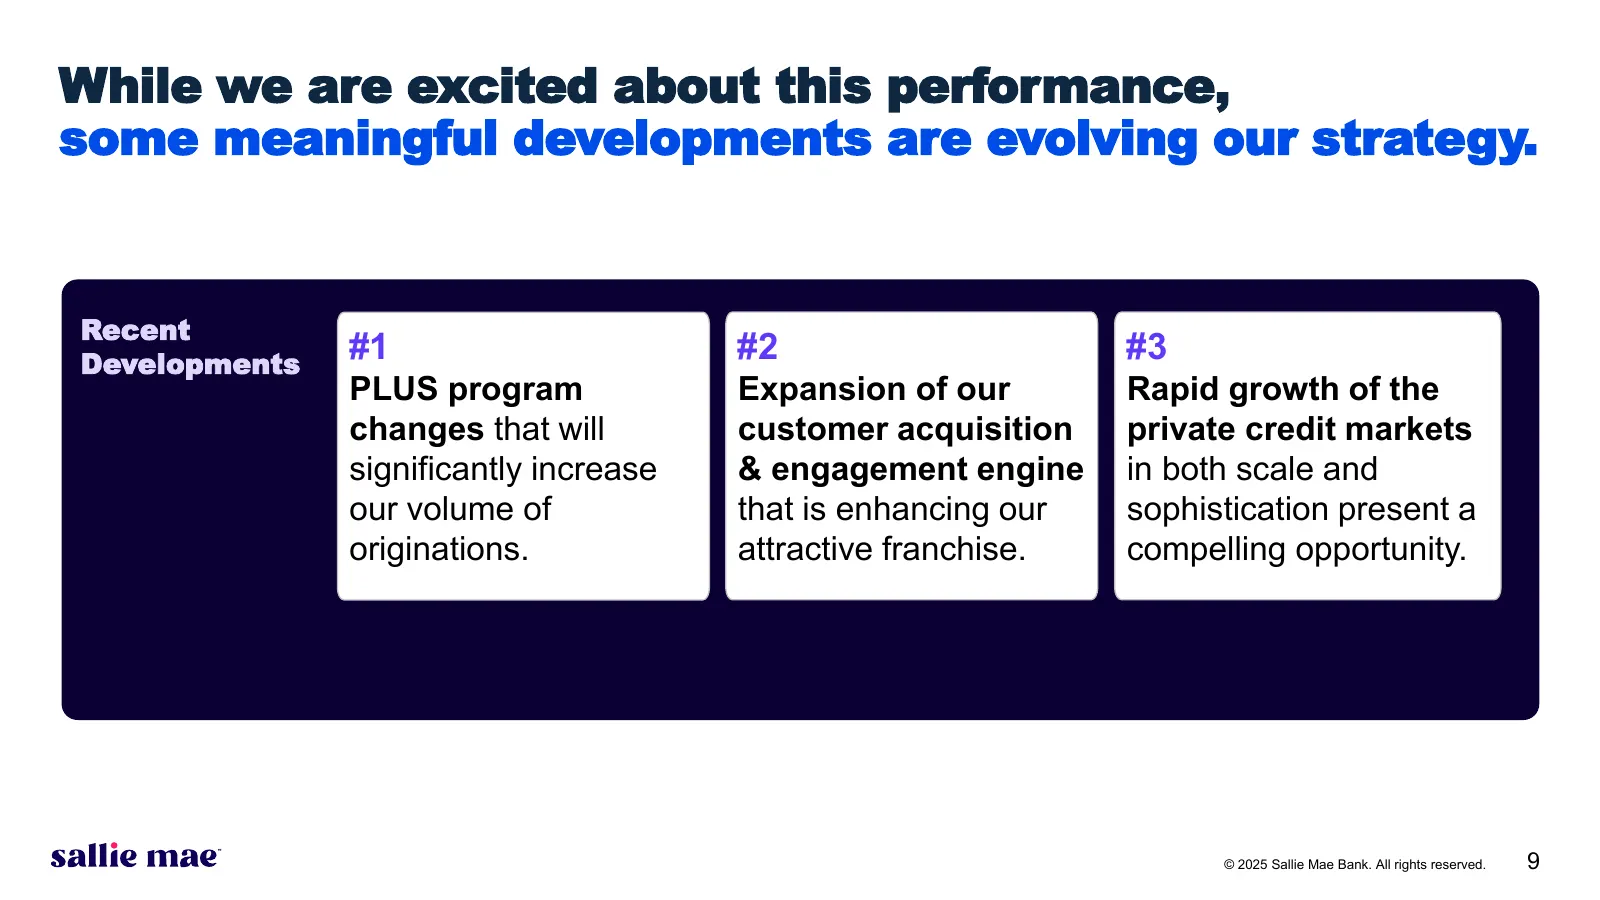
While we are excited about this performance, some meaningful developments are evolving our strategy. Recent Developments #1 #2 #3 PLUS program Expansion of our Rapid growth of the changes that will customer acquisition private credit markets significantly increase & engagement engine in both scale a
Slide 10: PLUS Program Changes
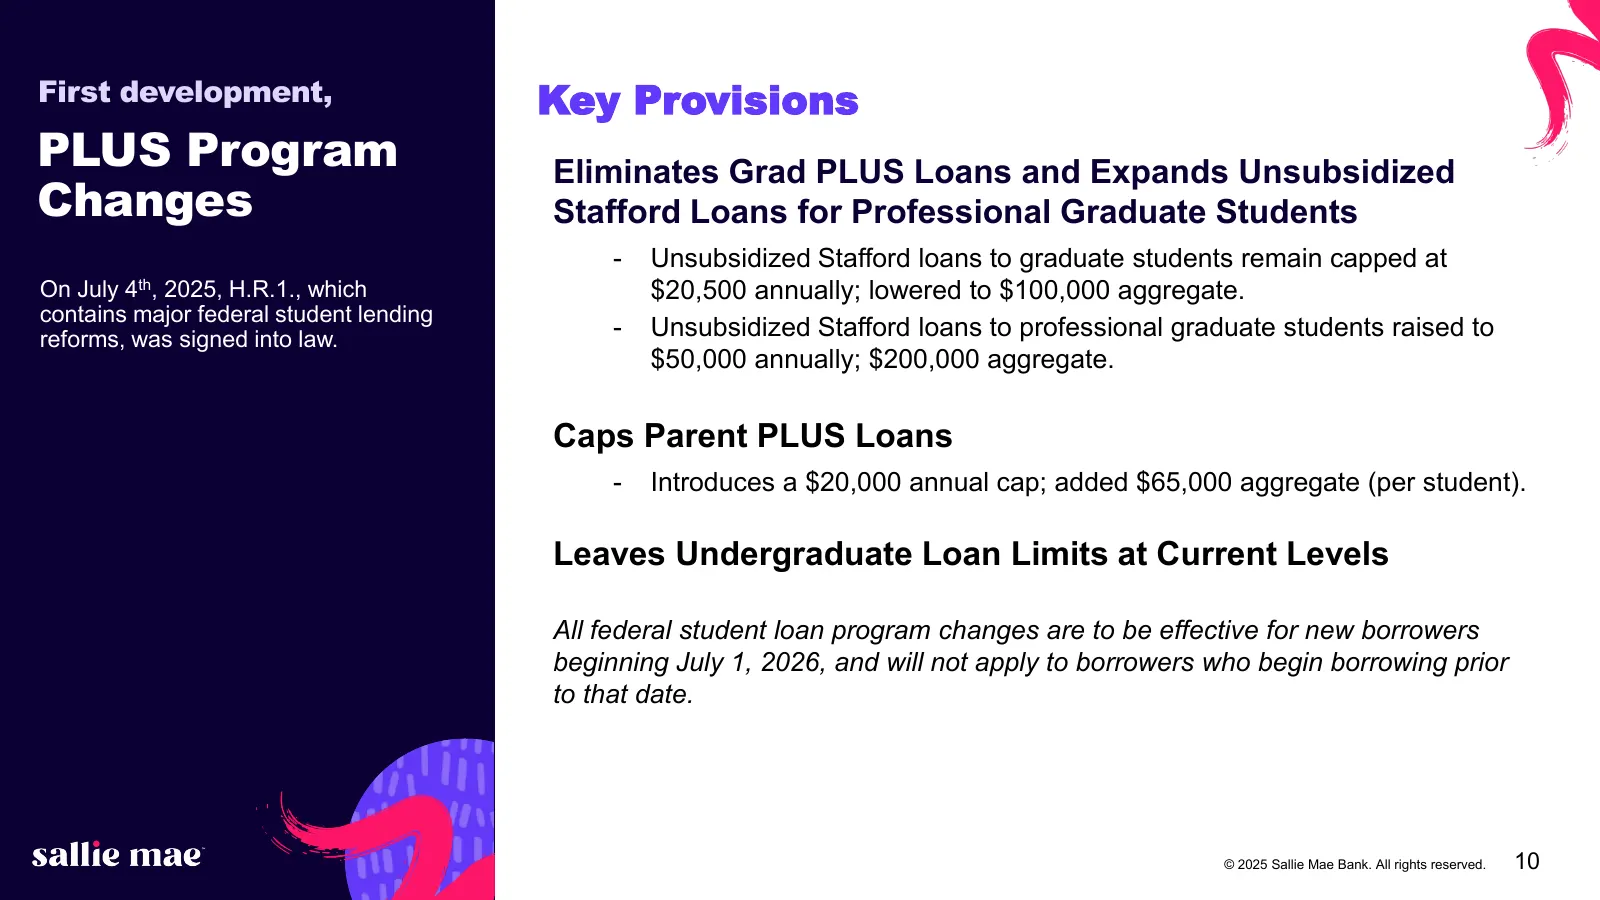
First development, Key Provisions PLUS Program Eliminates Grad PLUS Loans and Expands Unsubsidized Changes Stafford Loans for Professional Graduate Students - Unsubsidized Stafford loans to graduate students remain capped at On July 4th, 2025, H.R.1., which $20,500 annually; lowered to $100,000 aggr
Slide 11: These changes bring significant opportunity
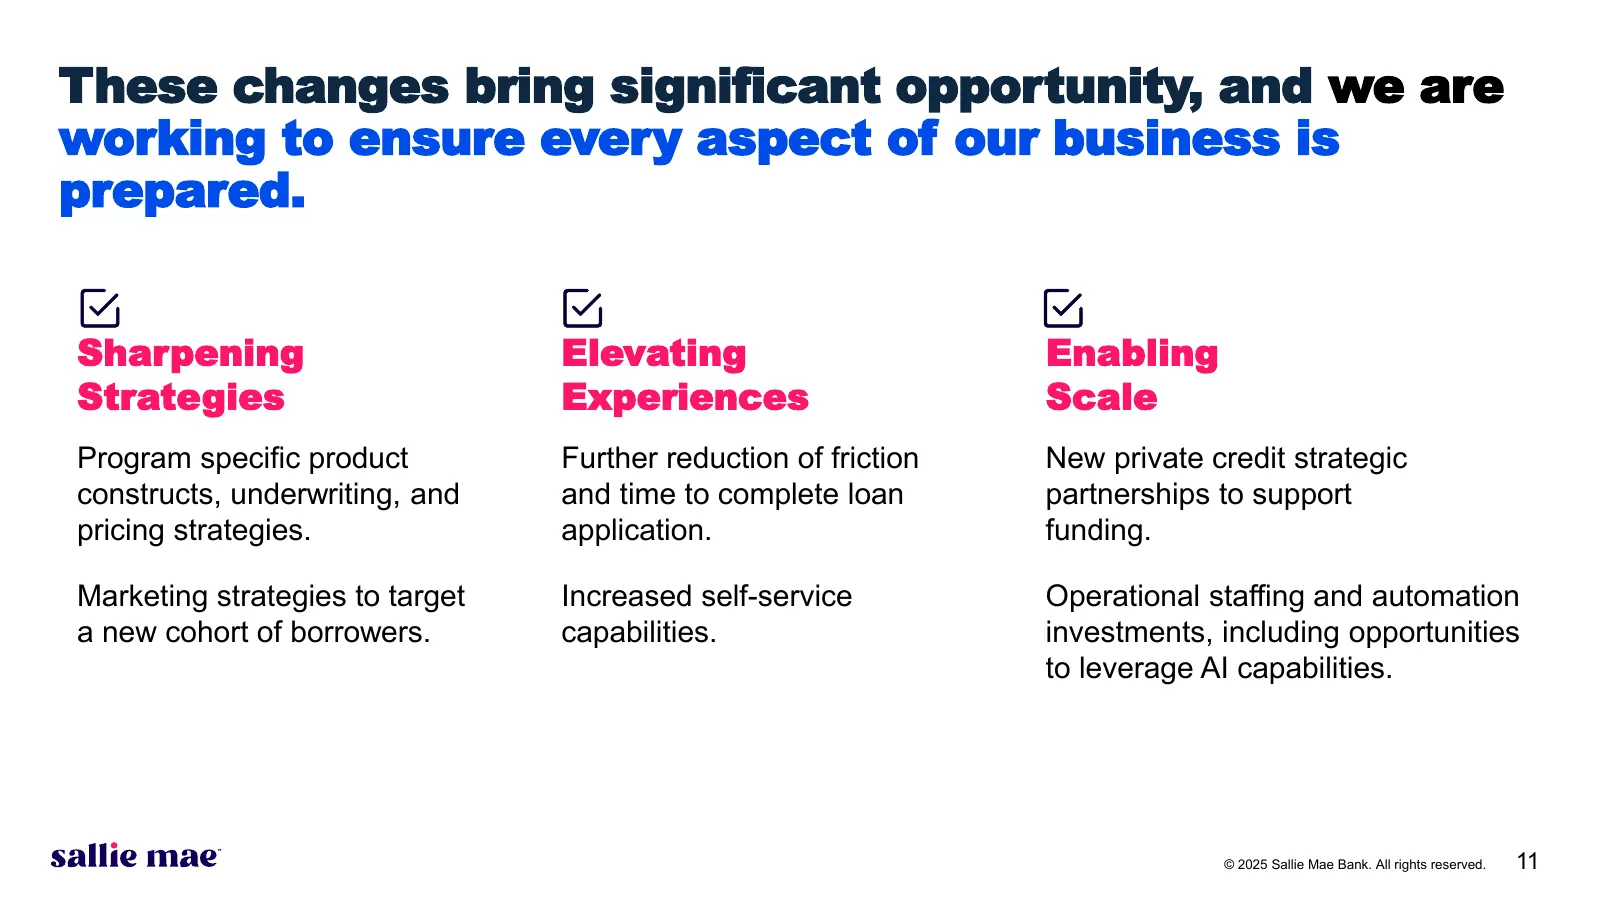
These changes bring significant opportunity, and we are working to ensure every aspect of our business is prepared. Sharpening Elevating Enabling Strategies Experiences Scale Program specific product Further reduction of friction New private credit strategic constructs, underwriting, and and time to
Slide 12: We anticipate an additional $4.5 to $5B in originations
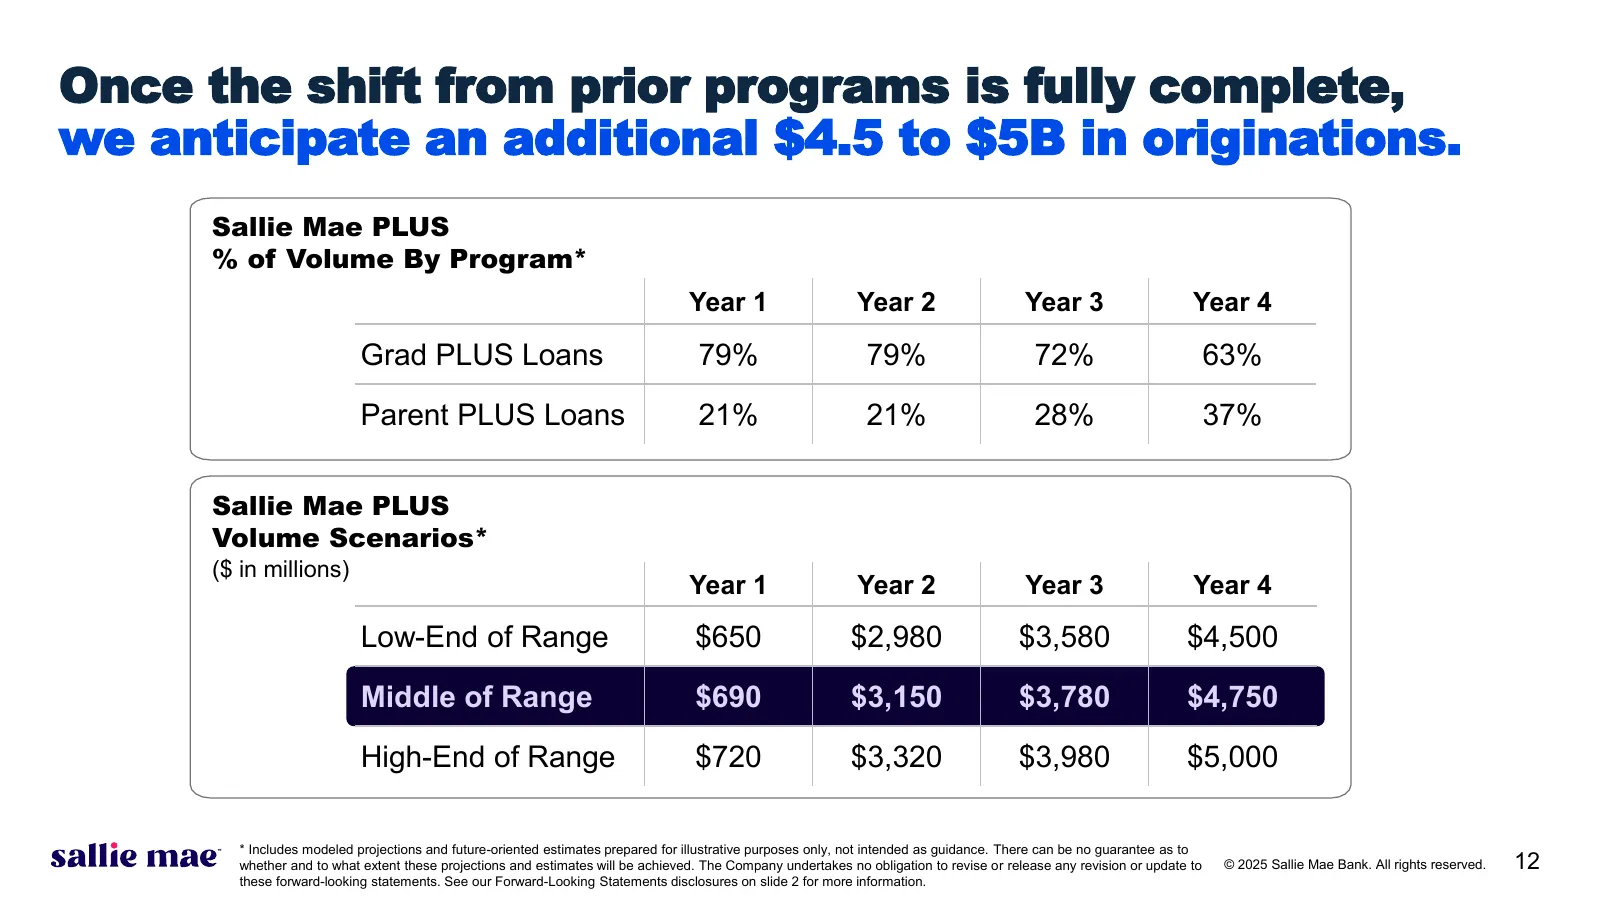
Once the shift from prior programs is fully complete, we anticipate an additional $4.5 to $5B in originations. Sallie Mae PLUS % of Volume By Program* Year 1 Year 2 Year 3 Year 4 Grad PLUS Loans 79% 79% 72% 63% Parent PLUS Loans 21% 21% 28% 37% Sallie Mae PLUS Volume Scenarios* ($ in millions) Year
Slide 13: Expansion of Our Customer Acquisition & Engagement Engine
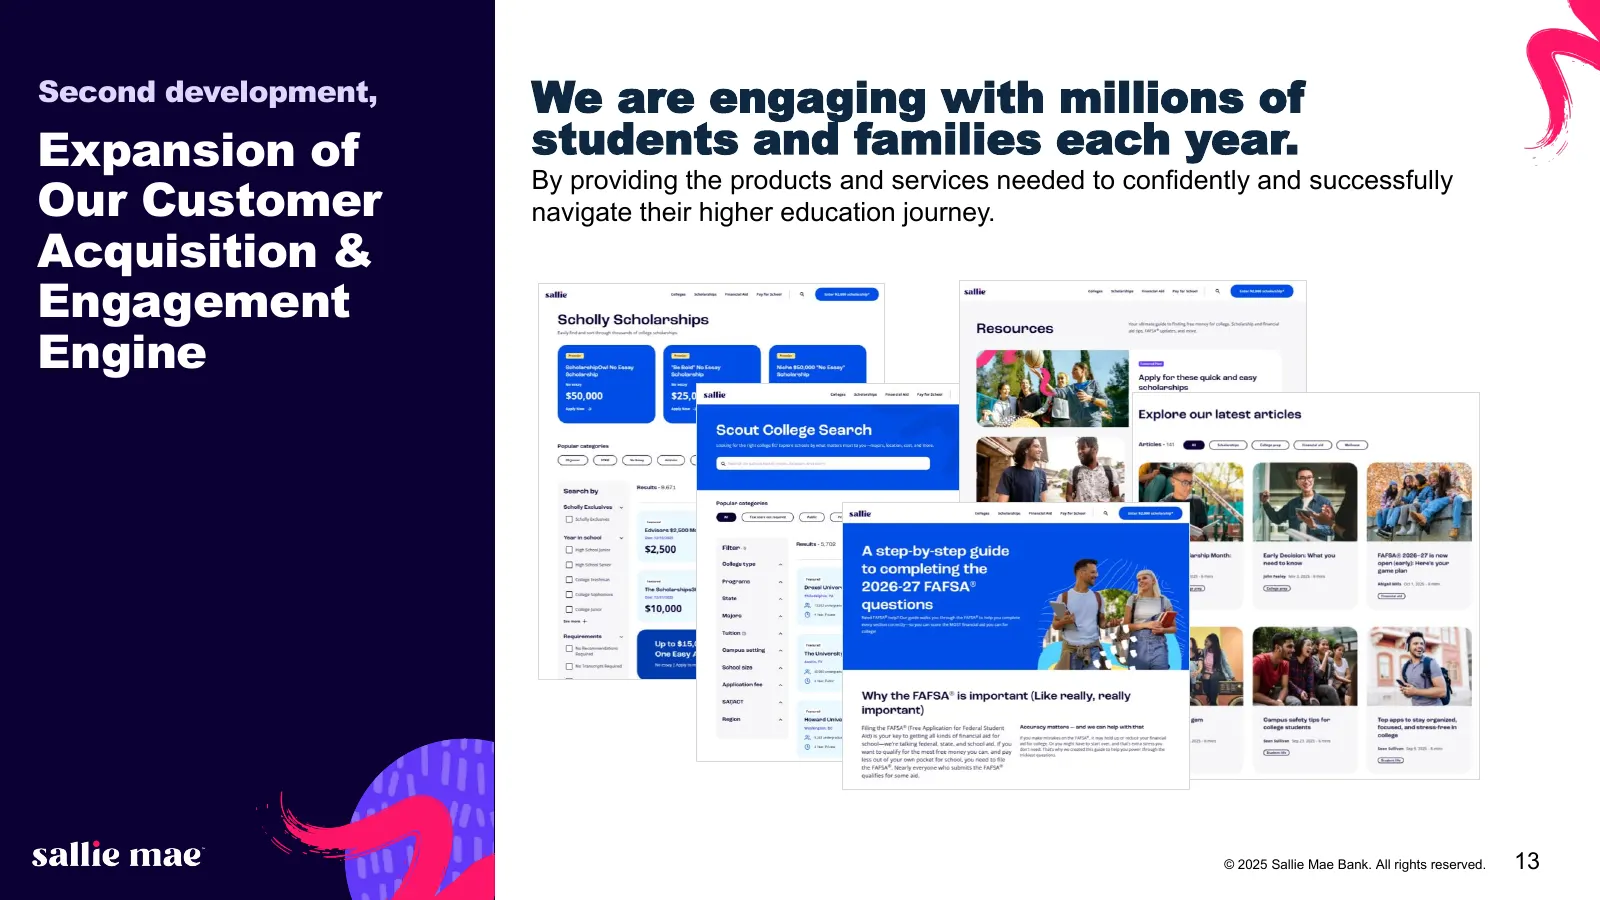
Second development, We are engaging with millions of Expansion of students and families each year. Our Customer By providing the products and services needed to confidently and successfully navigate their higher education journey. Acquisition & Engagement Engine © 2025 Sallie Mae Bank. All rights re
Slide 14: We have significantly expanded these relationships
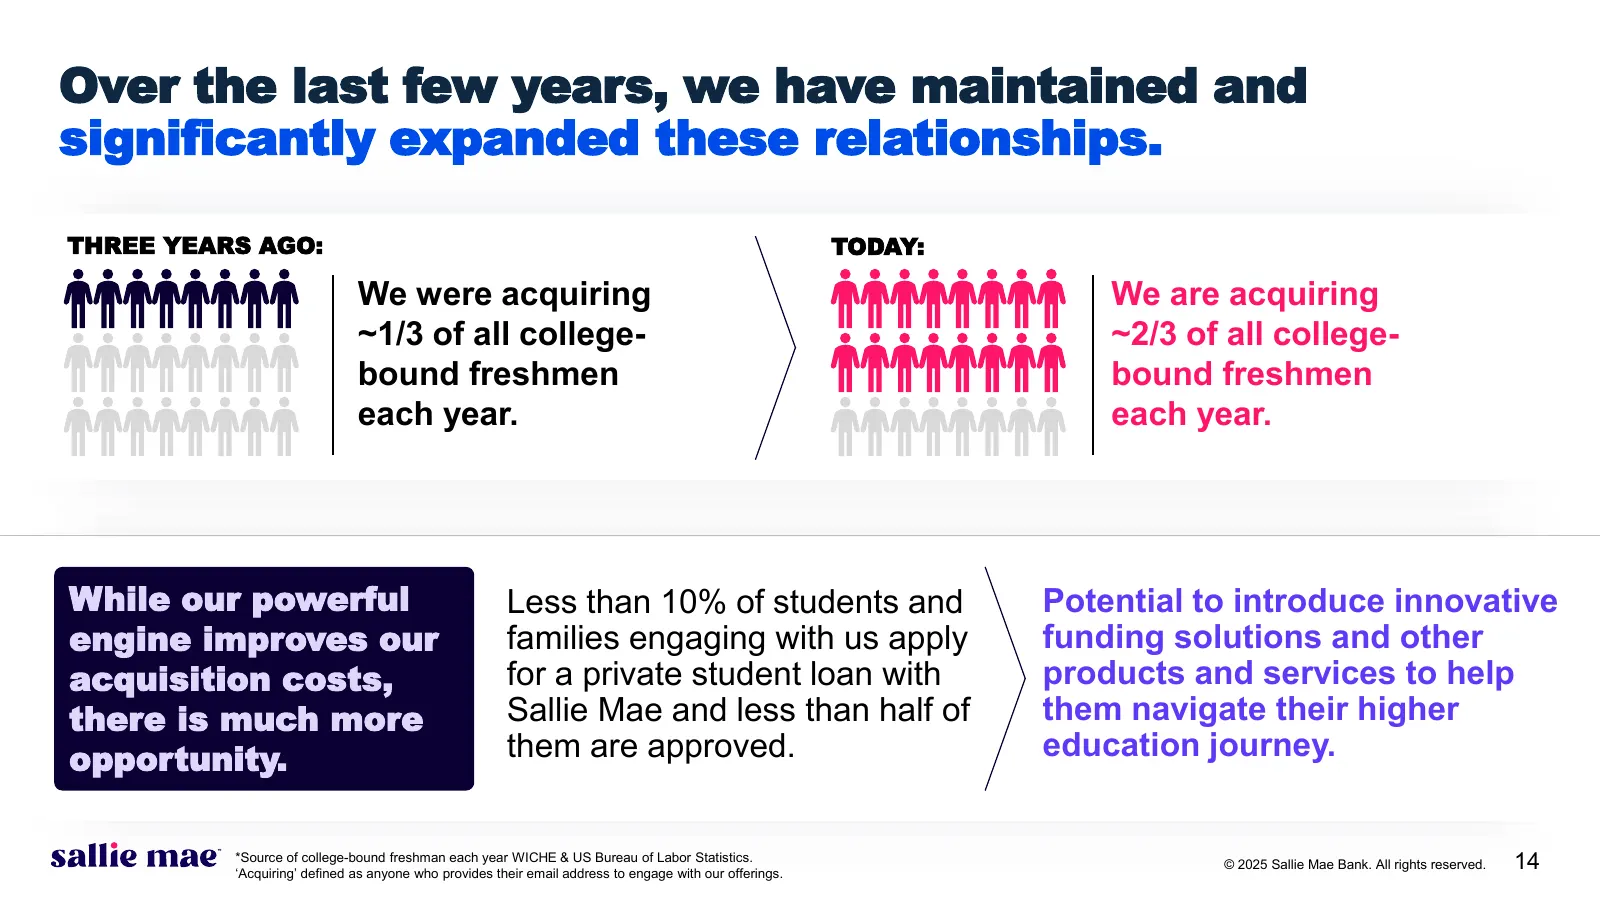
Over the last few years, we have maintained and significantly expanded these relationships. THREE YEARS AGO: TODAY: We were acquiring We are acquiring ~1/3 of all college- ~2/3 of all college- bound freshmen bound freshmen each year. each year. While our powerful Less than 10% of students and Potent
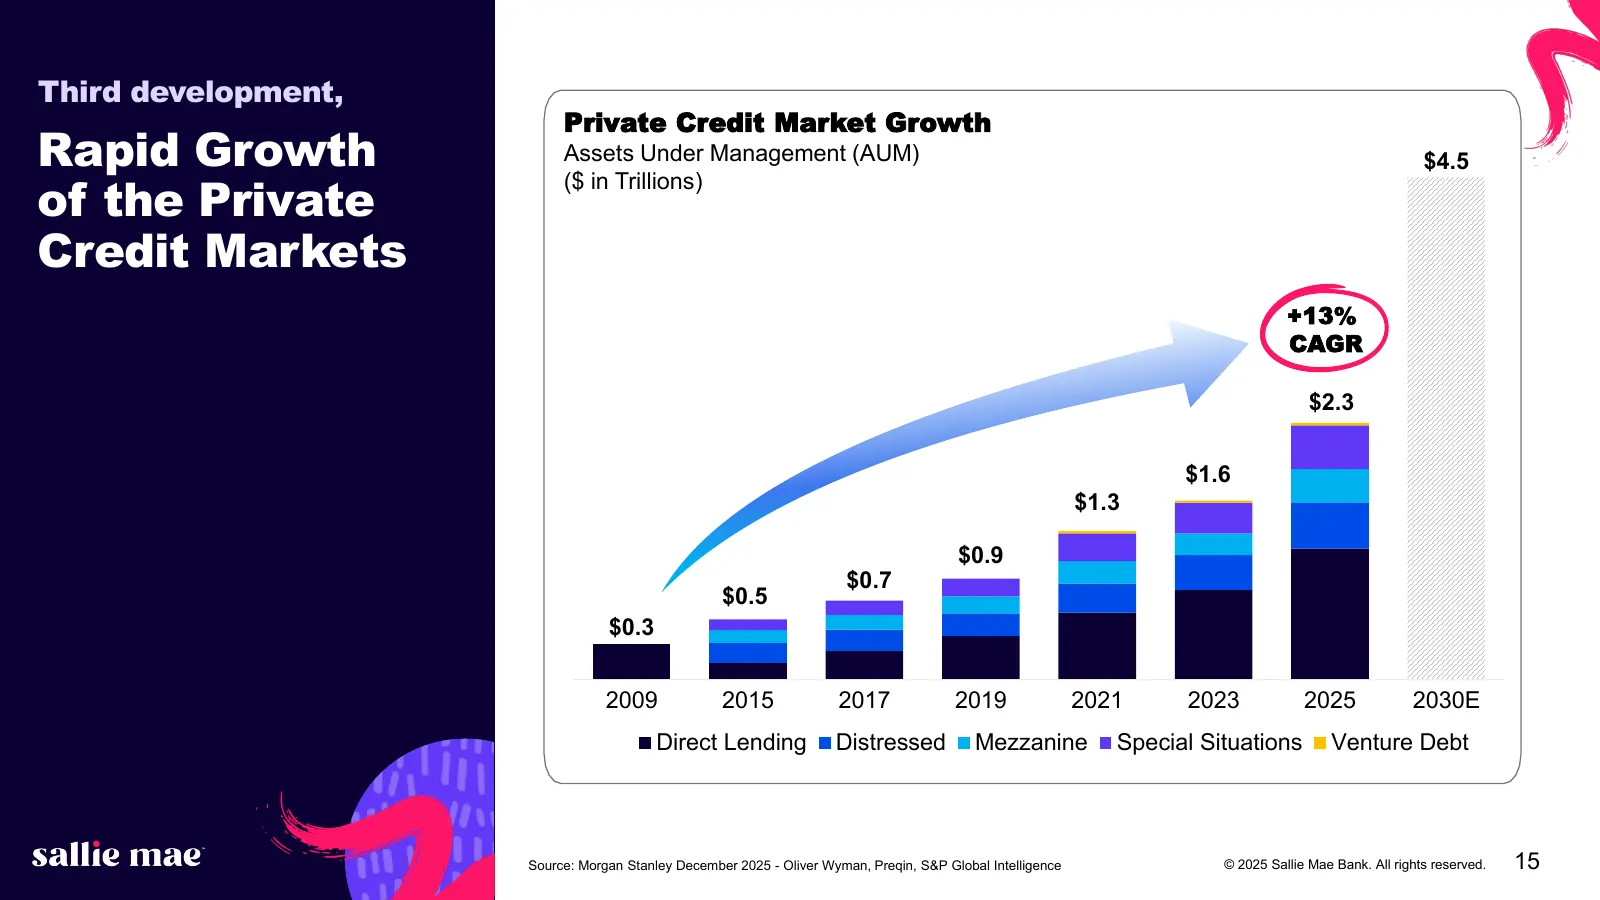
Slide 15: Rapid Growth of the Private Credit Markets
Third development, Private Credit Market Growth Rapid Growth Assets Under Management (AUM) $4.5 of the Private ($ in Trillions) Credit Markets +13% CAGR $2.3 $1.6 $1.3 $0.9 $0.7 $0.5 $0.3 2009 2015 2017 2019 2021 2023 2025 2030E Direct Lending Distressed Mezzanine Special Situations Venture Debt Sou
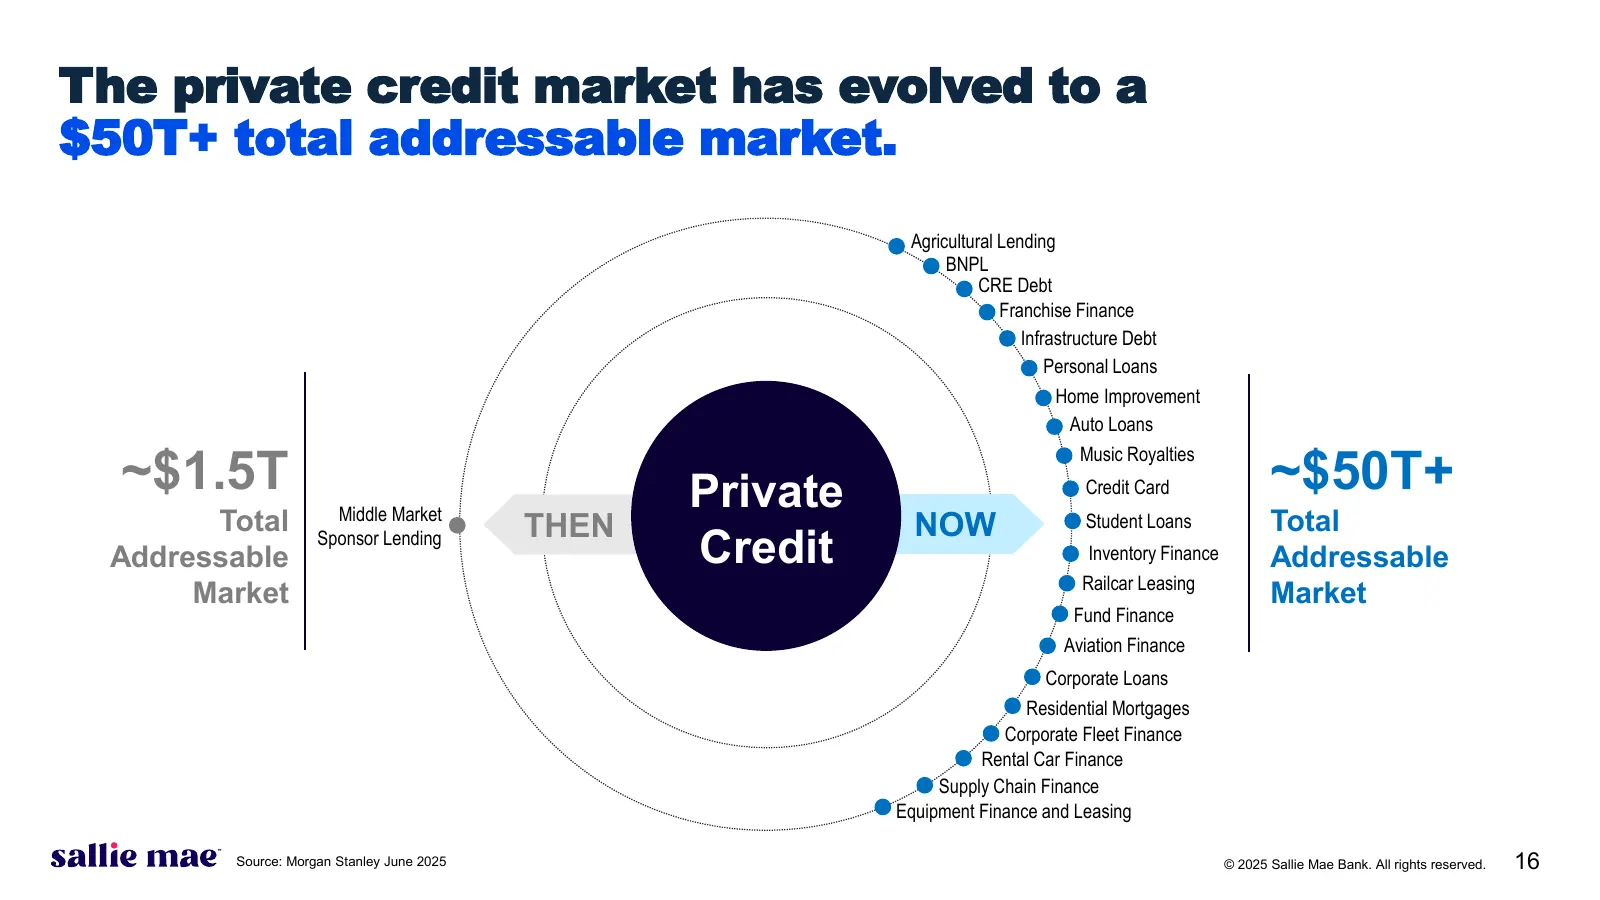
Slide 16: The private credit market has evolved to a $50T+ total addressable market
The private credit market has evolved to a $50T+ total addressable market. Agricultural Lending BNPL CRE Debt Franchise Finance Infrastructure Debt Personal Loans Home Improvement Auto Loans ~$1.5T ~$50T+ Music Royalties Middle Market Private Credit Card Total THEN NOW Student Loans Total Addressabl
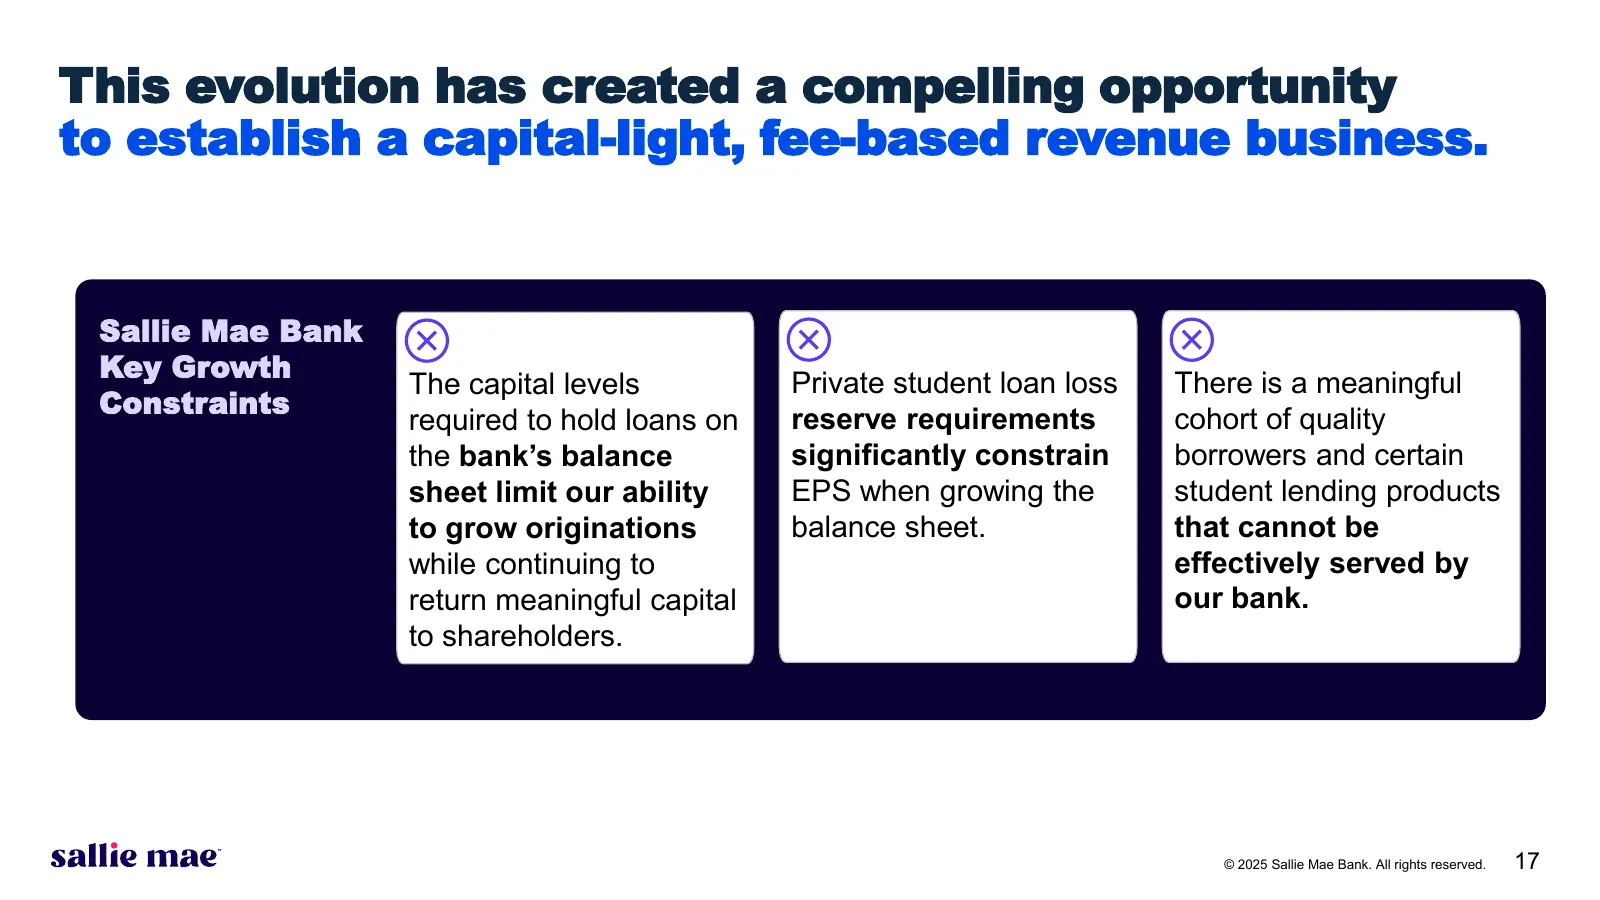
Slide 17: Opportunity to establish a capital-light, fee-based revenue business
This evolution has created a compelling opportunity to establish a capital-light, fee-based revenue business. Sallie Mae Bank Key Growth The capital levels Private student loan loss There is a meaningful Constraints required to hold loans on reserve requirements cohort of quality the bank’s balance
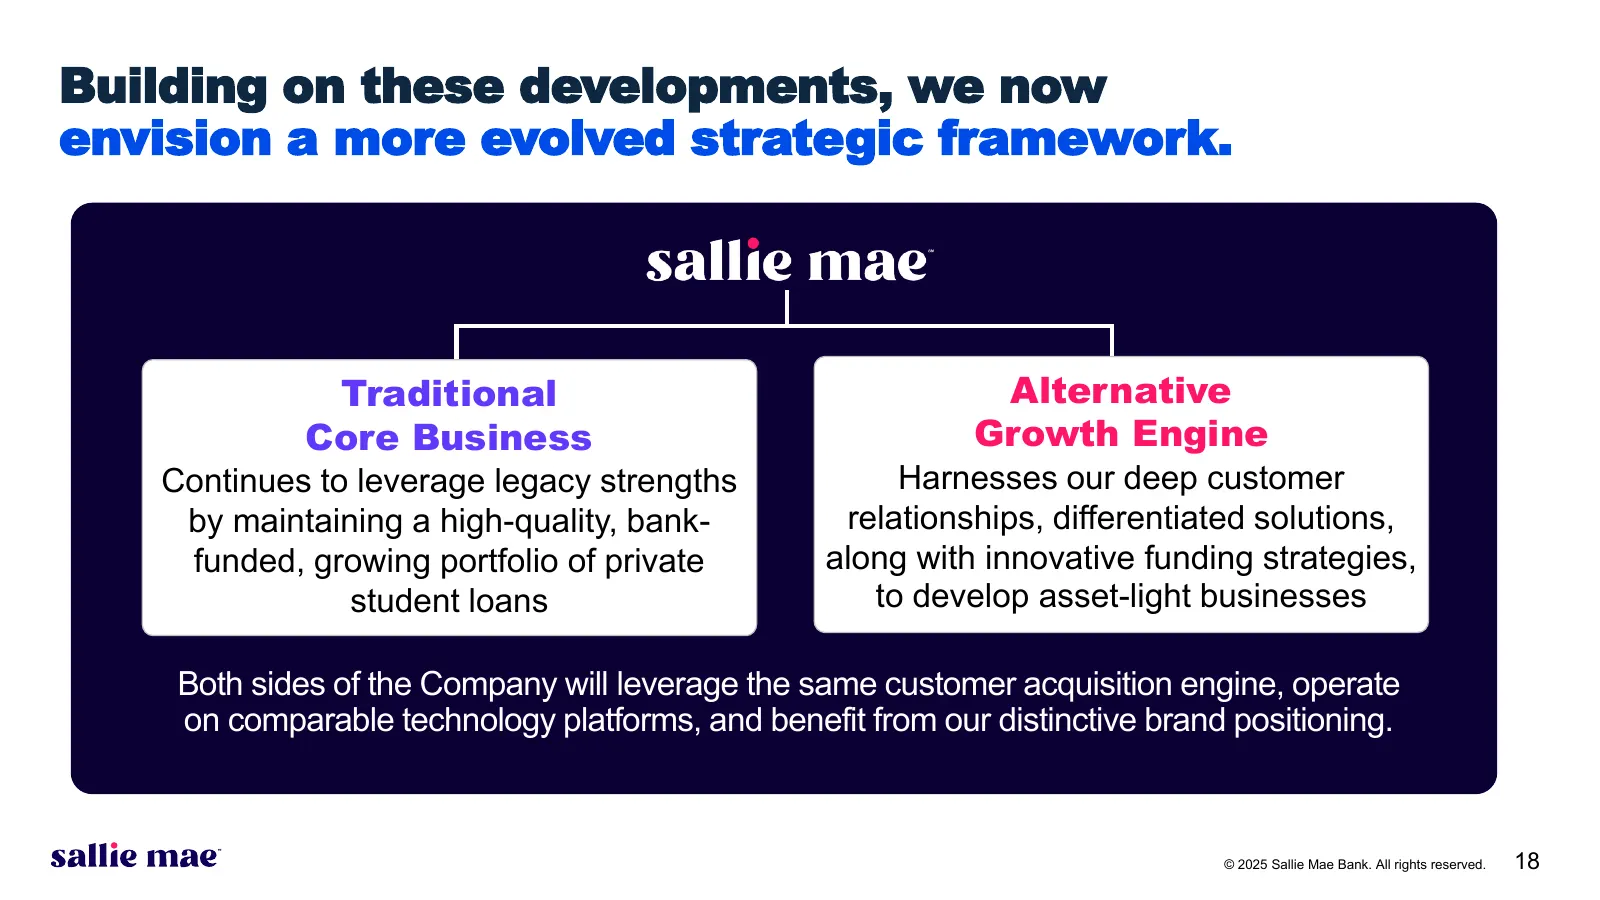
Slide 18: A more evolved strategic framework
Building on these developments, we now envision a more evolved strategic framework. Traditional Alternative Core Business Growth Engine Continues to leverage legacy strengths Harnesses our deep customer by maintaining a high-quality, bank- relationships, differentiated solutions, funded, growing por
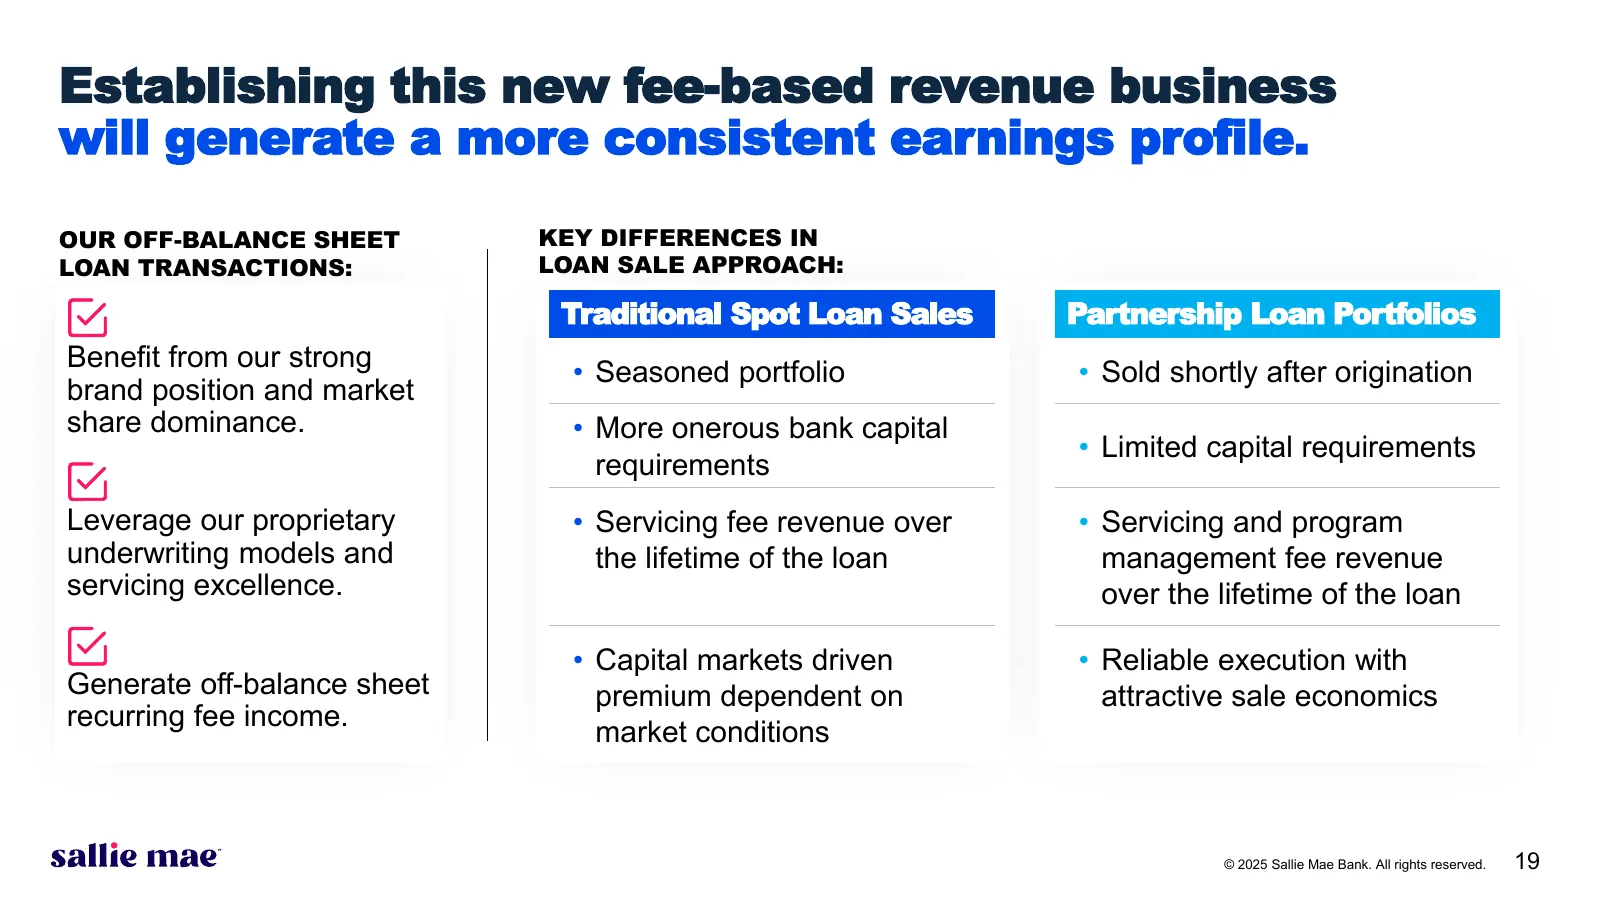
Slide 19: New fee-based revenue business will generate a more consistent earnings profile
Establishing this new fee-based revenue business will generate a more consistent earnings profile. OUR OFF-BALANCE SHEET KEY DIFFERENCES IN LOAN TRANSACTIONS: LOAN SALE APPROACH: Traditional Spot Loan Sales Partnership Loan Portfolios Benefit from our strong • Seasoned portfolio • Sold shortly after
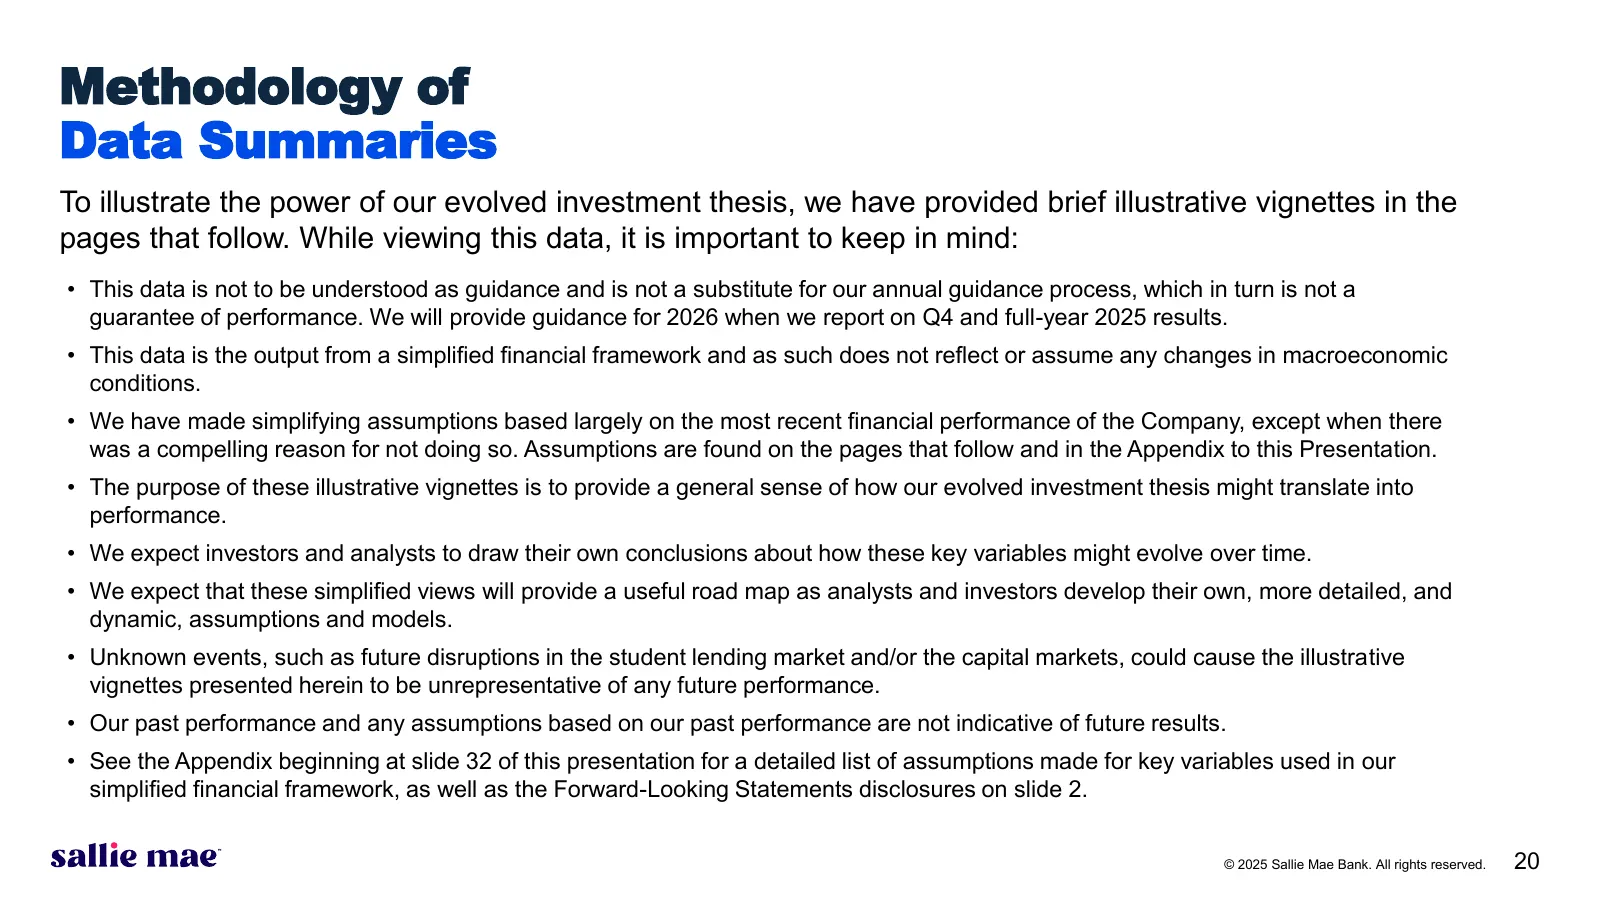
Slide 20: Methodology of Data Summaries
Methodology of Data Summaries To illustrate the power of our evolved investment thesis, we have provided brief illustrative vignettes in the pages that follow. While viewing this data, it is important to keep in mind: • This data is not to be understood as guidance and is not a substitute for our an
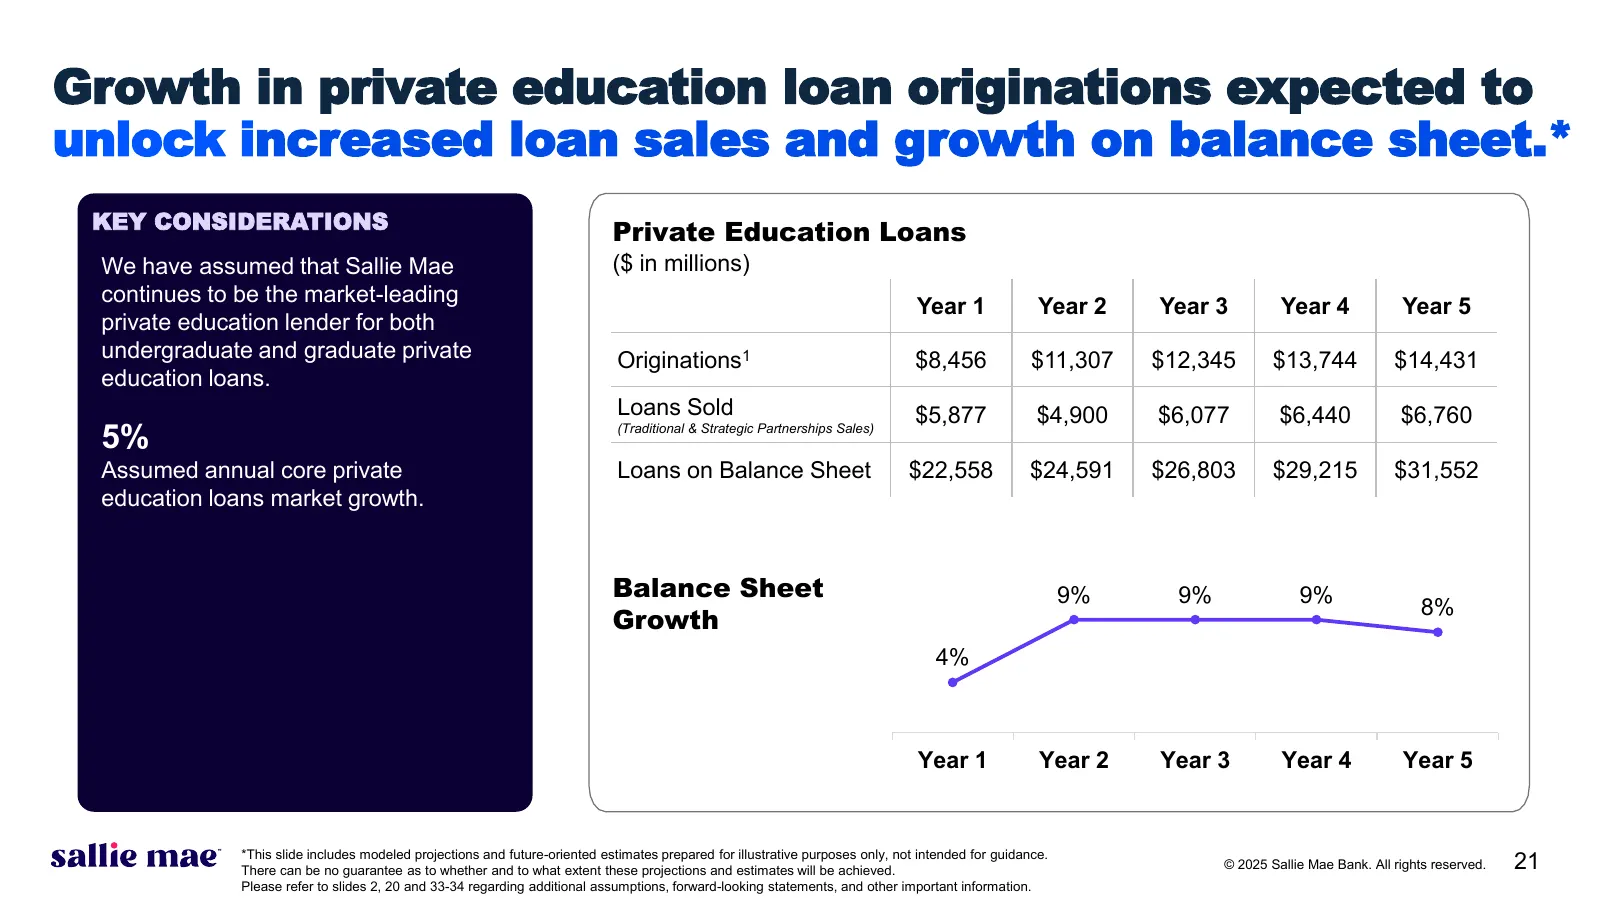
Slide 21: Growth in originations expected to unlock loan sales and balance sheet growth
Growth in private education loan originations expected to unlock increased loan sales and growth on balance sheet.* KEY CONSIDERATIONS Private Education Loans We have assumed that Sallie Mae ($ in millions) continues to be the market-leading Year 1 Year 2 Year 3 Year 4 Year 5 private education lende
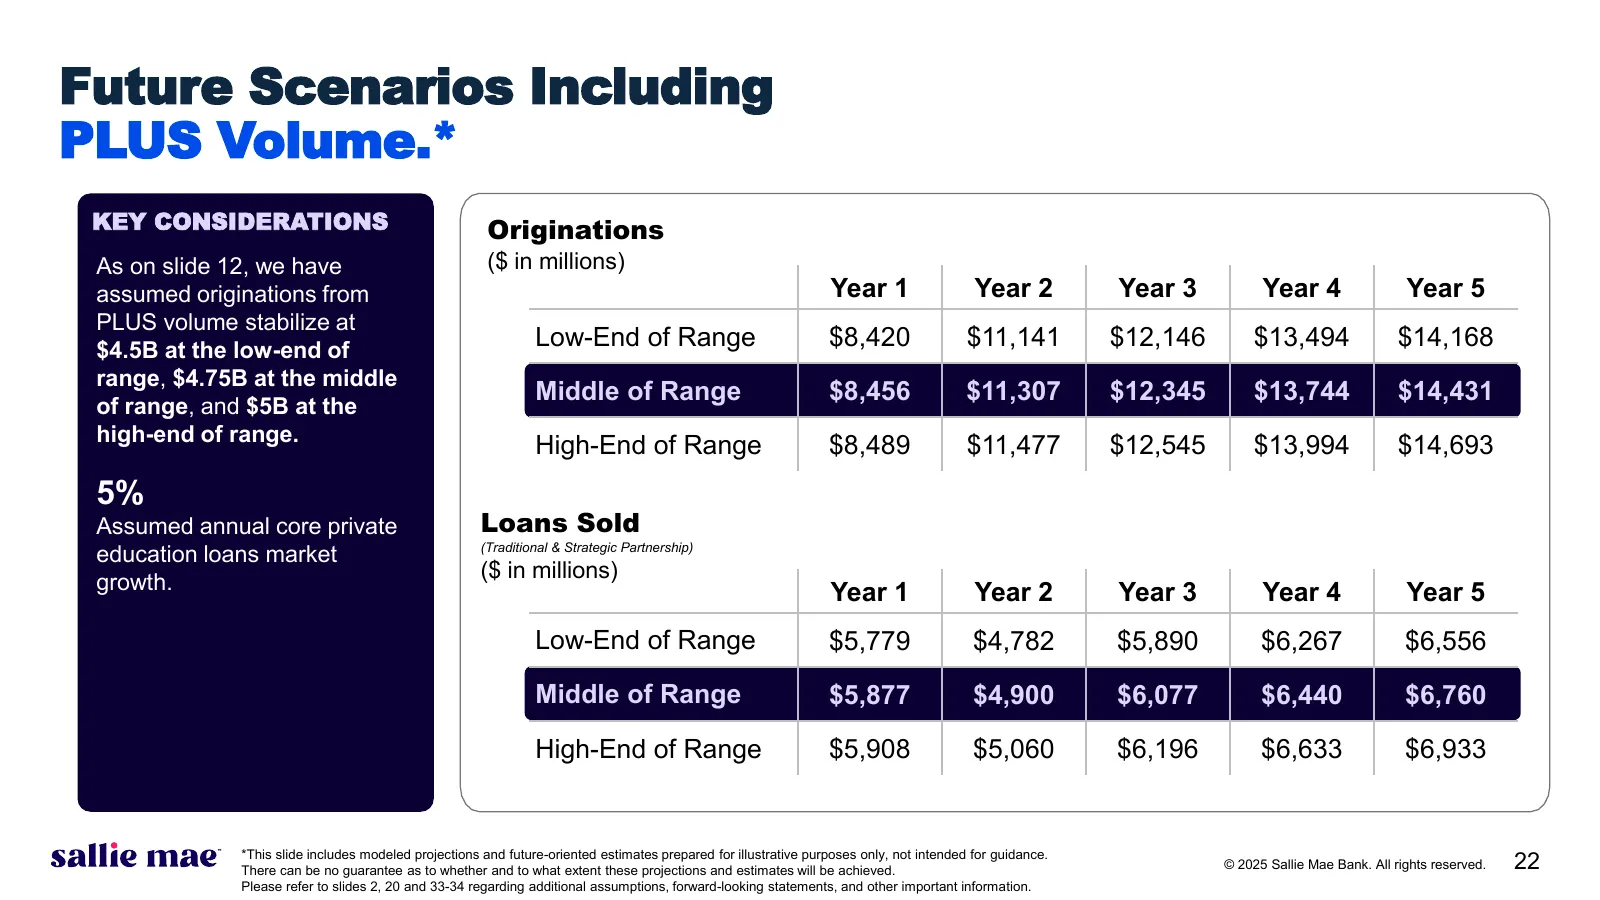
Slide 22: Future Scenarios Including PLUS Volume
Future Scenarios Including PLUS Volume.* KEY CONSIDERATIONS Originations As on slide 12, we have ($ in millions) assumed originations from Year 1 Year 2 Year 3 Year 4 Year 5 PLUS volume stabilize at $4.5B at the low-end of Low-End of Range $8,420 $11,141 $12,146 $13,494 $14,168 range, $4.75B at the
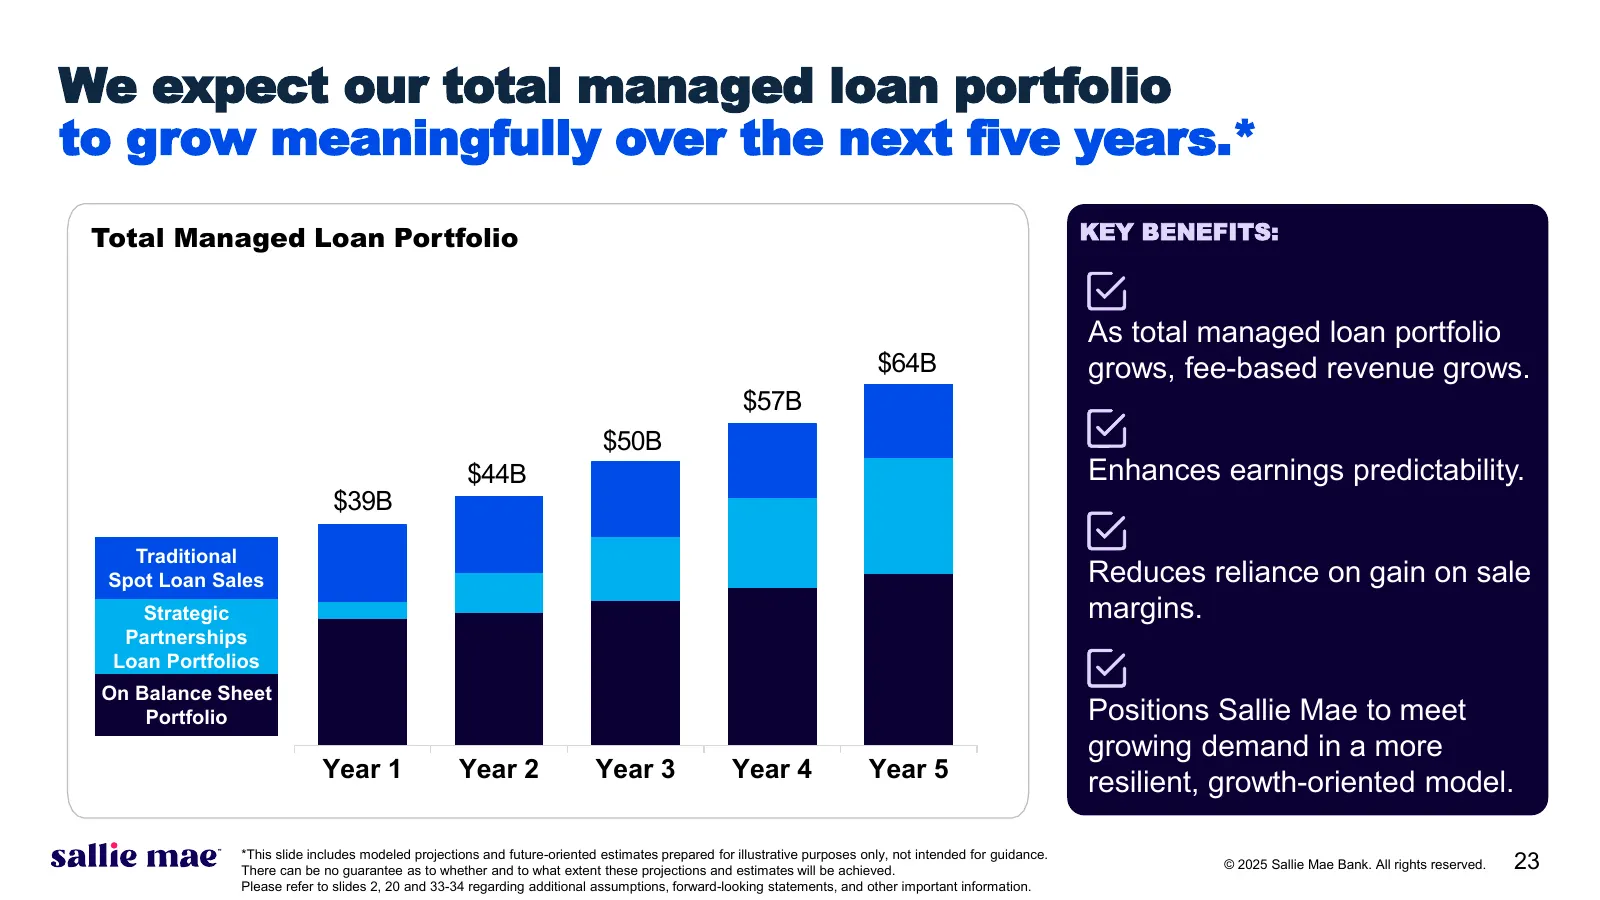
Slide 23: Total managed loan portfolio expected to grow over the next five years
We expect our total managed loan portfolio to grow meaningfully over the next five years.* Total Managed Loan Portfolio KEY BENEFITS: As total managed loan portfolio $64B grows, fee-based revenue grows. $57B $50B $44B Enhances earnings predictability. $39B Traditional Spot Loan Sales Reduces relianc
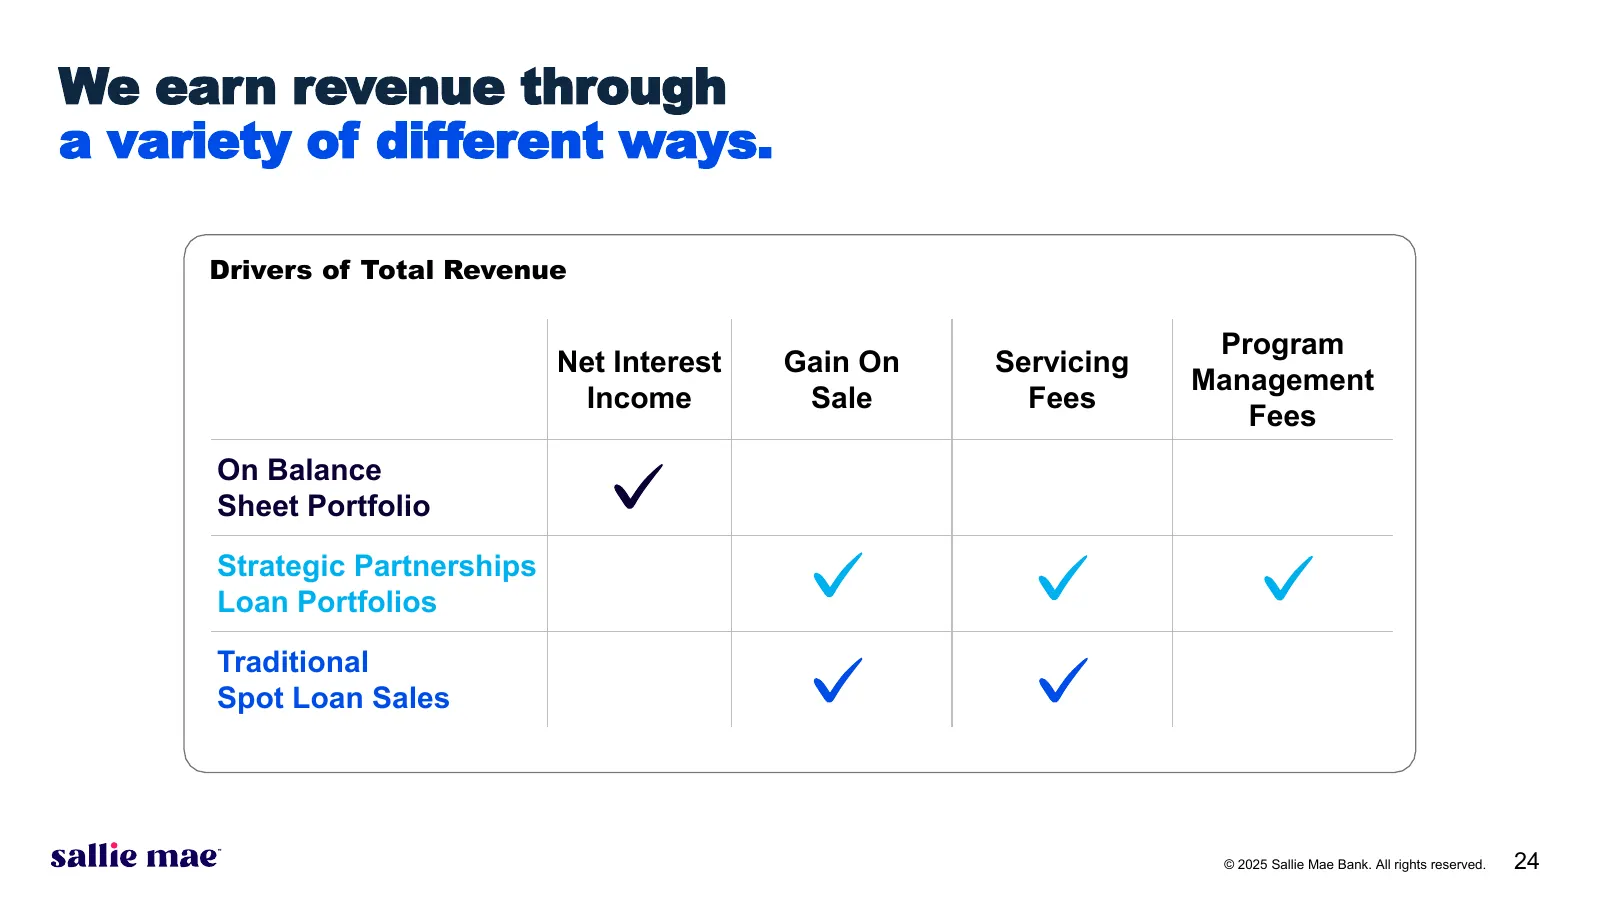
Slide 24: We earn revenue through a variety of different ways
We earn revenue through a variety of different ways. Drivers of Total Revenue Program Net Interest Gain On Servicing Management Income Sale Fees Fees On Balance Sheet Portfolio Strategic Partnerships Loan Portfolios Traditional Spot Loan Sales © 2025 Sallie Mae Bank. All rights reserved. 24
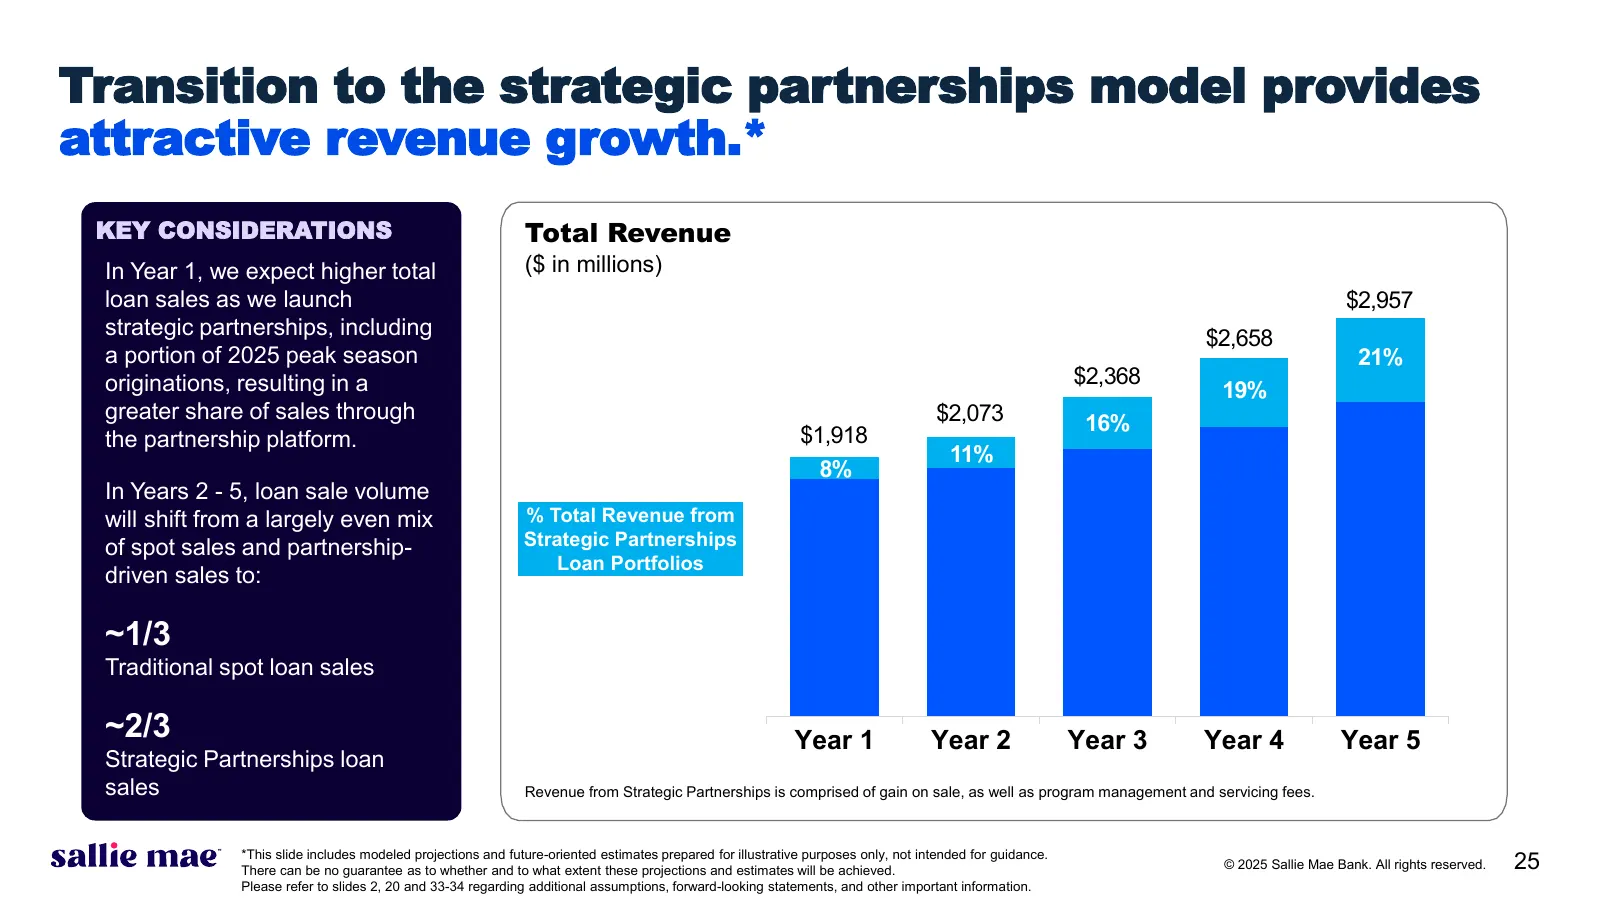
Slide 25: Transition to strategic partnerships model provides revenue growth
Transition to the strategic partnerships model provides attractive revenue growth.* KEY CONSIDERATIONS Total Revenue In Year 1, we expect higher total ($ in millions) loan sales as we launch $2,957 strategic partnerships, including $2,658 a portion of 2025 peak season 21% originations, resulting in
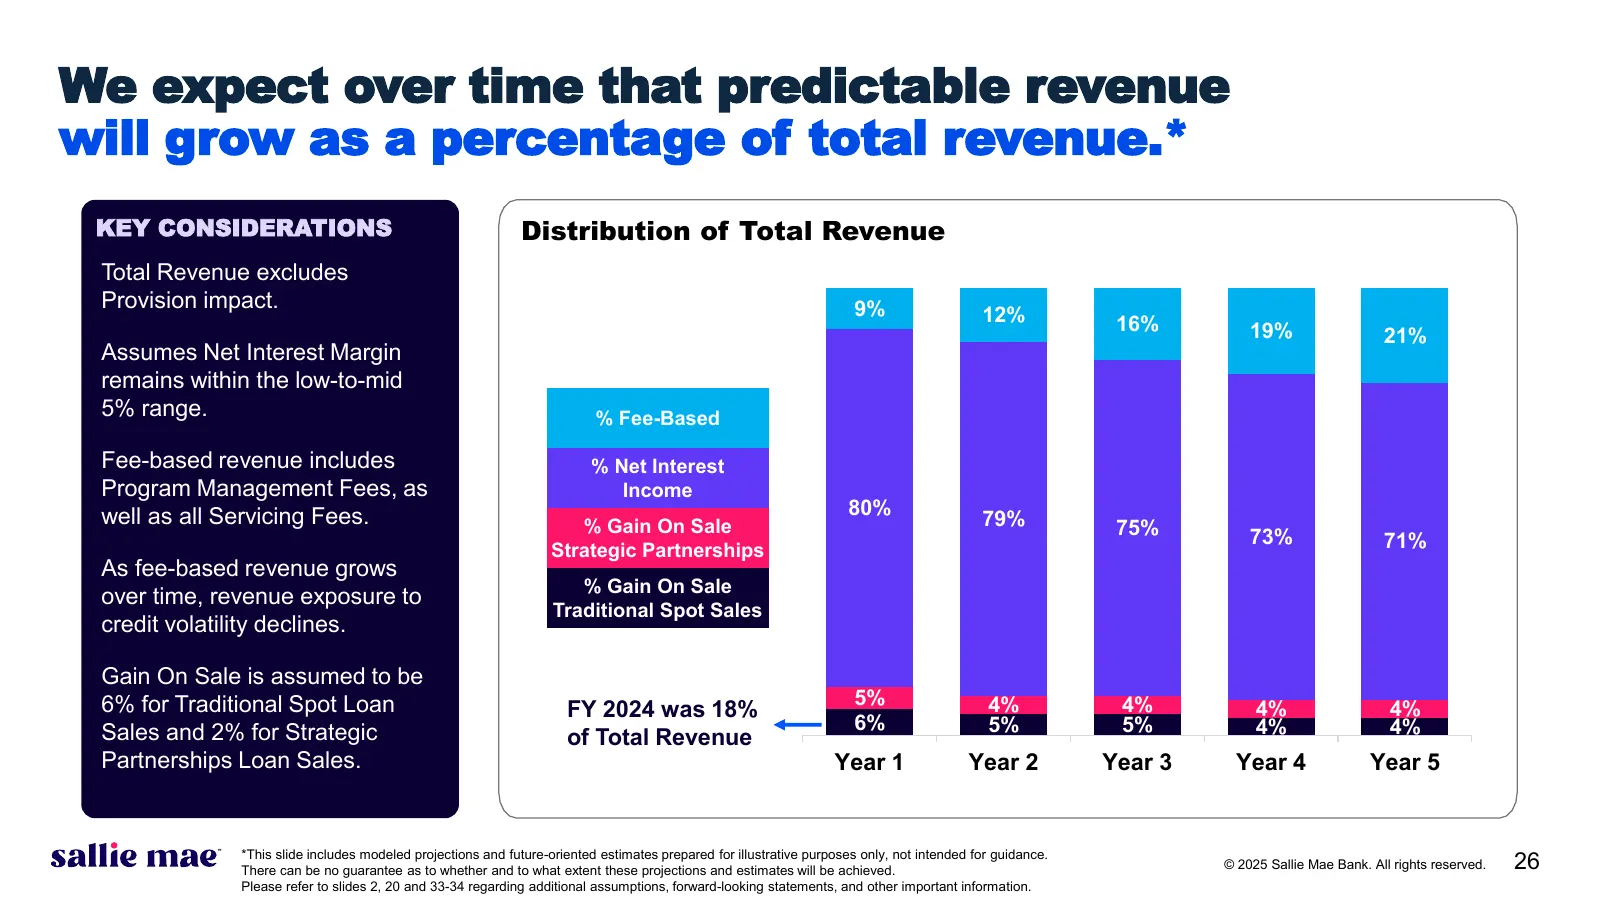
Slide 26: Predictable revenue to grow as a percentage of total revenue
We expect over time that predictable revenue will grow as a percentage of total revenue.* KEY CONSIDERATIONS Distribution of Total Revenue Total Revenue excludes Provision impact. 9% 12% 16% 19% 21% Assumes Net Interest Margin remains within the low-to-mid 5% range. % Fee-Based Fee-based revenue inc
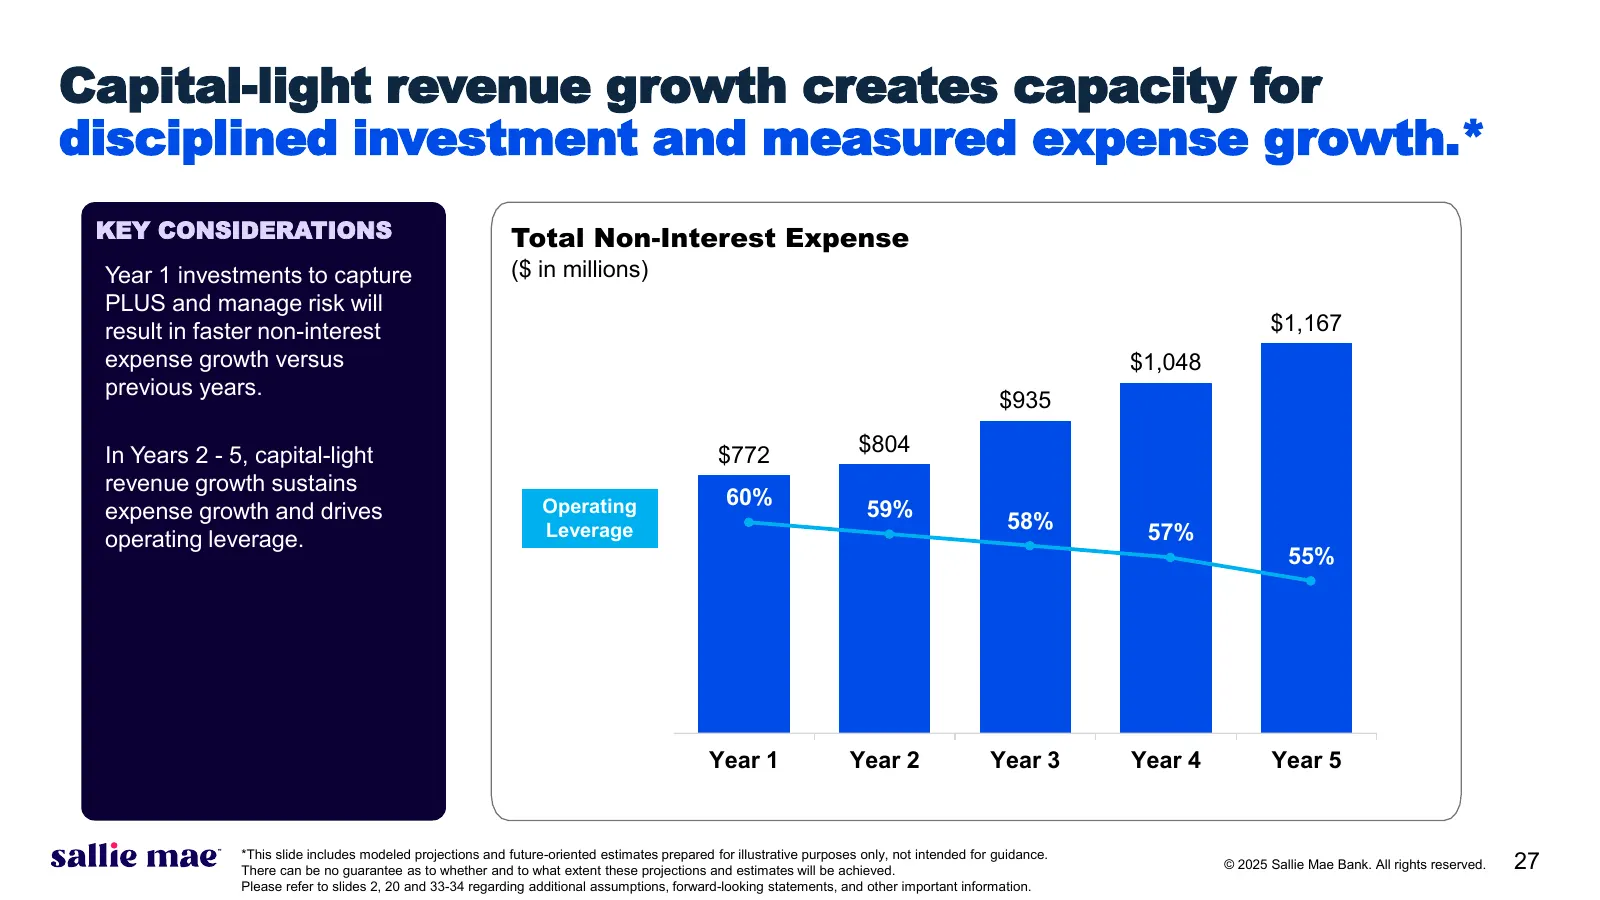
Slide 27: Capital-light revenue growth creates capacity for disciplined investment
Capital-light revenue growth creates capacity for disciplined investment and measured expense growth.* KEY CONSIDERATIONS Total Non-Interest Expense Year 1 investments to capture ($ in millions) PLUS and manage risk will result in faster non-interest $1,167 expense growth versus $1,048 previous year
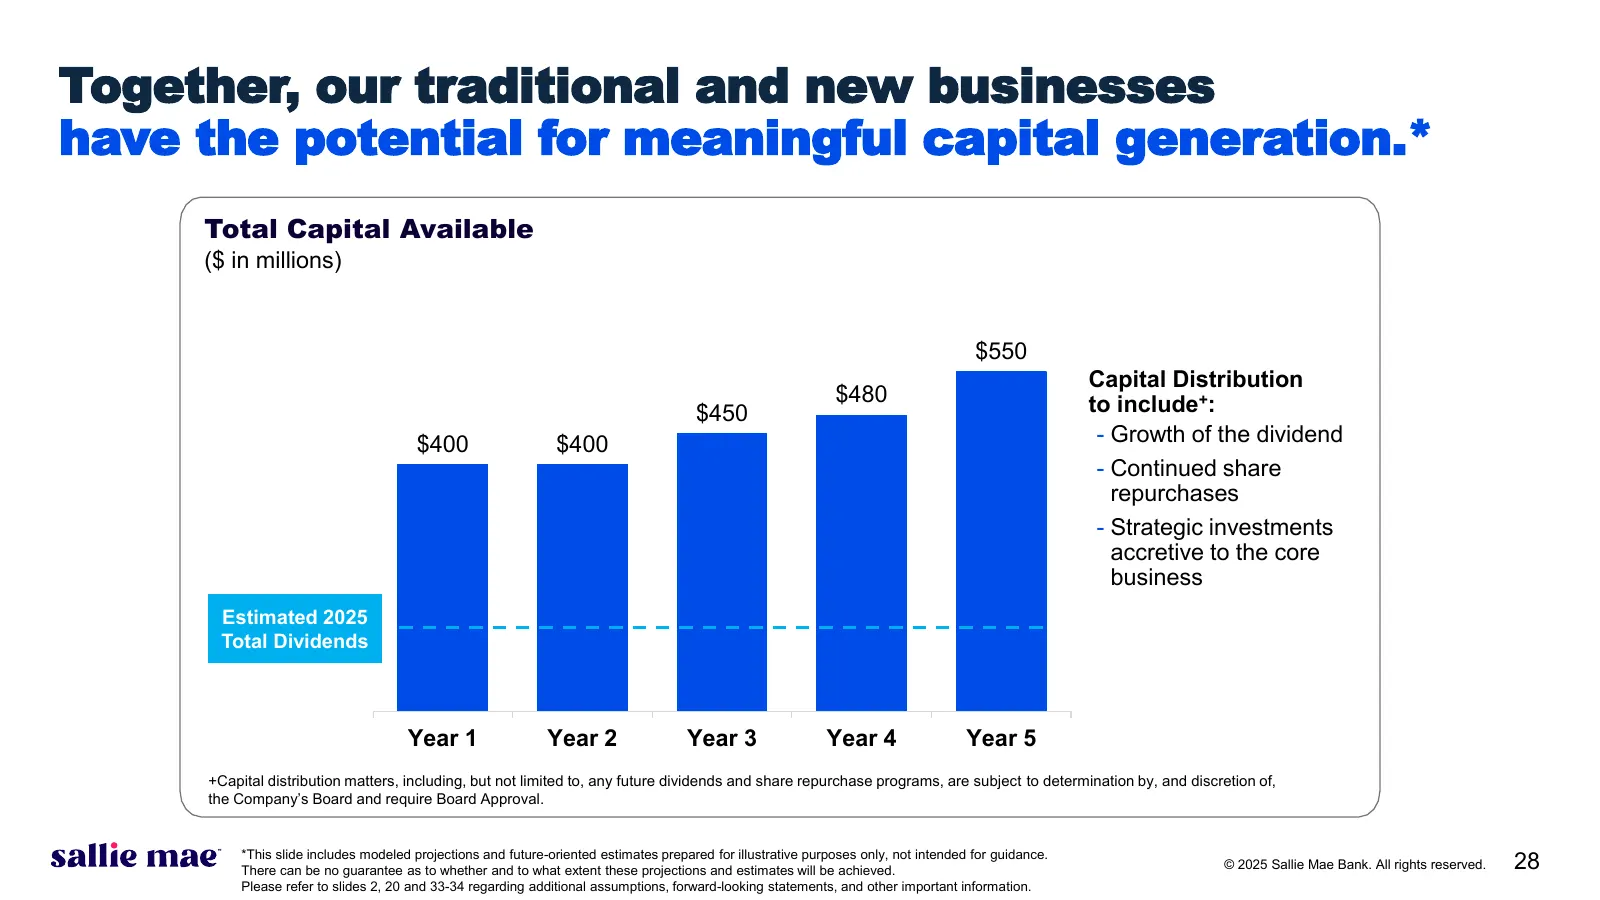
Slide 28: Potential for meaningful capital generation
Together, our traditional and new businesses have the potential for meaningful capital generation.* Total Capital Available ($ in millions) $550 Capital Distribution $480 to include+: $450 $400 $400 - Growth of the dividend - Continued share repurchases - Strategic investments accretive to the core
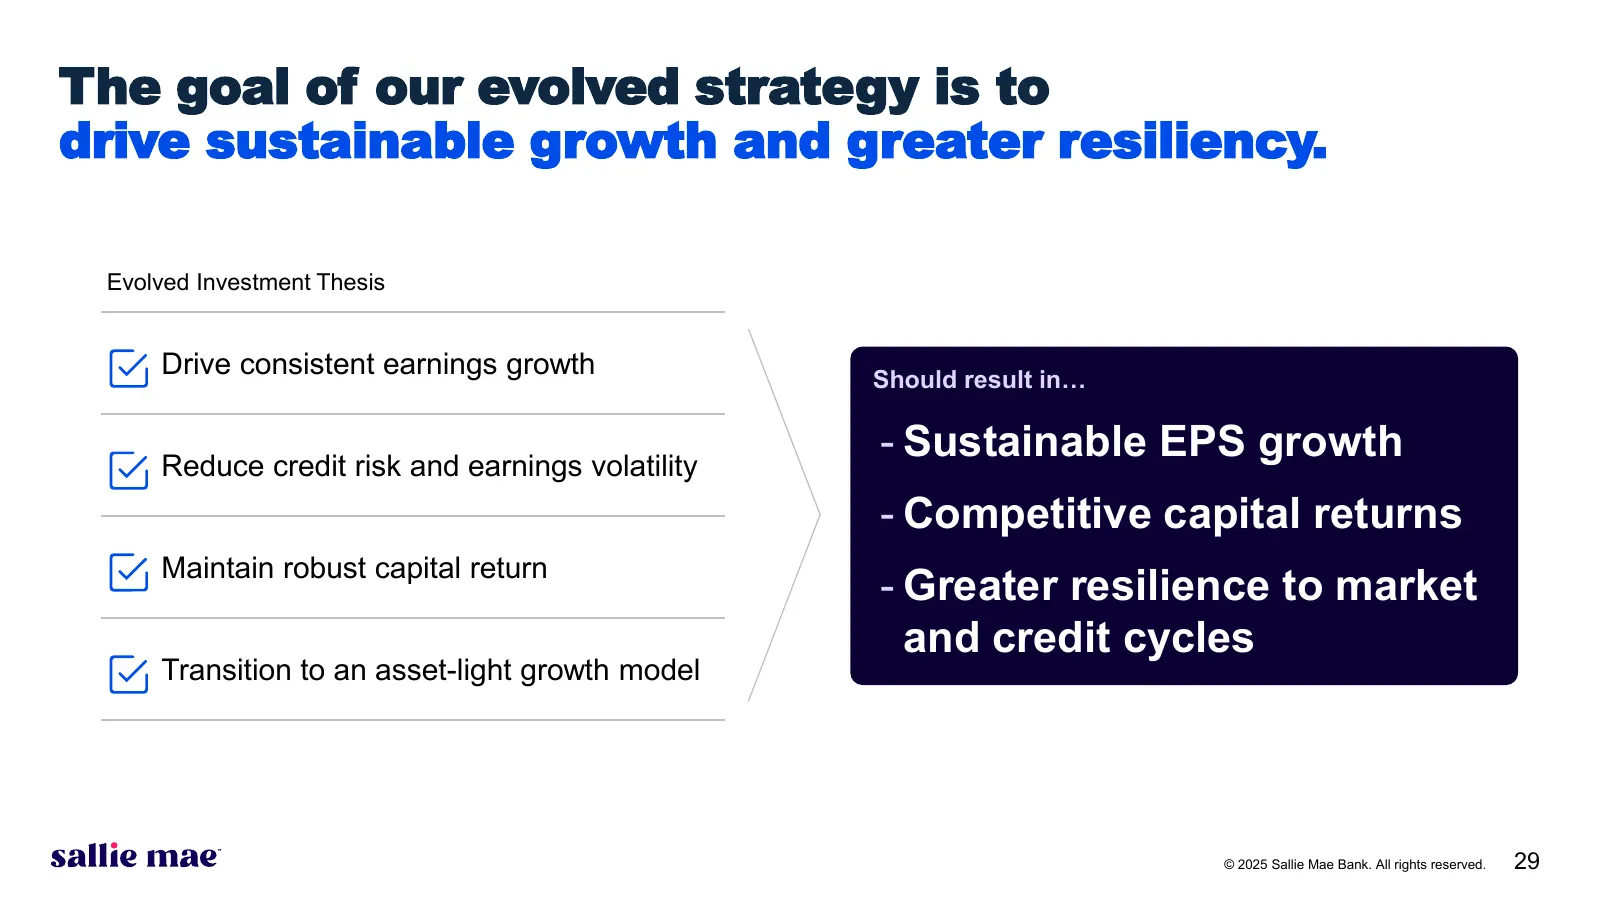
Slide 29: The goal of our evolved strategy is sustainable growth and greater resiliency
The goal of our evolved strategy is to drive sustainable growth and greater resiliency. Evolved Investment Thesis Drive consistent earnings growth Should result in… Reduce credit risk and earnings volatility - Sustainable EPS growth - Competitive capital returns Maintain robust capital return - Grea
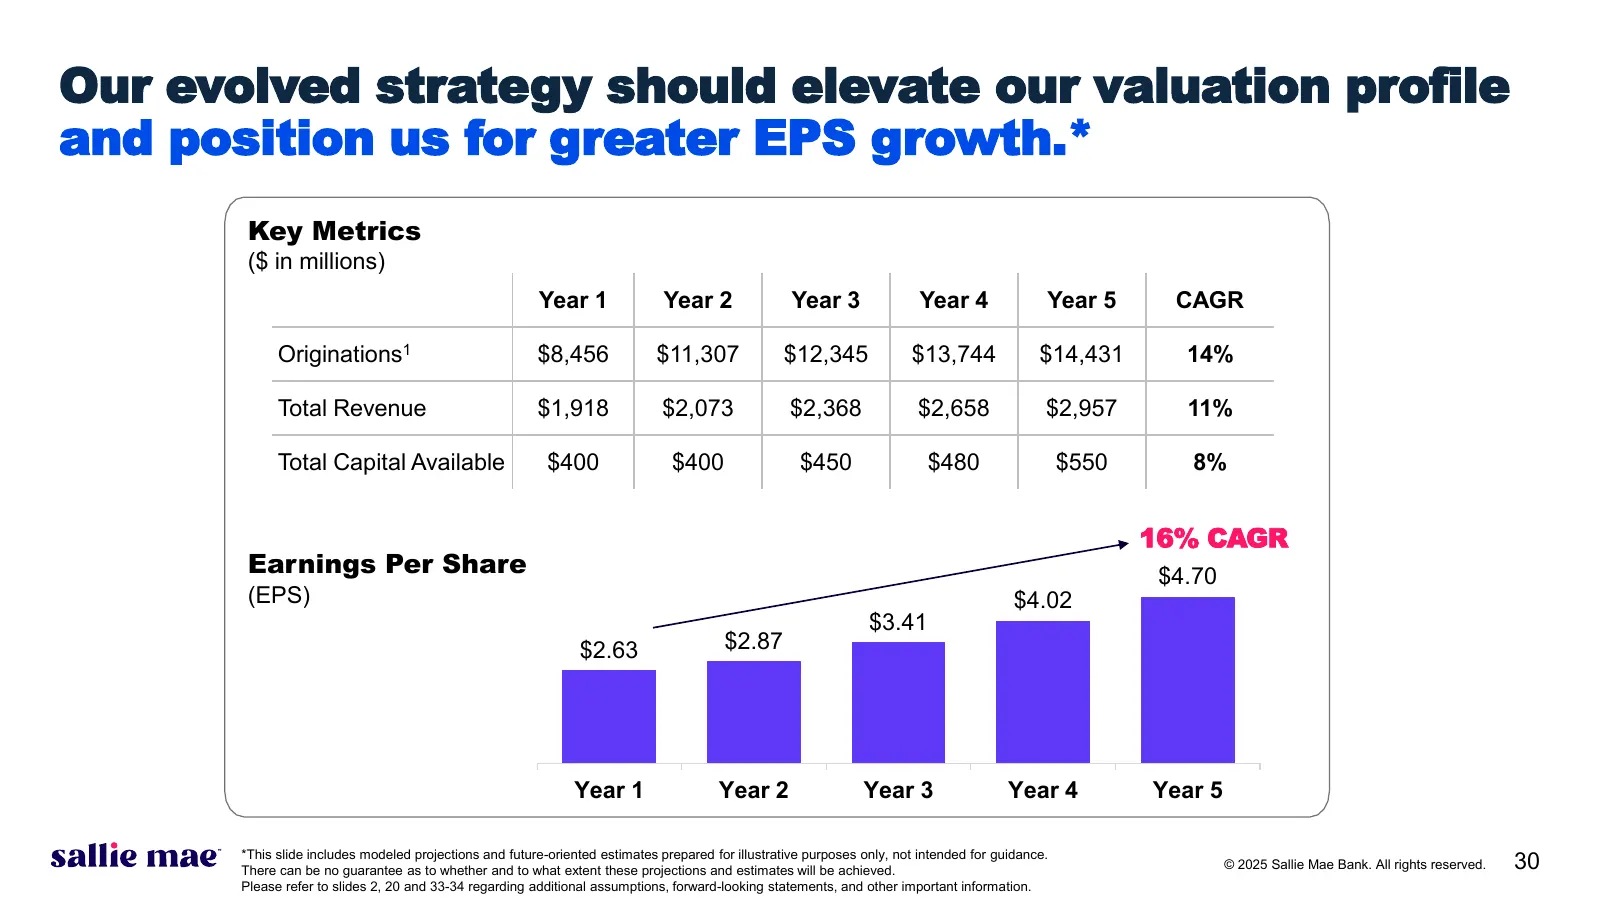
Slide 30: Evolved strategy should elevate valuation profile and position for EPS growth
Our evolved strategy should elevate our valuation profile and position us for greater EPS growth.* Key Metrics ($ in millions) Year 1 Year 2 Year 3 Year 4 Year 5 CAGR Originations1 $8,456 $11,307 $12,345 $13,744 $14,431 14% Total Revenue $1,918 $2,073 $2,368 $2,658 $2,957 11% Total Capital Available
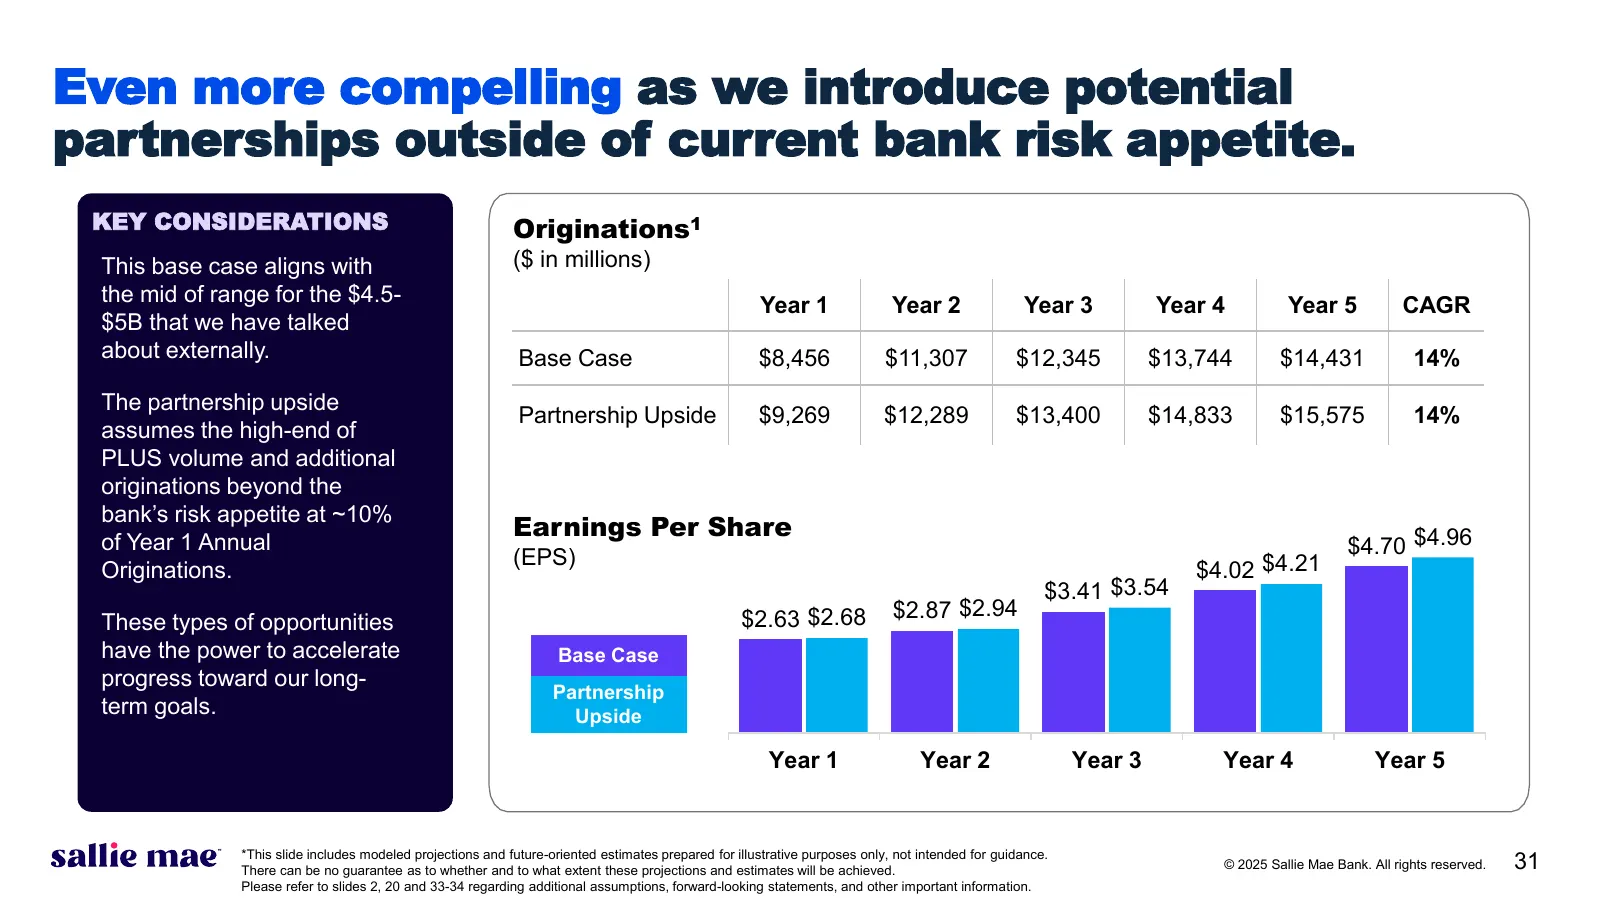
Slide 31: Potential partnerships outside of current bank risk appetite
Even more compelling as we introduce potential partnerships outside of current bank risk appetite. KEY CONSIDERATIONS Originations1 This base case aligns with ($ in millions) the mid of range for the $4.5- Year 1 Year 2 Year 3 Year 4 Year 5 CAGR $5B that we have talked about externally. Base Case $8
Slide 32: Appendix
Appendix © 2025 Sallie Mae Bank. All rights reserved. 32
Slide 33: Assumptions
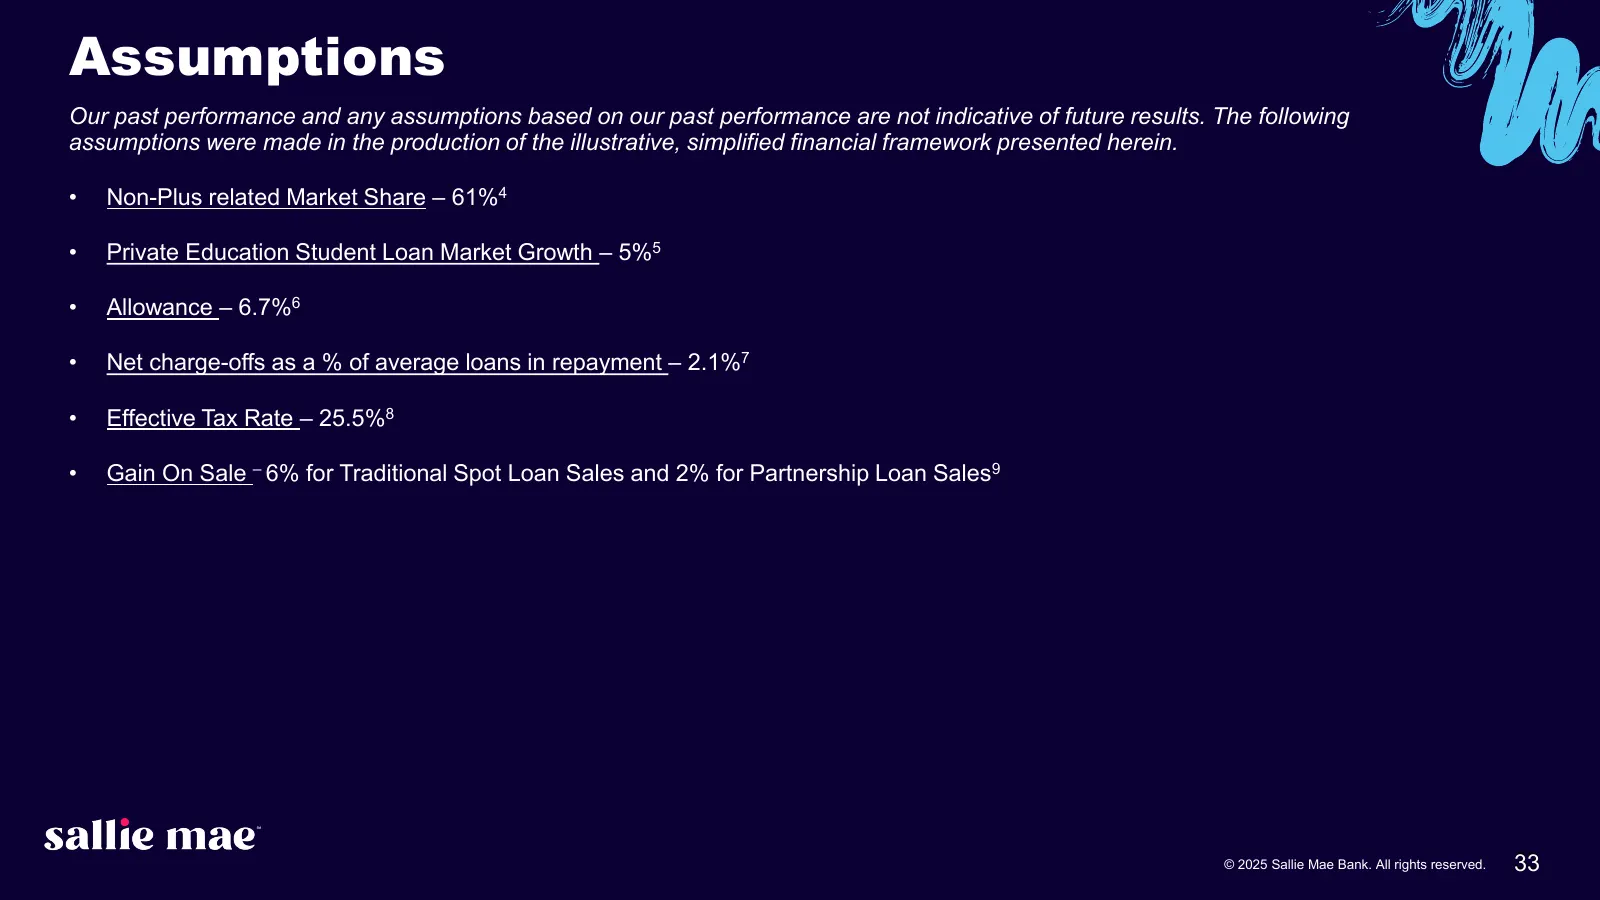
Assumptions Our past performance and any assumptions based on our past performance are not indicative of future results. The following assumptions were made in the production of the illustrative, simplified financial framework presented herein. • Non-Plus related Market Share – 61%4 • Private Educat
Slide 34: Footnotes
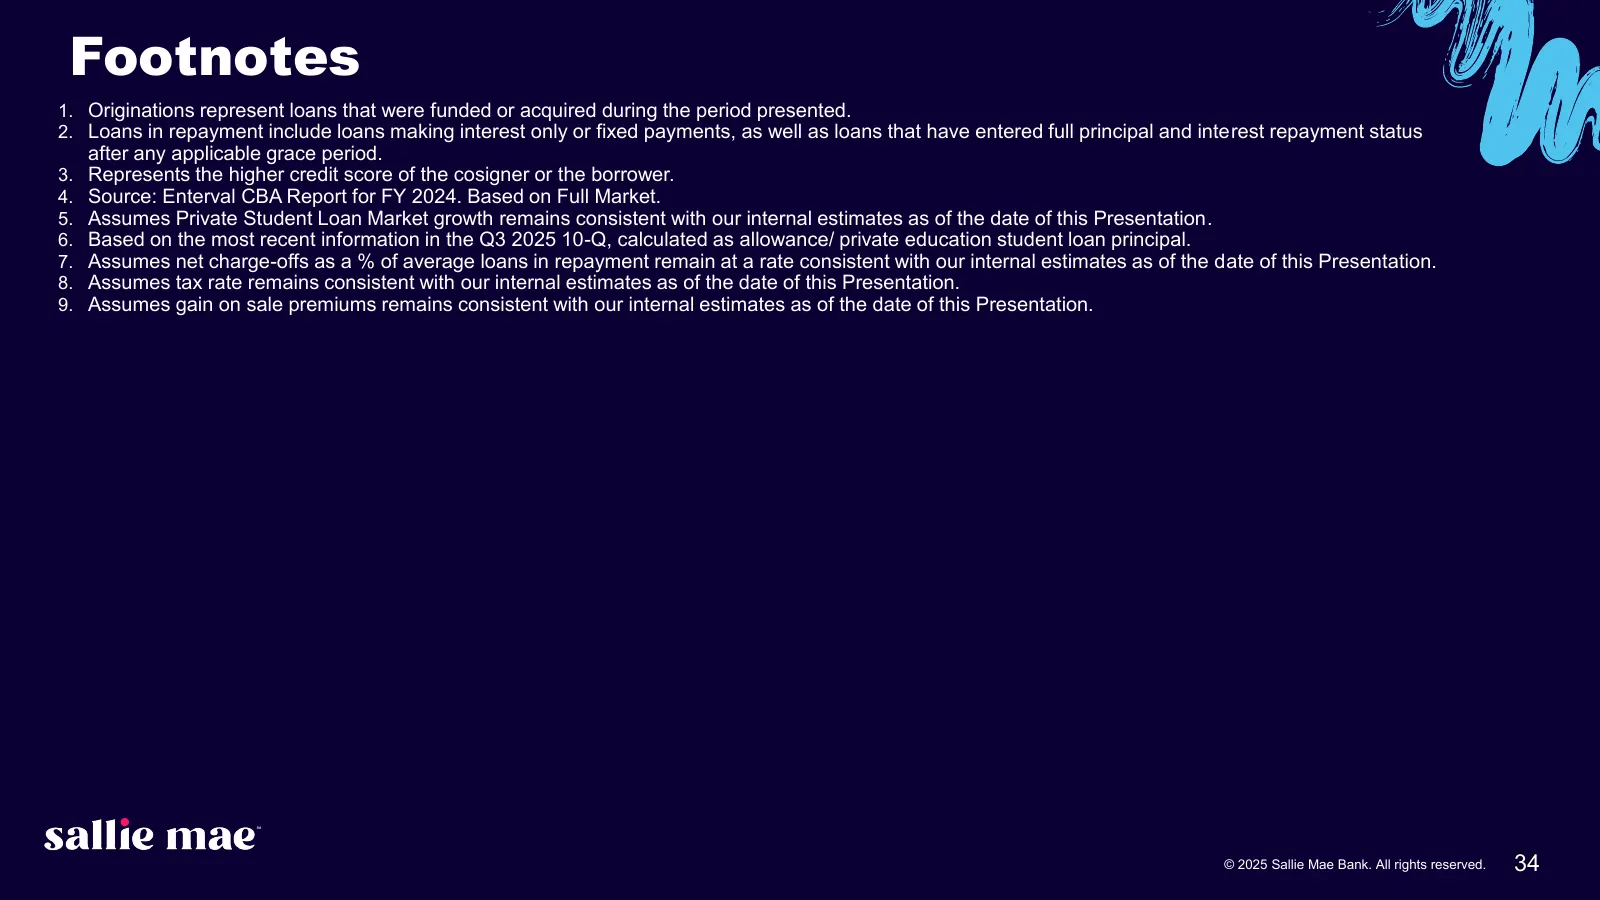
Footnotes 1. Originations represent loans that were funded or acquired during the period presented. 2. Loans in repayment include loans making interest only or fixed payments, as well as loans that have entered full principal and interest repayment status after any applicable grace period. 3. Repres
Source: company website
More decks from SLM Corporation
 Q3 2026 Earnings Presentation45 slides · Nov 17, 2026
 Debt Investor Presentation (November 2026)54 slides · Nov 17, 2026
 Q3 2026 Earnings Presentation16 slides · Oct 22, 2026
 Q2 2026 Earnings Presentation46 slides · Jul 23, 2026
 Q2 2026 Earnings Presentation16 slides · Jul 23, 2026
 Morgan Stanley US Financials Conference 202615 slides · Jun 10, 2026