Newalliance Bancshares — Investor Presentation (May 2006)
23 slides from Newalliance Bancshares's investor presentation, May 2, 2006

Slide 1: Investor and Analyst Presentation
[Logo] Investor and Analyst Presentation

Slide 2: Disclaimer & Forward-Looking Statements
Disclaimer & Forward-Looking Statements This presentation contains forward-looking statements which involve risks and uncertainties. The Company's actual results may differ significantly from the results discussed in the forward-looking statements. Factors that might cause such a difference include,

Slide 3: Our Mission
Our Mission Our Mission is: § To enhance the financial well-being of our customers and communities; § To excel at customer service; § To attract and retain highly dedicated employees; § To deliver superior returns to our shareholders; § To practice “first class” corporate governance. 3

Slide 4: Building Our Franchise
Building Our Franchise § Third largest bank headquartered in Connecticut; § Sixth largest headquartered in New England; § $6.9 billion in assets; $3.9 billion in deposits at 3/31/06; § Recently entered affluent Fairfield County; § Nearly tripled trust assets under management in 2005; § Poised to gro

Slide 5: Nicely Aligned Along I-95 and I-91 Corridors including Fairfield County
Nicely Aligned Along I-95 and I-91 Corridors including Fairfield County [Graph] 5

Slide 6: First Quarter Highlights
First Quarter Highlights § GAAP EPS 11 cents; 12 cents exclusive of M&A costs; met Street expectations; § Loan balances up 8% over year-end; ◊ Originations & Purchases up 38% § Deposits up 3.4%; focused on managing profitability; § Stable margin; § Credit Quality continues to be pristine. 6
Slide 7: Managing Our Capital
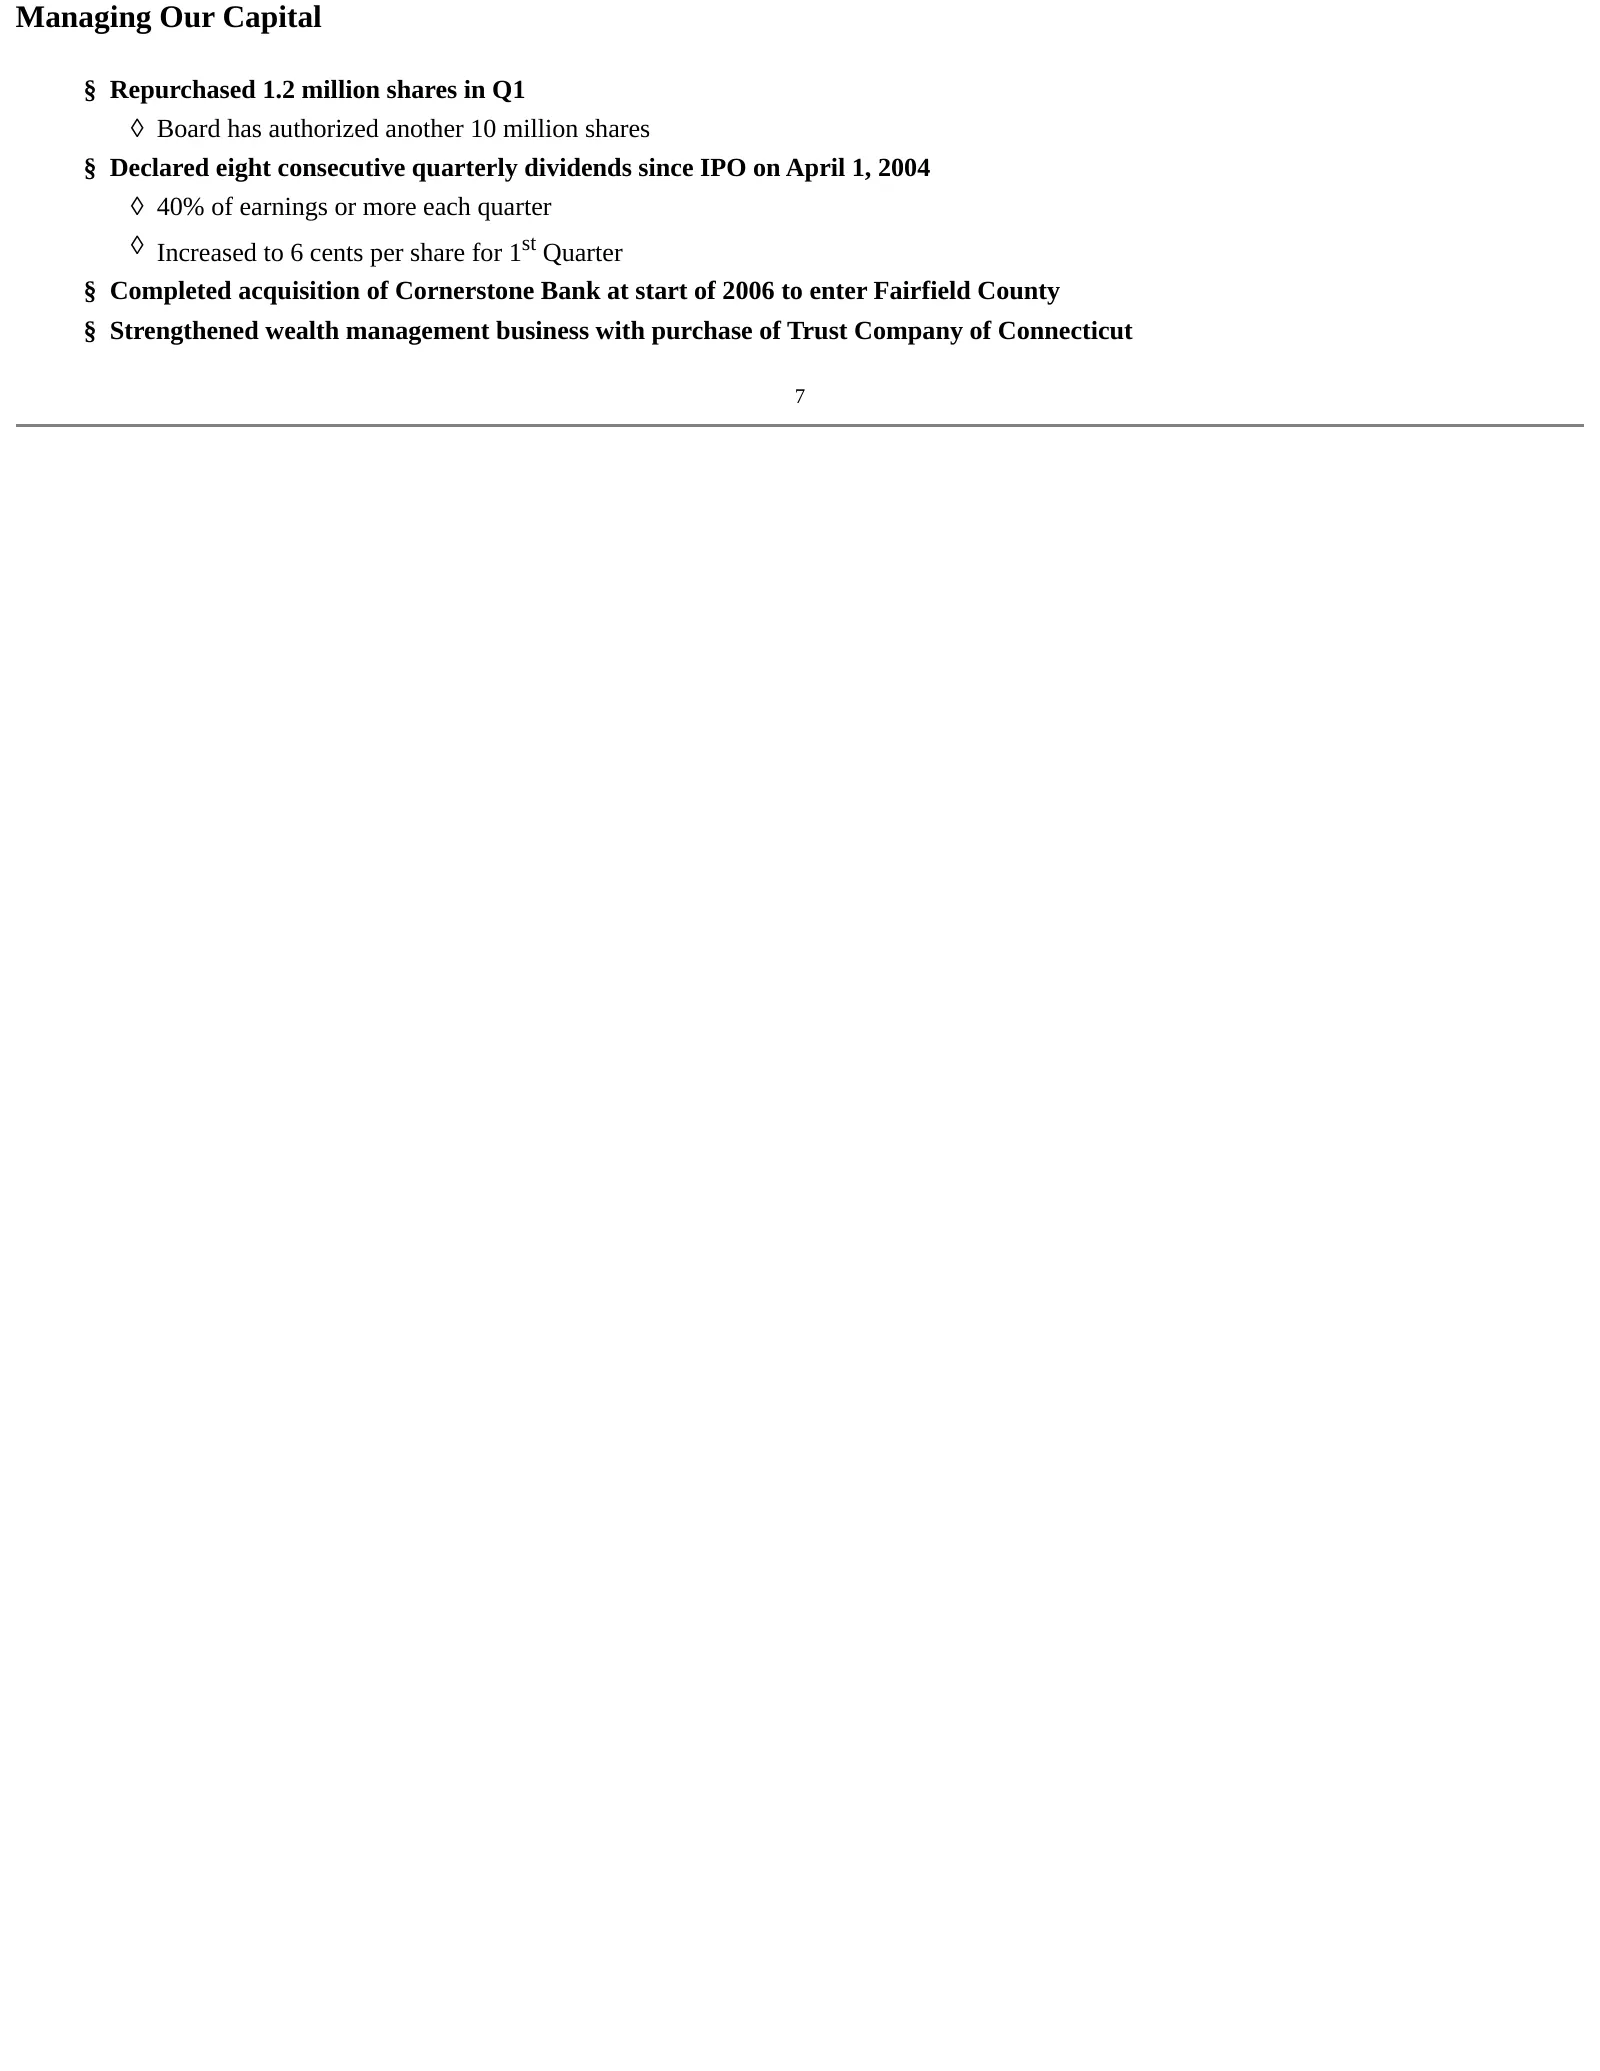
Managing Our Capital § Repurchased 1.2 million shares in Q1 ◊ Board has authorized another 10 million shares § Declared eight consecutive quarterly dividends since IPO on April 1, 2004 ◊ 40% of earnings or more each quarter ◊ Increased to 6 cents per share for 1st Quarter § Completed acquisition of

Slide 8: "Best Practices" Corporate Governance
“Best Practices” Corporate Governance NewAlliance Corporate Governance outperforms most companies: Institutional Shareholder Services (ISS) states: ◊ NewAlliance outperforms 94.7% of Russell 3000 companies; ◊ NewAlliance outperforms 95.5% of the “Bank Group”. 8

Slide 9: Priorities in 2006
Priorities in 2006 Manage Revenue Growth Increase earning assets Manage interest rate risk Focus on fee income Balance Sheet Growth Emphasize checking deposits C&I loans Contain Expenses Deliver on acquisition cost saves Accelerate process improvements Maintain Credit Quality Intensify loan review U

Slide 10: Priorities in 2006 (continued)
Priorities in 2006 (continued) Deploy capital strategically Pursue sound acquisitions Conduct opportunistic share repurchases Maintain competitive dividend 10

Slide 11: Financials
Financials [Logo] 11

Slide 12: Deposits 3/31/06
Deposits 3/31/06 [Graph] 12

Slide 13: Loans 3/31/06
Loans 3/31/06 [Graph] 13
Slide 14: Residential Loan Portfolio
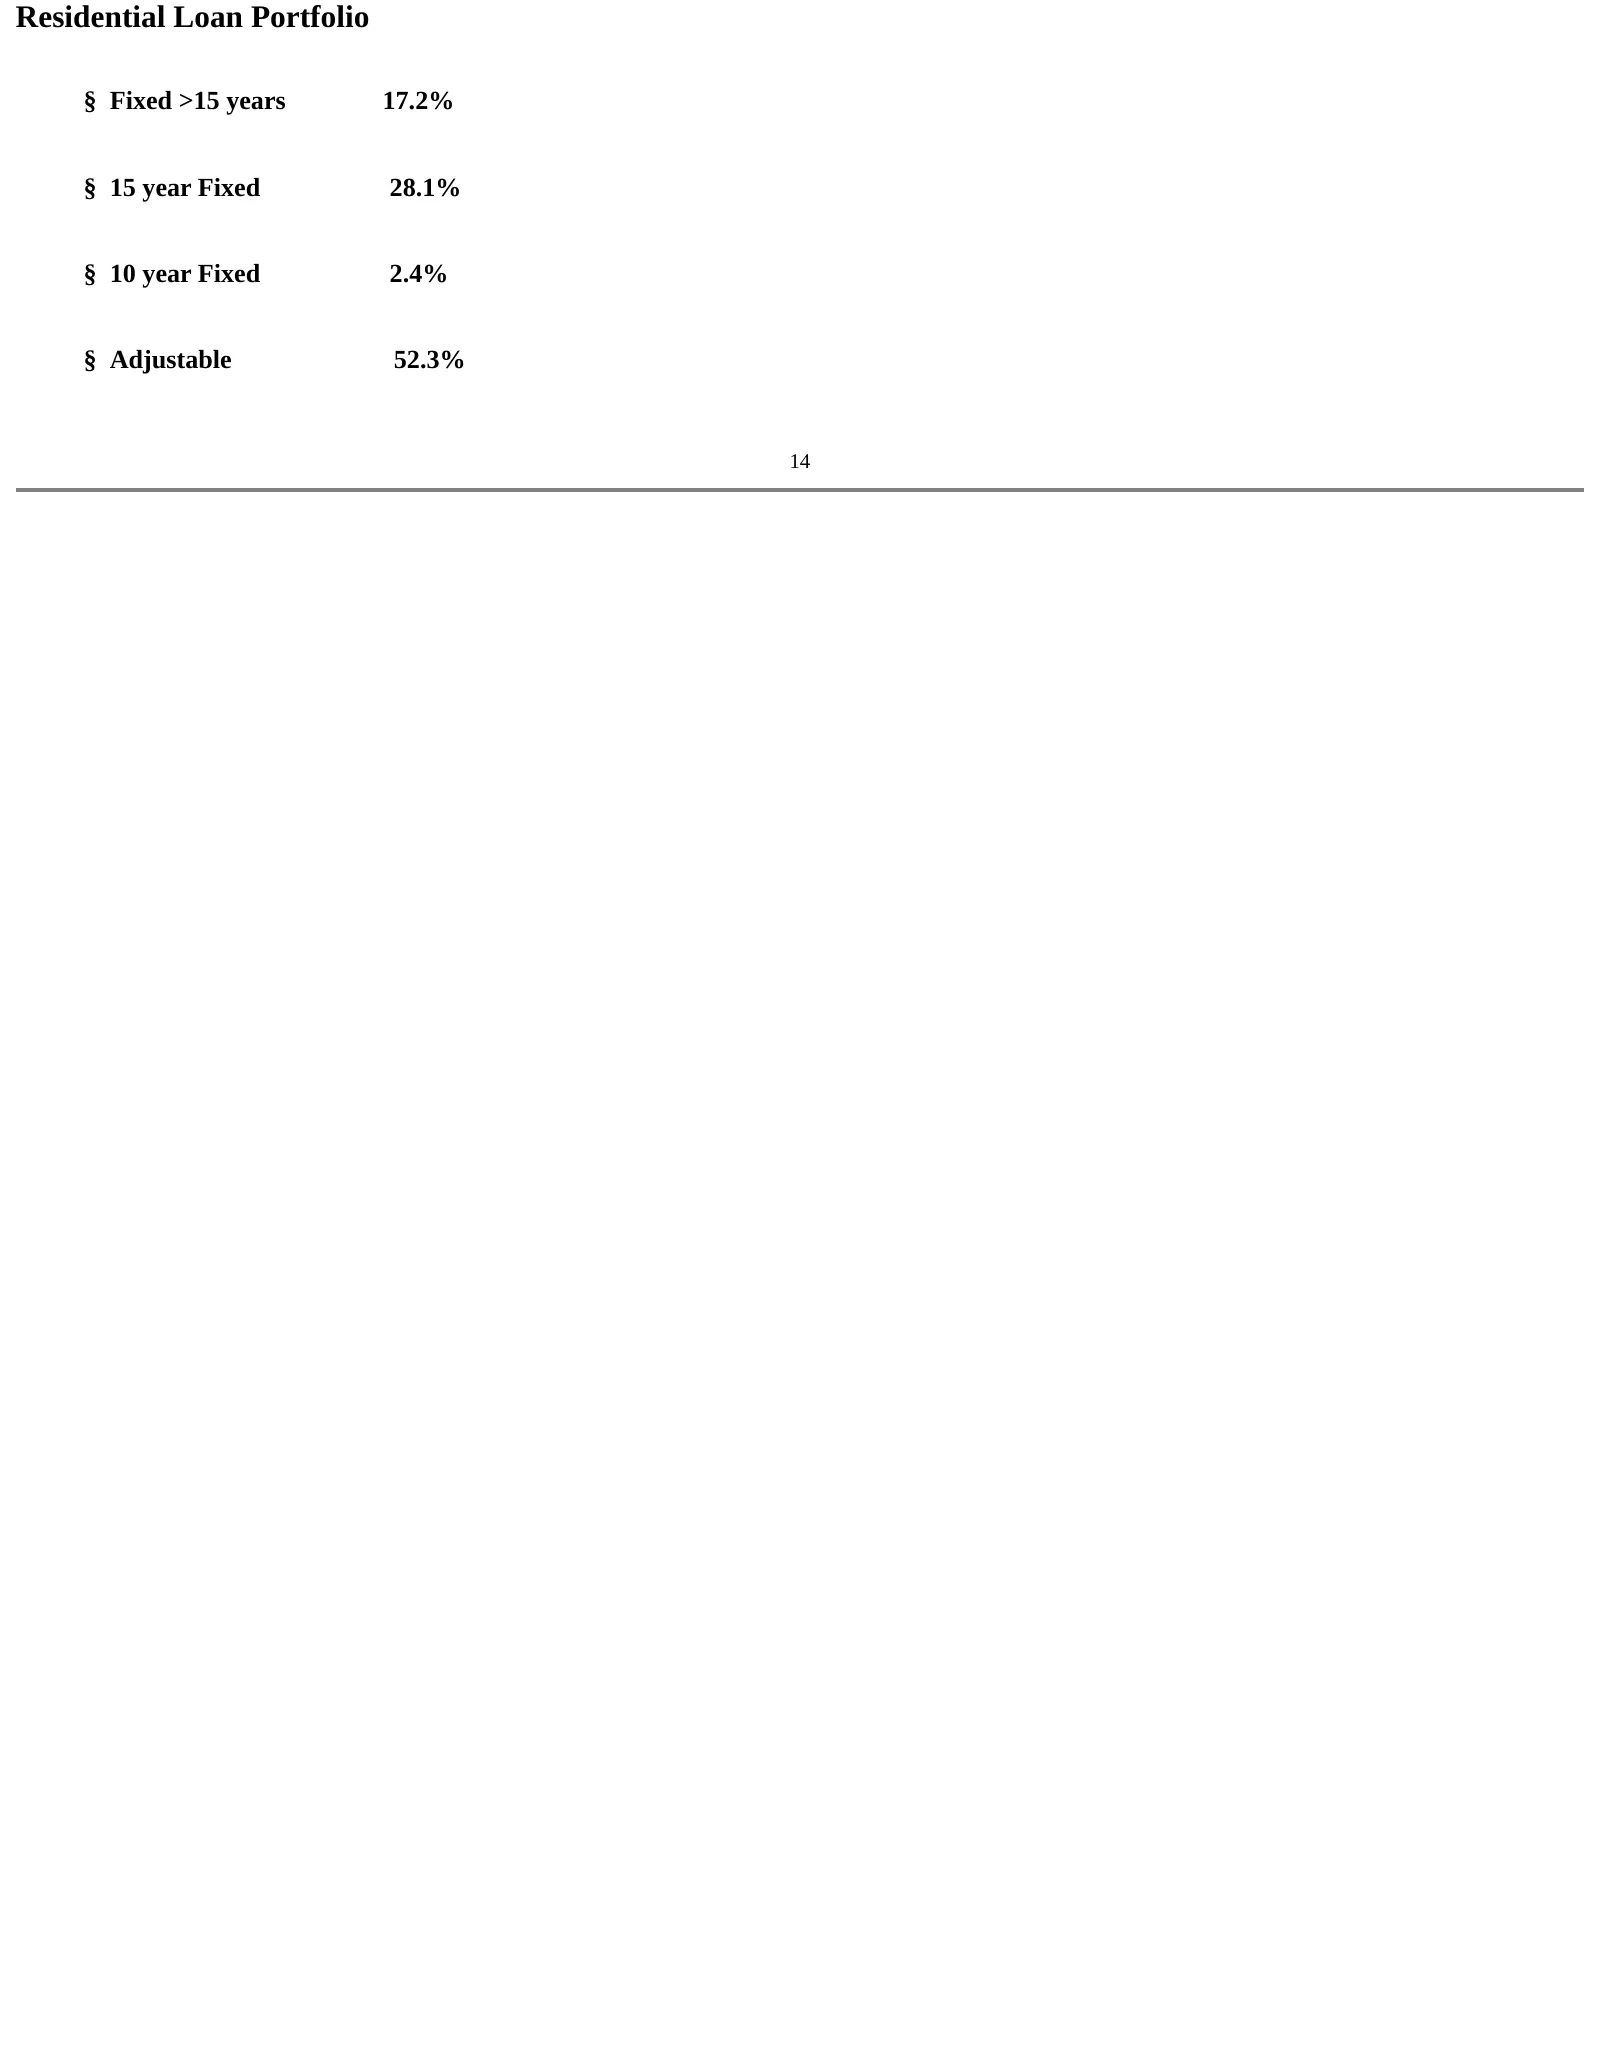
Residential Loan Portfolio § Fixed >15 years 17.2% § 15 year Fixed 28.1% § 10 year Fixed 2.4% § Adjustable 52.3% 14

Slide 15: Residential Portfolio Balances
Residential Portfolio Balances § Originated by NAL 82% § Purchased by NAL 17% 15
Slide 16: Purchased Mortgages
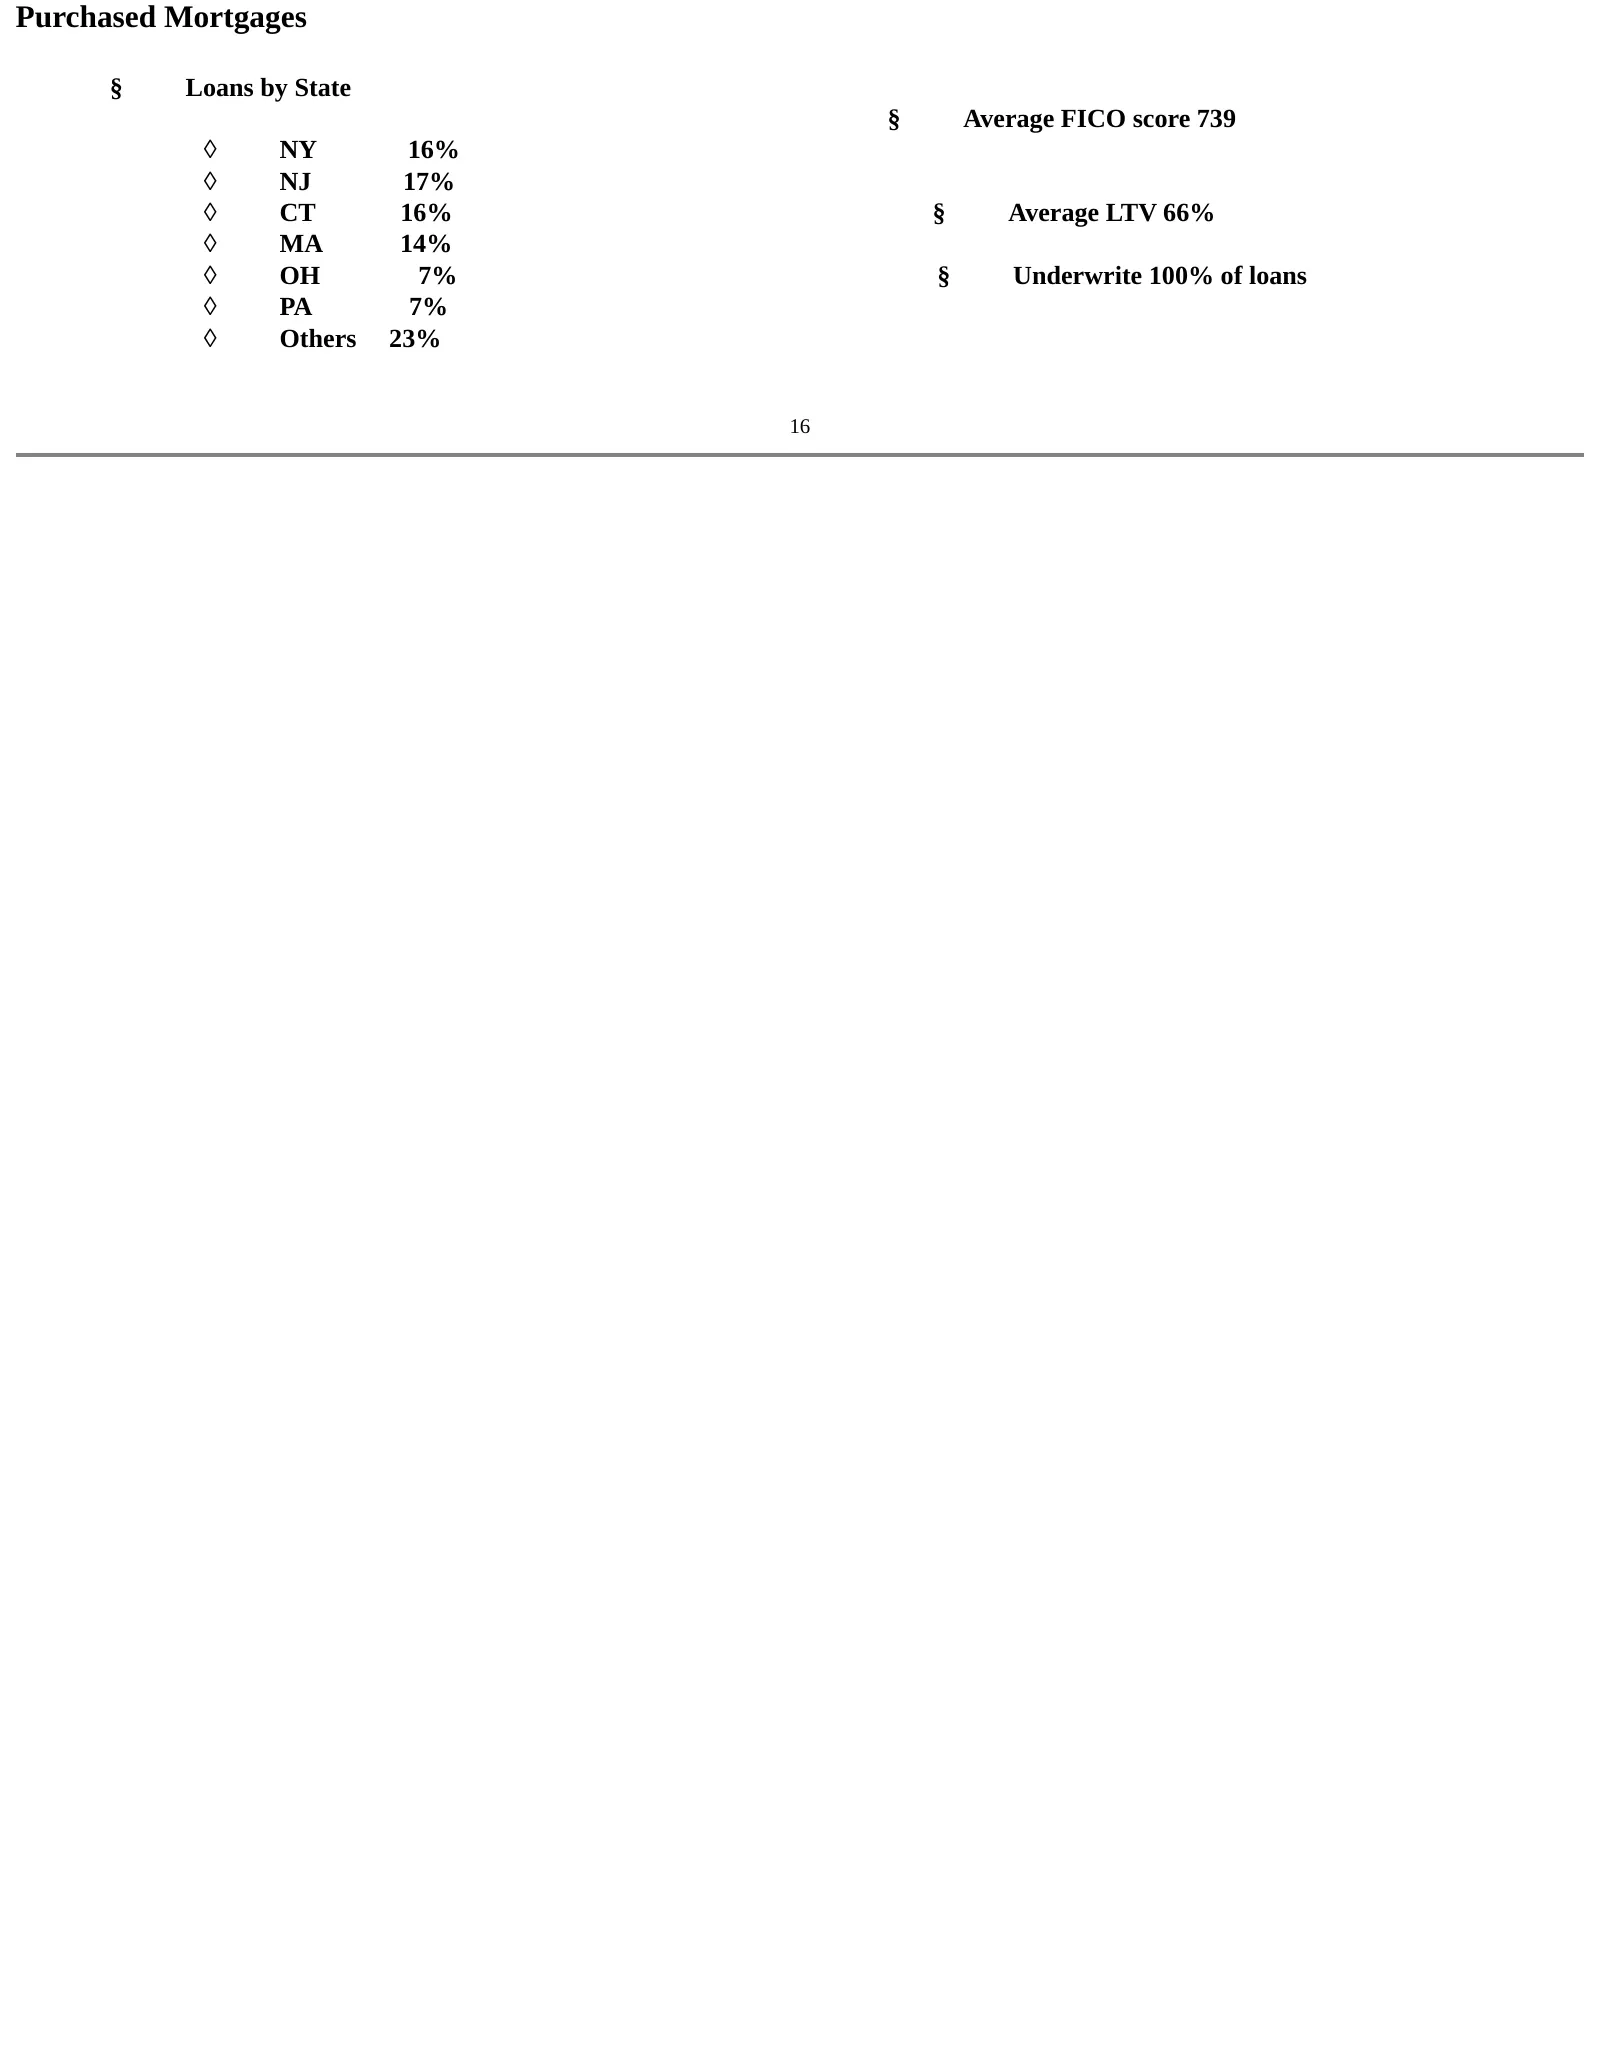
Purchased Mortgages § Loans by State § Average FICO score 739 ◊ NY 16% ◊ NJ 17% ◊ CT 16% § Average LTV 66% ◊ MA 14% ◊ OH 7% § Underwrite 100% of loans ◊ PA 7% ◊ Others 23% 16

Slide 17: CRE Loan Portfolio
CRE Loan Portfolio § 18.4% Fixed > 10 years § 5.9% Fixed 10 years or less § 60.6% Adjustable § 15.1% Construction 17

Slide 18: Consumer Loan Portfolio
Consumer Loan Portfolio § 47.1% Home Equity loans § 48.7% Home Equity lines § 4.2% Other Consumer 18

Slide 19: Investments
Investments 96% Agency or AAA 33.6% Adjustable MBS 0.4% 30 year Fixed MBS 7.2% 15 year Fixed MBS 20.2% CMOs 8.8% 5 year + 7 year balloons 6.8% Agencies 19
Slide 20: Durations
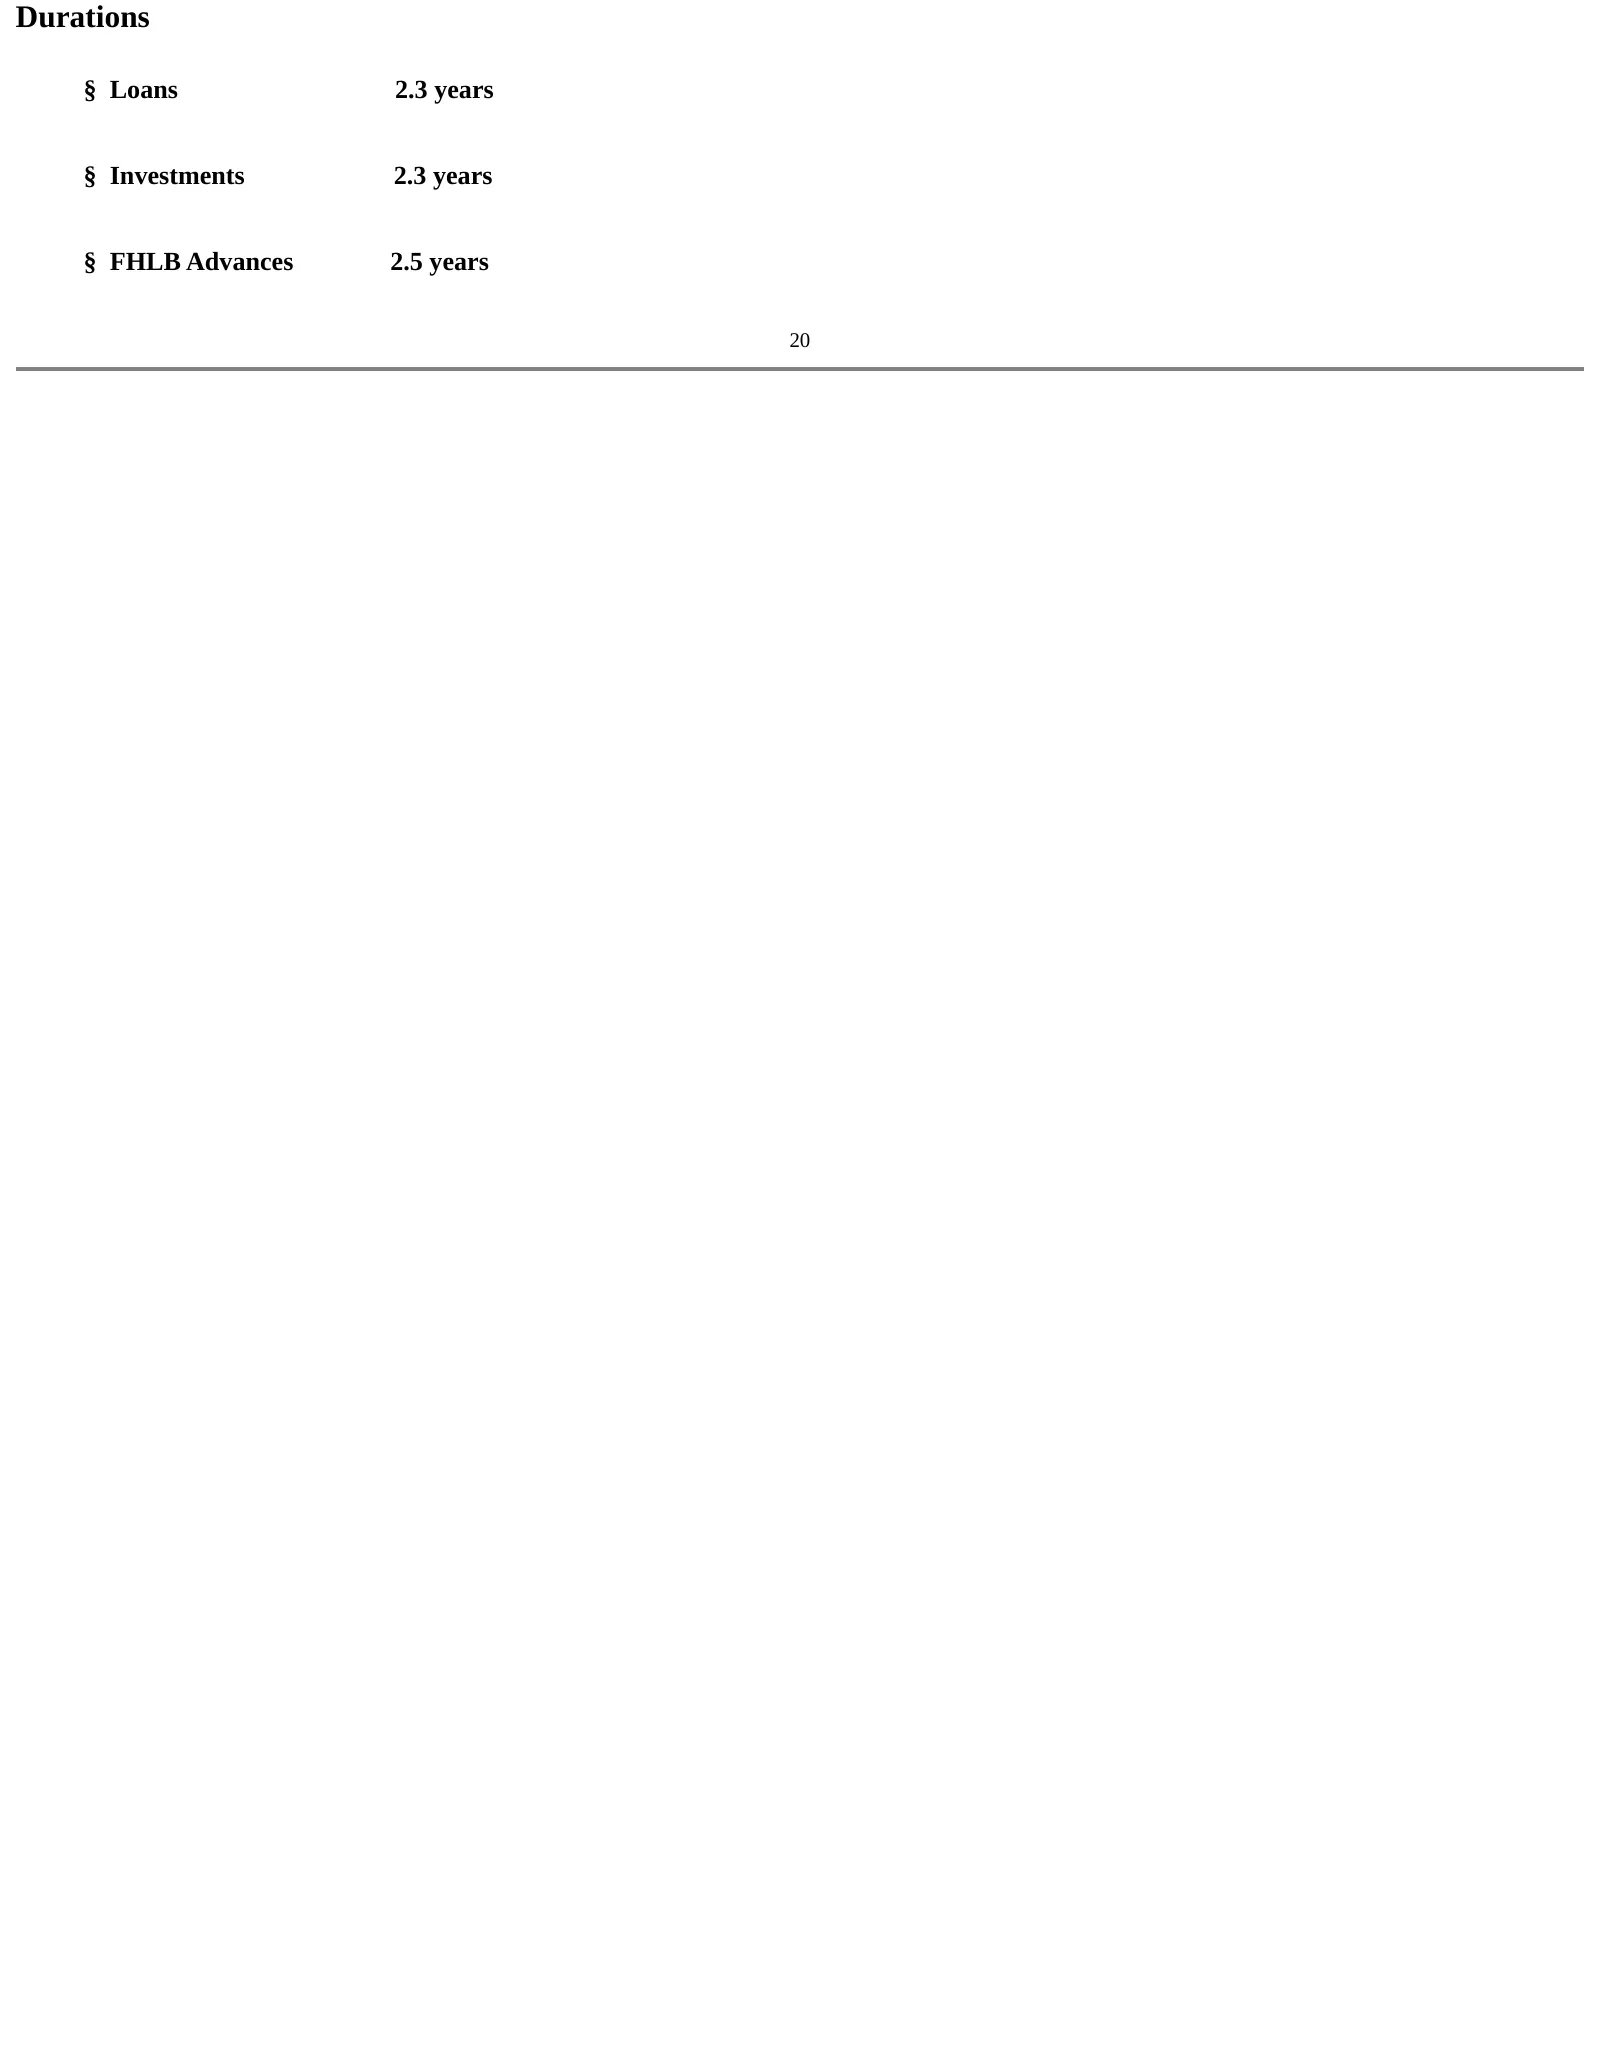
Durations § Loans 2.3 years § Investments 2.3 years § FHLB Advances 2.5 years 20
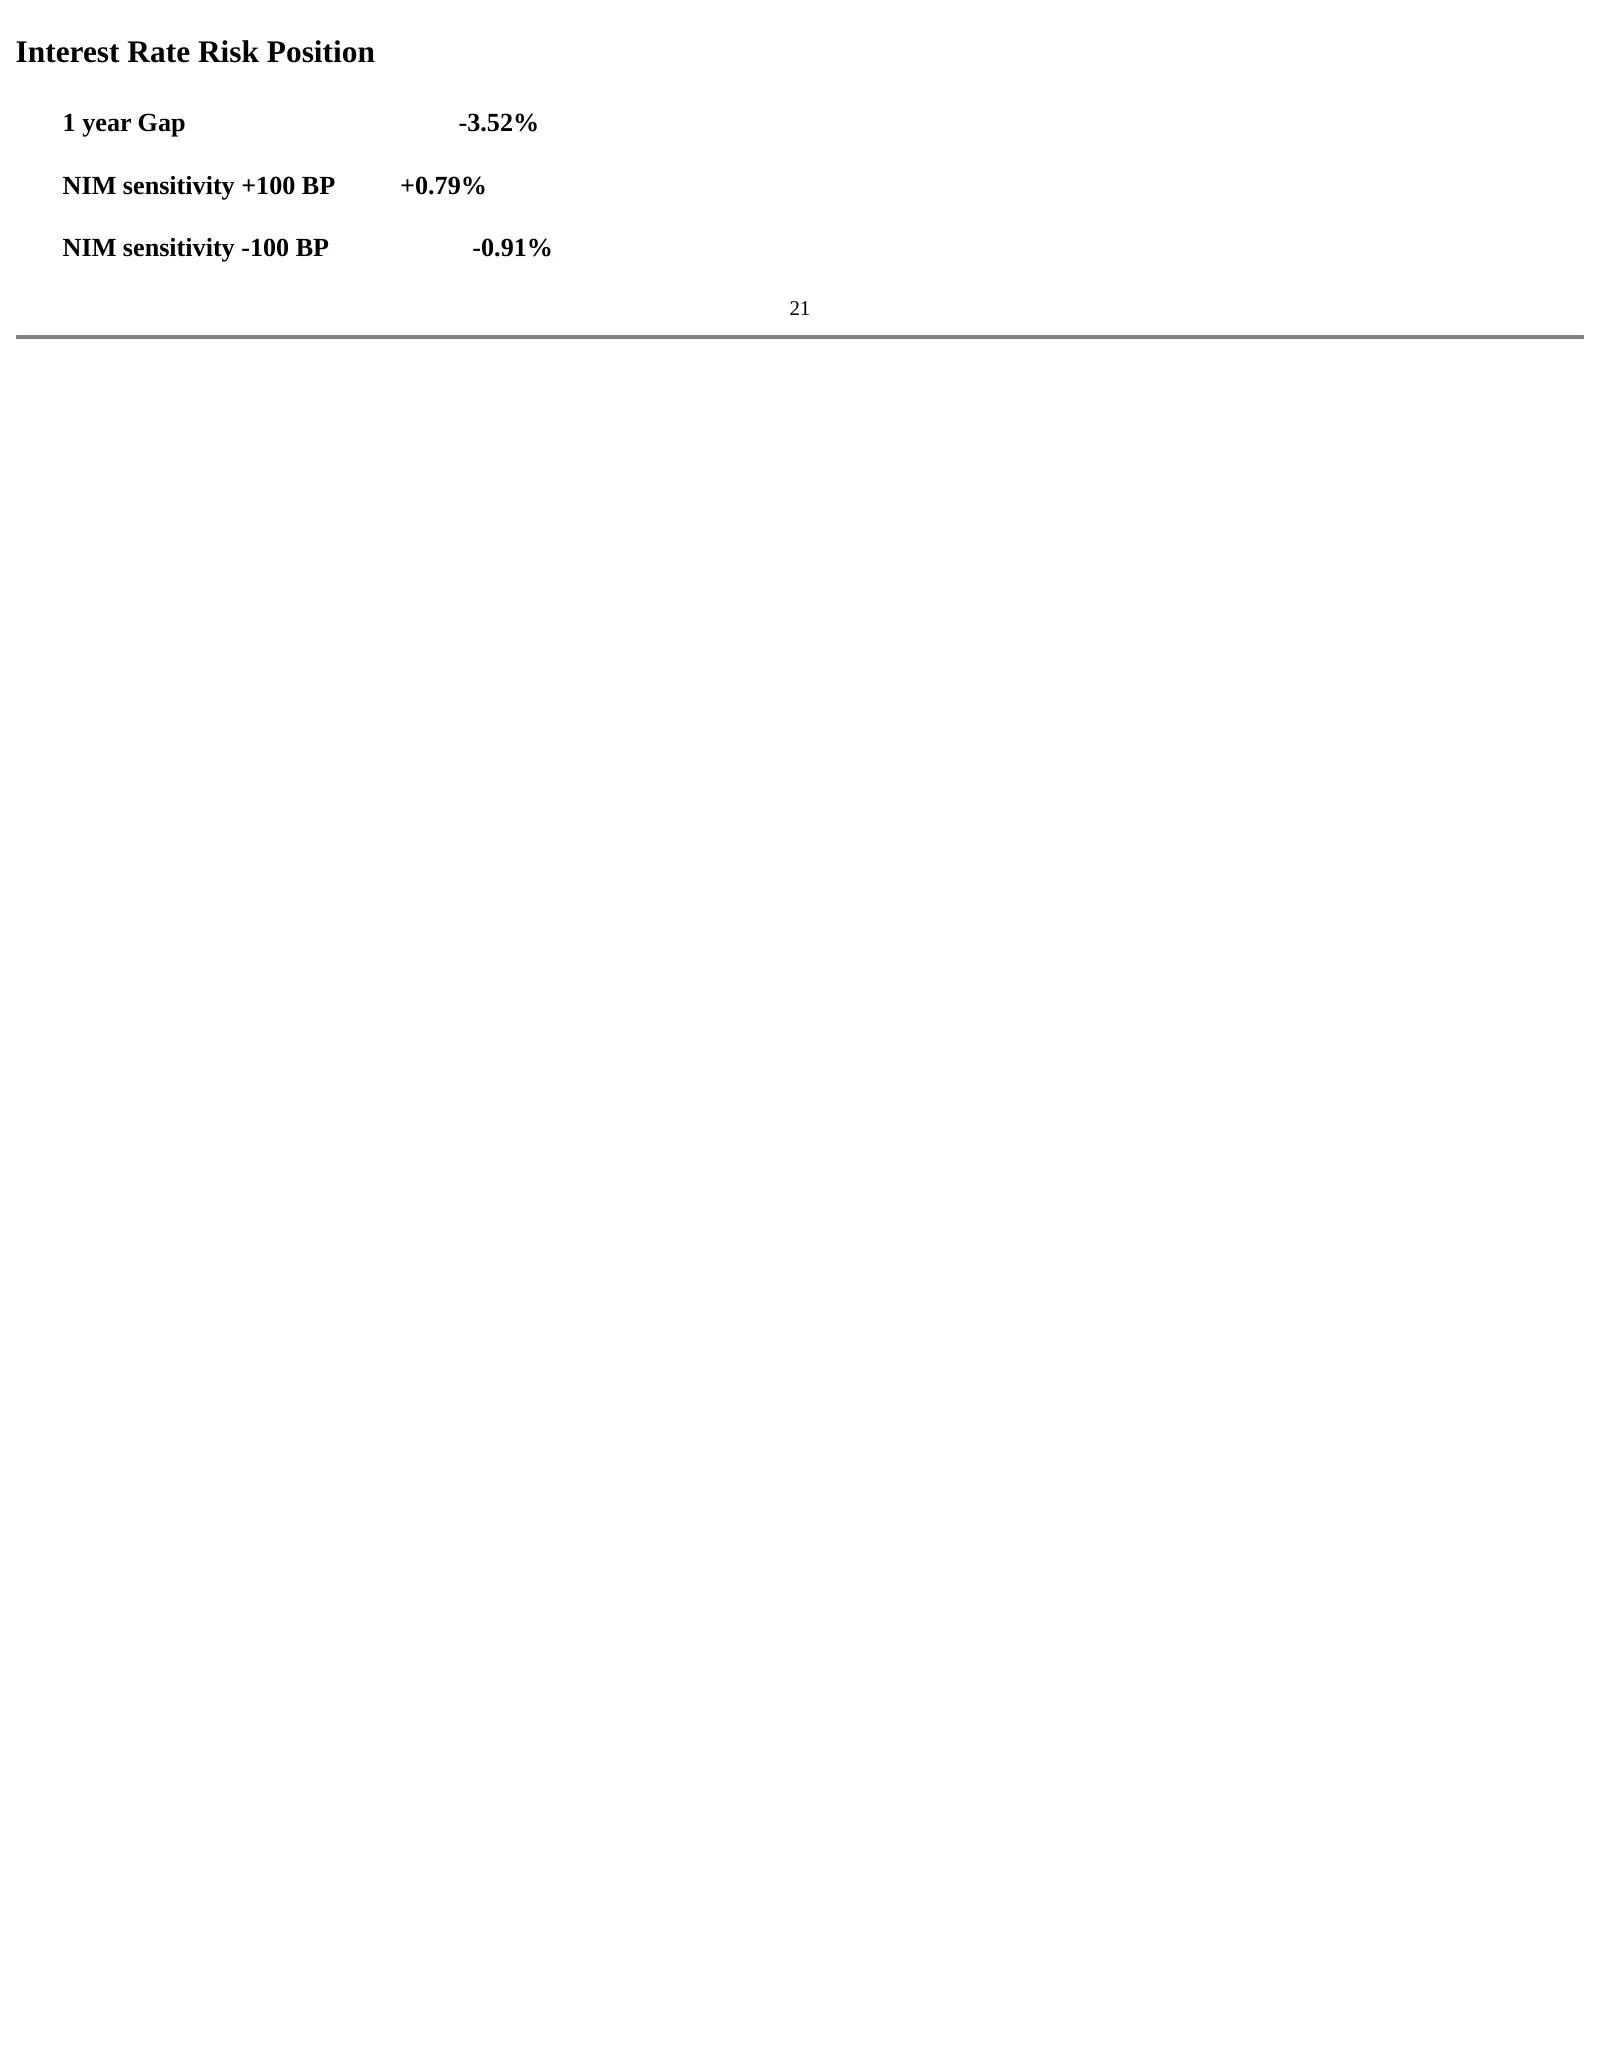
Slide 21: Interest Rate Risk Position
Interest Rate Risk Position 1 year Gap -3.52% NIM sensitivity +100 BP +0.79% NIM sensitivity -100 BP -0.91% 21

Slide 22: In Summary
In Summary § Anticipate EPS growth in 10% range, exclusive of options expensing and conversion and merger related charges; § Comfortable with Street consensus of 52 cents; § Loan growth subject to strong underwriting standards; § Continue rigorous capital deployment. 22

Slide 23: Capital ideas. Human values.
[Logo] Capital ideas. Human values.
Source: SEC EDGAR · 8-K filed May 2, 2006
More decks from Newalliance Bancshares Inc
 Merger or Acquisition (November 2010)45 slides · Nov 18, 2010
 Stifel, Nicolaus & Company, Inc. Bank and Thrift Conference 201037 slides · Nov 3, 2010
 Merger or Acquisition (August 2010)25 slides · Aug 25, 2010
 Merger or Acquisition (August 2010)24 slides · Aug 19, 2010
 Merger or Acquisition (August 2010)23 slides · Aug 19, 2010
 Q2 2010 Earnings Presentation31 slides · Jul 28, 2010