Silvergate Capital Corp. · OTC:SICP
Silvergate Capital — Q1 2021 Earnings Presentation
13 slides from Silvergate Capital's earnings presentation, Apr 20, 2021

Slide 1: Silvergate Capital Corporation 1Q21 Earnings Presentation
Silvergate Capital Corporation 1Q21 Earnings Presentation April 20, 2021 Exhibit 99.2
Slide 2: Forward Looking Statements
1 5 0 41 42 44 221 228 231 146 183 188 0 107 183 0 175 220 2 #010500 #DDE4E7 #919498 #92B7BC #00AFDC #006BB7 #292A2C Forward Looking Statements This presentation contains forward looking statements within the meaning of the Securities and Exchange Act of 1934, as amended, including statements of goa
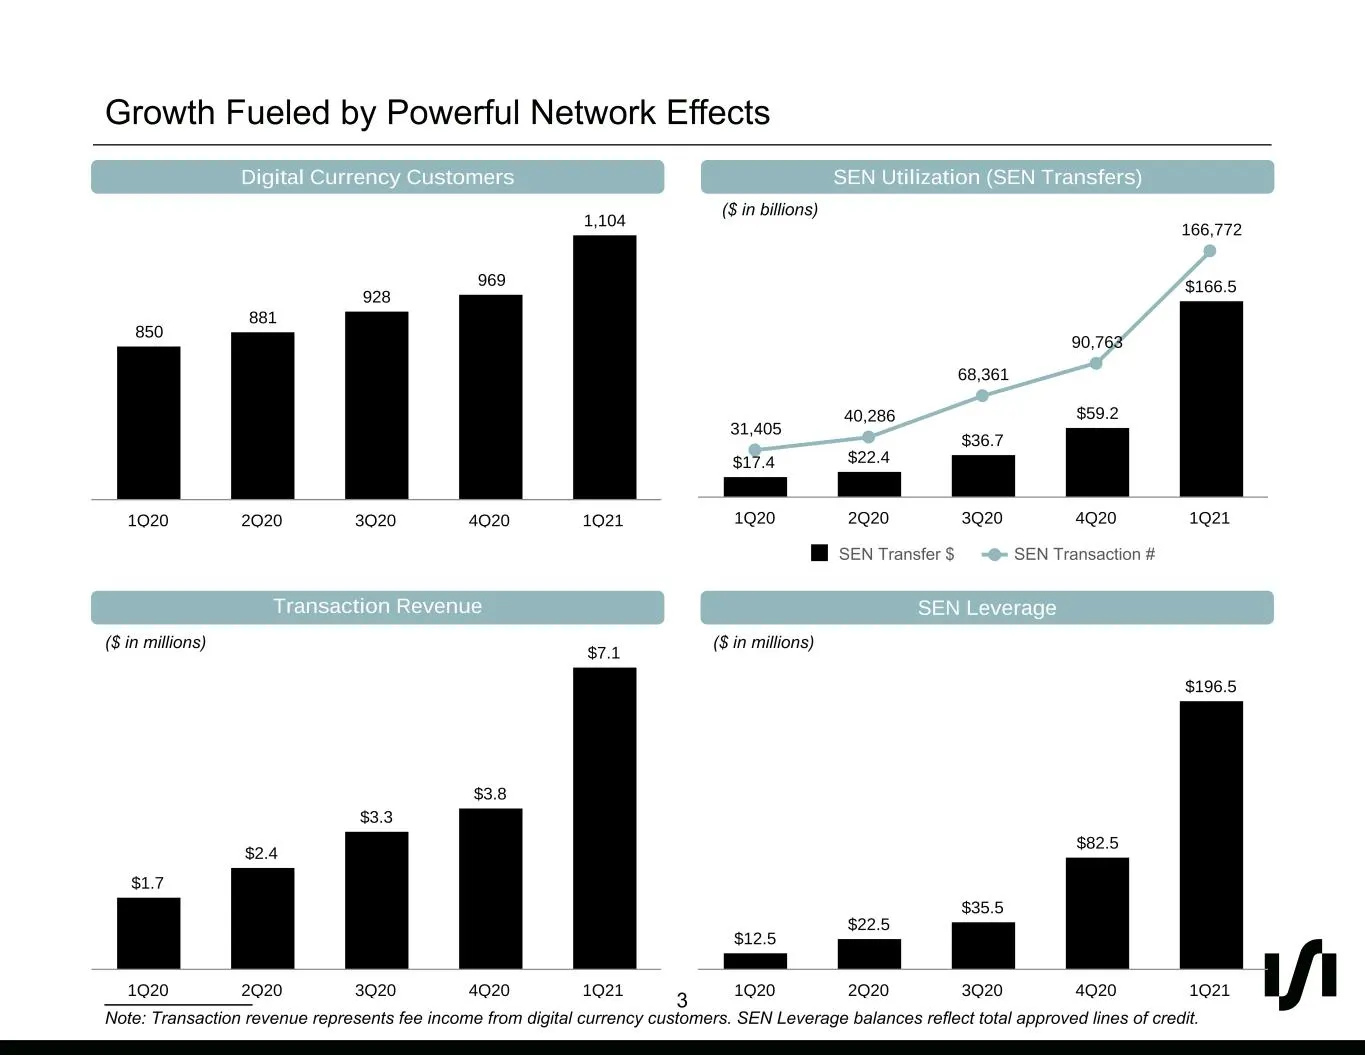
Slide 3: Growth Fueled by Powerful Network Effects
1 5 0 41 42 44 221 228 231 146 183 188 0 107 183 0 175 220 3 #010500 #DDE4E7 #919498 #92B7BC #00AFDC #006BB7 #292A2C Growth Fueled by Powerful Network Effects Digital Currency Customers SEN LeverageTransaction Revenue SEN Utilization (SEN Transfers) 850 881 928 969 1,104 1Q20 2Q20 3Q20 4Q20 1Q21 $17
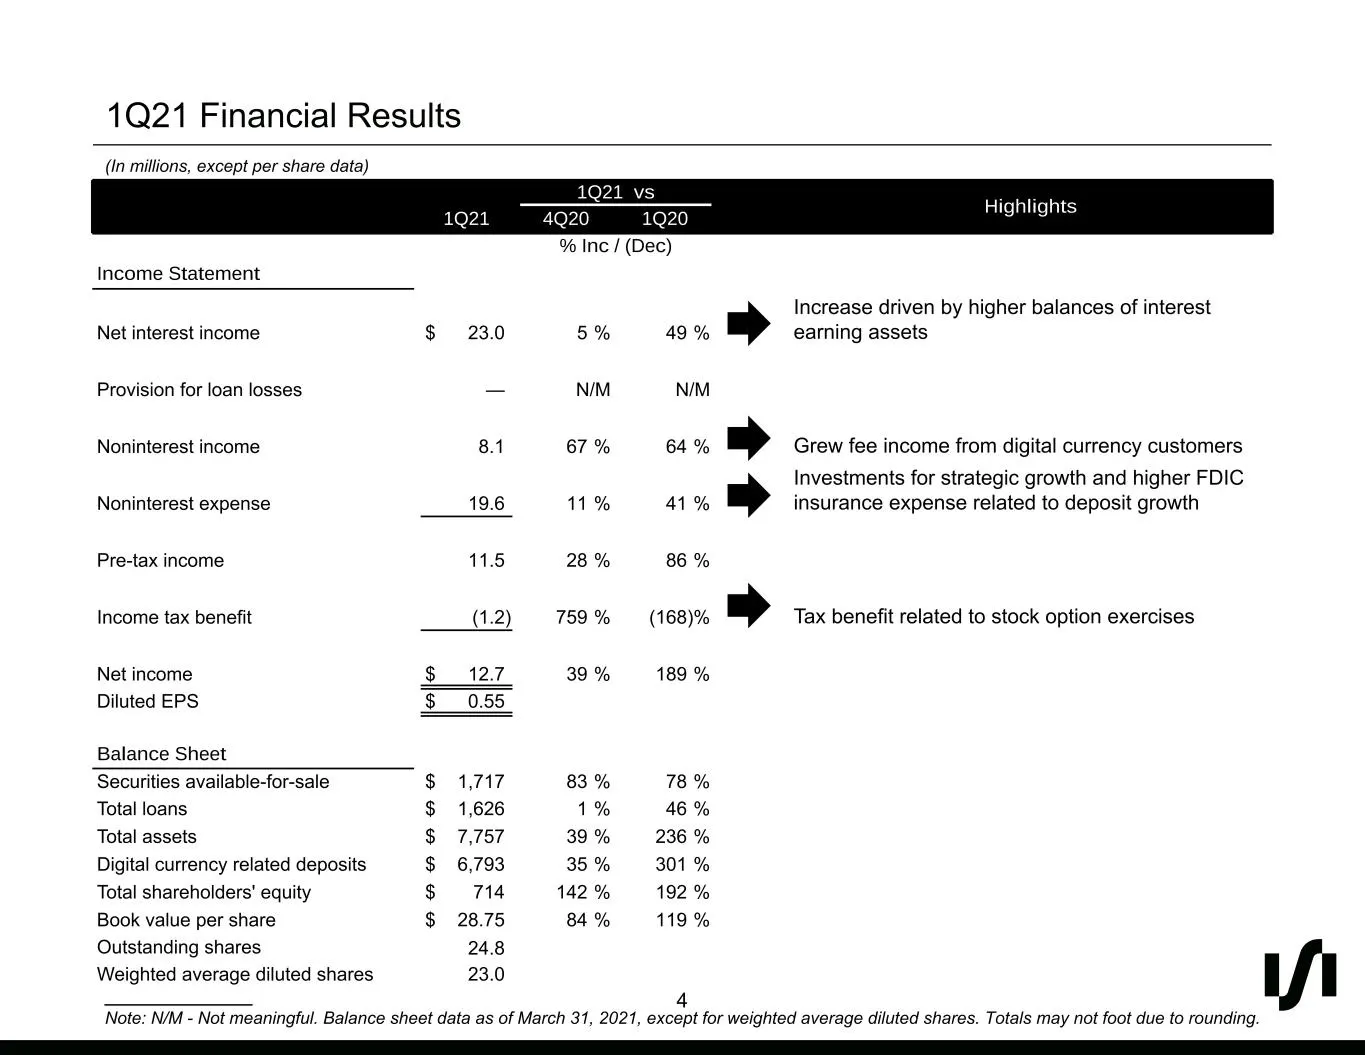
Slide 4: 1Q21 Financial Results
1 5 0 41 42 44 221 228 231 146 183 188 0 107 183 0 175 220 4 #010500 #DDE4E7 #919498 #92B7BC #00AFDC #006BB7 #292A2C 1Q21 Financial Results (In millions, except per share data) ___________ Note: N/M - Not meaningful. Balance sheet data as of March 31, 2021, except for weighted average diluted shares
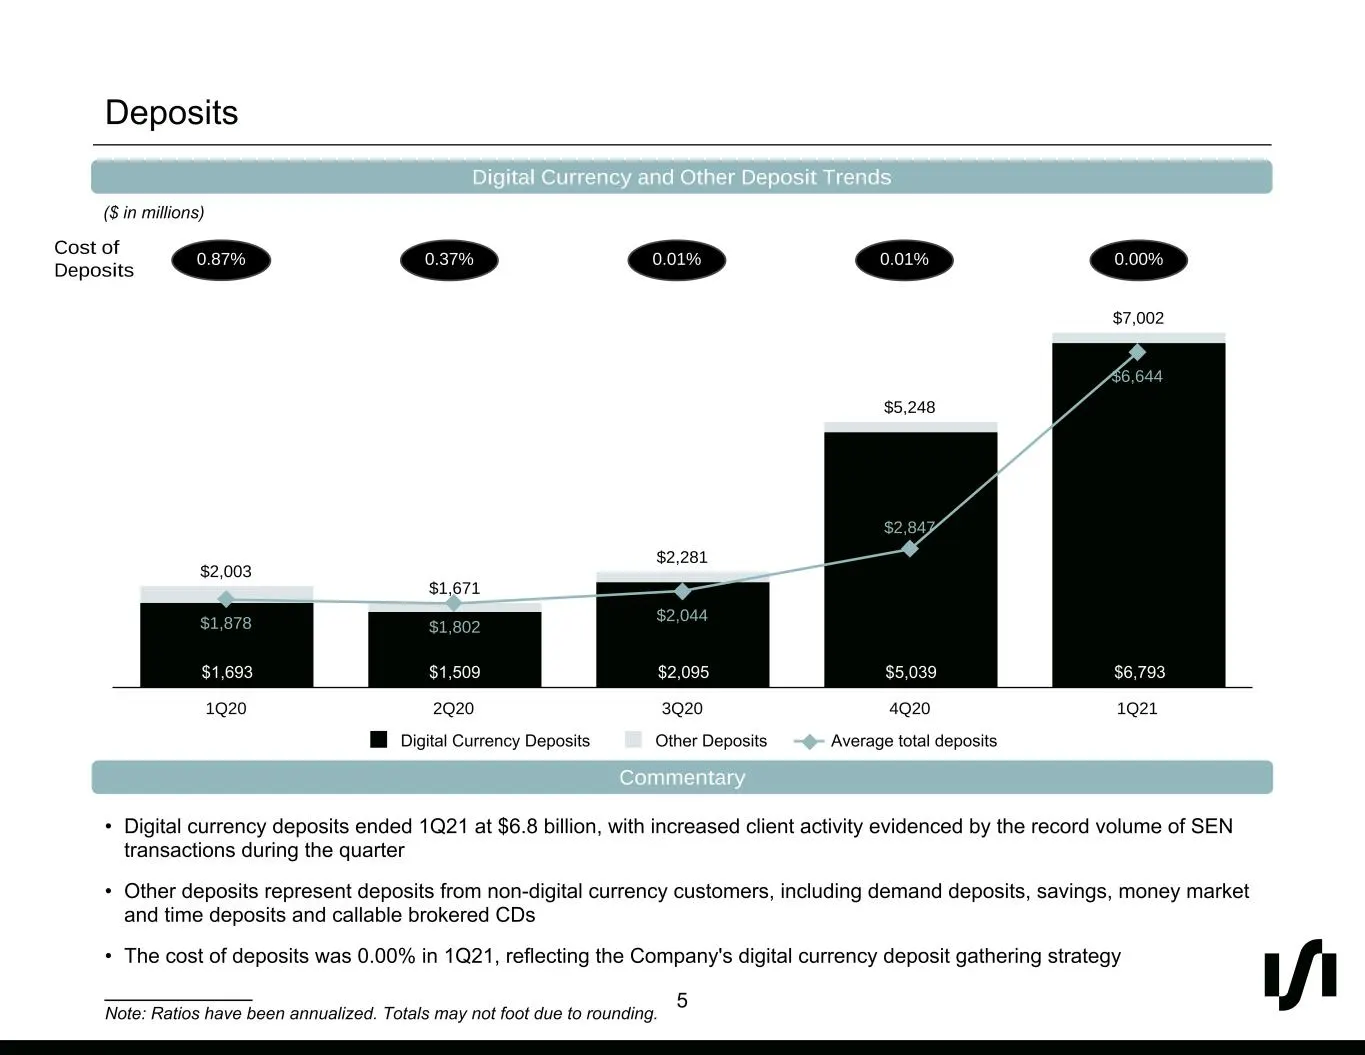
Slide 5: Deposits
1 5 0 41 42 44 221 228 231 146 183 188 0 107 183 0 175 220 5 #010500 #DDE4E7 #919498 #92B7BC #00AFDC #006BB7 #292A2C Deposits Digital Currency and Other Deposit Trends Commentary • Digital currency deposits ended 1Q21 at $6.8 billion, with increased client activity evidenced by the record volume of
Slide 6: Yields, Cost of Funds and Net Interest Margin Trends
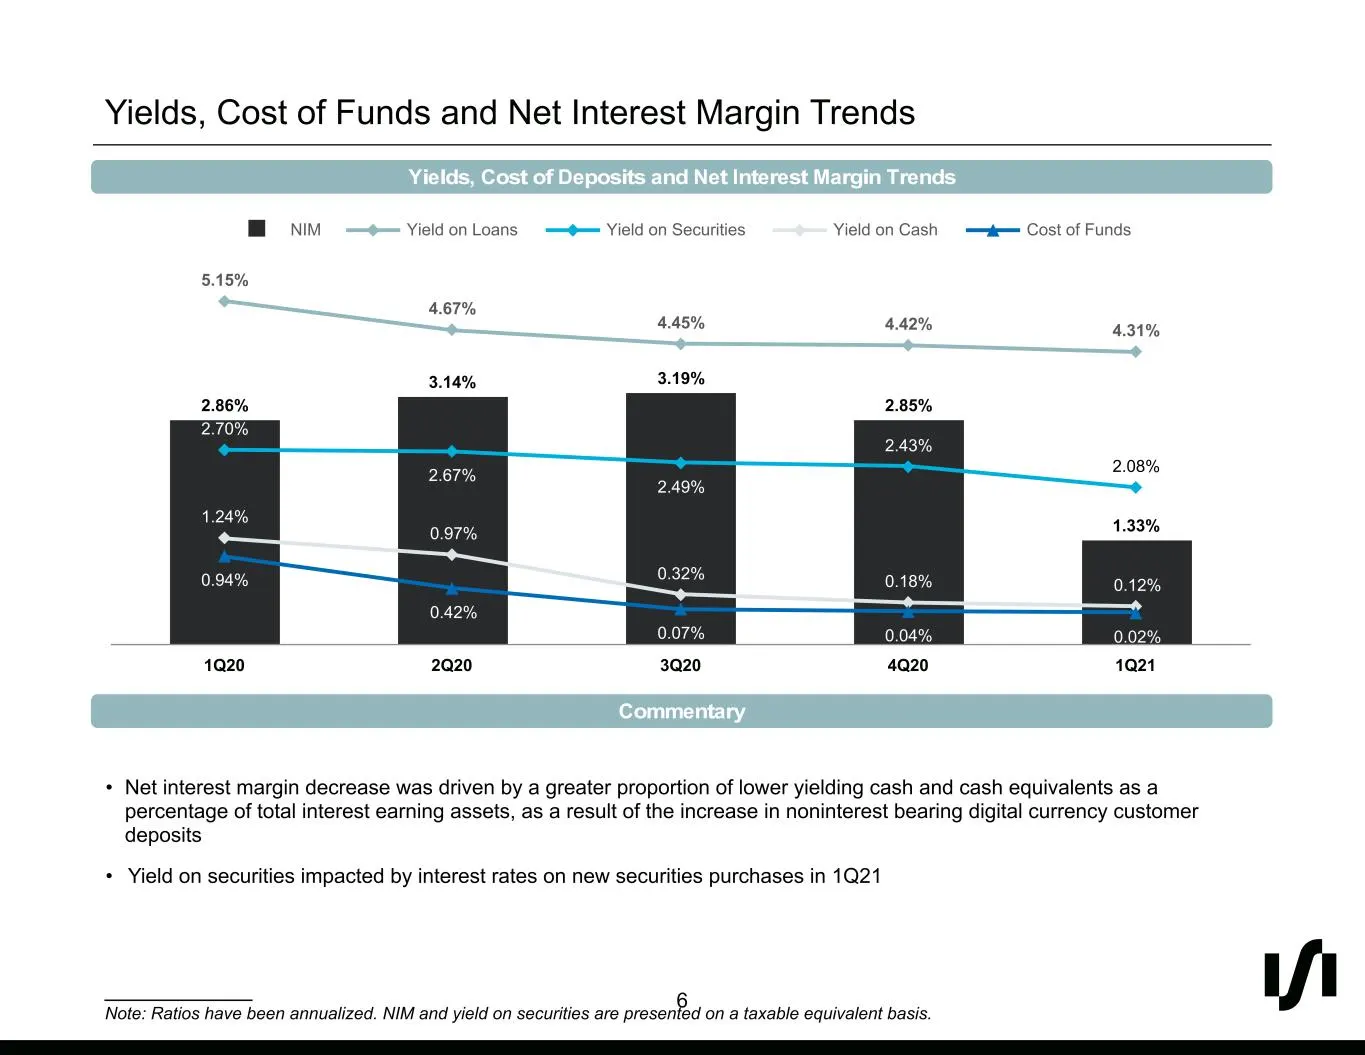
1 5 0 41 42 44 221 228 231 146 183 188 0 107 183 0 175 220 6 #010500 #DDE4E7 #919498 #92B7BC #00AFDC #006BB7 #292A2C Yields, Cost of Funds and Net Interest Margin Trends • Net interest margin decrease was driven by a greater proportion of lower yielding cash and cash equivalents as a percentage of t
Slide 7: Noninterest Income
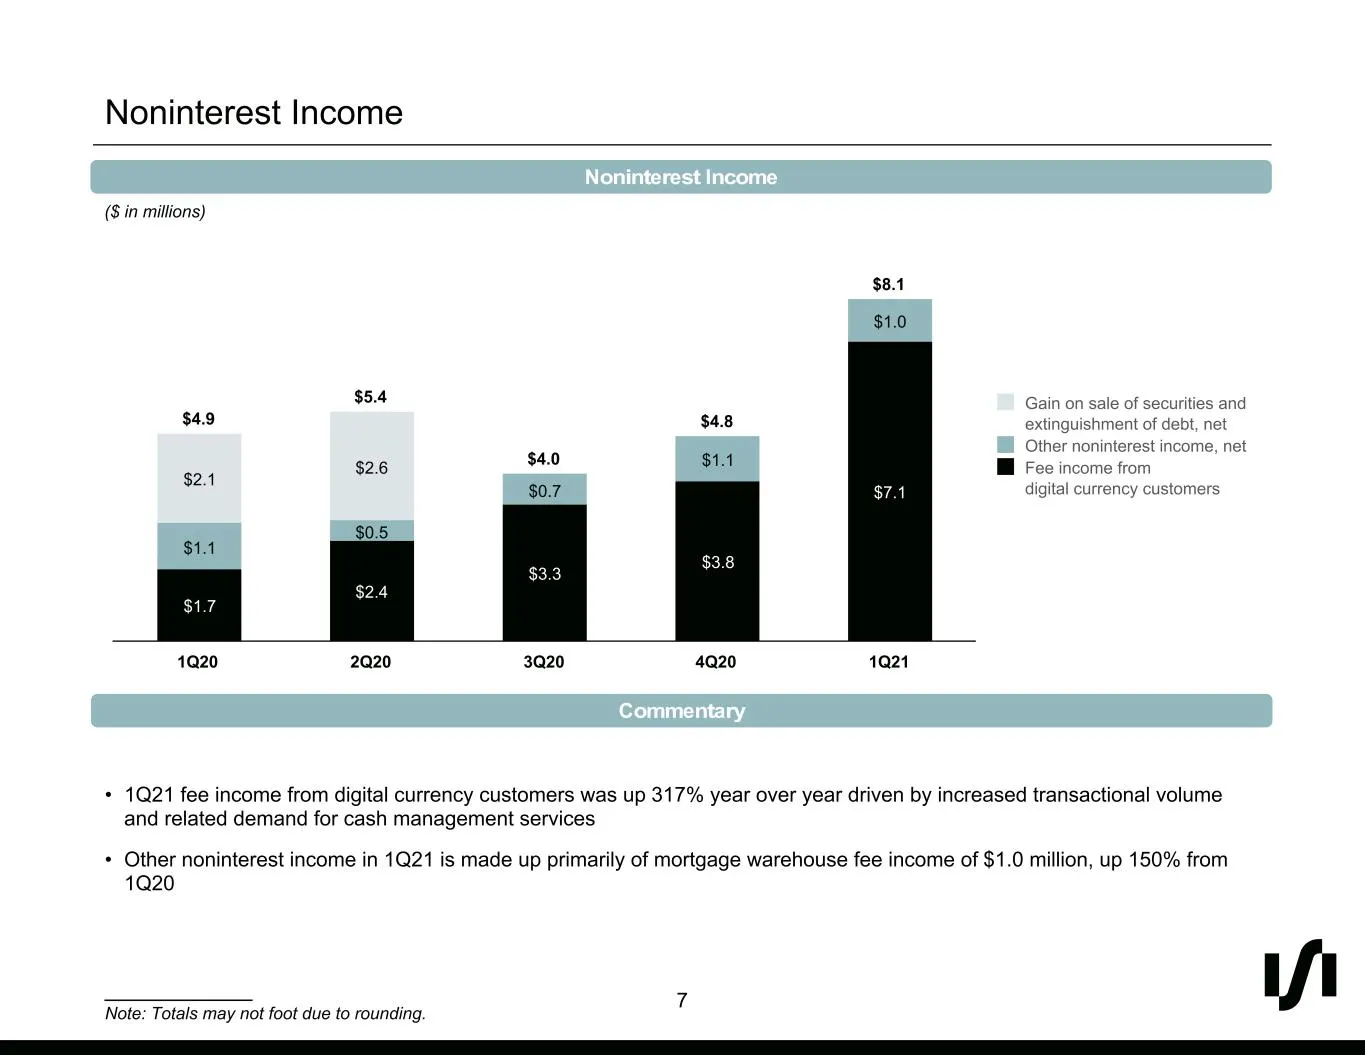
1 5 0 41 42 44 221 228 231 146 183 188 0 107 183 0 175 220 7 #010500 #DDE4E7 #919498 #92B7BC #00AFDC #006BB7 #292A2C Noninterest Income Commentary Noninterest Income • 1Q21 fee income from digital currency customers was up 317% year over year driven by increased transactional volume and related dema
Slide 8: Noninterest Expense
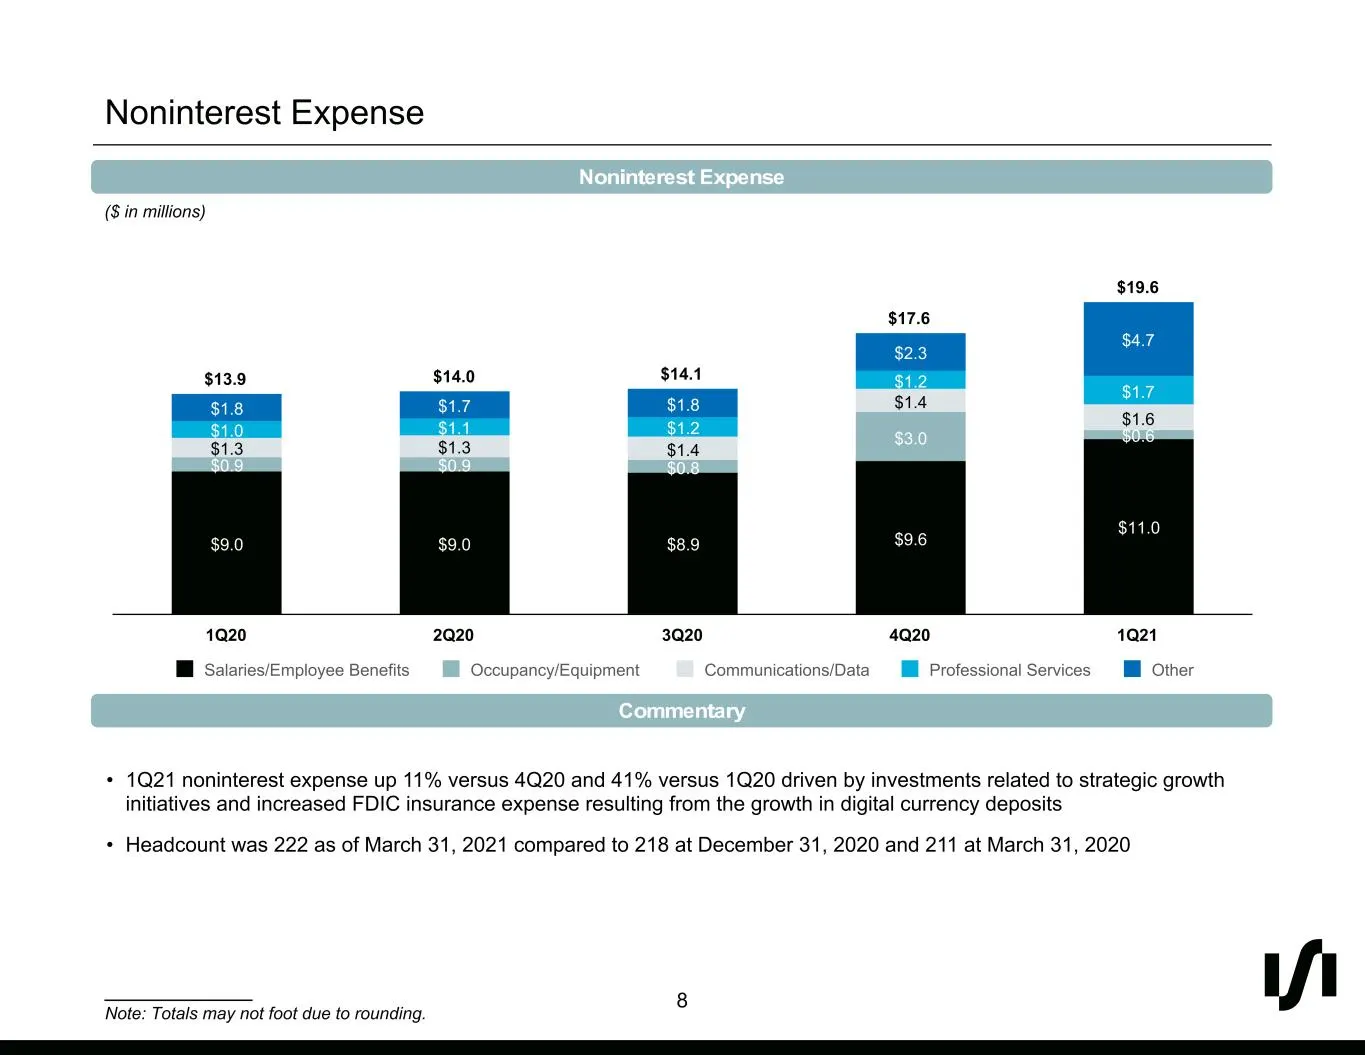
1 5 0 41 42 44 221 228 231 146 183 188 0 107 183 0 175 220 8 #010500 #DDE4E7 #919498 #92B7BC #00AFDC #006BB7 #292A2C Noninterest Expense Noninterest Expense • 1Q21 noninterest expense up 11% versus 4Q20 and 41% versus 1Q20 driven by investments related to strategic growth initiatives and increased F
Slide 9: Securities and Loan Portfolio
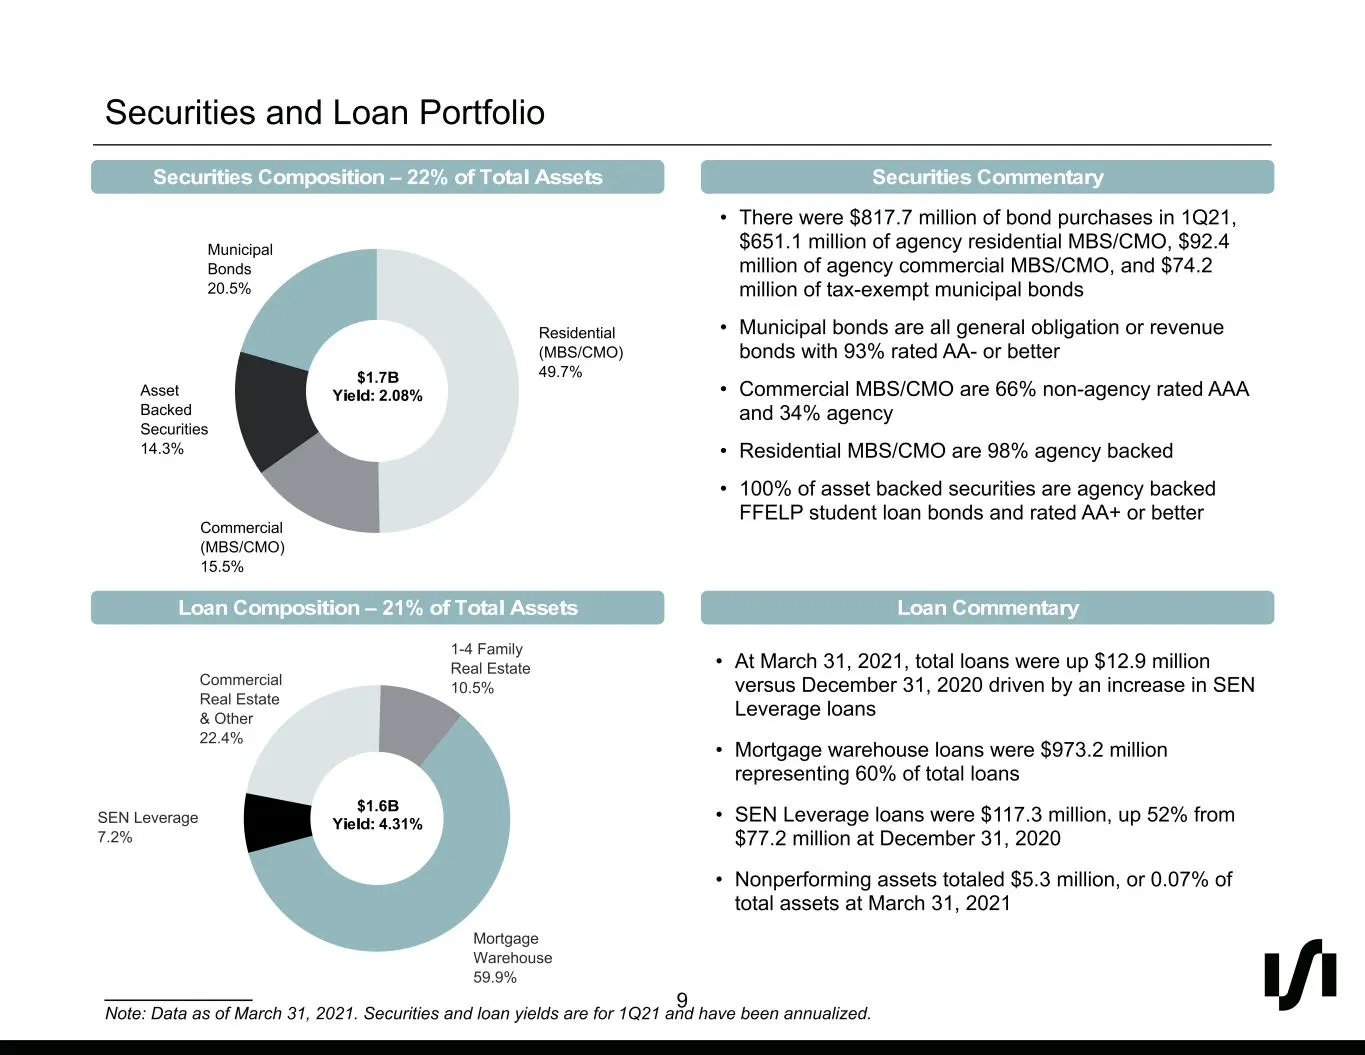
1 5 0 41 42 44 221 228 231 146 183 188 0 107 183 0 175 220 9 #010500 #DDE4E7 #919498 #92B7BC #00AFDC #006BB7 #292A2C Securities and Loan Portfolio Securities Composition – 22% of Total Assets Securities Commentary Loan Composition – 21% of Total Assets ___________ Note: Data as of March 31, 2021. Se
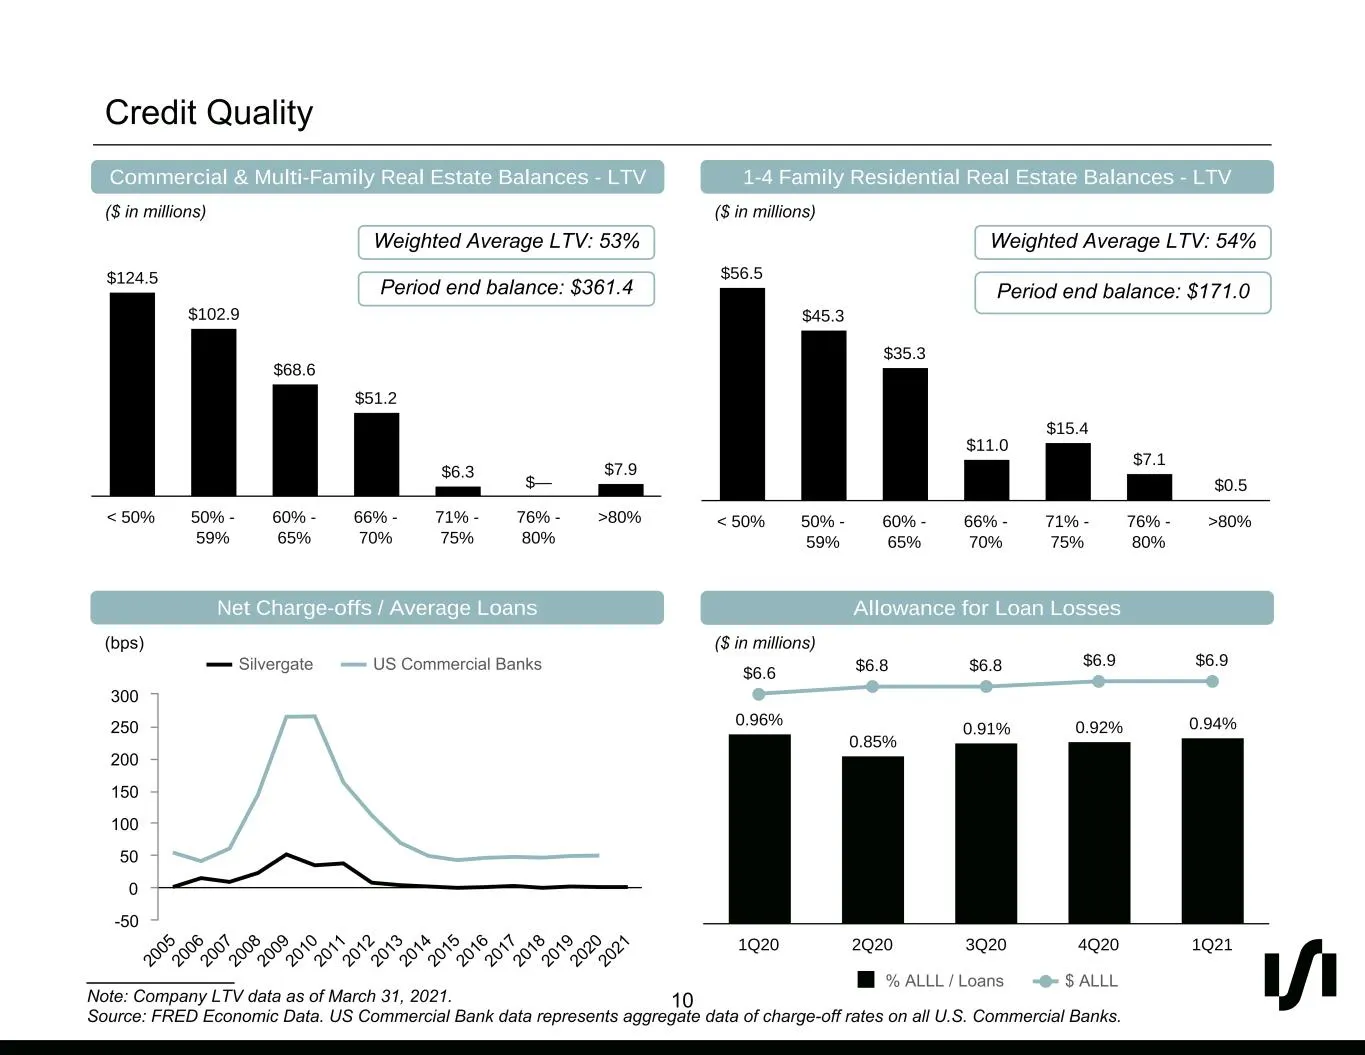
Slide 10: Credit Quality
1 5 0 41 42 44 221 228 231 146 183 188 0 107 183 0 175 220 10 #010500 #DDE4E7 #919498 #92B7BC #00AFDC #006BB7 #292A2C Credit Quality Net Charge-offs / Average Loans Commercial & Multi-Family Real Estate Balances - LTV ($ in millions) ___________ Note: Company LTV data as of March 31, 2021. Source: F
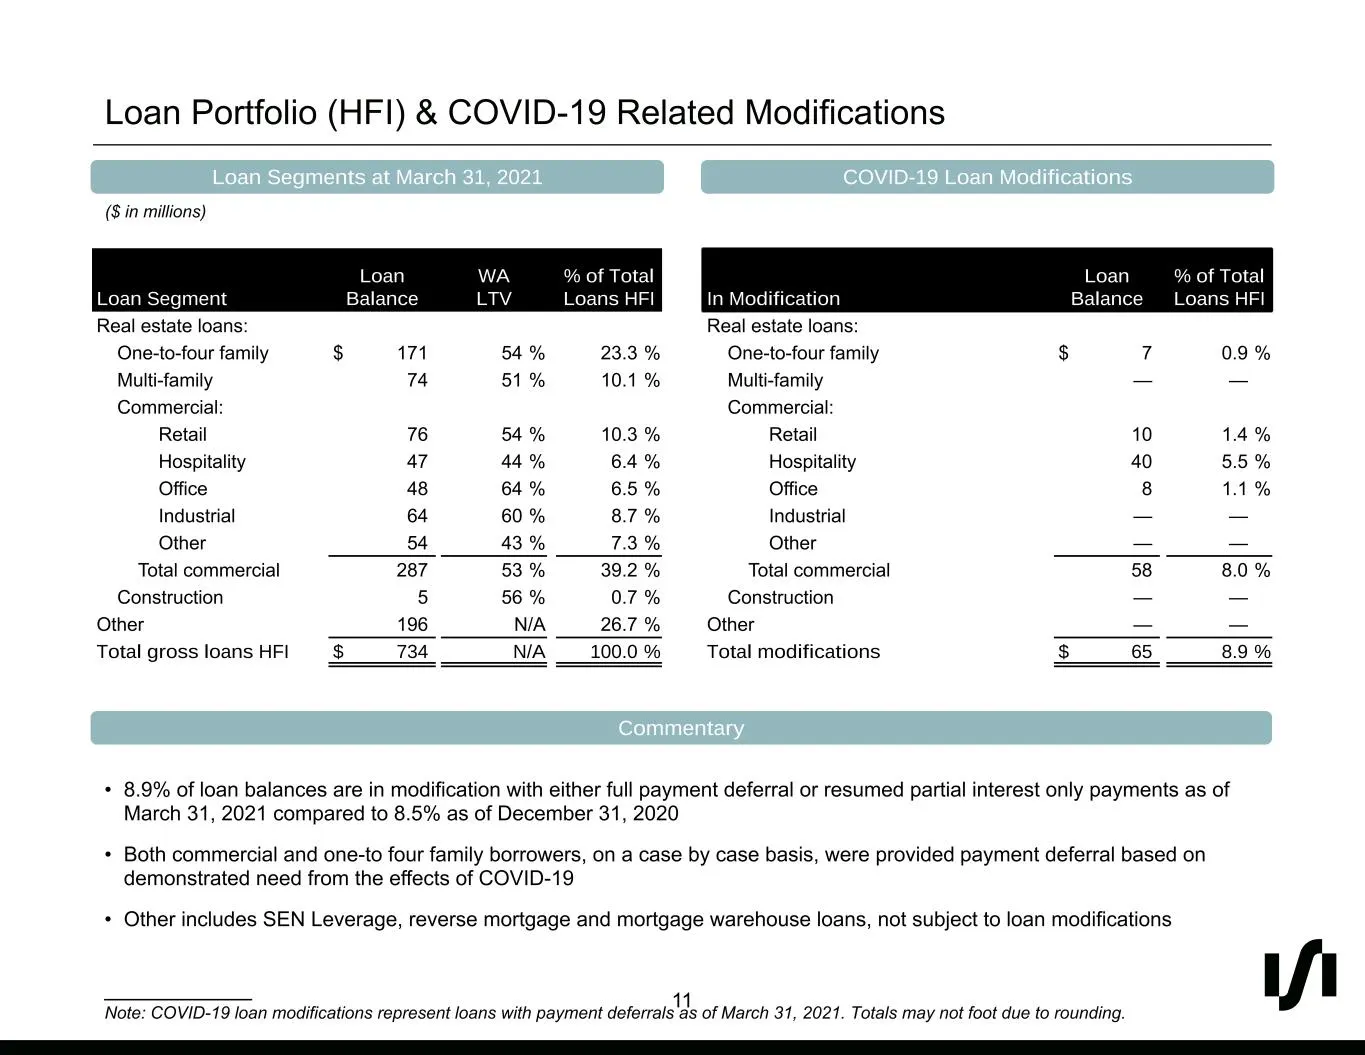
Slide 11: Loan Portfolio (HFI) & COVID-19 Related Modifications
1 5 0 41 42 44 221 228 231 146 183 188 0 107 183 0 175 220 11 #010500 #DDE4E7 #919498 #92B7BC #00AFDC #006BB7 #292A2C Loan Portfolio (HFI) & COVID-19 Related Modifications • 8.9% of loan balances are in modification with either full payment deferral or resumed partial interest only payments as of Ma
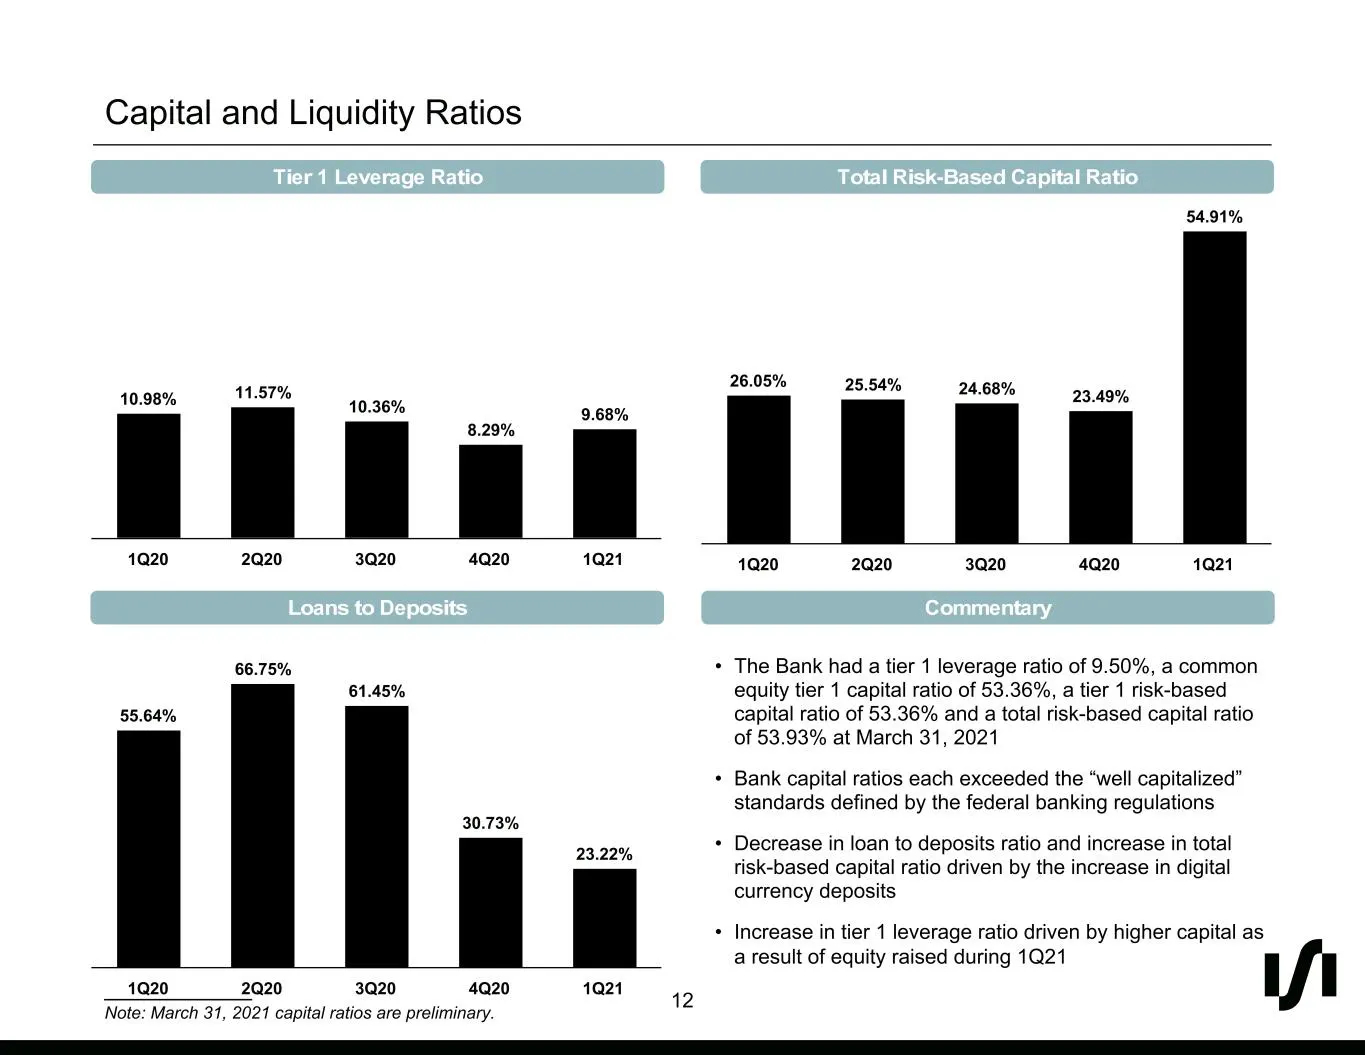
Slide 12: Capital and Liquidity Ratios
1 5 0 41 42 44 221 228 231 146 183 188 0 107 183 0 175 220 12 #010500 #DDE4E7 #919498 #92B7BC #00AFDC #006BB7 #292A2C Capital and Liquidity Ratios Tier 1 Leverage Ratio Total Risk-Based Capital Ratio • The Bank had a tier 1 leverage ratio of 9.50%, a common equity tier 1 capital ratio of 53.36%, a t
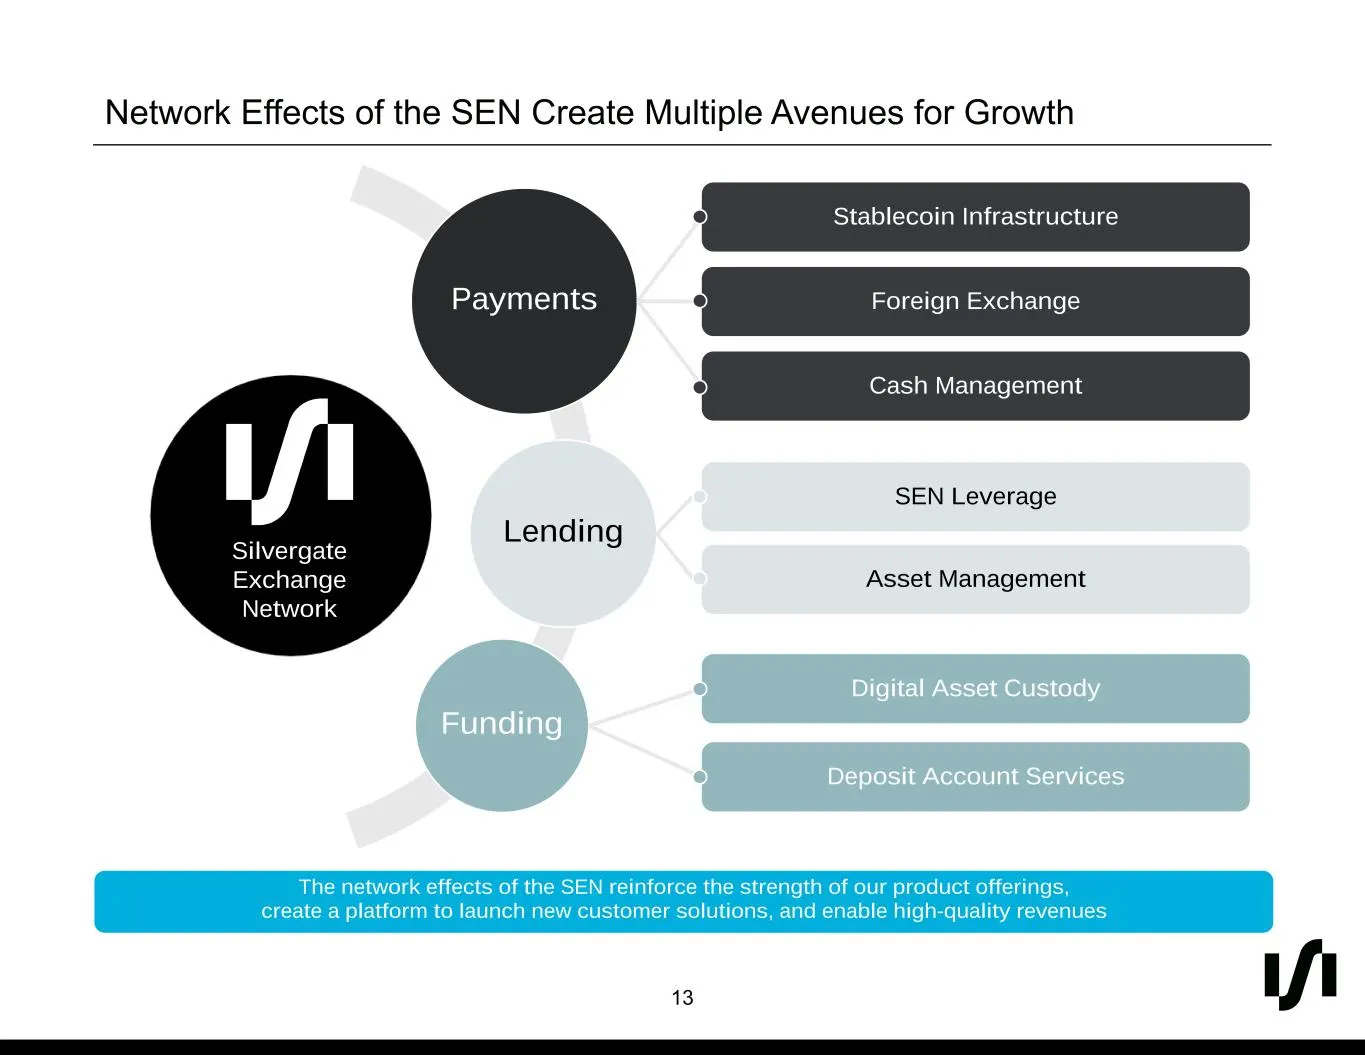
Slide 13: Network Effects of the SEN Create Multiple Avenues for Growth
1 5 0 41 42 44 221 228 231 146 183 188 0 107 183 0 175 220 13 #010500 #DDE4E7 #919498 #92B7BC #00AFDC #006BB7 #292A2C The network effects of the SEN reinforce the strength of our product offerings, create a platform to launch new customer solutions, and enable high-quality revenues Silvergate Exchan
Source: SEC EDGAR · 8-K filed Apr 20, 2021
More decks from Silvergate Capital Corp.
 Q4 2022 Earnings Presentation11 slides · Jan 17, 2023
 Investor Presentation (November 2022)13 slides · Nov 1, 2022
 Q3 2022 Earnings Presentation10 slides · Oct 18, 2022
 Investor Presentation (August 2022)14 slides · Aug 8, 2022
 Q2 2022 Earnings Presentation10 slides · Jul 19, 2022
 Investor Presentation (May 2022)15 slides · May 10, 2022