Flutter Entertainment plc · NYSE:FLUT
Flutter Entertainment — H1 2021 Earnings Presentation
52 slides from Flutter Entertainment's earnings presentation, Aug 10, 2021

Slide 1: Flutter Entertainment Plc Interim Results 2021 & US Deep Dive
Flutter Entertainment Plc Interim Results 2021 & US Deep Dive 10 August 2021 1

Slide 2: Introduction
Introduction Peter Jackson, Group CEO 2
Slide 3: Agenda
Agenda • H1 Summary • Financial Review • Group ex-US Business Update − UK and Ireland − International − Australia • US Deep Dive • Conclusion 3
Slide 4: H1 Summary
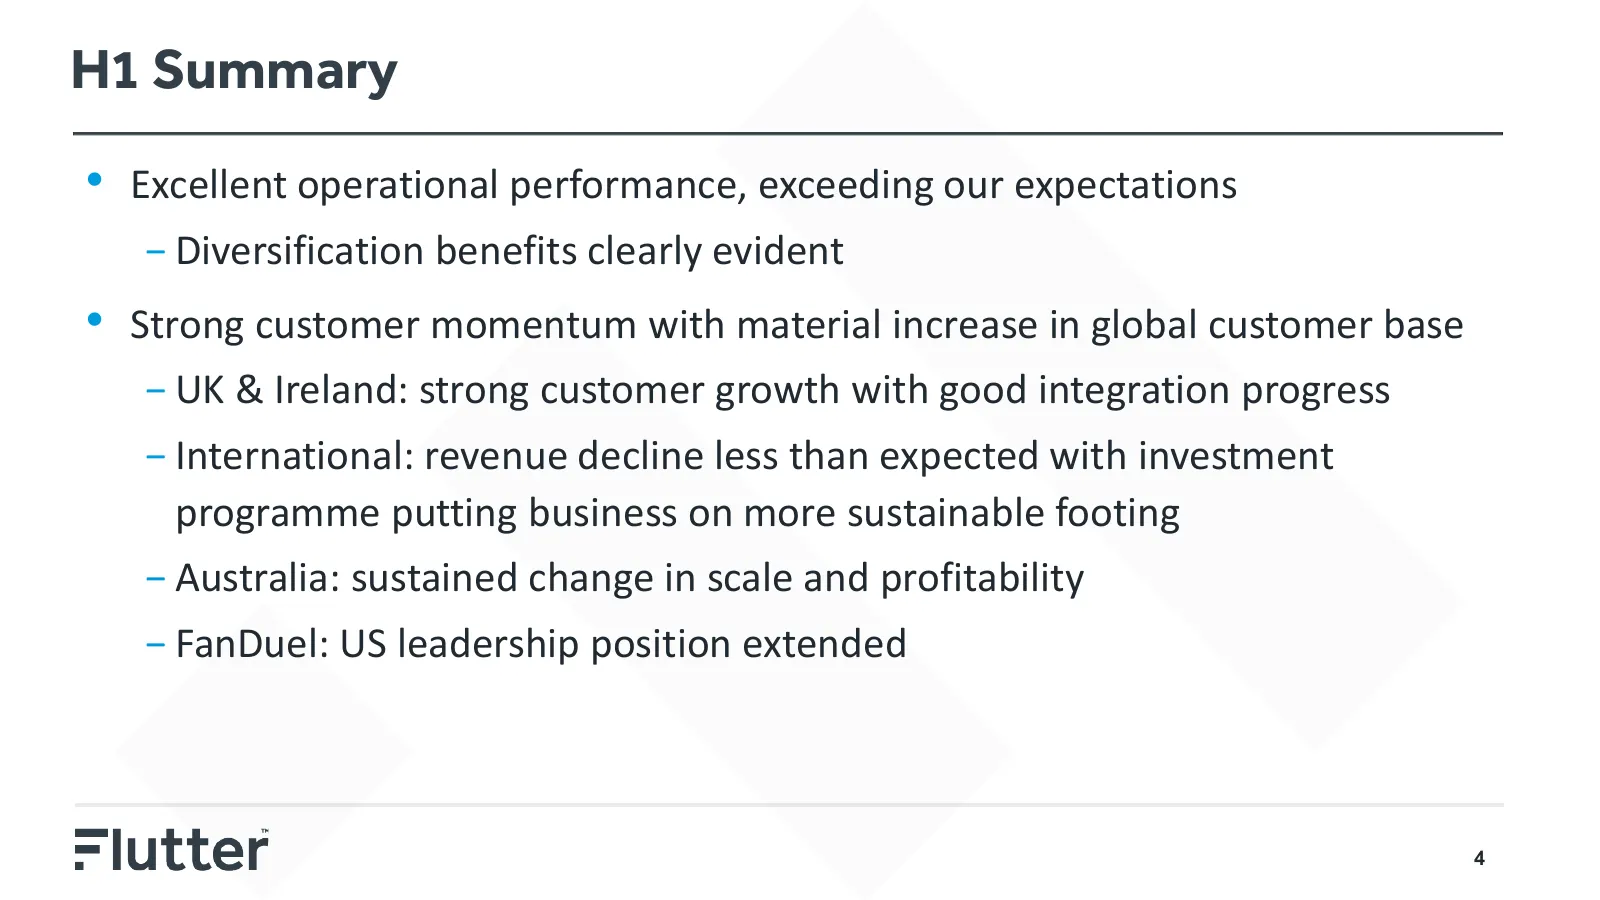
H1 Summary • Excellent operational performance, exceeding our expectations − Diversification benefits clearly evident • Strong customer momentum with material increase in global customer base − UK & Ireland: strong customer growth with good integration progress − International: revenue decline less
Slide 5: Scale and quality of Flutter Group enhanced
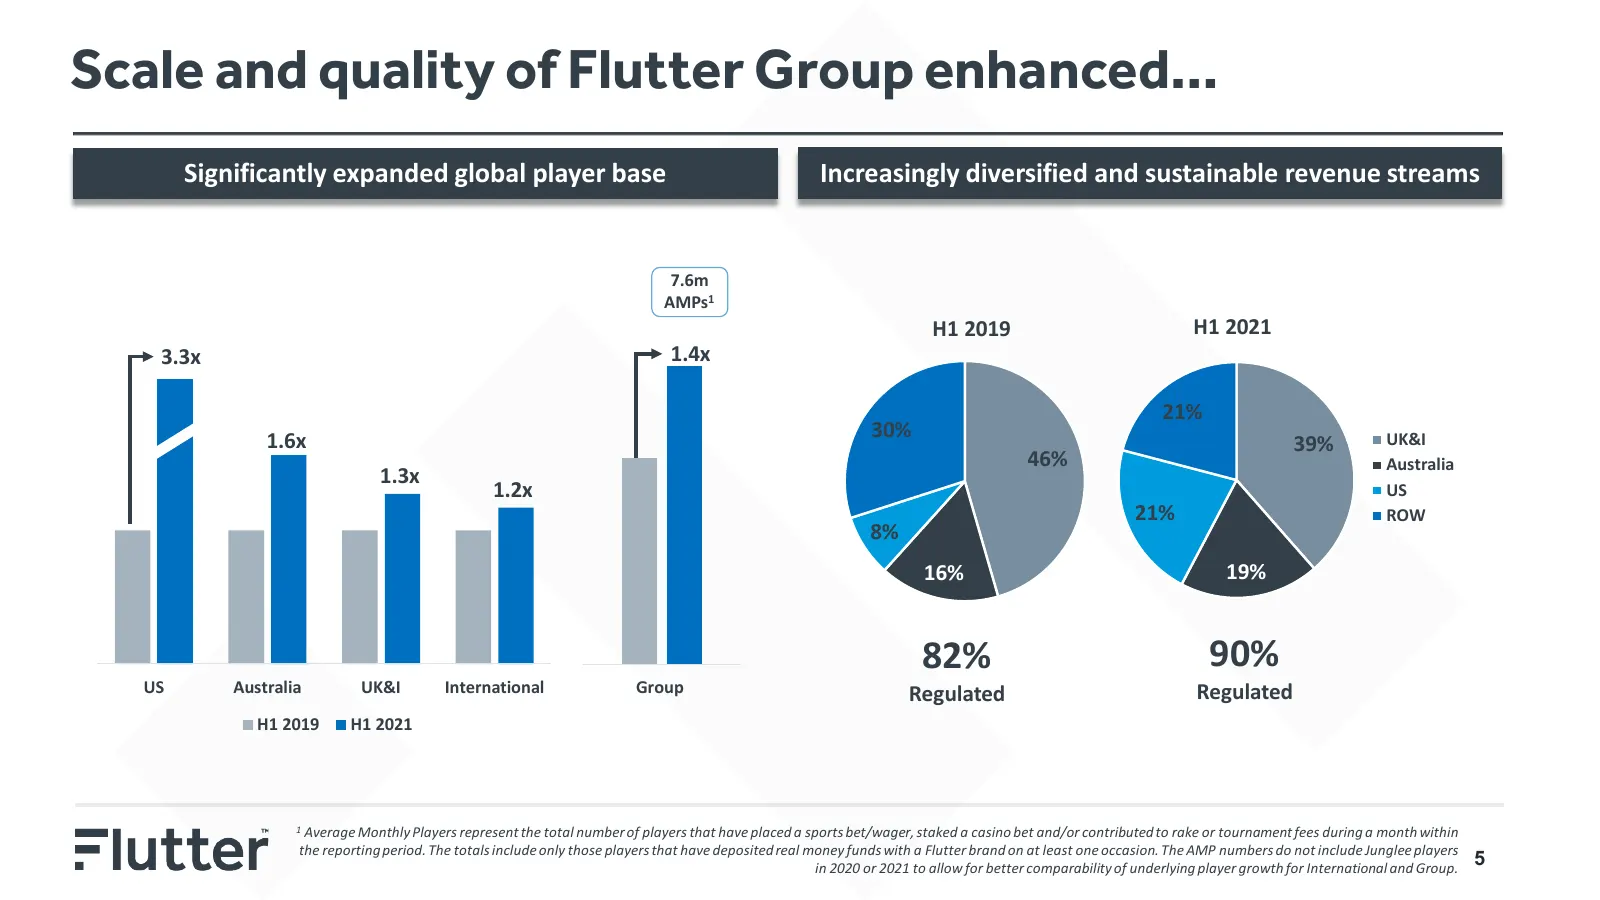
Scale and quality of Flutter Group enhanced… Significantly expanded global player base Increasingly diversified and sustainable revenue streams 7.6m AMPs1 H1 2019 H1 2021 3.3x 1.4x 21% 1.6x 30% UK&I 39% 46% Australia 1.3x 1.2x US 21% ROW 8% 16% 19% 82% 90% US Australia UK&I International Group Regul
Slide 6: Leading on safer gambling through market specific initiatives
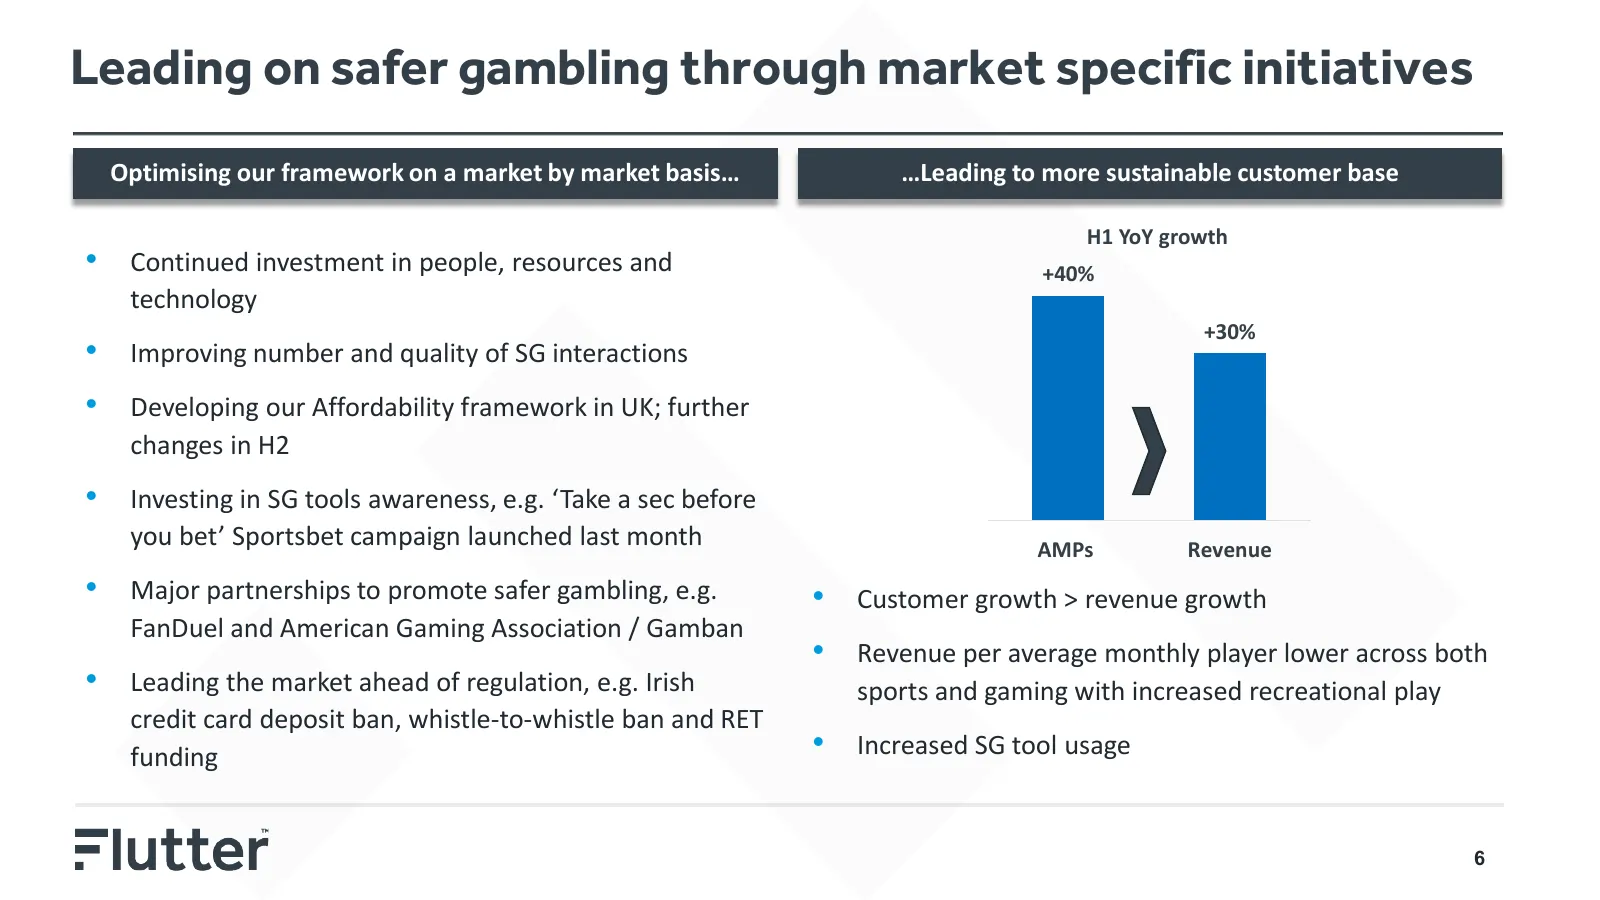
Leading on safer gambling through market specific initiatives Optimising our framework on a market by market basis… …Leading to more sustainable customer base H1 YoY growth • Continued investment in people, resources and +40% technology +30% • Improving number and quality of SG interactions • Develo

Slide 7: Financial Review
Financial Review Jonathan Hill, Group CFO 7
Slide 8: Key financial highlights
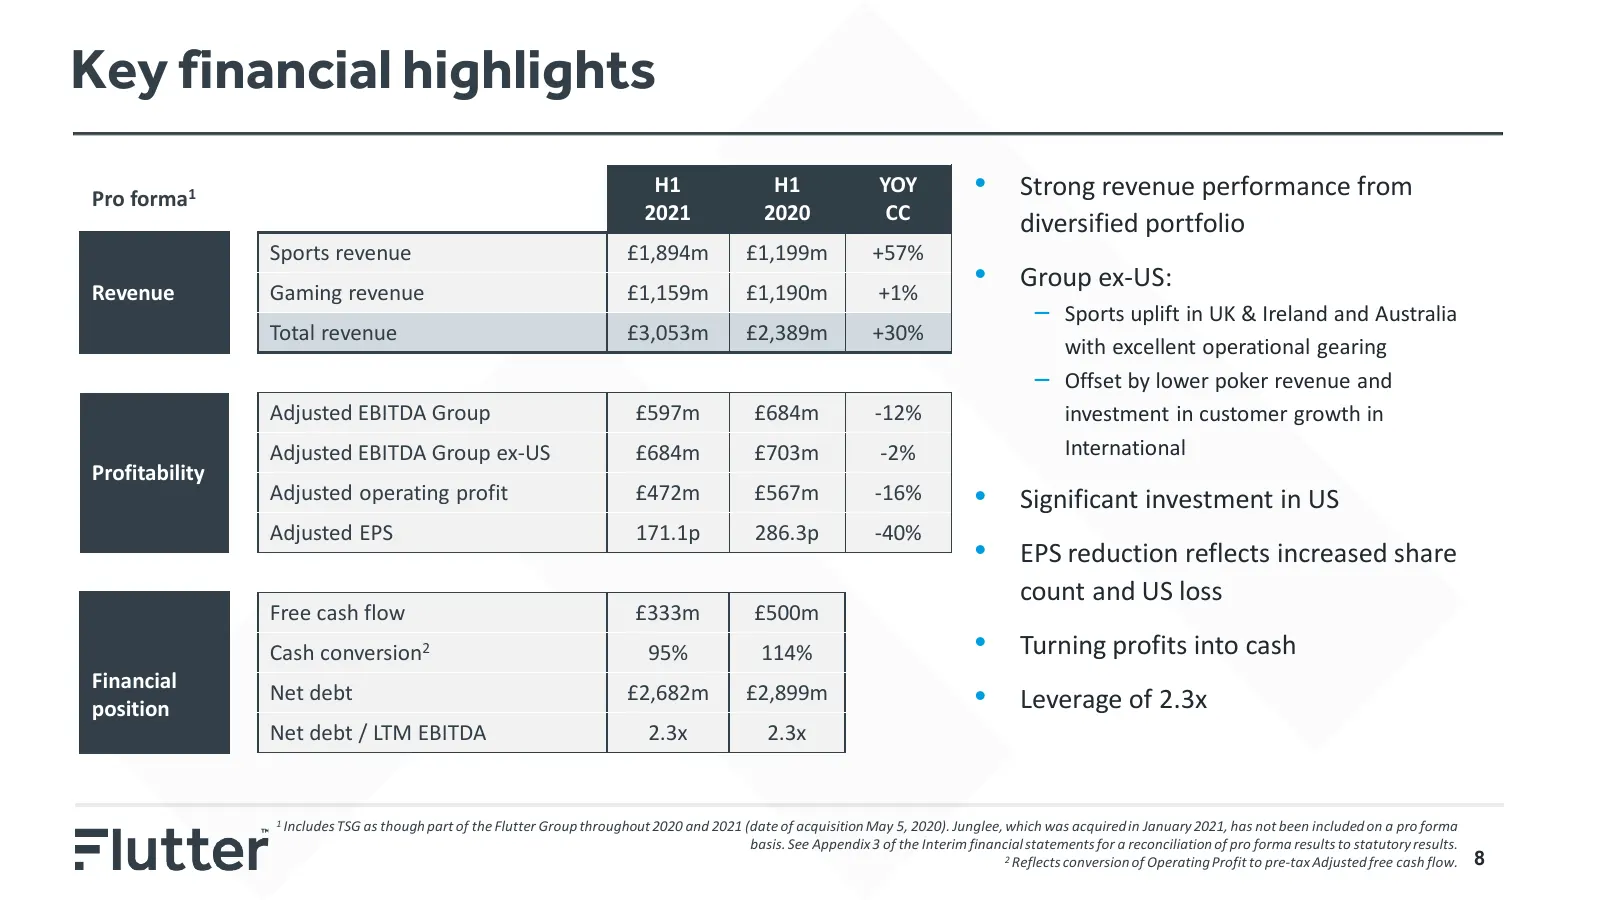
Key financial highlights Pro forma1 H1 H1 YOY • Strong revenue performance from 2021 2020 CC diversified portfolio Sports revenue £1,894m £1,199m +57% Revenue Gaming revenue £1,159m £1,190m +1% • Group ex-US: – Sports uplift in UK & Ireland and Australia Total revenue £3,053m £2,389m +30% with excel
Slide 9: Statutory Group P&L
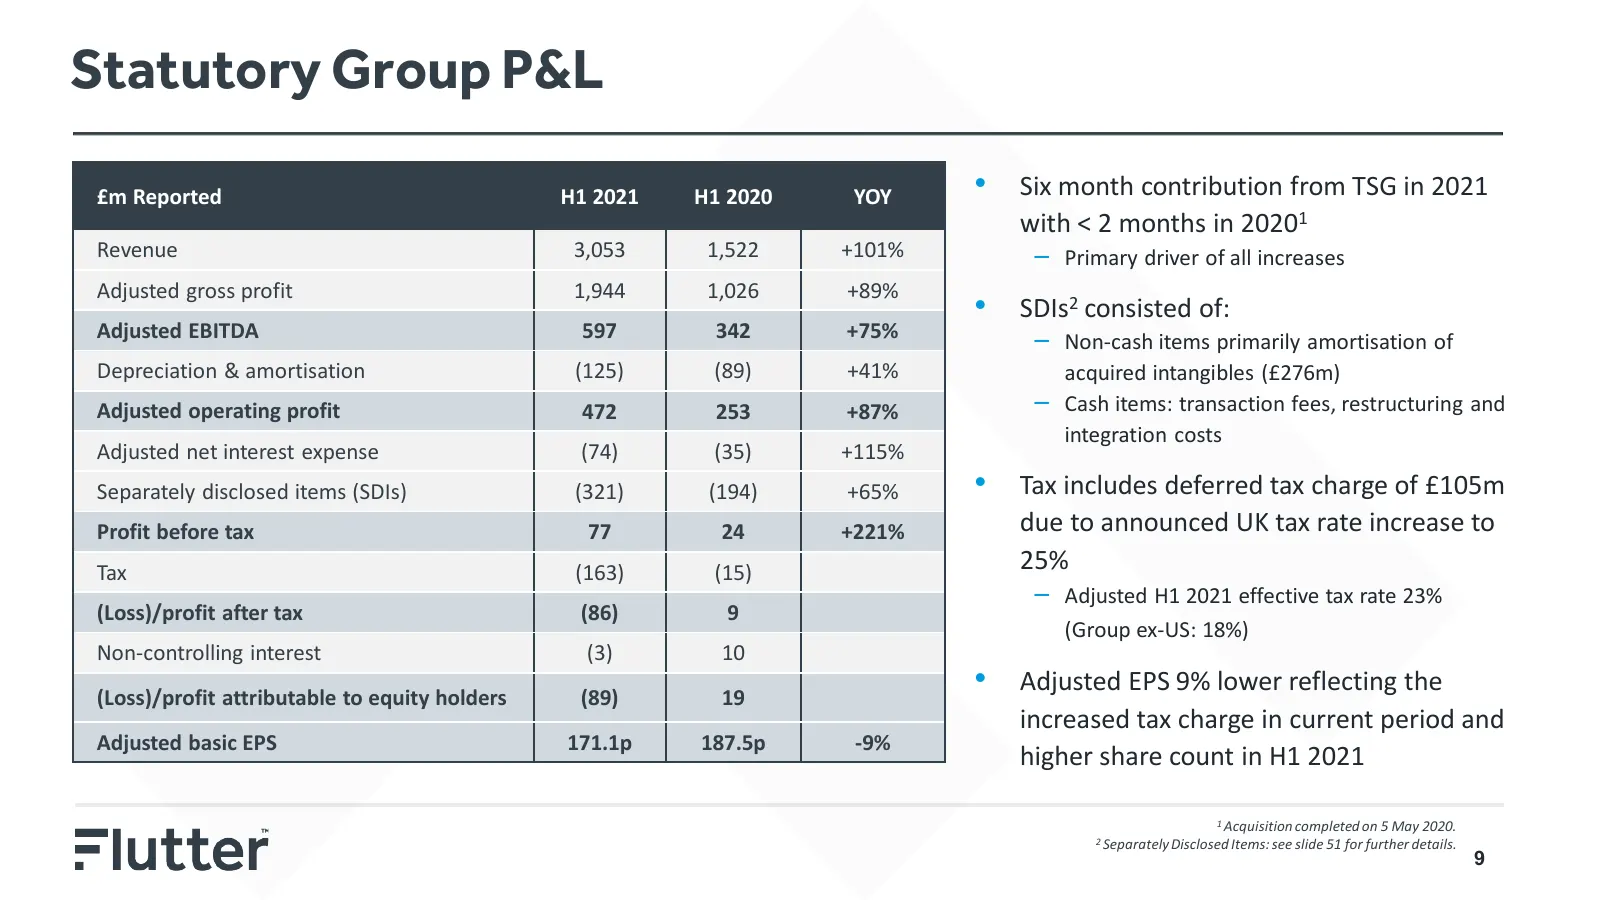
Statutory Group P&L £m Reported H1 2021 H1 2020 YOY • Six month contribution from TSG in 2021 with < 2 months in 20201 Revenue 3,053 1,522 +101% – Primary driver of all increases Adjusted gross profit 1,944 1,026 +89% • SDIs2 consisted of: Adjusted EBITDA 597 342 +75% – Non-cash items primarily amor
Slide 10: Customer momentum continued into H1
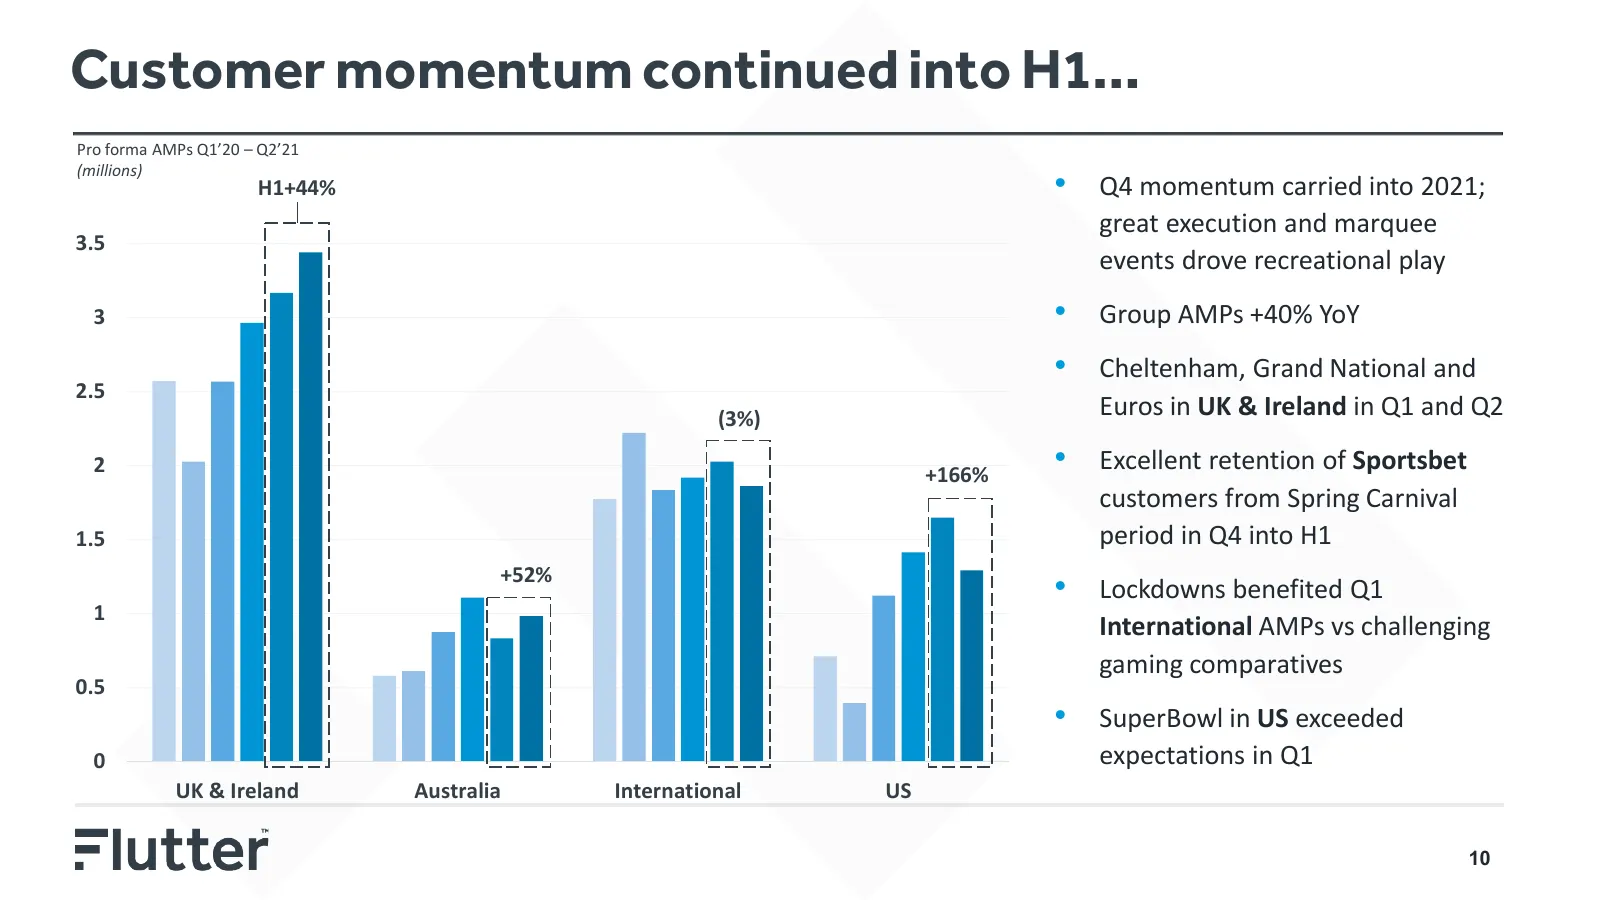
Customer momentum continued into H1… Pro forma AMPs Q1’20 – Q2’21 • (millions) H1+44% Q4 momentum carried into 2021; great execution and marquee 3.5 events drove recreational play 3 • Group AMPs +40% YoY • Cheltenham, Grand National and 2.5 (3%) Euros in UK & Ireland in Q1 and Q2 2 +166% • Excellent
Slide 11: Driving excellent revenue performance
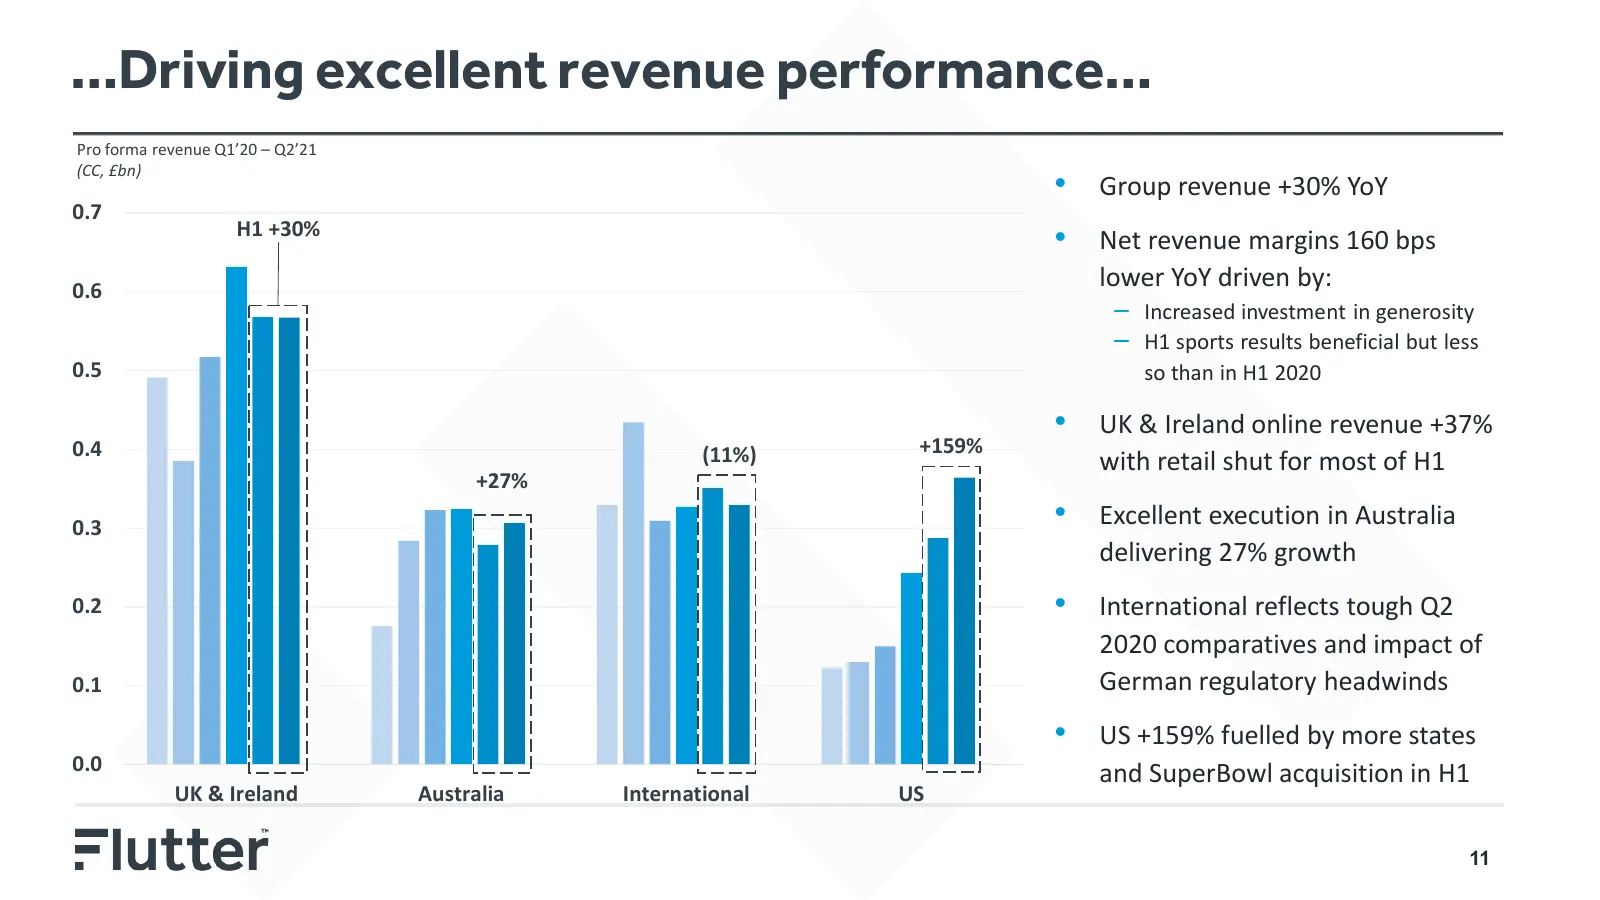
…Driving excellent revenue performance… Pro forma revenue Q1’20 – Q2’21 • (CC, £bn) Group revenue +30% YoY 0.7 H1 +30% • Net revenue margins 160 bps 0.6 lower YoY driven by: – Increased investment in generosity – H1 sports results beneficial but less 0.5 so than in H1 2020 • UK & Ireland online reve
Slide 12: Benefits of diversified product portfolio evident
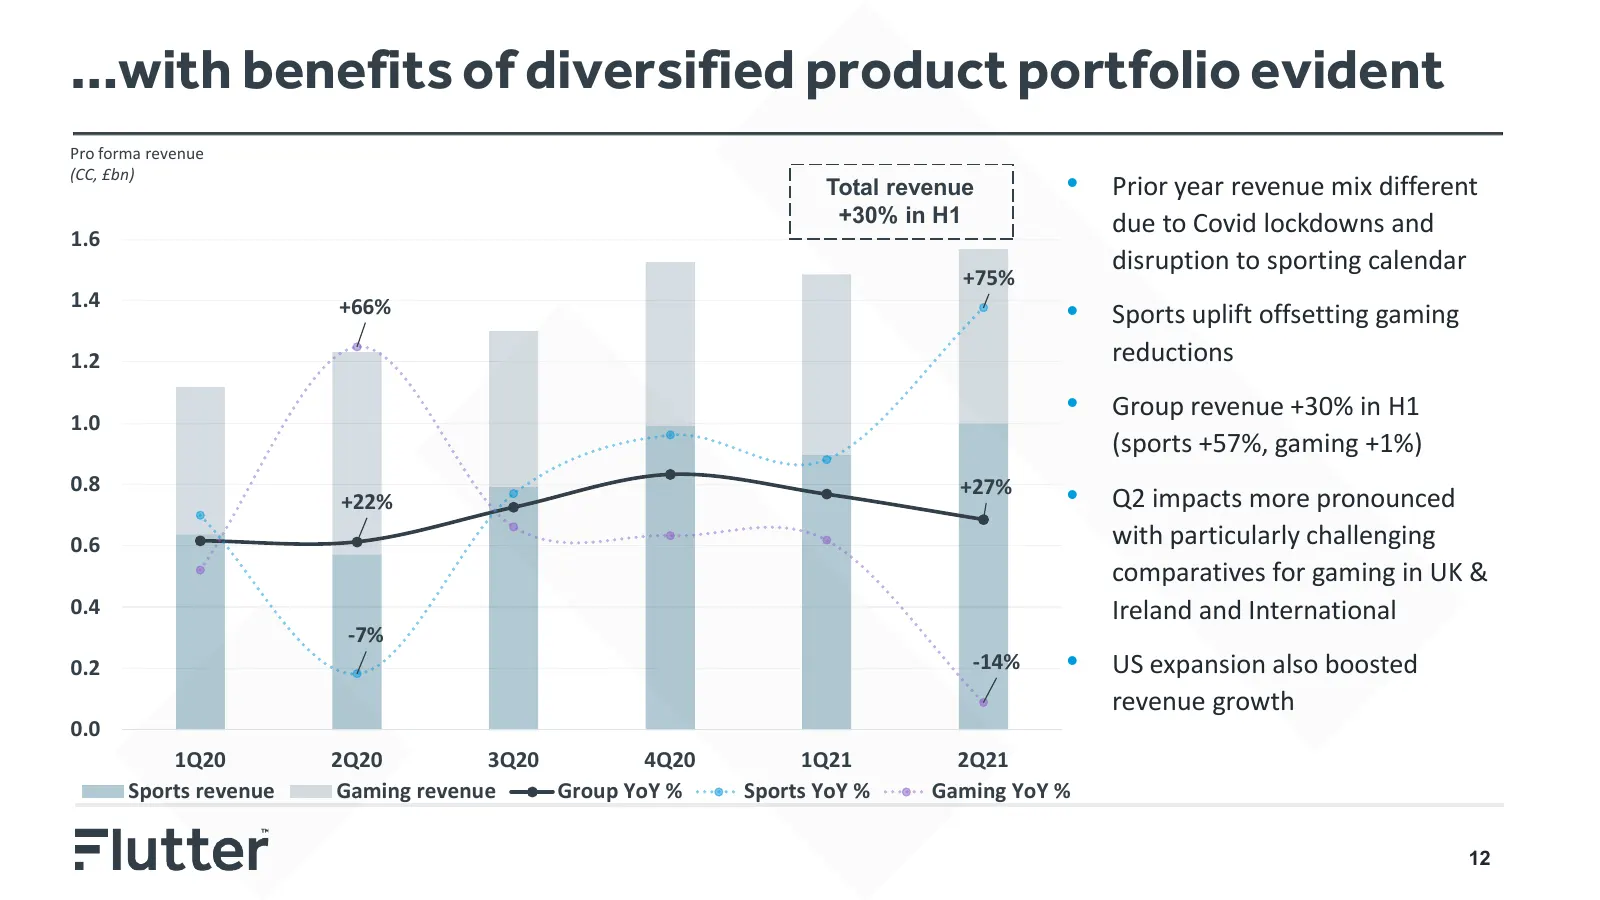
…with benefits of diversified product portfolio evident Pro forma revenue (CC, £bn) Total revenue • Prior year revenue mix different +30% in H1 due to Covid lockdowns and 1.6 disruption to sporting calendar +75% 1.4 +66% • Sports uplift offsetting gaming 1.2 reductions 1.0 • Group revenue +30% in H1
Slide 13: Group ex-US diversification supporting investment
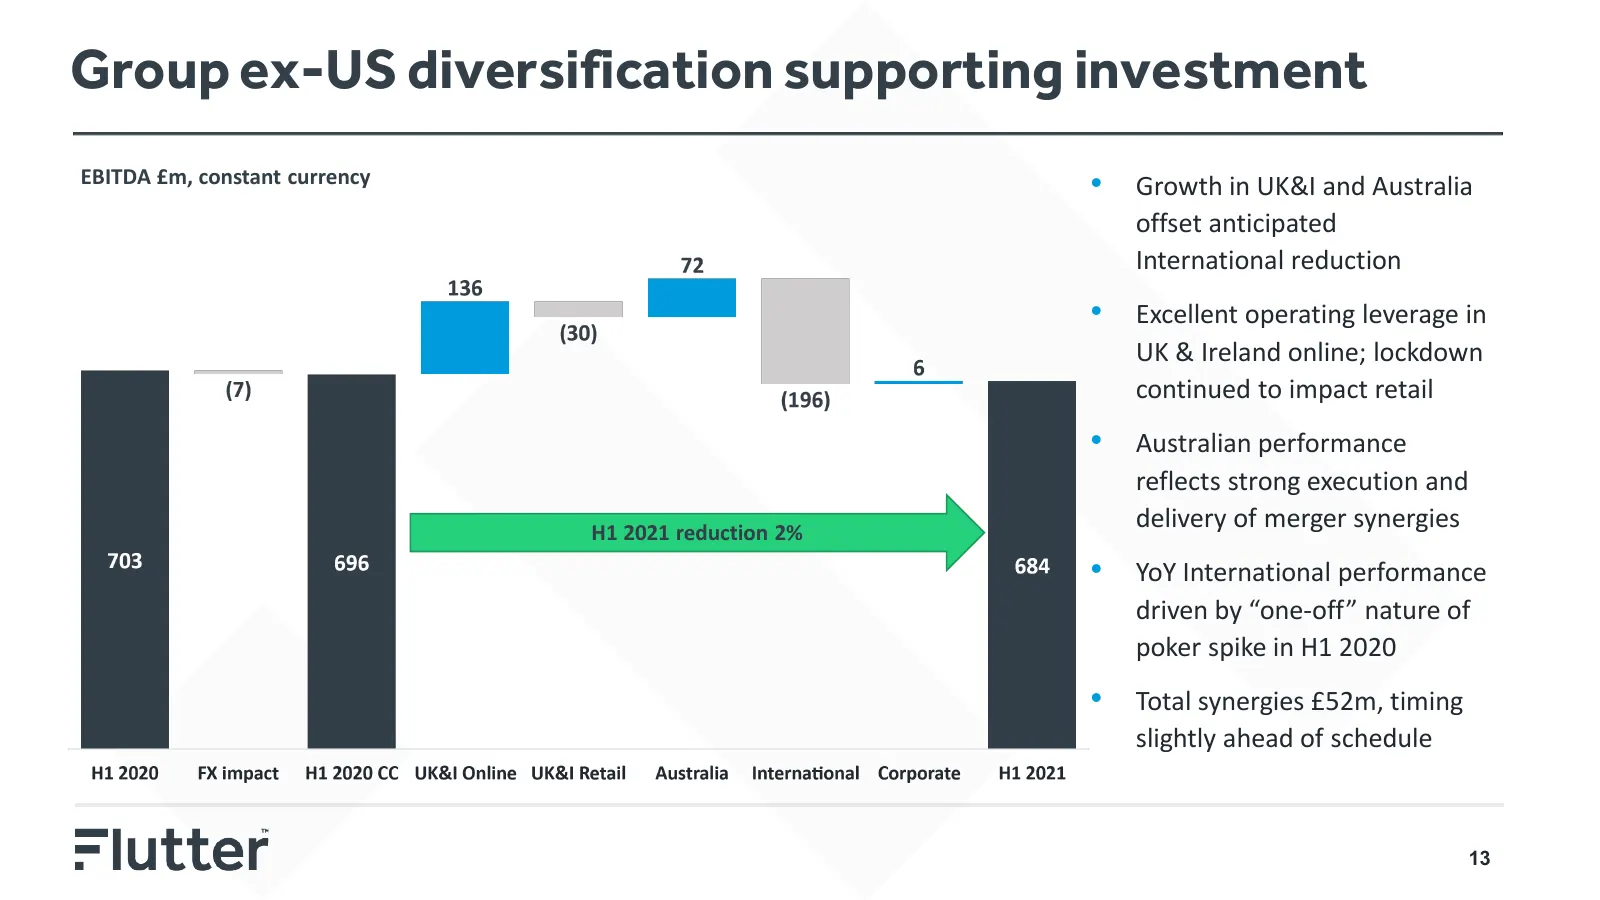
Group ex-US diversification supporting investment EBITDA £m, constant currency • Growth in UK&I and Australia offset anticipated International reduction • Excellent operating leverage in UK & Ireland online; lockdown continued to impact retail • Australian performance reflects strong execution and H
Slide 14: International EBITDA reflects various significant factors
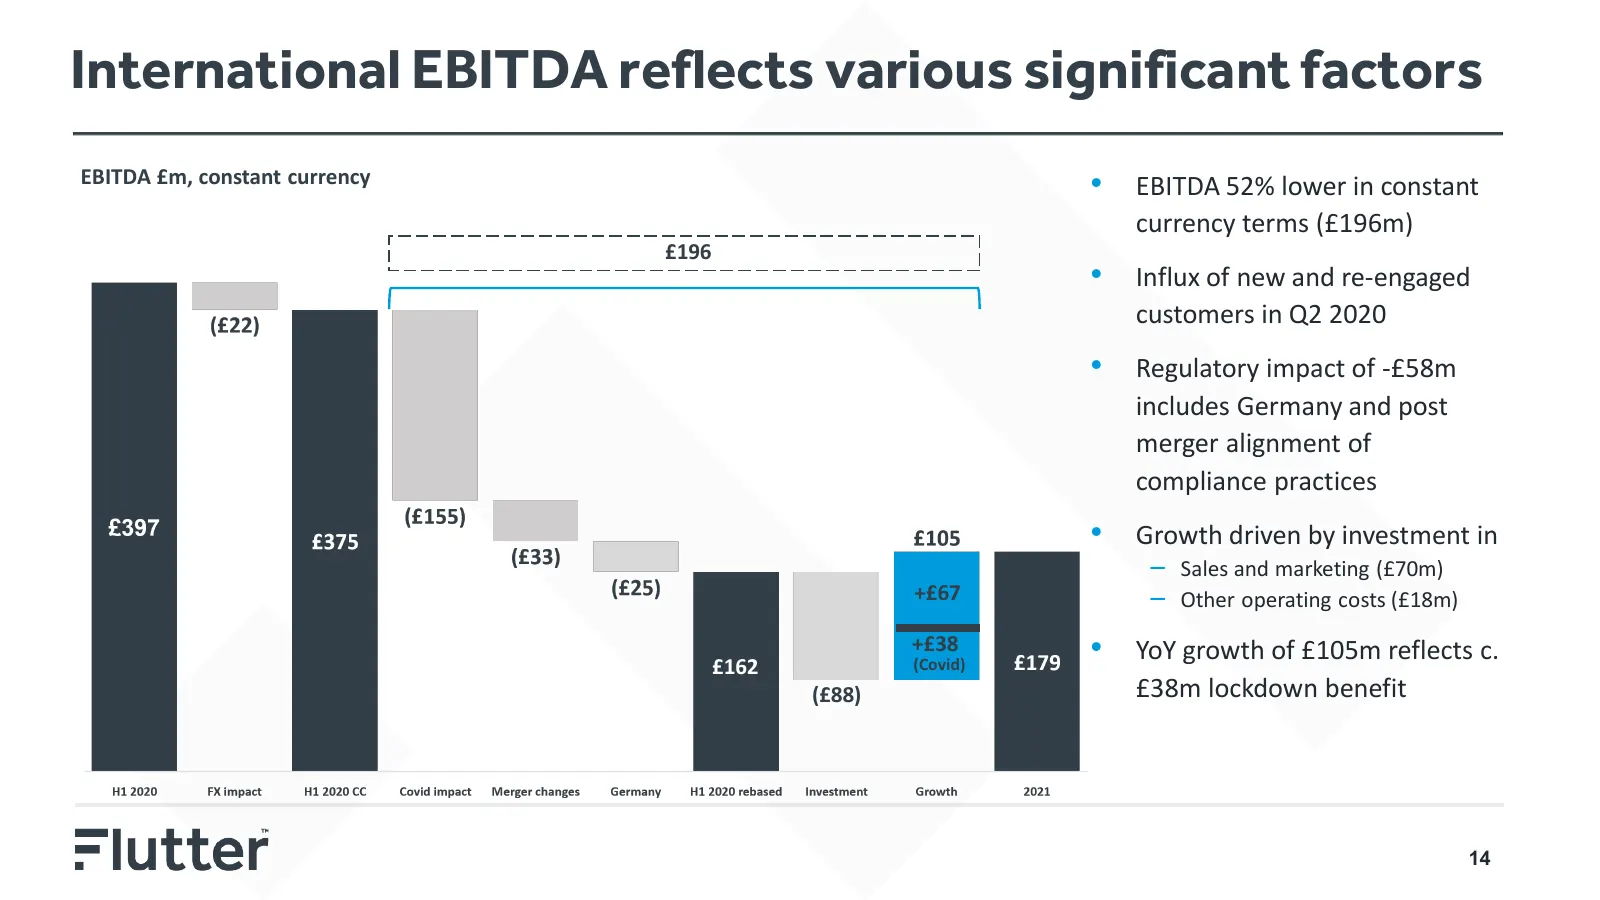
International EBITDA reflects various significant factors EBITDA £m, constant currency • EBITDA 52% lower in constant currency terms (£196m) £196 • Influx of new and re-engaged customers in Q2 2020 • Regulatory impact of -£58m includes Germany and post merger alignment of compliance practices • Grow
Slide 15: Group ex-US EBITDA margin 28% after investment
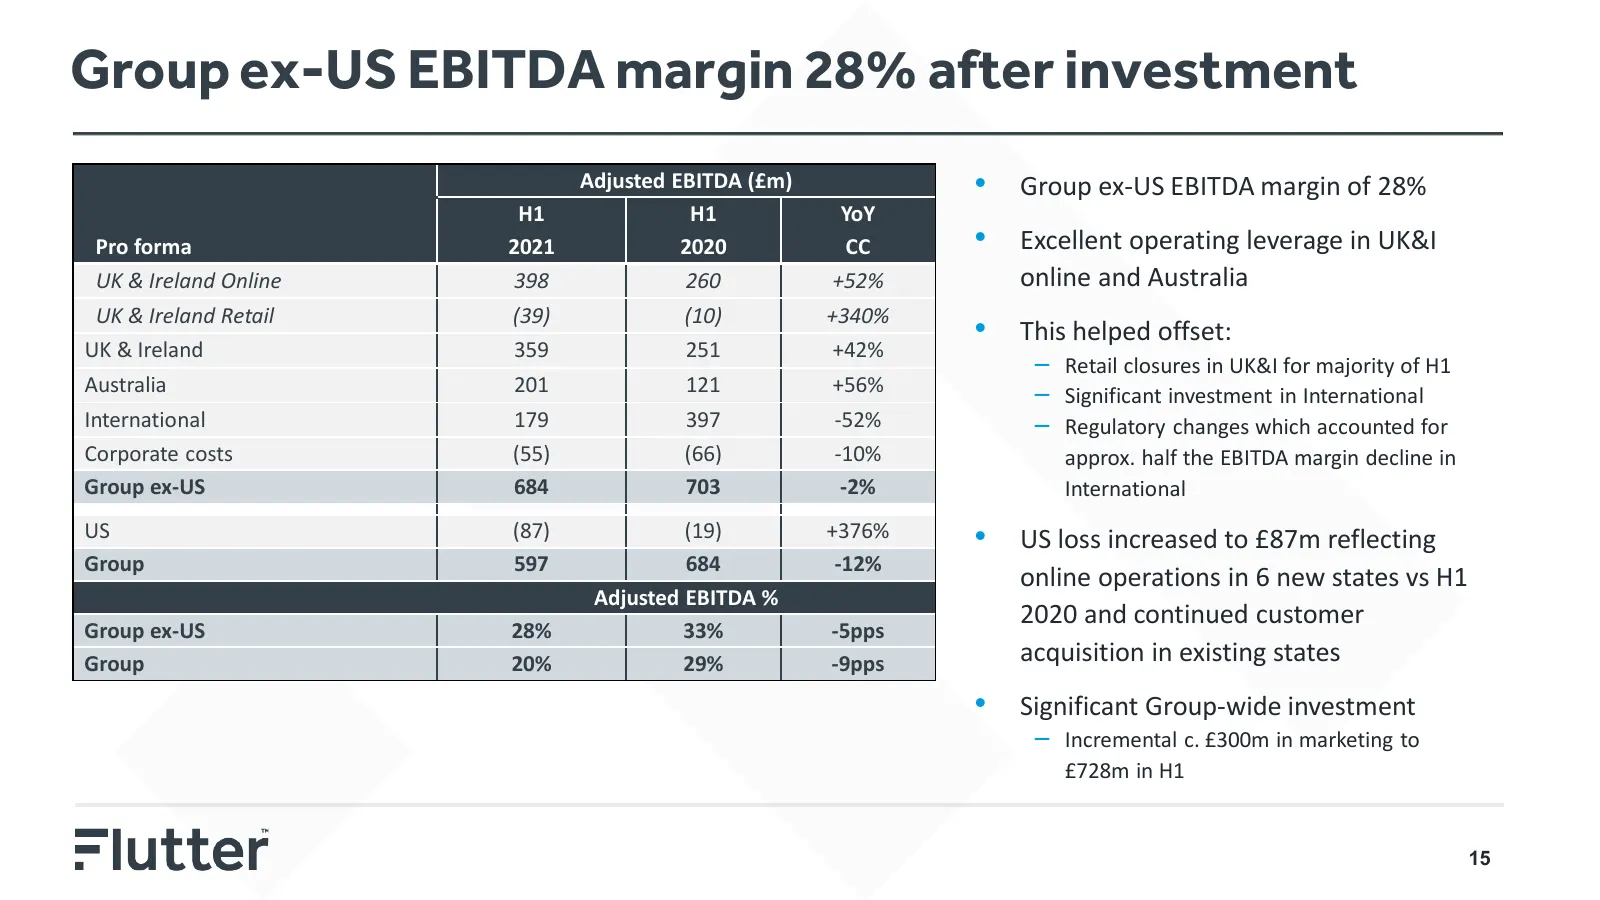
Group ex-US EBITDA margin 28% after investment Adjusted EBITDA (£m) • Group ex-US EBITDA margin of 28% H1 H1 YoY Pro forma 2021 2020 CC • Excellent operating leverage in UK&I UK & Ireland Online 398 260 +52% online and Australia UK & Ireland Retail (39) (10) +340% UK & Ireland 359 251 +42% • This he
Slide 16: Cash flow
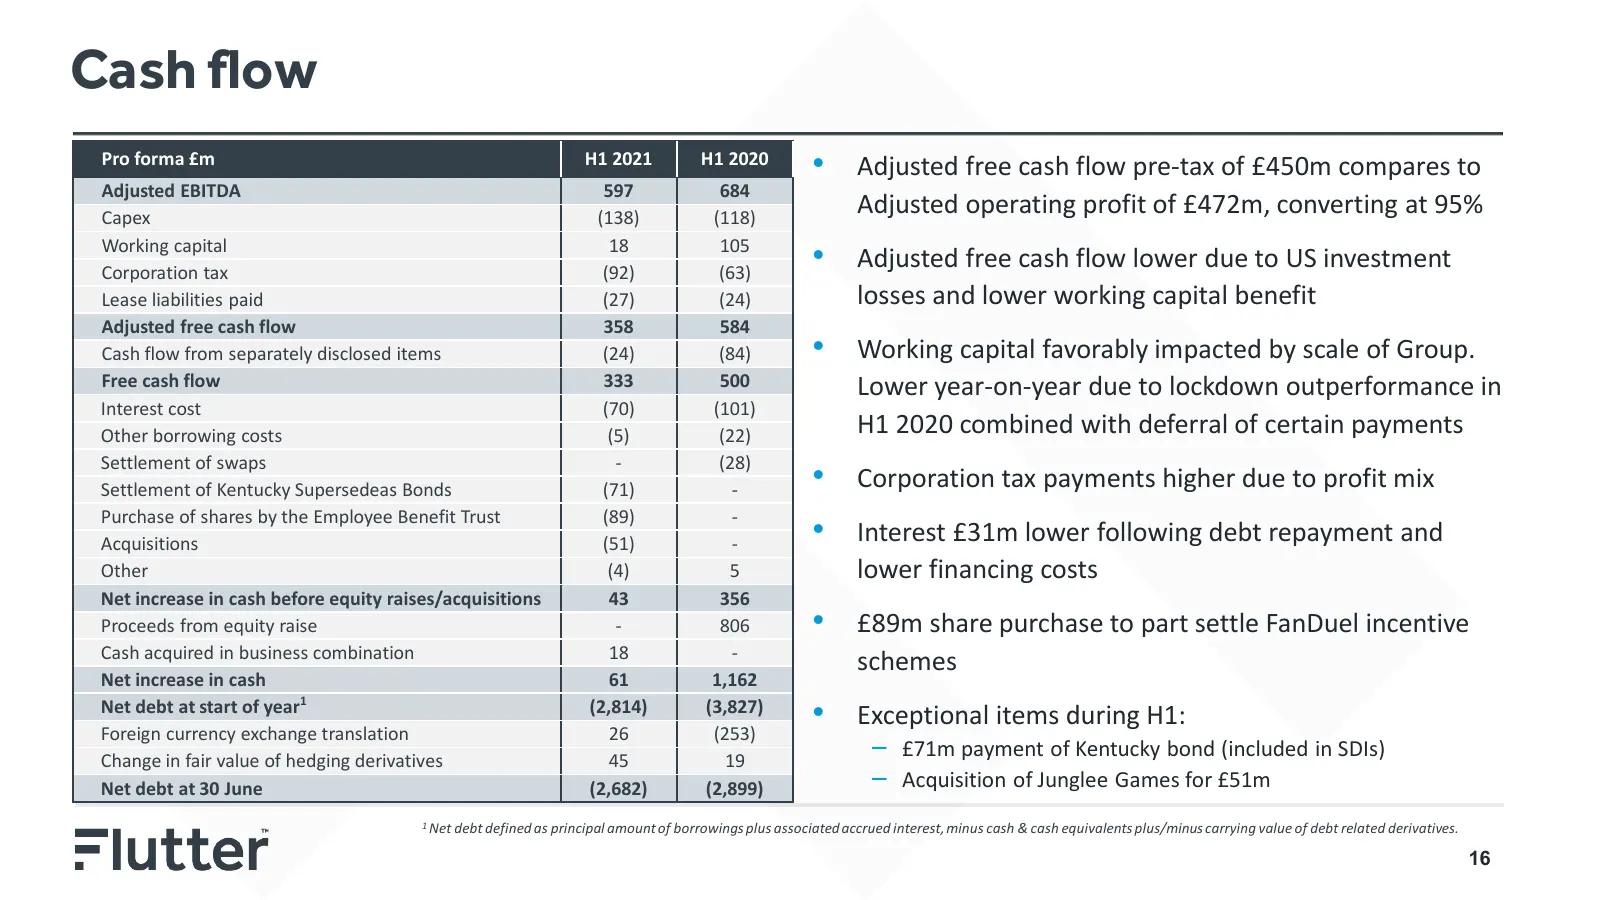
Cash flow Pro forma £m H1 2021 H1 2020 • Adjusted free cash flow pre-tax of £450m compares to Adjusted EBITDA 597 684 Capex (138) (118) Adjusted operating profit of £472m, converting at 95% Working capital Corporation tax 18 (92) 105 (63) • Adjusted free cash flow lower due to US investment Lease li
Slide 17: H2 2021 refinancing strengthens debt position
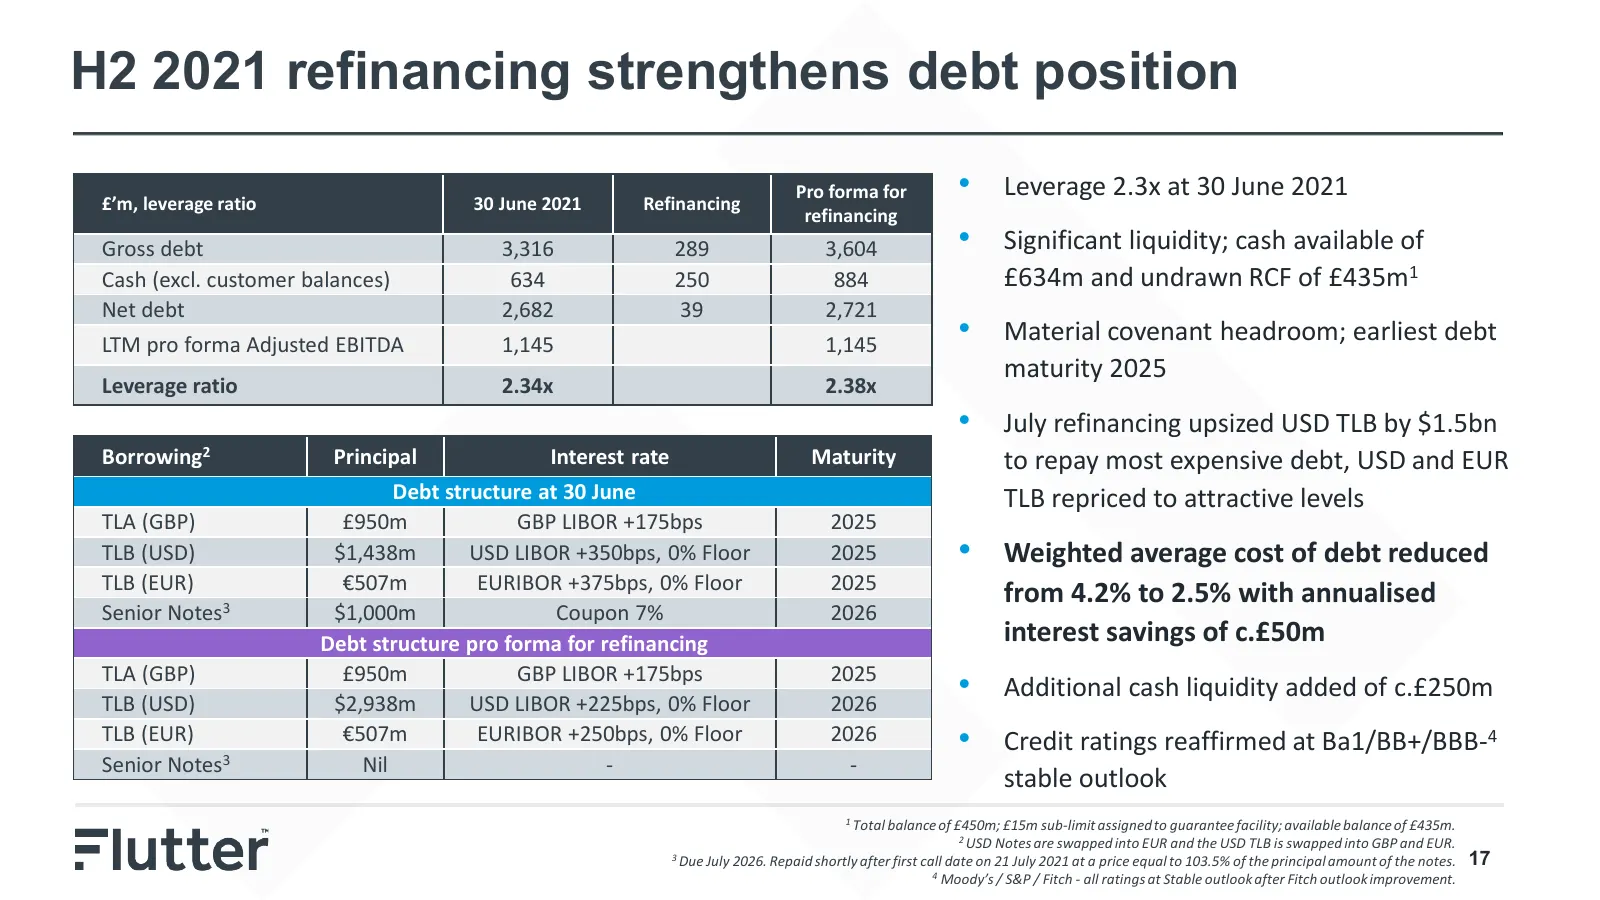
H2 2021 refinancing strengthens debt position £’m, leverage ratio 30 June 2021 Refinancing Pro forma for • Leverage 2.3x at 30 June 2021 refinancing Gross debt 3,316 289 3,604 • Significant liquidity; cash available of Cash (excl. customer balances) 634 250 884 £634m and undrawn RCF of £435m1 Net de
Slide 18: 2021 Outlook
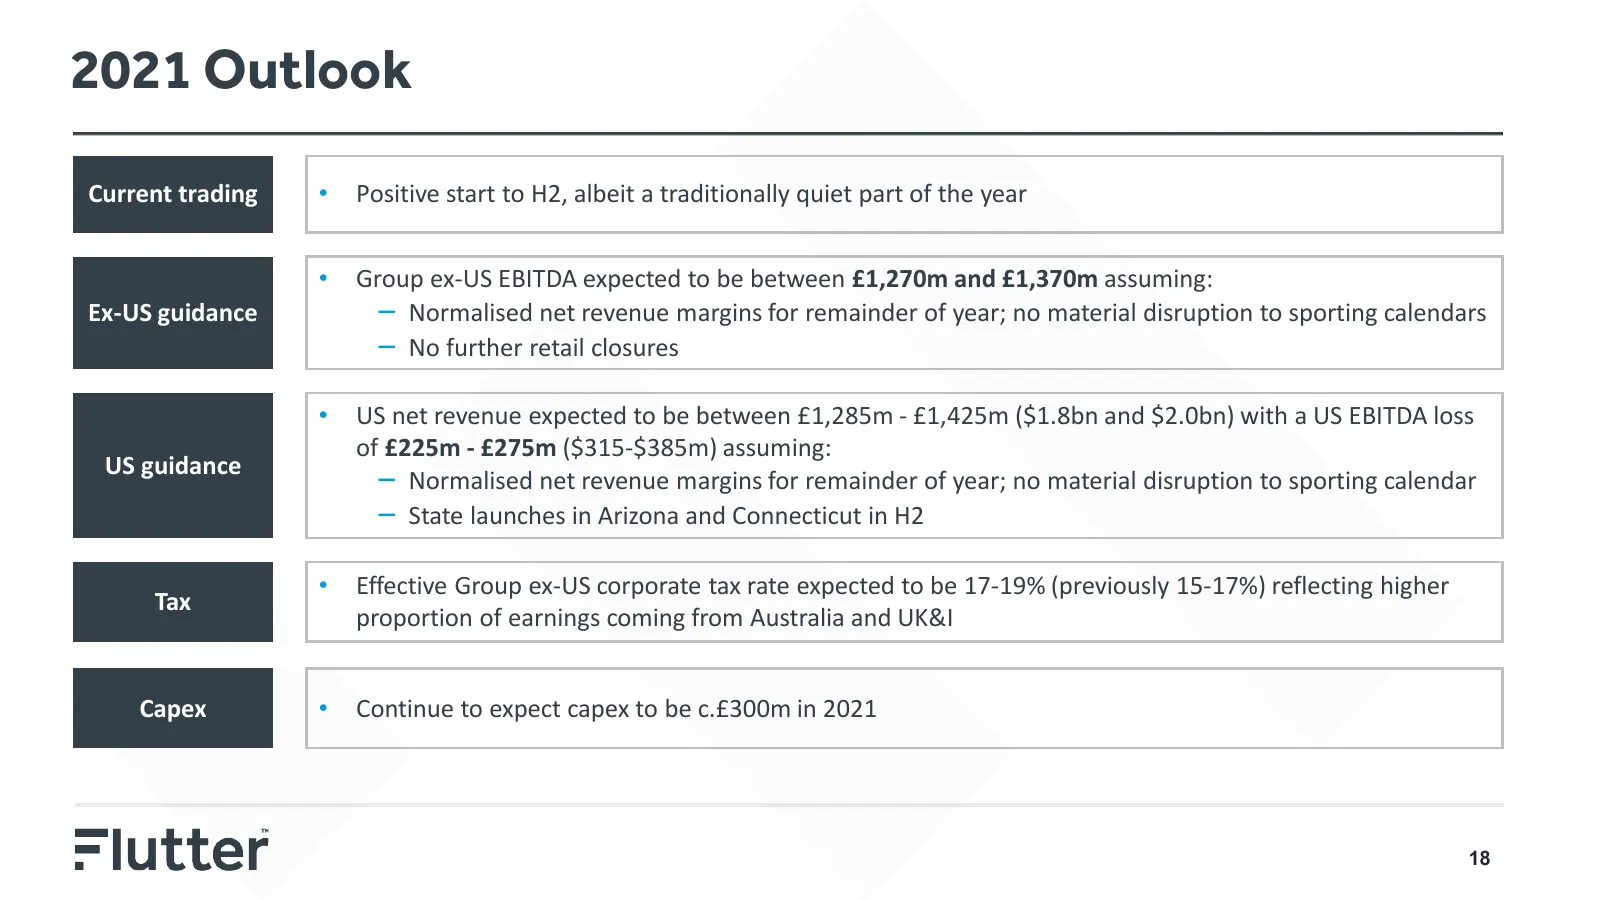
2021 Outlook Current trading • Positive start to H2, albeit a traditionally quiet part of the year • Group ex-US EBITDA expected to be between £1,270m and £1,370m assuming: Ex-US guidance – Normalised net revenue margins for remainder of year; no material disruption to sporting calendars – No furthe

Slide 19: Group ex-US Business Review
Group ex-US Business Review Peter Jackson, Group CEO 19
Slide 20: UK & Ireland: progress on integration
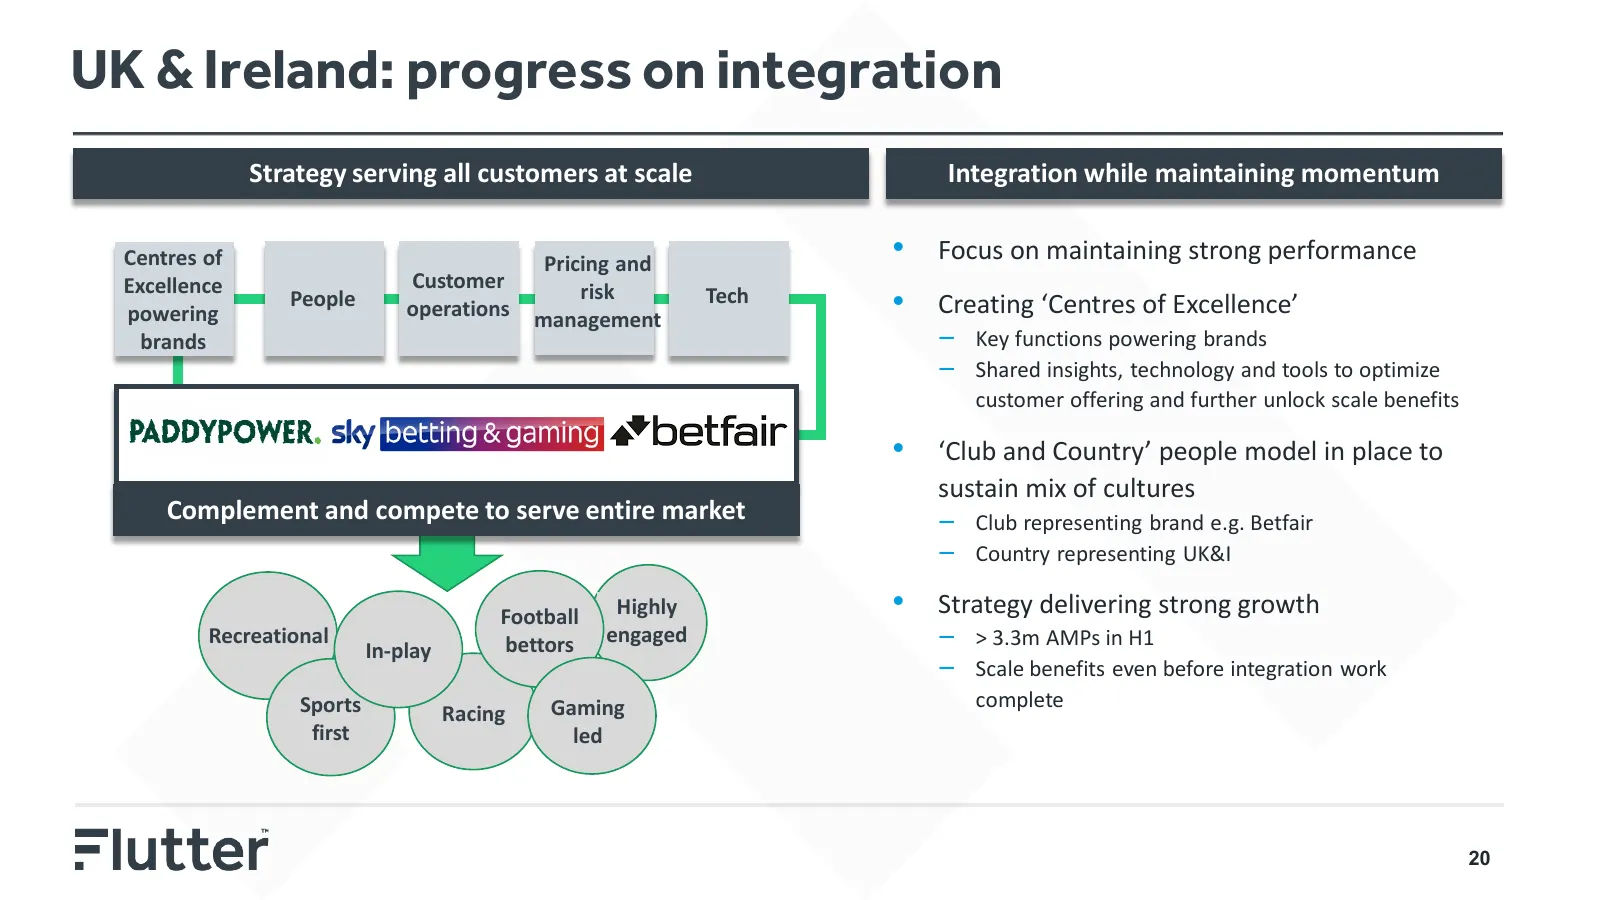
UK & Ireland: progress on integration Strategy serving all customers at scale Integration while maintaining momentum Centres of Pricing and • Focus on maintaining strong performance Excellence Customer risk powering People operations management Tech • Creating ‘Centres of Excellence’ brands – Key fu
Slide 21: UK & Ireland: benefits of shared expertise evident
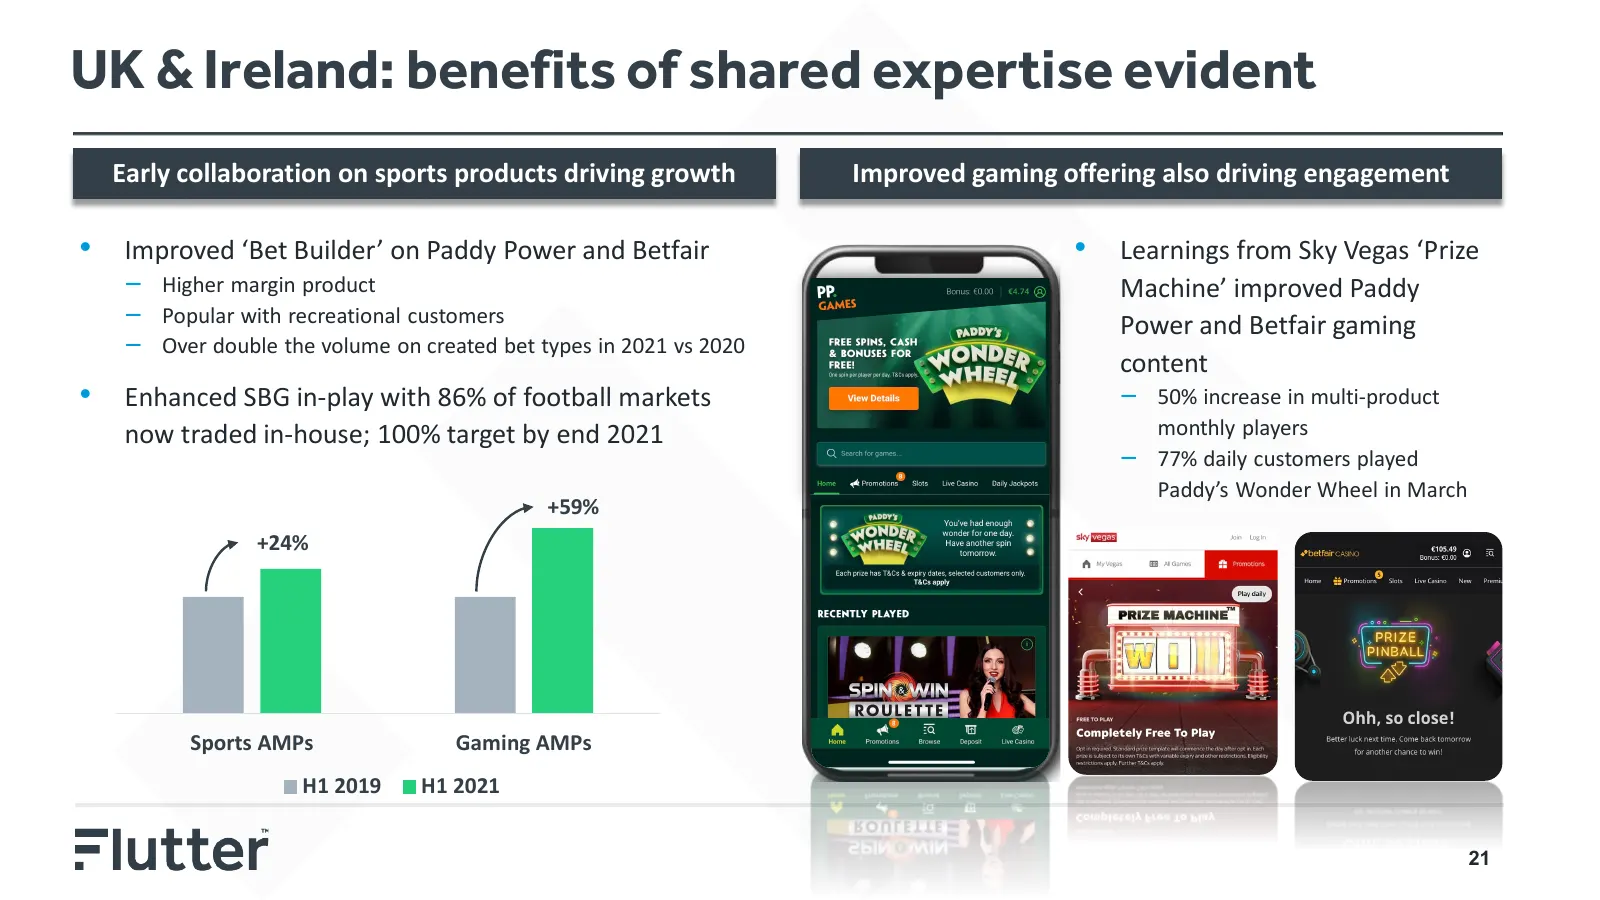
UK & Ireland: benefits of shared expertise evident Early collaboration on sports products driving growth Improved gaming offering also driving engagement • Improved ‘Bet Builder’ on Paddy Power and Betfair • Learnings from Sky Vegas ‘Prize – Higher margin product Machine’ improved Paddy – Popular wi
Slide 22: International: building the foundations for future growth
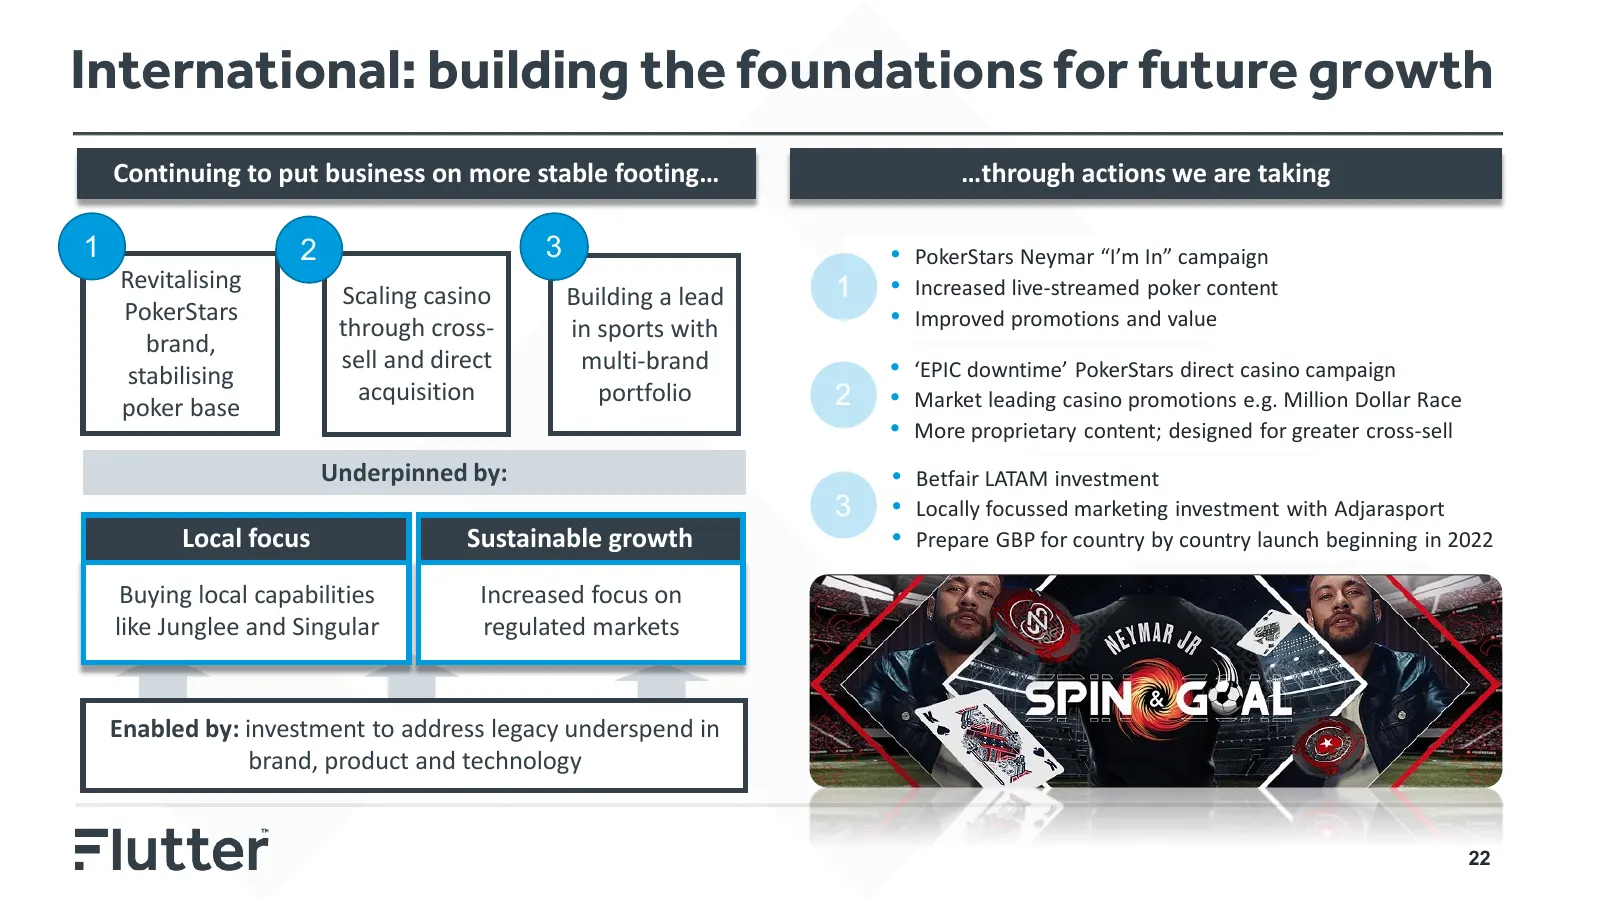
International: building the foundations for future growth Continuing to put business on more stable footing… …through actions we are taking 1 2 3 • PokerStars Neymar “I’m In” campaign Revitalising 1 • Increased live-streamed poker content Scaling casino Building a lead PokerStars • Improved promotio
Slide 23: International: our changes are having an impact
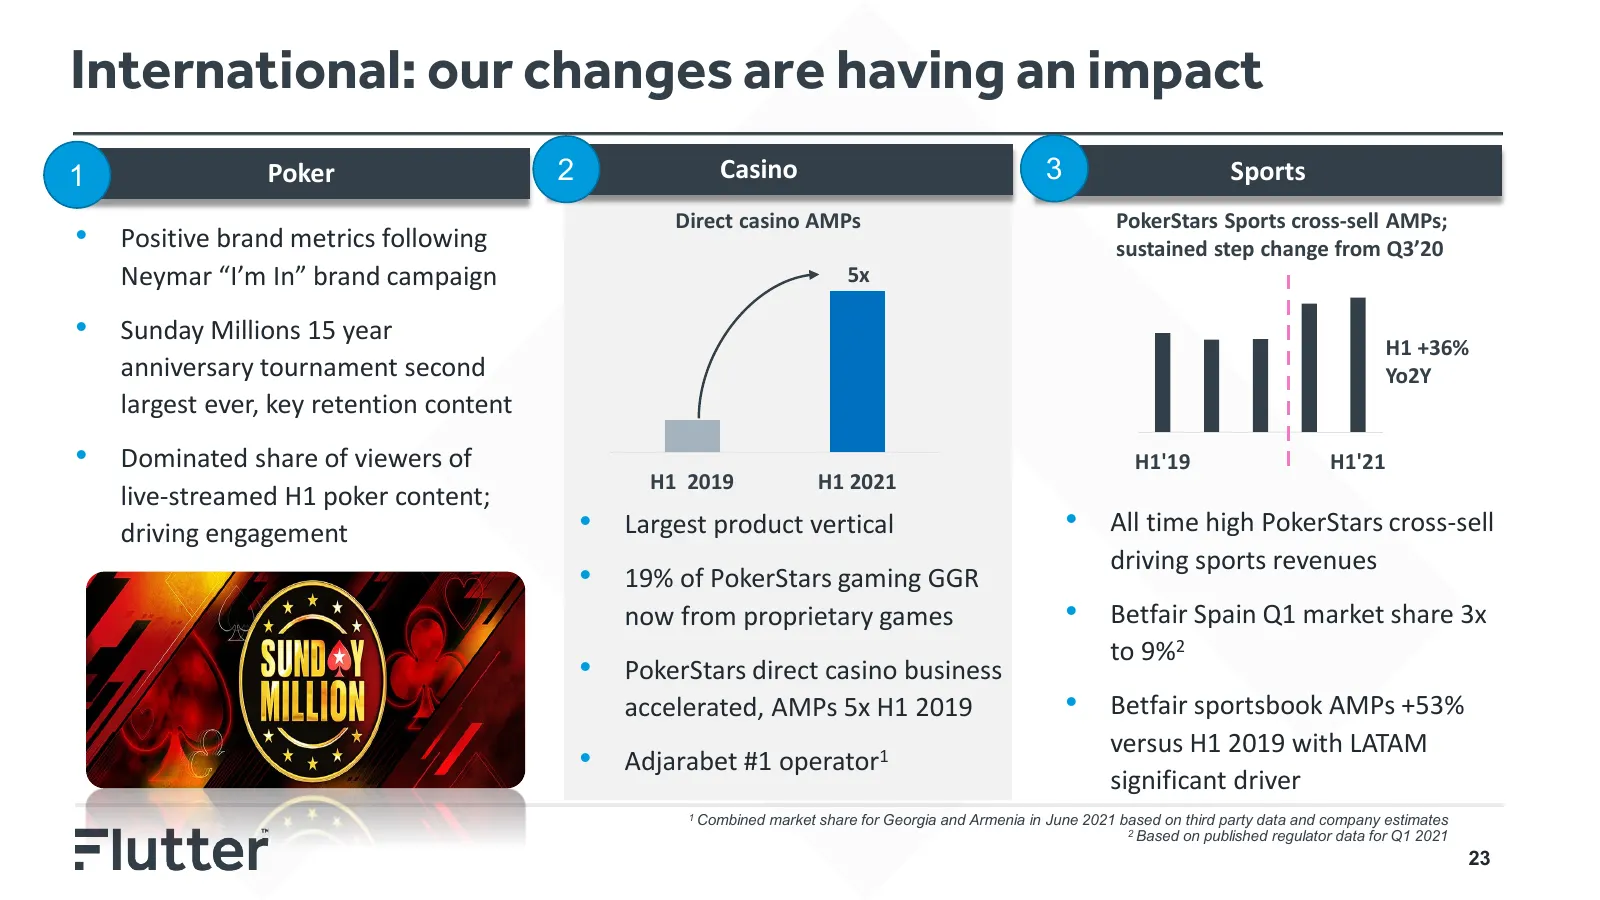
International: our changes are having an impact 1 Poker 2 Casino 3 Sports Direct casino AMPs PokerStars Sports cross-sell AMPs; • Positive brand metrics following sustained step change from Q3’20 Neymar “I’m In” brand campaign 5x • Sunday Millions 15 year H1 +36% anniversary tournament second Yo2Y l
Slide 24: Australia: Step change in scale of Sportsbet business
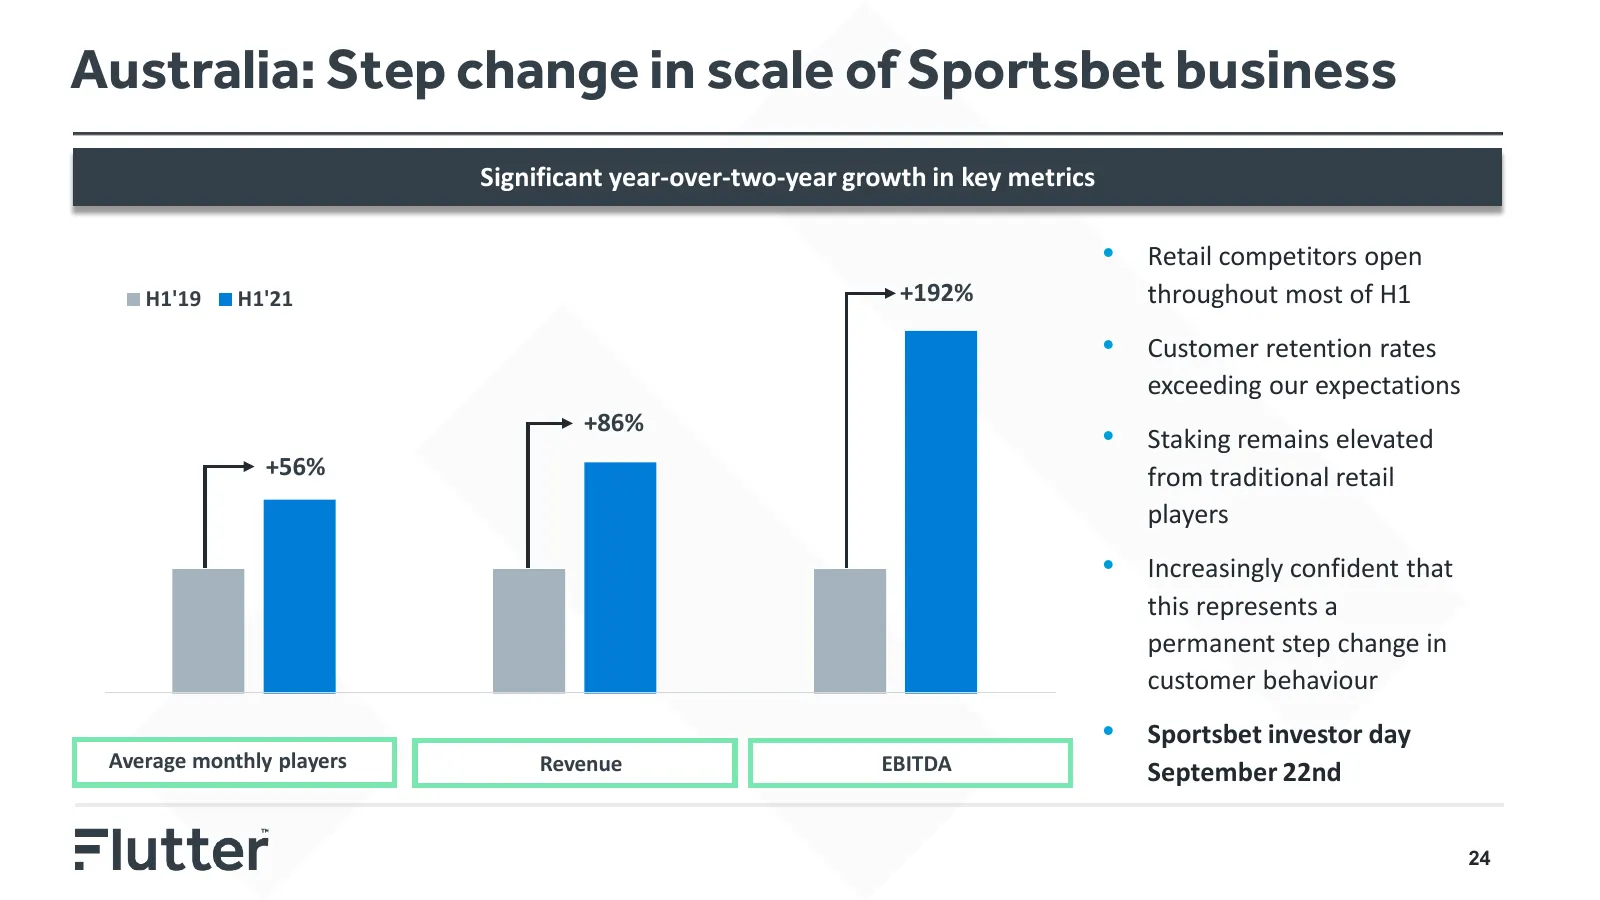
Australia: Step change in scale of Sportsbet business Significant year-over-two-year growth in key metrics • Retail competitors open H1'19 H1'21 +192% throughout most of H1 • Customer retention rates exceeding our expectations +86% • Staking remains elevated +56% from traditional retail players • In

Slide 25: US Deep Dive
US Deep Dive Peter Jackson, Group CEO 25
Slide 26: US Deep Dive: Introduction
US Deep Dive: Introduction • Compelling customer economics • Path to 2023 profitability • Scale advantage generating ‘flywheel effect’ • Our structural competitive advantages: − Product (including pricing and risk management) − Brand reach • Q2 market share performance • What’s next… 26
Slide 27: FanDuel scaling rapidly with attractive CPAs
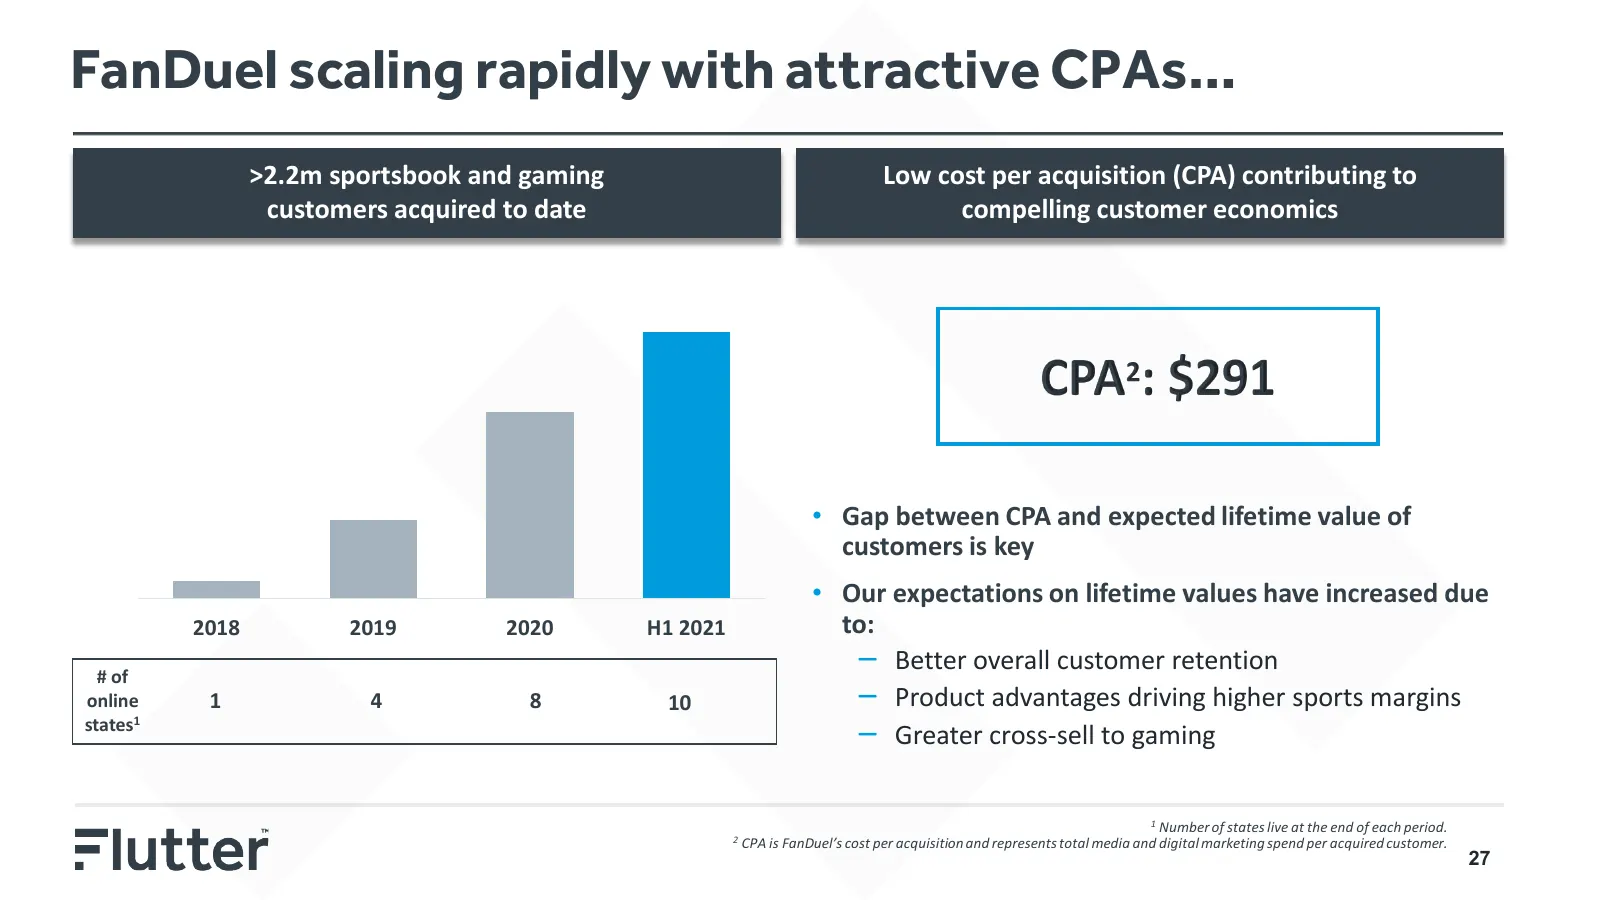
FanDuel scaling rapidly with attractive CPAs… >2.2m sportsbook and gaming Low cost per acquisition (CPA) contributing to customers acquired to date compelling customer economics • Gap between CPA and expected lifetime value of customers is key • Our expectations on lifetime values have increased due
Slide 28: Excellent customer values from strong retention
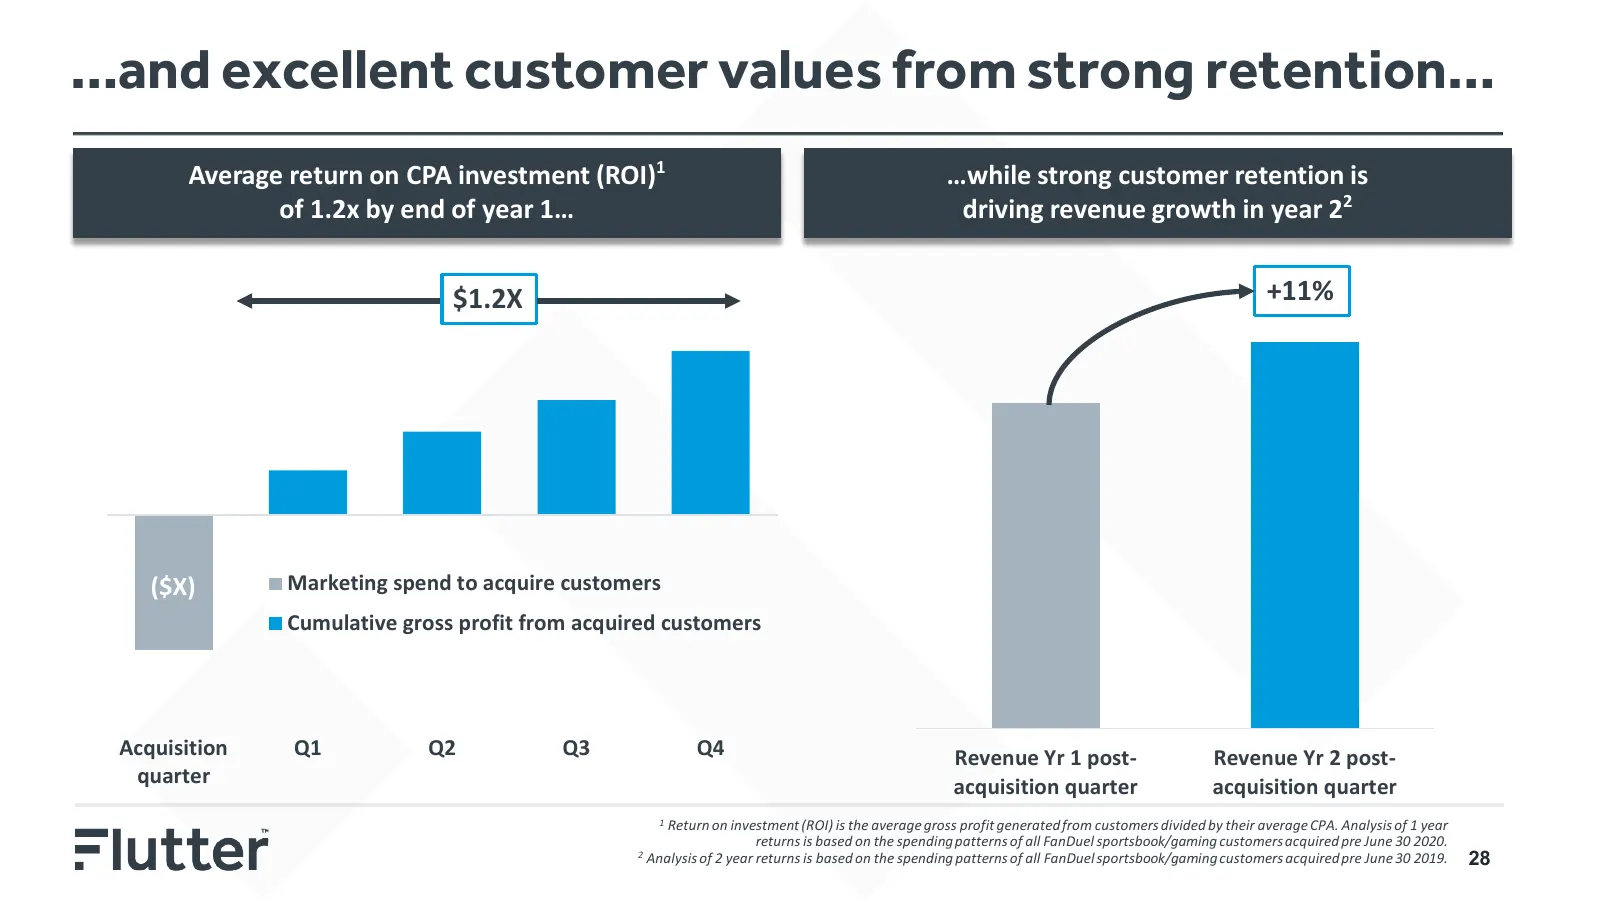
…and excellent customer values from strong retention… Average return on CPA investment (ROI)1 …while strong customer retention is of 1.2x by end of year 1… driving revenue growth in year 22 $1.2X +11% ($X) Marketing spend to acquire customers Cumulative gross profit from acquired customers Acquisiti
Slide 29: Clear pathway for future profitability
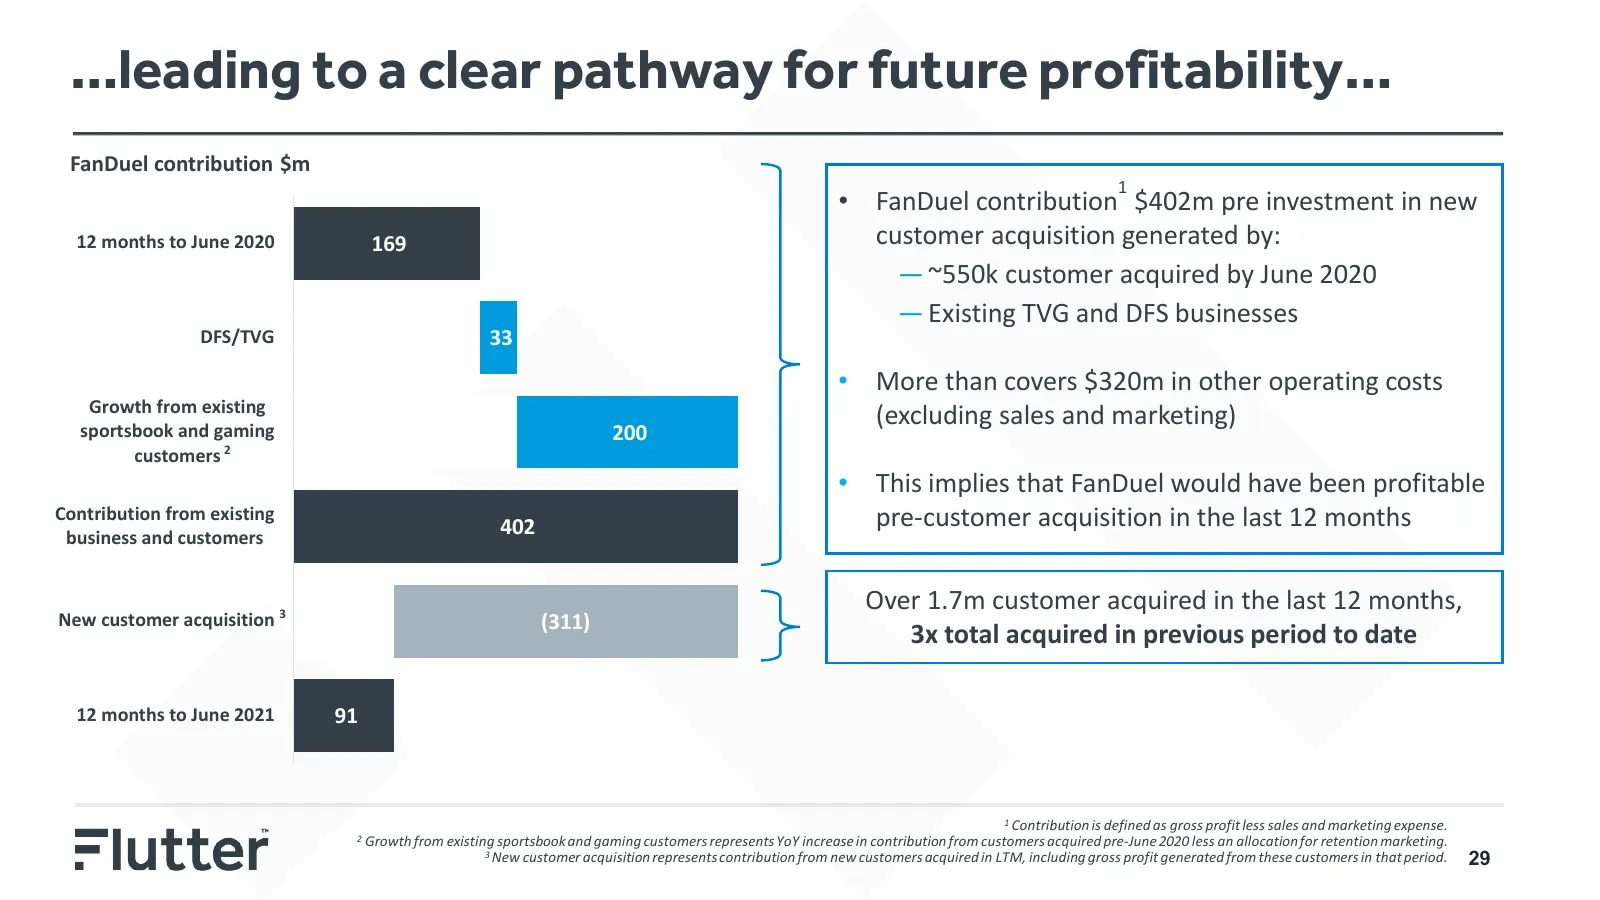
…leading to a clear pathway for future profitability… FanDuel contribution $m 1 • FanDuel contribution $402m pre investment in new 12 months to June 2020 169 customer acquisition generated by: — ~550k customer acquired by June 2020 — Existing TVG and DFS businesses DFS/TVG 33 • More than covers $320
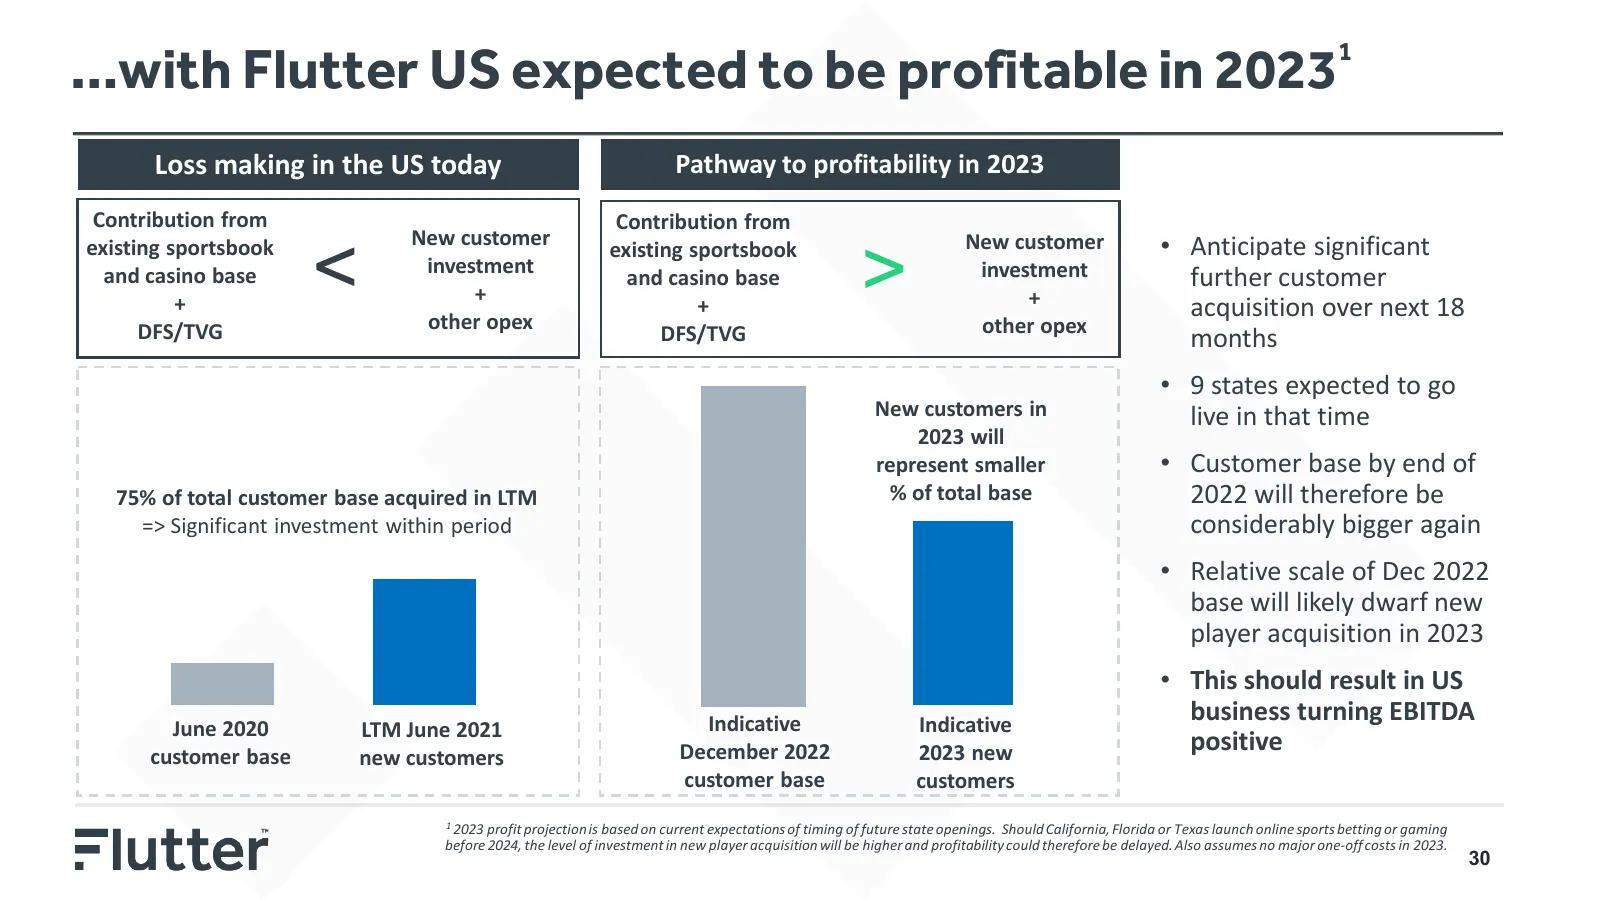
Slide 30: Flutter US expected to be profitable in 2023
…with Flutter US expected to be profitable in 2023 1 Loss making in the US today Pathway to profitability in 2023 Contribution from Contribution from < > existing sportsbook New customer New customer • Anticipate significant existing sportsbook investment investment and casino base and casino base f
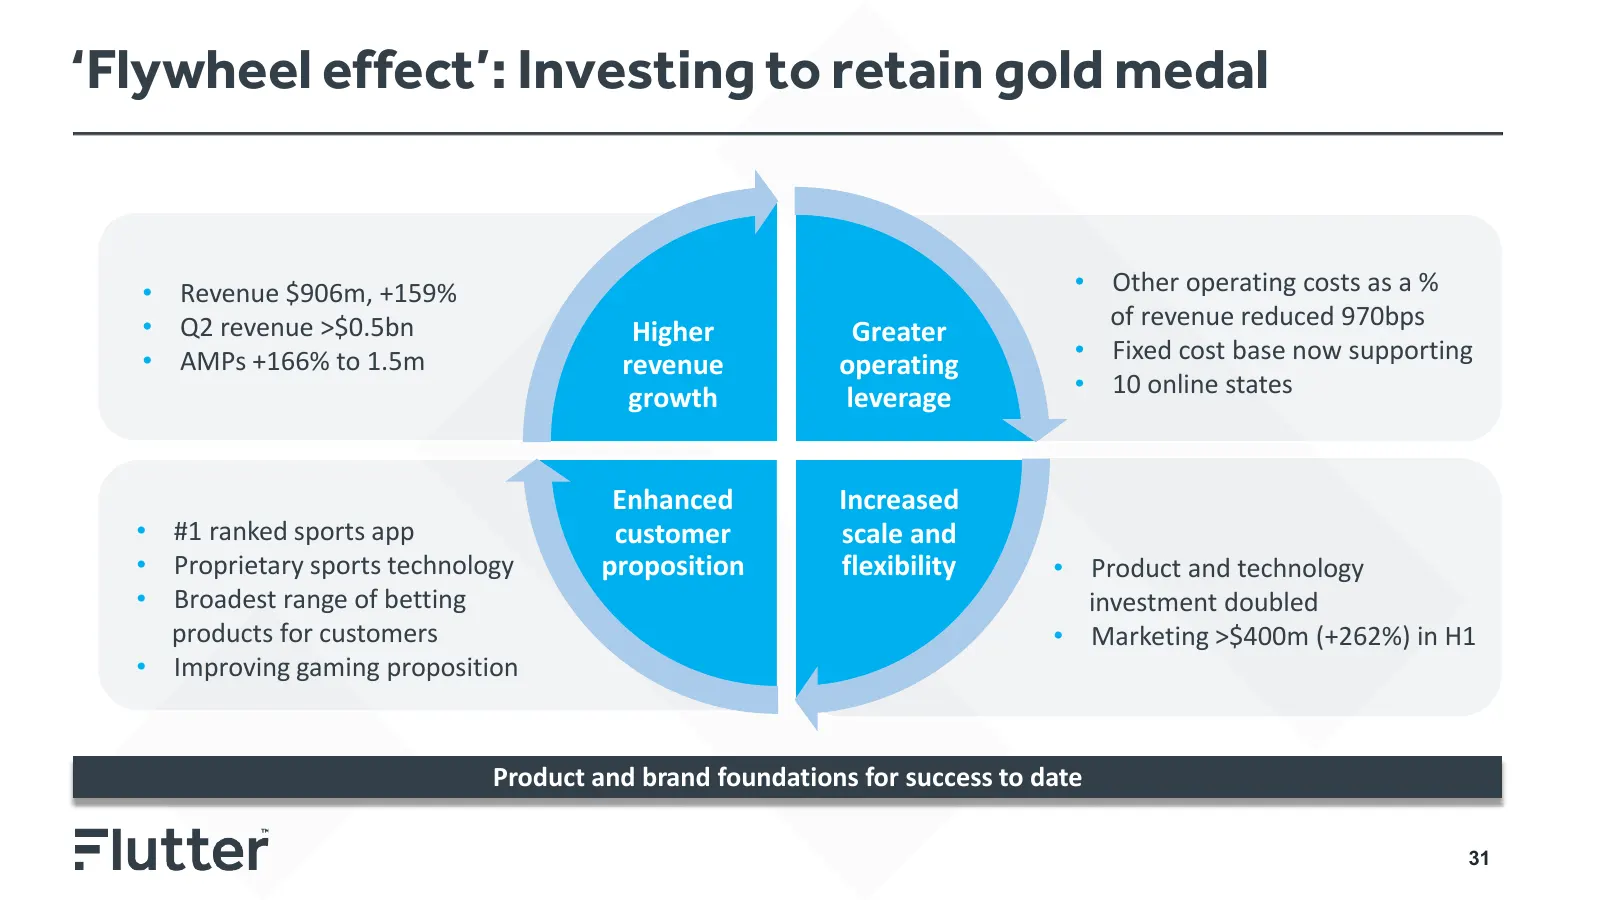
Slide 31: Flywheel effect: Investing to retain gold medal
‘Flywheel effect’: Investing to retain gold medal • Revenue $906m, +159% • Other operating costs as a % • Q2 revenue >$0.5bn of revenue reduced 970bps Higher Greater • AMPs +166% to 1.5m • Fixed cost base now supporting revenue operating growth leverage • 10 online states Enhanced Increased • #1 ran
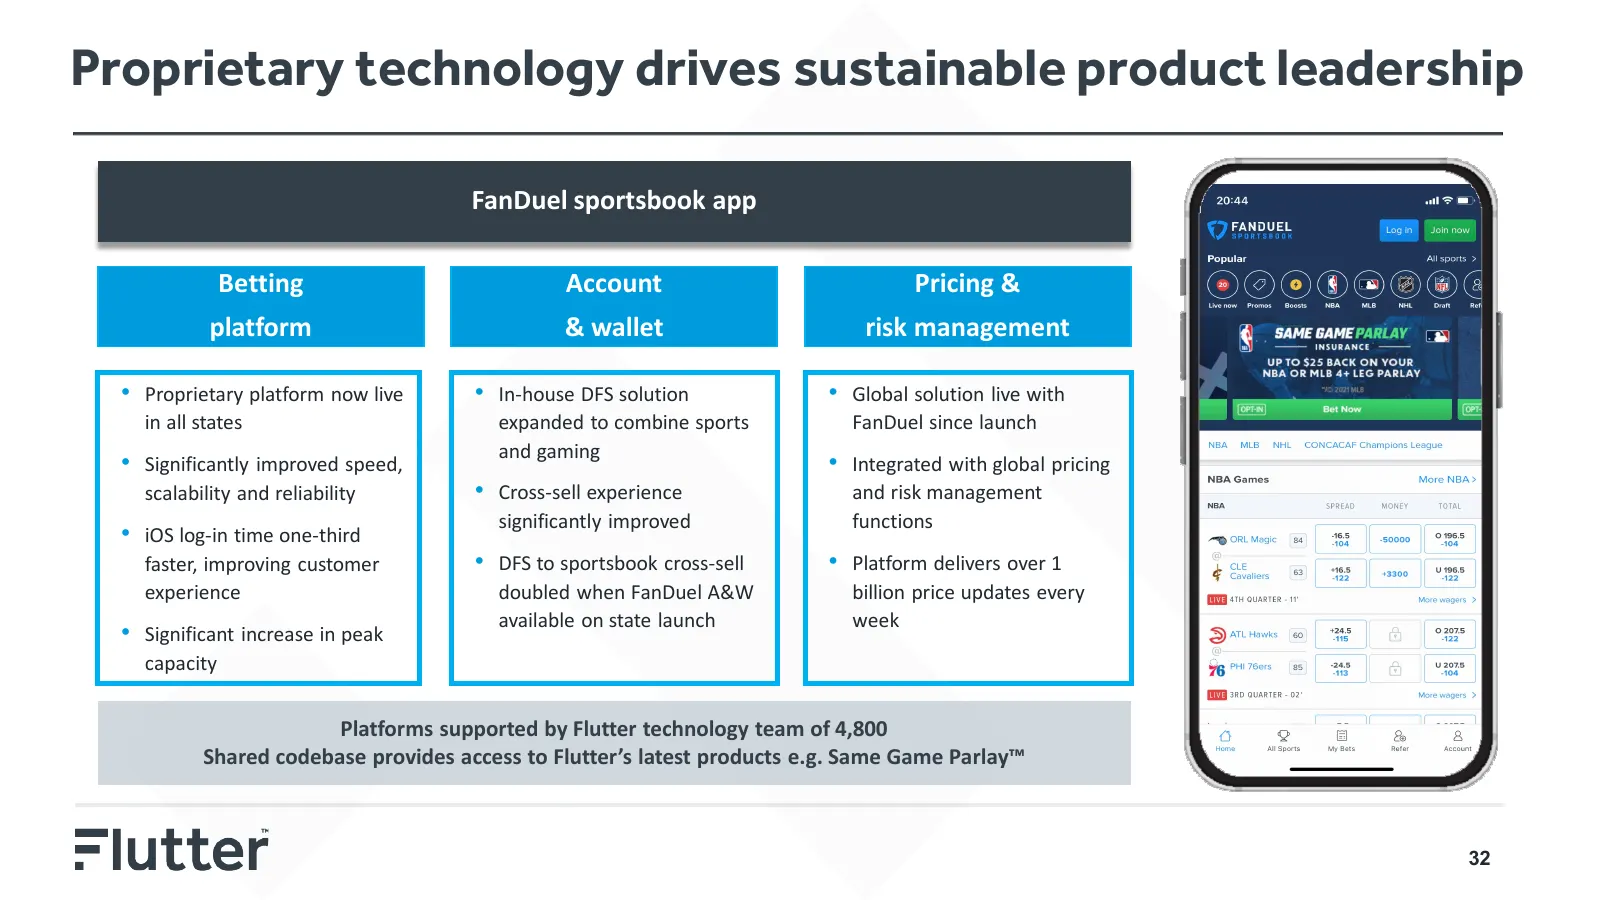
Slide 32: Proprietary technology drives sustainable product leadership
Proprietary technology drives sustainable product leadership FanDuel sportsbook app Betting Account Pricing & platform & wallet risk management • Proprietary platform now live • In-house DFS solution • Global solution live with in all states expanded to combine sports FanDuel since launch and gaming
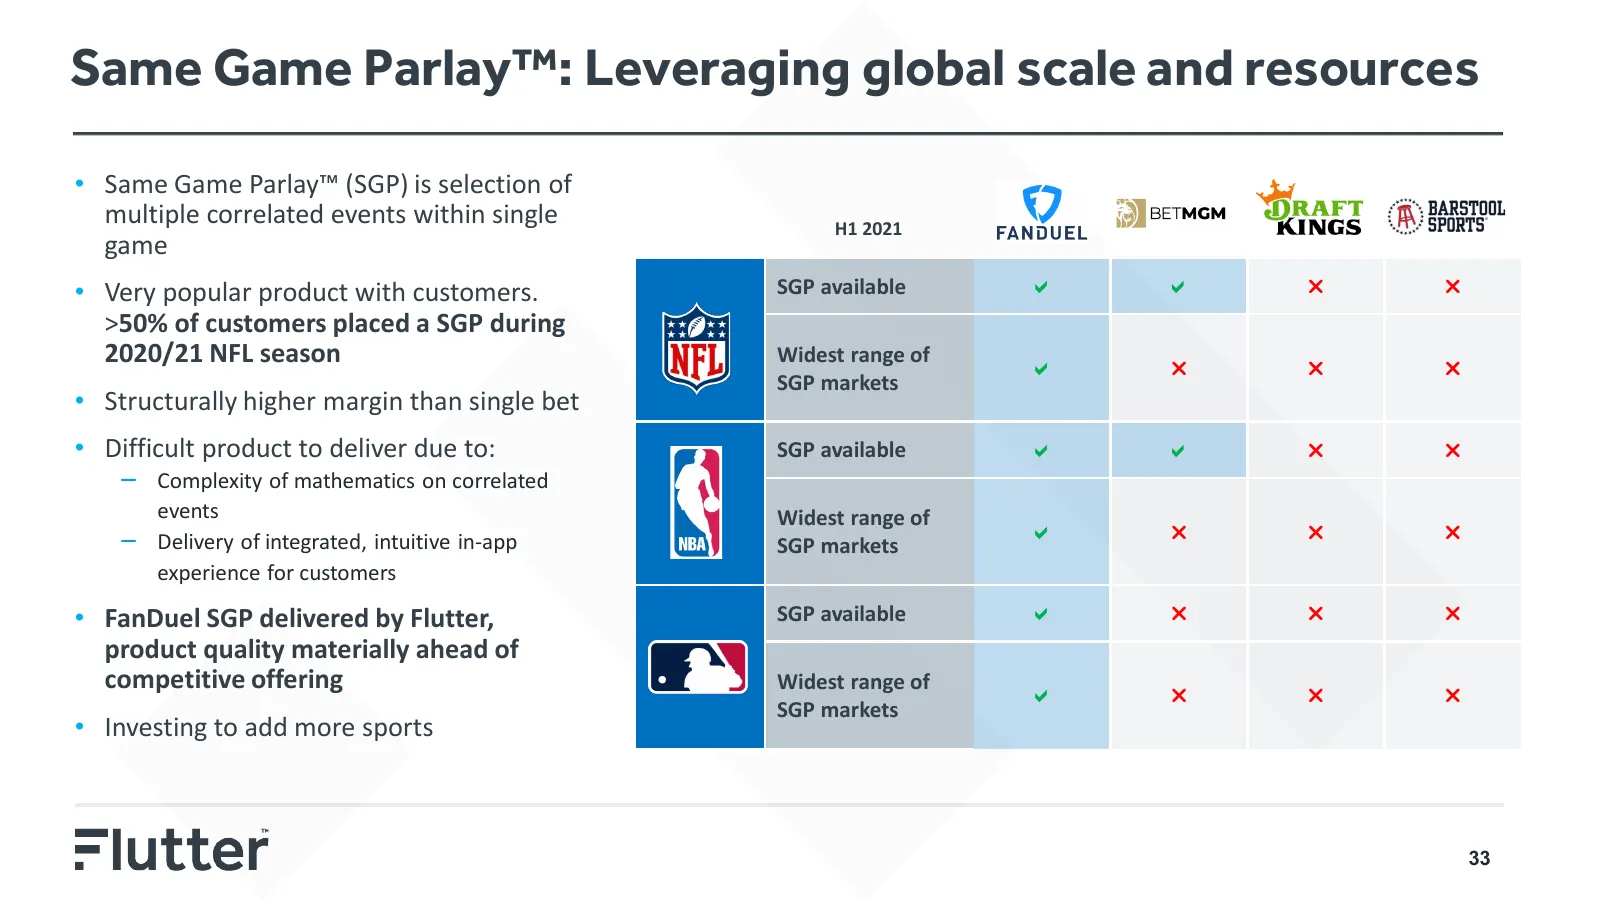
Slide 33: Same Game Parlay: Leveraging global scale and resources
Same Game Parlay™: Leveraging global scale and resources • Same Game Parlay™ (SGP) is selection of multiple correlated events within single H1 2021 game • Very popular product with customers. SGP available >50% of customers placed a SGP during 2020/21 NFL season Widest range of SGP m
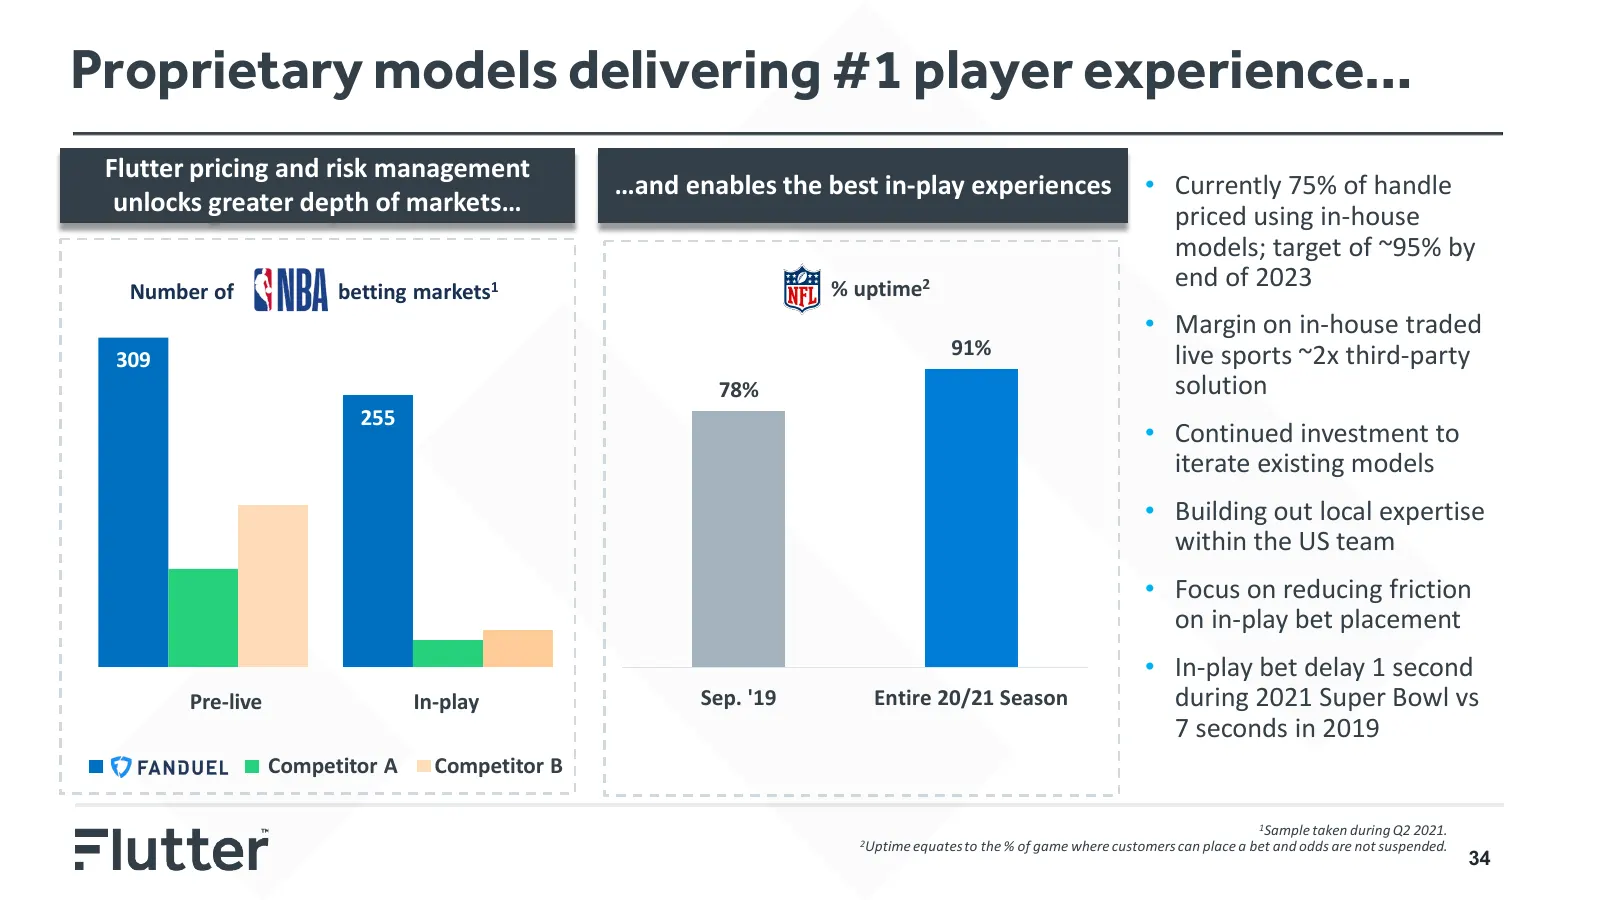
Slide 34: Proprietary models delivering #1 player experience
Proprietary models delivering #1 player experience… Flutter pricing and risk management …and enables the best in-play experiences • Currently 75% of handle unlocks greater depth of markets… priced using in-house models; target of ~95% by Number of betting markets1 % uptime2 end of 2023 • Margin on i
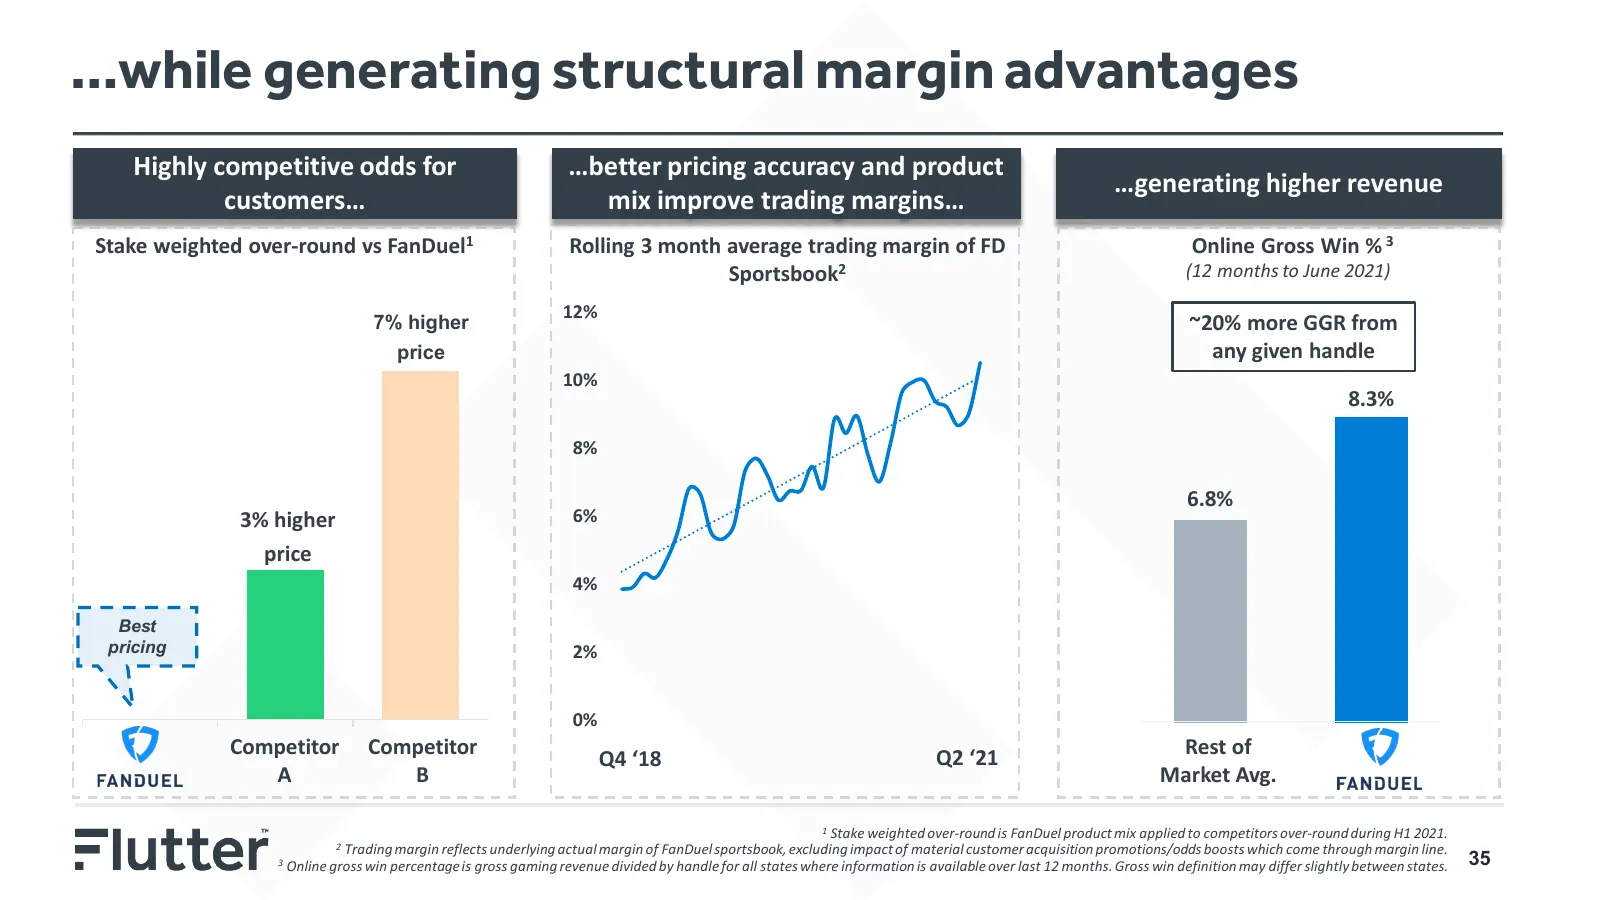
Slide 35: Generating structural margin advantages
…while generating structural margin advantages Highly competitive odds for …better pricing accuracy and product % of Handle Priced In-House …generating Morehigher revenue to come… customers… mix improve trading margins… Stake weighted over-round vs FanDuel1 Rolling 3 month average trading margin of
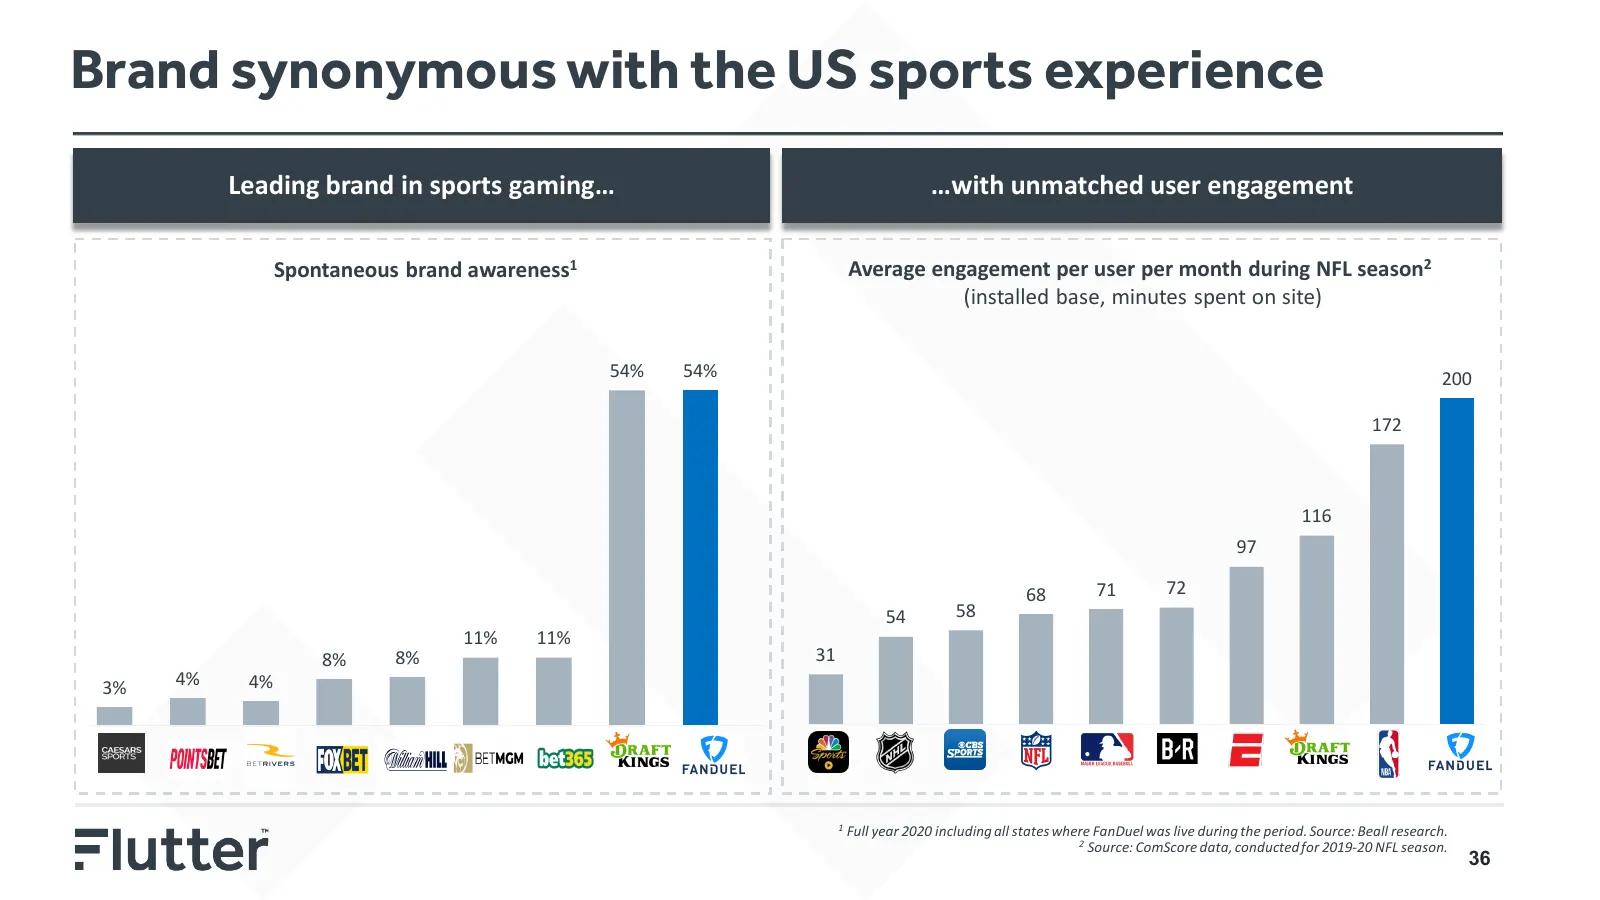
Slide 36: Brand synonymous with the US sports experience
Brand synonymous with the US sports experience Leading brand in sports gaming… …with unmatched user engagement Spontaneous brand awareness1 Average engagement per user per month during NFL season2 (installed base, minutes spent on site) 54% 54% 200 172 116 97 68 71 72 54 58 11% 11% 8% 8% 31 3% 4% 4%
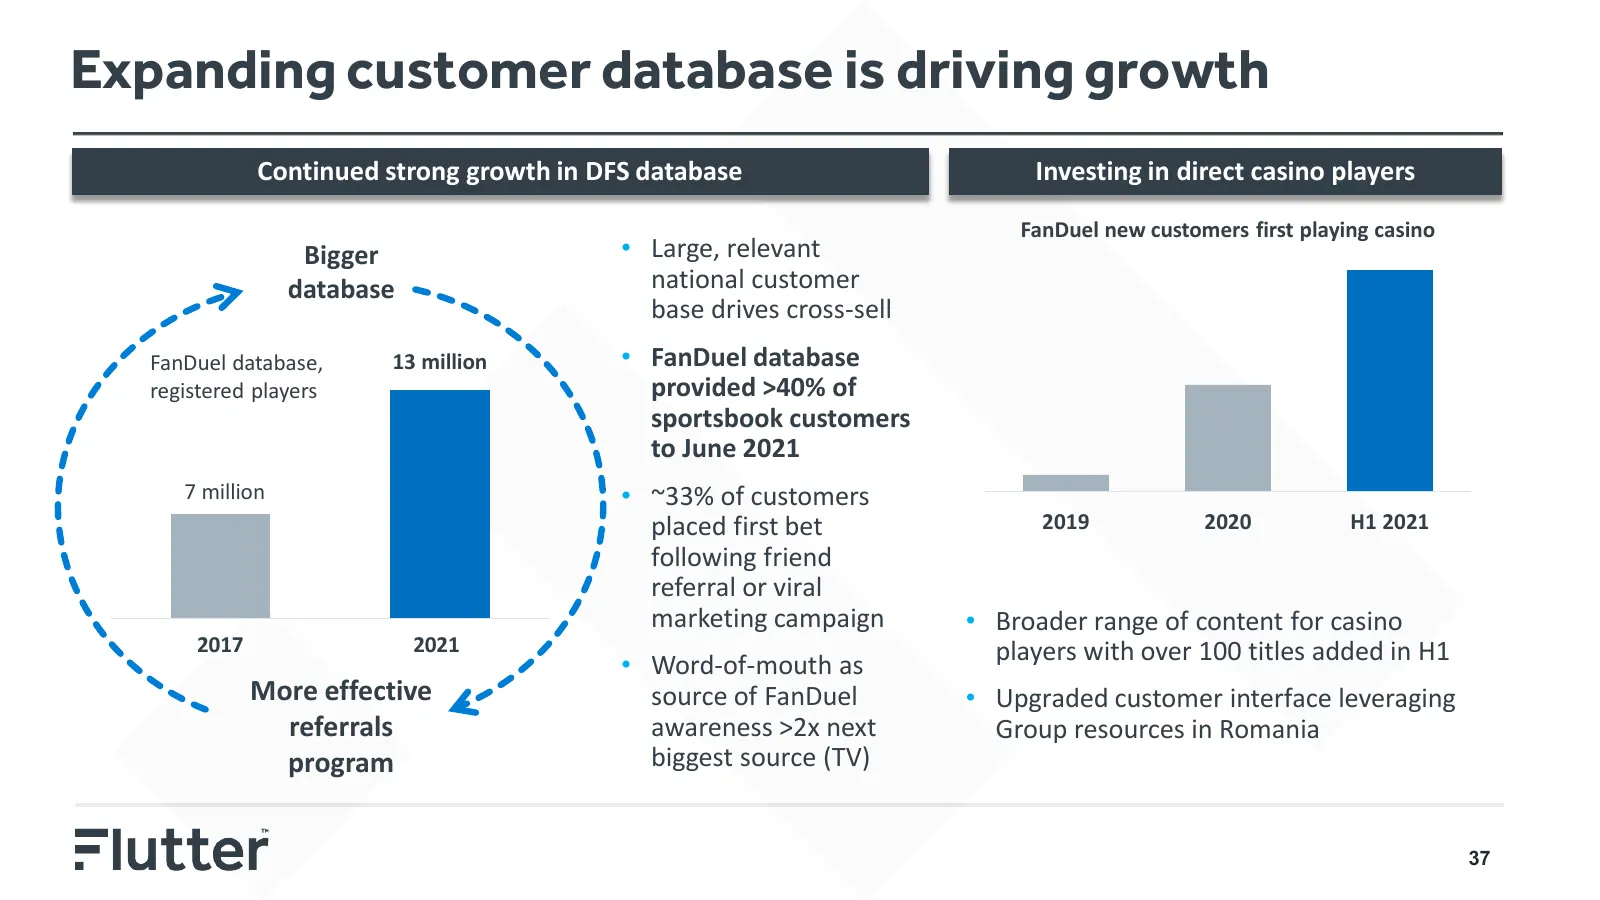
Slide 37: Expanding customer database is driving growth
Expanding customer database is driving growth Continued strong growth in DFS database Investing in direct casino players FanDuel new customers first playing casino Bigger • Large, relevant database national customer base drives cross-sell FanDuel database, 13 million • FanDuel database registered pl
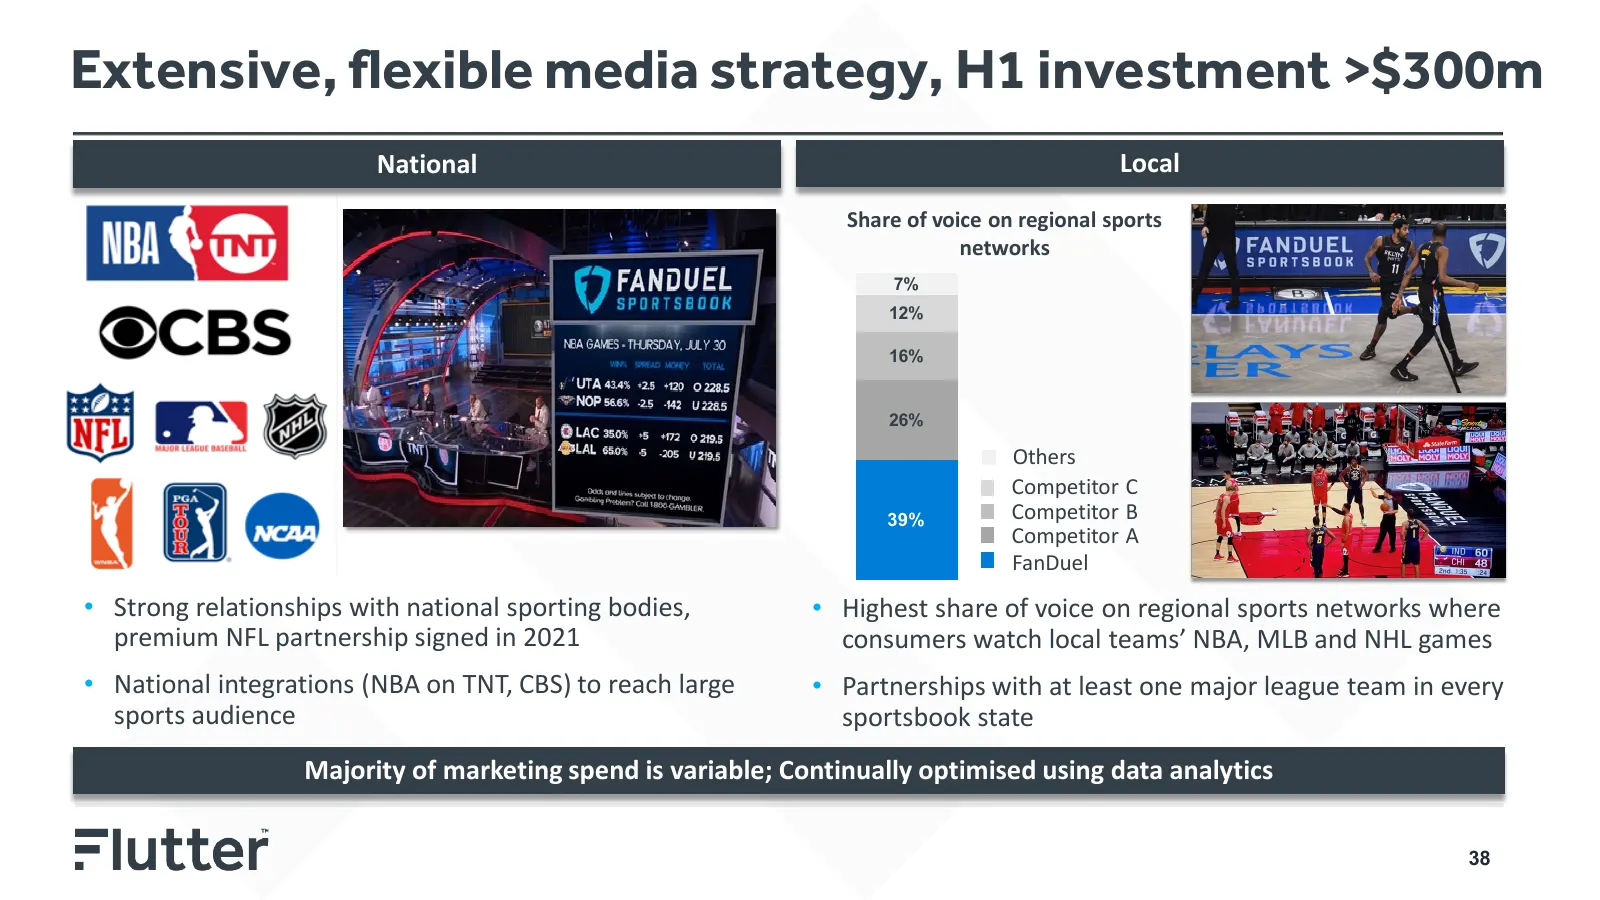
Slide 38: Extensive, flexible media strategy, H1 investment >$300m
Extensive, flexible media strategy, H1 investment >$300m National Local Share of voice on regional sports networks 7% 12% 16% 26% Others Competitor C 39% Competitor B Competitor A FanDuel • Strong relationships with national sporting bodies, • Highest share of voice on regional sports networks where
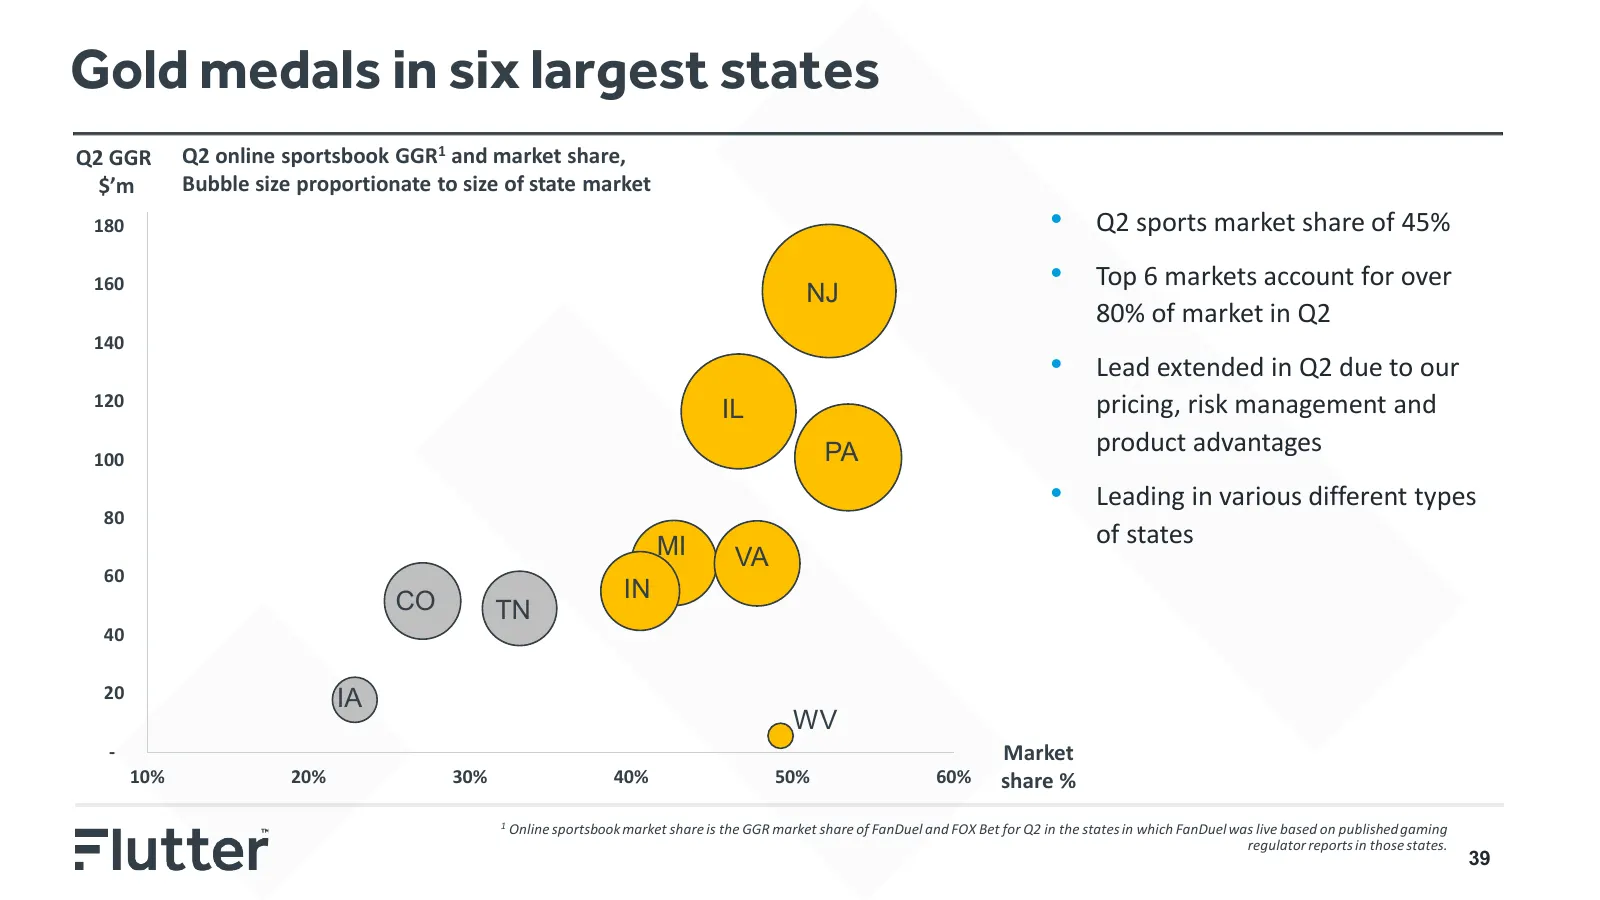
Slide 39: Gold medals in six largest states
Gold medals in six largest states Q2 GGR Q2 online sportsbook GGR1 and market share, $’m Bubble size proportionate to size of state market 180 • Q2 sports market share of 45% 160 NJ • Top 6 markets account for over 80% of market in Q2 140 • Lead extended in Q2 due to our 120 IL pricing, risk managem
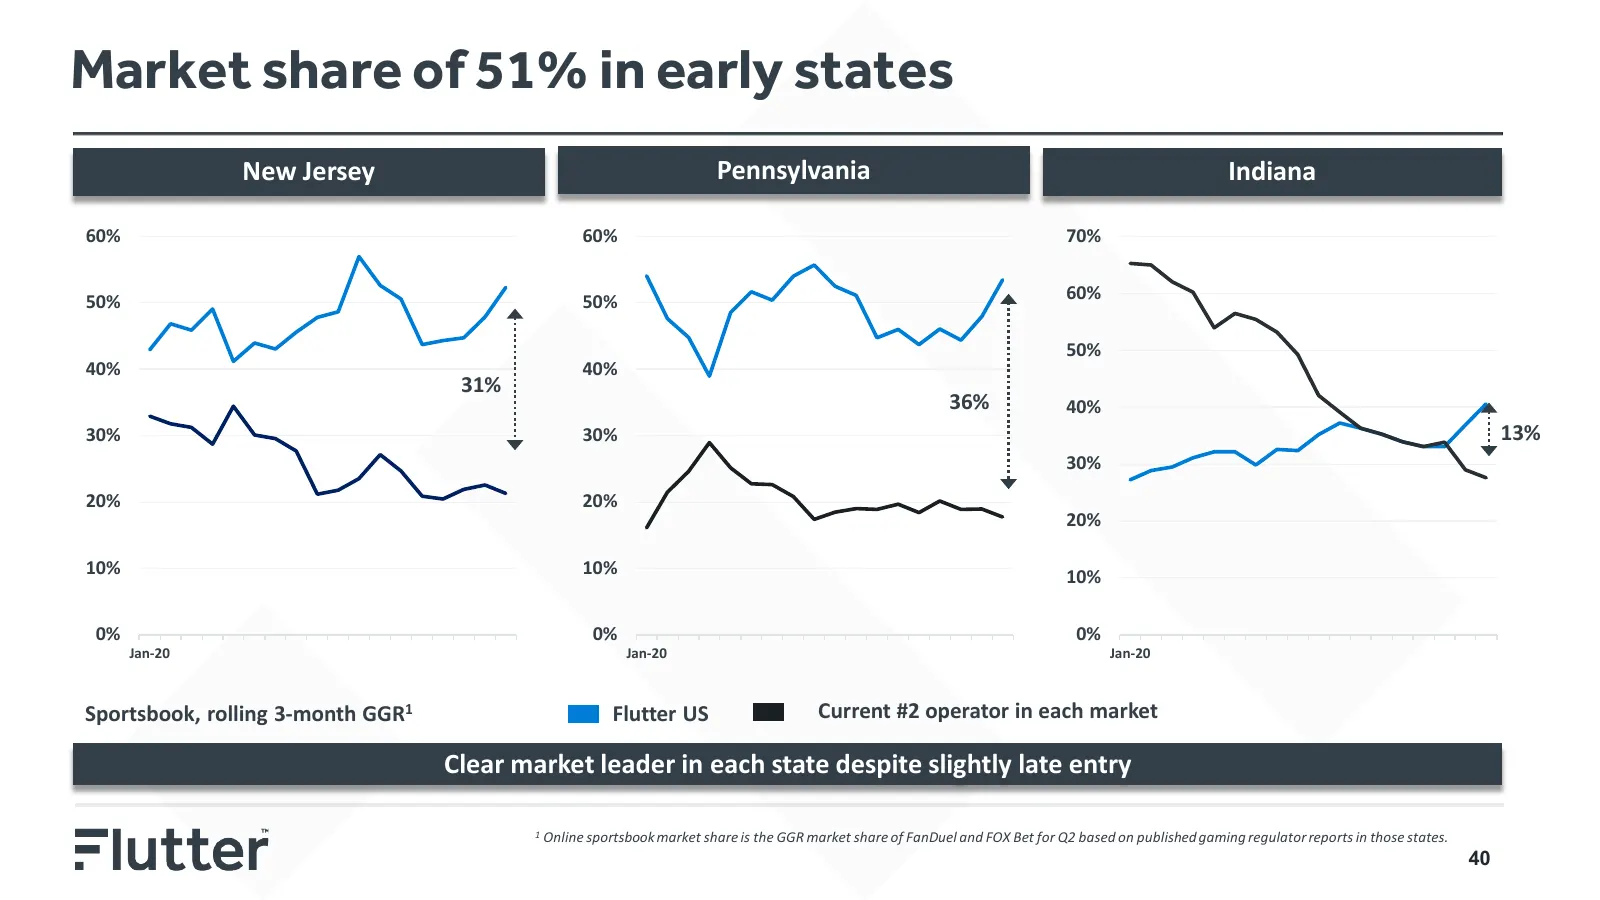
Slide 40: Market share of 51% in early states
Market share of 51% in early states New Jersey Pennsylvania Indiana 60% 60% 70% 50% 50% 60% 50% 40% 40% 31% 36% 40% 30% 30% 13% 30% 20% 20% 20% 10% 10% 10% 0% 0% 0% Jan-20 Jan-20 Jan-20 Sportsbook, rolling 3-month GGR1 Flutter US Current #2 operator in each market Clear market leader in each state d
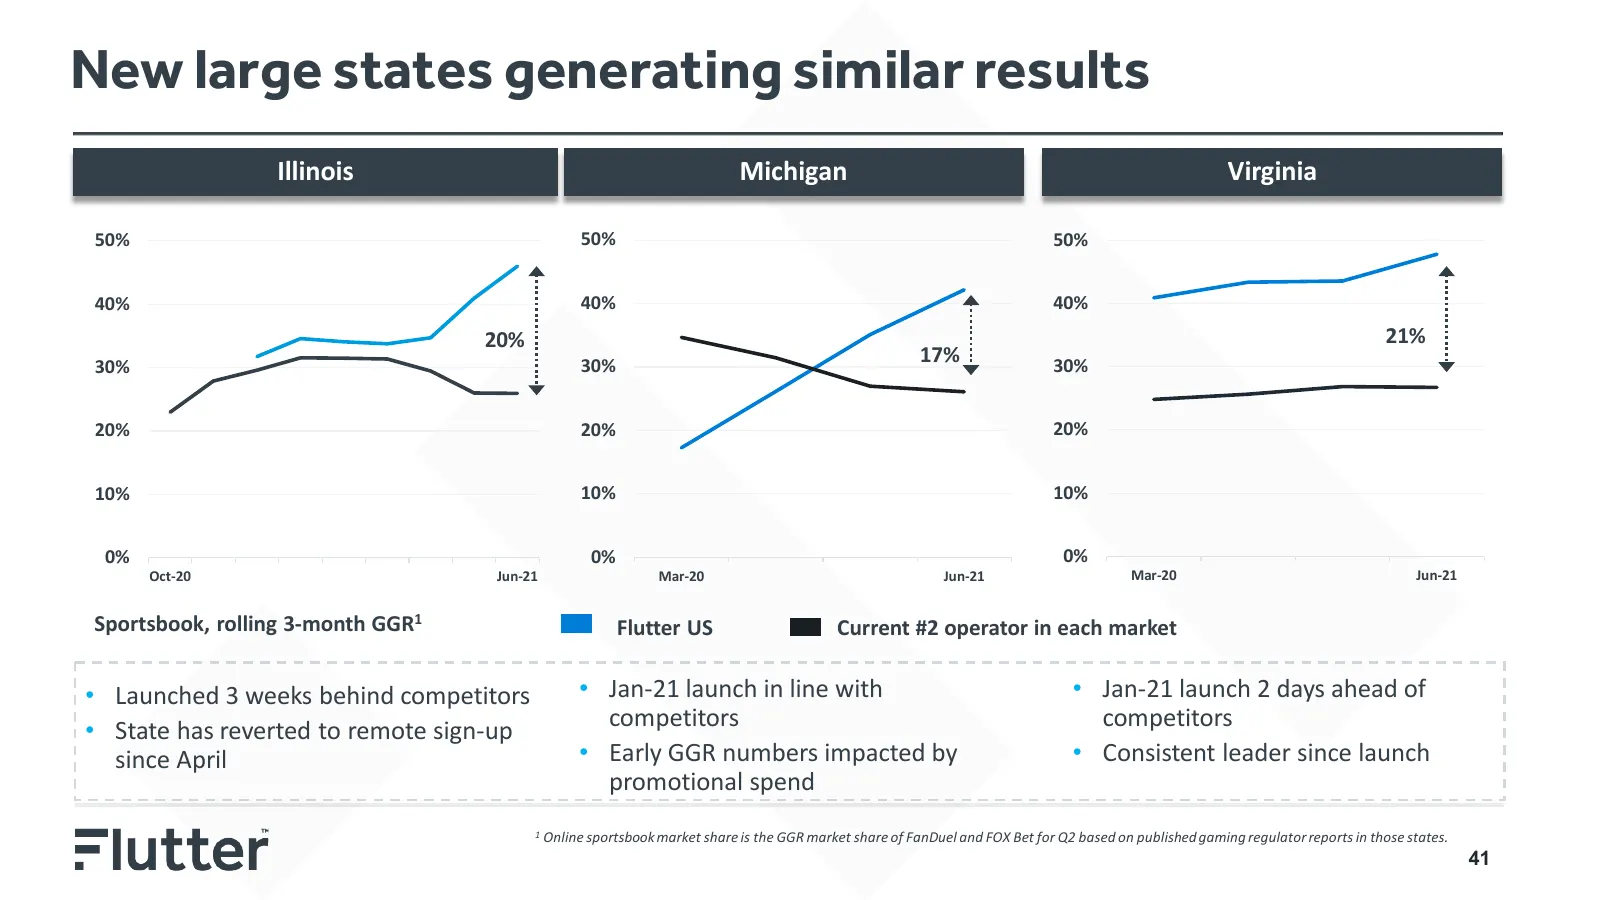
Slide 41: New large states generating similar results
New large states generating similar results Illinois Michigan Virginia 50% 50% 50% 40% 40% 40% 20% 21% 30% 30% 17% 30% 20% 20% 20% 10% 10% 10% 0% 0% 0% Oct-20 Jun-21 Mar-20 Jun-21 Mar-20 Jun-21 Sportsbook, rolling 3-month GGR1 Flutter US Current #2 operator in each market • Launched 3 weeks behind c
Slide 42: More to come
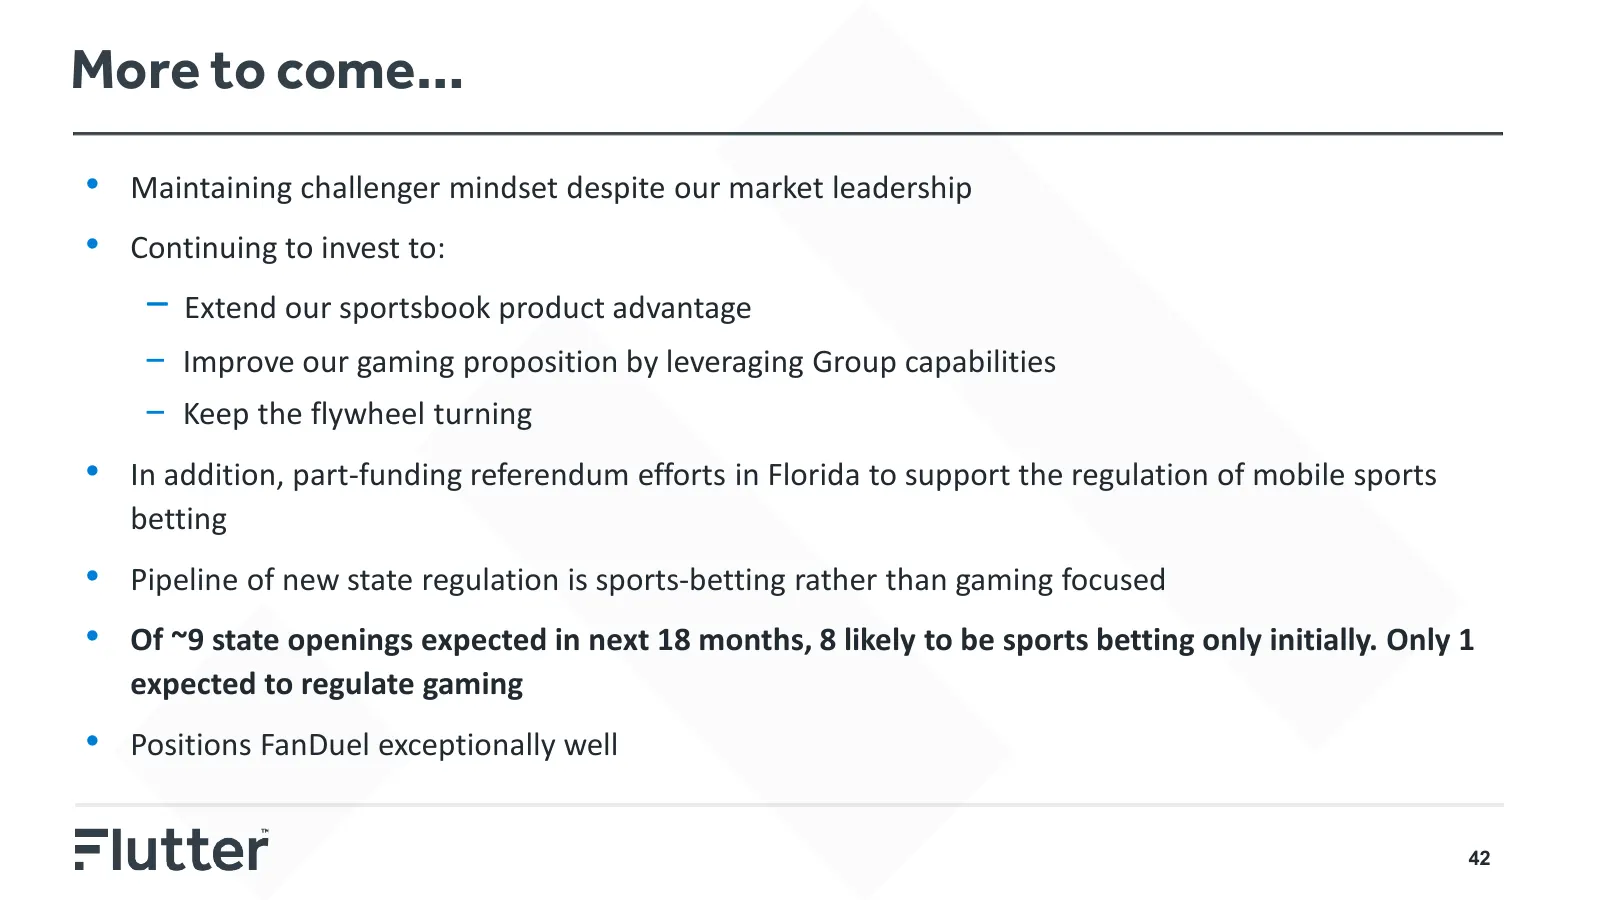
More to come… • Maintaining challenger mindset despite our market leadership • Continuing to invest to: − Extend our sportsbook product advantage − Improve our gaming proposition by leveraging Group capabilities − Keep the flywheel turning • In addition, part-funding referendum efforts in Florida to

Slide 43: Conclusion
Conclusion Peter Jackson, Group CEO 43
Slide 44: Conclusion
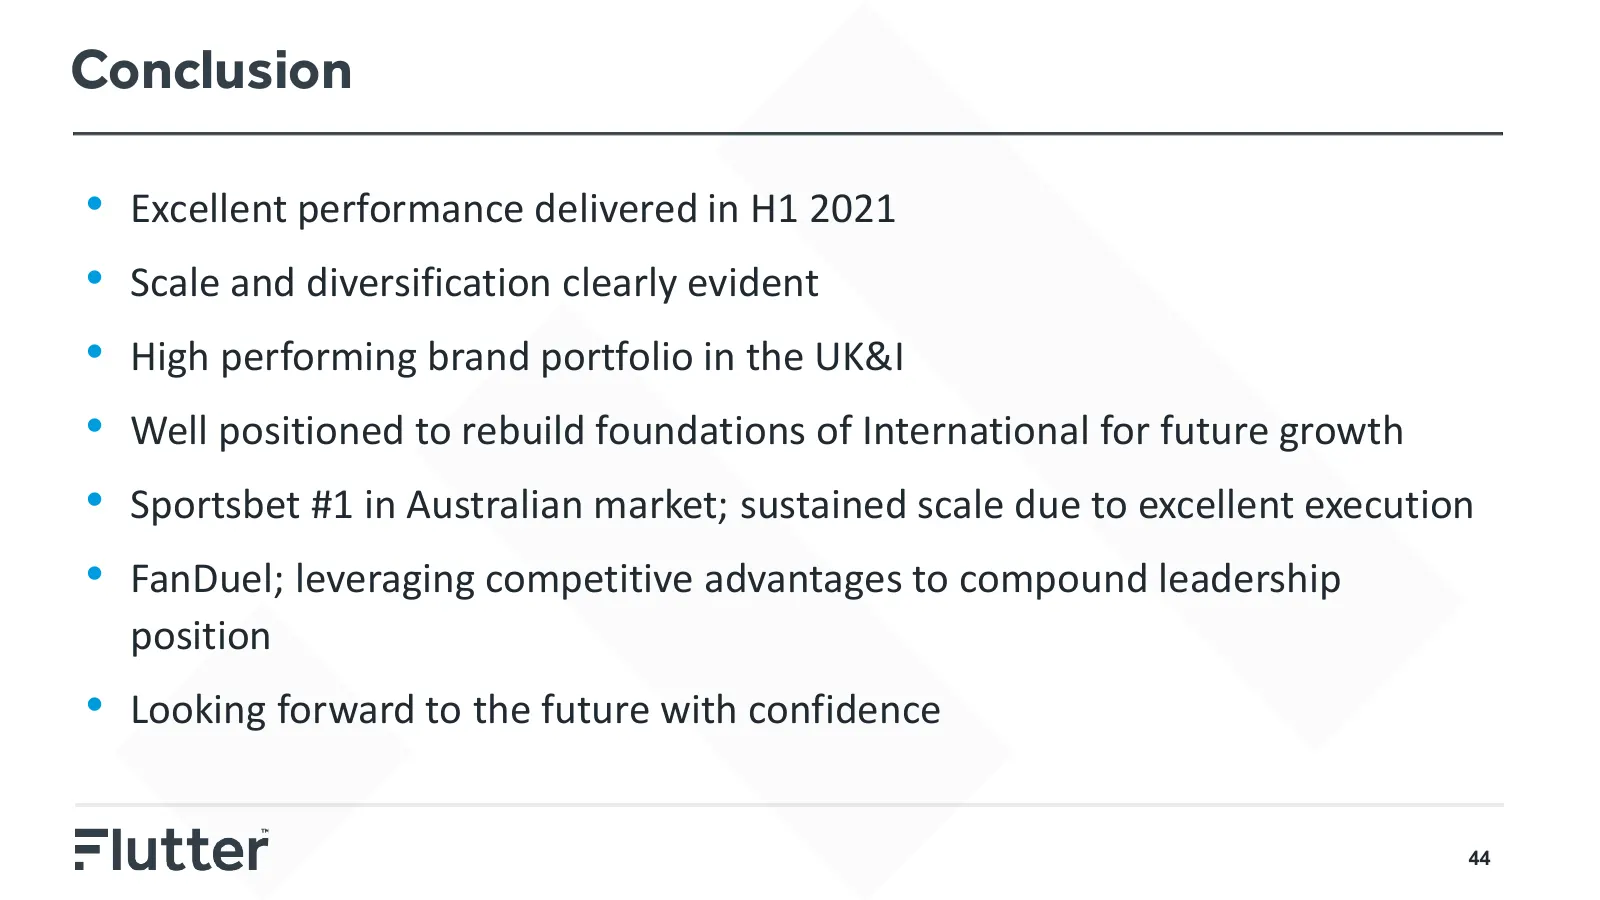
Conclusion • Excellent performance delivered in H1 2021 • Scale and diversification clearly evident • High performing brand portfolio in the UK&I • Well positioned to rebuild foundations of International for future growth • Sportsbet #1 in Australian market; sustained scale due to excellent executio

Slide 45: Appendix
Appendix =lutter
Slide 46: KPI: Average monthly players
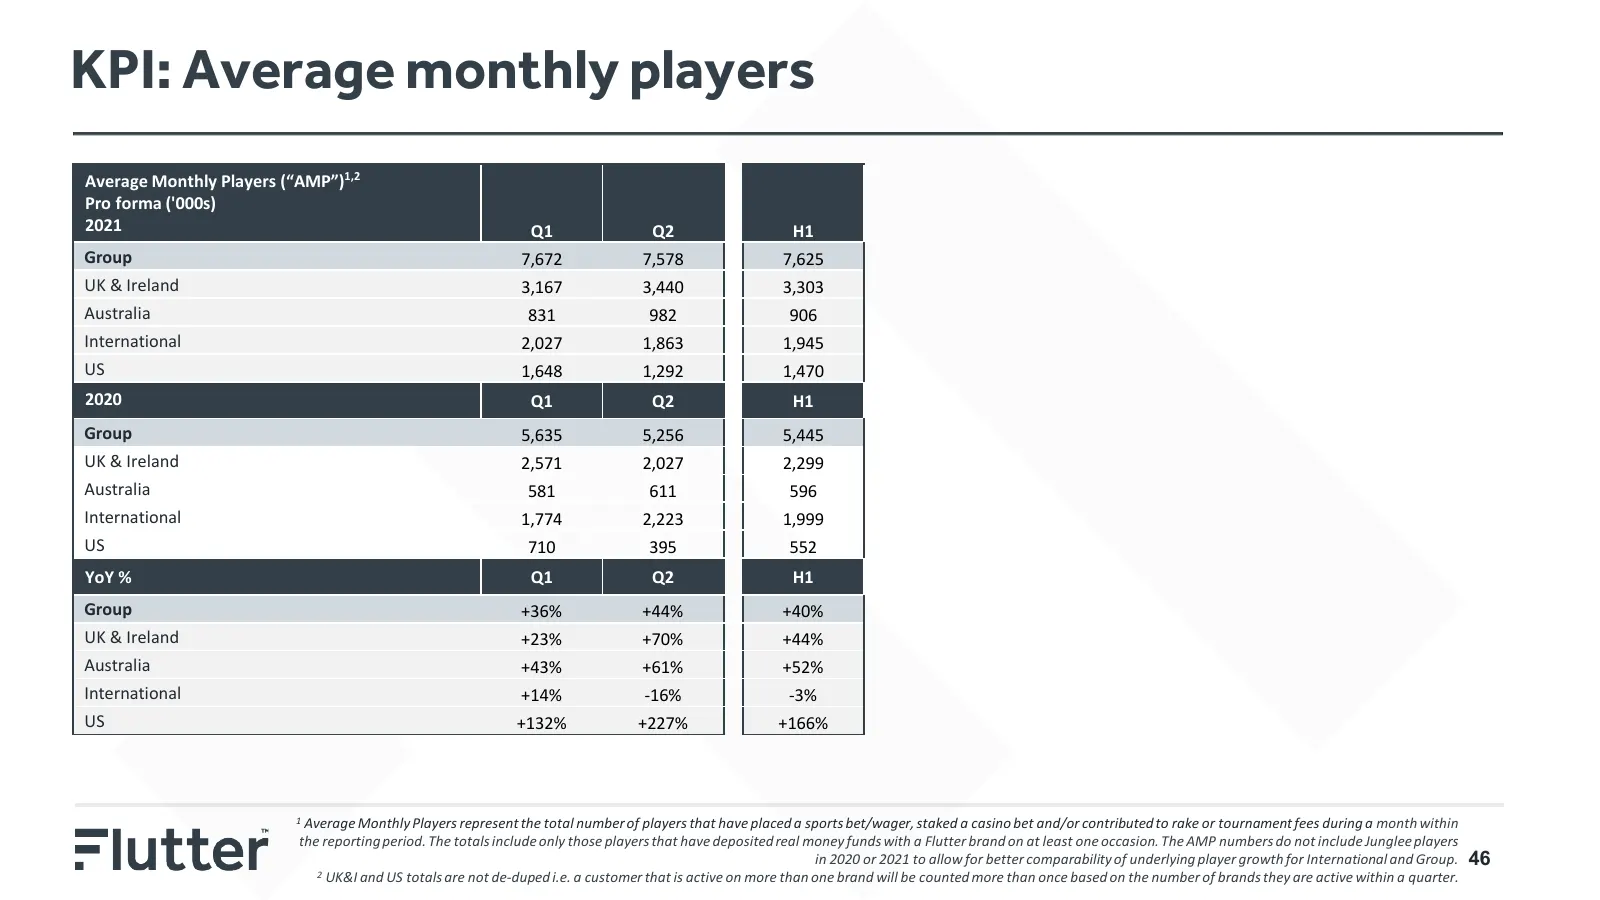
KPI: Average monthly players Average Monthly Players (“AMP”)1,2 Pro forma ('000s) 2021 Q1 Q2 H1 Group 7,672 7,578 7,625 UK & Ireland 3,167 3,440 3,303 Australia 831 982 906 International 2,027 1,863 1,945 US 1,648 1,292 1,470 2020 Q1 Q2 H1 Group 5,635 5,256 5,445 UK & Ireland 2,571 2,027 2,299 Austr
Slide 47: UK & Ireland
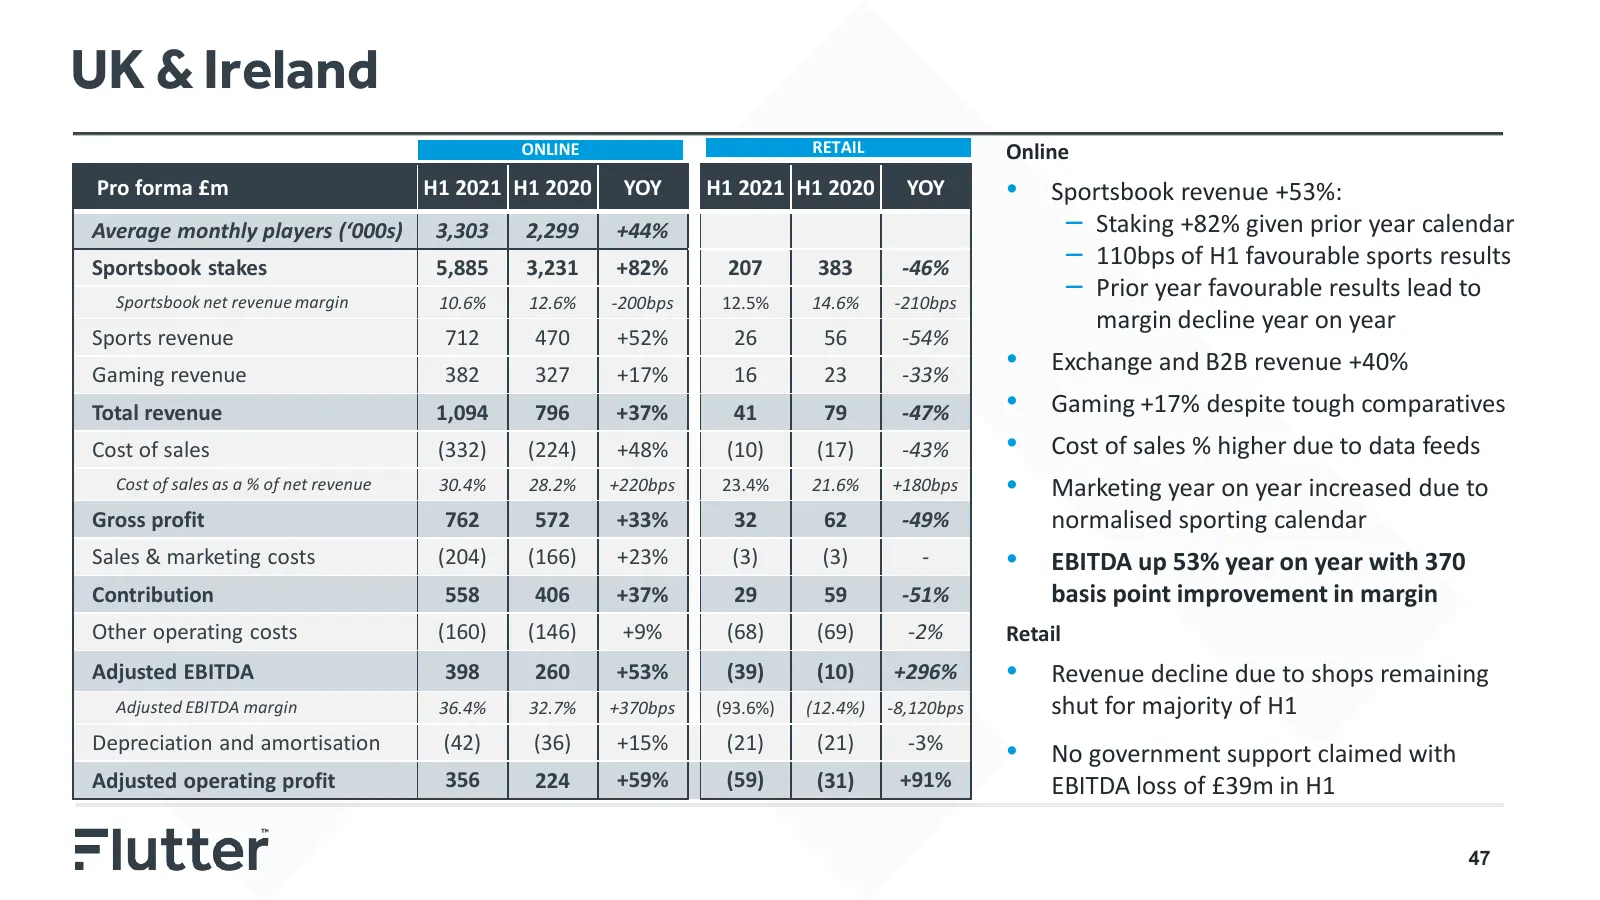
UK & Ireland ONLINE RETAIL Online Pro forma £m H1 2021 H1 2020 YOY H1 2021 H1 2020 YOY • Sportsbook revenue +53%: Average monthly players (‘000s) 3,303 2,299 +44% – Staking +82% given prior year calendar Sportsbook stakes 5,885 3,231 +82% 207 383 -46% – 110bps of H1 favourable sports results Sportsb
Slide 48: Australia
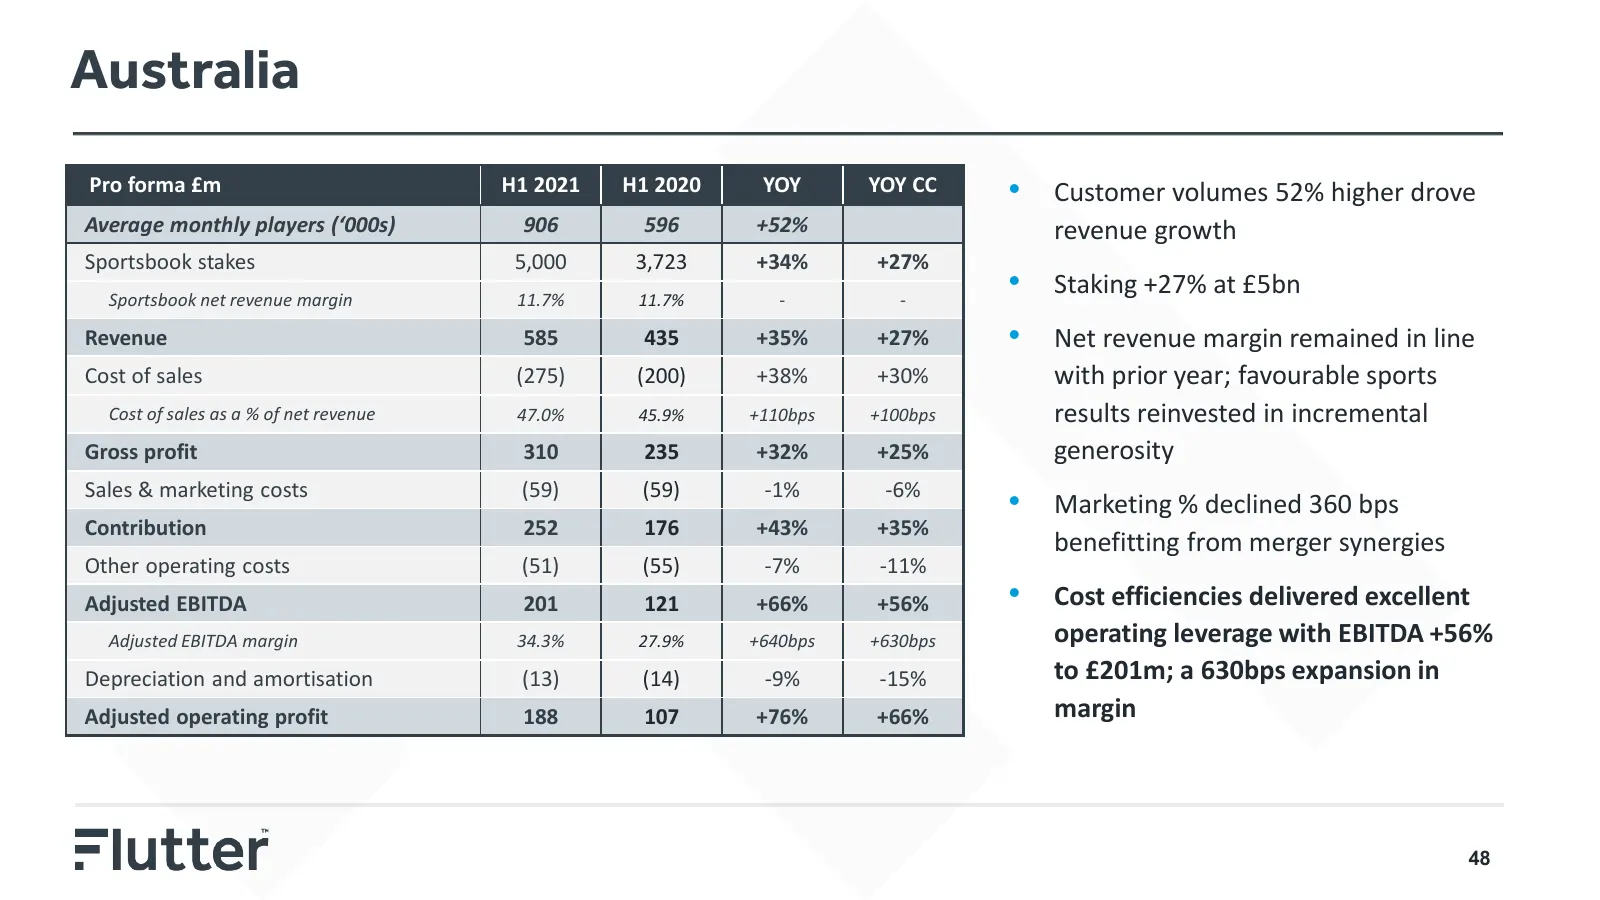
Australia Pro forma £m H1 2021 H1 2020 YOY YOY CC • Customer volumes 52% higher drove Average monthly players (‘000s) 906 596 +52% revenue growth Sportsbook stakes 5,000 3,723 +34% +27% Sportsbook net revenue margin 11.7% 11.7% - - • Staking +27% at £5bn Revenue 585 435 +35% +27% • Net revenue margi
Slide 49: International
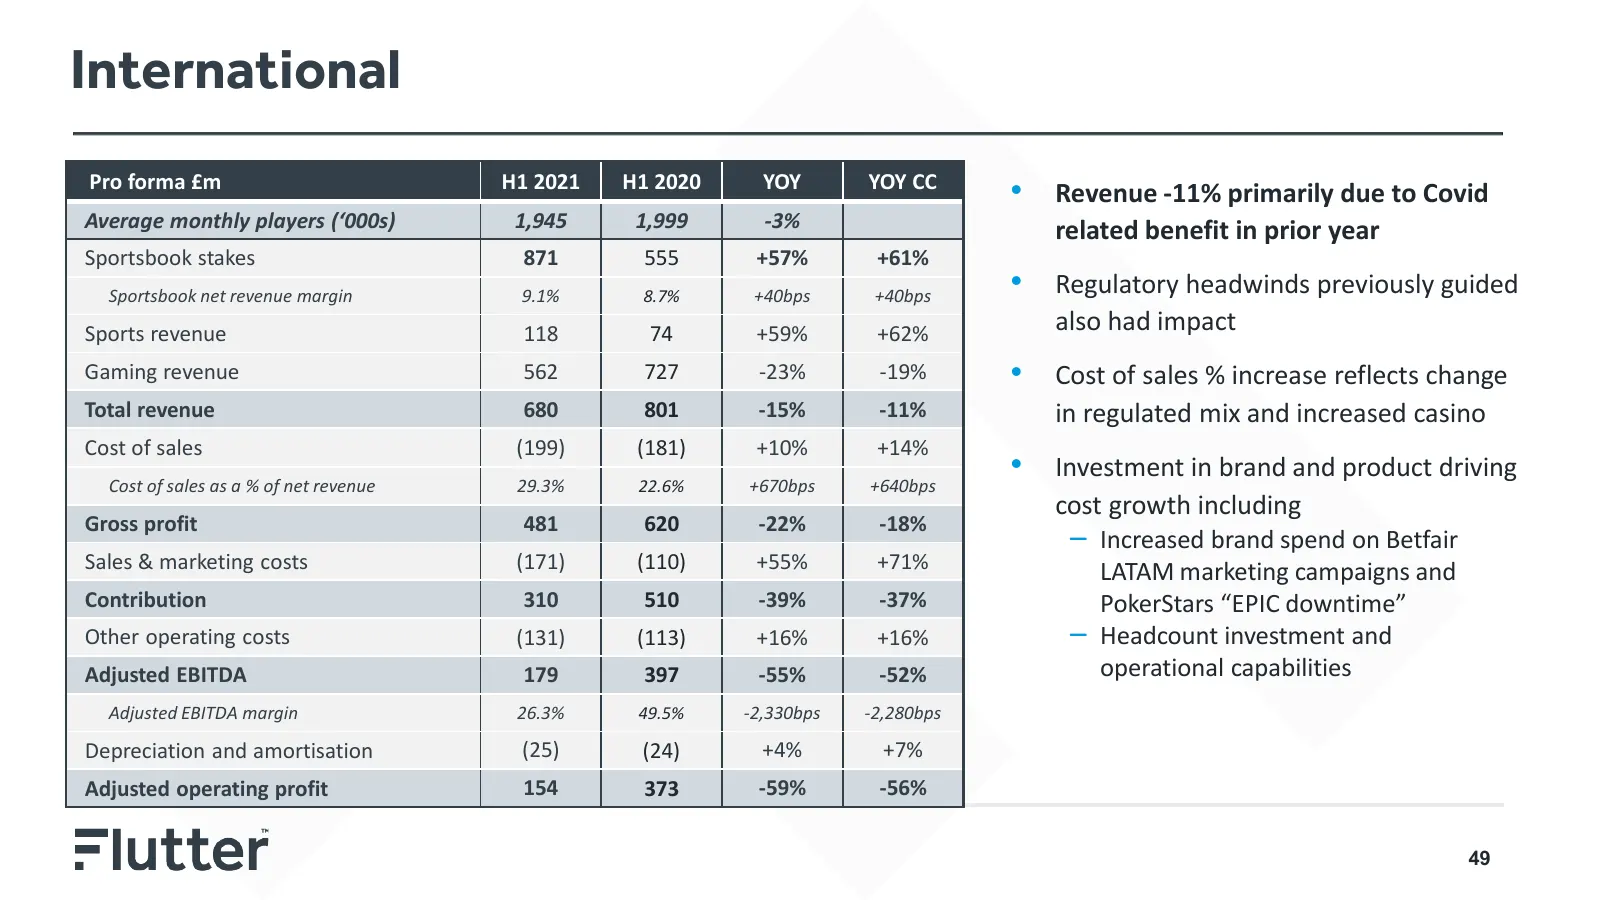
International Pro forma £m H1 2021 H1 2020 YOY YOY CC • Revenue -11% primarily due to Covid Average monthly players (‘000s) 1,945 1,999 -3% related benefit in prior year Sportsbook stakes 871 555 +57% +61% Sportsbook net revenue margin 9.1% 8.7% +40bps +40bps • Regulatory headwinds previously guided
Slide 50: US
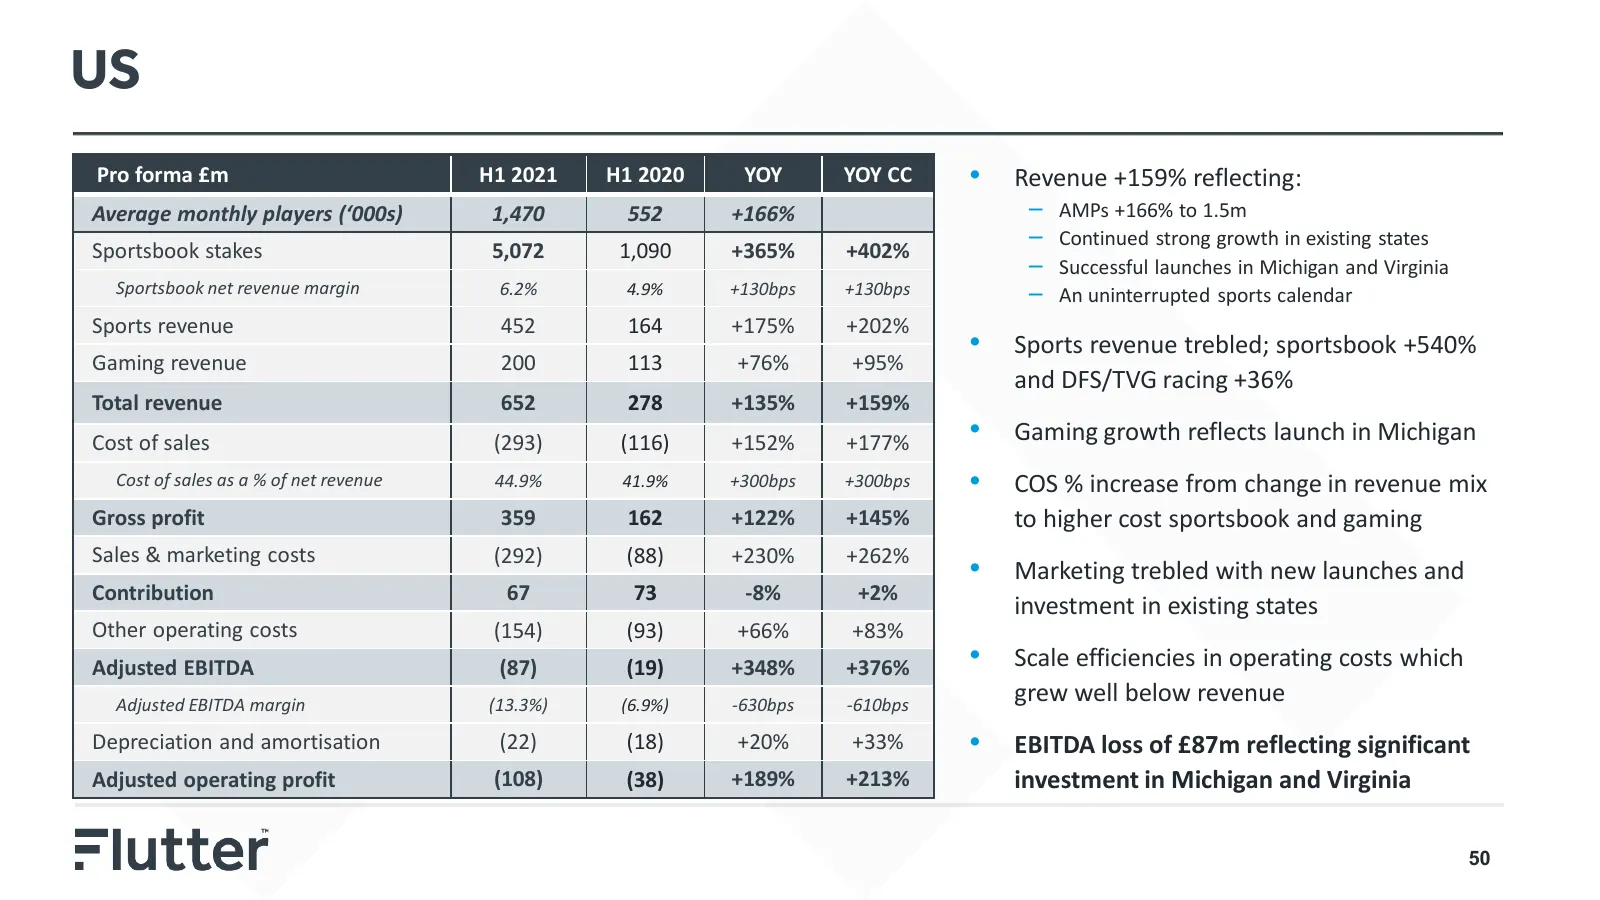
US Pro forma £m H1 2021 H1 2020 YOY YOY CC • Revenue +159% reflecting: Average monthly players (‘000s) 1,470 552 +166% – AMPs +166% to 1.5m Sportsbook stakes 5,072 1,090 +365% +402% – Continued strong growth in existing states – Successful launches in Michigan and Virginia Sportsbook net revenue mar
Slide 51: Separately disclosed items
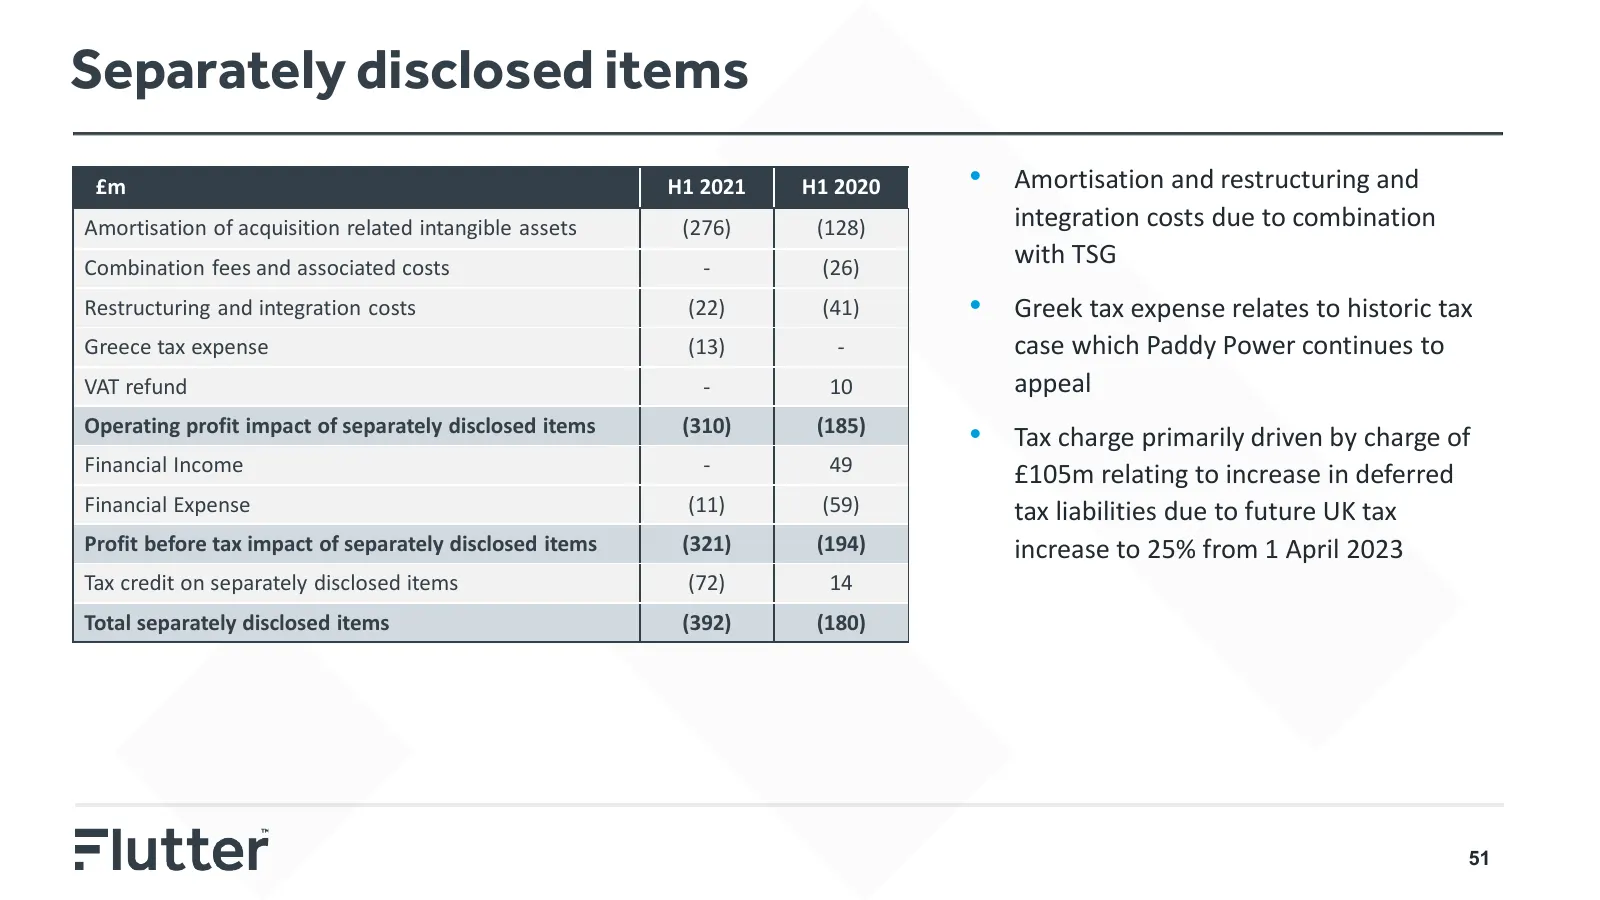
Separately disclosed items £m H1 2021 H1 2020 • Amortisation and restructuring and Amortisation of acquisition related intangible assets (276) (128) integration costs due to combination Combination fees and associated costs - (26) with TSG Restructuring and integration costs (22) (41) • Greek tax ex

Slide 52: www.flutter.com
=lutter www. flutter.com
Source: Internet Archive copy of flutter.com
More decks from Flutter Entertainment plc
 Q3 2026 Earnings Presentation15 slides · Nov 4, 2026
 Q2 2026 Earnings Presentation14 slides · Aug 5, 2026
 Investor Day (September 2024)152 slides · Sep 25, 2024
 Q2 2024 Earnings Presentation20 slides · Aug 13, 2024
 Q1 2024 Earnings Presentation20 slides · May 14, 2024
 FY2023 Earnings Presentation36 slides · Mar 26, 2024