Goodman Group · ASX:GMG
Goodman — Goodman New Zealand — H1 FY2027 Earnings Presentation
29 slides from Goodman's earnings presentation, November 2026
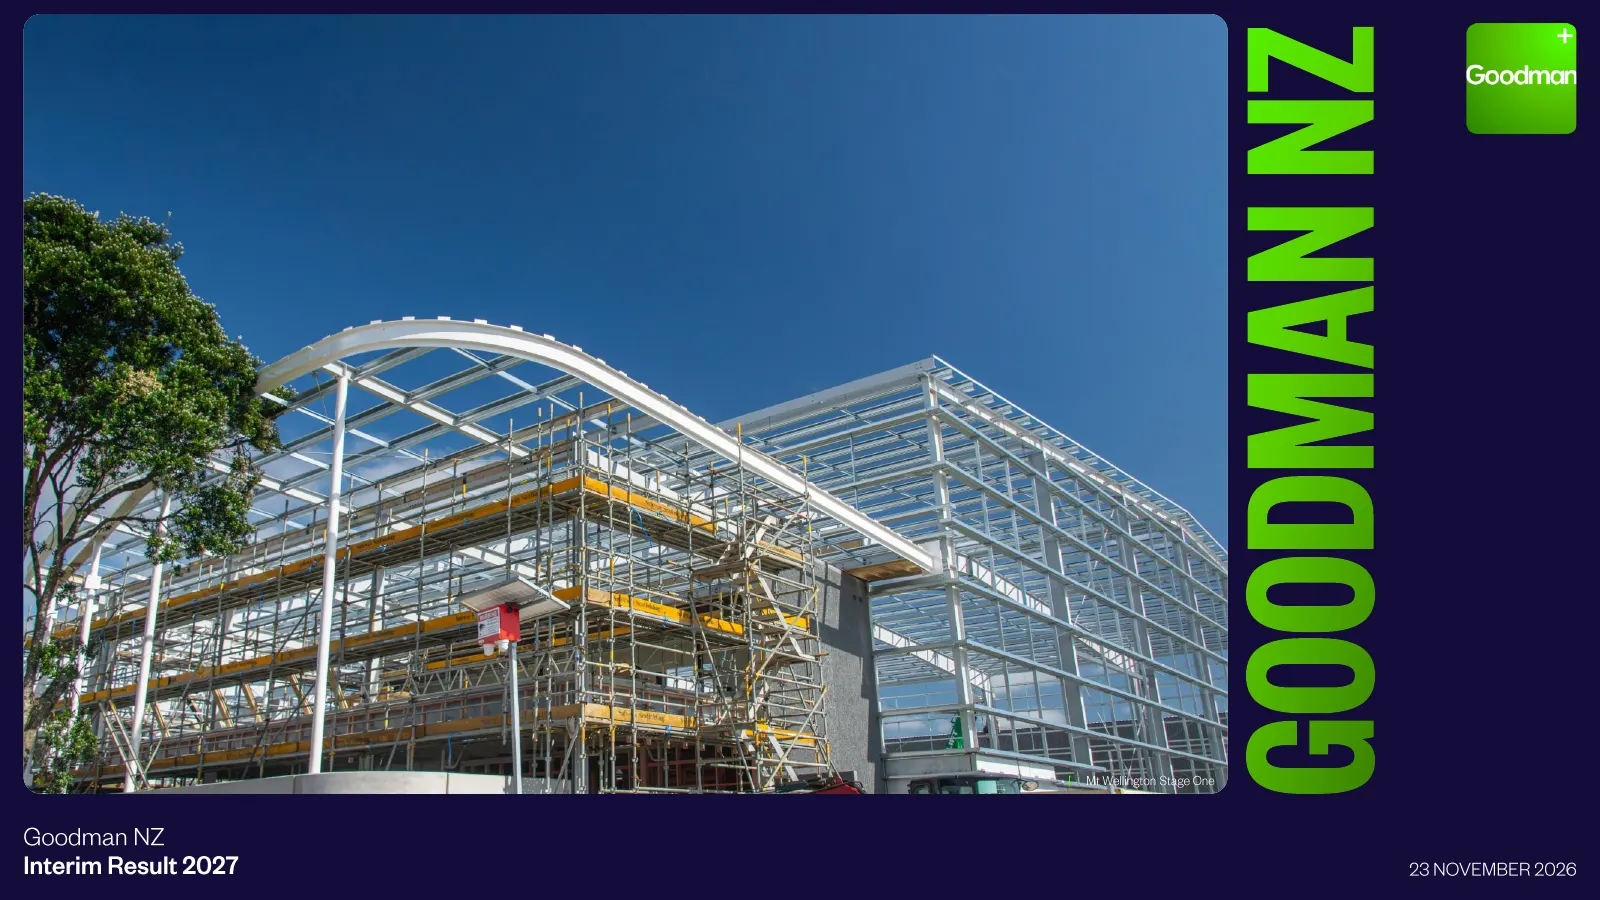
Slide 1: Goodman NZ Interim Result 2027
GOODMAN NZ Mt Wellington Stage One Goodman NZ Interim Result 2027 23 NOVEMBER 2026
Slide 2: Contents
CONTENTS The financial result provided with this release are the consolidated financial results of Goodman New Zealand Limited and (GNZL) Goodman Property Services (NZ) Limited (GPS) and subsidiaries of GNZL and GPS. Each GNZL share is stapled to a GPS share and they are quoted on the NZX Main Board
Slide 3: Overview
WaterCo and Wiggins, Highbrook Business Park 01 OVERVIEW WaterCo and Wiggins, Highbrook Business Park
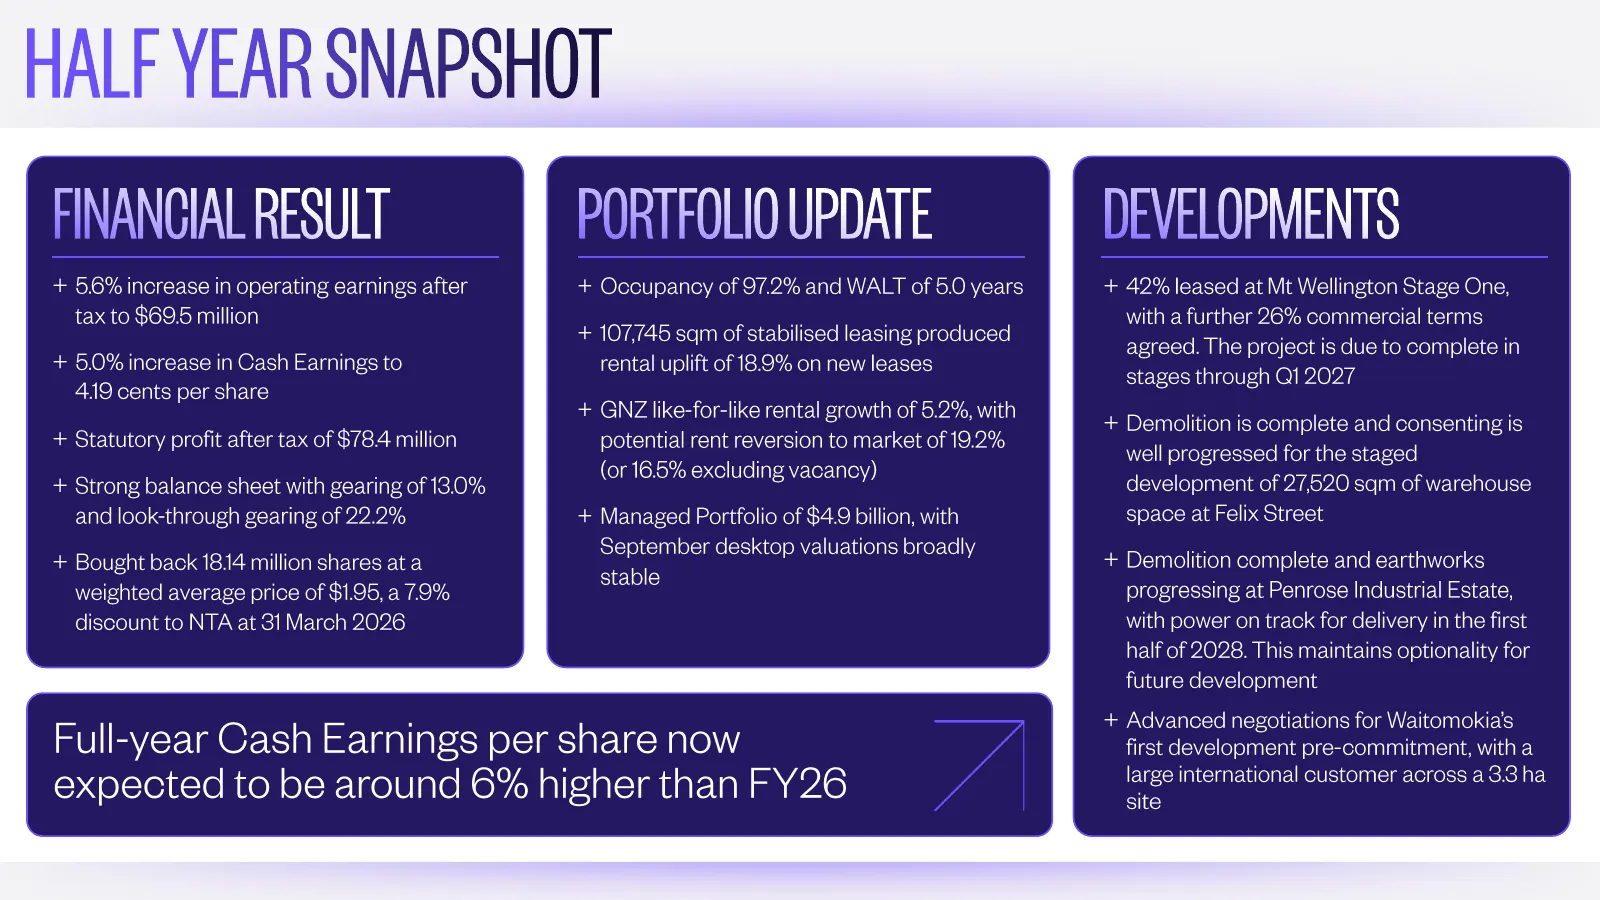
Slide 4: Half Year Snapshot
HALF YEAR SNAPSHOT FINANCIAL RESULT PORTFOLIO UPDATE DEVELOPMENTS + 5.6% increase in operating earnings after + Occupancy of 97.2% and WALT of 5.0 years + 42% leased atMt Wellington Stage One, tax to $69.5 million with a further 26% commercial terms + 107,745 sqm of stabilised leasing produced agree
Slide 5: Strategy & Key Themes
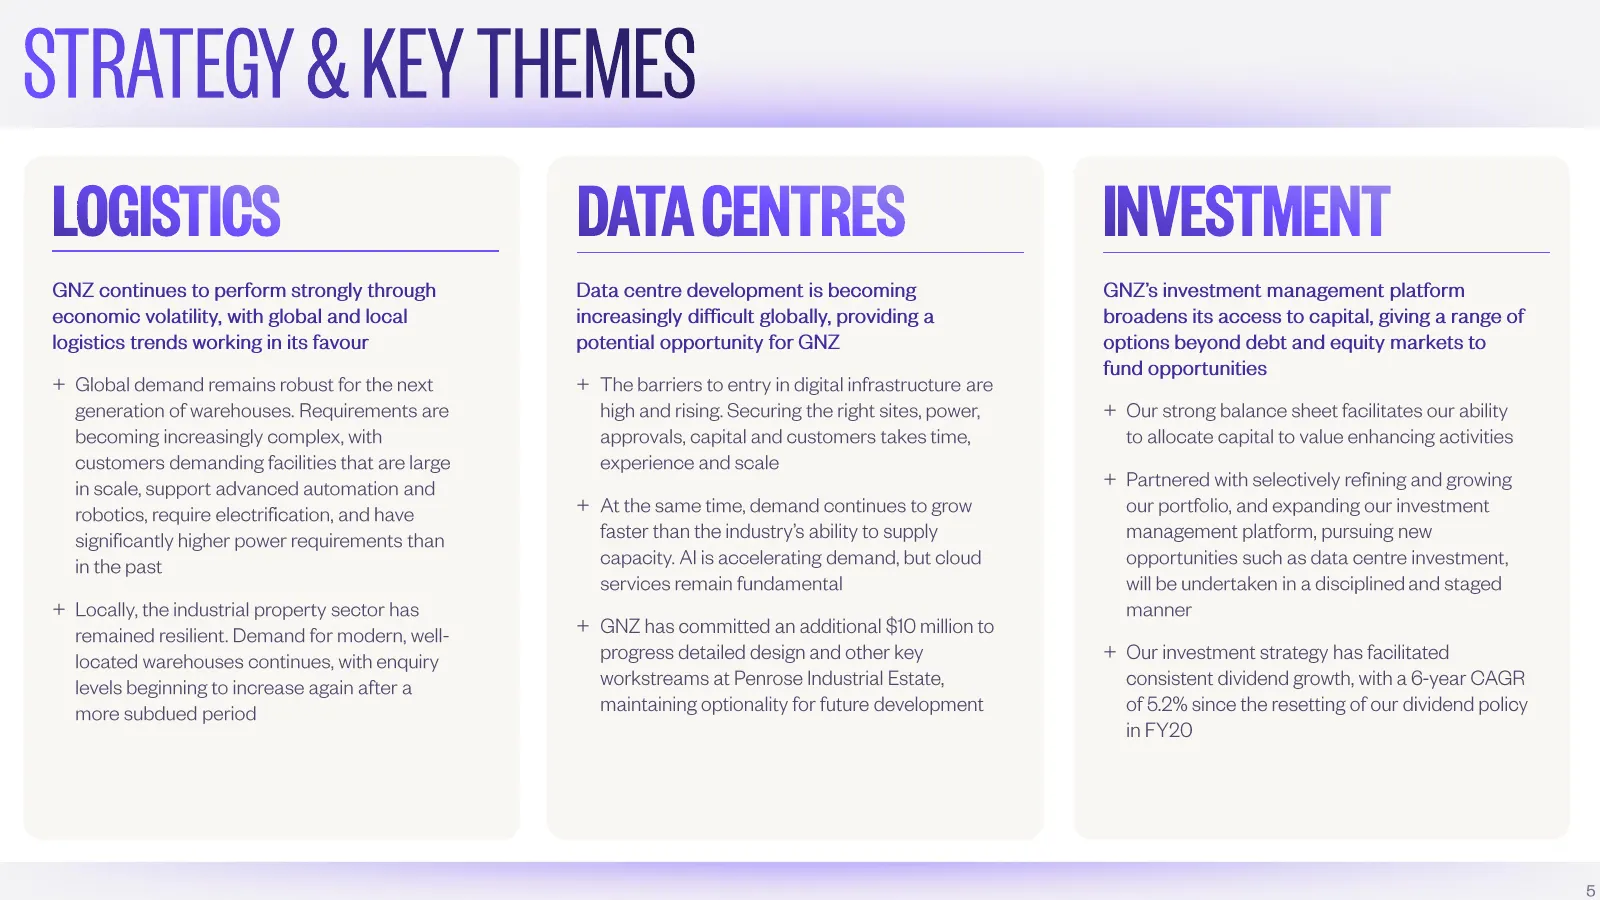
STRATEGY & KEY THEMES LOGISTICS DATA CENTRES INVESTMENT GNZ continues to perform strongly through Data centre development is becoming GNZ’s investment management platform economic volatility, with global and local increasingly difficult globally, providing a broadens its access to capital, giving a
Slide 6: Investment Portfolio
02 INVESTMEN PORTFOLIO Suntory M20 Recorp, Oceania, M20Park Business Business Park
Slide 7: Portfolio Performance
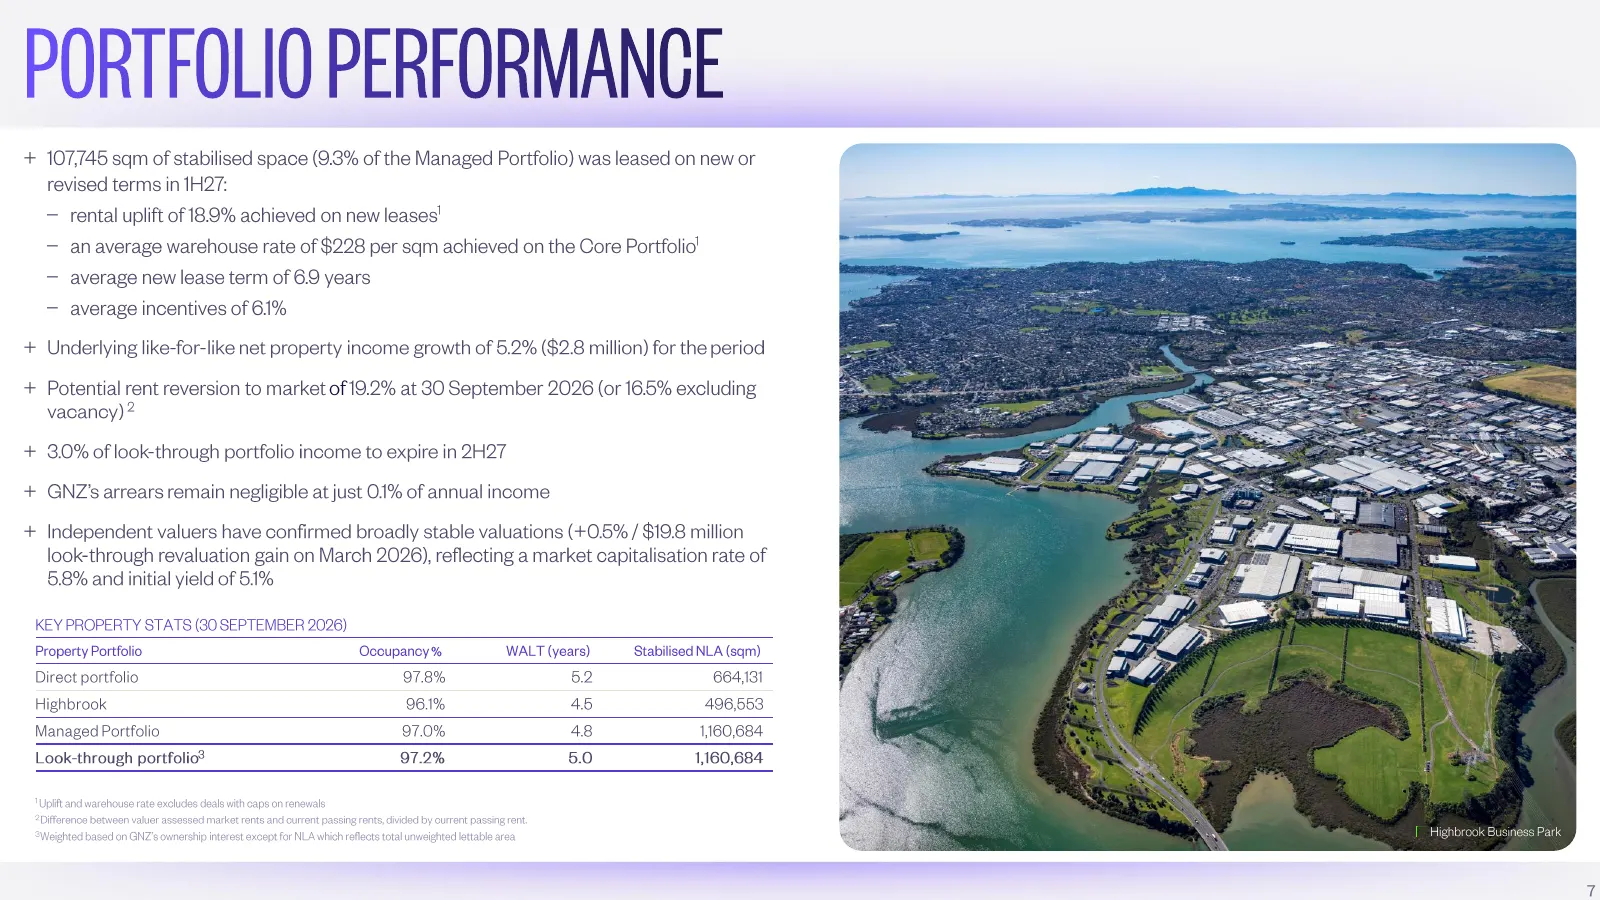
PORTFOLIO PERFORMANCE + 107,745 sqm of stabilised space (9.3% of the Managed Portfolio) was leased on new or revised terms in 1H27: ‒ rental uplift of 18.9% achieved on new leases 1 ‒ an average warehouse rate of $228 per sqm achieved on the Core Portfolio 1 ‒ average new lease term of 6.9 years ‒ a
Slide 8: Developments
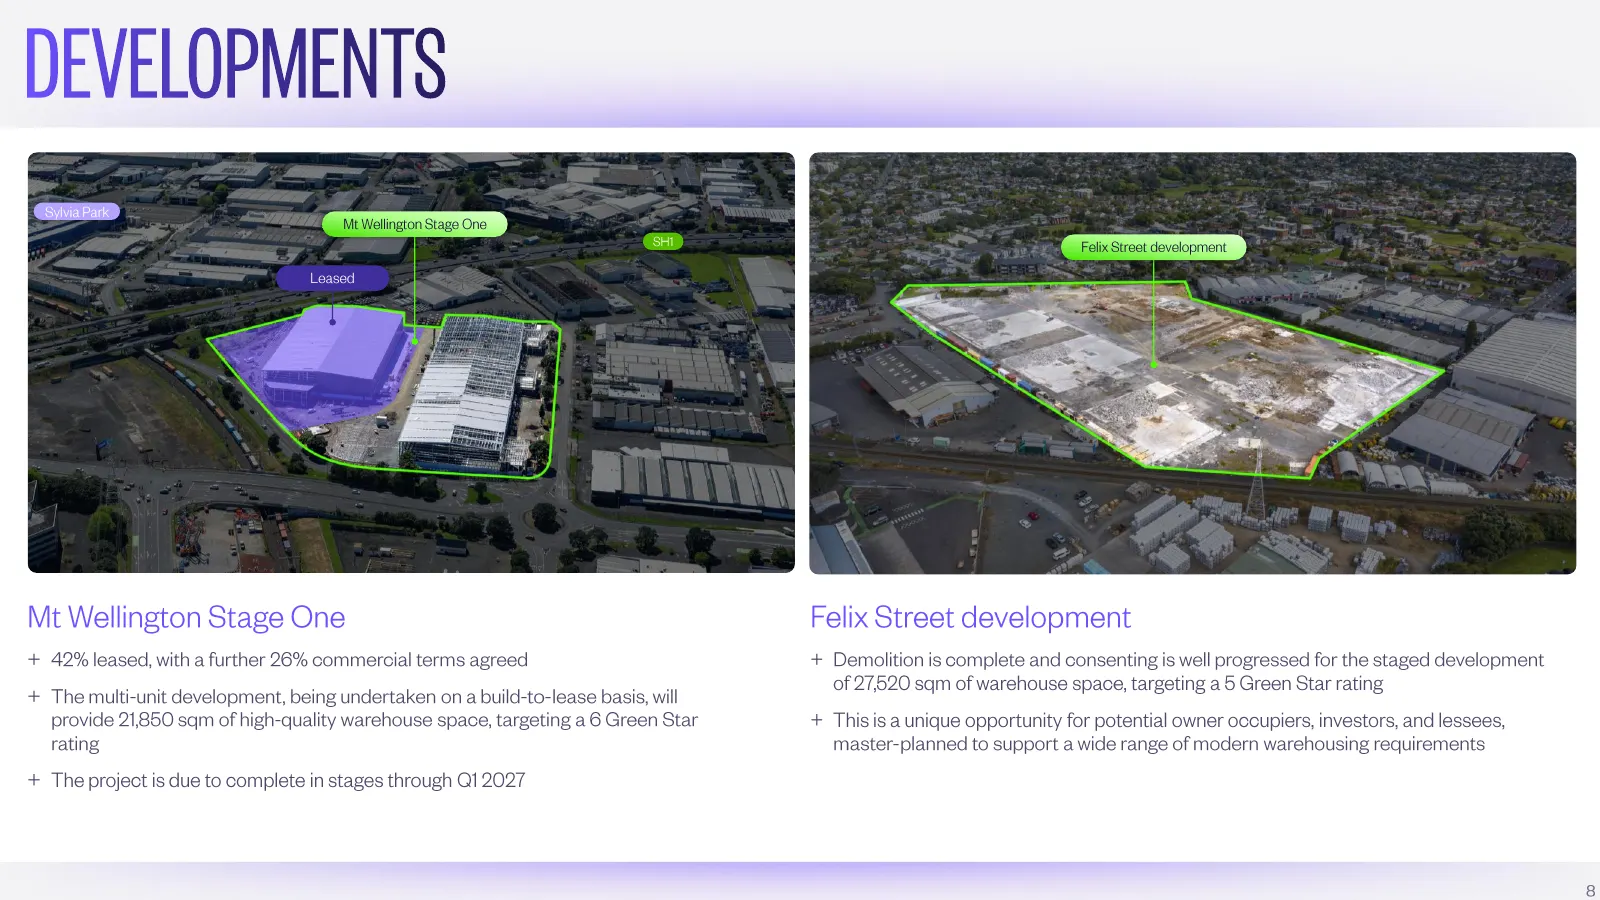
DEVELOPMENTS Sylvia Park Mt Wellington Stage One SH1 Felix Street development Leased Mt Wellington Stage One Felix Street development + 42% leased, with a further 26% commercial terms agreed + Demolition is complete and consenting is well progressed for the staged development of 27,520 sqm of wareho
Slide 9: Power and Infrastructure
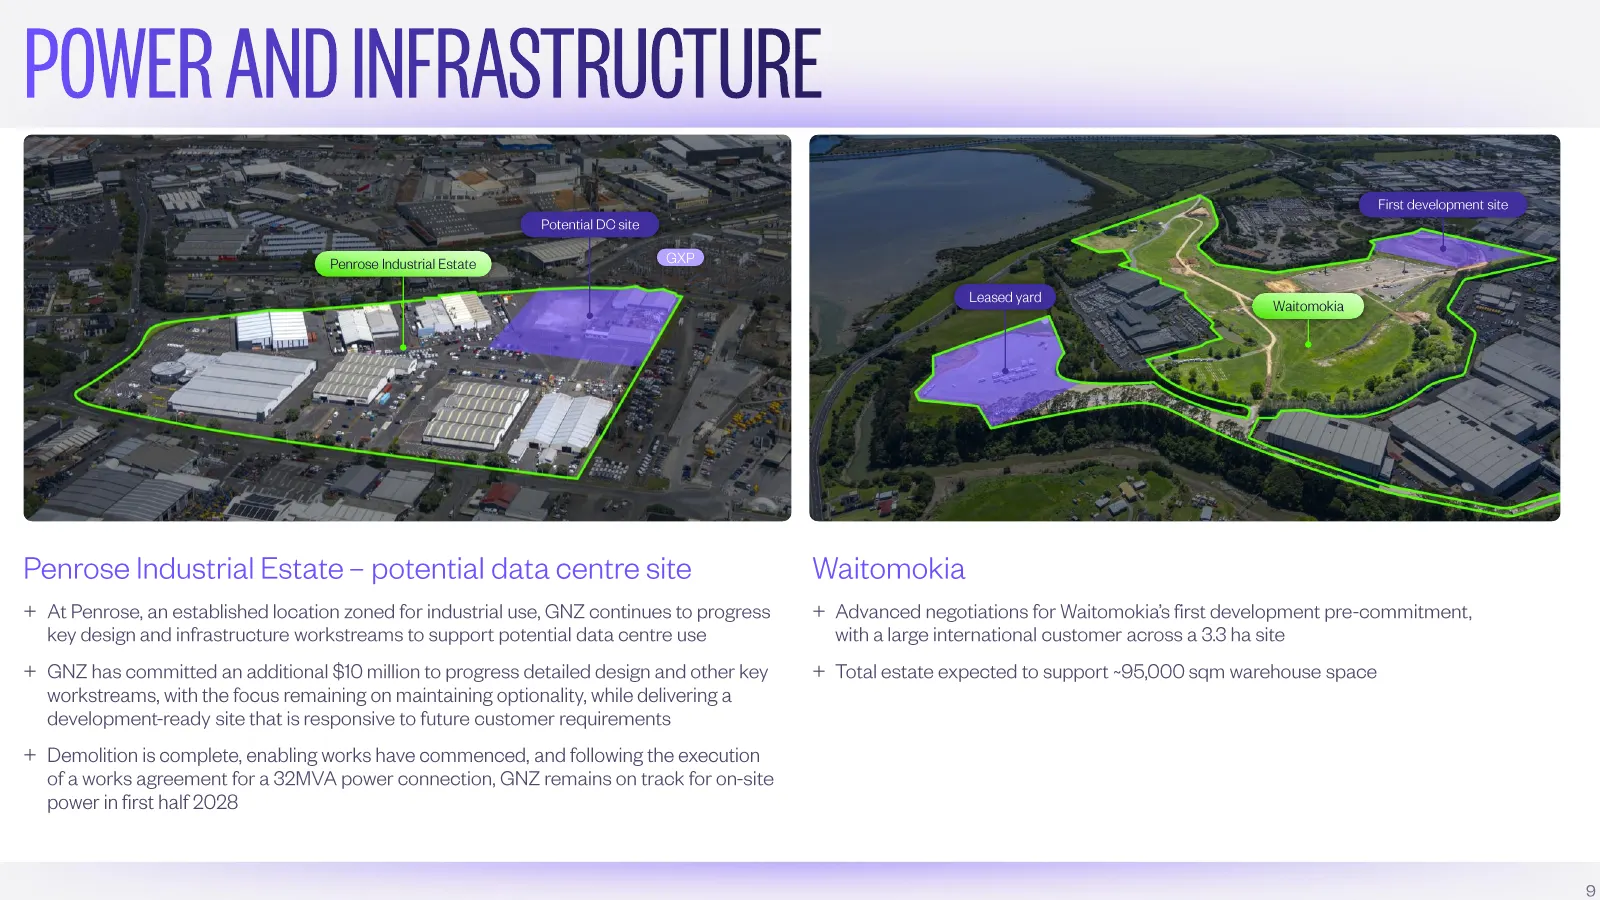
POWER AND INFRASTRUCTURE Waitomokia First development site Potential DC site Penrose Industrial Estate GXP Leased yard Waitomokia Penrose Industrial Estate– potential data centre site Waitomokia + At Penrose, an established location zoned for industrial use, GNZ continues to progress + Advanced nego
Slide 10: Financial Result
03 FINANCIAL RESULT NZ Post, Roma Road
Slide 11: Financial Summary
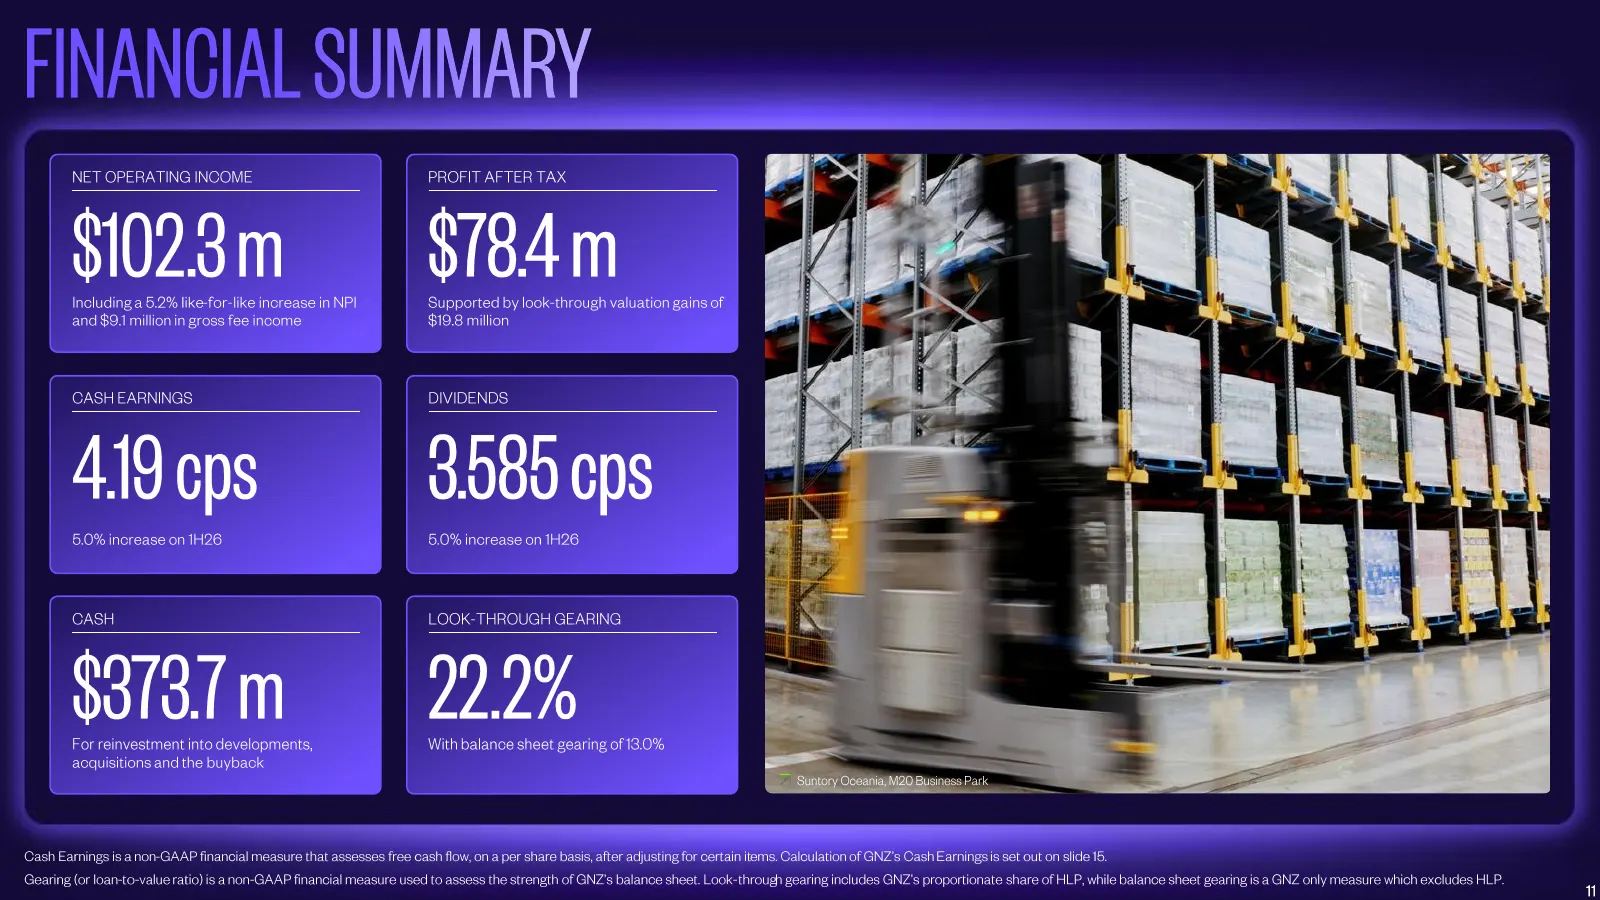
FINANCIAL SUMMARY NET OPERATING INCOME PROFIT AFTER TAX $102.3 m $78.4 m Including a 5.2% like-for-like increase in NPI and $9.1 million in gross fee income Supported by look-through valuation gains of $19.8 million CASH EARNINGS DIVIDENDS 4.19 cps 3.585 cps 5.0% increase on 1H26 5.0% increase on 1H
Slide 12: Net Operating Income
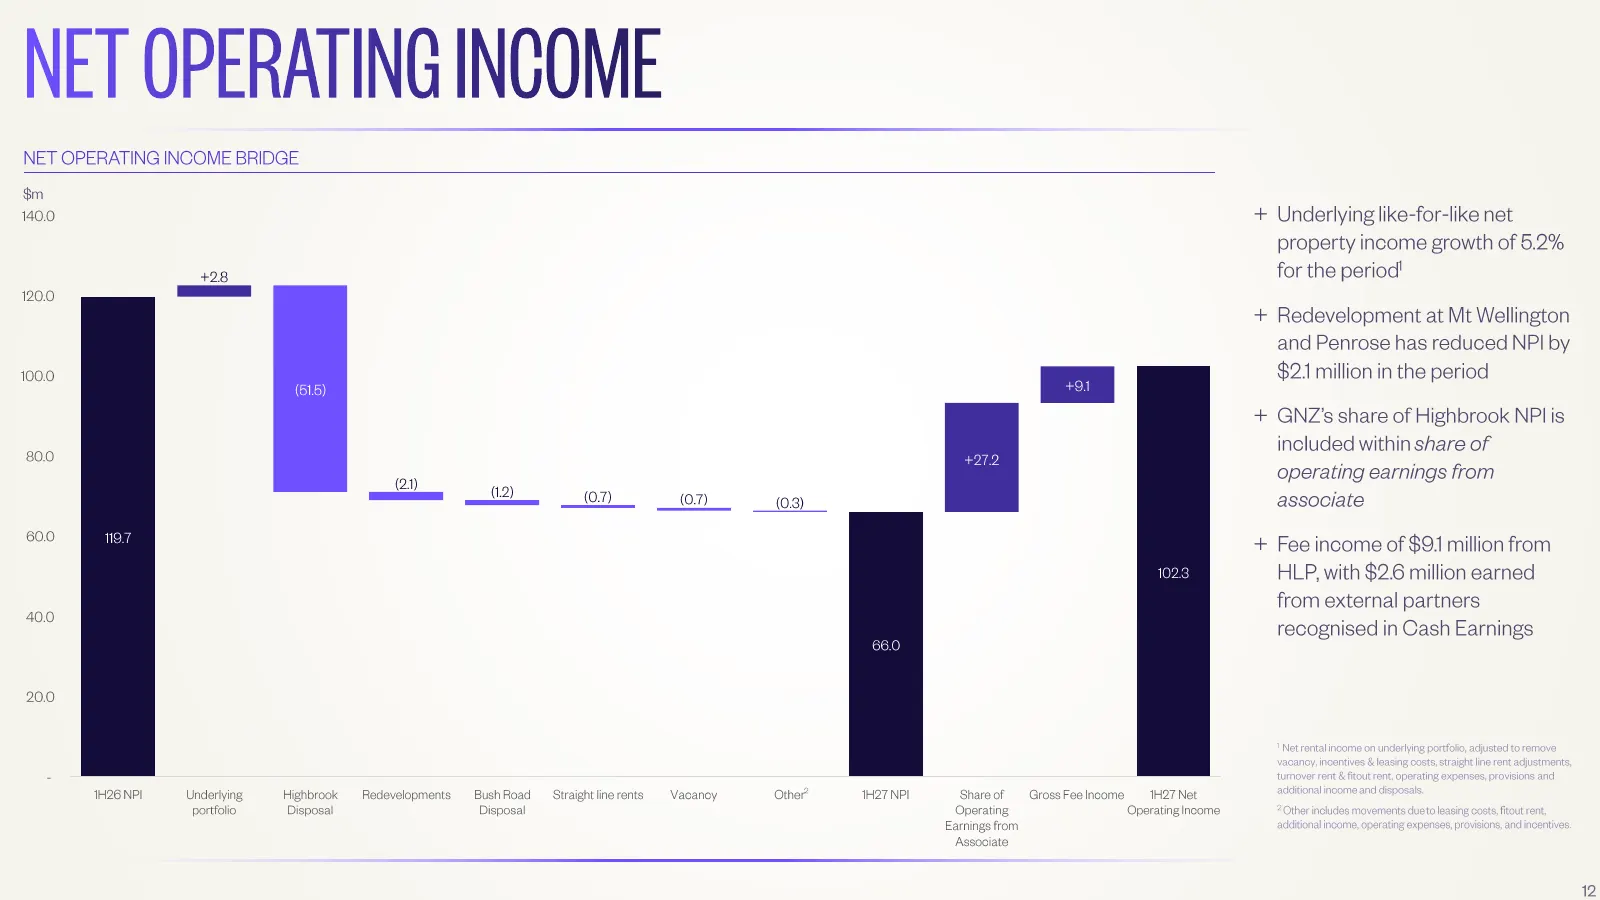
NET OPERATING INCOME NET OPERATING INCOME BRIDGE $m 140.0 + Underlying like-for-like net property income growth of 5.2% +2.8 for the period1 120.0 + Redevelopment at Mt Wellington and Penrose has reduced NPI by 100.0 $2.1 million in the period (51.5) +9.1 + GNZ’s share of Highbrook NPI is 80.0 inclu
Slide 13: Financial Performance
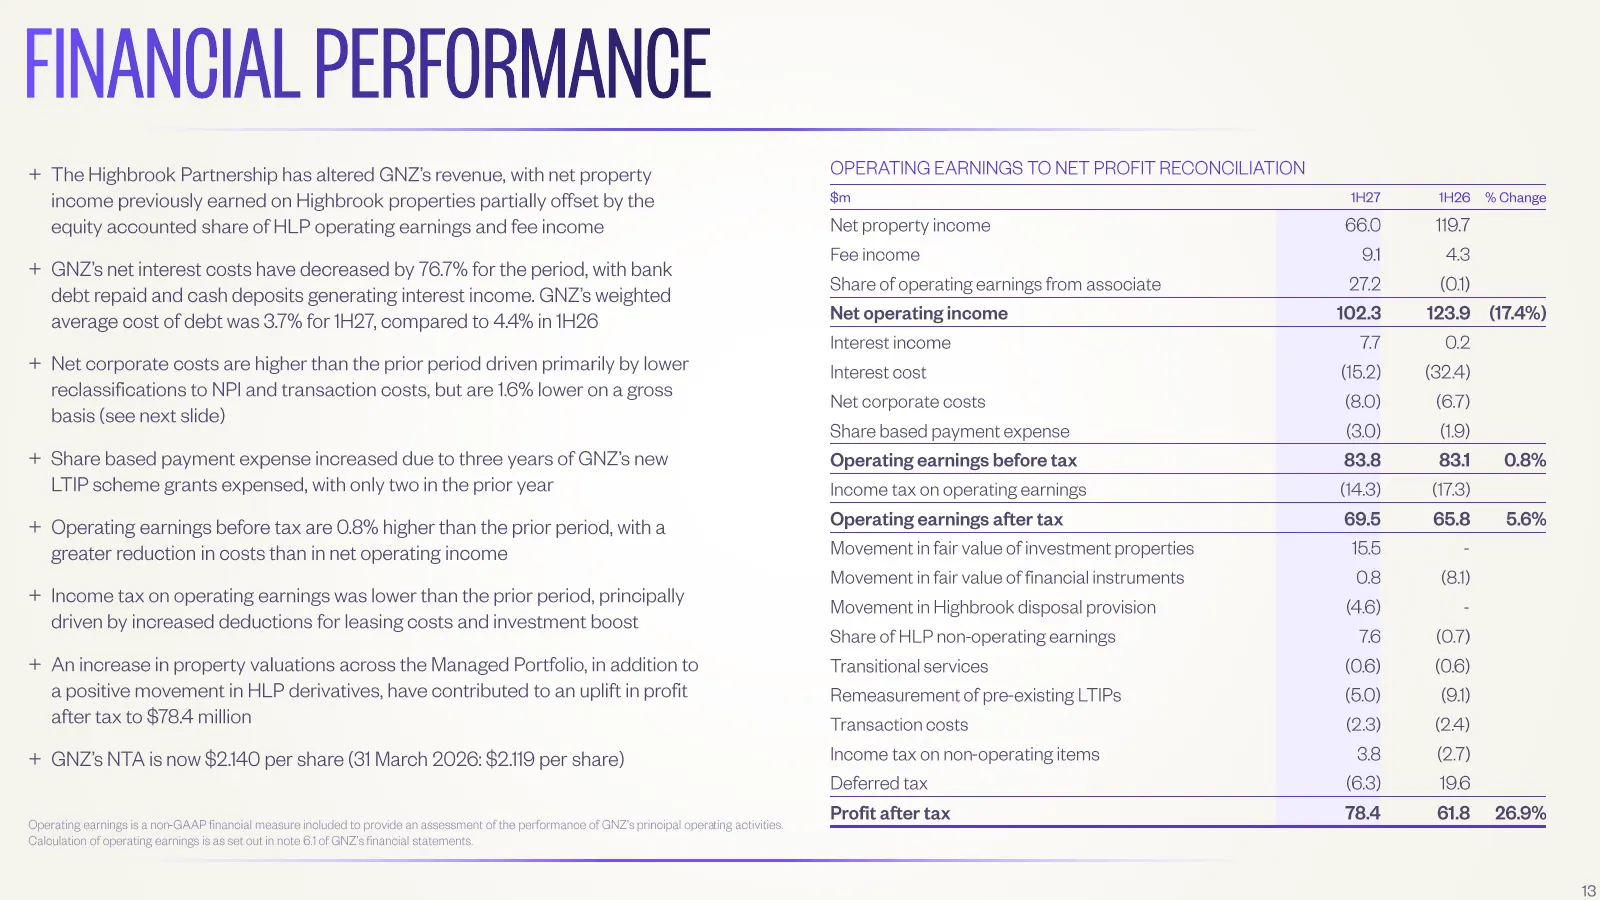
FINANCIAL PERFORMANCE + The Highbrook Partnership has altered GNZ’s revenue, with net property OPERATING EARNINGS TO NET PROFIT RECONCILIATION income previously earned on Highbrook properties partially offset by the $m 1H27 1H26 % Change equity accounted share of HLP operating earnings and fee incom
Slide 14: Corporate Costs
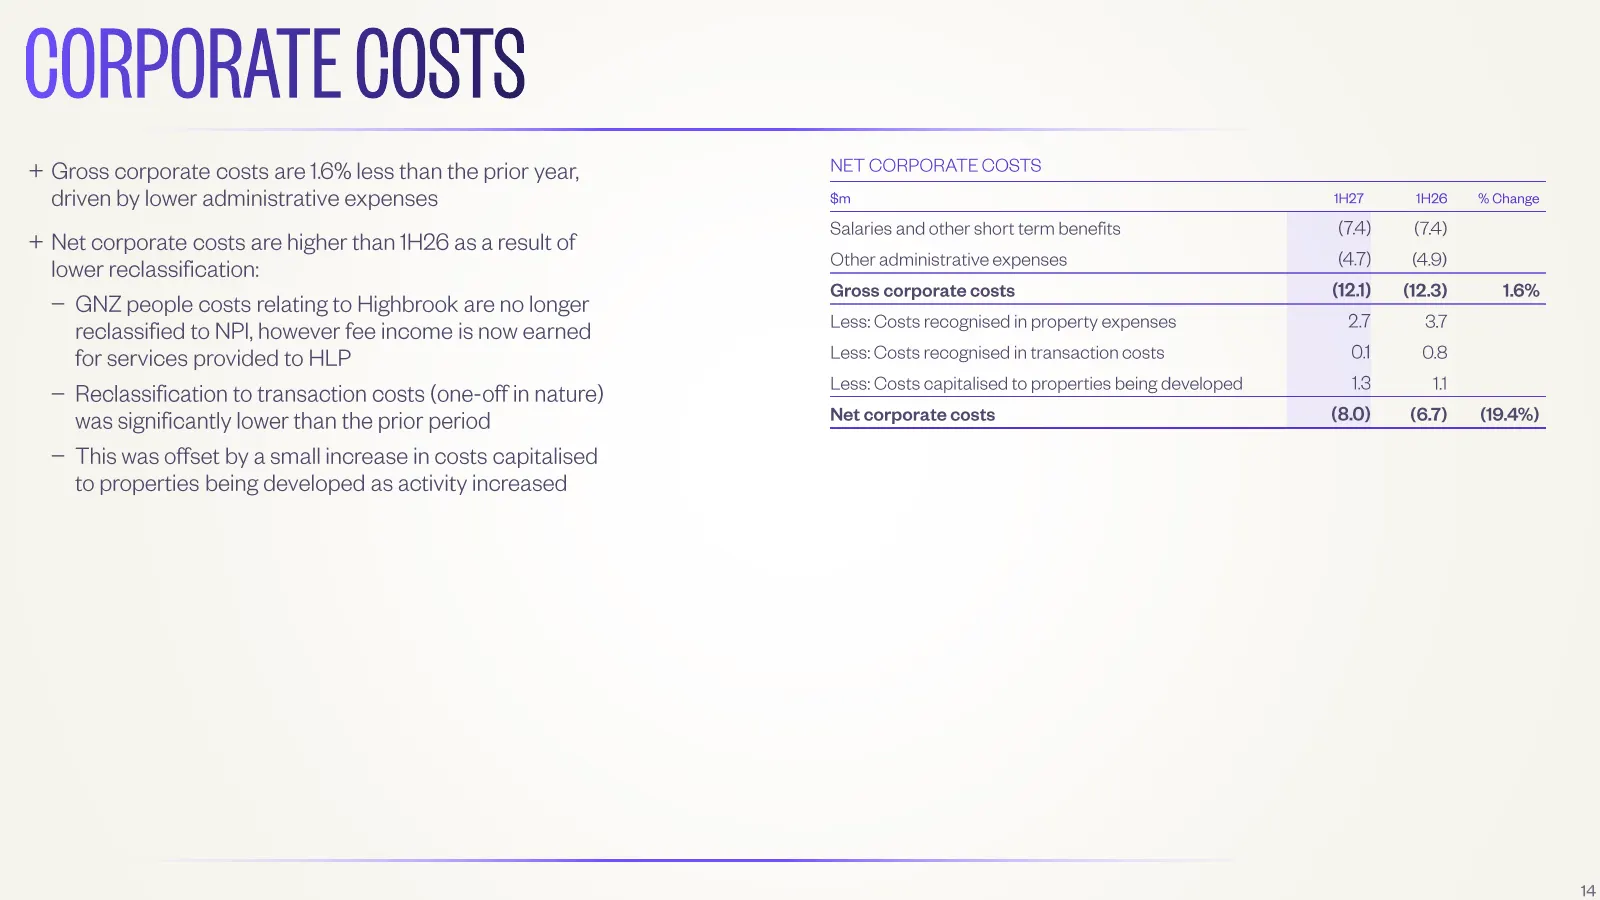
CORPORATE COSTS + Gross corporate costs are 1.6% less than the prior year, NET CORPORATE COSTS driven by lower administrative expenses $m 1H27 1H26 % Change Salaries and other short term benefits (7.4) (7.4) + Net corporate costs are higher than 1H26 as a result of Other administrative expenses (4.7
Slide 15: Cash Earnings
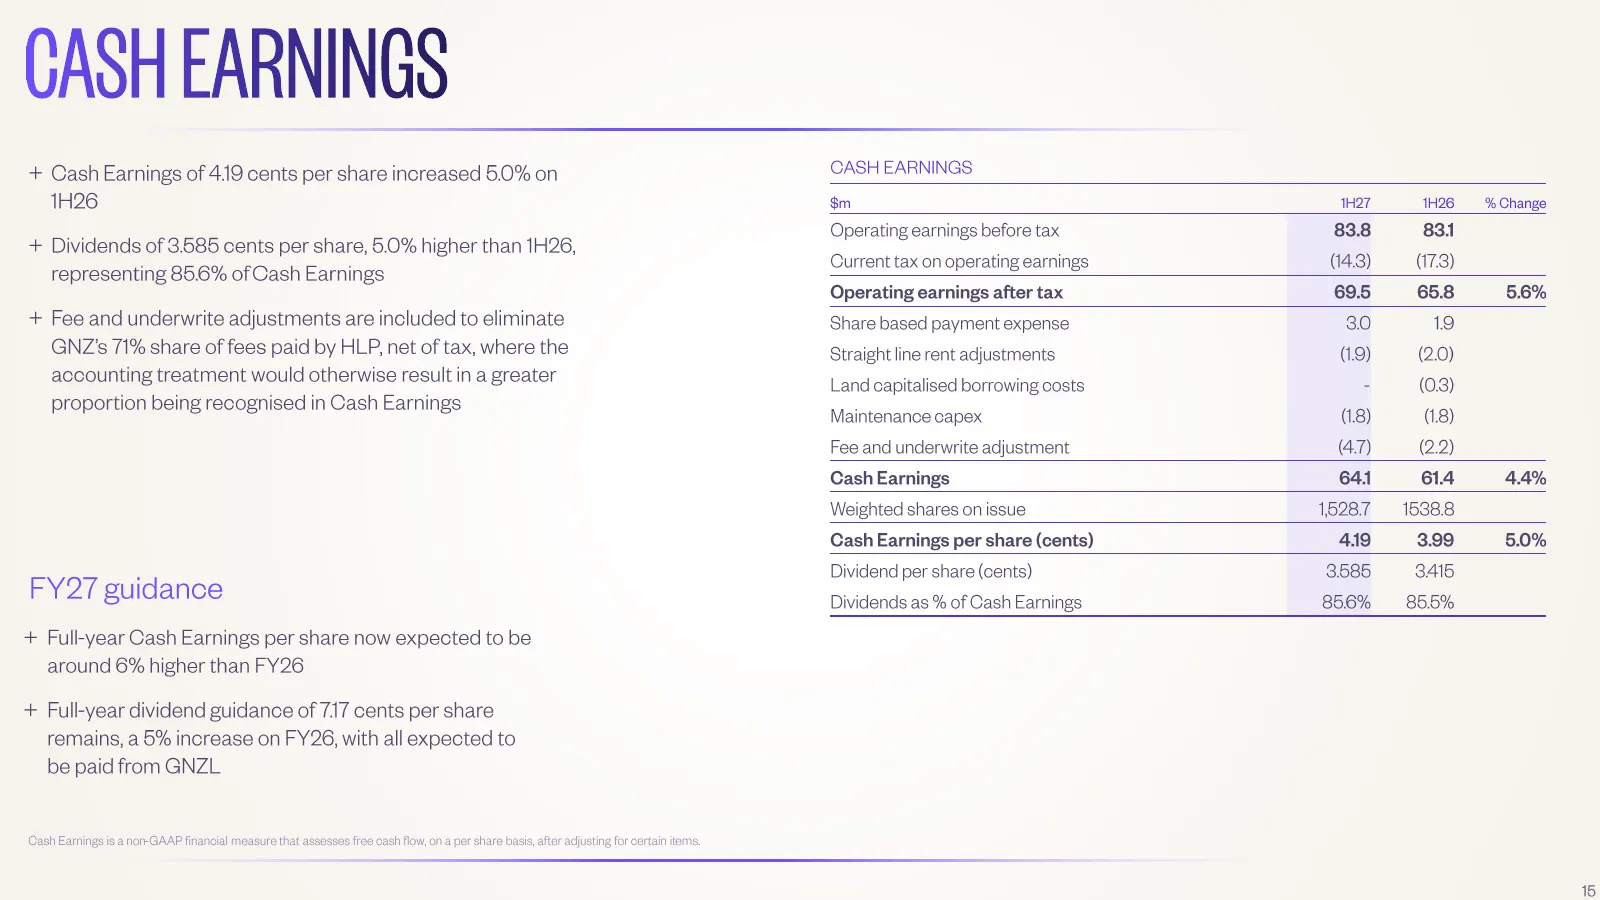
CASH EARNINGS + Cash Earnings of 4.19 cents per share increased 5.0% on CASH EARNINGS 1H26 $m 1H27 1H26 % Change Operating earnings before tax 83.8 83.1 + Dividends of 3.585 cents per share, 5.0% higher than 1H26, Current tax on operating earnings (14.3) (17.3) representing 85.6% ofC ash Earnings Op
Slide 16: Capital Management
Mt Wellington Stage One 04 CAPITAL MANAGEM HighbrookBusiness Park
Slide 17: Interest & Liquidity
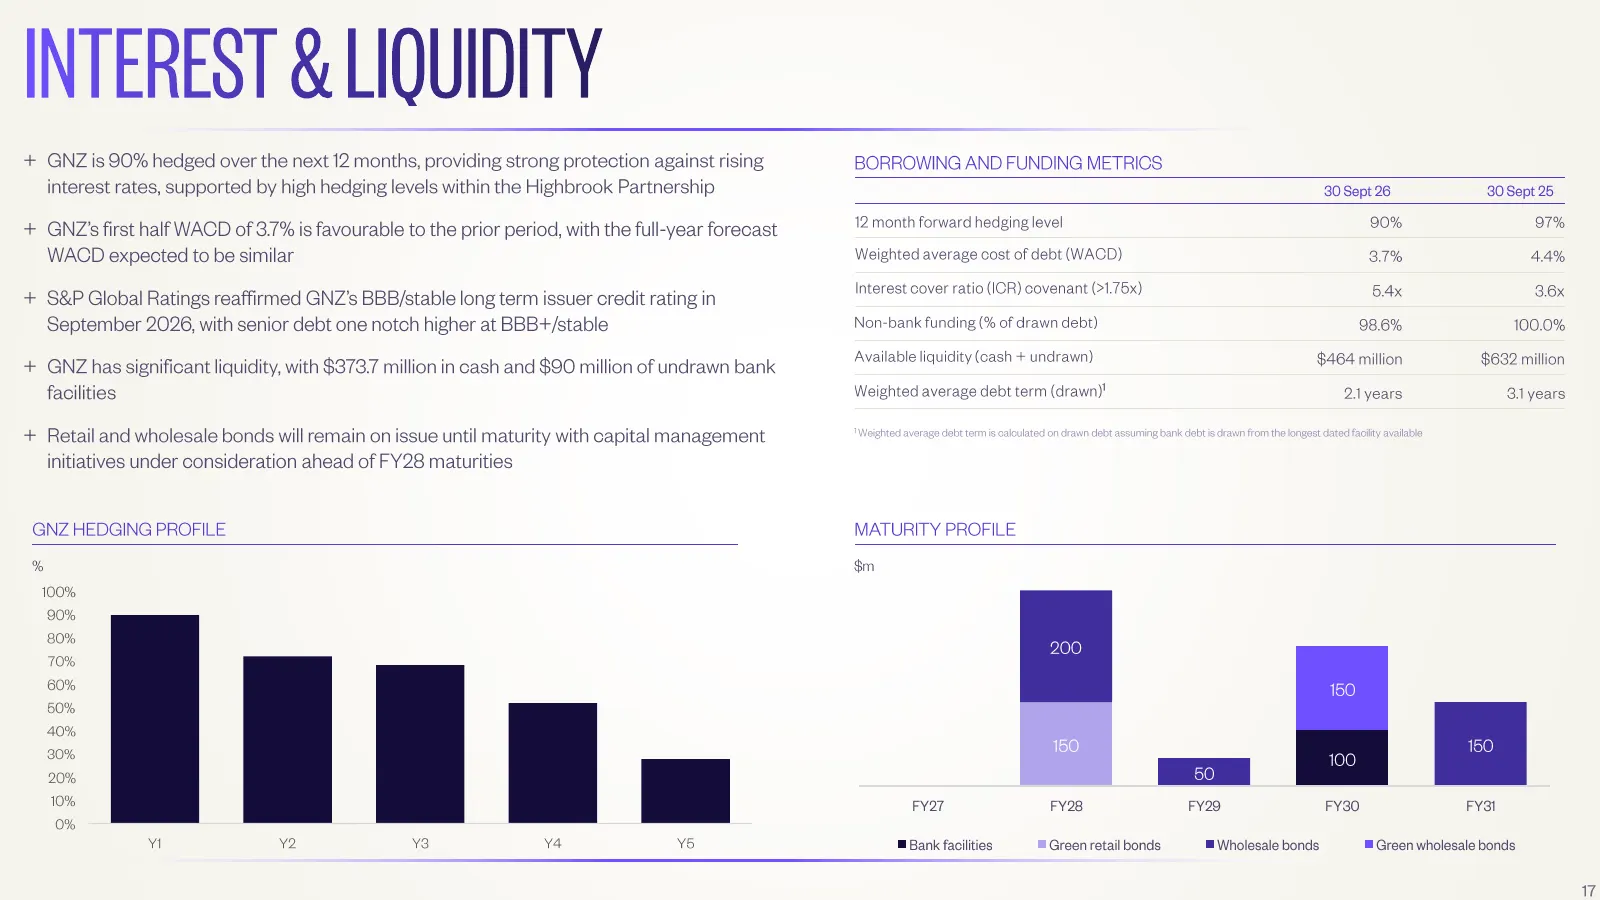
INTEREST & LIQUIDITY + GNZ is 90% hedged over the next 12 months, providing strong protection against rising BORROWING AND FUNDING METRICS interest rates, supported by high hedging levels within the Highbrook Partnership 30 Sept 26 30 Sept 25 12 month forward hedging level 90% 97% + GNZ’s first half
Slide 18: Gearing
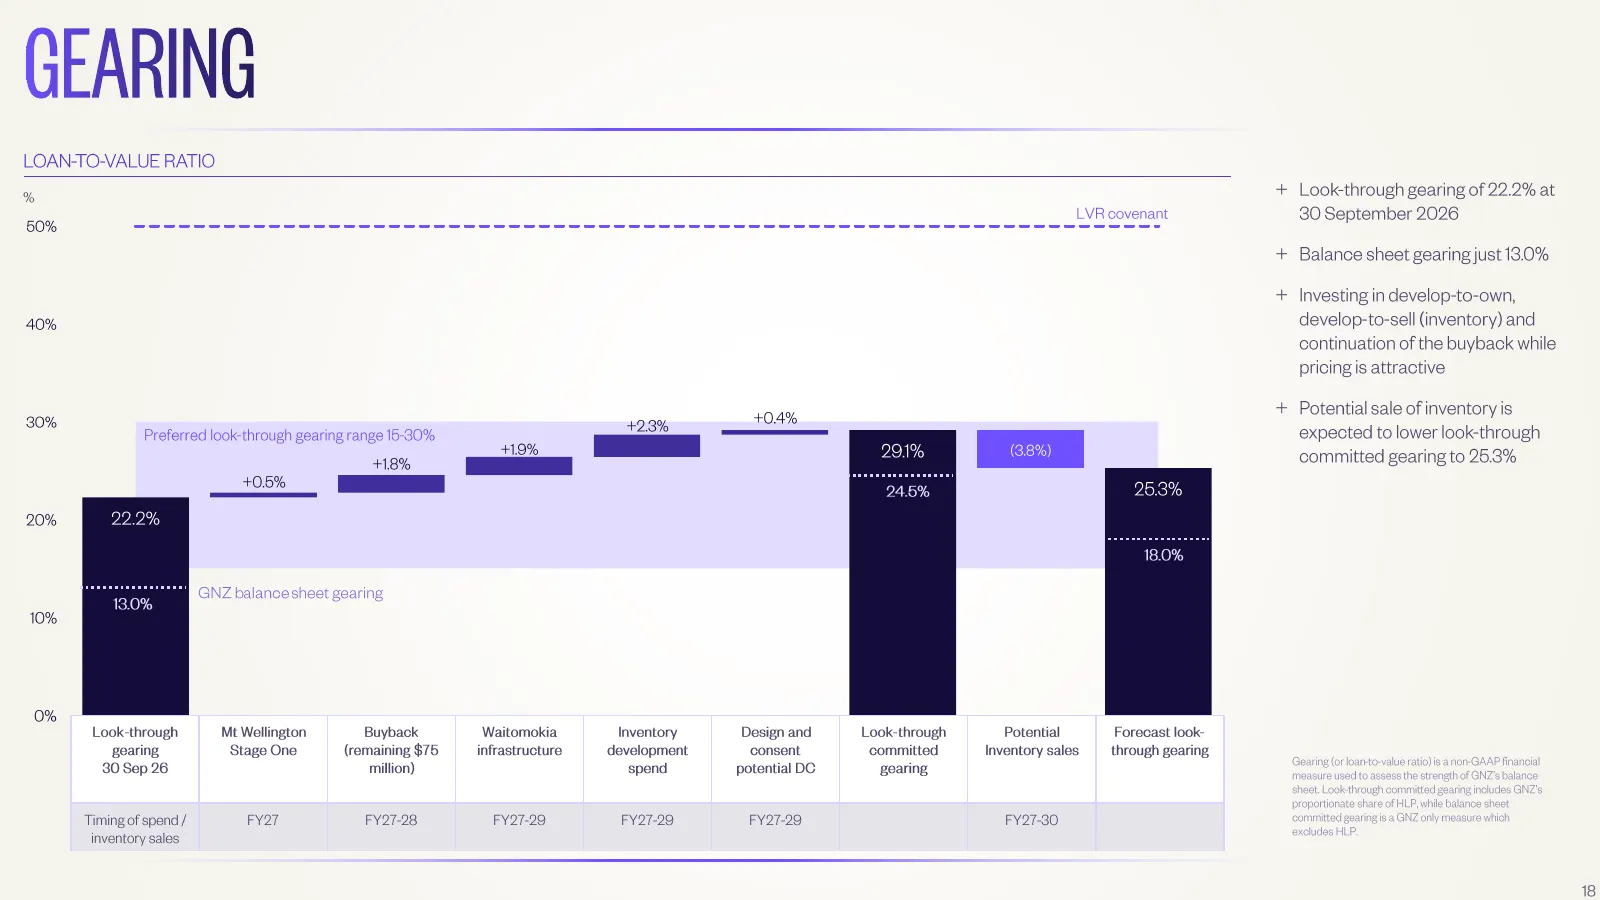
GEARING LOAN-TO-VALUE RATIO % + Look-through gearing of 22.2% at LVR covenant 30 September 2026 50% + Balance sheet gearing just 13.0% + Investing in develop - to-own, 40% develop-to-sell (inventory) and continuation of the buyback while pricing is attractive +0.4% + Potential sale of inventory is 3
Slide 19: Sustainability
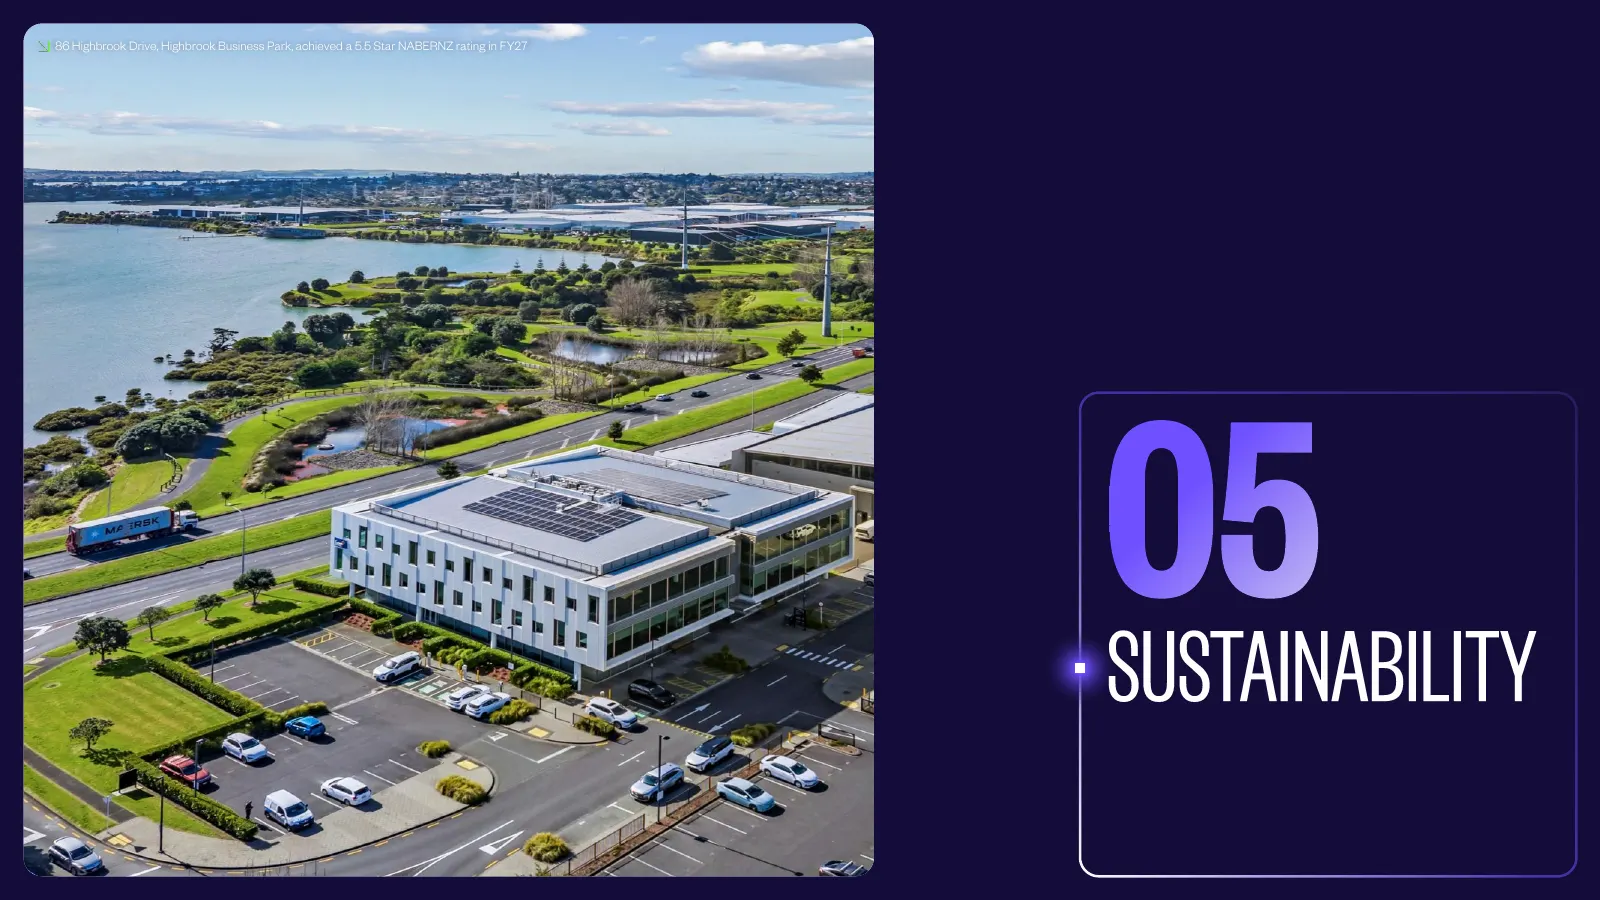
86 Highbrook Drive, Highbrook Business Park, achieved a 5.5 Star NABERNZ rating in FY27 05 SUSTAINAB
Slide 20: Sustainability Highlights
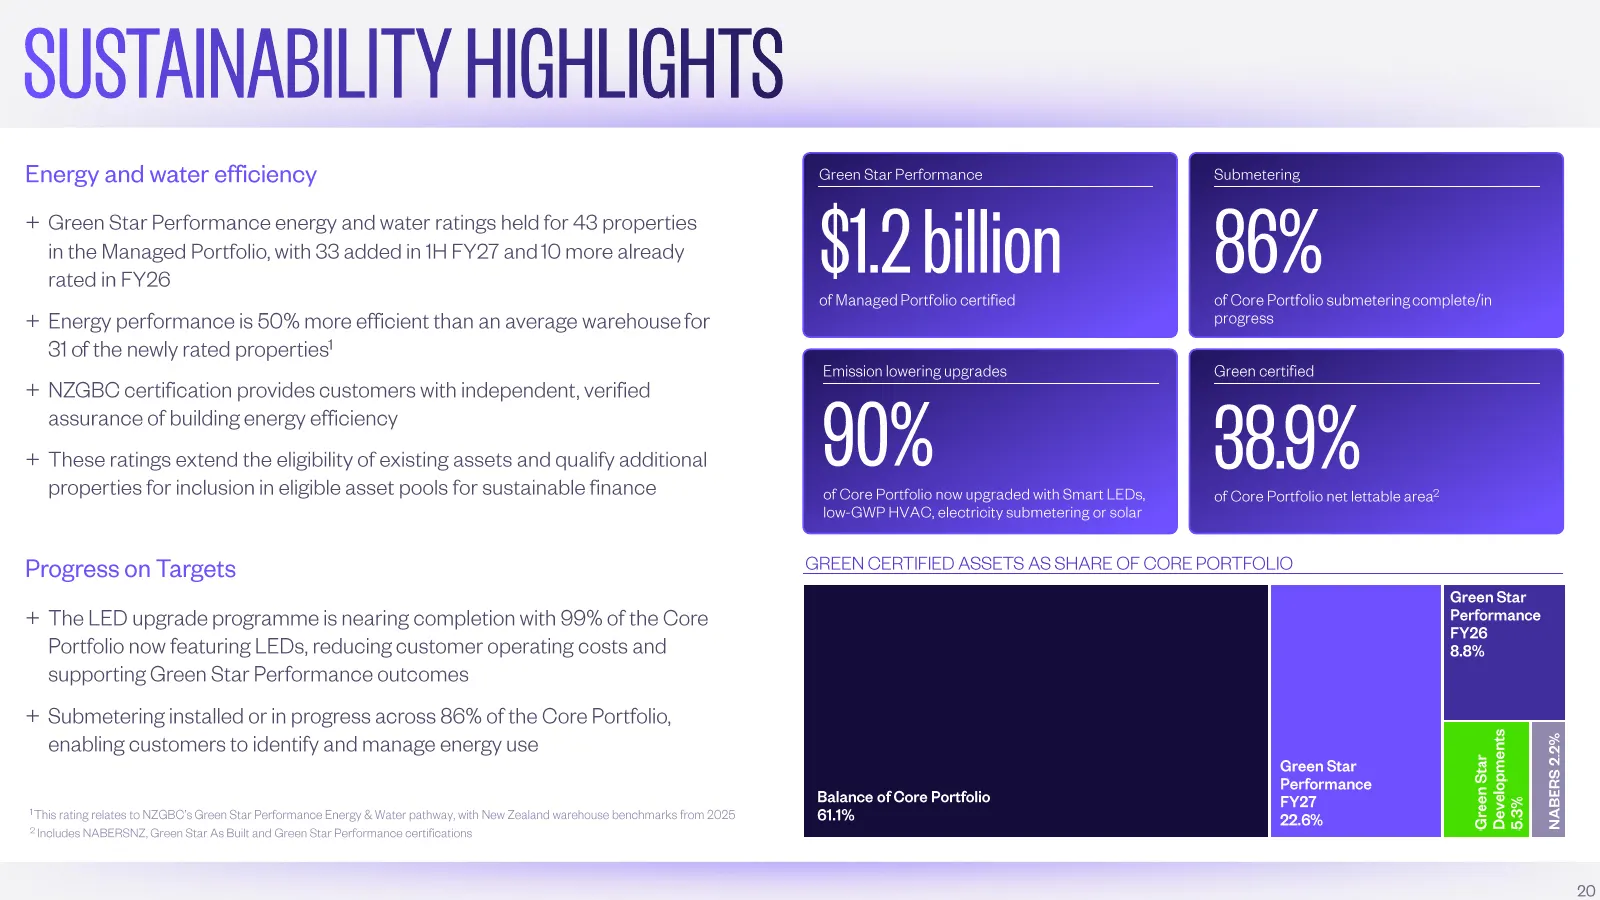
SUSTAINABILITY HIGHLIGHTS Energy and water efficiency Green Star Performance Submetering + Green Star Performance energy and water ratings held forproperties in the Managed Portfolio, with 33 added in 1H FY27 10 rated in FY26 43 andmore already $1.2 billion 86% of Managed Portfolio certified of Core
Slide 21: Summary & Outlook
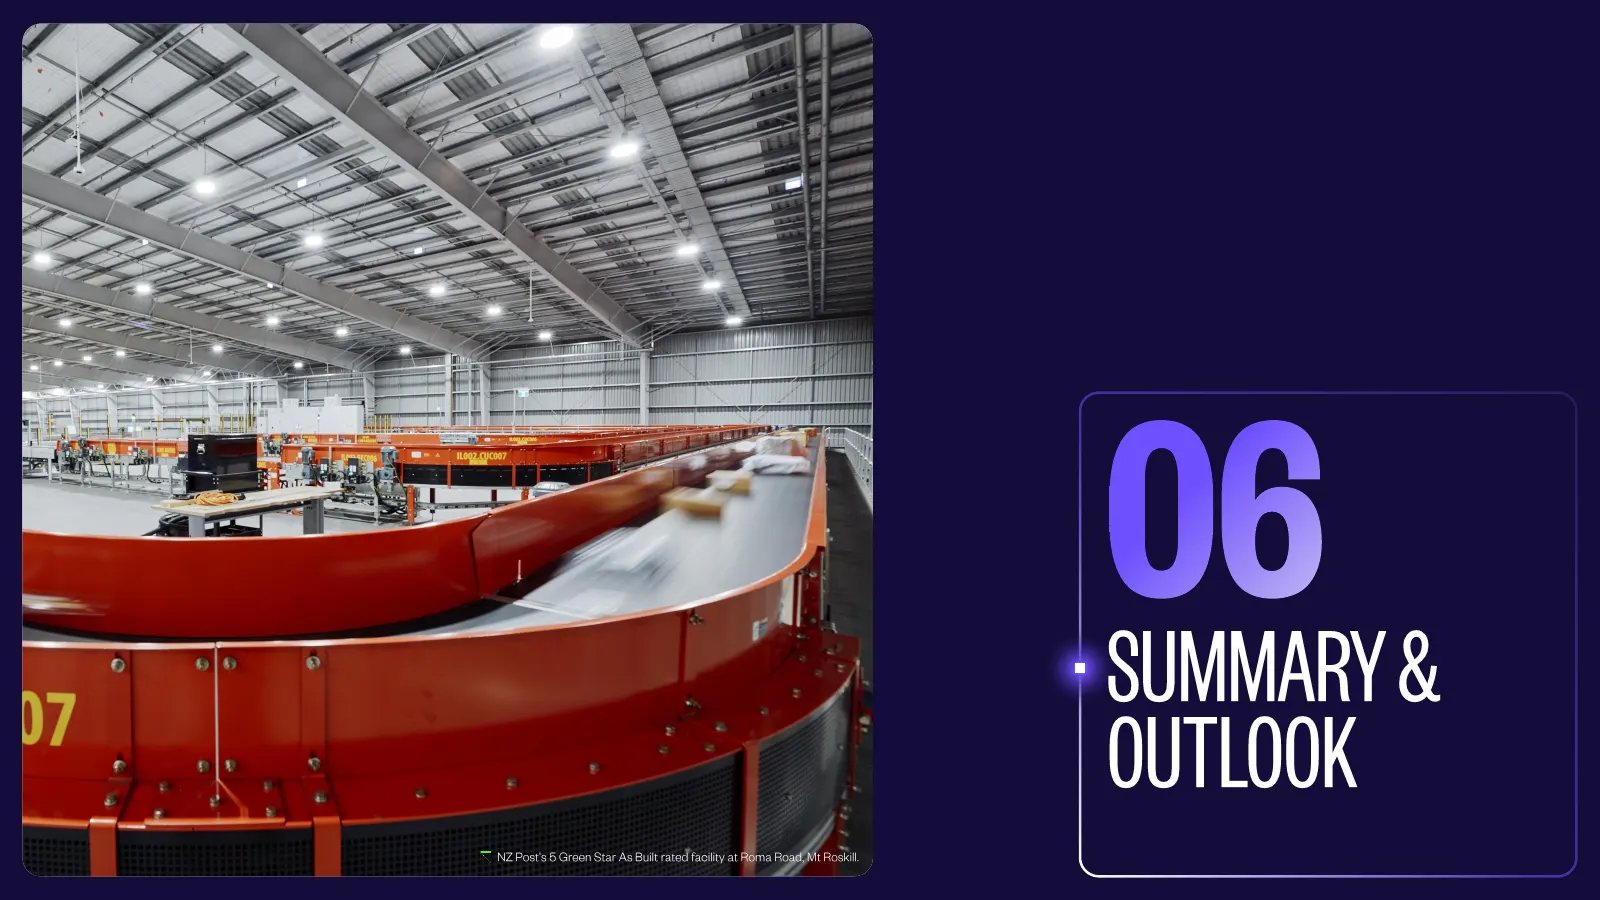
06 SUMMARY OUTLOOK NZ Post’s 5 Green Star As Built rated facility at Roma Road, Mt Roskill.
Slide 22: Looking Forward
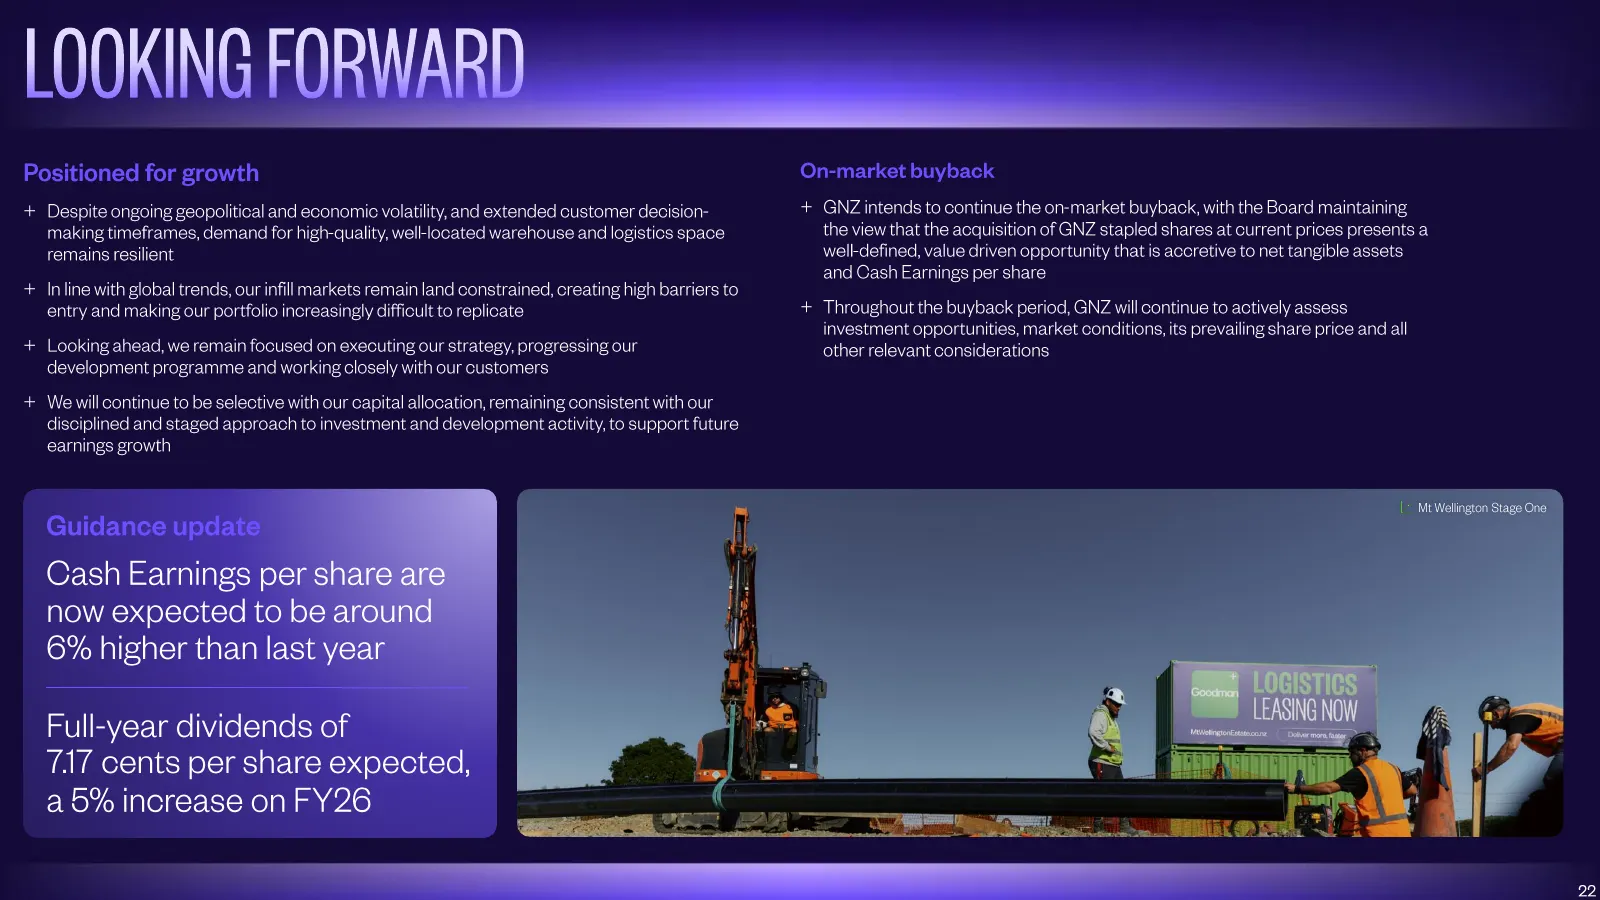
LOOKING FORWARD Positioned for growth On-market buyback + Despite ongoing geopolitical and economic volatility, and extended customer decision - + GNZ intends to continue the on -market buyback, with the Board maintaining making timeframes, demand for high-quality, well -located warehouse and logist
Slide 23: Questions
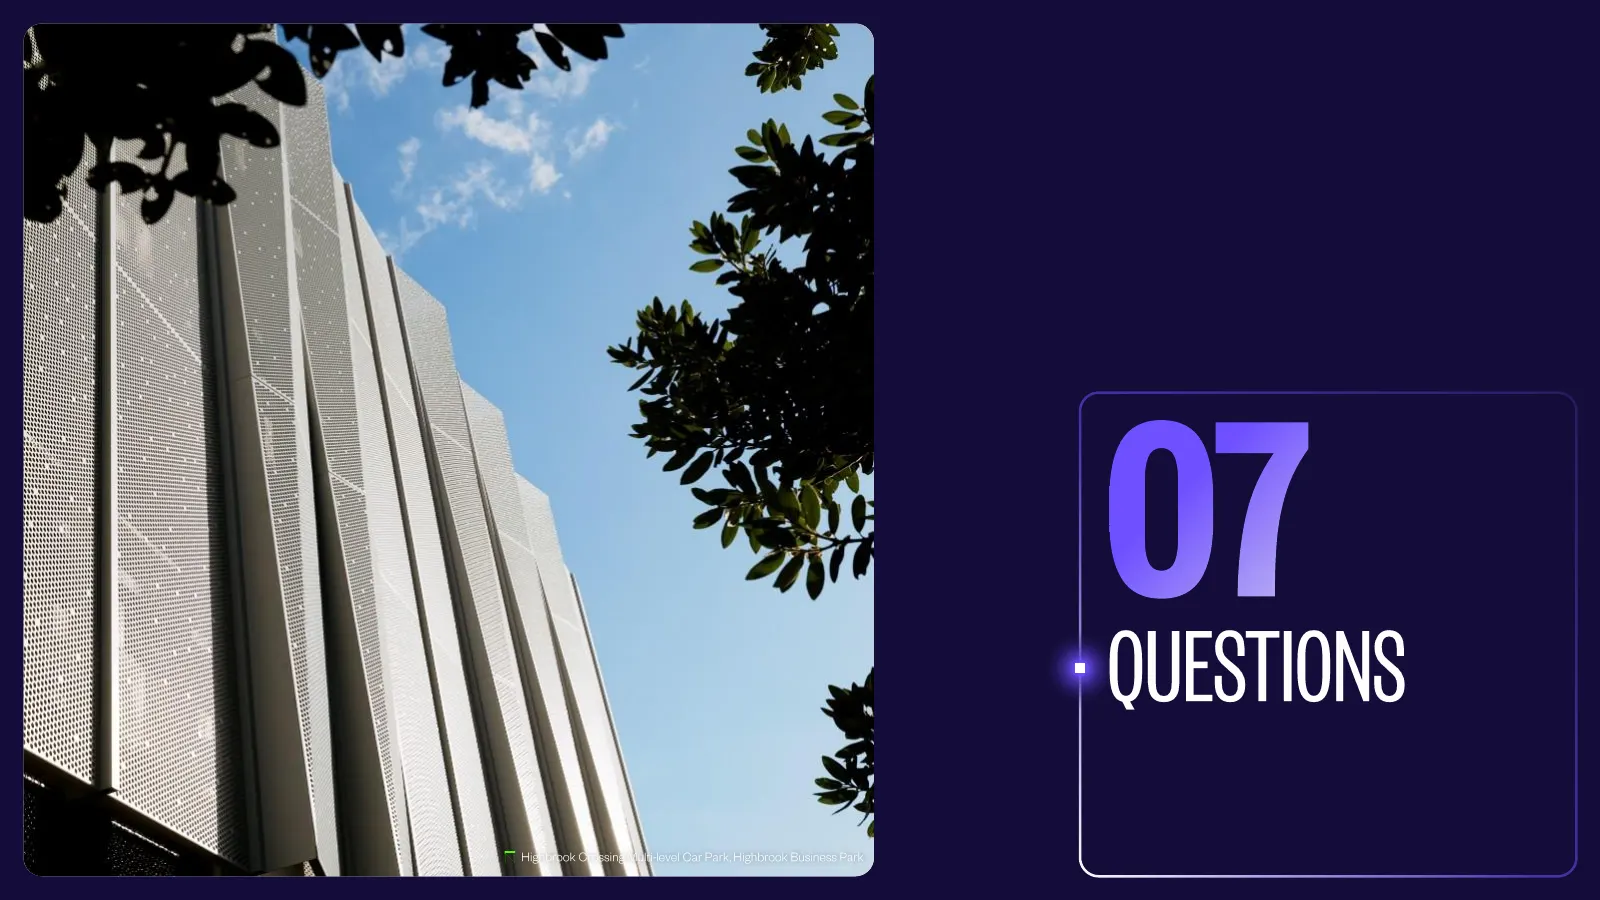
07 QUESTIONS Highbrook Crossing Multi -level Car Park, Highbrook Business Park
Slide 24: Thank You
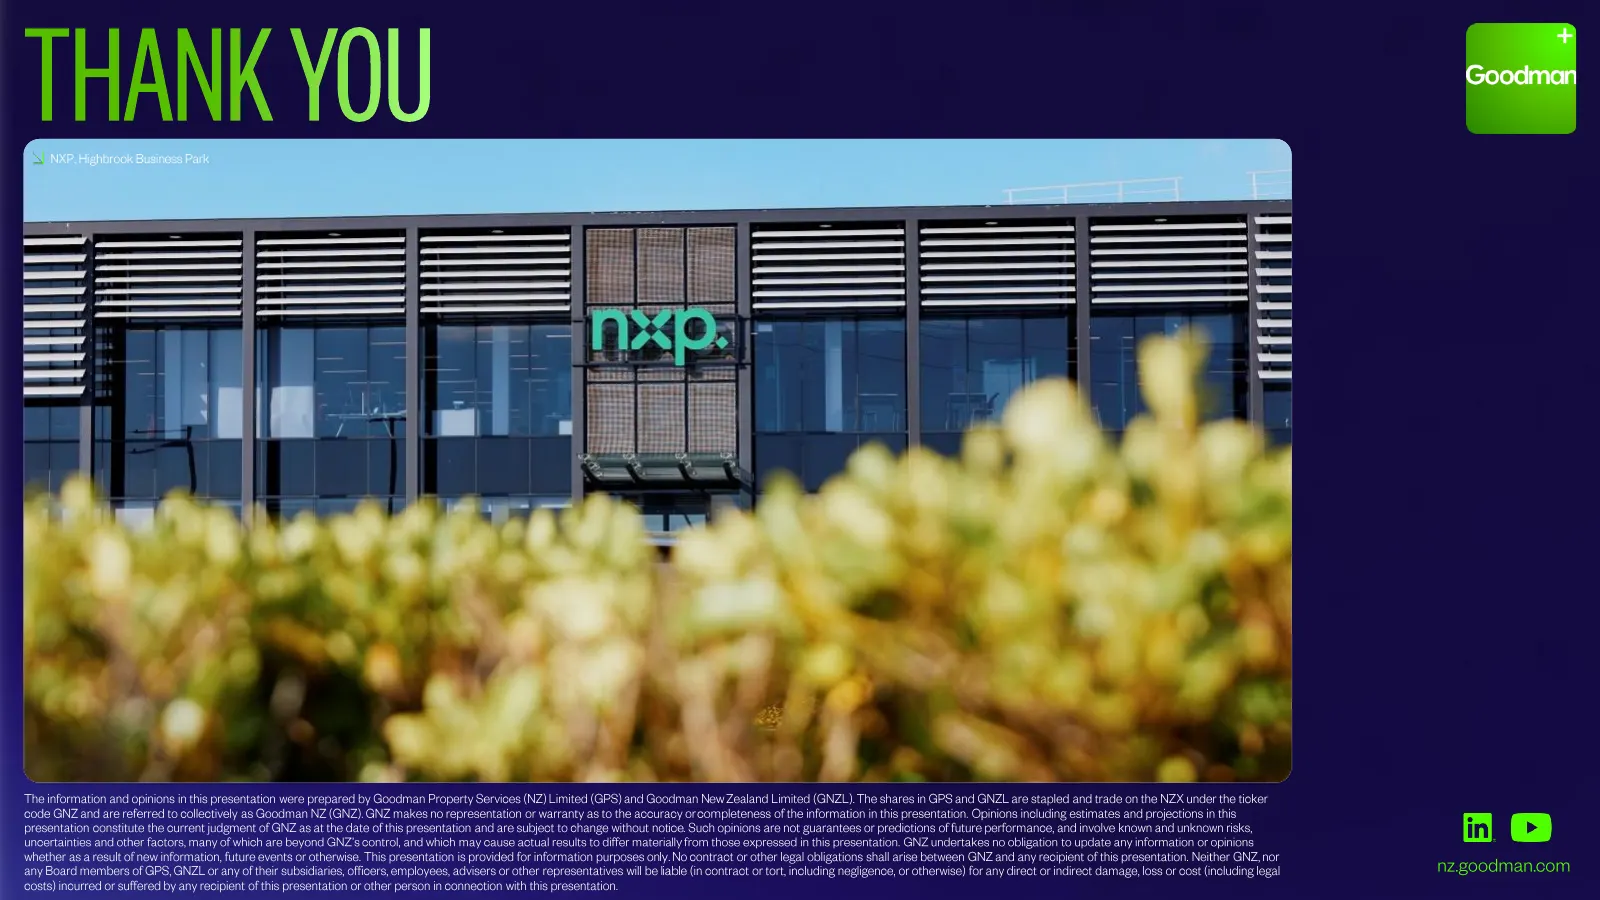
THANK YOU NXP, Highbrook Business Park The information and opinions in this presentation were prepared by Goodman Property Services (NZ) Limited (GPS) and Goodman ew Zealand N Limited (GNZL). The shares in GPS and GNZL are stapled and trade on the NZX under the ticker code GNZ and are referred to co
Slide 25: Appendix
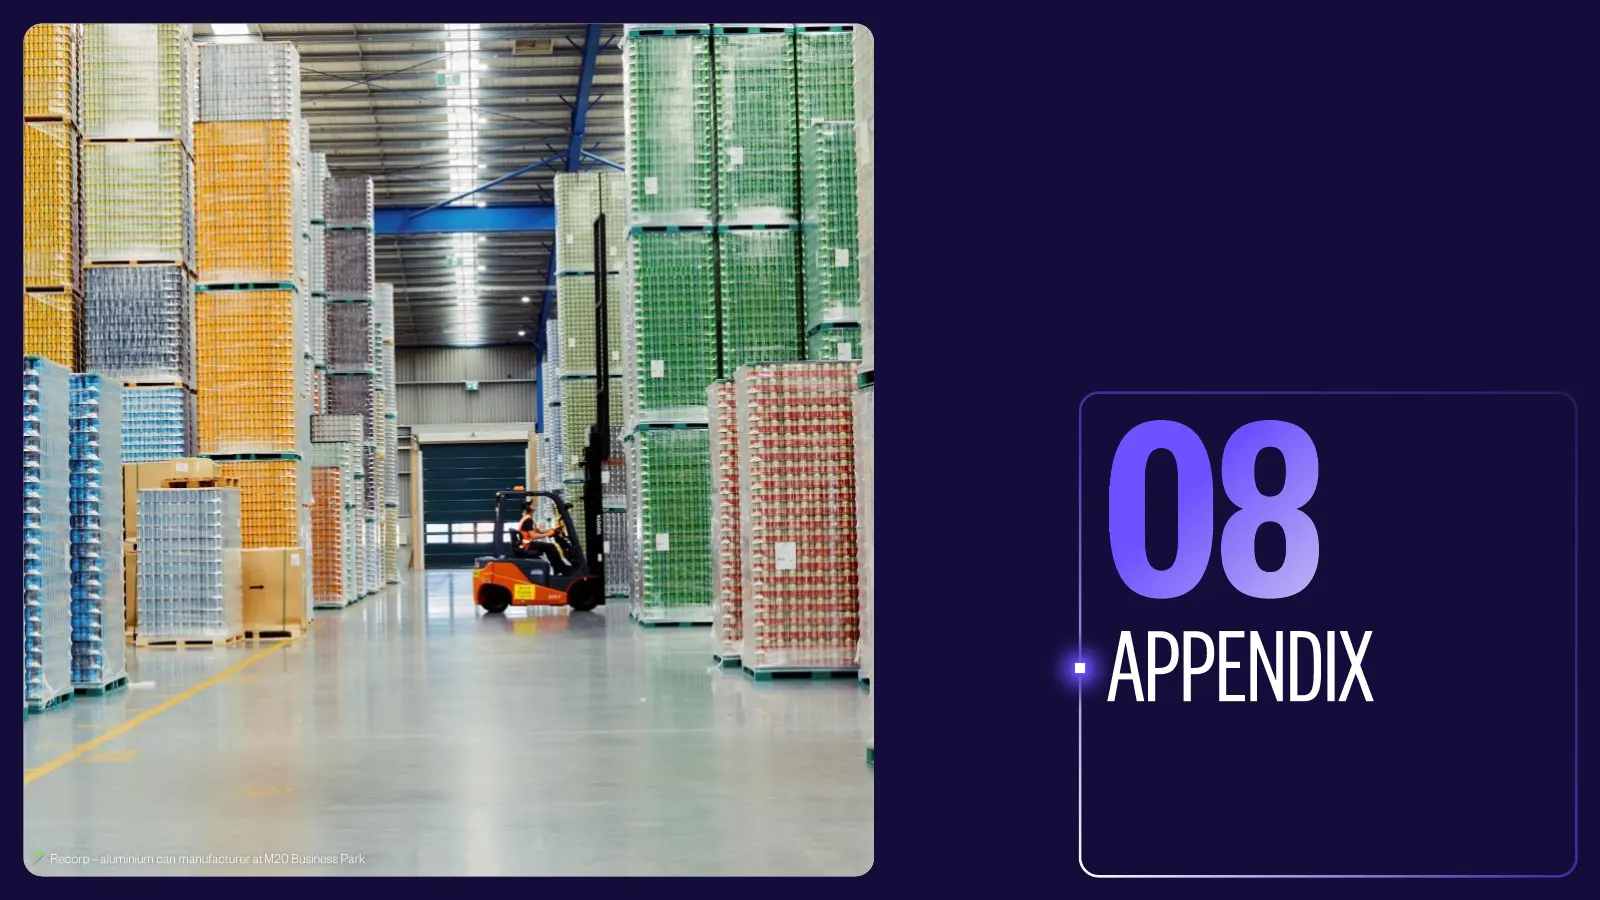
08 APPENDIX Sika, Roma Recorp Road can manufacturer at – aluminium M20 Business Park
Slide 26: Statement of Comprehensive Income
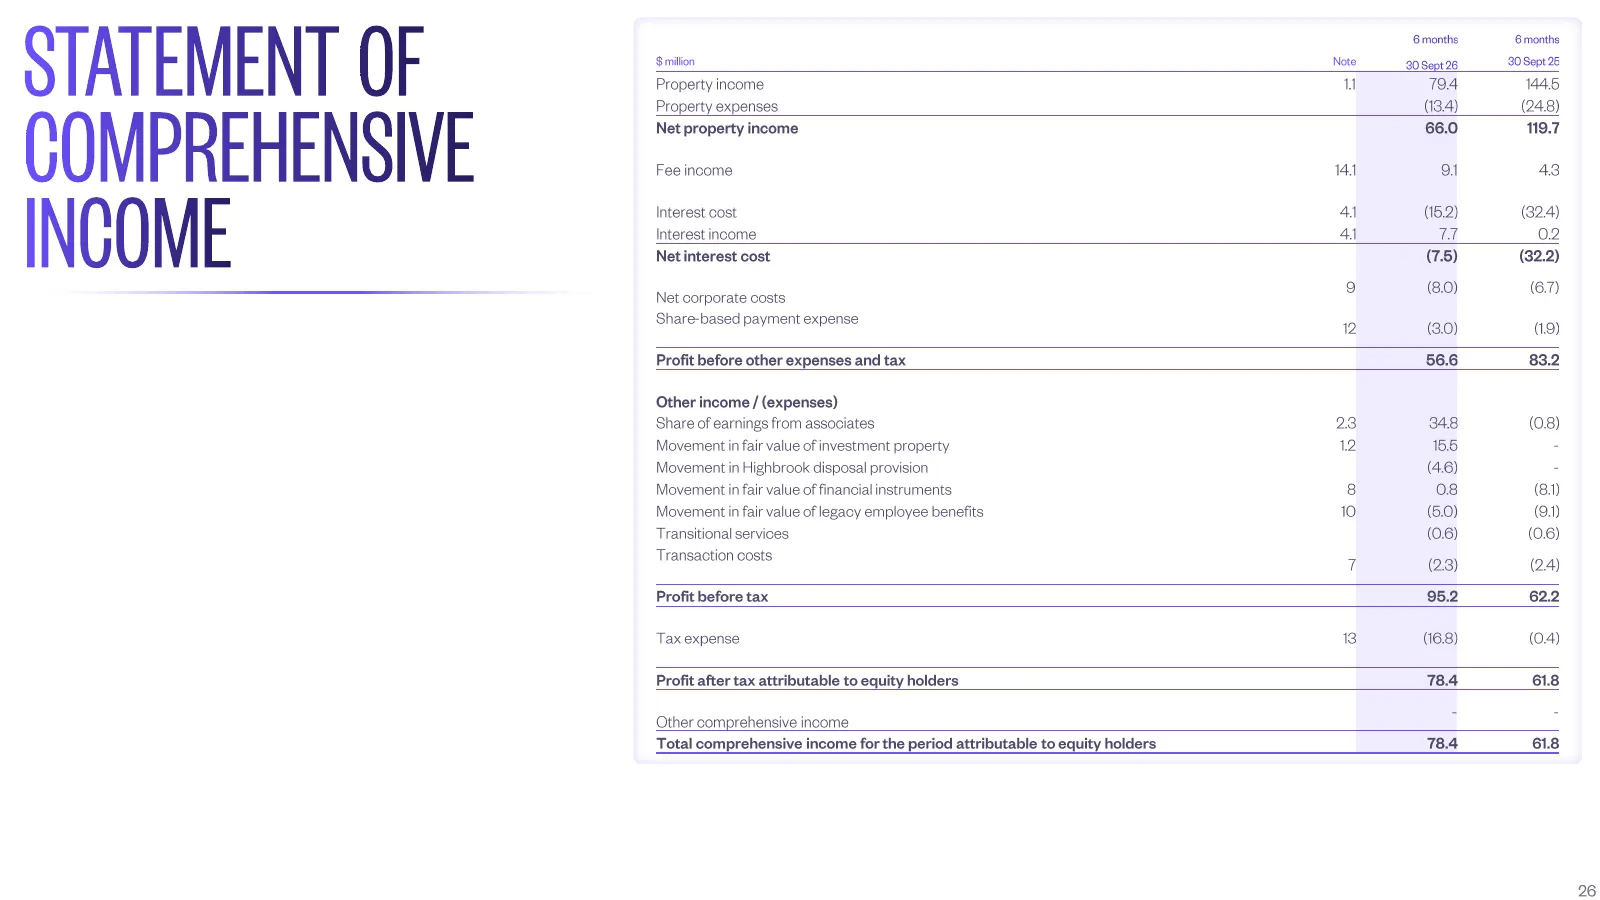
STATEMENT OF $ million Property income Note 1.1 6 months 30 Sept 26 79.4 6 months 30 Sept 25 144.5 COMPREHENSIVE Property expenses (13.4) (24.8) Net property income 66.0 119.7 Fee income 14.1 9.1 4.3 INCOME Interest cost Interest income Net interest cost Net corporate costs 4.1 4.1 9 (15.2) 7.7 (7.5
Slide 27: Balance Sheet
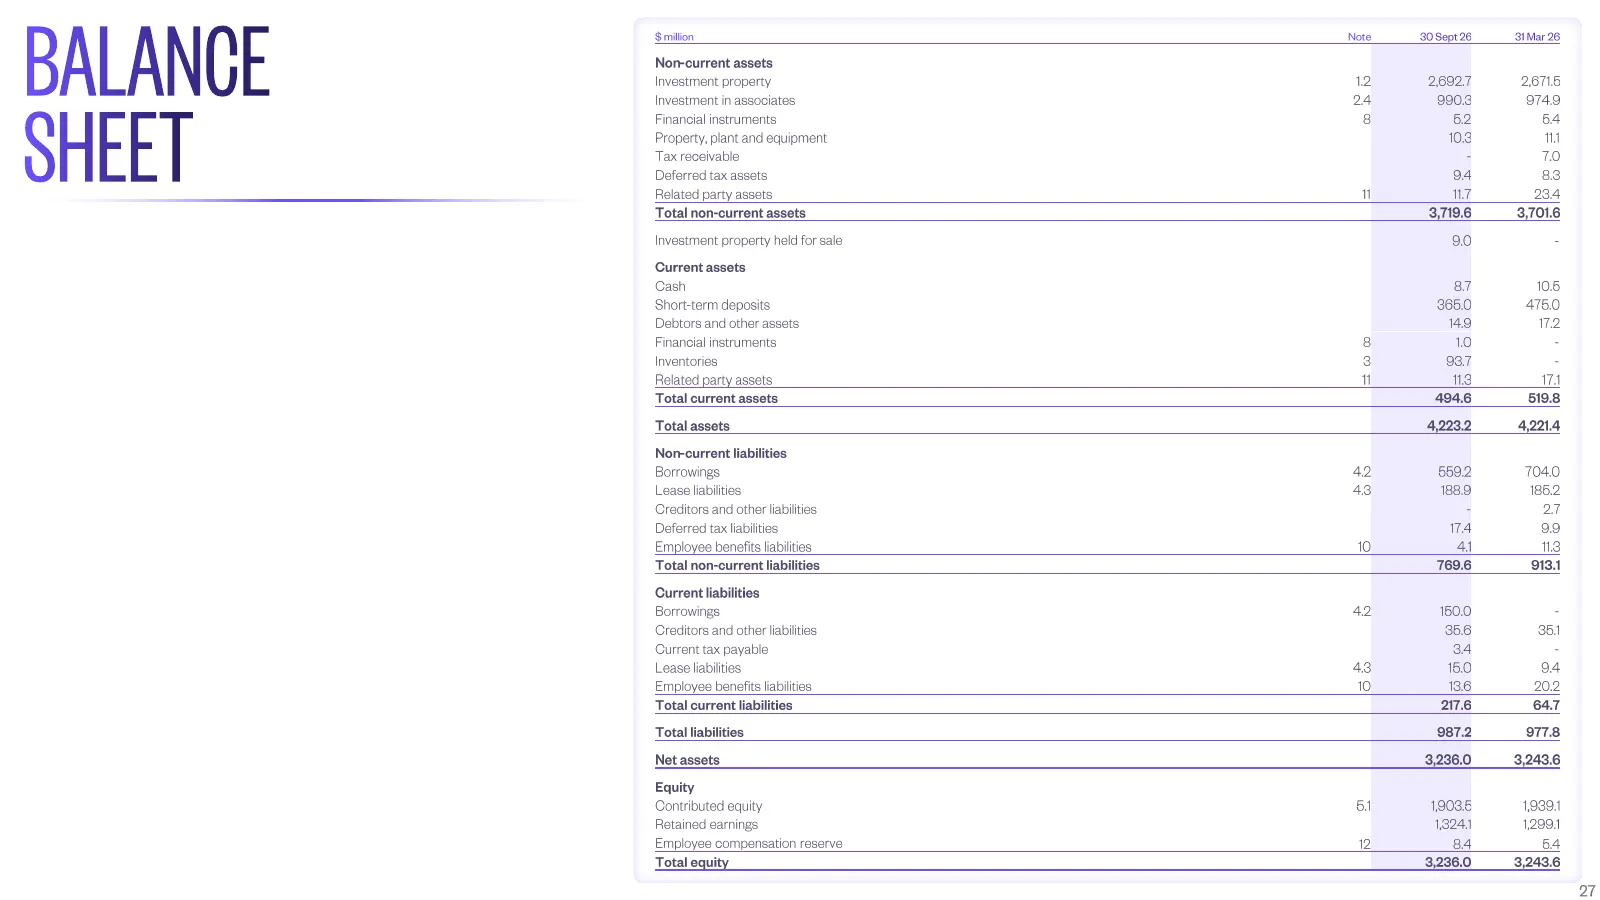
BALANCE $ million Note 30 Sept 26 31 Mar 26 Non-current assets Investment property 1.2 2,692.7 2,671.5 SHEET Investment in associates 2.4 990.3 974.9 Financial instruments 8 5.2 5.4 Property, plant and equipment 10.3 11.1 Tax receivable - 7.0 Deferred tax assets 9.4 8.3 Related party assets 11 11.7
Slide 28: Statement of Cash Flows
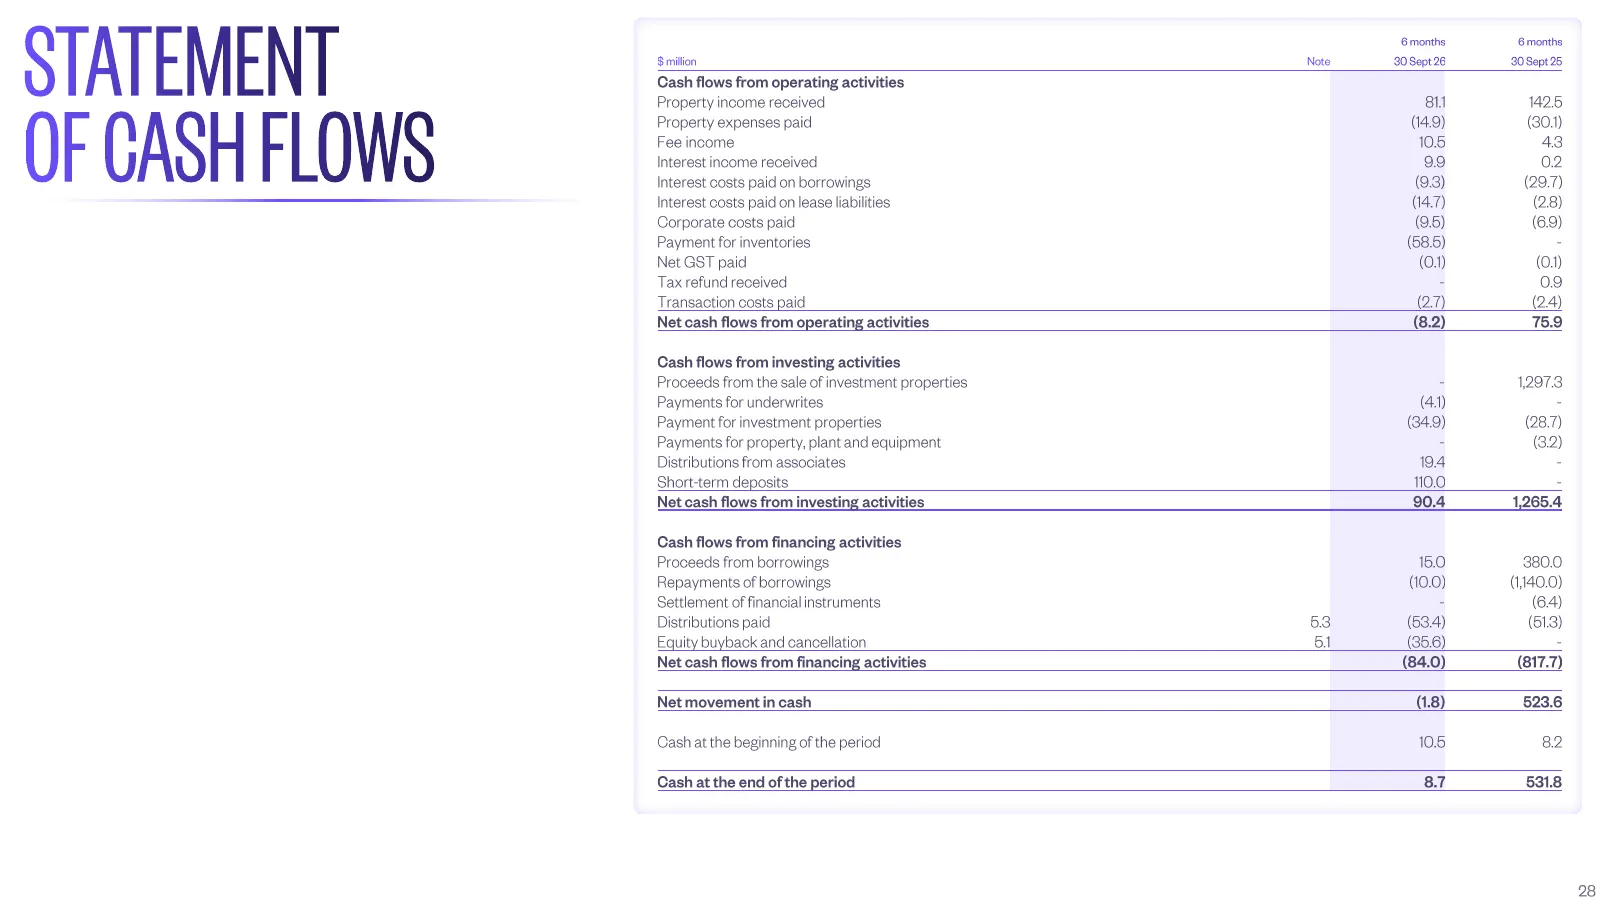
STATEMENT $ million Cash flows from operating activities Note 6 months 30 Sept 26 6 months 30 Sept 25 OF CASH FLOWS Property income received 81.1 142.5 Property expenses paid (14.9) (30.1) Fee income 10.5 4.3 Interest income received 9.9 0.2 Interest costs paid on borrowings (9.3) (29.7) Interest co
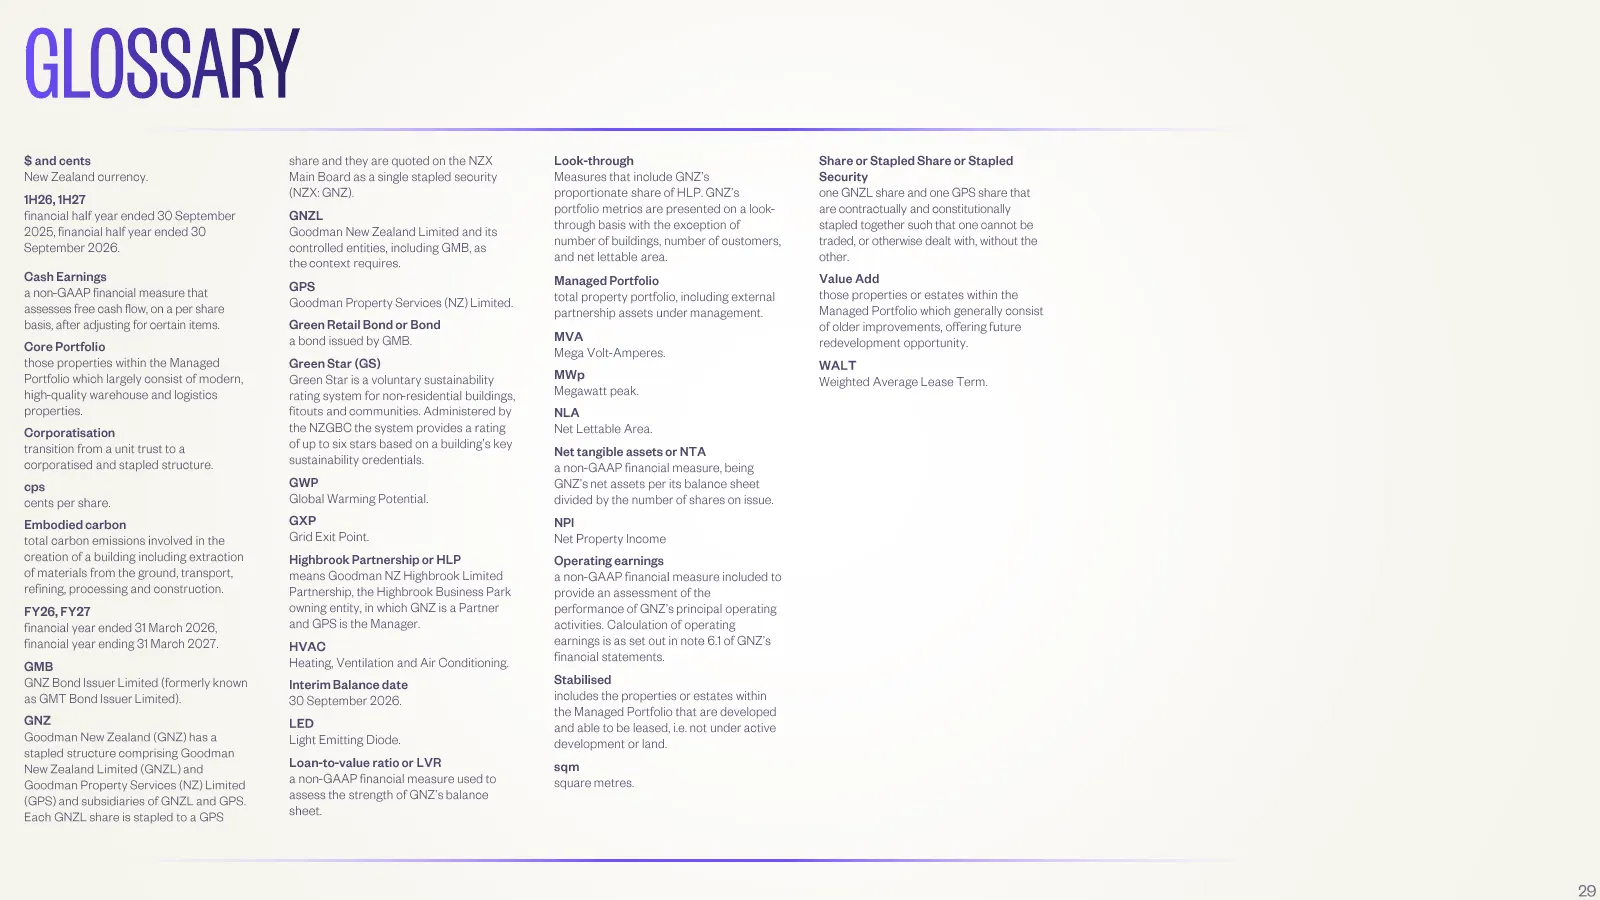
Slide 29: Glossary
GLOSSARY $ and cents share and they are quoted on the NZX Look -through Share or Stapled Share or Stapled New Zealand currency. Main Board as a single stapled security Measures that include GNZ’s Security 1H26, 1H27 (NZX: GNZ). proportionate share of HLP. GNZ’s one GNZL share and one GPS share that
Source: NZX announcement, Nov 23, 2026
More decks from Goodman Group
 Shareholder Meeting (November 2026)33 slides · Nov 19, 2026
 FY2026 Earnings Presentation54 slides · Aug 20, 2026
 Goodman NZ — Shareholder Meeting (July 2026)24 slides · Jul 27, 2026
 Goodman NZ — FY2026 Earnings Presentation35 slides · May 2026
 Goodman Property Trust — Shareholder Meeting (March 2026)16 slides · Mar 31, 2026
 1H FY26 Earnings Presentation51 slides · Feb 19, 2026