Capita plc · LSE:CPI
Capita — FY2020 Earnings Presentation
53 slides from Capita's earnings presentation, Mar 17, 2021

Slide 1: Full year results 2020
Full year results 2020 17 March 2021
Slide 2: Disclaimer
Disclaimer This full-year results statement is prepared for and addressed only to the Company's shareholders as a whole and to no other person. The Company, its Directors, employees, agents and advisers accept and assume no liability to any person in respect of this update save as would arise under

Slide 3: A big thank you
A big thank you 3

Slide 4: CEO update Jon Lewis
CEO update Jon Lewis 4
Slide 5: Overview
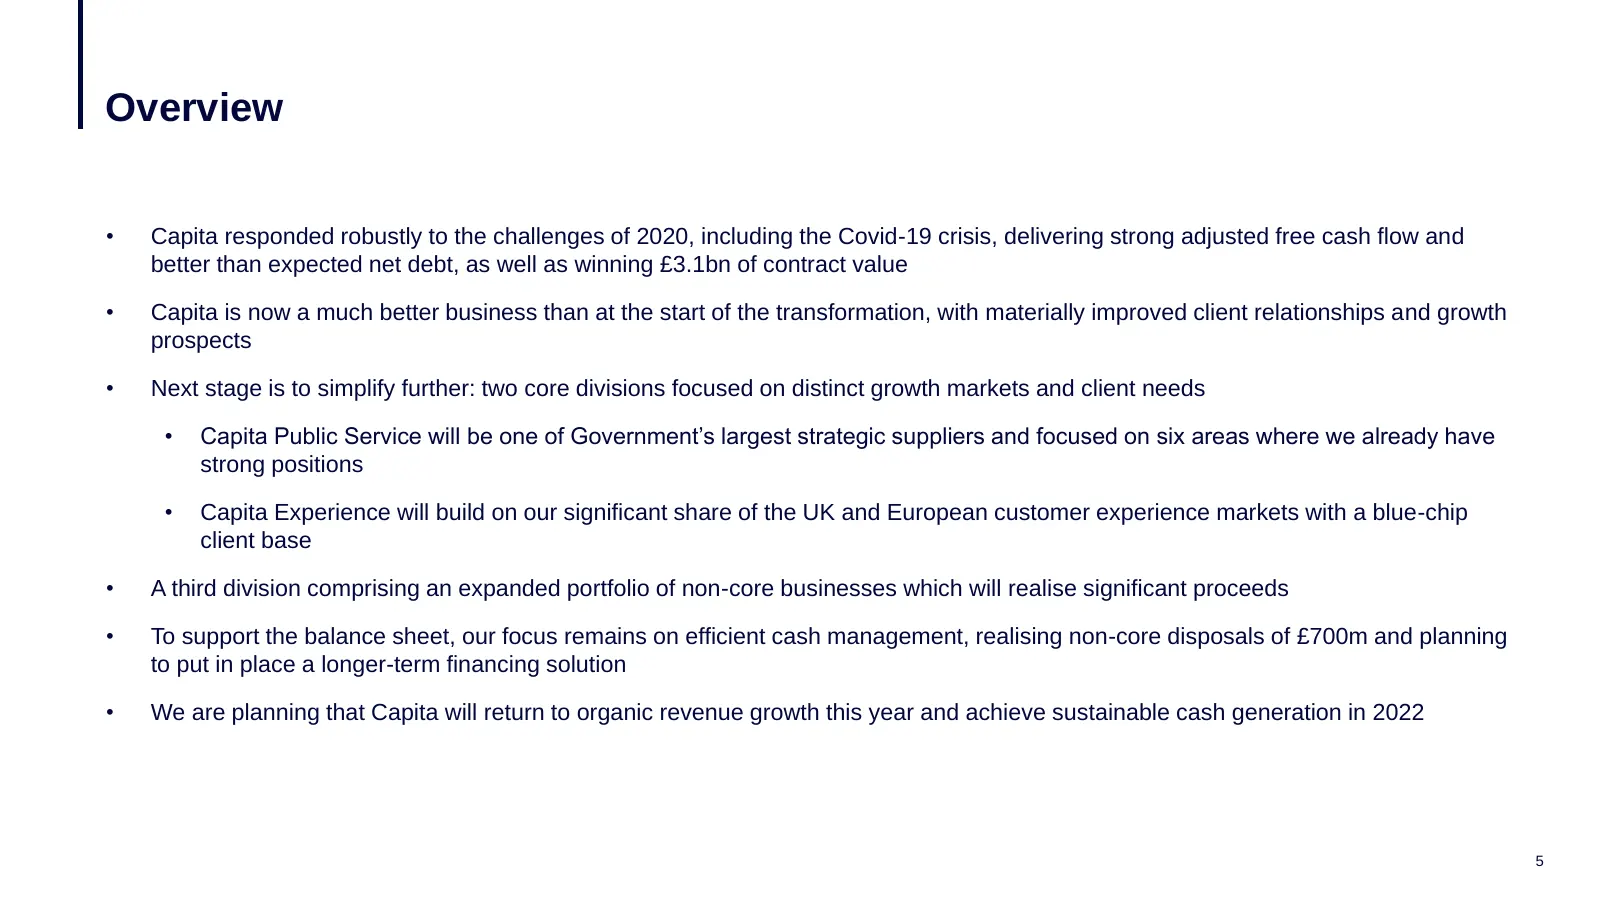
Overview • Capita responded robustly to the challenges of 2020, including the Covid-19 crisis, delivering strong adjusted free cash flow and better than expected net debt, as well as winning £3.1bn of contract value • Capita is now a much better business than at the start of the transformation, with
Slide 6: Our Purpose: resonates with our people, clients and their customers
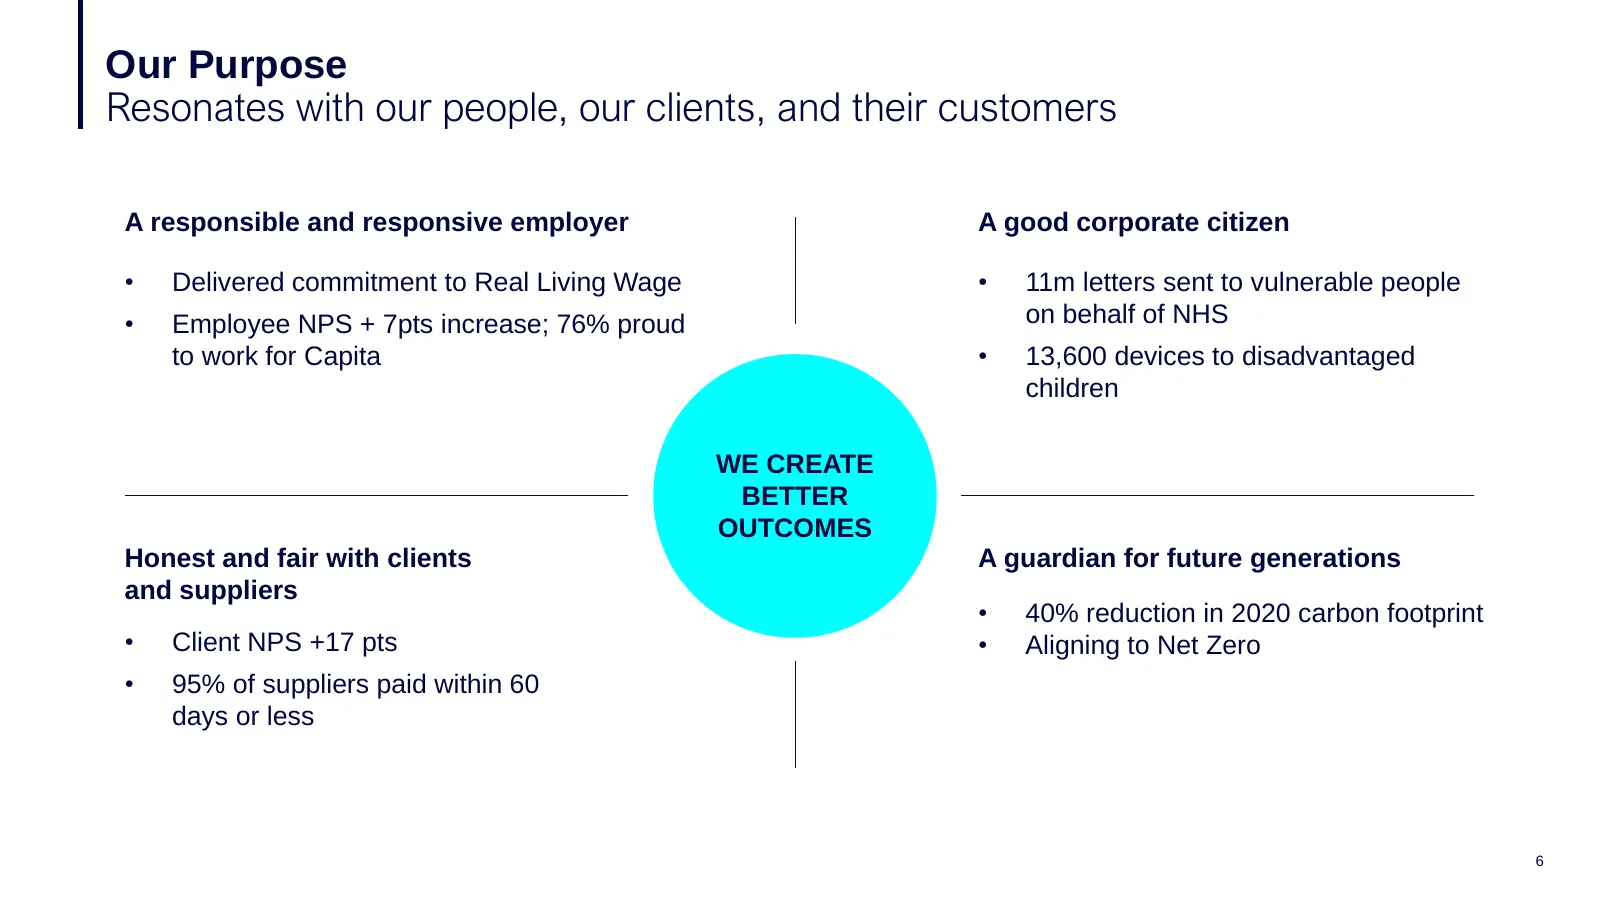
Our Purpose Resonates with our people, our clients, and their customers A responsible and responsive employer A good corporate citizen • Delivered commitment to Real Living Wage • 11m letters sent to vulnerable people • Employee NPS + 7pts increase; 76% proud on behalf of NHS to work for Capita • 13
Slide 7: A robust response, putting our colleagues and clients first
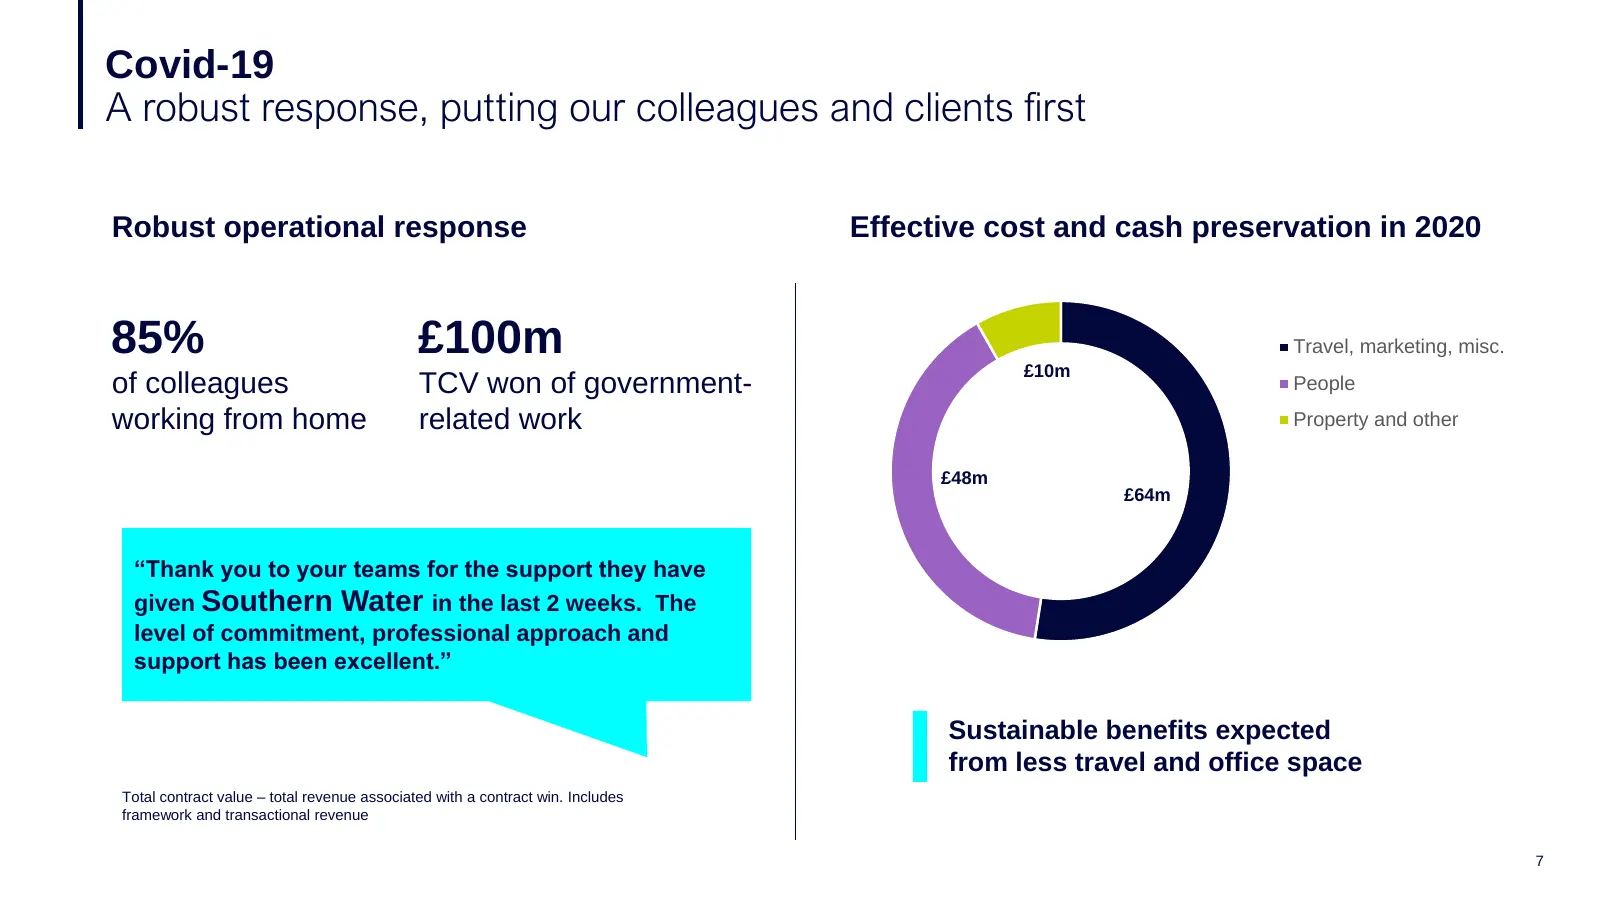
Covid-19 A robust response, putting our colleagues and clients first Robust operational response Effective cost and cash preservation in 2020 85% £100m Travel, marketing, misc. £10m of colleagues TCV won of government- People working from home related work Property and other £48m £64m “Thank you to
Slide 8: We also protected the business financially
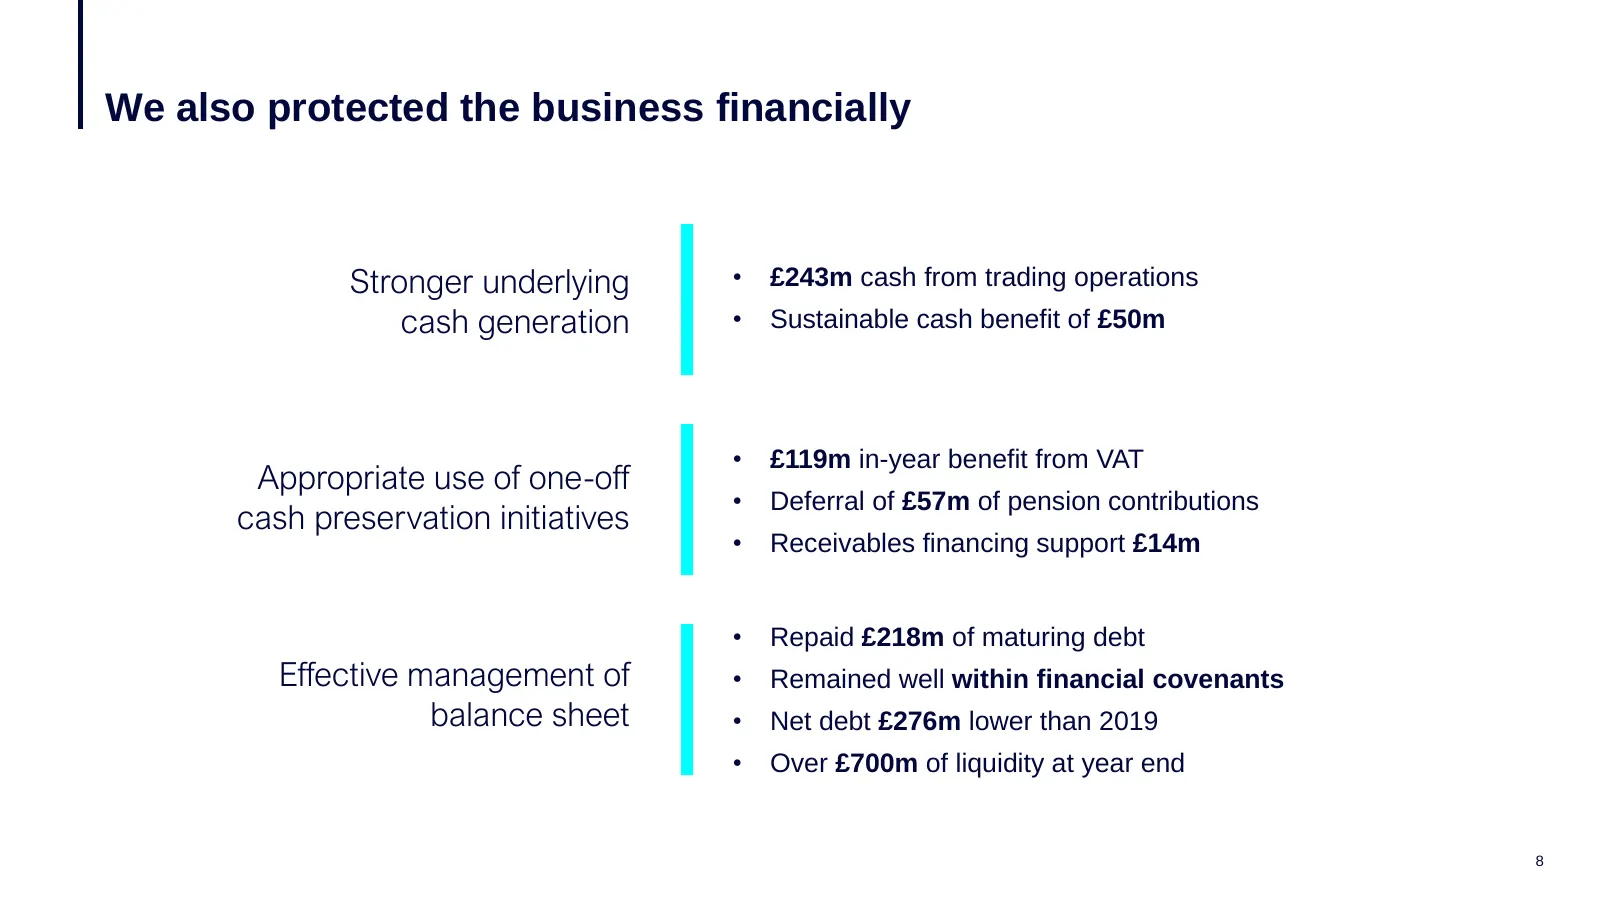
We also protected the business financially Stronger underlying • £243m cash from trading operations cash generation • Sustainable cash benefit of £50m • £119m in-year benefit from VAT Appropriate use of one-off • Deferral of £57m of pension contributions cash preservation initiatives • Receivables f
Slide 9: We have now established the platform to move to the next step
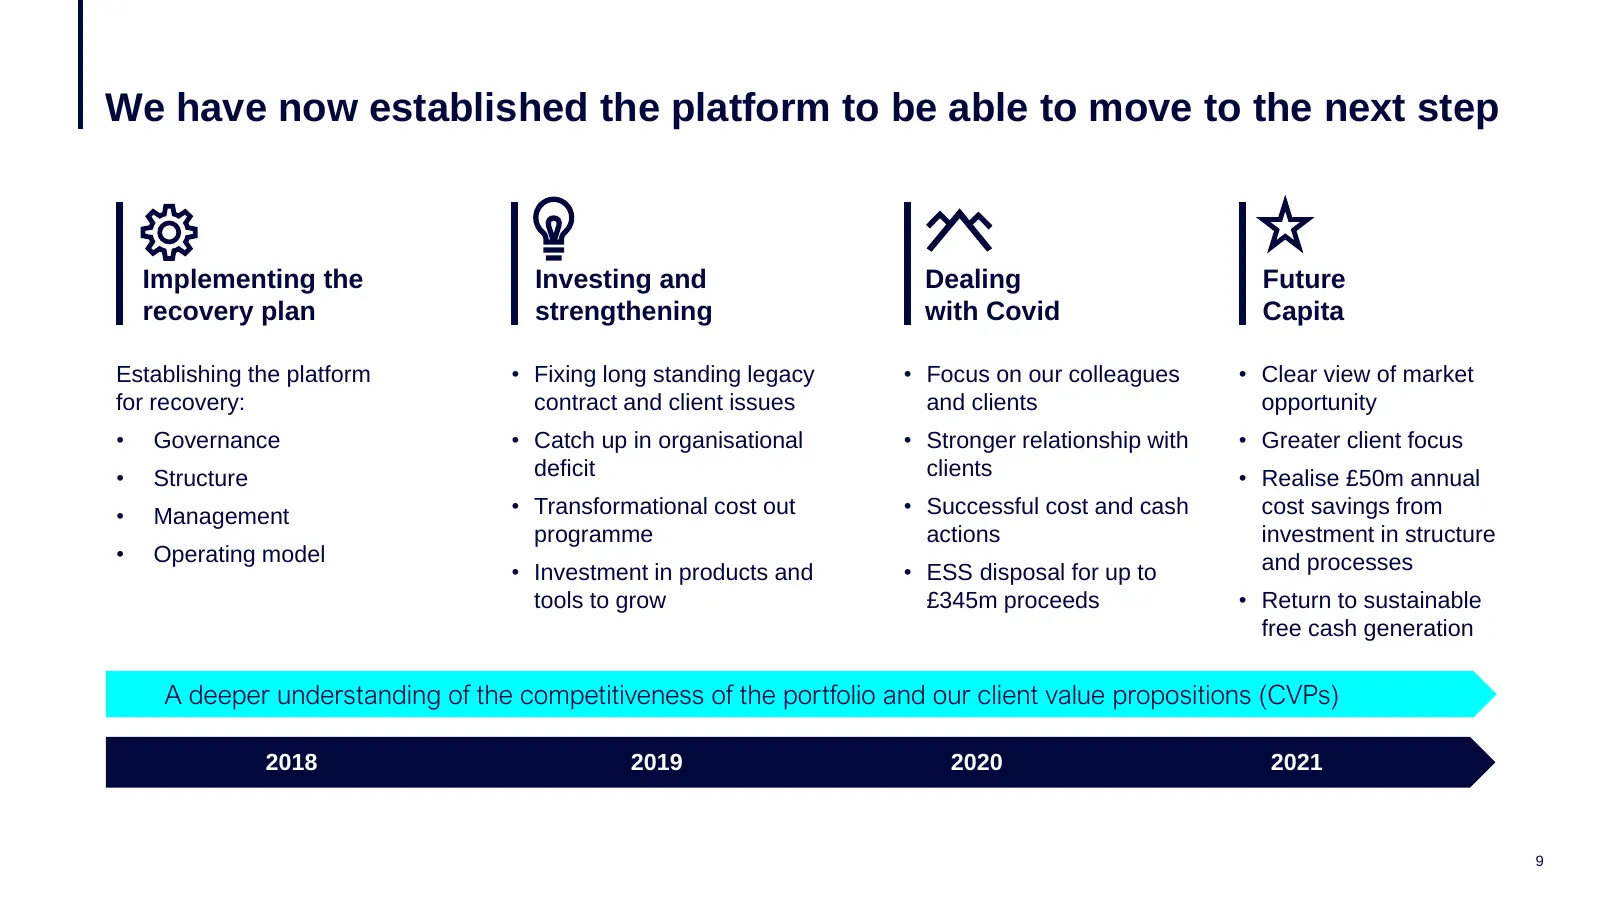
We have now established the platform to be able to move to the next step Implementing the Investing and Dealing Future recovery plan strengthening with Covid Capita Establishing the platform • Fixing long standing legacy • Focus on our colleagues • Clear view of market for recovery: contract and cli
Slide 10: Client-focused, with shared services and a lean Group overhead
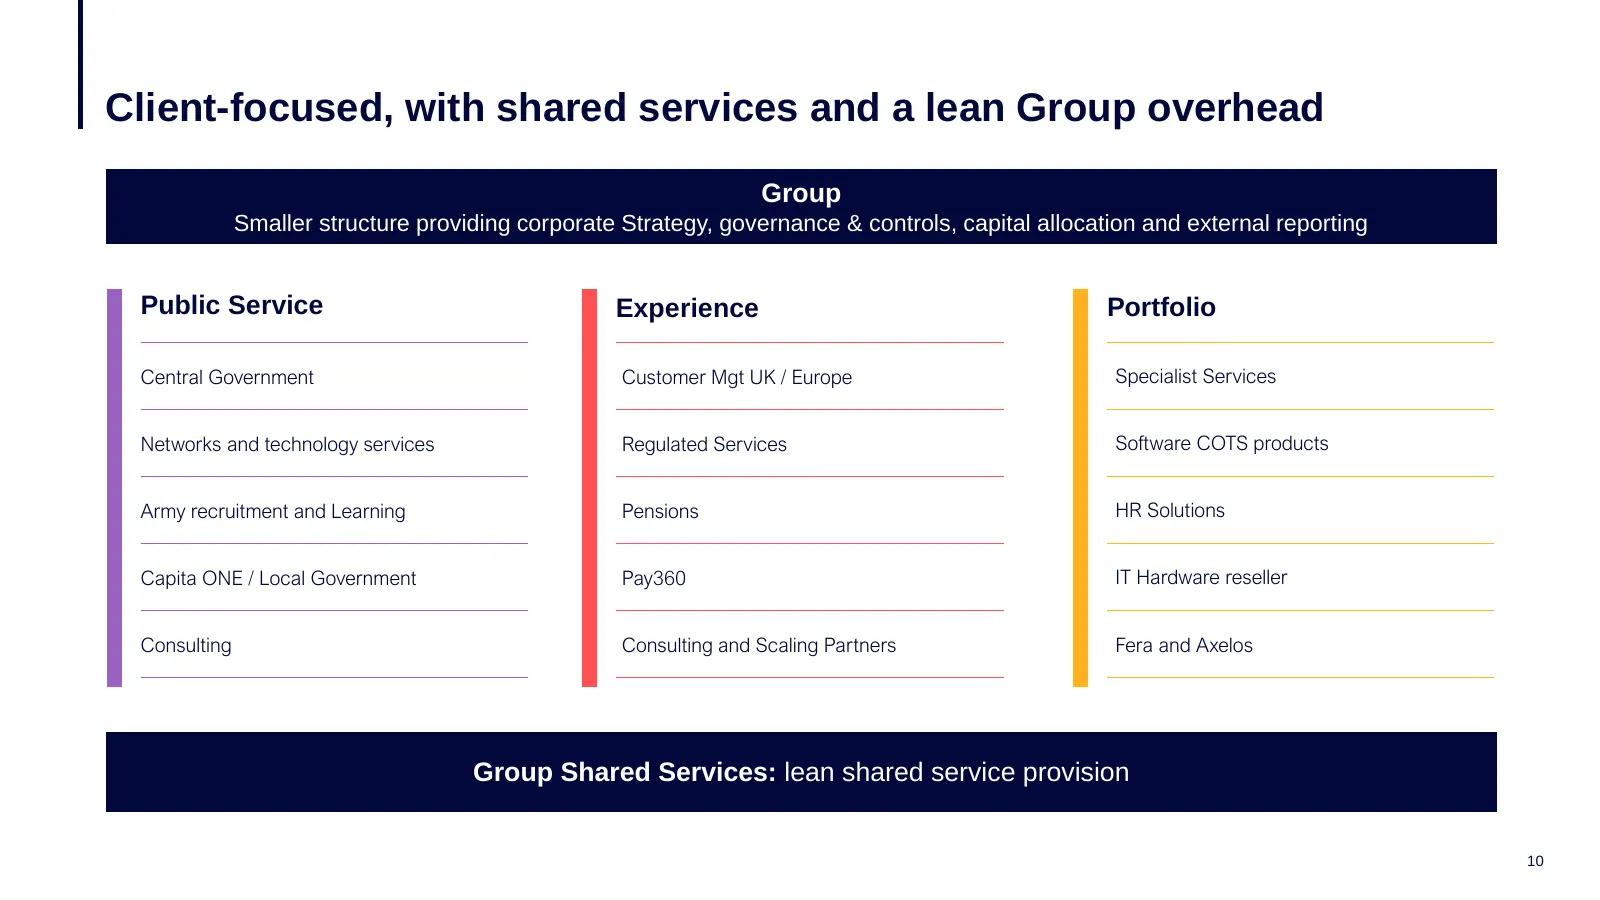
Client-focused, with shared services and a lean Group overhead Group Smaller structure providing corporate Strategy, governance & controls, capital allocation and external reporting Public Service Experience Portfolio Central Government Customer Mgt UK / Europe Specialist Services Networks and techn
Slide 11: We have addressed the legacy operational issues for our clients
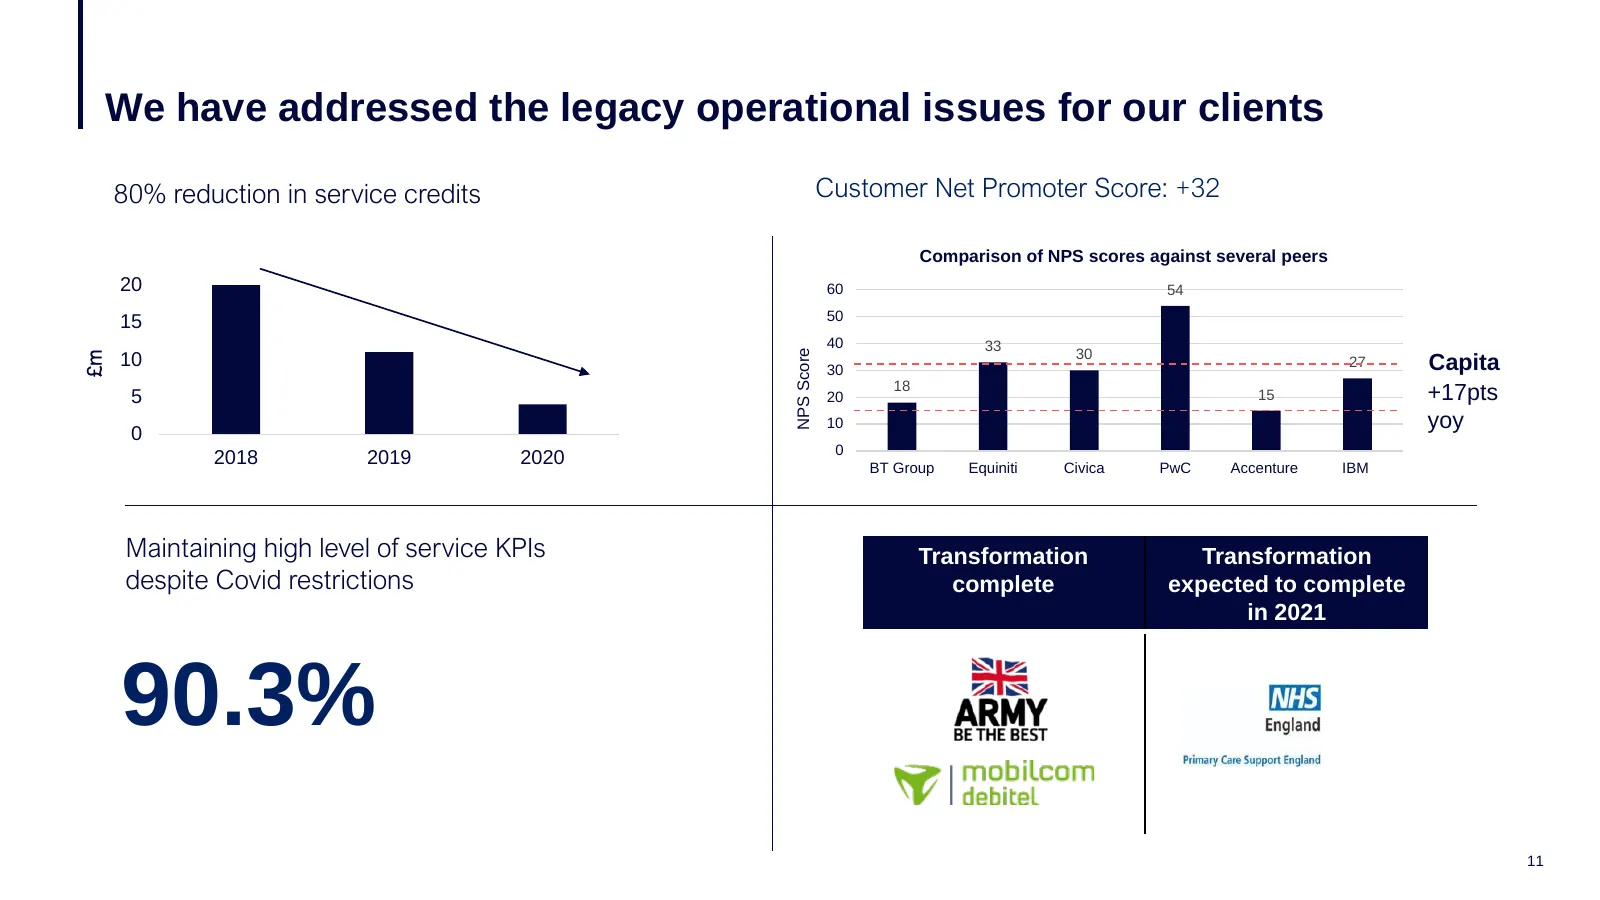
We have addressed the legacy operational issues for our clients 80% reduction in service credits Customer Net Promoter Score: +32 Comparison of NPS scores against several peers 20 60 54 15 50 40 33 NPS Score 30 £m 10 30 27 Capita 18 5 20 15 +17pts 10 yoy 0 0 2018 2019 2020 BT Group Equiniti Civica P
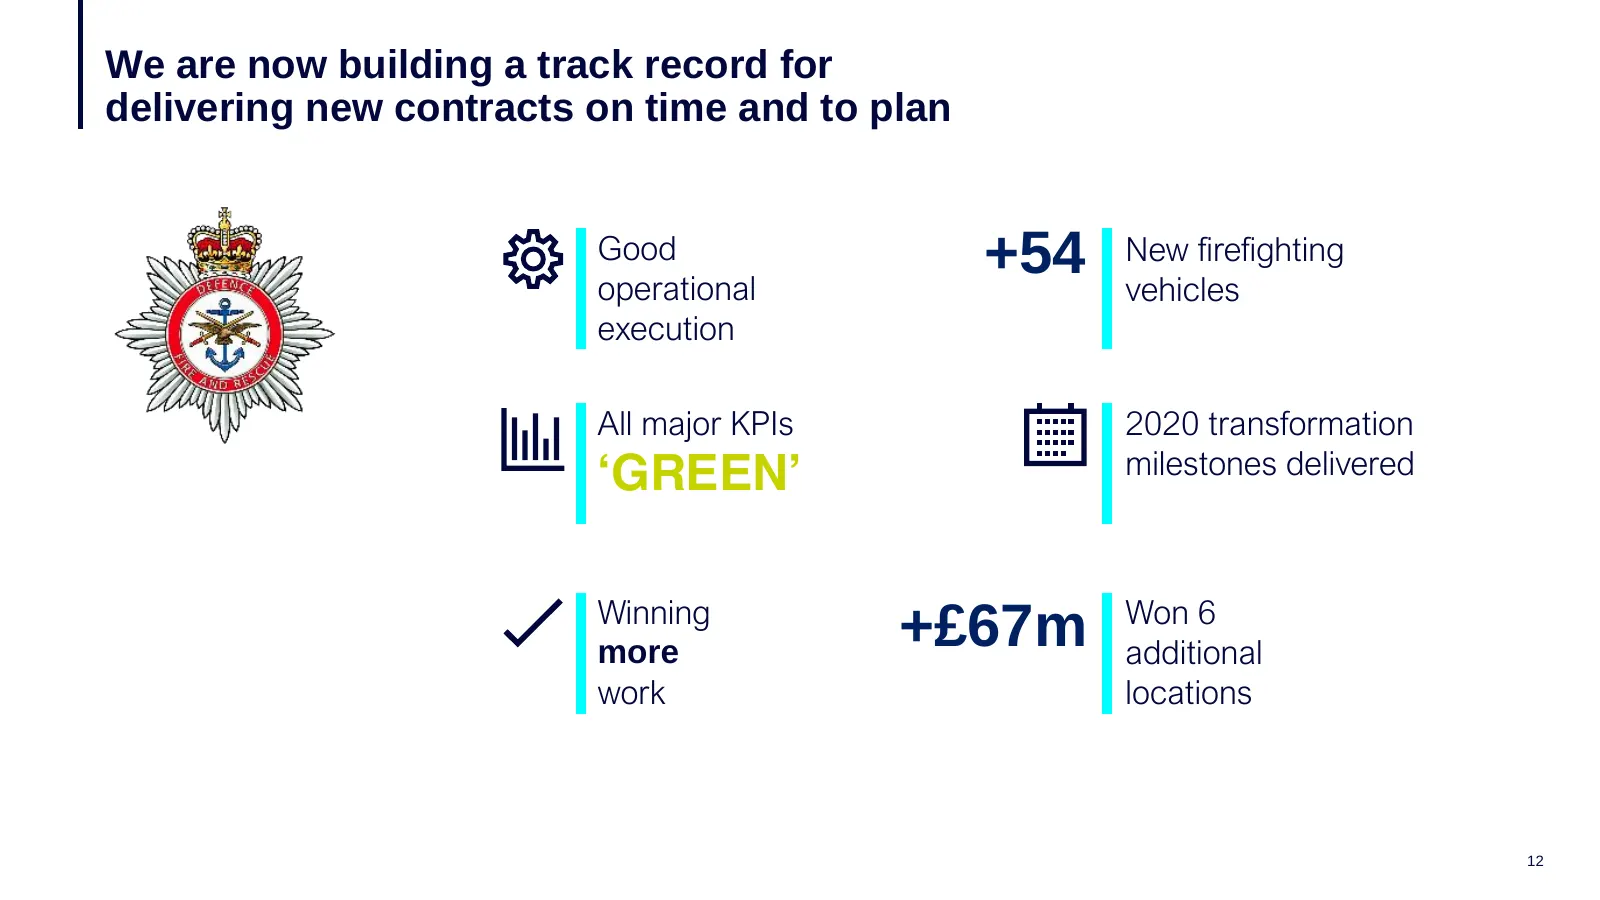
Slide 12: Building a track record of delivering new contracts on time and to plan
We are now building a track record for delivering new contracts on time and to plan Good +54 New firefighting operational vehicles execution All major KPIs 2020 transformation ‘GREEN’ milestones delivered Winning more +£67m Won 6 additional work locations 12
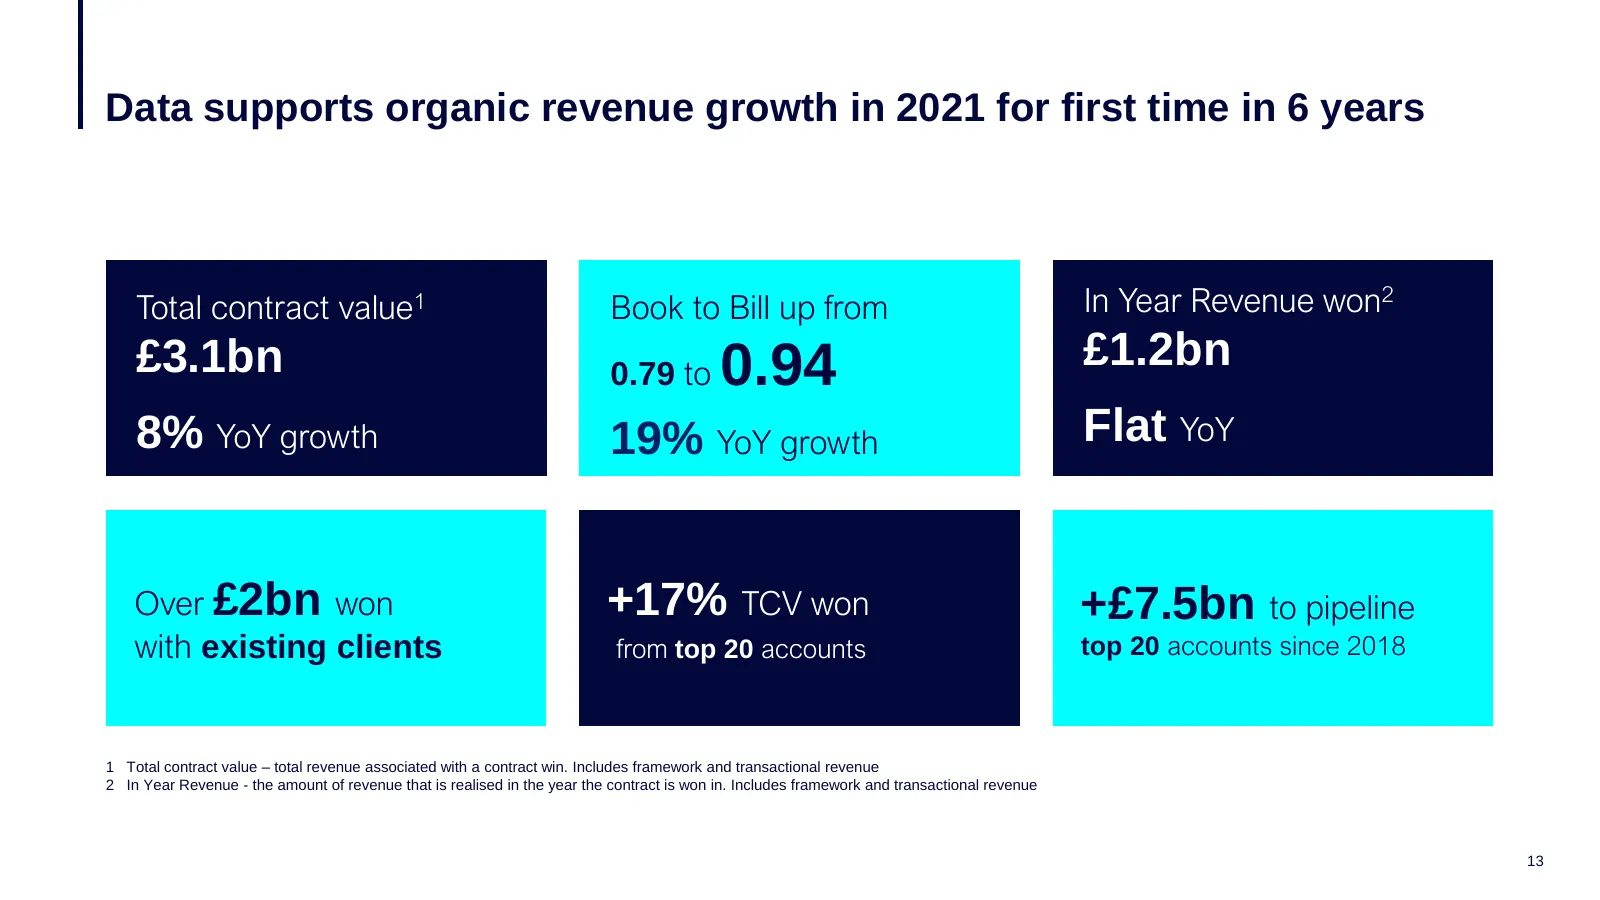
Slide 13: Data supports organic revenue growth in 2021 for first time in 6 years
Data supports organic revenue growth in 2021 for first time in 6 years Total contract value1 Book to Bill up from In Year Revenue won2 £3.1bn 0.79 to 0.94 £1.2bn 8% YoY growth 19% YoY growth Flat YoY Over £2bn won +17% TCV won +£7.5bn to pipeline with existing clients from top 20 accounts top 20 acc
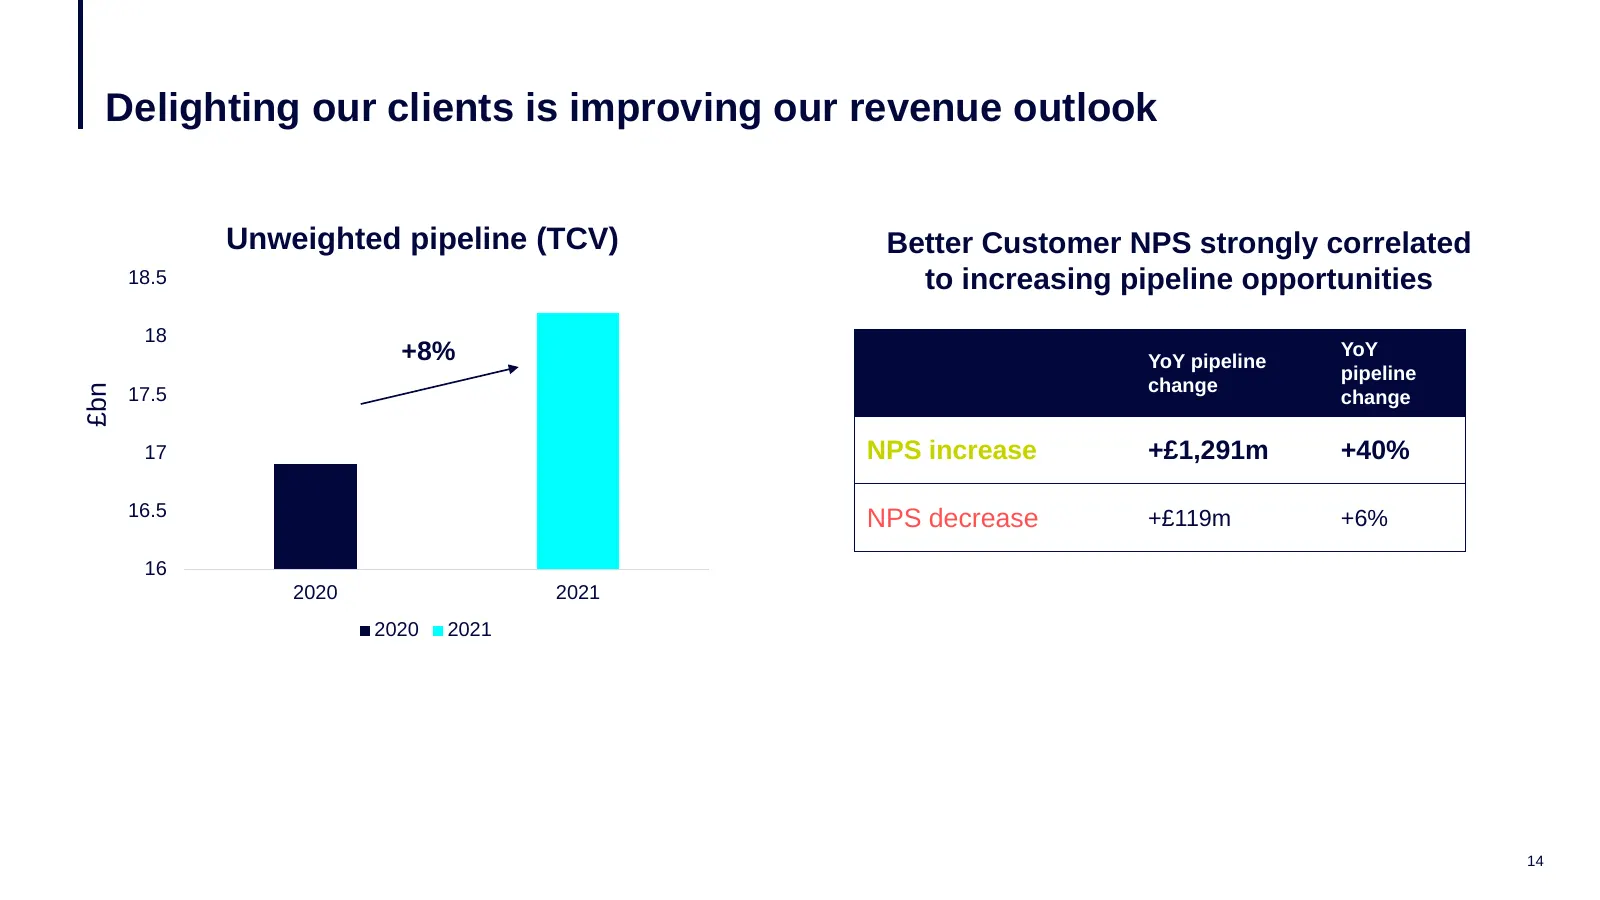
Slide 14: Delighting our clients is improving our revenue outlook
Delighting our clients is improving our revenue outlook Unweighted pipeline (TCV) Better Customer NPS strongly correlated 18.5 to increasing pipeline opportunities 18 +8% YoY pipeline YoY pipeline change £bn 17.5 change 17 NPS increase +£1,291m +40% 16.5 NPS decrease +£119m +6% 16 2020 2021 2020 202
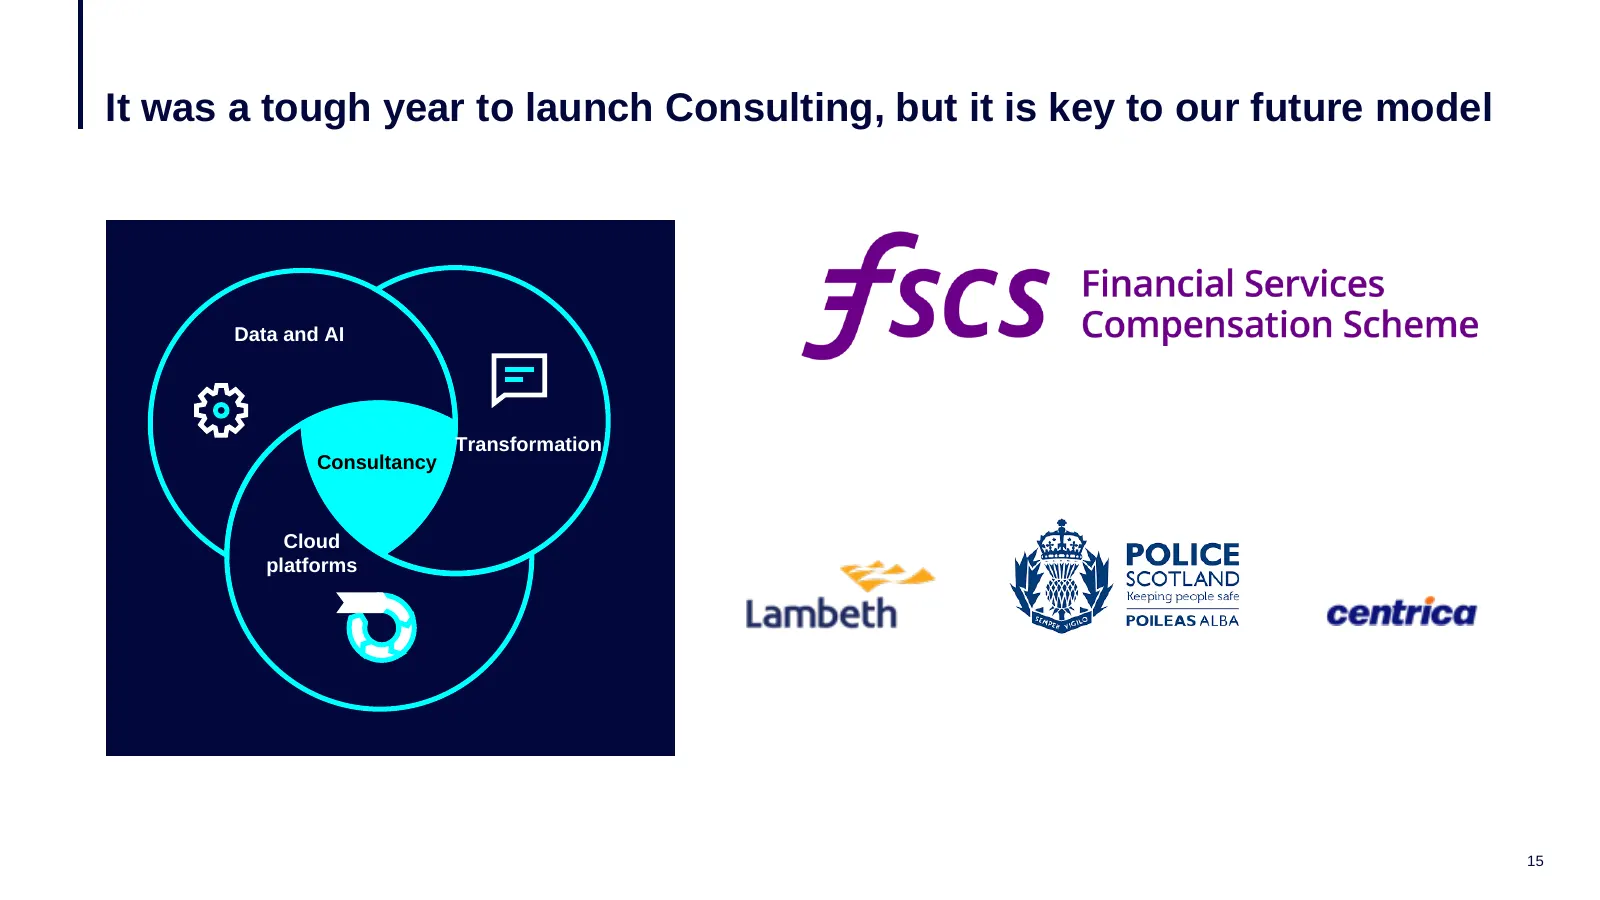
Slide 15: It was a tough year to launch Consulting, but it is key to our future
It was a tough year to launch Consulting, but it is key to our future model Data and AI Transformation Consultancy Cloud platforms 15
Slide 16: Major investment is almost complete, driving sustainable cost savings
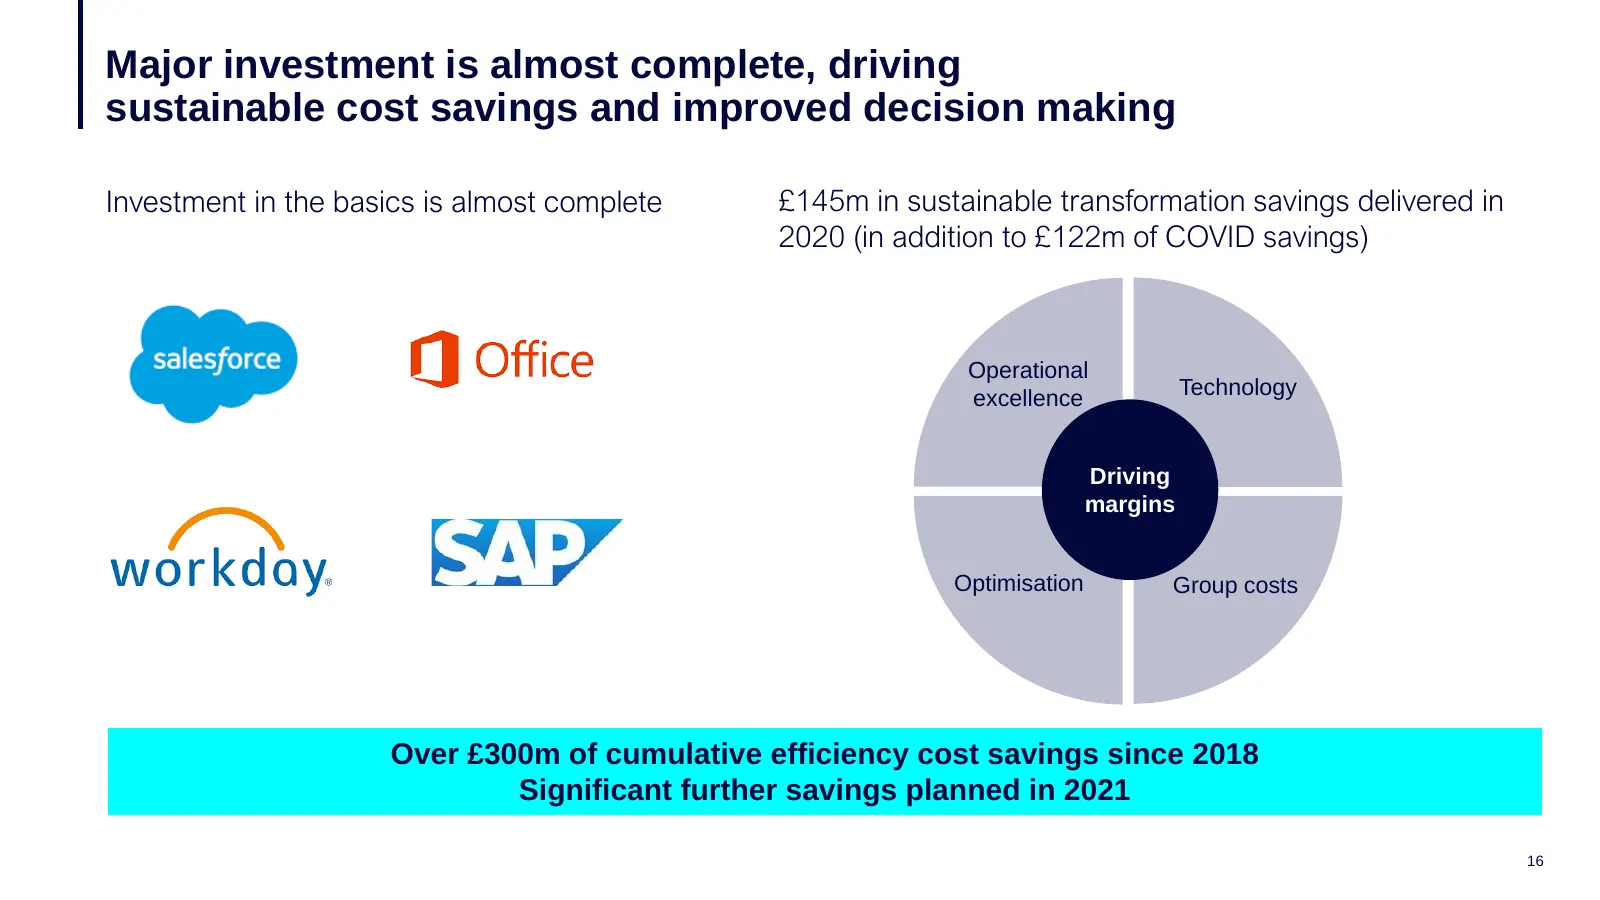
Major investment is almost complete, driving sustainable cost savings and improved decision making Investment in the basics is almost complete £145m in sustainable transformation savings delivered in 2020 (in addition to £122m of COVID savings) Operational excellence Technology Driving margins Optim
Slide 17: Future Capita
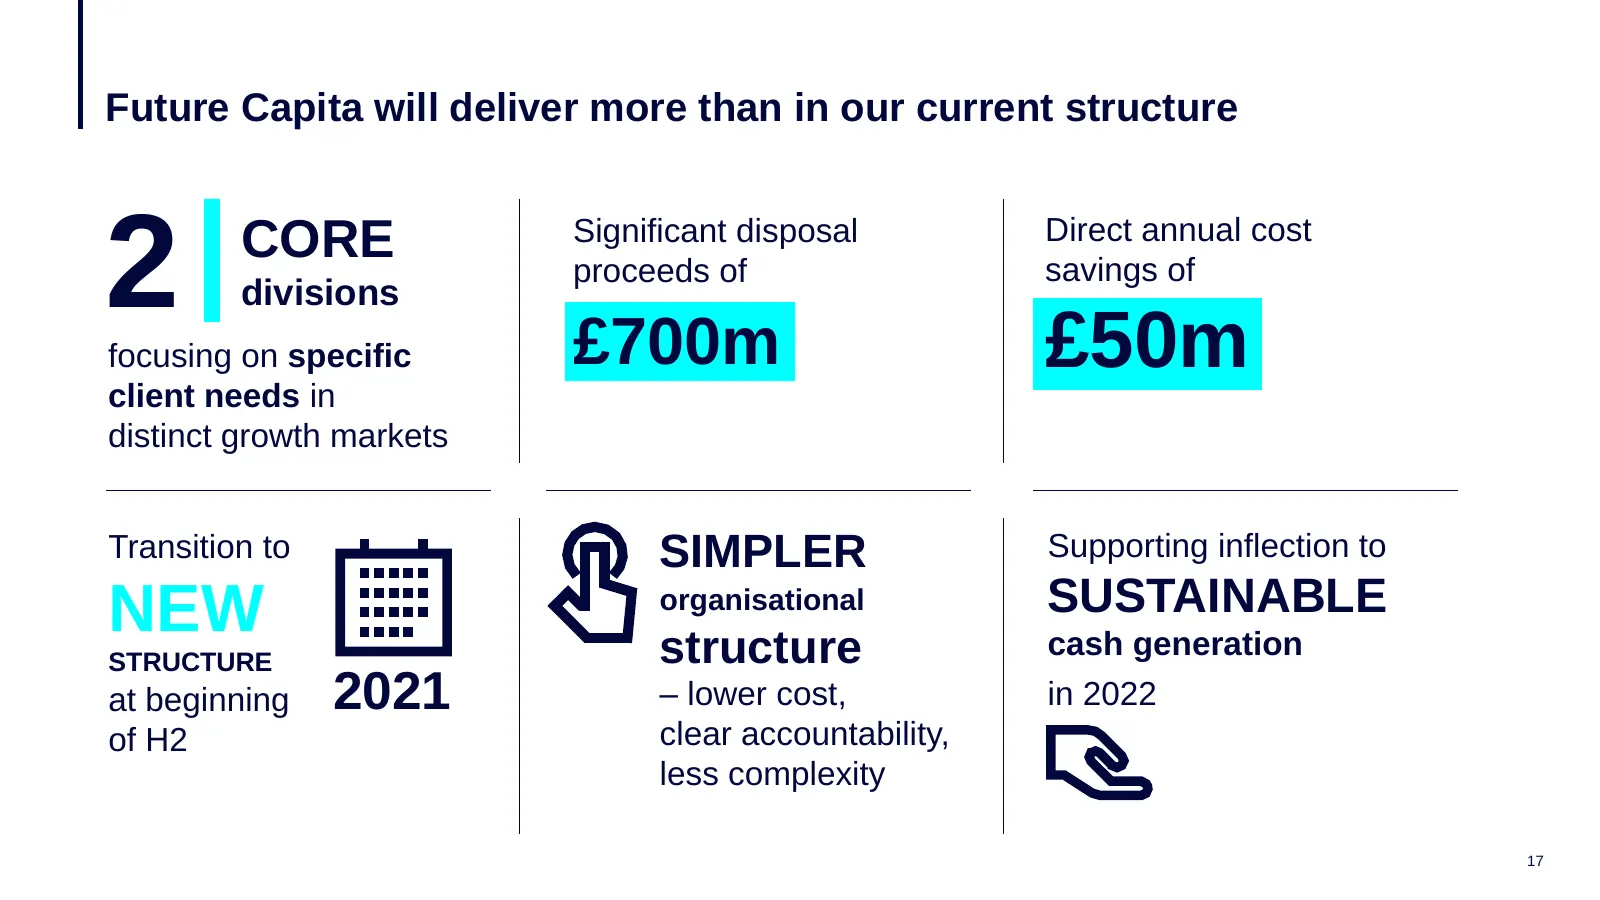
Future Capita will deliver more than in our current structure 2 CORE divisions focusing on specific Significant disposal proceeds of £700m Direct annual cost savings of £50m client needs in distinct growth markets Transition to SIMPLER Supporting inflection to NEW organisational SUSTAINABLE STRUCTUR
Slide 18: The two core divisions each focused on distinct client needs
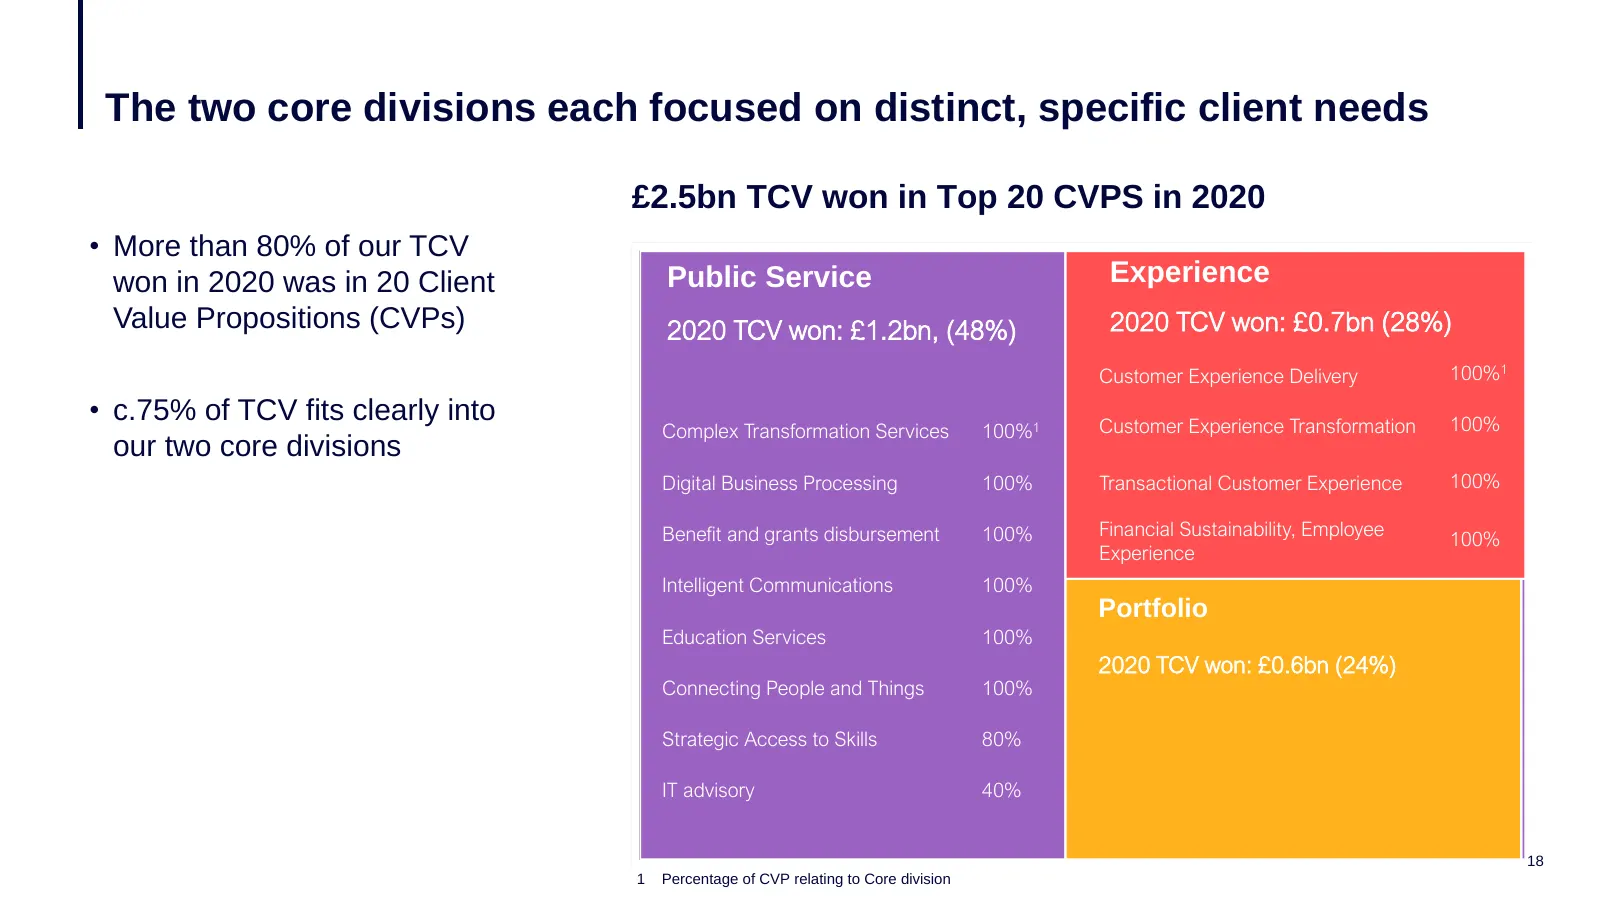
The two core divisions each focused on distinct, specific client needs £2.5bn TCV won in Top 20 CVPS in 2020 • More than 80% of our TCV won in 2020 was in 20 Client Public Service Experience Value Propositions (CVPs) 2020 TCV won: £1.2bn, (48%) 2020 TCV won: £0.7bn (28%) Customer Experience Delivery
Slide 19: Capita Public Service: Better serving the public sector
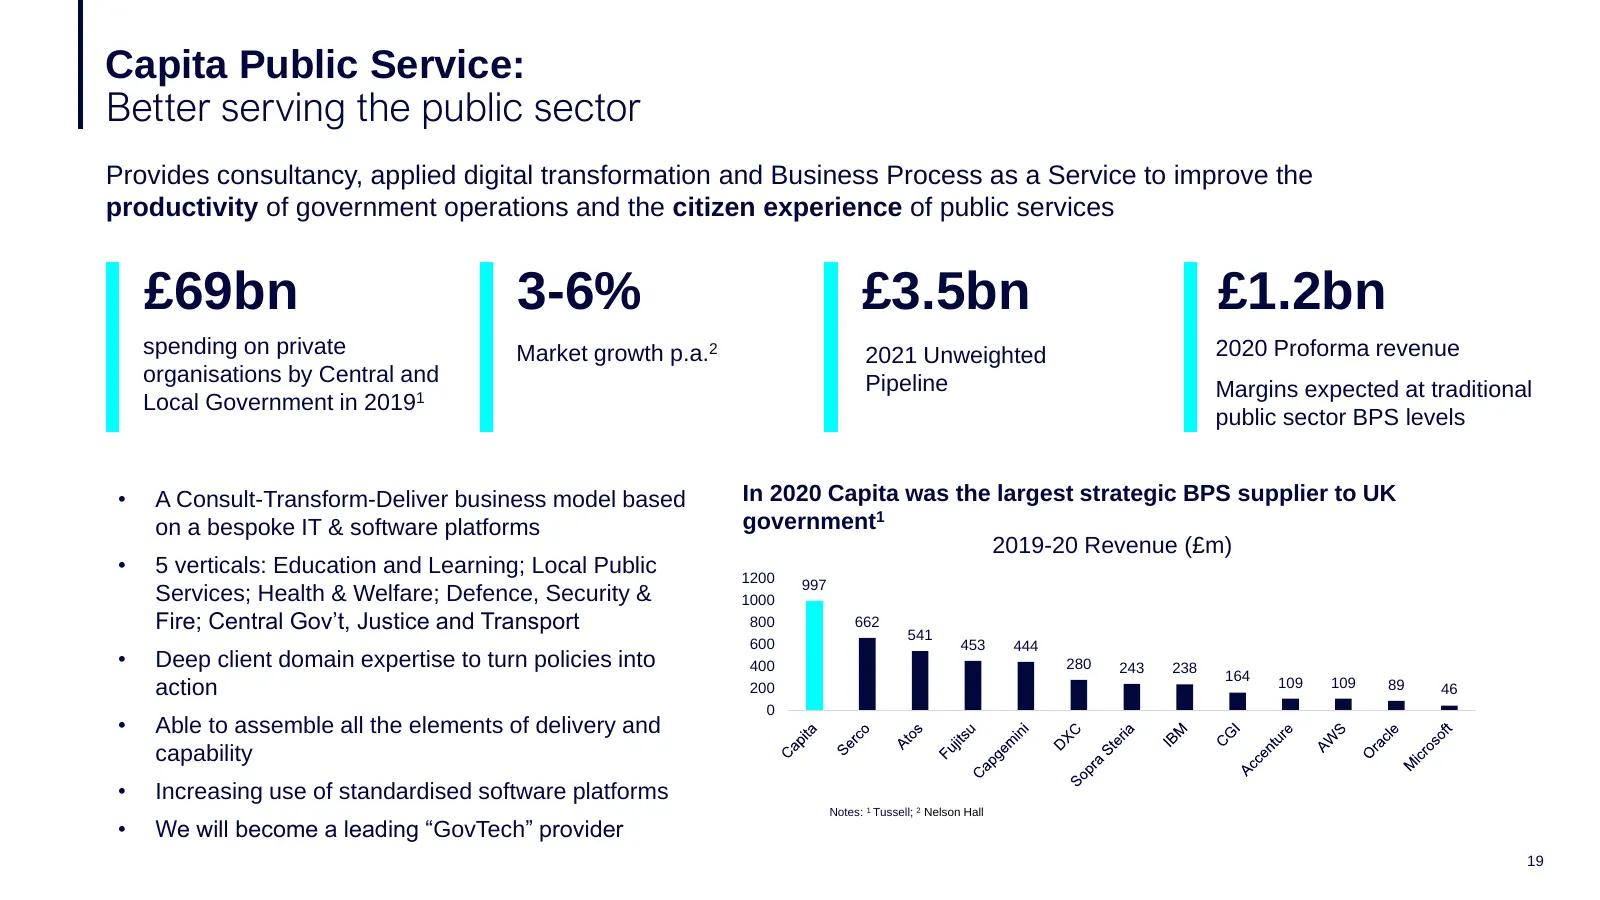
Capita Public Service: Better serving the public sector Provides consultancy, applied digital transformation and Business Process as a Service to improve the productivity of government operations and the citizen experience of public services £69bn 3-6% £3.5bn £1.2bn spending on private Market growth
Slide 20: Capita Experience: Superior customer service propositions
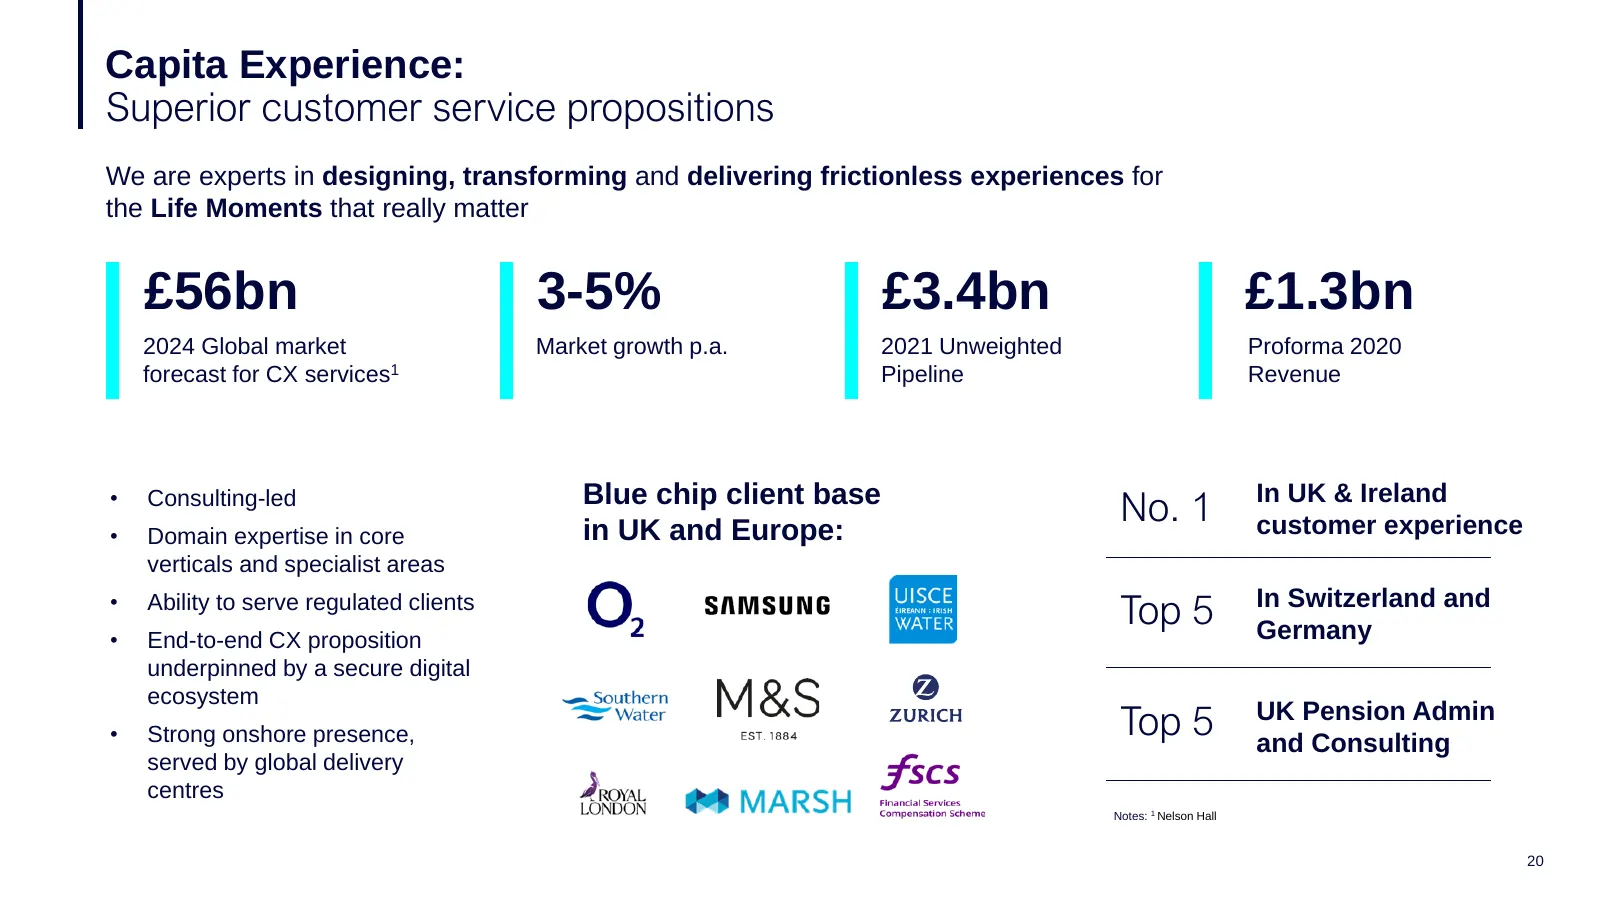
Capita Experience: Superior customer service propositions We are experts in designing, transforming and delivering frictionless experiences for the Life Moments that really matter £56bn 3-5% £3.4bn £1.3bn 2024 Global market Market growth p.a. 2021 Unweighted Proforma 2020 forecast for CX services1 P
Slide 21: Driving cost and efficiency from an evolved operating model
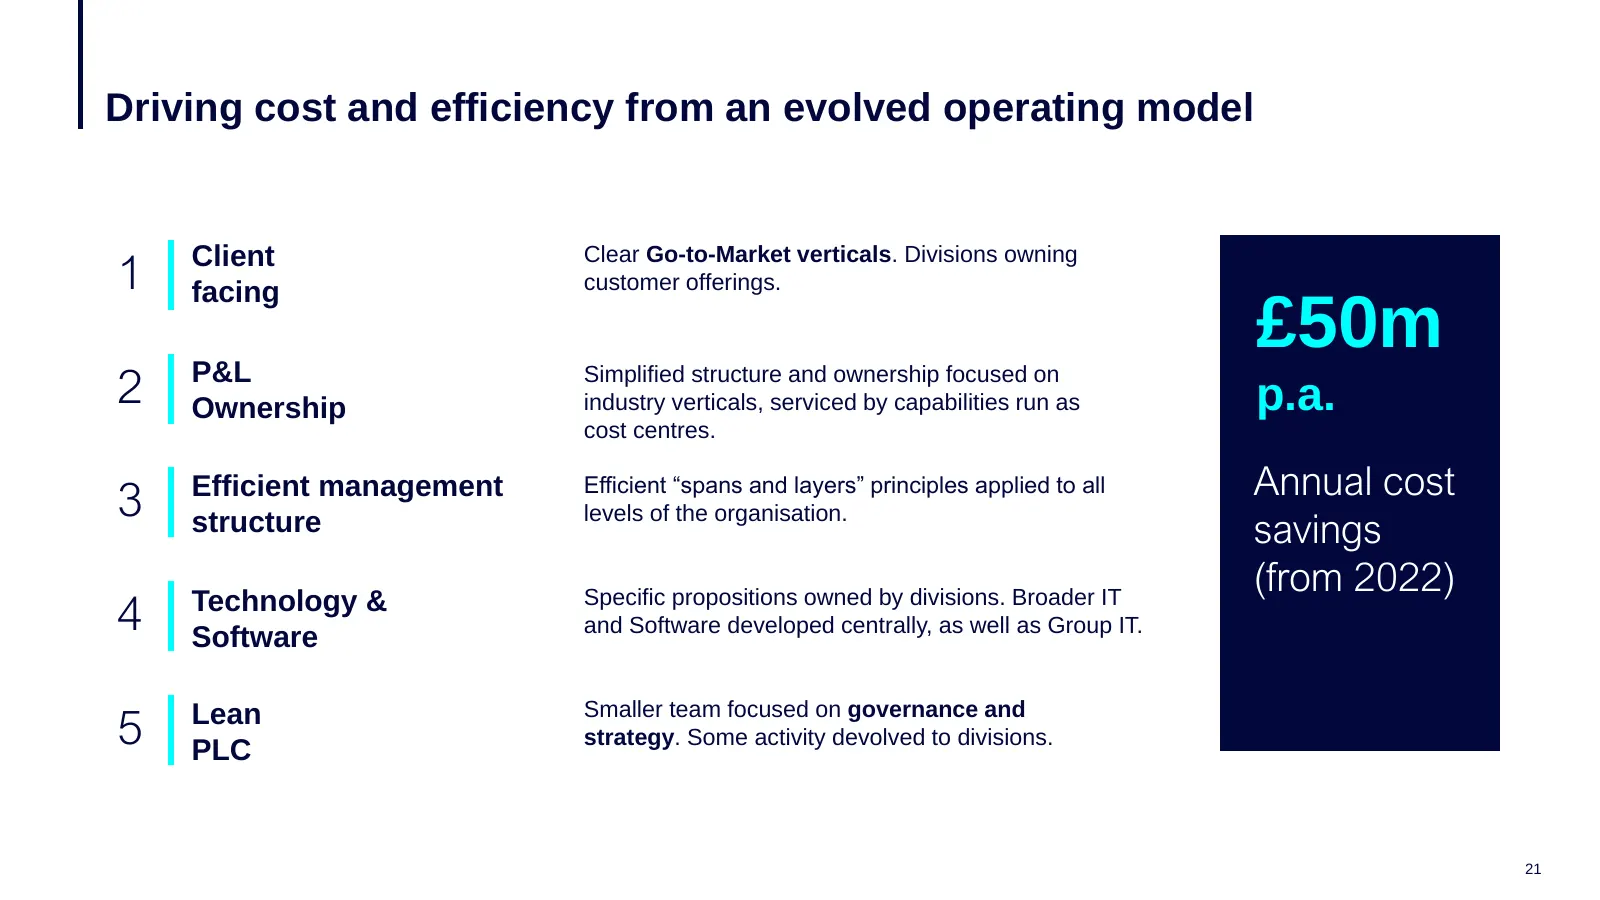
Driving cost and efficiency from an evolved operating model 1 Client Clear Go-to-Market verticals. Divisions owning customer offerings. facing £50m 2 P&L Ownership Simplified structure and ownership focused on industry verticals, serviced by capabilities run as p.a. cost centres. Annual cost 3 Effic
Slide 22: Capita Portfolio: An expanded portfolio of valuable non-core businesses
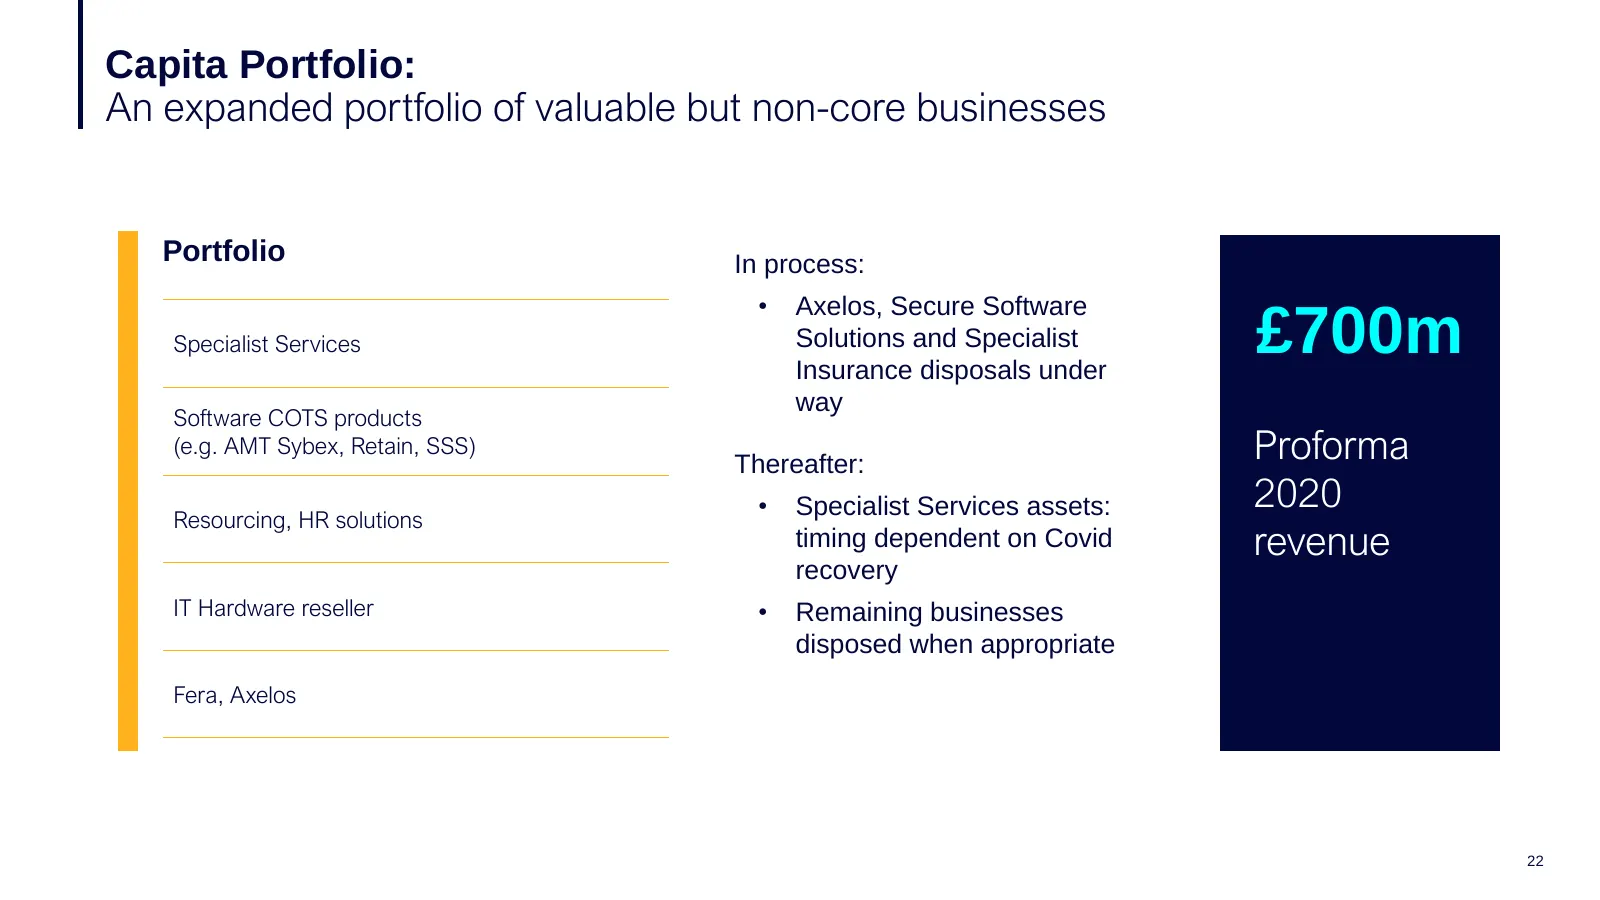
Capita Portfolio: An expanded portfolio of valuable but non-core businesses Portfolio In process: • Axelos, Secure Software Specialist Services Solutions and Specialist Insurance disposals under £700m way Software COTS products (e.g. AMT Sybex, Retain, SSS) Thereafter: Proforma • Specialist Services
Slide 23: Financial results Gordon Boyd
Financial results Gordon Boyd All figures included within this presentation are on an adjusted basis (ESS excluded from adjusted results in both years, as held for sale at year end) and post IFRS 16, unless otherwise stated. 23
Slide 24: Financial overview
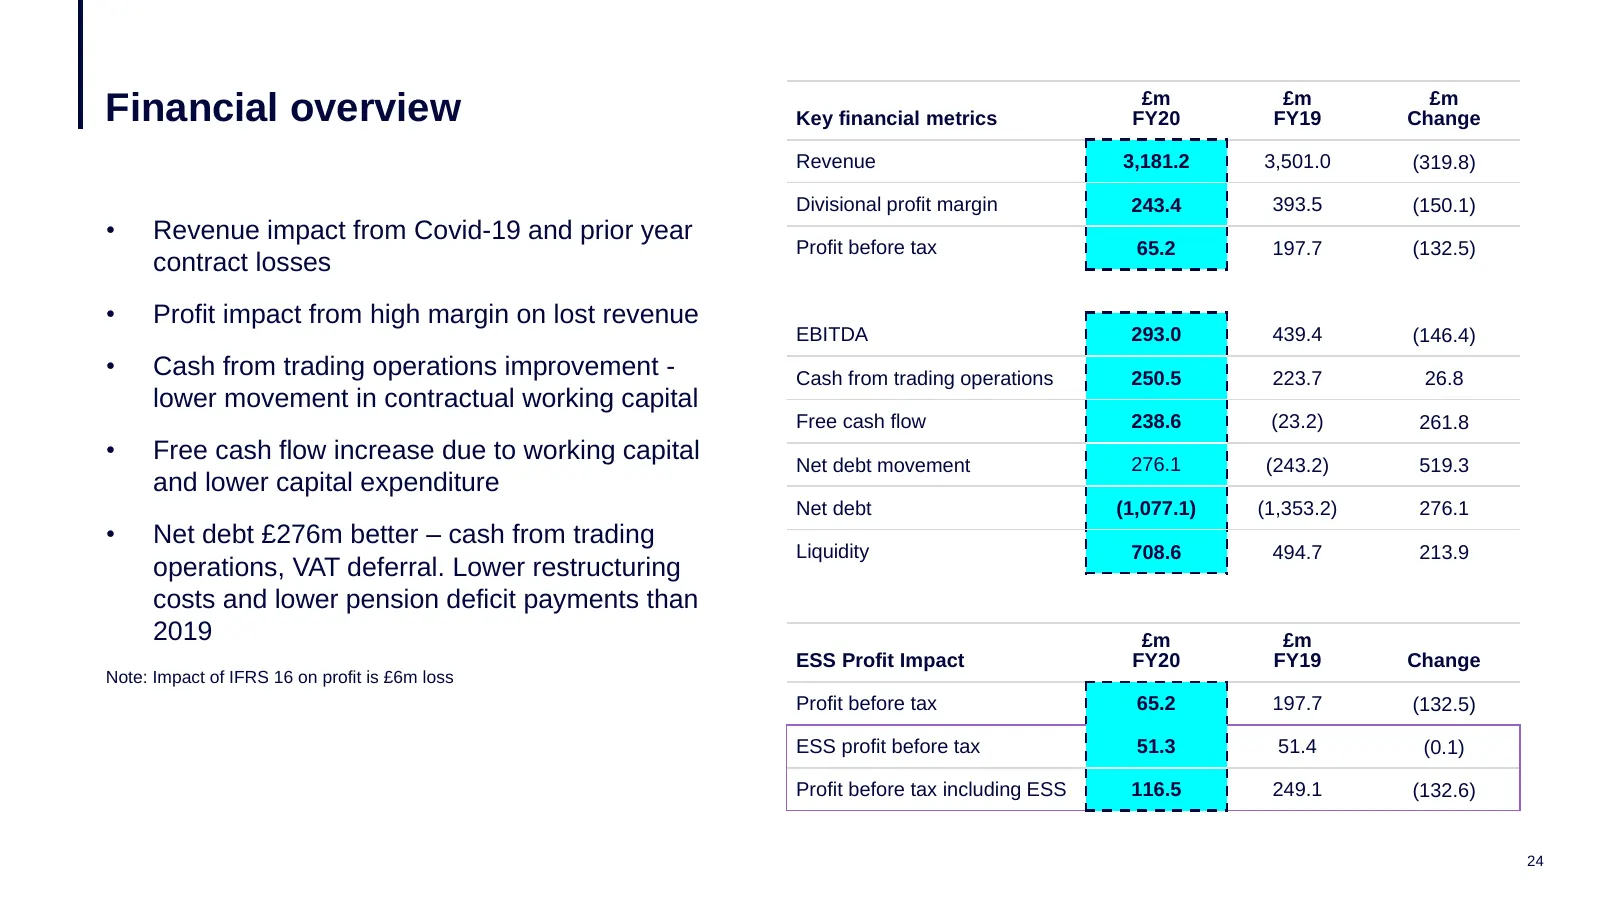
£m £m £m Financial overview Key financial metrics FY20 FY19 Change Revenue 3,181.2 3,501.0 (319.8) Divisional profit margin 243.4 393.5 (150.1) • Revenue impact from Covid-19 and prior year Profit before tax 65.2 197.7 (132.5) contract losses • Profit impact from high margin on lost revenue EBITDA 2
Slide 25: Revenue – year on year
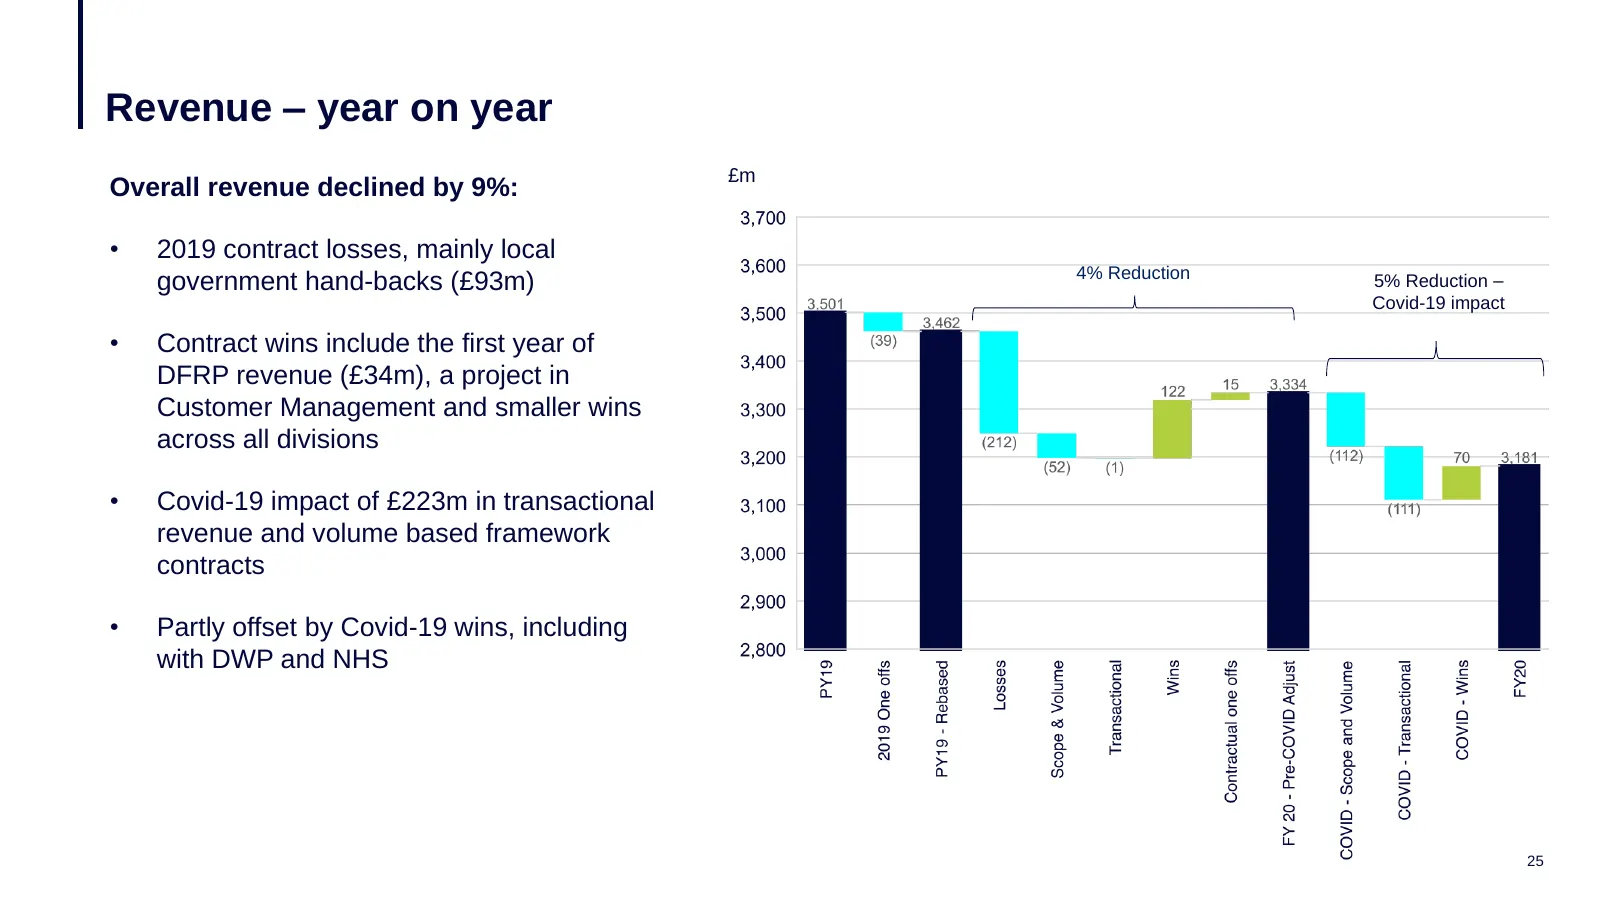
Revenue – year on year £m Overall revenue declined by 9%: • 2019 contract losses, mainly local 4% Reduction government hand-backs (£93m) 5% Reduction – Covid-19 impact • Contract wins include the first year of DFRP revenue (£34m), a project in Customer Management and smaller wins across all division
Slide 26: Cost saving
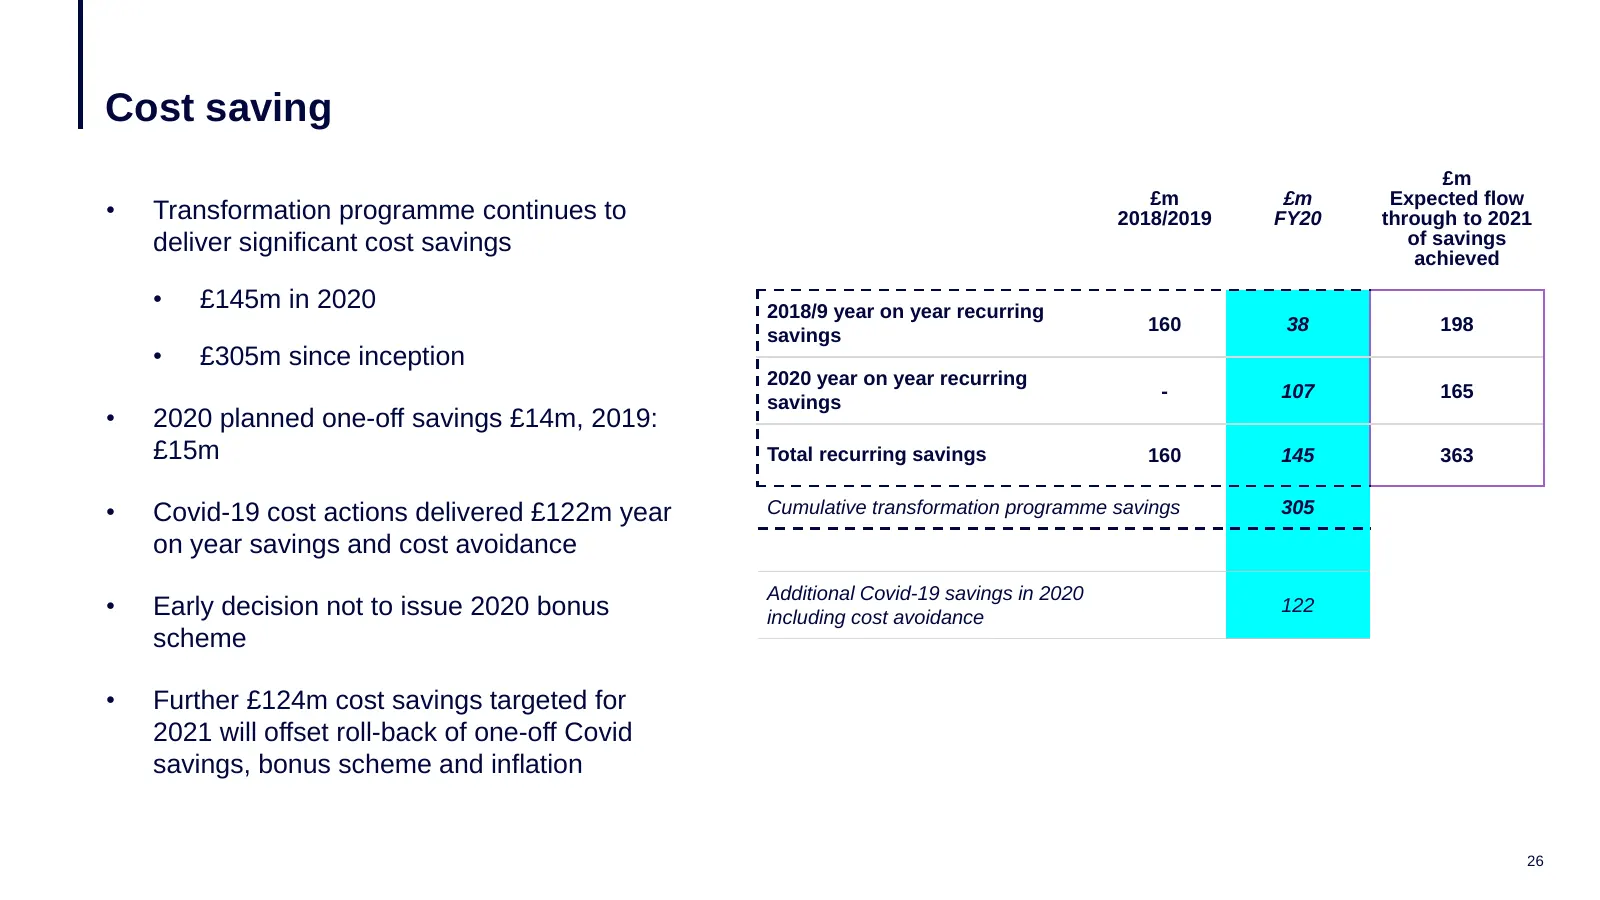
Cost saving £m £m £m Expected flow • Transformation programme continues to 2018/2019 FY20 through to 2021 deliver significant cost savings of savings achieved • £145m in 2020 2018/9 year on year recurring 160 38 198 savings • £305m since inception 2020 year on year recurring - 107 165 savings • 2020
Slide 27: Profit before tax
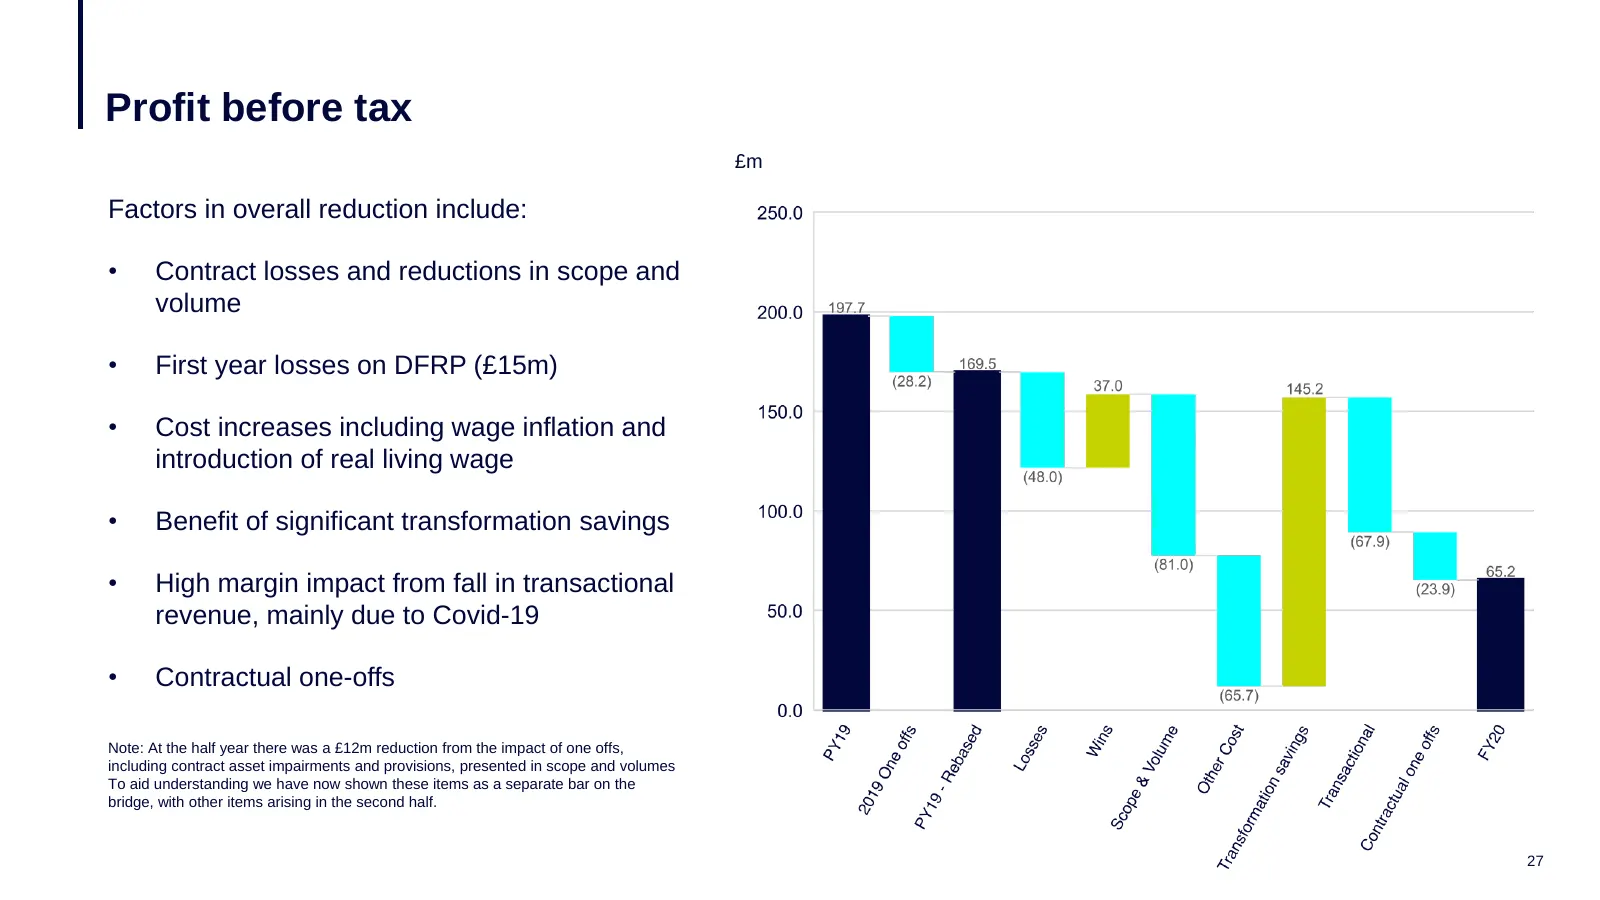
Profit before tax £m Factors in overall reduction include: • Contract losses and reductions in scope and volume • First year losses on DFRP (£15m) • Cost increases including wage inflation and introduction of real living wage • Benefit of significant transformation savings • High margin impact from
Slide 28: Group income statement summary
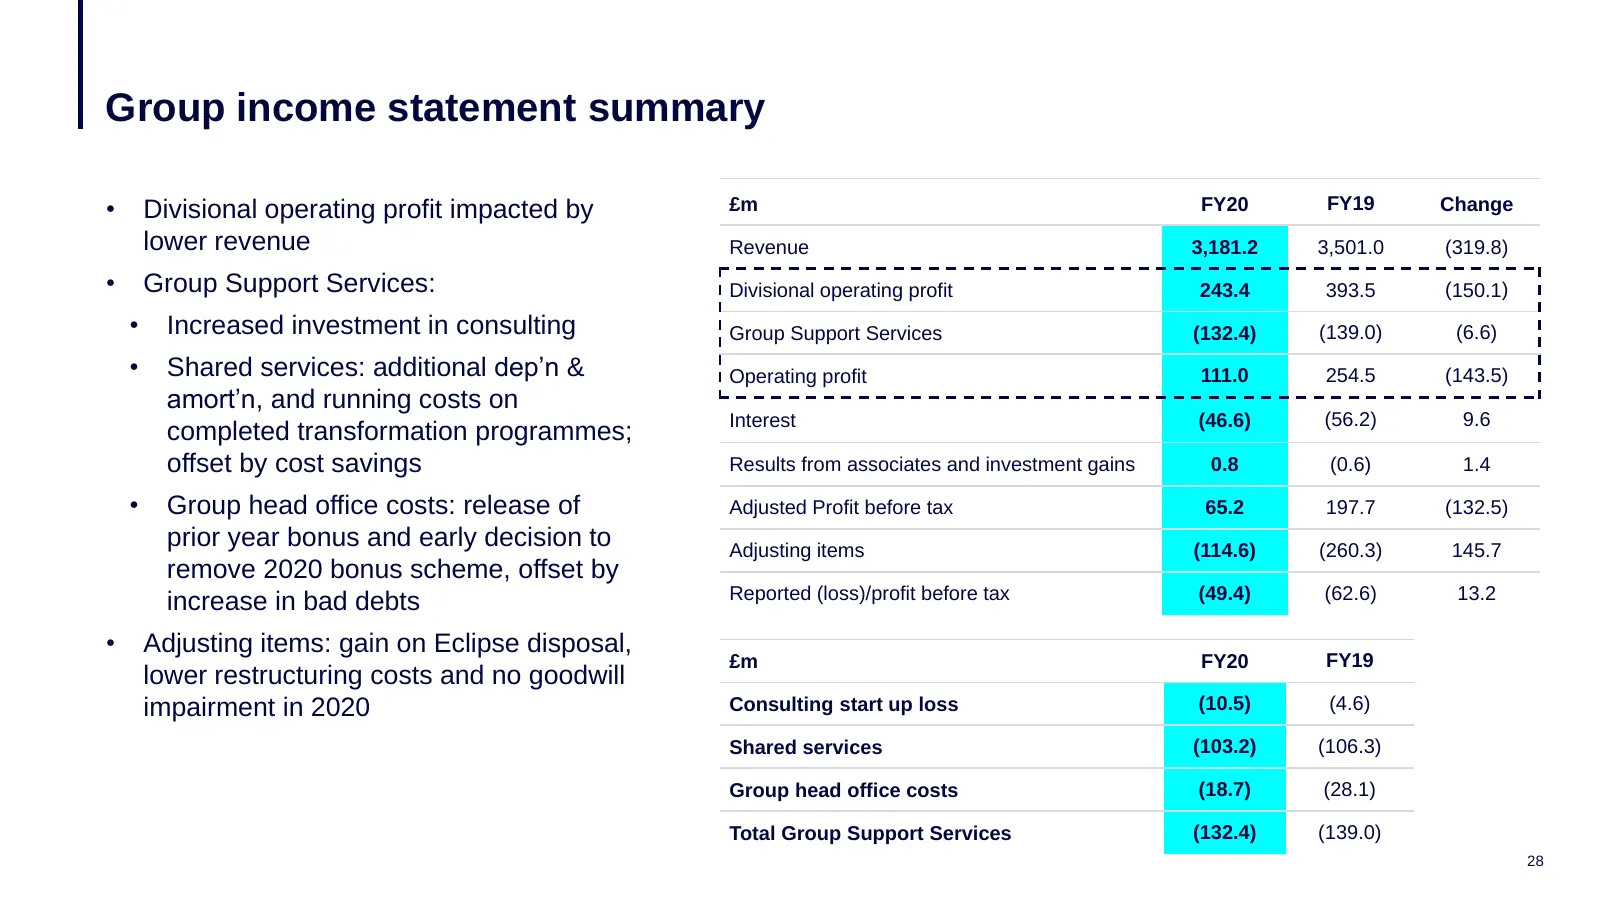
Group income statement summary • Divisional operating profit impacted by £m FY20 FY19 Change lower revenue Revenue 3,181.2 3,501.0 (319.8) • Group Support Services: Divisional operating profit 243.4 393.5 (150.1) • Increased investment in consulting Group Support Services (132.4) (139.0) (6.6) • Sha
Slide 29: Summary Financial performance by Division
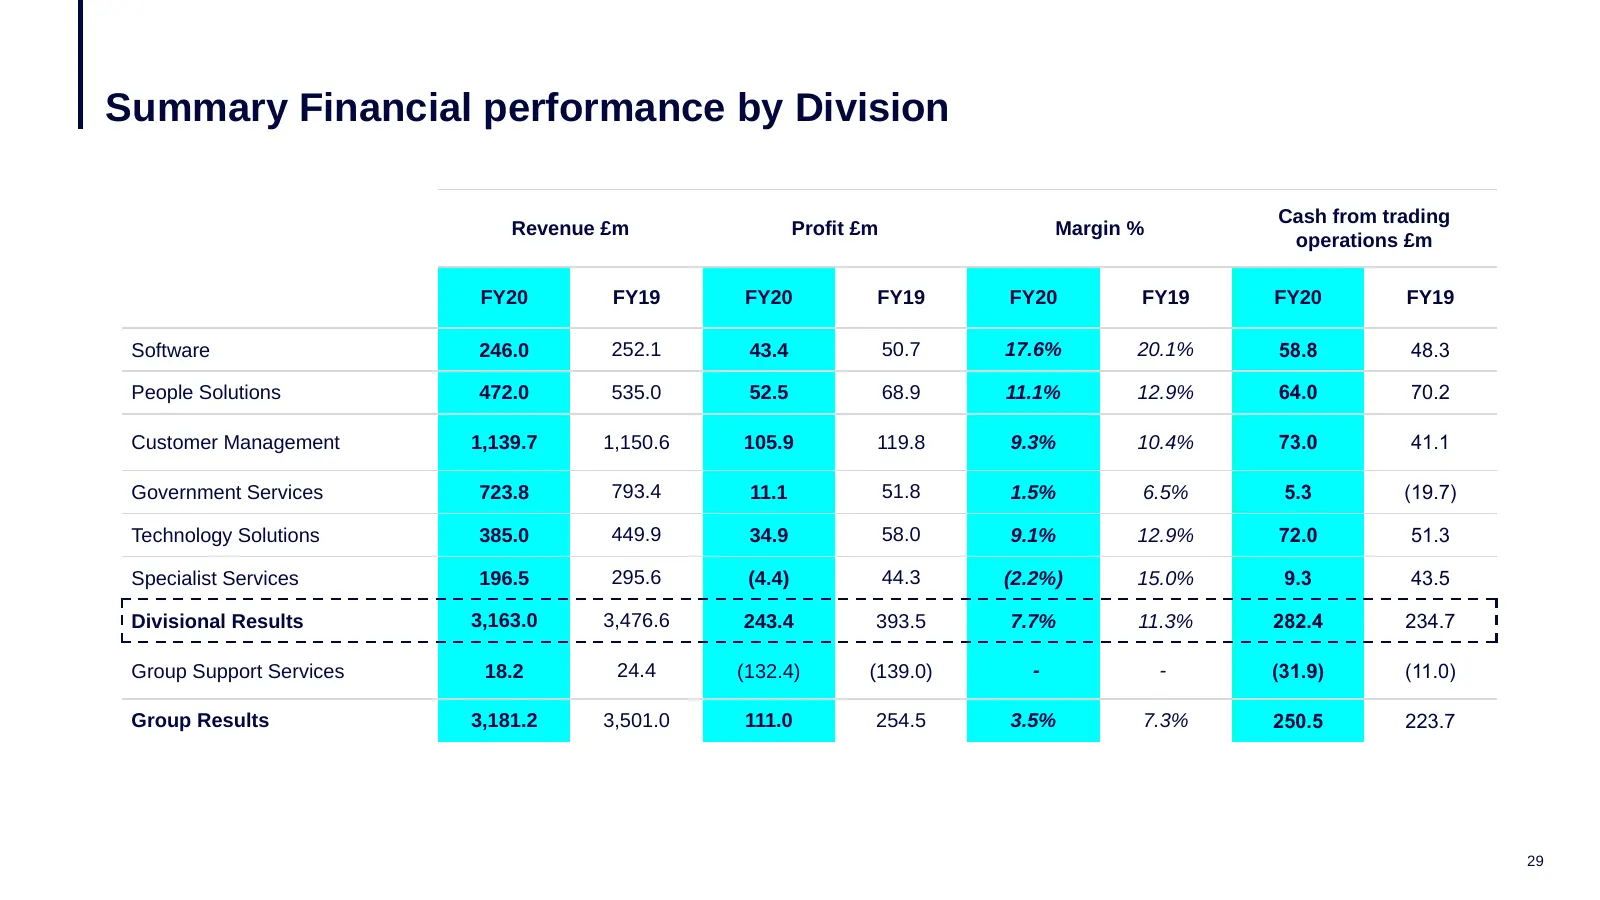
Summary Financial performance by Division Cash from trading Revenue £m Profit £m Margin % operations £m FY20 FY19 FY20 FY19 FY20 FY19 FY20 FY19 Software 246.0 252.1 43.4 50.7 17.6% 20.1% 58.8 48.3 People Solutions 472.0 535.0 52.5 68.9 11.1% 12.9% 64.0 70.2 Customer Management 1,139.7 1,150.
Slide 30: Cash flow and net debt movement
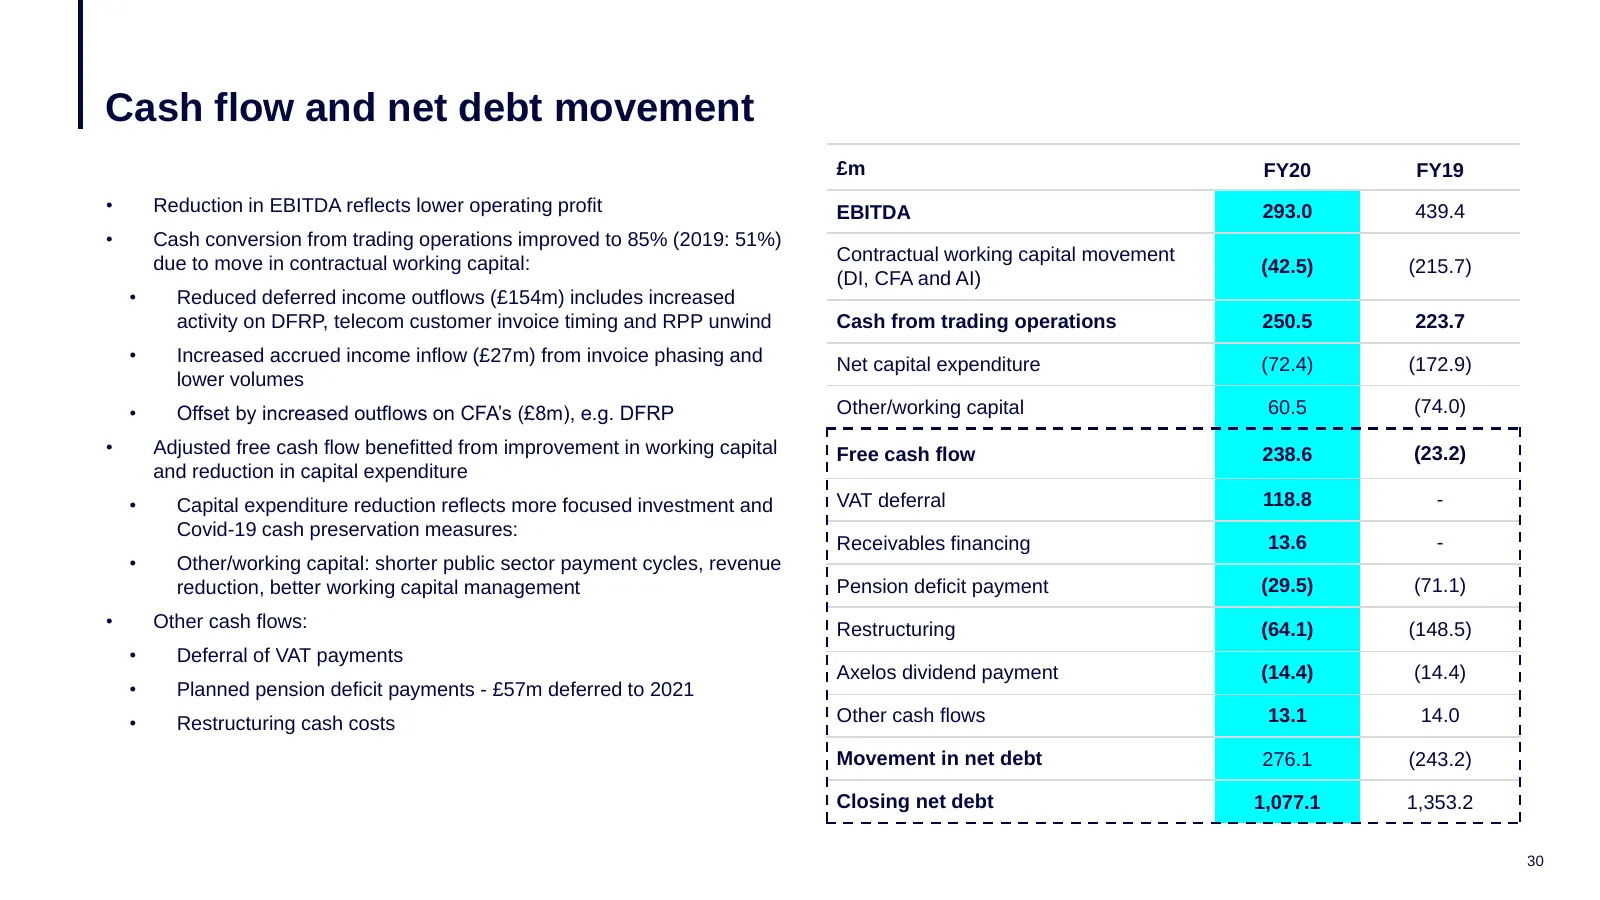
Cash flow and net debt movement £m FY20 FY19 • Reduction in EBITDA reflects lower operating profit EBITDA 293.0 439.4 • Cash conversion from trading operations improved to 85% (2019: 51%) due to move in contractual working capital: Contractual working capital movement (42.5) (215.7) (DI, CFA and AI)
Slide 31: Net debt and covenants
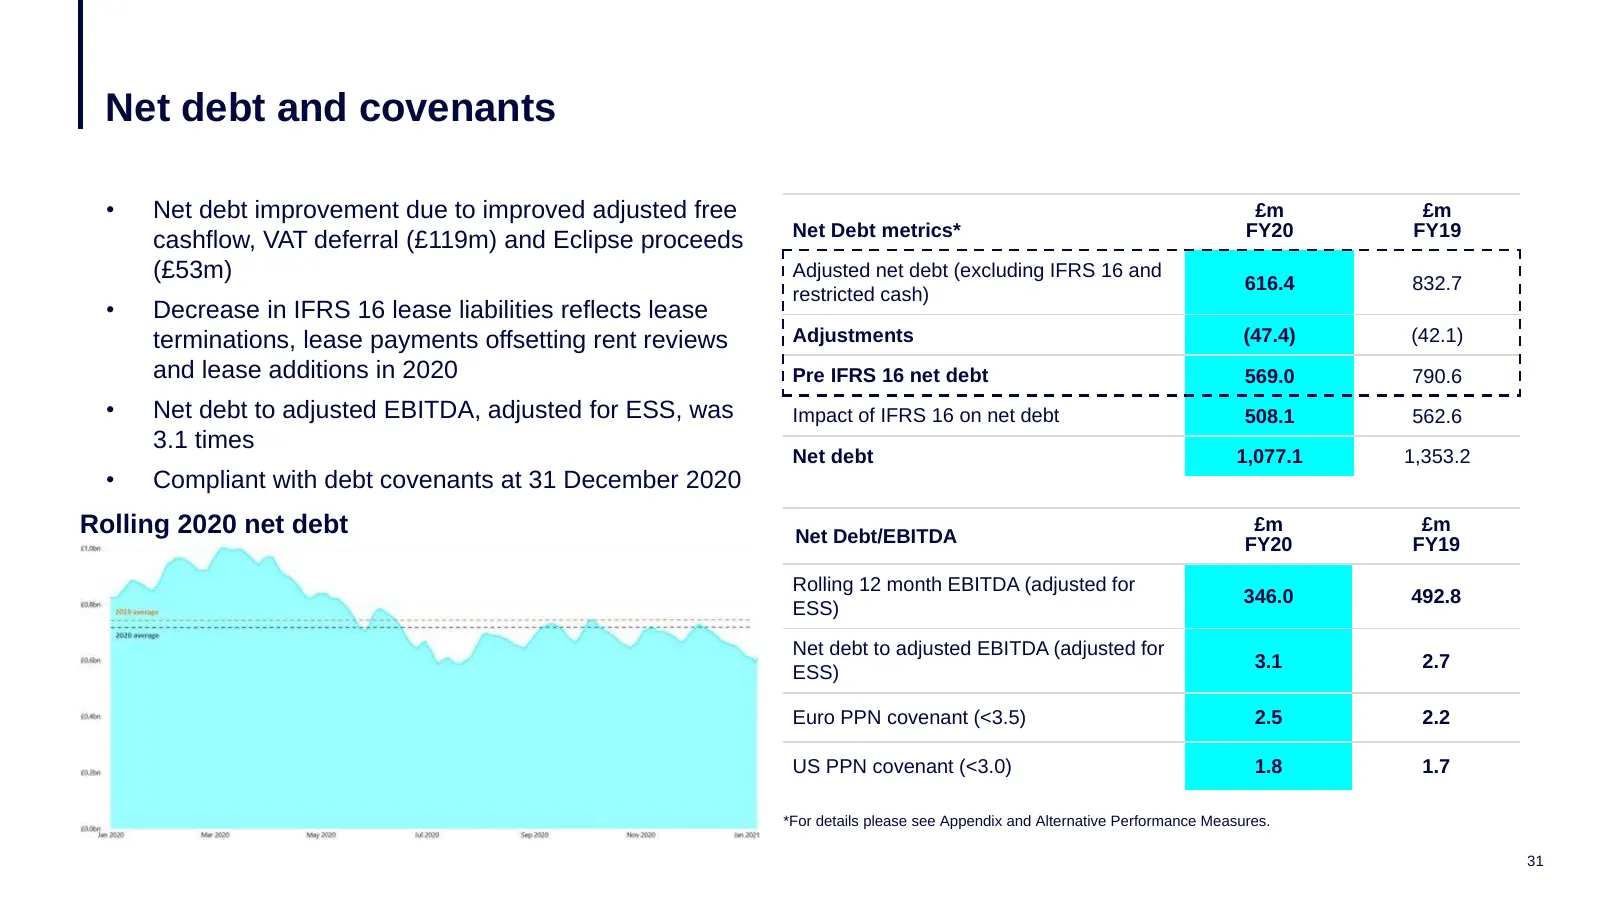
Net debt and covenants • Net debt improvement due to improved adjusted free £m £m Net Debt metrics* FY20 FY19 cashflow, VAT deferral (£119m) and Eclipse proceeds (£53m) Adjusted net debt (excluding IFRS 16 and 616.4 832.7 restricted cash) • Decrease in IFRS 16 lease liabilities reflects lease termin
Slide 32: Liquidity and debt maturities
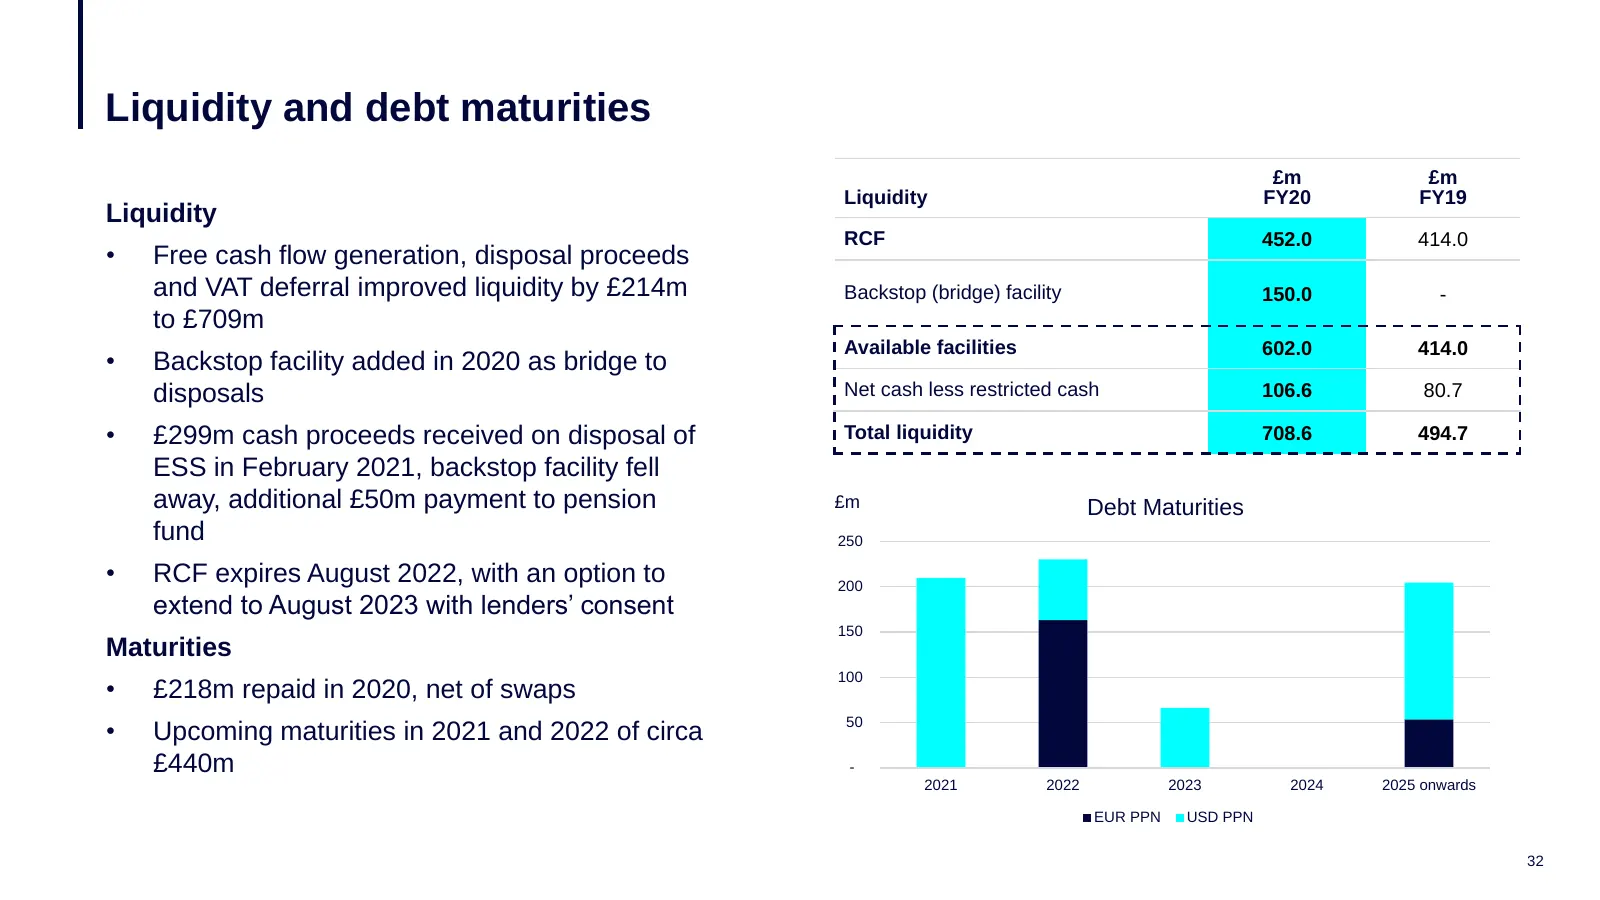
Liquidity and debt maturities £m £m Liquidity FY20 FY19 Liquidity RCF 452.0 414.0 • Free cash flow generation, disposal proceeds and VAT deferral improved liquidity by £214m Backstop (bridge) facility 150.0 - to £709m Available facilities 602.0 414.0 • Backstop facility added in 2020 as bridge to di
Slide 33: Managing our balance sheet priorities
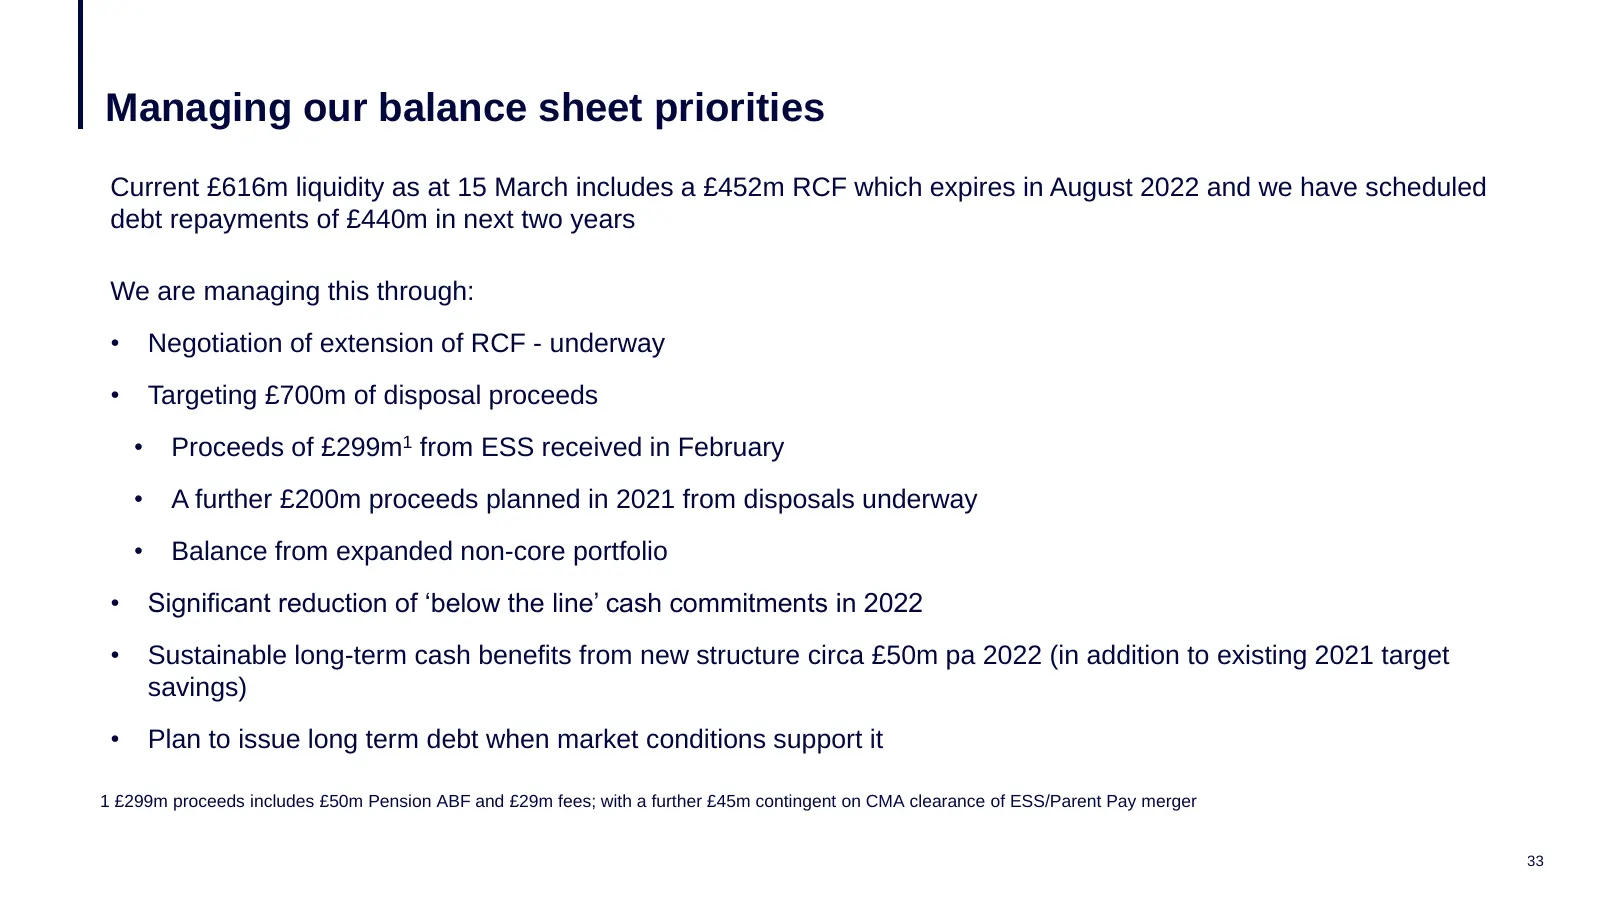
Managing our balance sheet priorities Current £616m liquidity as at 15 March includes a £452m RCF which expires in August 2022 and we have scheduled debt repayments of £440m in next two years We are managing this through: • Negotiation of extension of RCF - underway • Targeting £700m of disposal pro
Slide 34: Forward planning assumptions
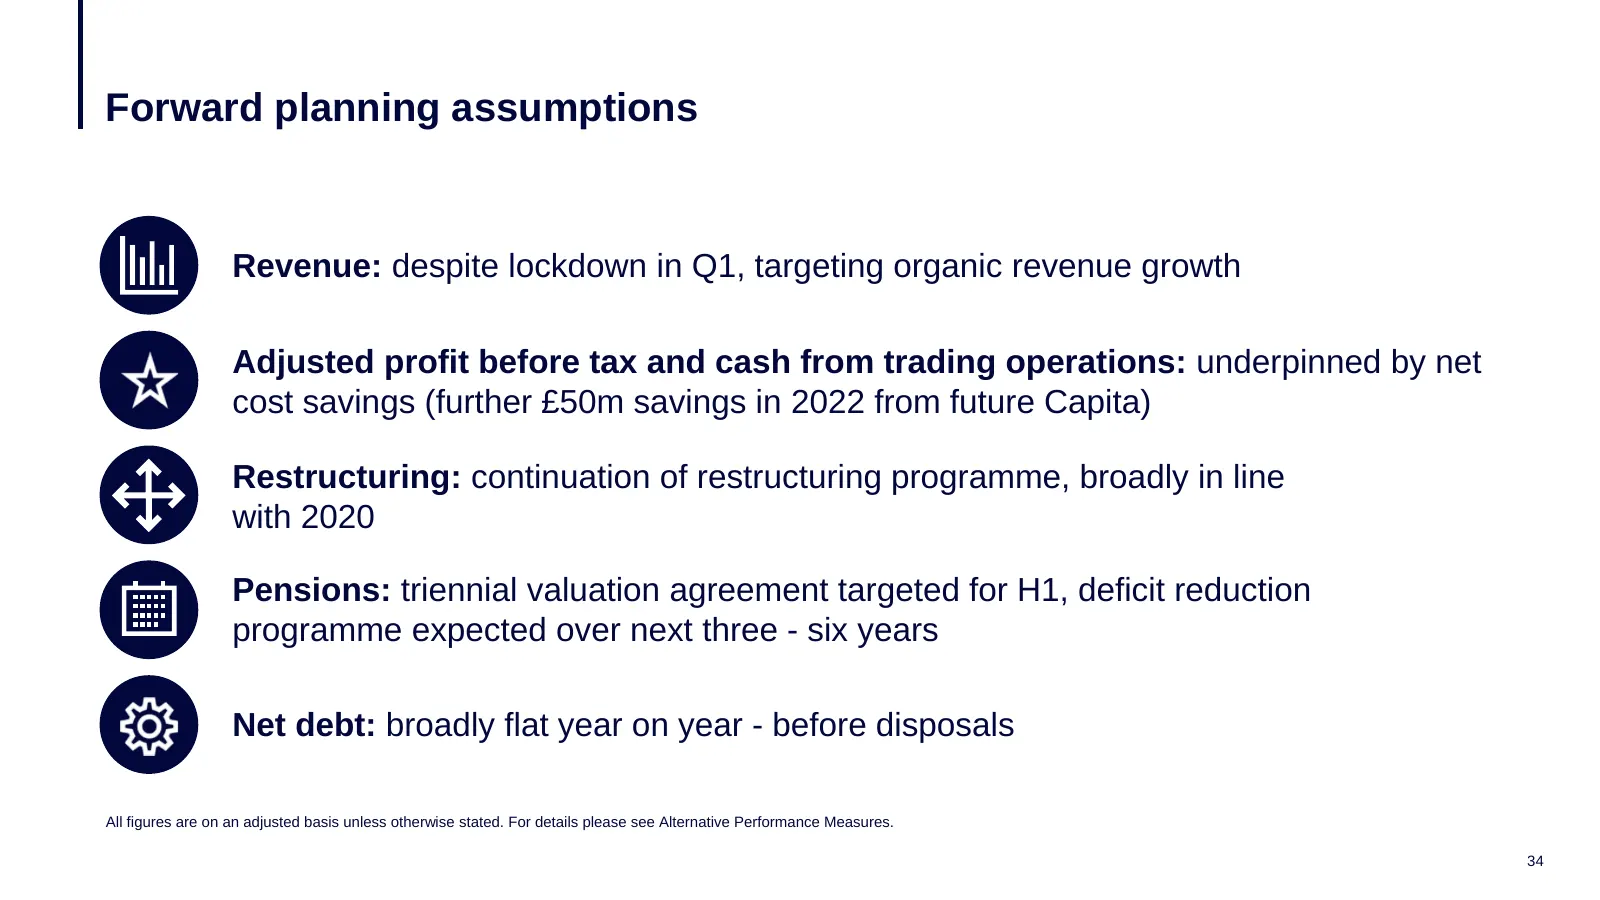
Forward planning assumptions Revenue: despite lockdown in Q1, targeting organic revenue growth Adjusted profit before tax and cash from trading operations: underpinned by net cost savings (further £50m savings in 2022 from future Capita) Restructuring: continuation of restructuring programme, broadl

Slide 35: Summary
Summary 35
Slide 36: Future Capita
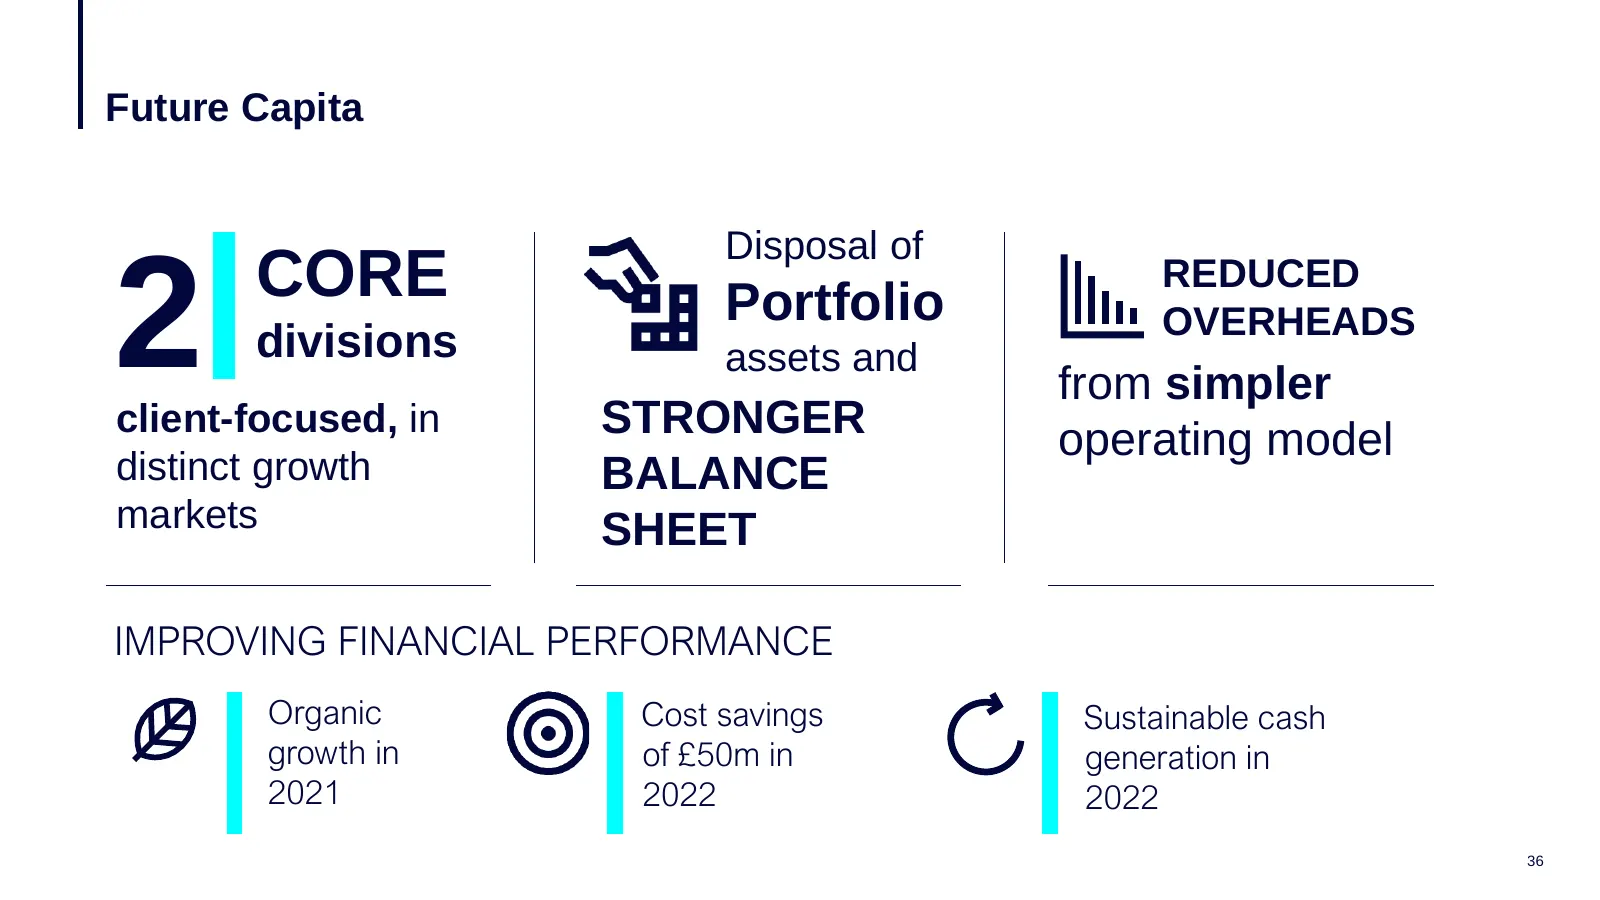
Future Capita Disposal of CORE 2 divisions client-focused, in Portfolio assets and STRONGER REDUCED OVERHEADS from simpler operating model distinct growth BALANCE markets SHEET IMPROVING FINANCIAL PERFORMANCE Organic Cost savings Sustainable cash growth in of £50m in generation in 2021 2022 2022 36

Slide 37: Q&A
Q&A 37

Slide 38: Appendix
Appendix
Slide 39: Software
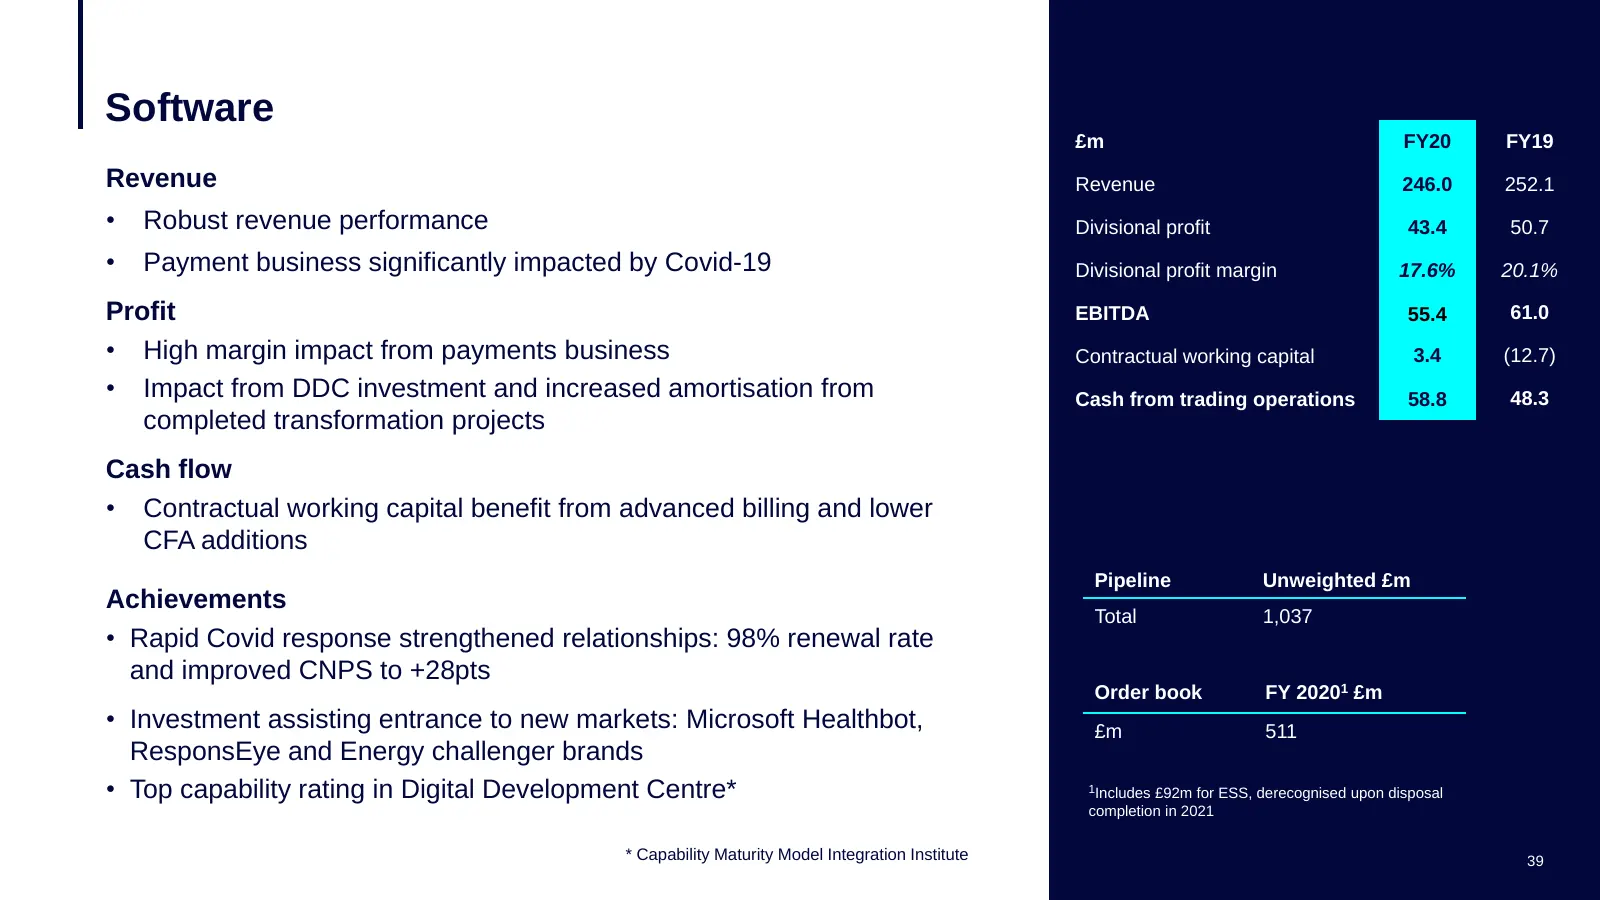
Software £m FY20 FY19 Revenue Revenue 246.0 252.1 • Robust revenue performance Divisional profit 43.4 50.7 • Payment business significantly impacted by Covid-19 Divisional profit margin 17.6% 20.1% Profit EBITDA 55.4 61.0 • High margin impact from payments business Contractual working capital 3.4 (1
Slide 40: People Solutions
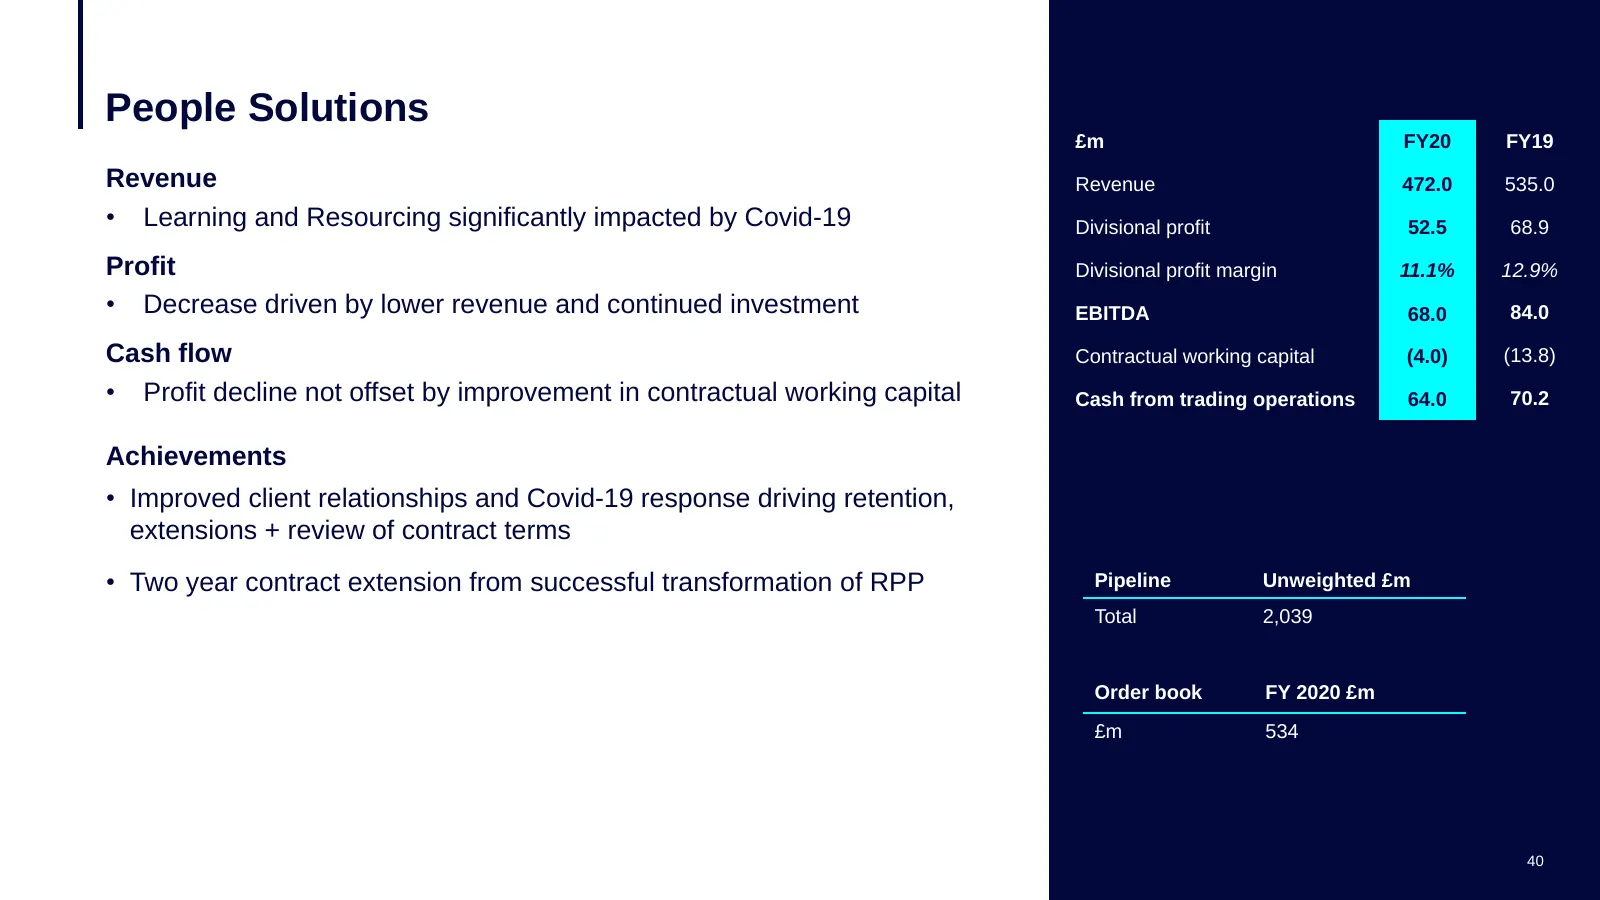
People Solutions £m FY20 FY19 Revenue Revenue 472.0 535.0 • Learning and Resourcing significantly impacted by Covid-19 Divisional profit 52.5 68.9 Profit Divisional profit margin 11.1% 12.9% • Decrease driven by lower revenue and continued investment EBITDA 68.0 84.0 Cash flow Contractual working ca
Slide 41: Customer Management
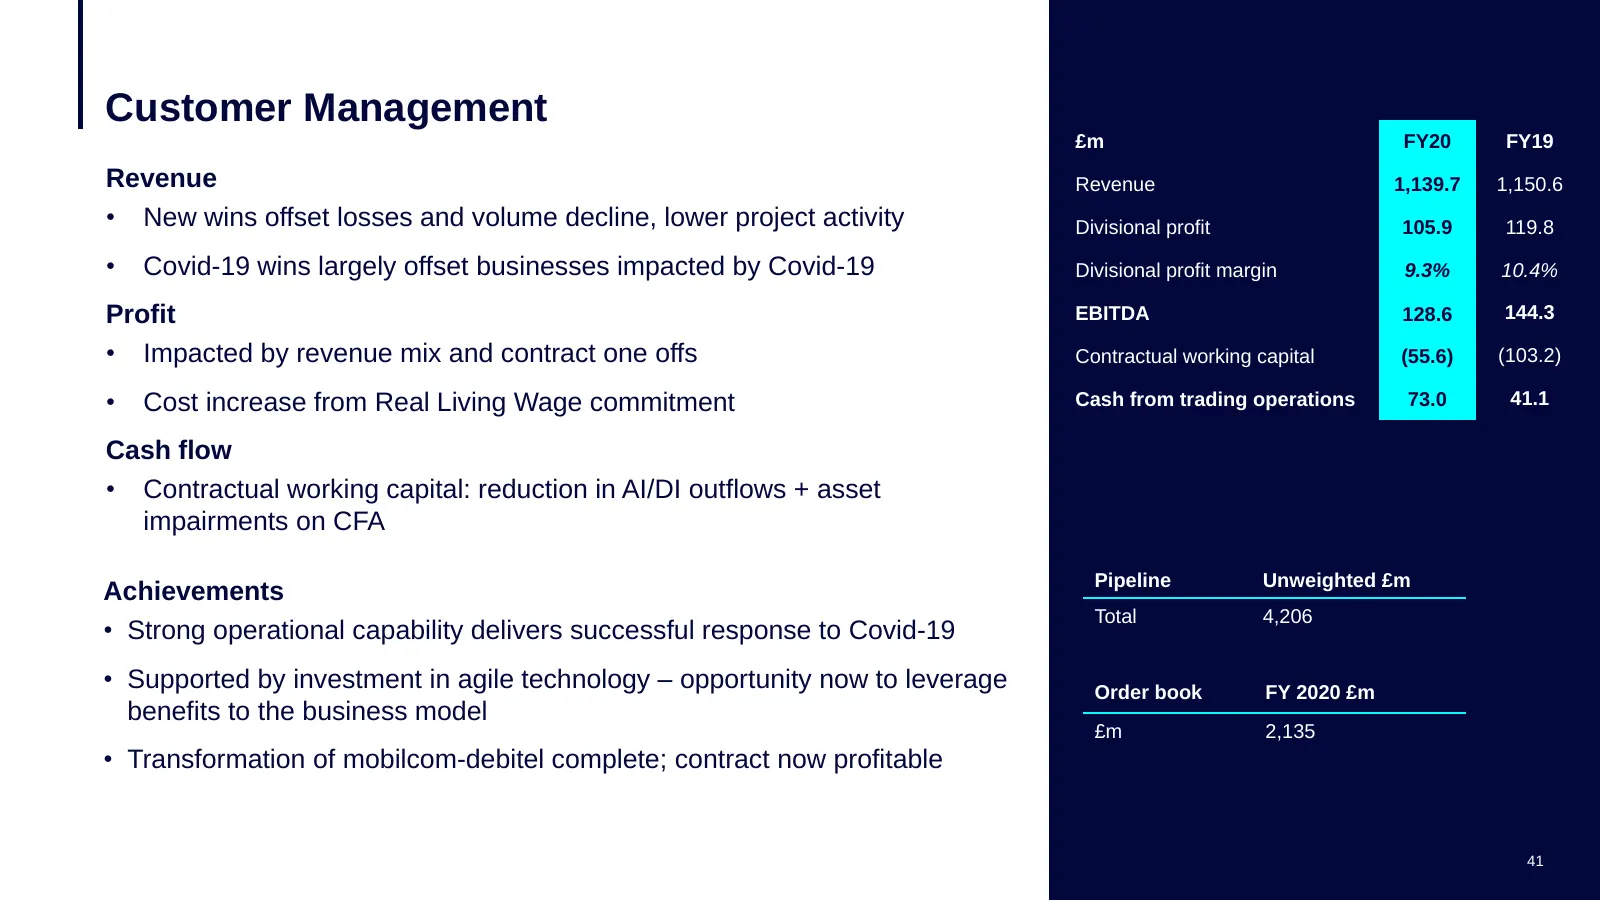
Customer Management £m FY20 FY19 Revenue Revenue 1,139.7 1,150.6 • New wins offset losses and volume decline, lower project activity Divisional profit 105.9 119.8 • Covid-19 wins largely offset businesses impacted by Covid-19 Divisional profit margin 9.3% 10.4% Profit EBITDA 128.6 144.3 • Impacted b
Slide 42: Government Services
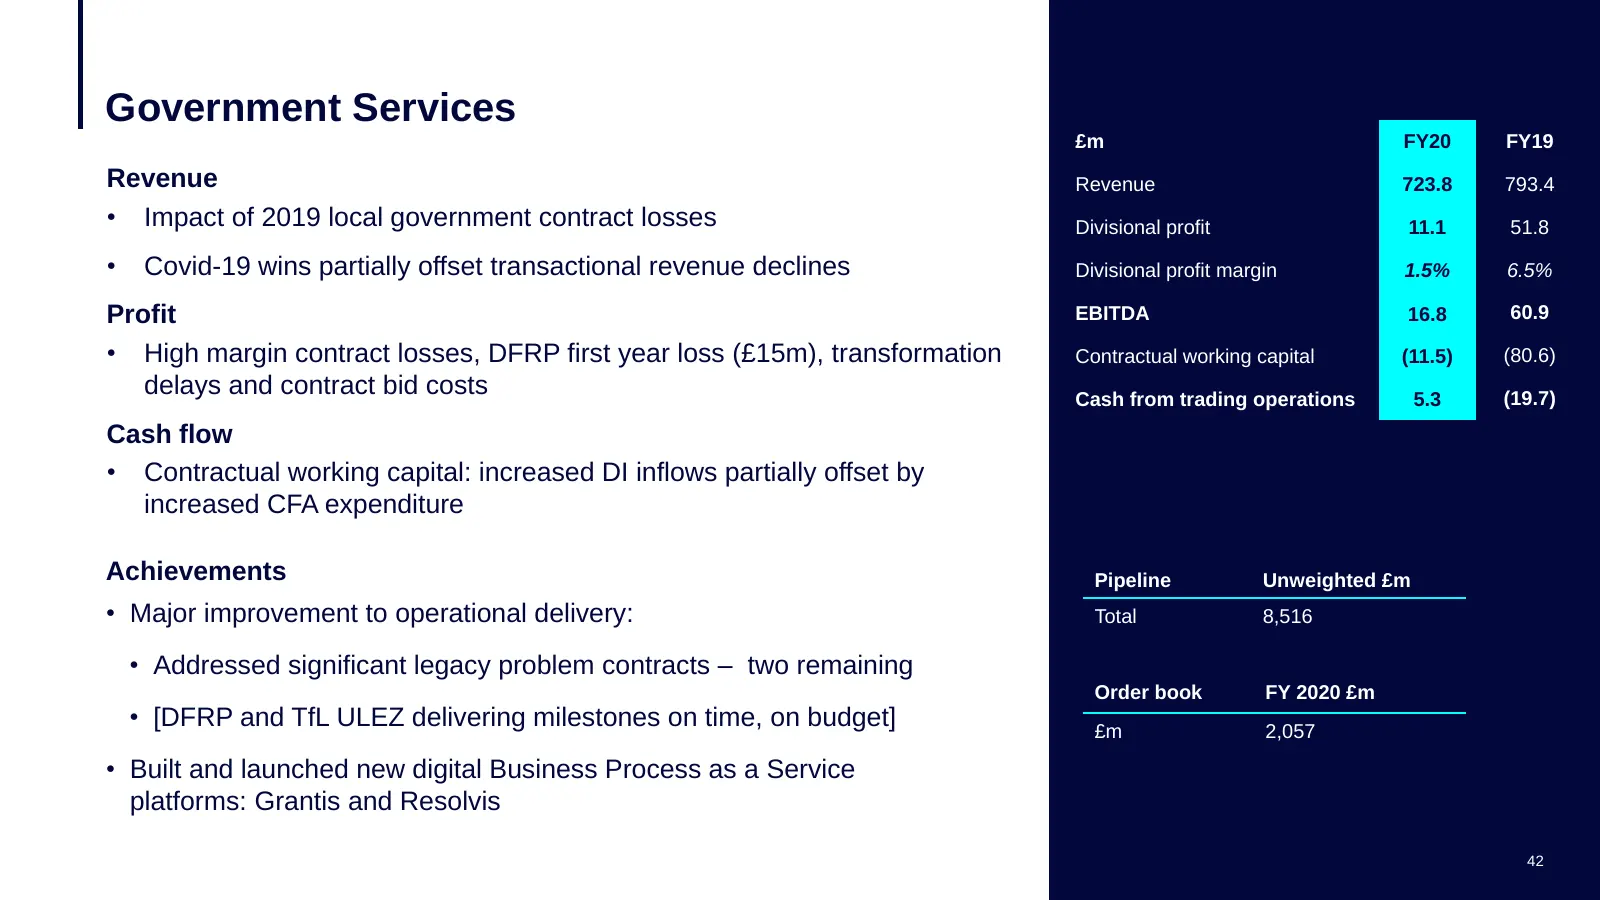
Government Services £m FY20 FY19 Revenue Revenue 723.8 793.4 • Impact of 2019 local government contract losses Divisional profit 11.1 51.8 • Covid-19 wins partially offset transactional revenue declines Divisional profit margin 1.5% 6.5% Profit EBITDA 16.8 60.9 • High margin contract losses, DFRP fi
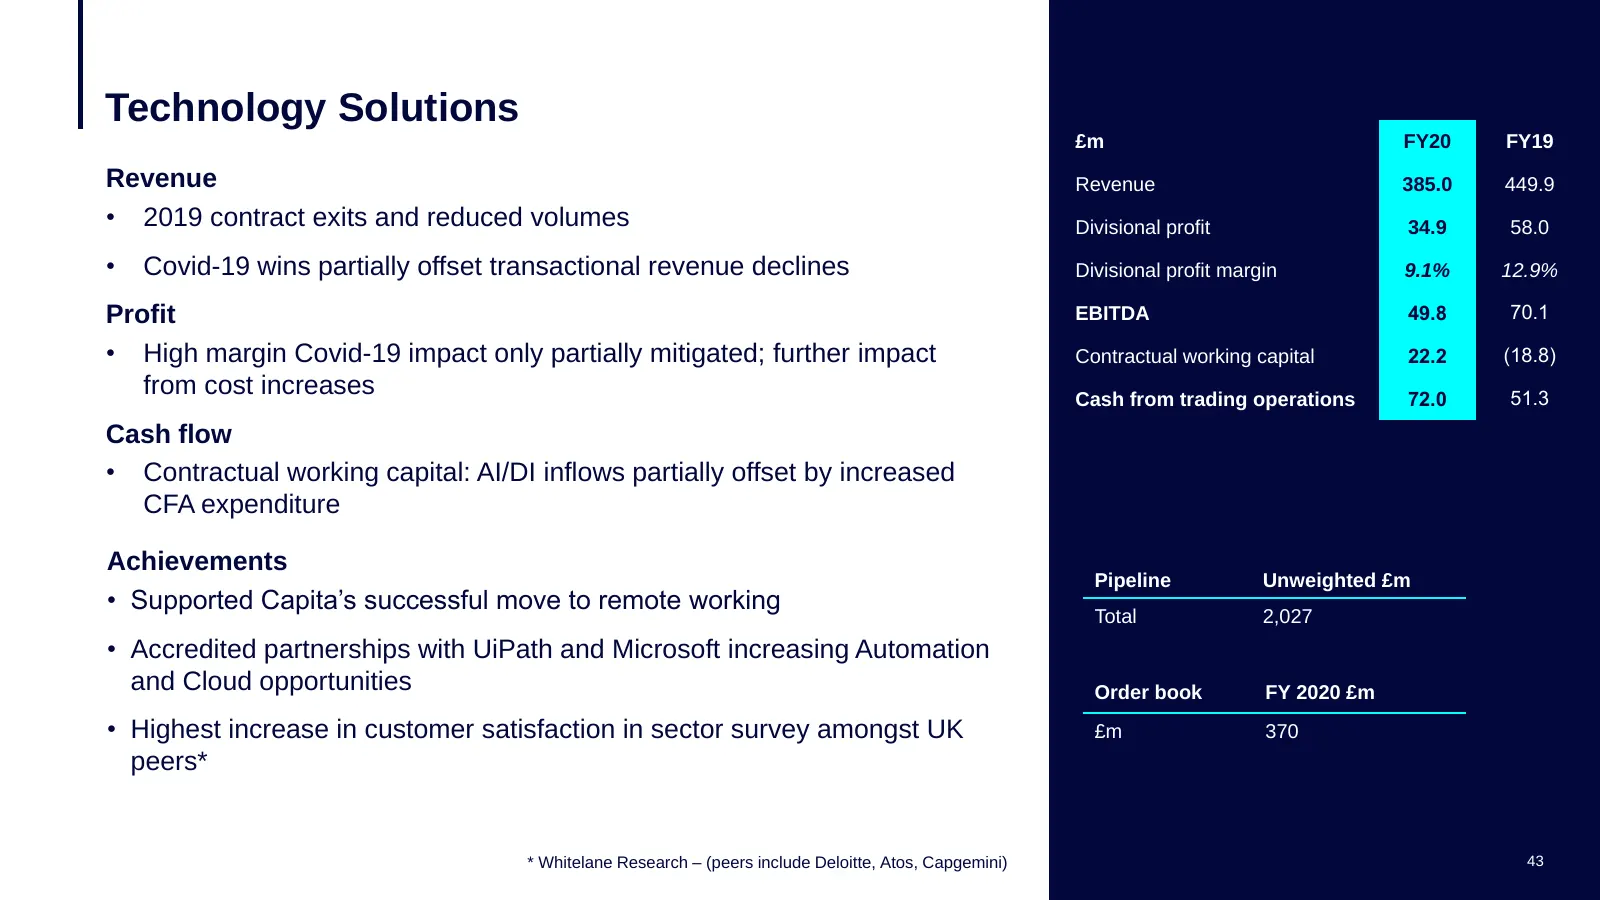
Slide 43: Technology Solutions
Technology Solutions £m FY20 FY19 Revenue Revenue 385.0 449.9 • 2019 contract exits and reduced volumes Divisional profit 34.9 58.0 • Covid-19 wins partially offset transactional revenue declines Divisional profit margin 9.1% 12.9% Profit EBITDA 49.8 70.1 • High margin Covid-19 impact only parti
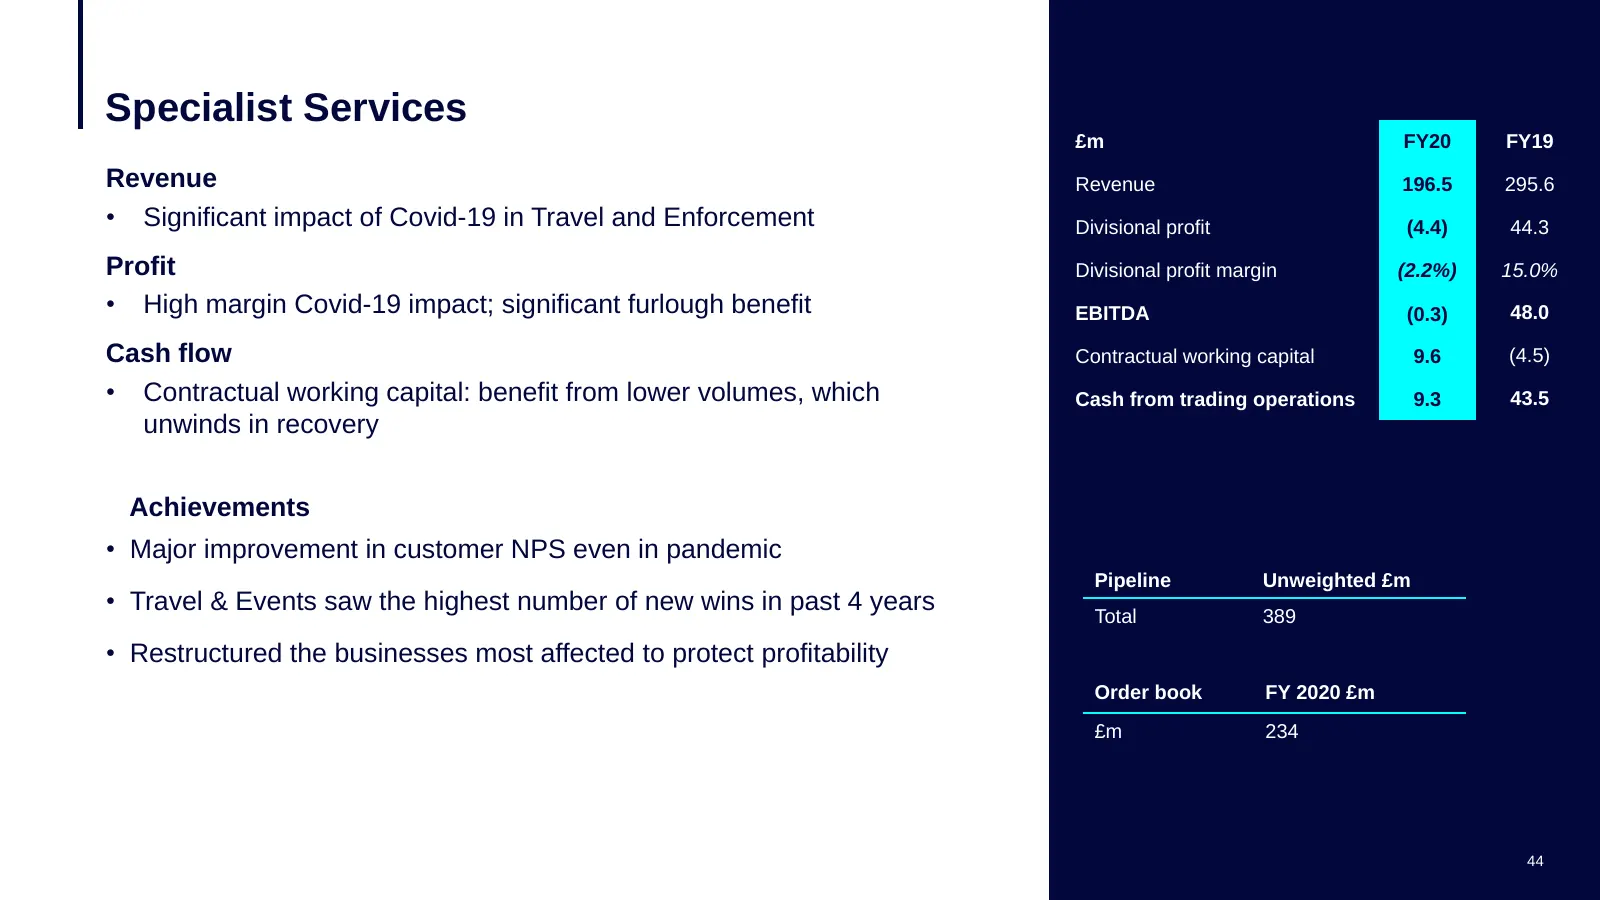
Slide 44: Specialist Services
Specialist Services £m FY20 FY19 Revenue Revenue 196.5 295.6 • Significant impact of Covid-19 in Travel and Enforcement Divisional profit (4.4) 44.3 Profit Divisional profit margin (2.2%) 15.0% • High margin Covid-19 impact; significant furlough benefit EBITDA (0.3) 48.0 Cash flow Contractual workin
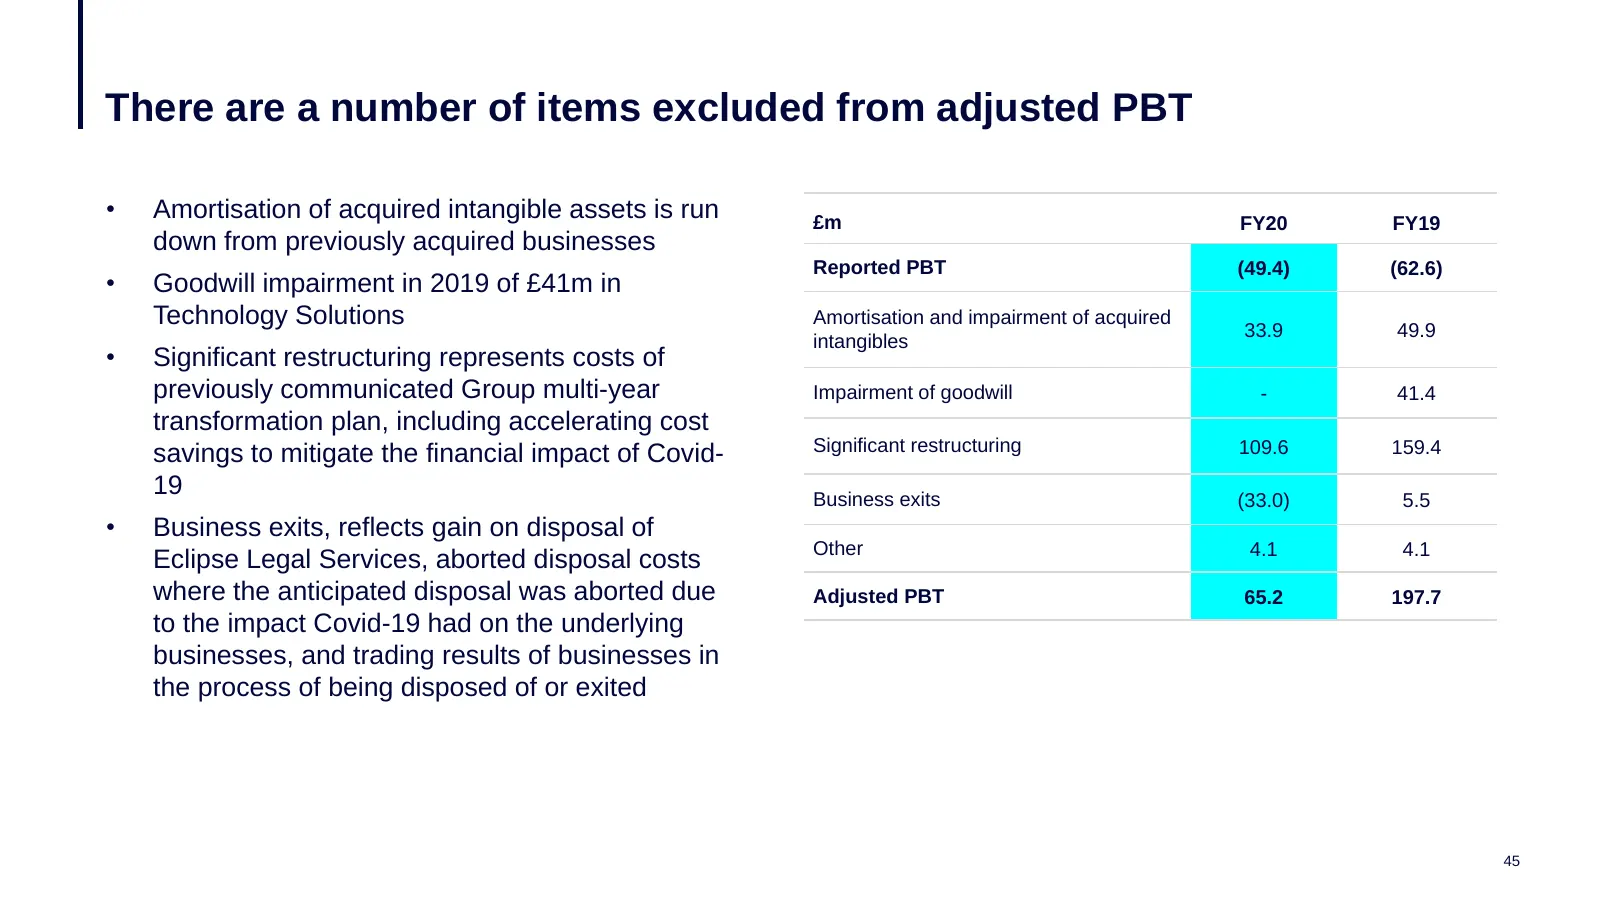
Slide 45: Items excluded from adjusted PBT
There are a number of items excluded from adjusted PBT • Amortisation of acquired intangible assets is run £m FY20 FY19 down from previously acquired businesses Reported PBT (49.4) (62.6) • Goodwill impairment in 2019 of £41m in Technology Solutions Amortisation and impairment of acquired 33.9 49.9
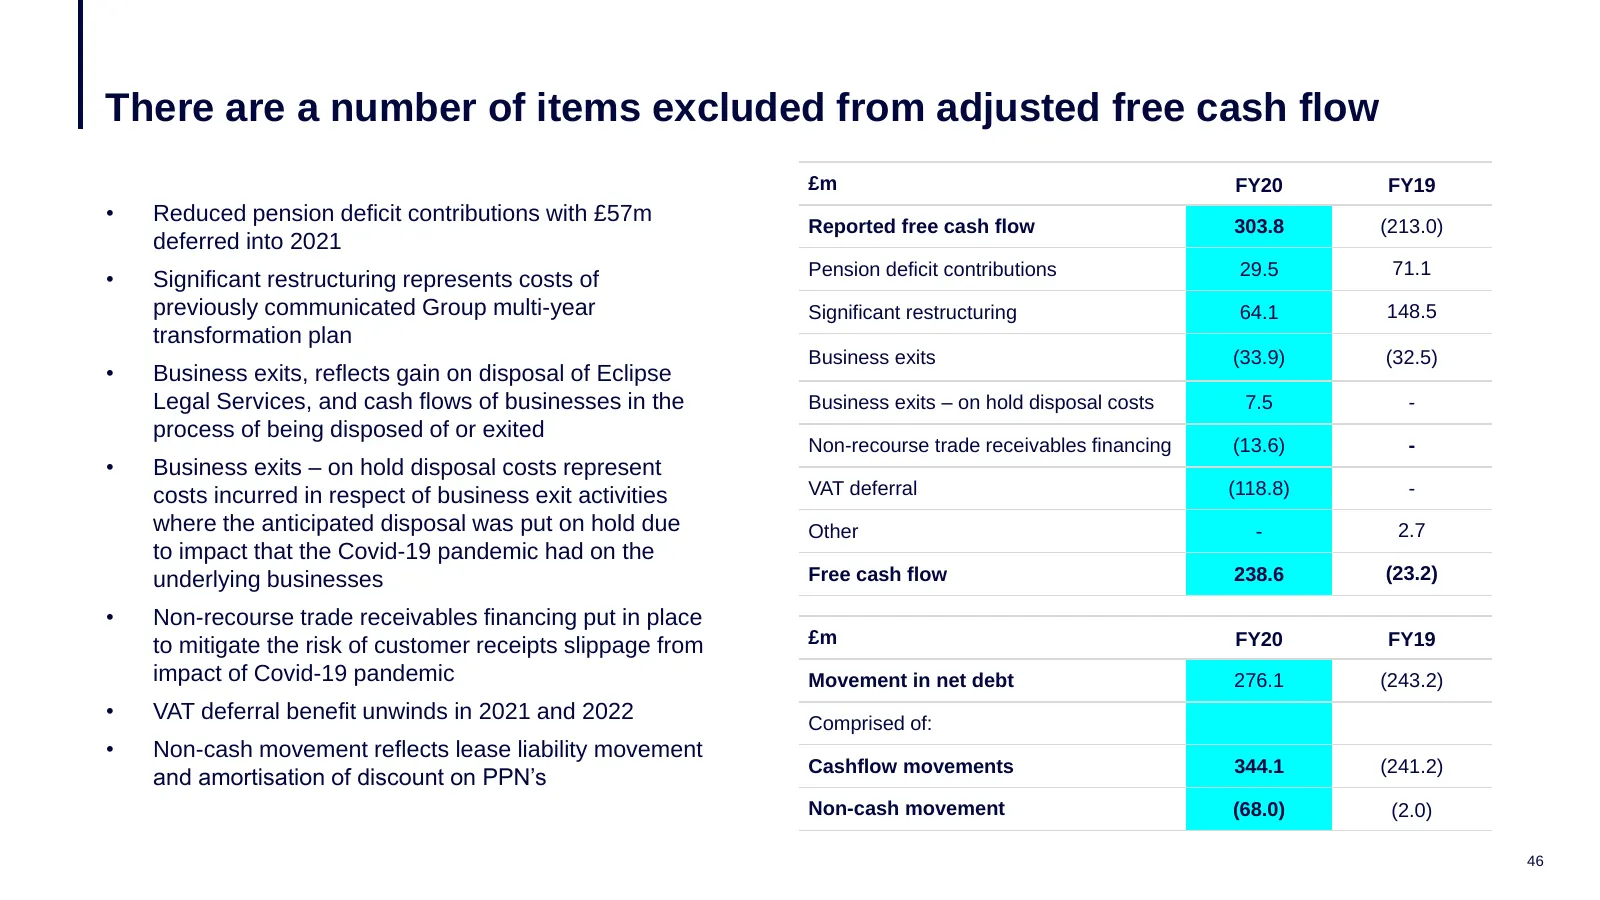
Slide 46: Items excluded from adjusted free cash flow
There are a number of items excluded from adjusted free cash flow £m FY20 FY19 • Reduced pension deficit contributions with £57m Reported free cash flow 303.8 (213.0) deferred into 2021 Pension deficit contributions 29.5 71.1 • Significant restructuring represents costs of previously communicated Gr
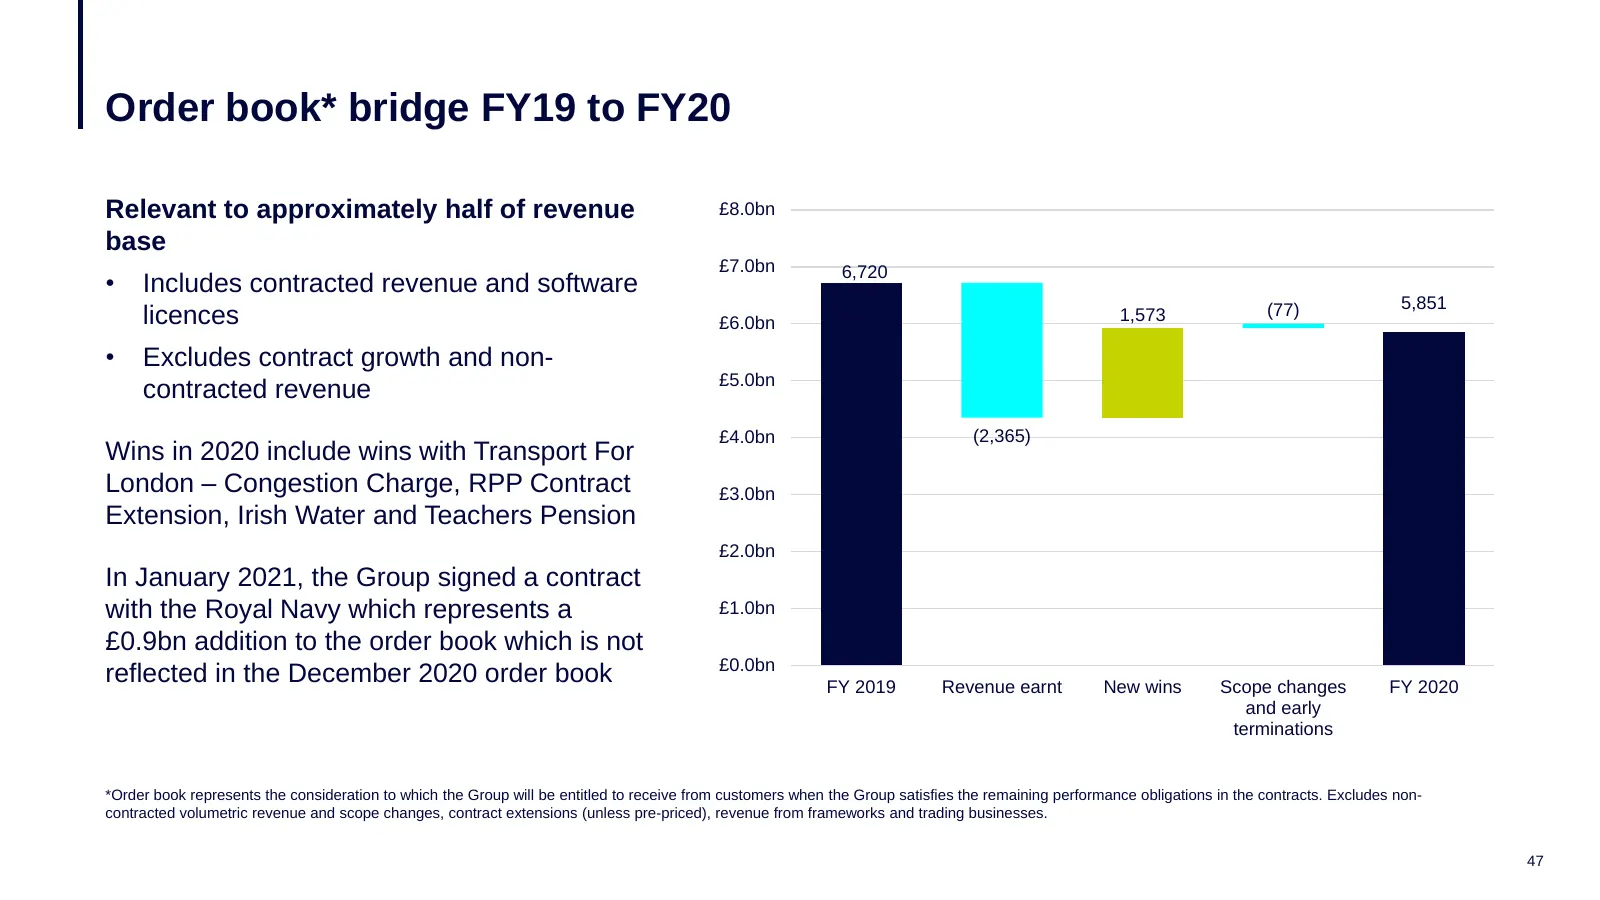
Slide 47: Order book bridge FY19 to FY20
Order book* bridge FY19 to FY20 Relevant to approximately half of revenue £8.0bn base £7.0bn 6,720 • Includes contracted revenue and software (77) 5,851 licences £6.0bn 1,573 • Excludes contract growth and non- £5.0bn contracted revenue £4.0bn (2,365) Wins in 2020 include wins with Transport For Lon
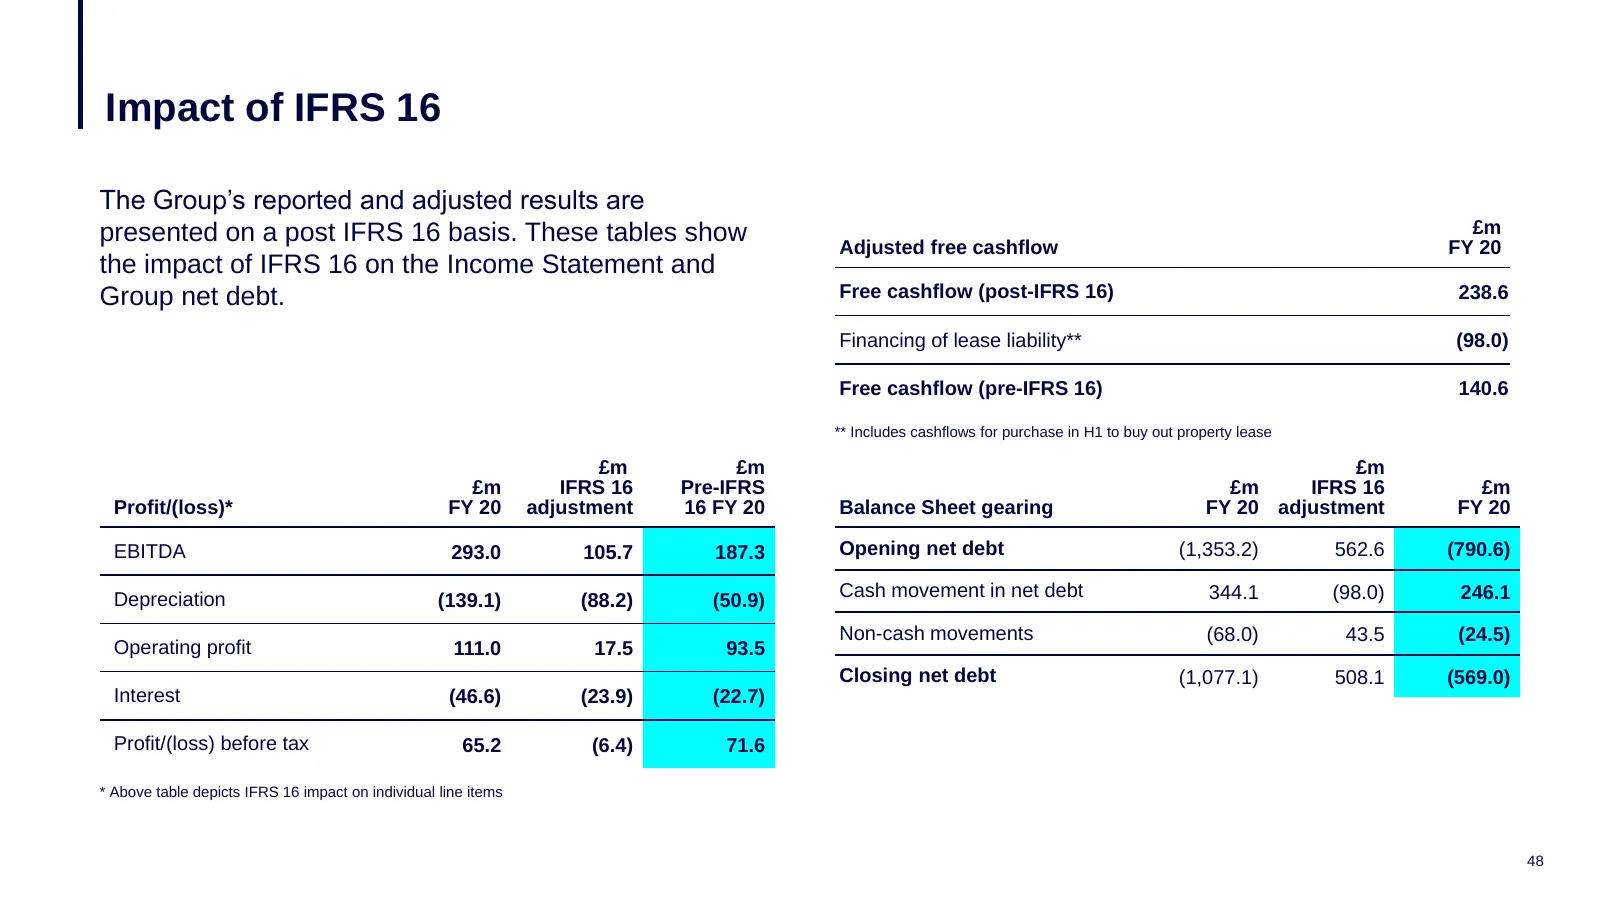
Slide 48: Impact of IFRS 16
Impact of IFRS 16 The Group’s reported and adjusted results are presented on a post IFRS 16 basis. These tables show £m Adjusted free cashflow FY 20 the impact of IFRS 16 on the Income Statement and Group net debt. Free cashflow (post-IFRS 16) 238.6 Financing of lease liability** (98.0) Free cashflo
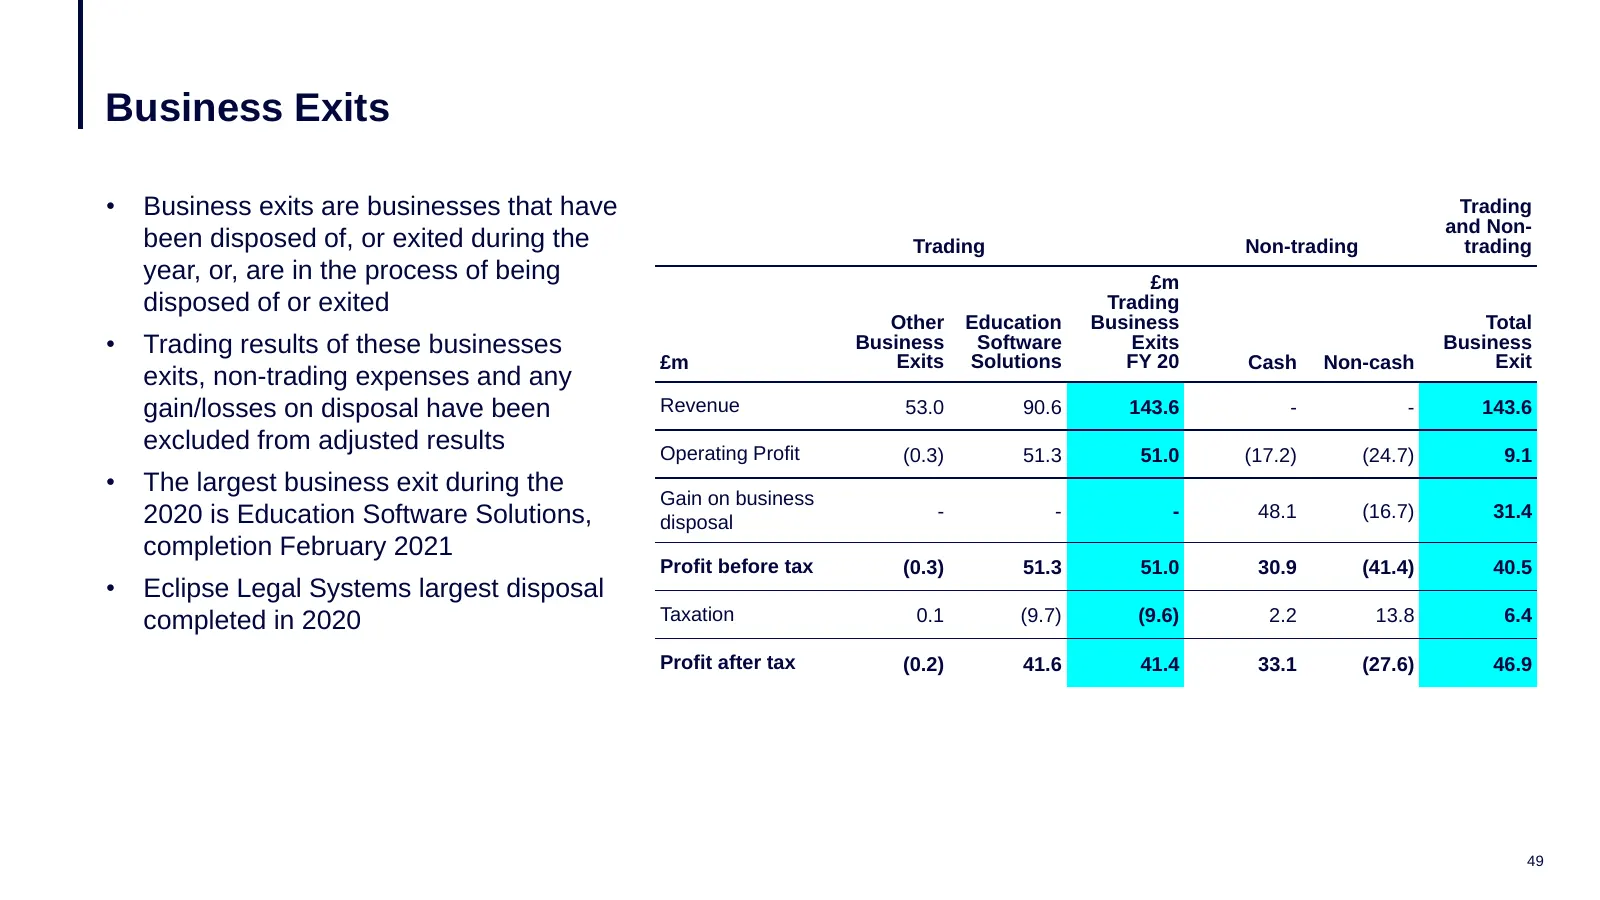
Slide 49: Business Exits
Business Exits • Business exits are businesses that have Trading and Non- been disposed of, or exited during the Trading Non-trading trading year, or, are in the process of being £m disposed of or exited Trading Other Education Business Total • Trading results of these businesses Business Software E
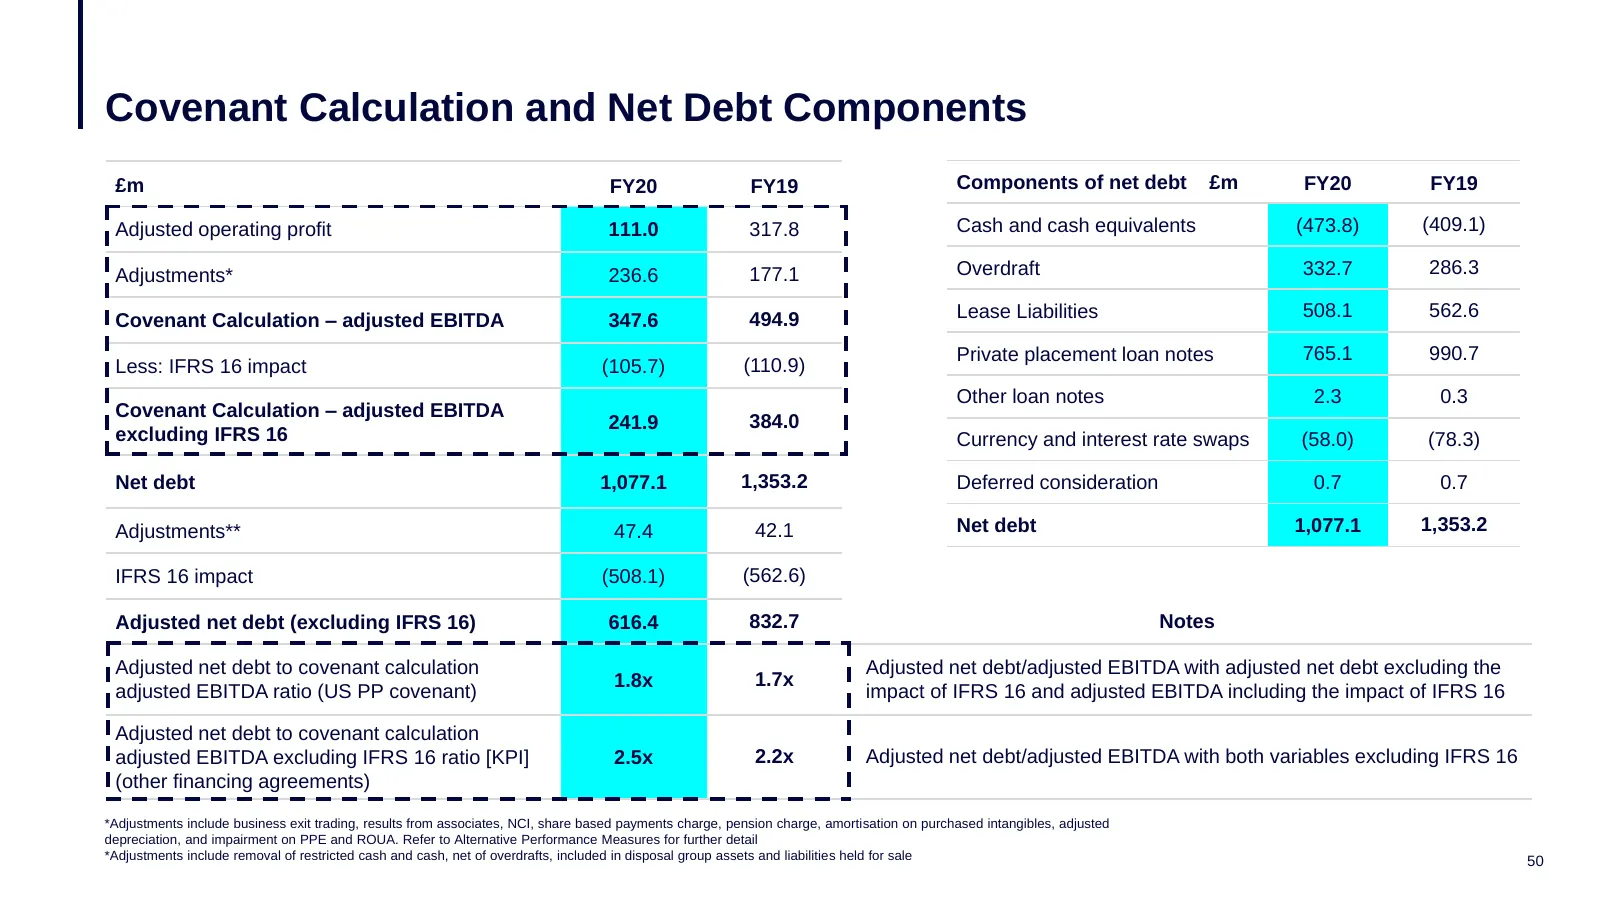
Slide 50: Covenant Calculation and Net Debt Components
Covenant Calculation and Net Debt Components £m FY20 FY19 Components of net debt £m FY20 FY19 Adjusted operating profit 111.0 317.8 Cash and cash equivalents (473.8) (409.1) Adjustments* 236.6 177.1 Overdraft 332.7 286.3 Lease Liabilities 508.1 562.6 Covenant Calculation – adjusted EBITDA 347.6 494.
Slide 51: Key Covid-19 cost and cash actions
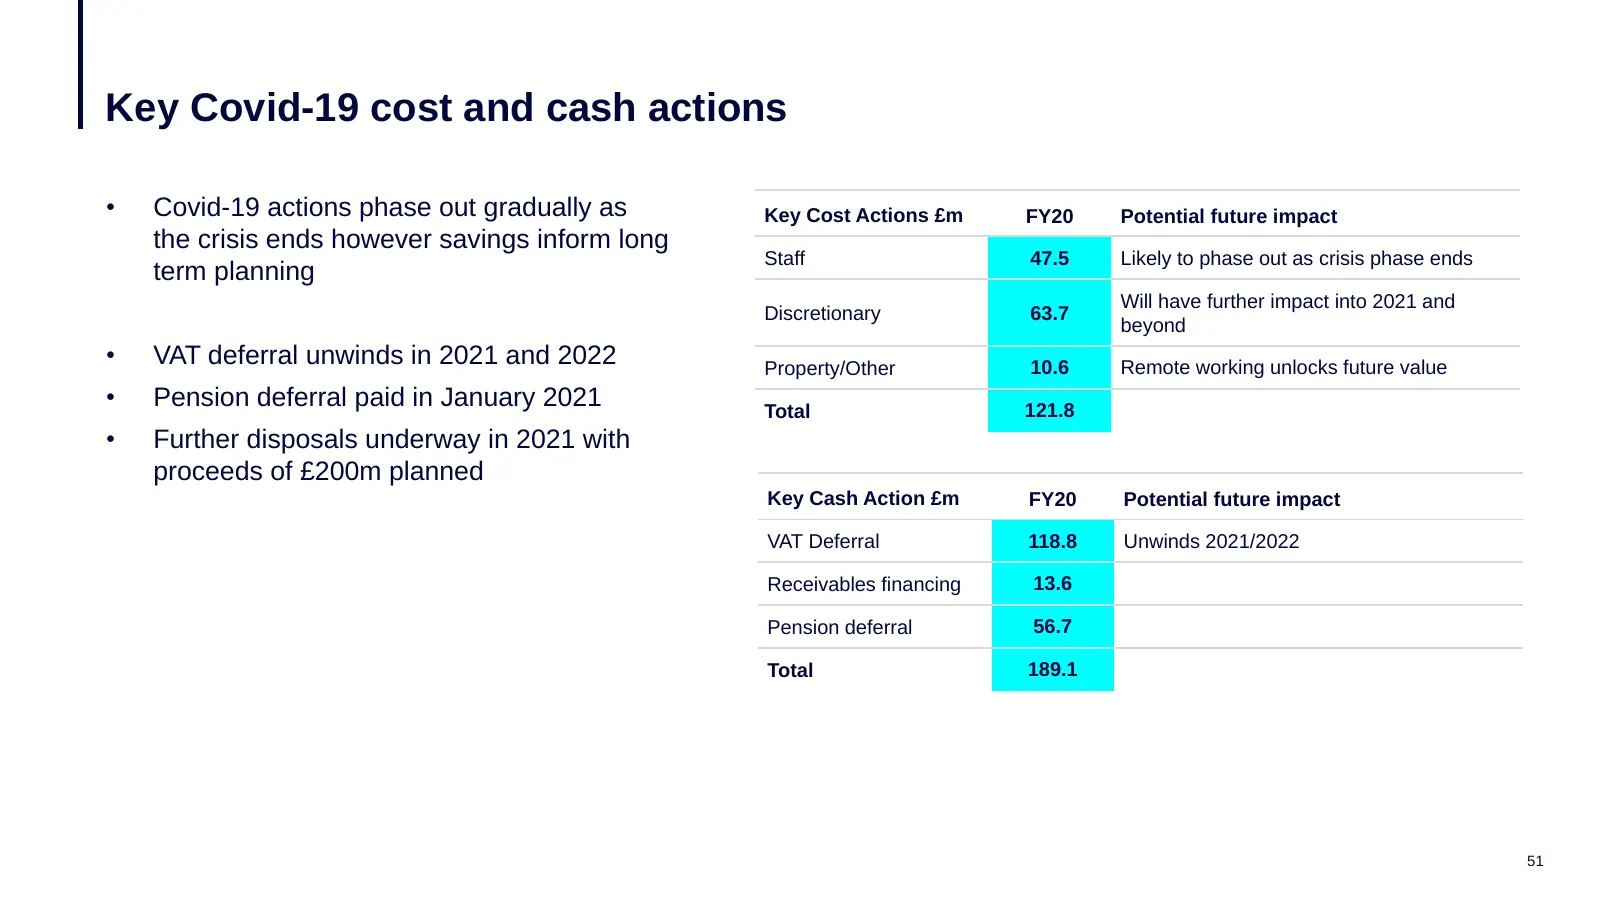
Key Covid-19 cost and cash actions • Covid-19 actions phase out gradually as Key Cost Actions £m FY20 Potential future impact the crisis ends however savings inform long Staff 47.5 Likely to phase out as crisis phase ends term planning Will have further impact into 2021 and Discretionary 63.7 beyond
Slide 52: Definitions
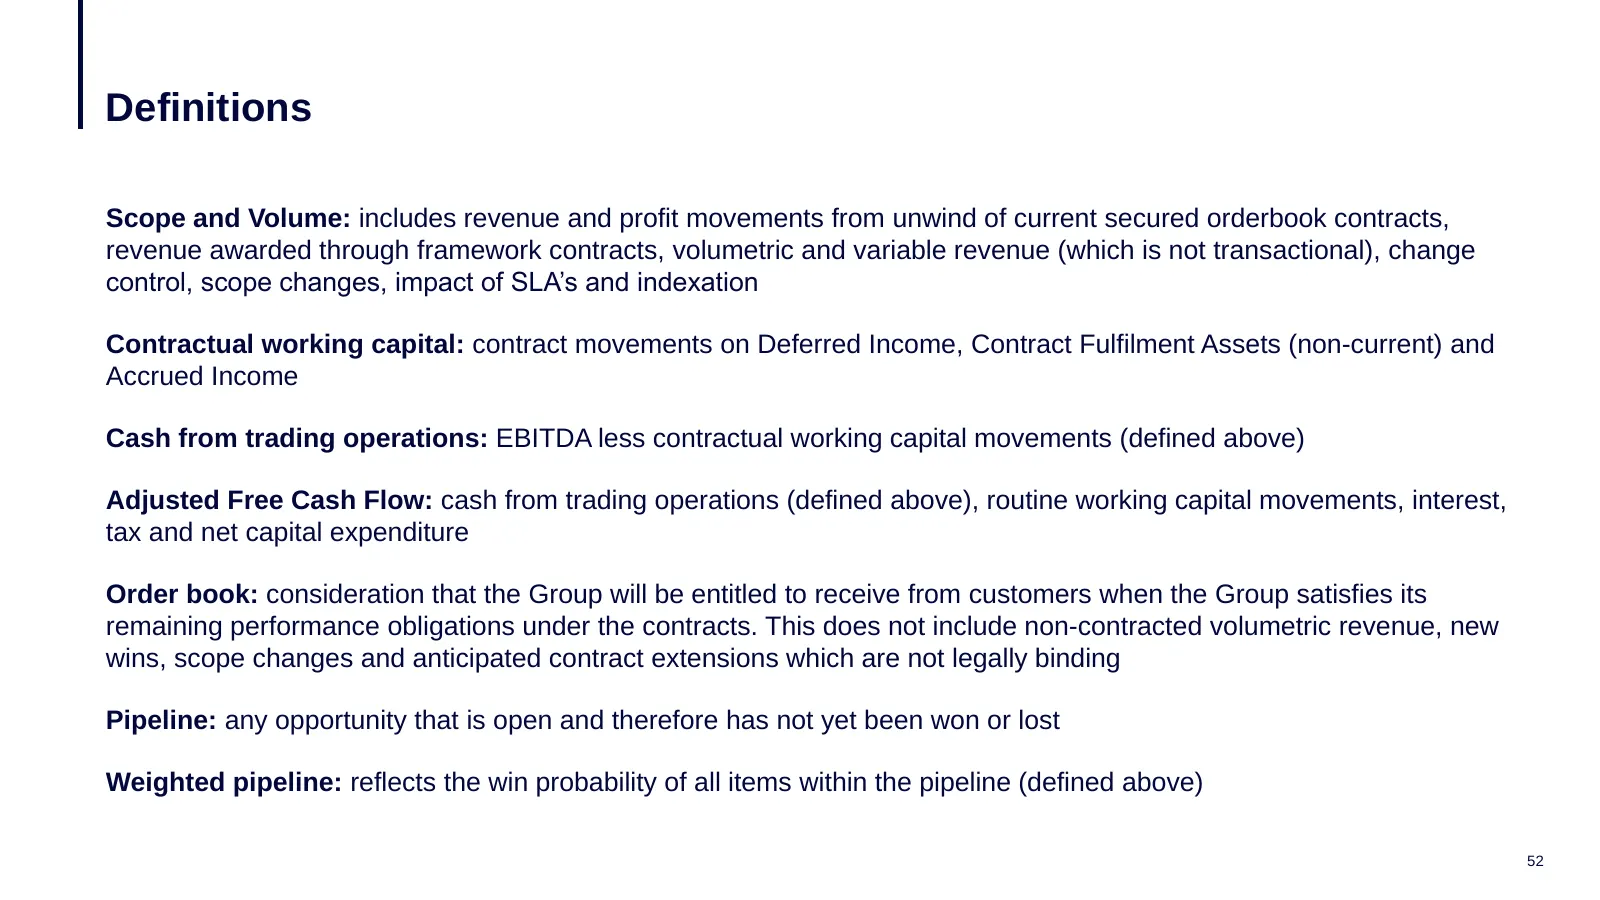
Definitions Scope and Volume: includes revenue and profit movements from unwind of current secured orderbook contracts, revenue awarded through framework contracts, volumetric and variable revenue (which is not transactional), change control, scope changes, impact of SLA’s and indexation Contractual

Slide 53: Glossary
Glossary DFRP: Defence Fire and Rescue Project DDC: Digital Development Centre ESS: Education Software Solutions RPP: Recruiting Partnering Project TFL ULEZ: Transport for London, Ultra-Low Emission Zone 53
Source: Internet Archive copy of capita.com
More decks from Capita plc
 H1 2026 Earnings Presentation44 slides · Aug 4, 2026
 FY2025 Earnings Presentation46 slides · March 2026
 Merger or Acquisition (March 2026)10 slides · March 2026
 H1 2025 Earnings Presentation51 slides · August 2025
 FY2024 Earnings Presentation44 slides · March 2025
 H1 2024 Earnings Presentation33 slides · Aug 1, 2024