Ellaktor SA · ATHEX:ELLAKTOR
Ellaktor SA — Q1 2021 Earnings Presentation
26 slides from Ellaktor SA's earnings presentation, March 2022
Slide 1: Q1 2021 Group Results
, ee Q1 2021 Group Results
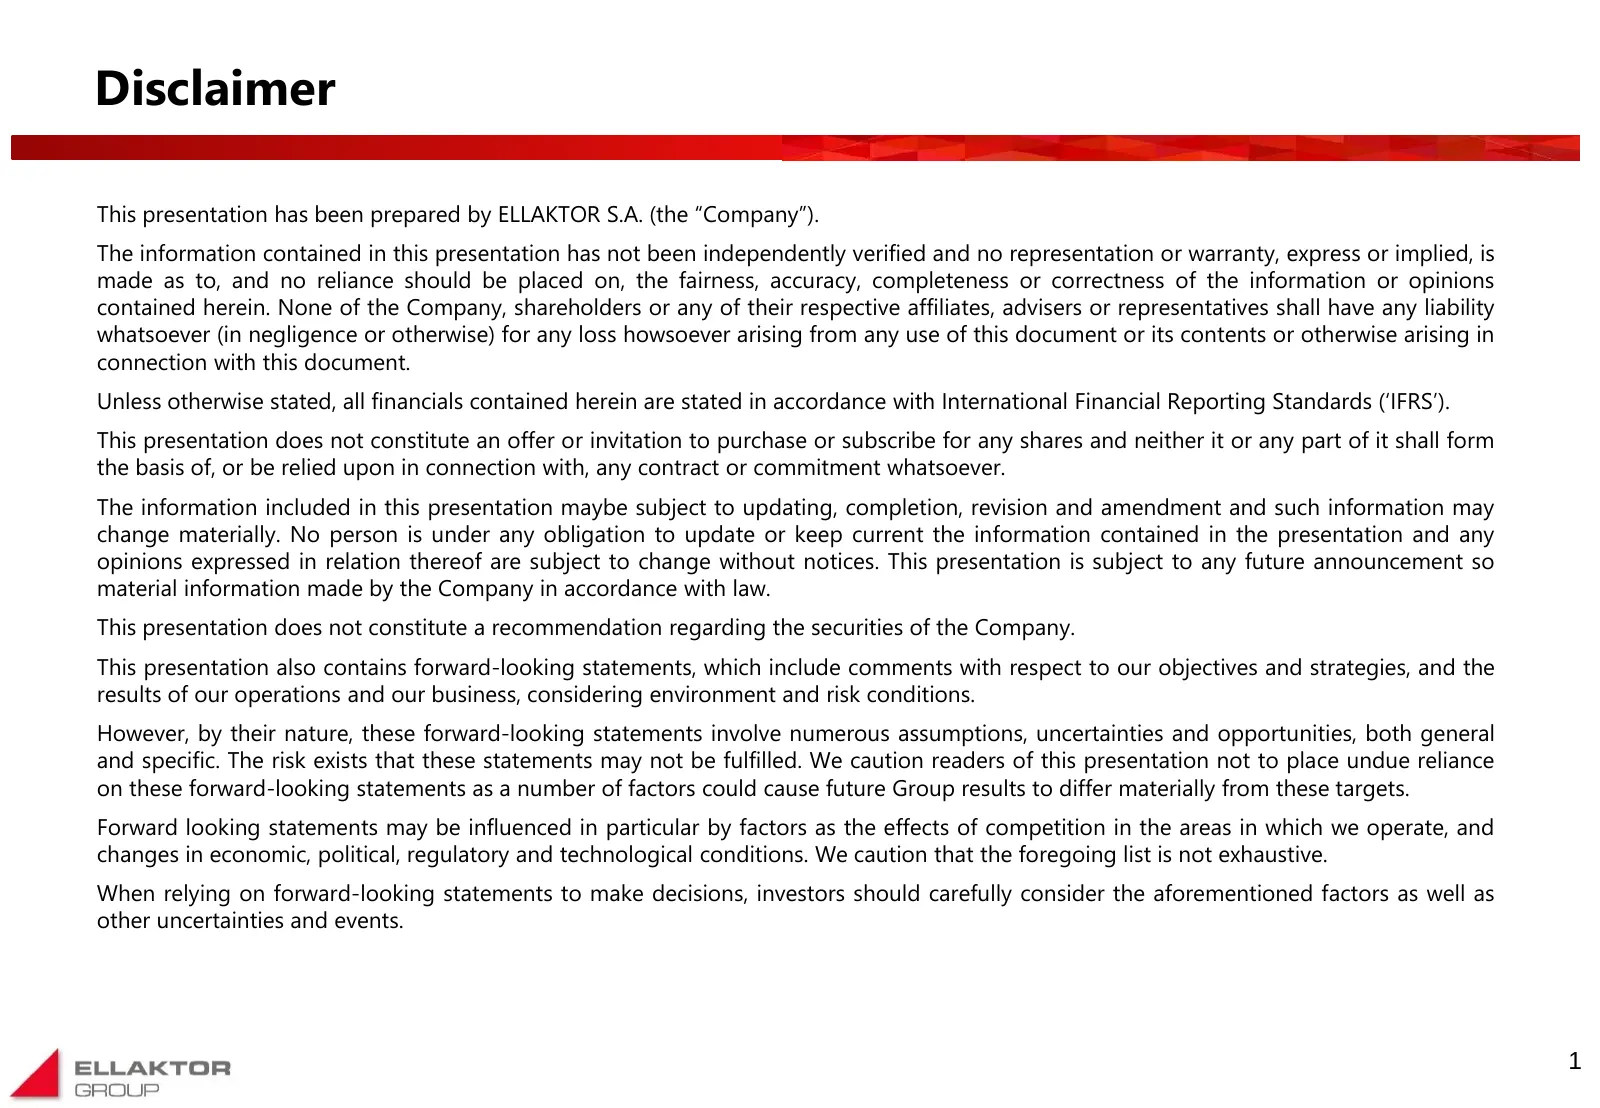
Slide 2: Disclaimer
Disclaimer This presentation has been prepared by ELLAKTOR S.A. (the “Company”). The information contained in this presentation has not been independently verified and no representation or warranty, express or implied, is made as to, and no reliance should be placed on, the fairness, accuracy, compl
Slide 3: Content pages
Content pages Q1 2021 Results Highlights 3 Consolidated Balance Sheet & Cash Flow 12 Segmental Analysis 16 Appendix 23 2
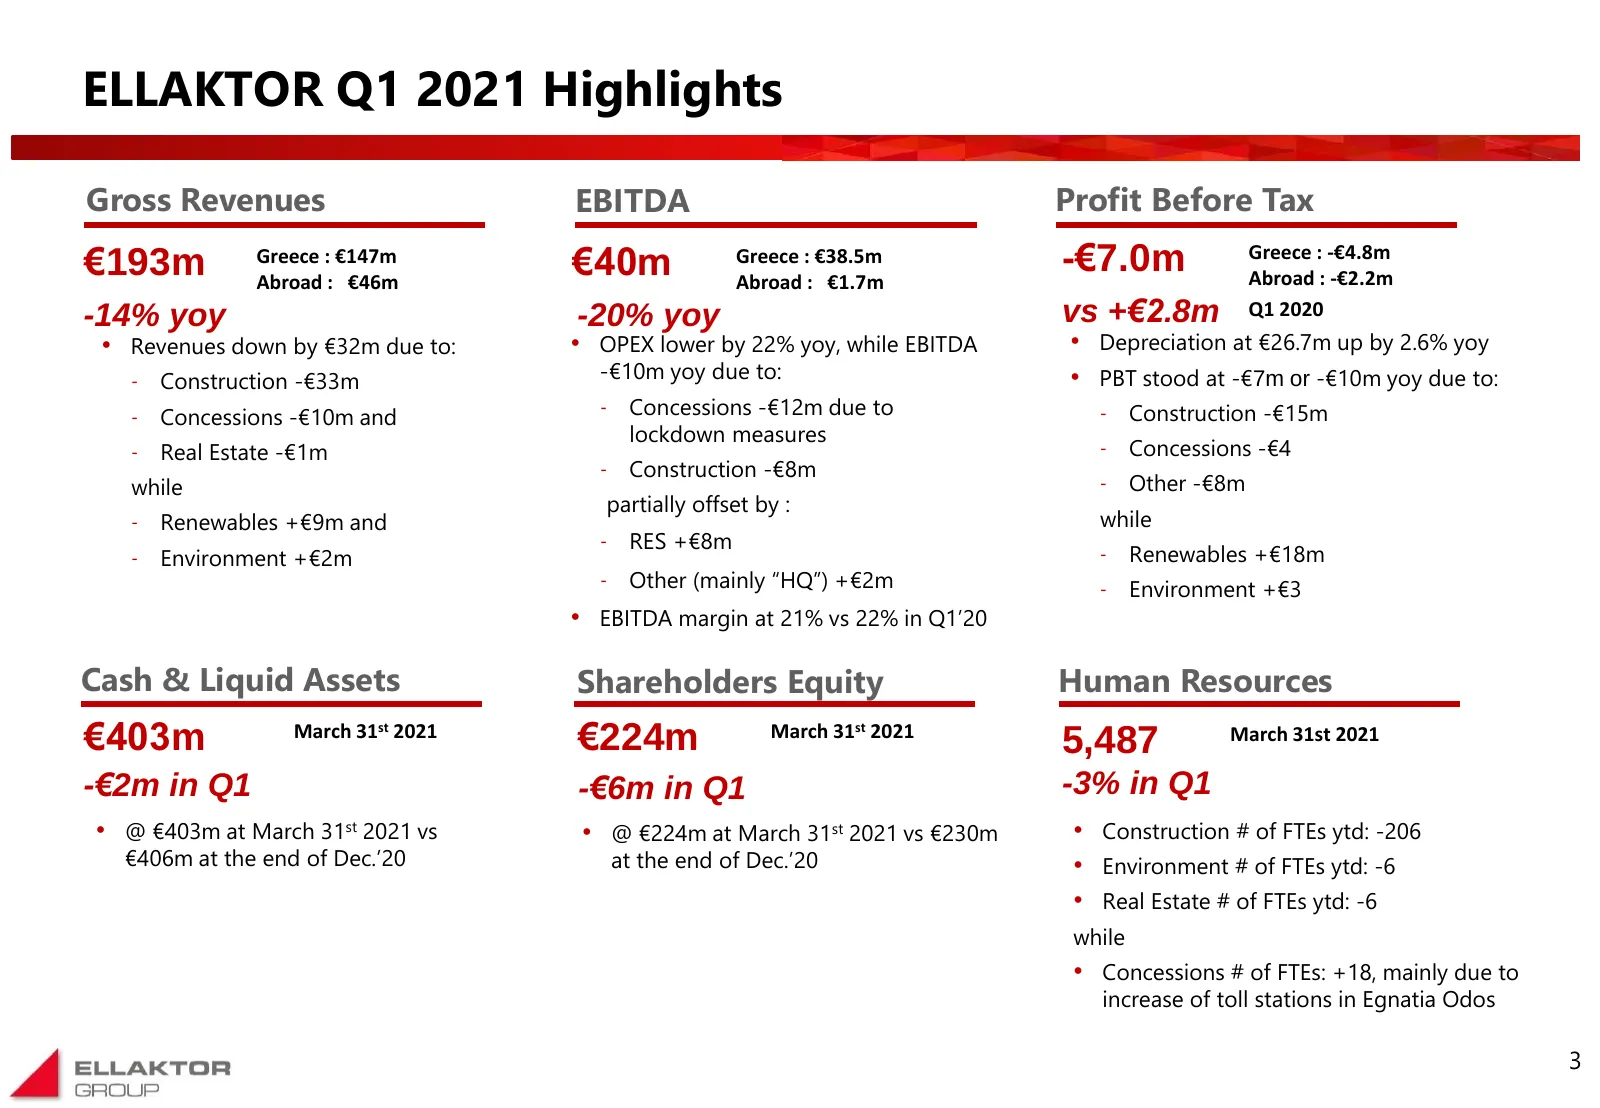
Slide 4: ELLAKTOR Q1 2021 Highlights
ELLAKTOR Q1 2021 Highlights Gross Revenues EBITDA Profit Before Tax €193m Greece : €147m Abroad : €46m €40m Greece : €38.5m Abroad : €1.7m -€7.0m Greece : -€4.8m Abroad : -€2.2m -14% yoy -20% yoy vs +€2.8m Q1 2020 • Revenues down by €32m due to: • OPEX lower by 22% yoy, while EBITDA • Depreciation a
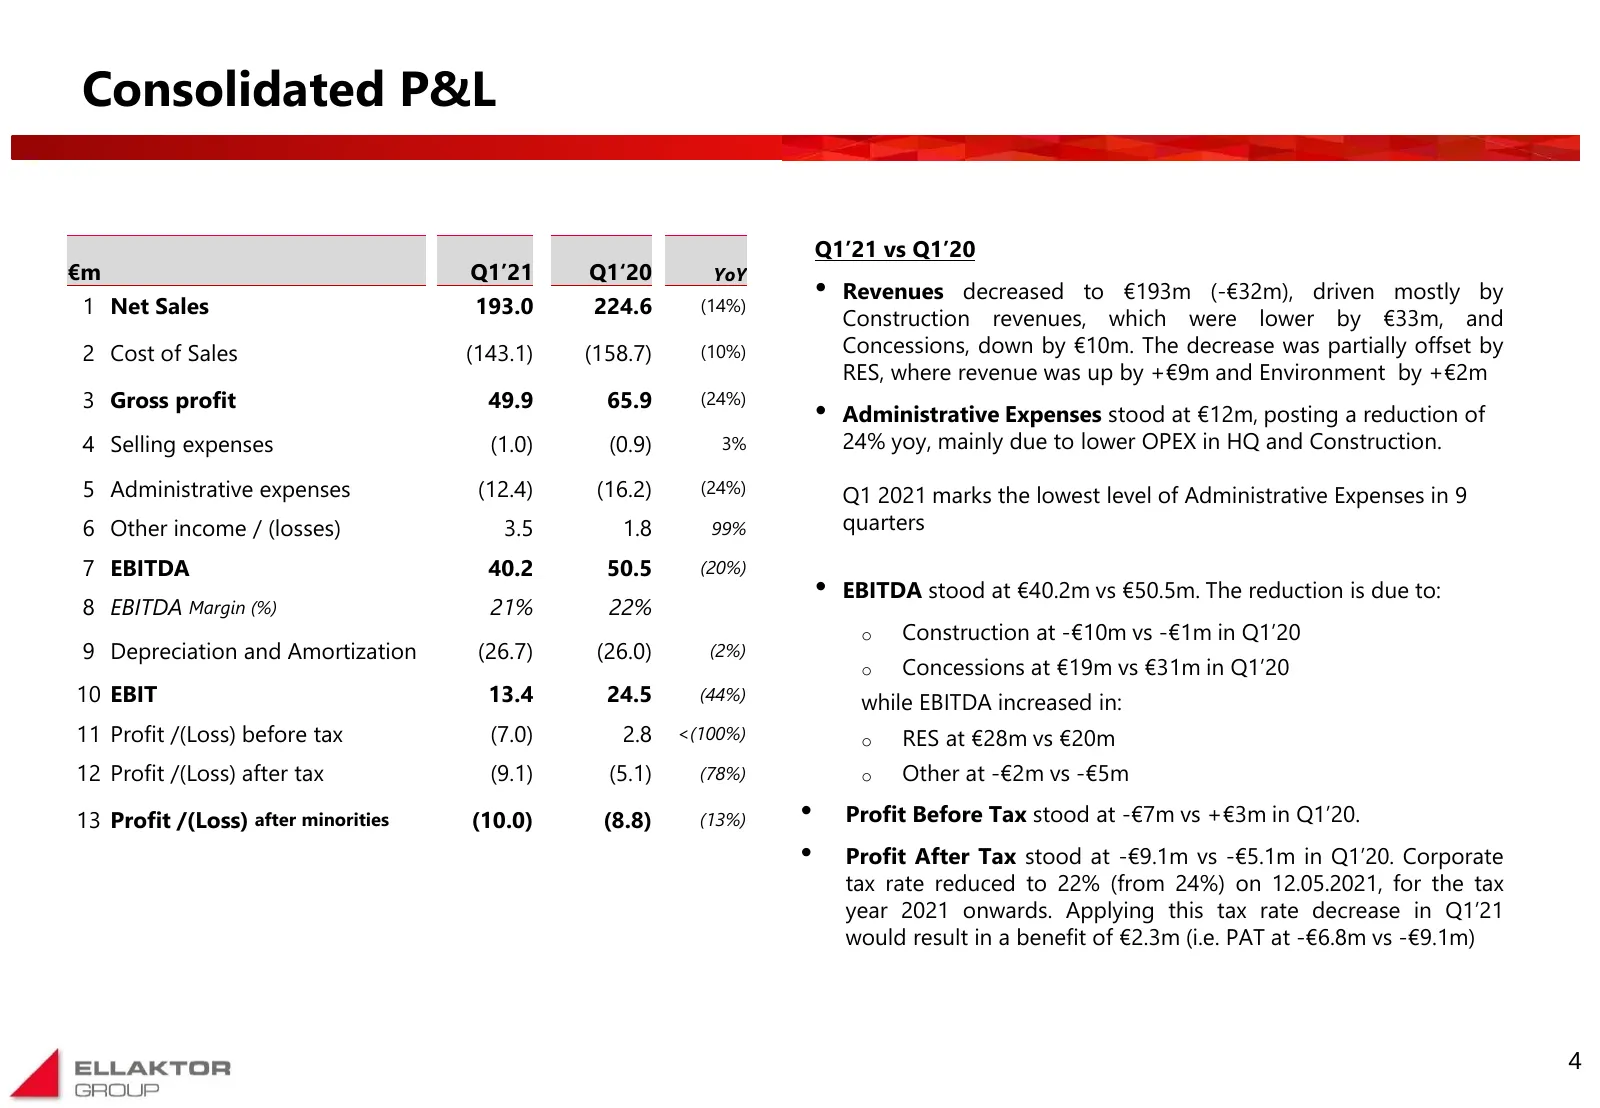
Slide 5: Consolidated P&L
Consolidated P&L Q1’21 vs Q1’20 €m Q1’21 Q1‘20 YoY 1 Net Sales 193.0 224.6 (14%) • Revenues decreased to €193m (-€32m), driven mostly by Construction revenues, which were lower by €33m, and 2 Cost of Sales (143.1) (158.7) (10%) Concessions, down by €10m. The decrease was partially offset by RES, whe
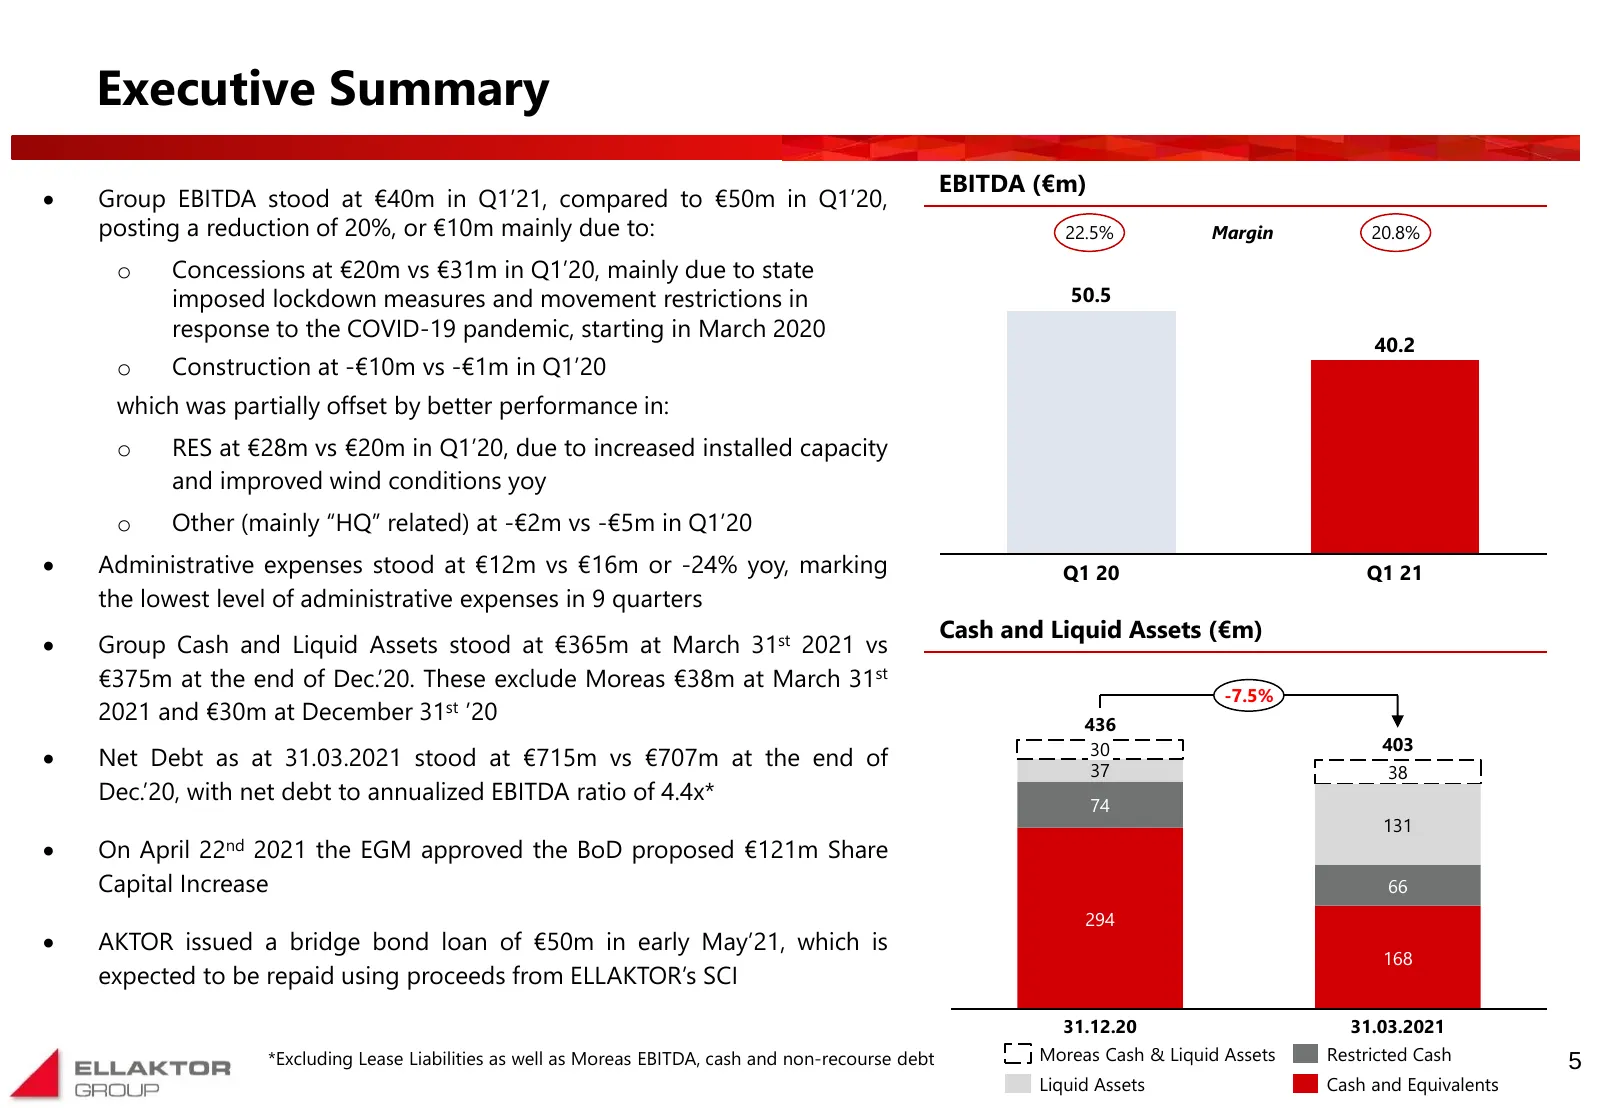
Slide 6: Executive Summary
Executive Summary EBITDA (€m) Group EBITDA stood at €40m in Q1’21, compared to €50m in Q1’20, posting a reduction of 20%, or €10m mainly due to: 22.5% Margin 20.8% o Concessions at €20m vs €31m in Q1’20, mainly due to state 55 140 imposed lockdown measures and movement restrictions in 50.5 50 resp
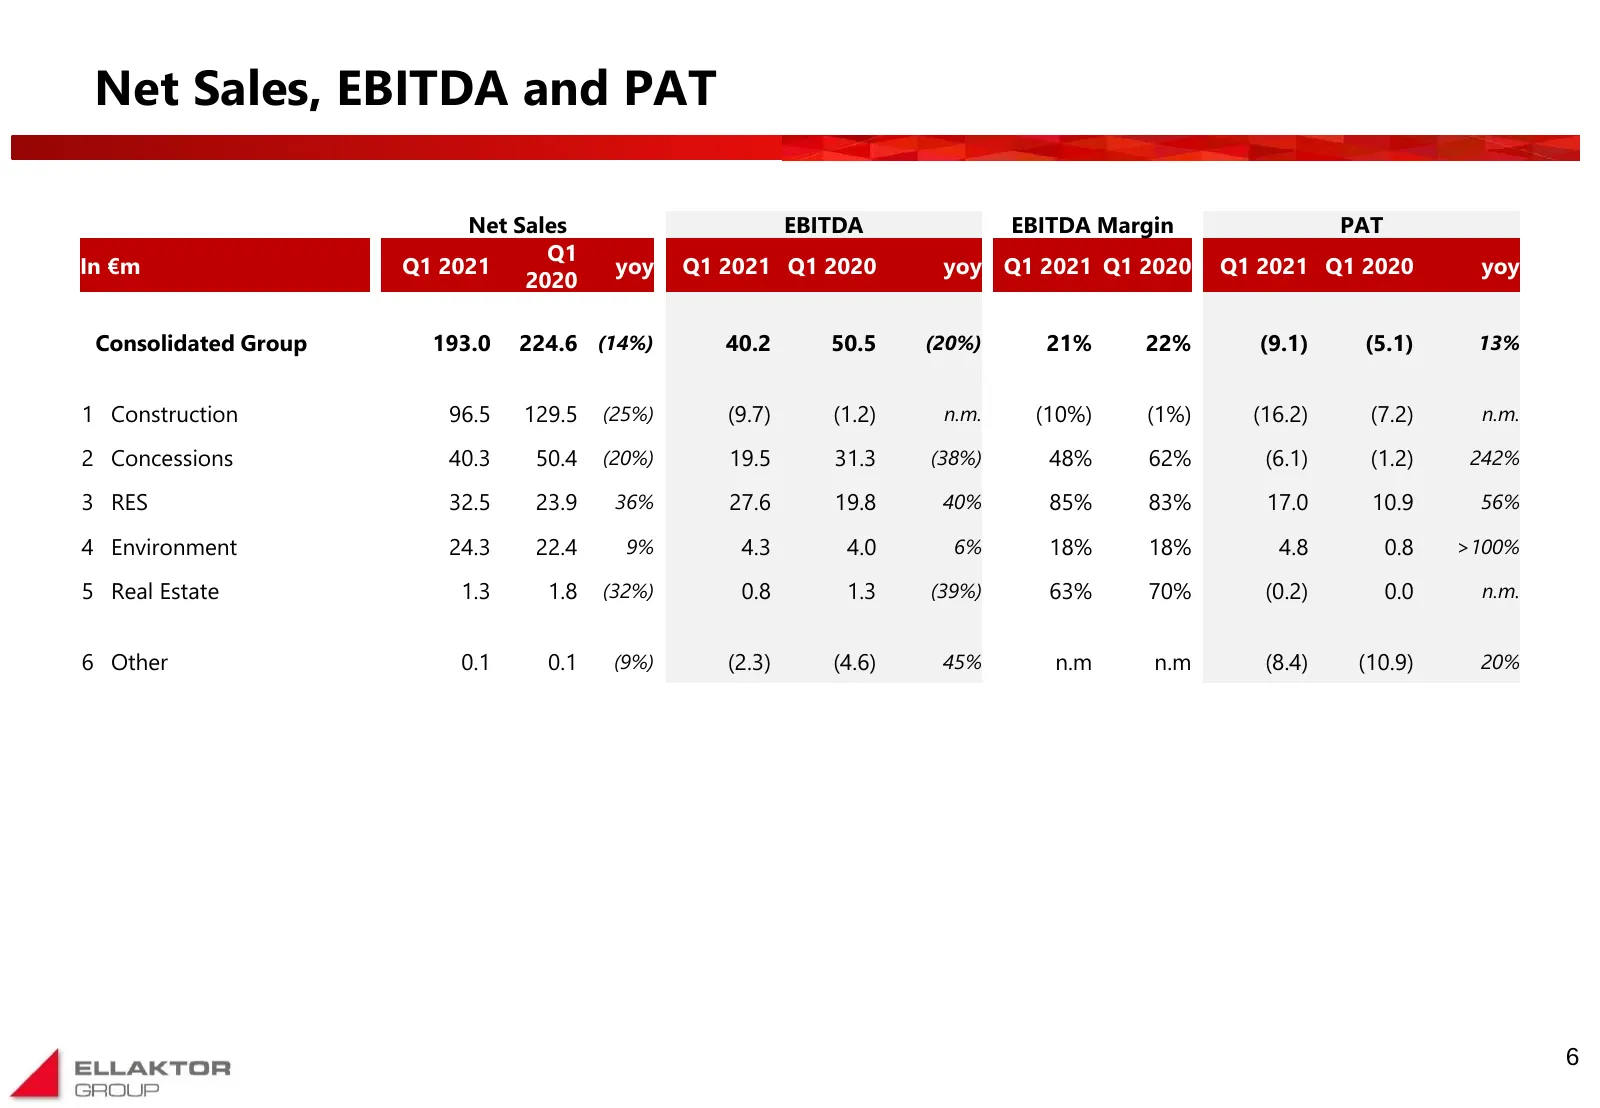
Slide 7: Net Sales, EBITDA and PAT
Net Sales, EBITDA and PAT Net Sales EBITDA EBITDA Margin PAT Q1 In €m Q1 2021 yoy Q1 2021 Q1 2020 yoy Q1 2021 Q1 2020 Q1 2021 Q1 2020 yoy 2020 Consolidated Group 193.0 224.6 (14%) 40.2 50.5 (20%) 21% 22% (9.1) (5.1) 13% 1 Construction 96.5 129.5 (25%) (9.7) (1.2) n.m. (10%) (1%) (16.2) (7.2) n.m. 2
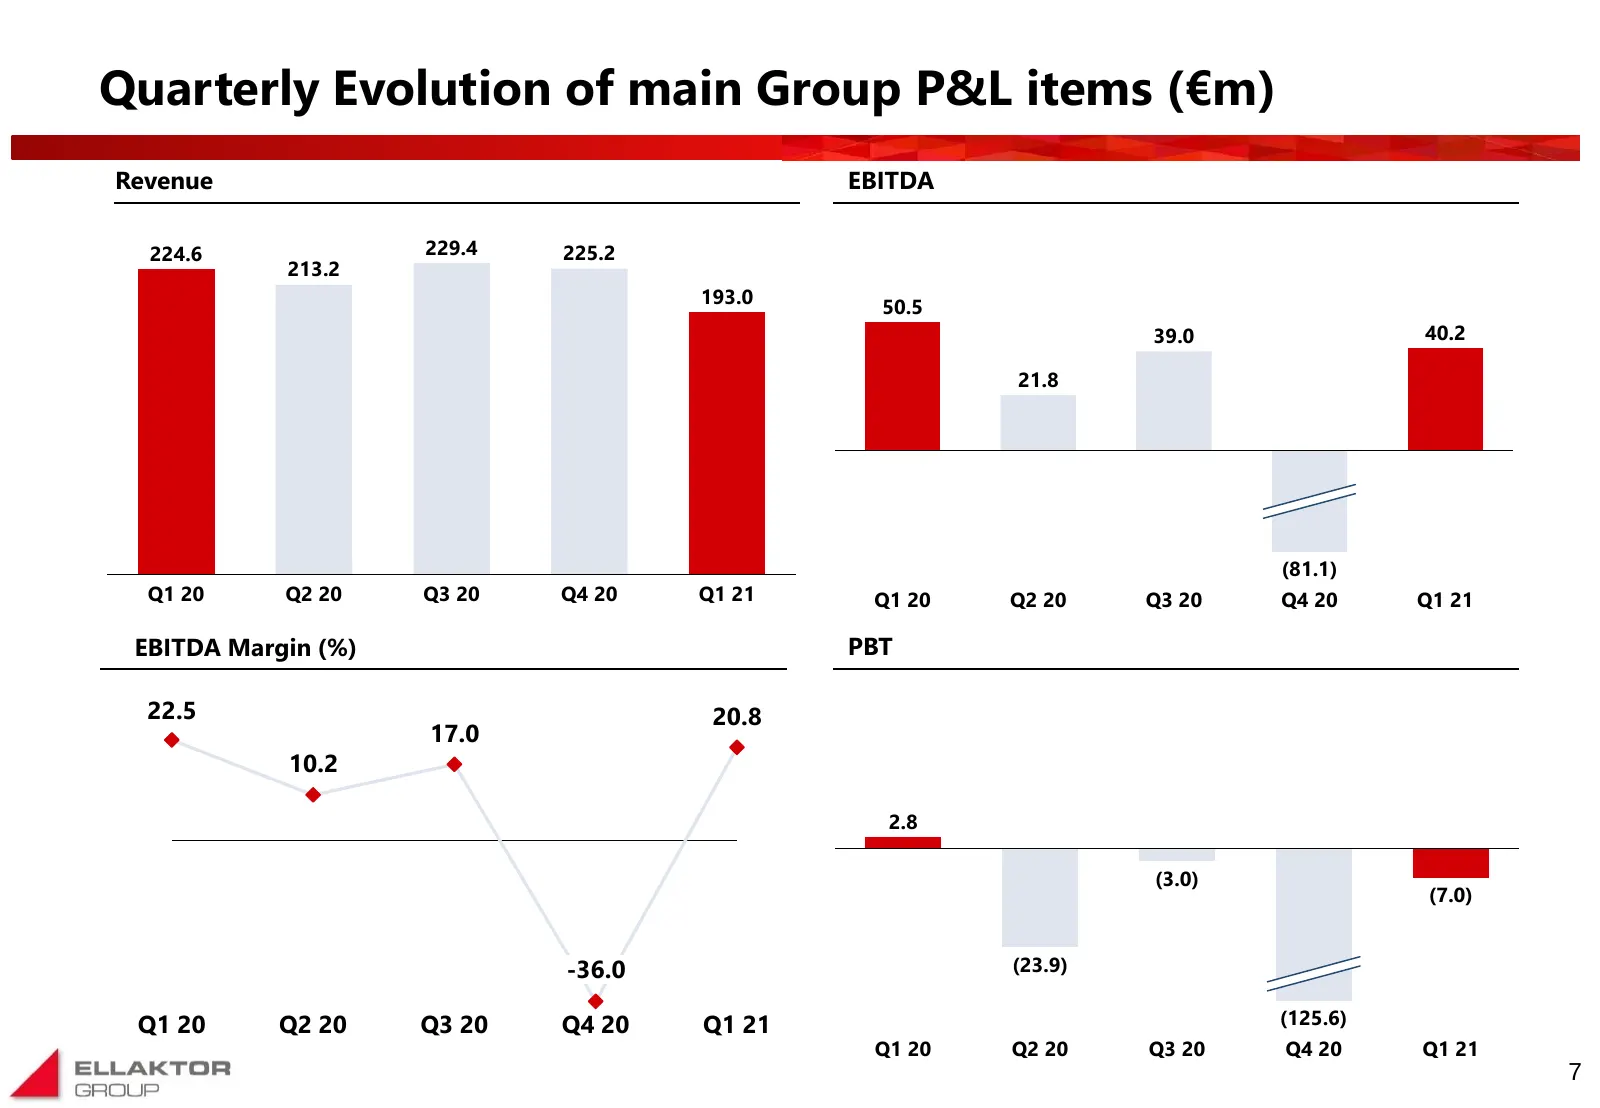
Slide 8: Quarterly Evolution of main Group P&L items (€m)
Quarterly Evolution of main Group P&L items (€m) Revenue EBITDA 240 224.6 229.4 225.2 130 220 213.2 120 200 193.0 60110 50.5 140 180 50100 39.0 40.2 120 160 4090 3080 21.8 100 140 2070 120 80 1060 100 050 60 80 -1040 60 30 40 40 -7020 20 20 -8010 0 -900 (81.1) 0 Q1 20 Q2 20 Q3 20 Q4 20 Q1 21 Q1 20 Q
Slide 9: Quarterly Evolution EBITDA performance by Segment
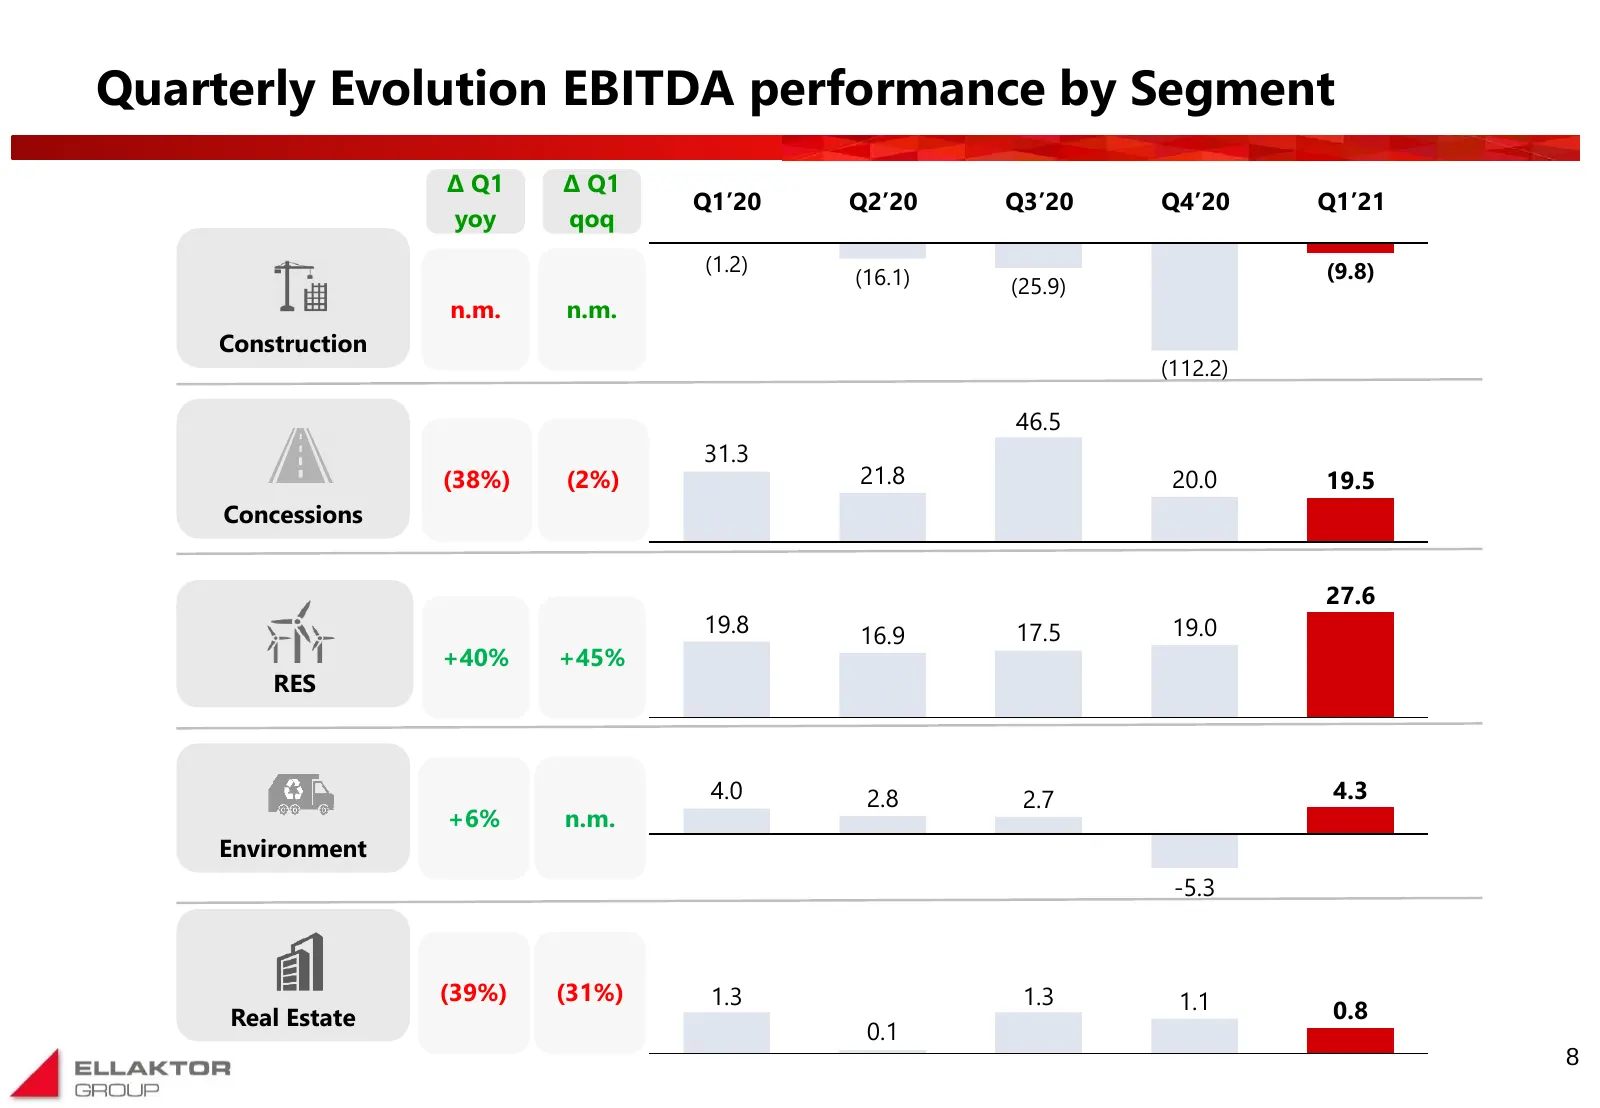
Quarterly Evolution EBITDA performance by Segment Δ Q1 Δ Q1 Q1’20 Q2’20 Q3’20 Q4’20 Q1’21 yoy qοq (1.2) (9.8) (16.1) (25.9) n.m. n.m. Construction (112.2) 46.5 31.3 (38%) (2%) 21.8 20.0 19.5 Concessions 27.6 19.8 16.9 17.5 19.0 +40% +45% RES 4.0 2.8 2.7 4.3 +6% n.m. Environment -5.3 (39%) (31%) 1.3
Slide 10: Business Update by Segment
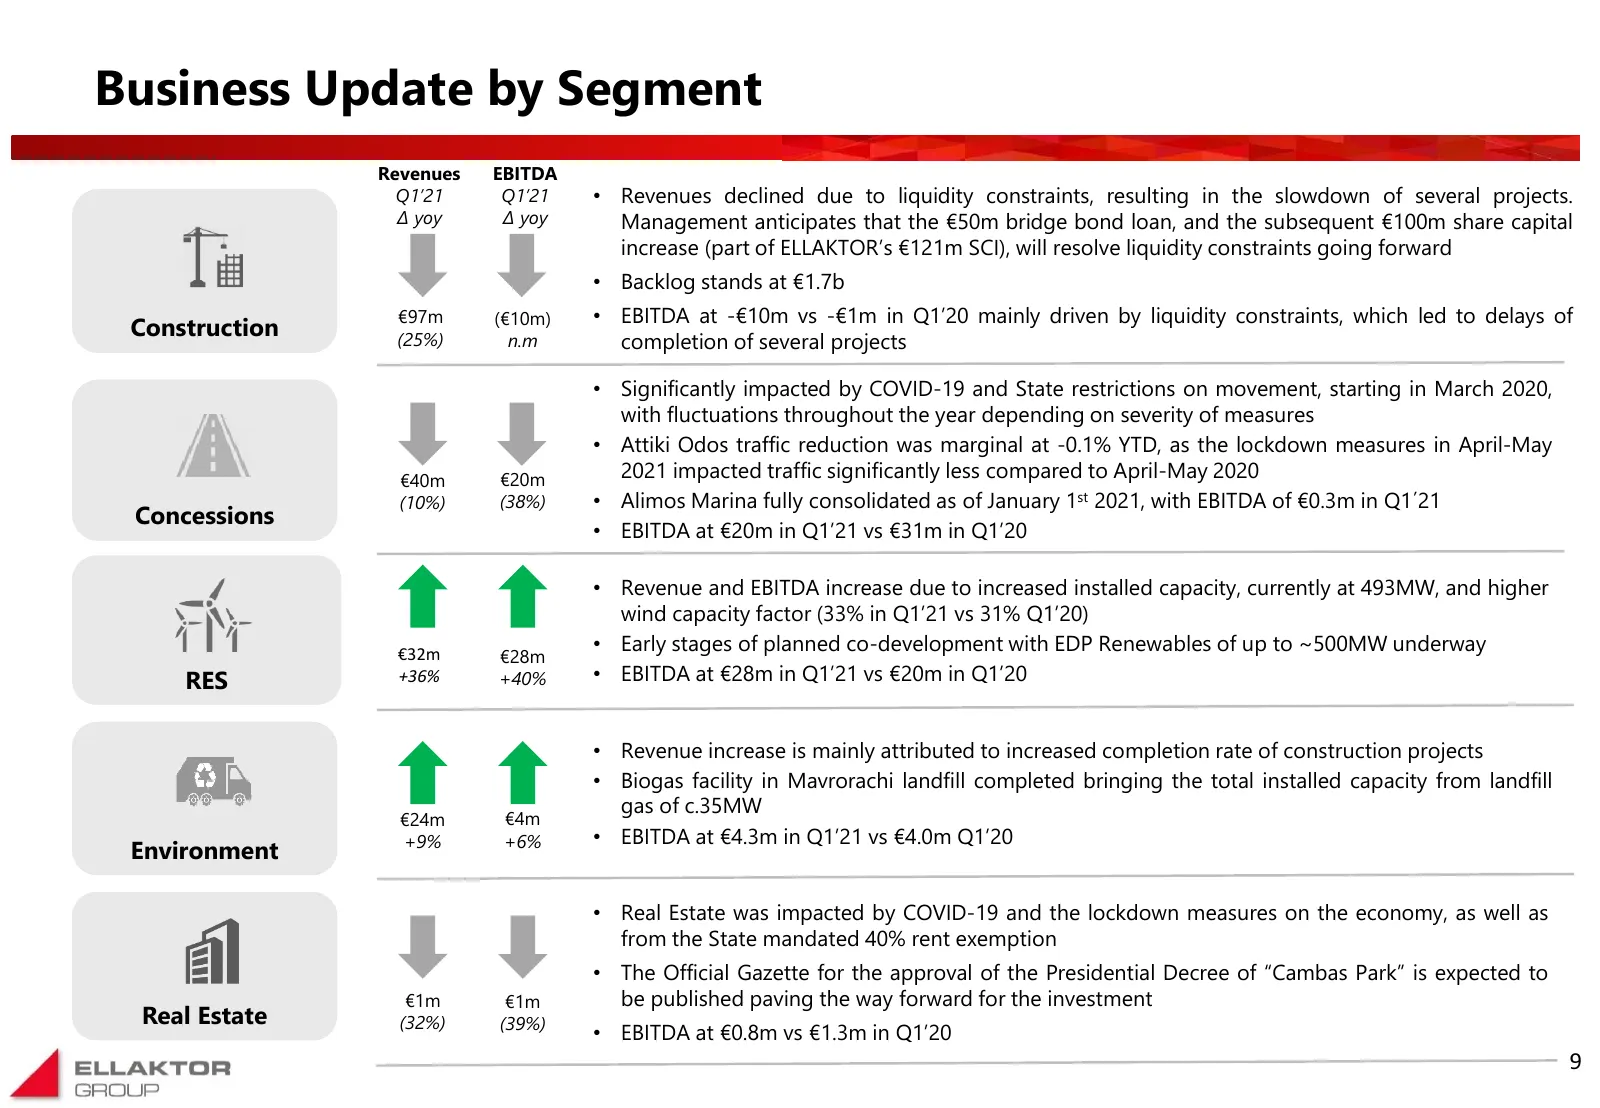
Business Update by Segment Revenues EBITDA Q1’21 Q1’21 • Revenues declined due to liquidity constraints, resulting in the slowdown of several projects. Δ yoy Δ yoy Management anticipates that the €50m bridge bond loan, and the subsequent €100m share capital increase (part of ELLAKTOR’s €121m SCI), w
Slide 11: Expenses Evolution (excl. depreciation)
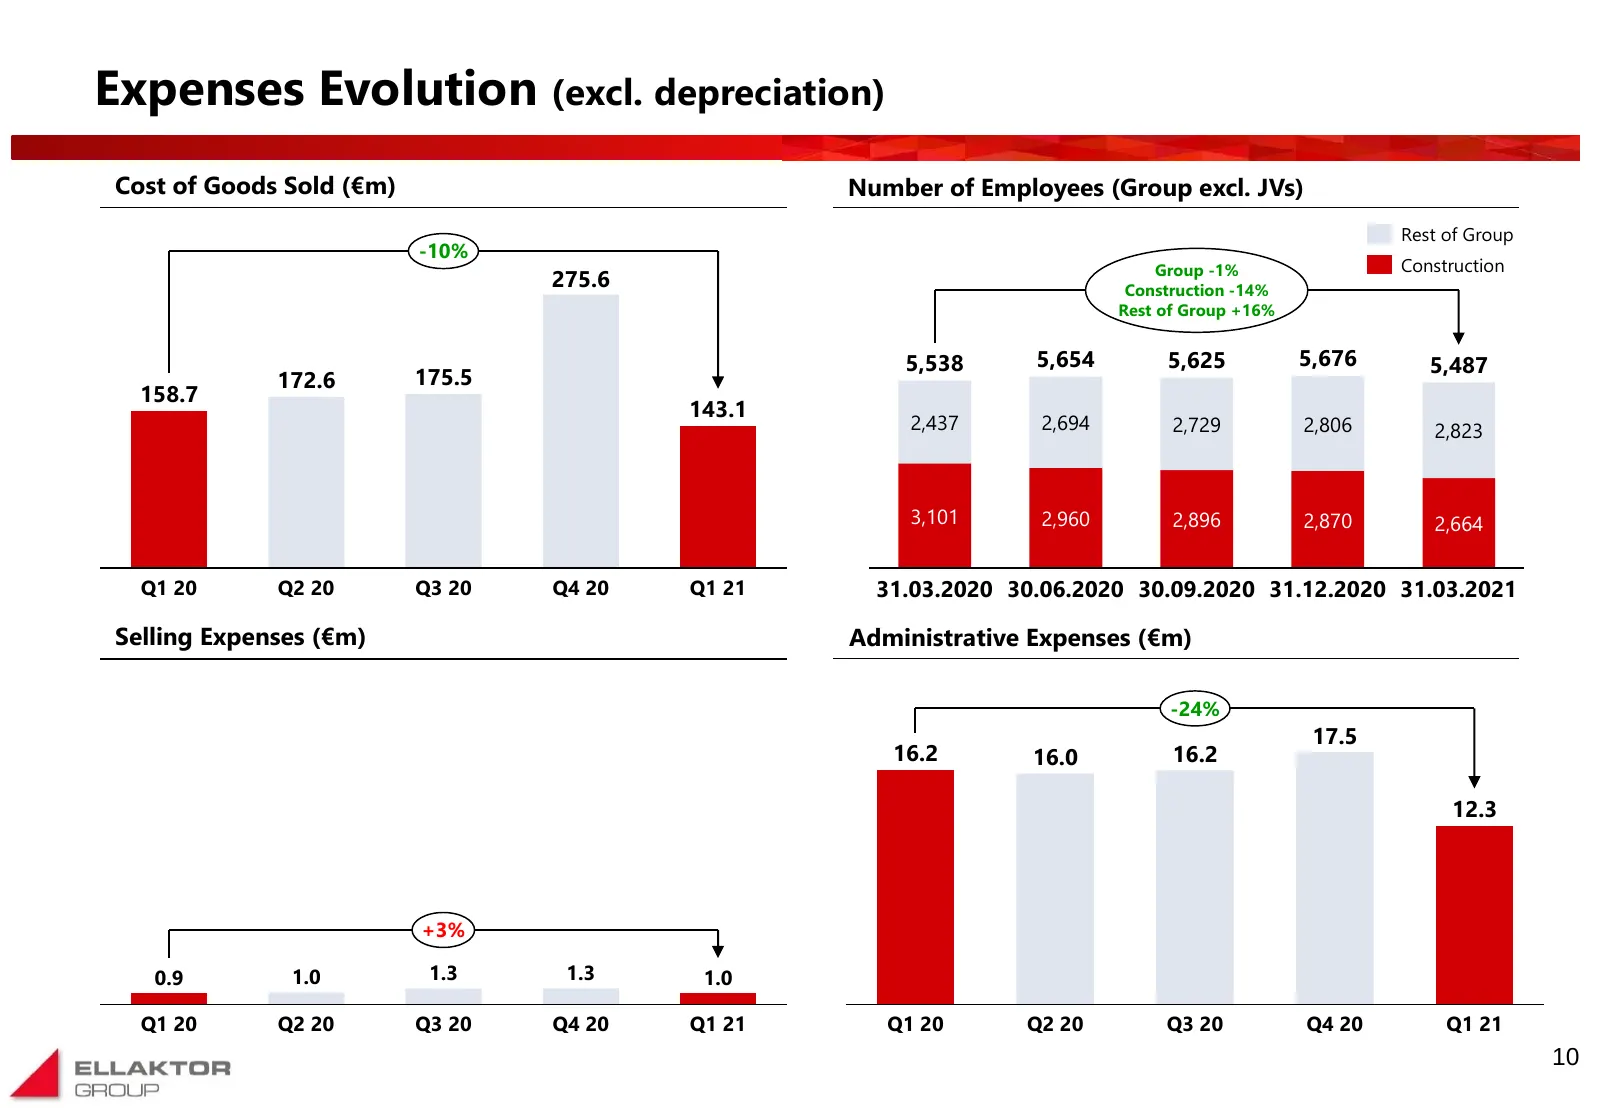
Expenses Evolution (excl. depreciation) Cost of Goods Sold (€m) Number of Employees (Group excl. JVs) Rest of Group -10% Group -1% Construction 275.6 Construction -14% Rest of Group +16% 5,538 5,654 5,625 5,676 5,487 172.6 175.5 158.7 143.1 2,437 2,694 2,729 2,806 2,823 3,101 2,960 2,896 2,870 2,664
Slide 12: Content pages
Content pages Q1 2021 Results Highlights 3 Consolidated Balance Sheet & Cash Flow 12 Segmental Analysis 16 Appendix 23 11
Slide 13: Consolidated Balance Sheet
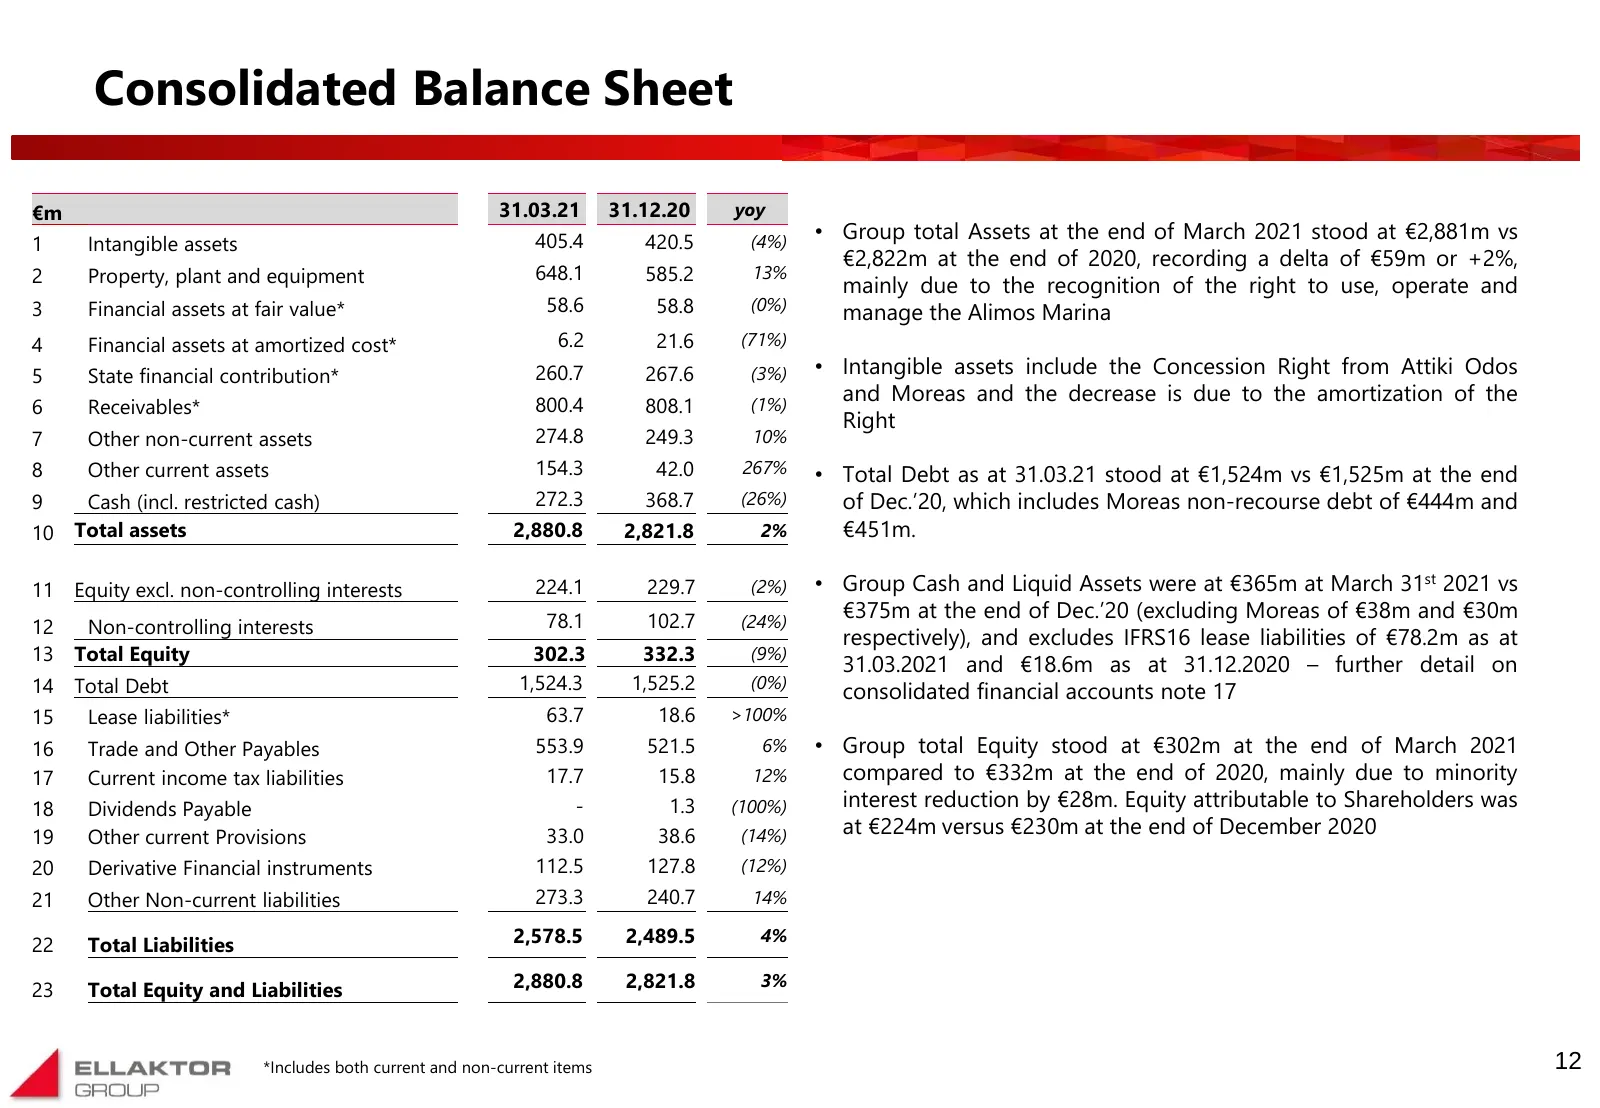
Consolidated Balance Sheet €m 31.03.21 31.12.20 yoy 405.4 420.5 (4%) • Group total Assets at the end of March 2021 stood at €2,881m vs 1 Intangible assets €2,822m at the end of 2020, recording a delta of €59m or +2%, 2 Property, plant and equipment 648.1 585.2 13% mainly due to the recognition of th
Slide 14: Net Debt by Segment
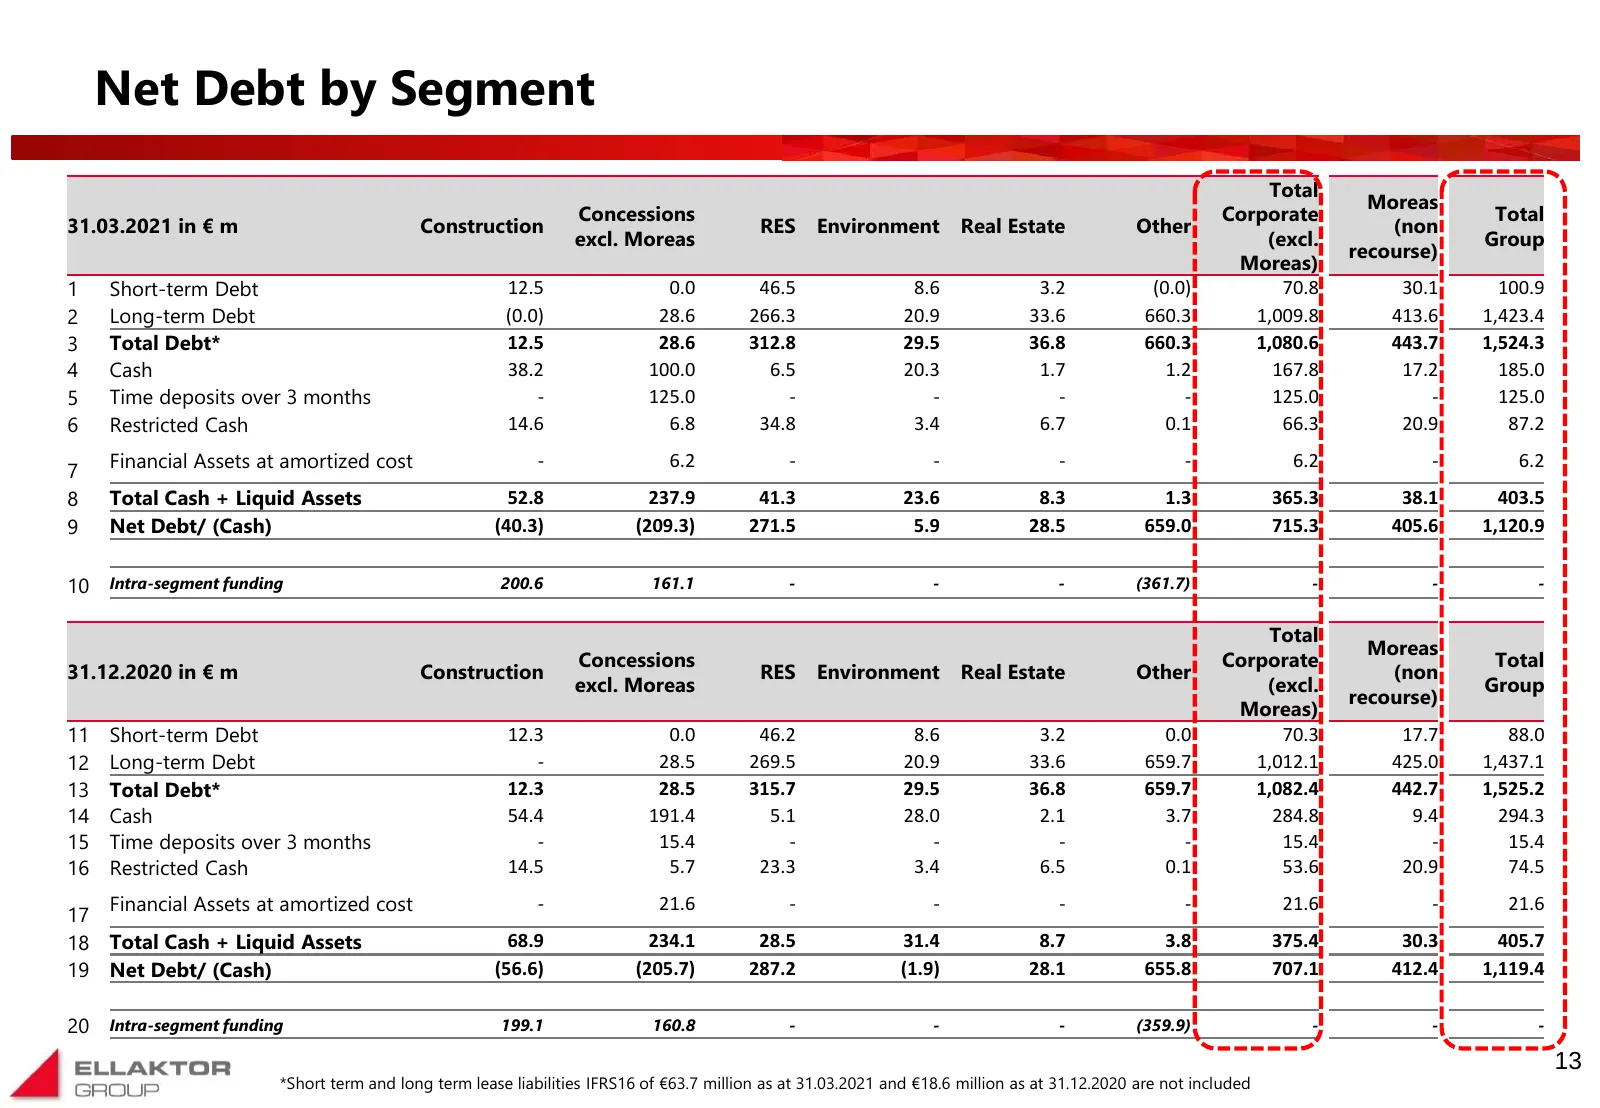
Net Debt by Segment Total Moreas Concessions Corporate Total 31.03.2021 in € m Construction RES Environment Real Estate Other (non excl. Moreas (excl. Group recourse) Moreas) 1 Short-term Debt 12.5 0.0 46.5 8.6 3.2 (0.0) 70.8 30.1 100.9 2 Long-term Debt (0.0) 28.6 266.3 20.9 33.6 660.3 1,009.8 413.6
Slide 15: Consolidated Cash Flows
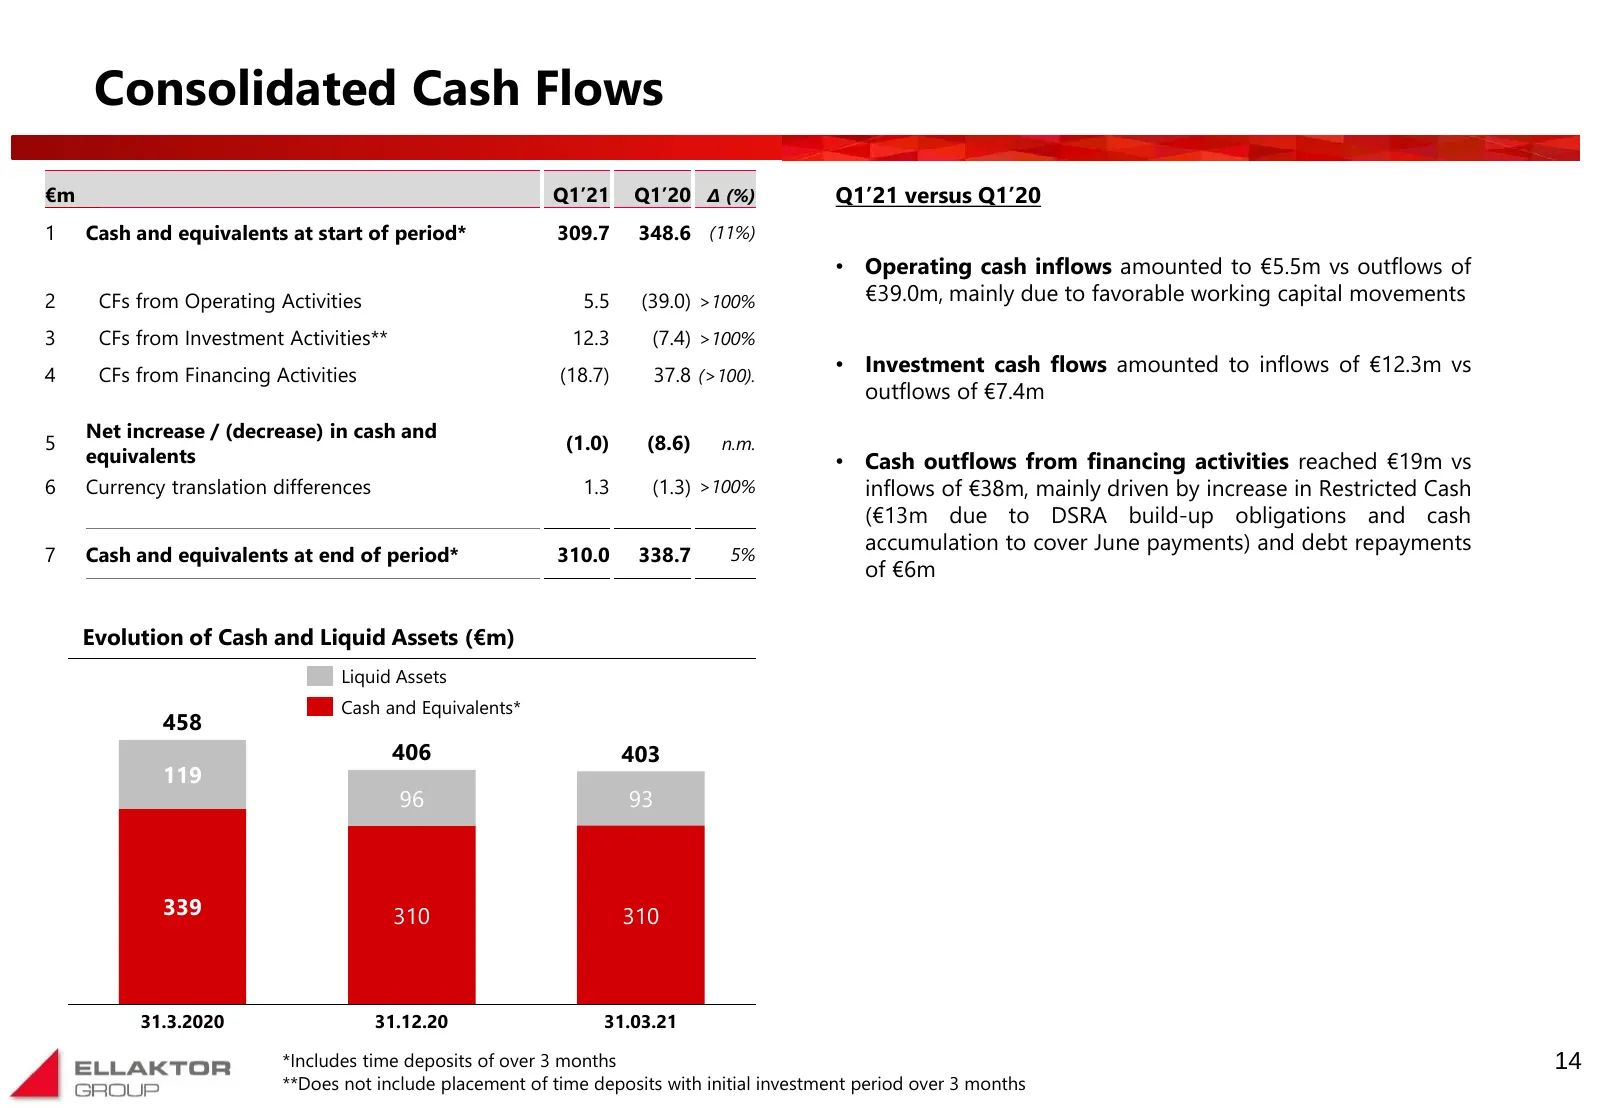
Consolidated Cash Flows €m Q1’21 Q1’20 Δ (%) Q1’21 versus Q1’20 1 Cash and equivalents at start of period* 309.7 348.6 (11%) • Operating cash inflows amounted to €5.5m vs outflows of 2 CFs from Operating Activities 5.5 (39.0) >100% €39.0m, mainly due to favorable working capital movements 3 CFs from
Slide 16: Content pages
Content pages Q1 2021 Results Highlights 3 Consolidated Balance Sheet & Cash Flow 12 Segmental Analysis 16 Appendix 23 15
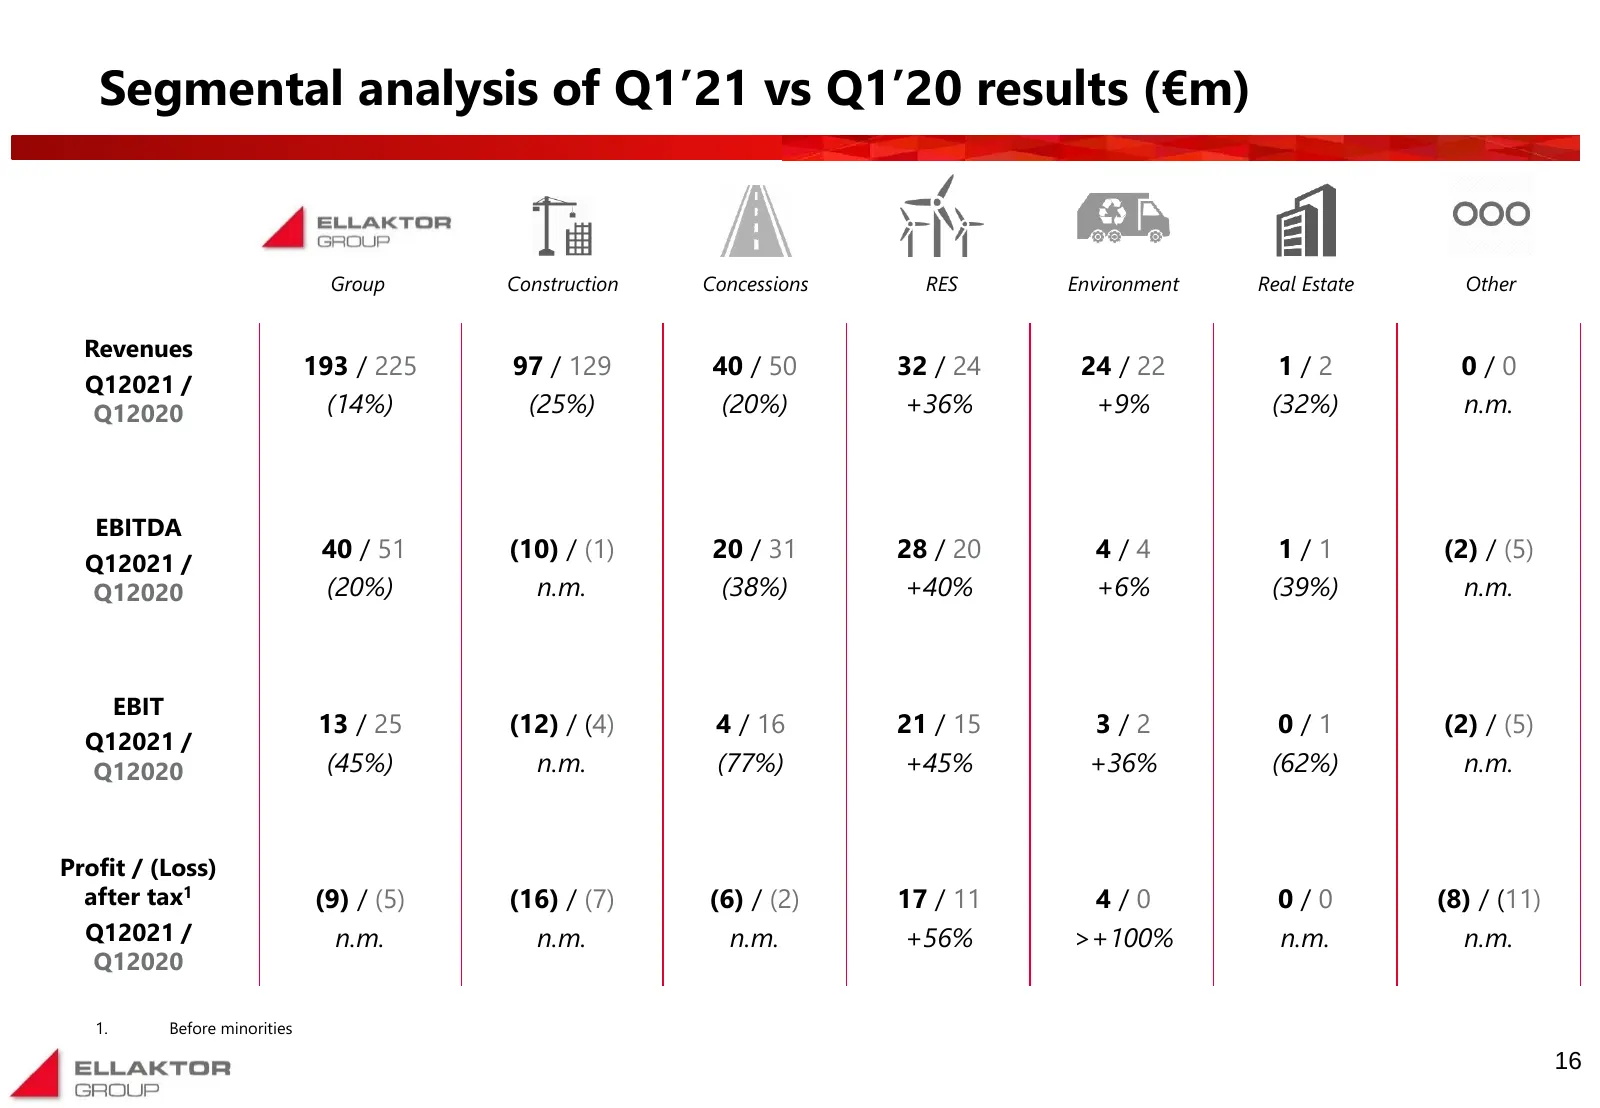
Slide 17: Segmental analysis of Q1'21 vs Q1'20 results (€m)
Segmental analysis of Q1’21 vs Q1’20 results (€m) Group Construction Concessions RES Environment Real Estate Other Revenues 193 / 225 97 / 129 40 / 50 32 / 24 24 / 22 1/2 0/0 Q12021 / Q12020 (14%) (25%) (20%) +36% +9% (32%) n.m. EBITDA 40 / 51 (10) / (1) 20 / 31 28 / 20 4/4 1/1 (2) / (5) Q12021 / Q1
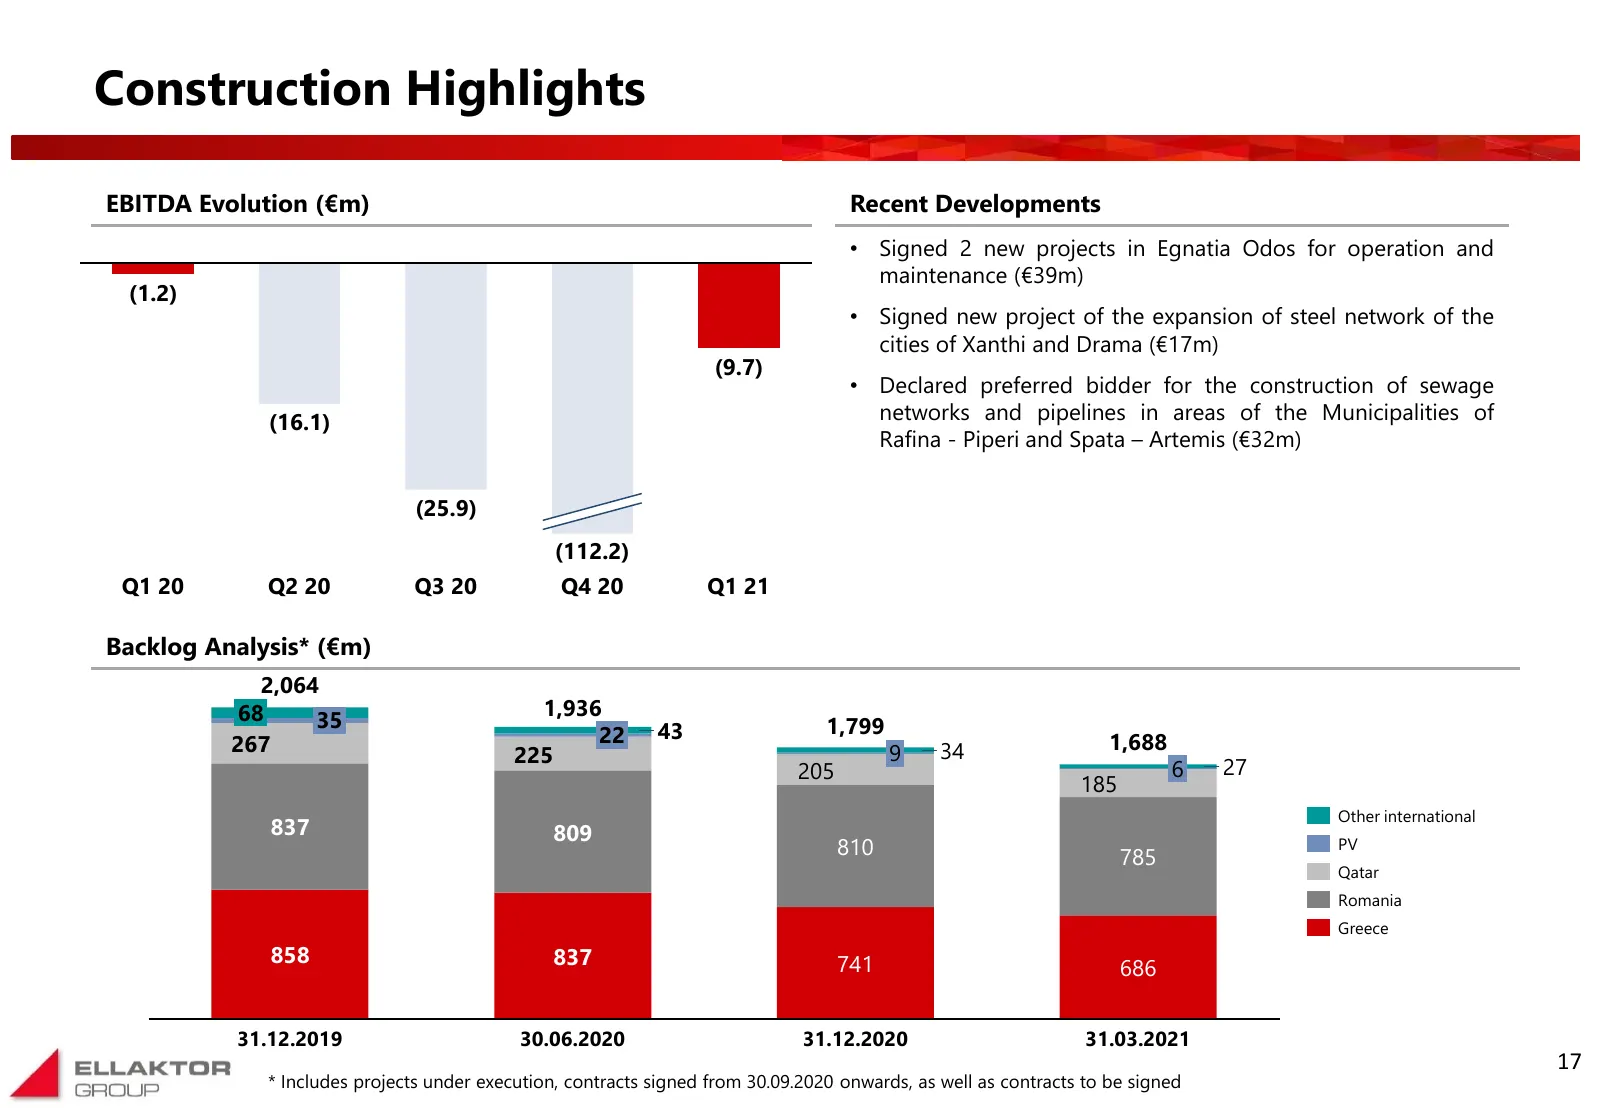
Slide 18: Construction Highlights
Construction Highlights EBITDA Evolution (€m) Recent Developments • Signed 2 new projects in Egnatia Odos for operation and maintenance (€39m) (1.2) • Signed new project of the expansion of steel network of the cities of Xanthi and Drama (€17m) (9.7) • Declared preferred bidder for the construction
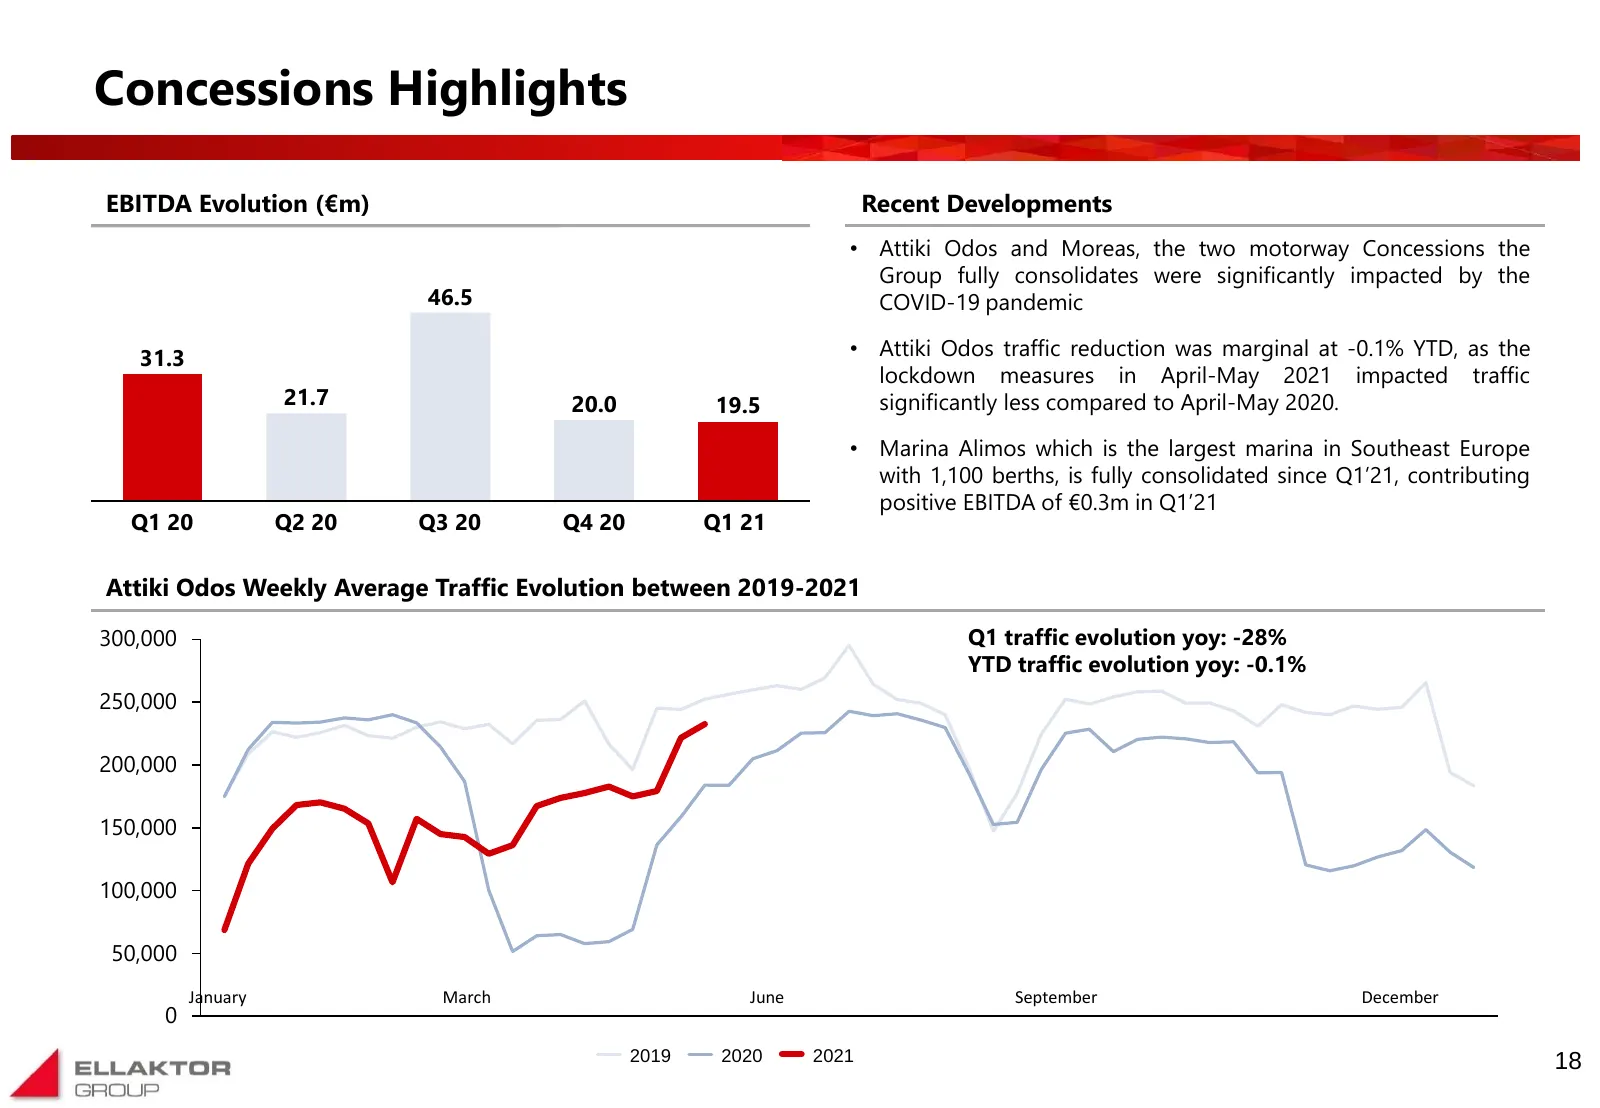
Slide 19: Concessions Highlights
Concessions Highlights EBITDA Evolution (€m) Recent Developments • Attiki Odos and Moreas, the two motorway Concessions the Group fully consolidates were significantly impacted by the 46.5 COVID-19 pandemic 31.3 • Attiki Odos traffic reduction was marginal at -0.1% YTD, as the lockdown measures in A
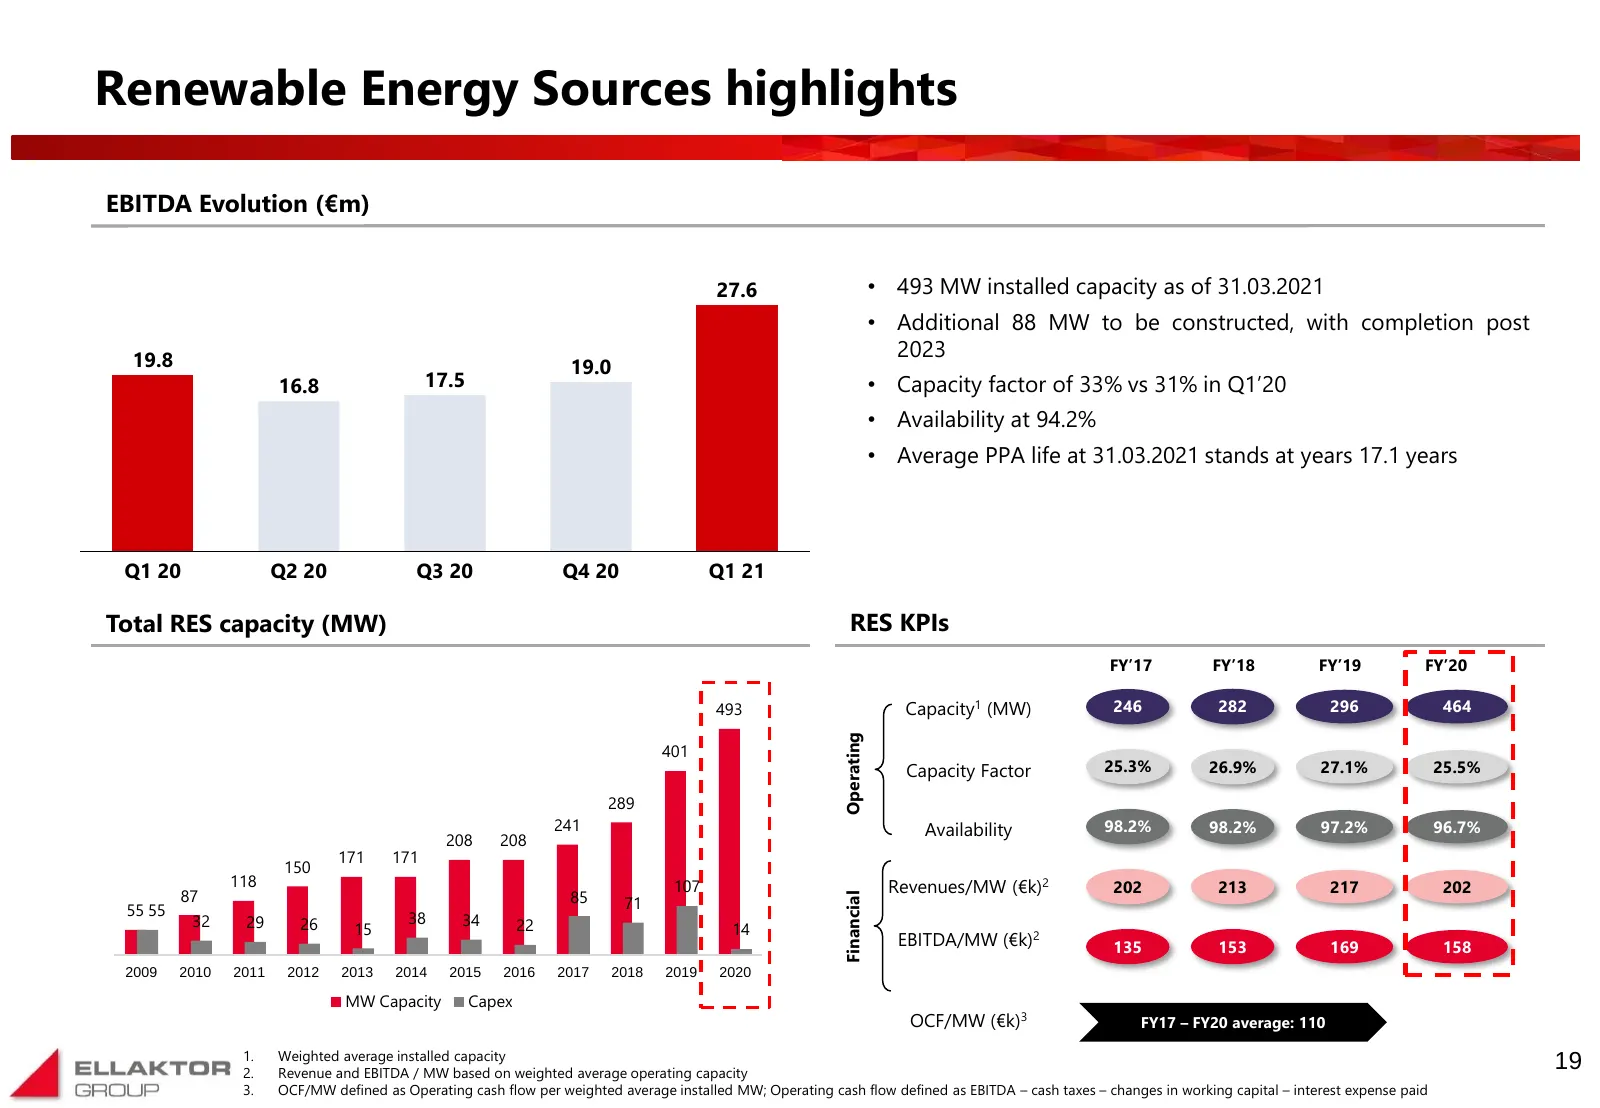
Slide 20: Renewable Energy Sources highlights
Renewable Energy Sources highlights EBITDA Evolution (€m) 27.6 • 493 MW installed capacity as of 31.03.2021 • Additional 88 MW to be constructed, with completion post 19.8 2023 19.0 16.8 17.5 • Capacity factor of 33% vs 31% in Q1’20 • Availability at 94.2% • Average PPA life at 31.03.2021 stands at
Slide 21: Environment Highlights
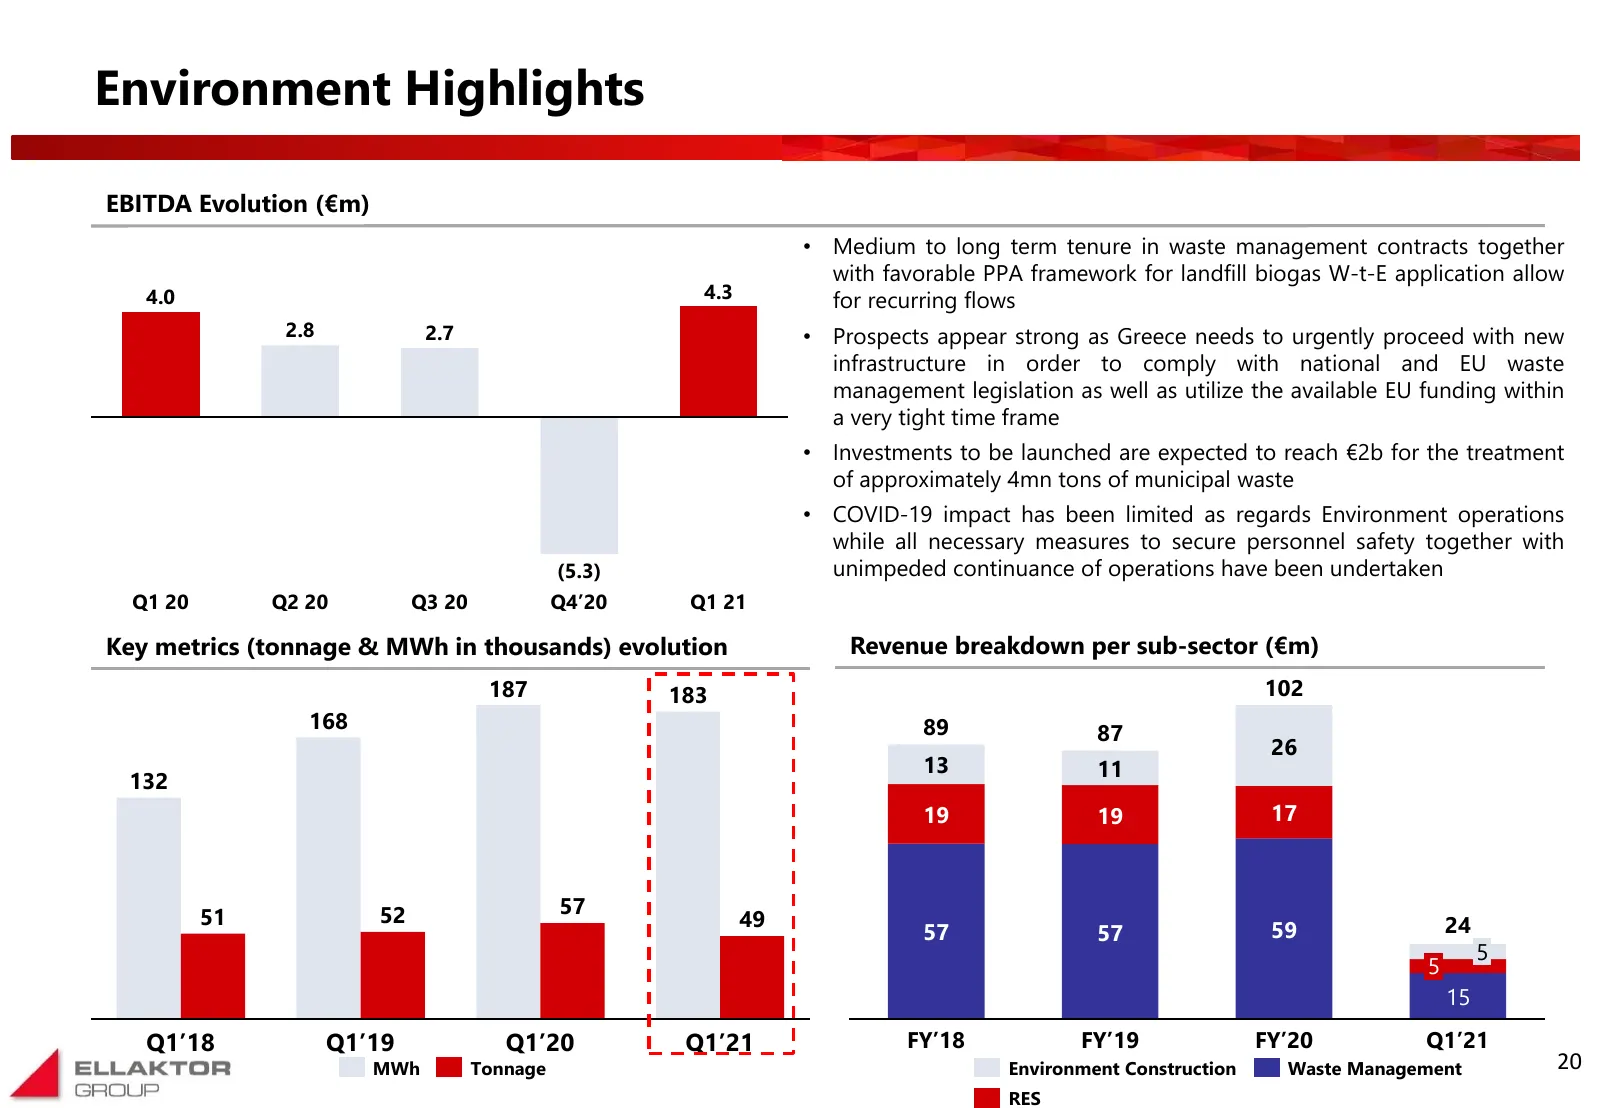
Environment Highlights EBITDA Evolution (€m) • Medium to long term tenure in waste management contracts together with favorable PPA framework for landfill biogas W-t-E application allow 4.0 4.3 for recurring flows 2.8 2.7 • Prospects appear strong as Greece needs to urgently proceed with new infrast
Slide 22: Real Estate Highlights
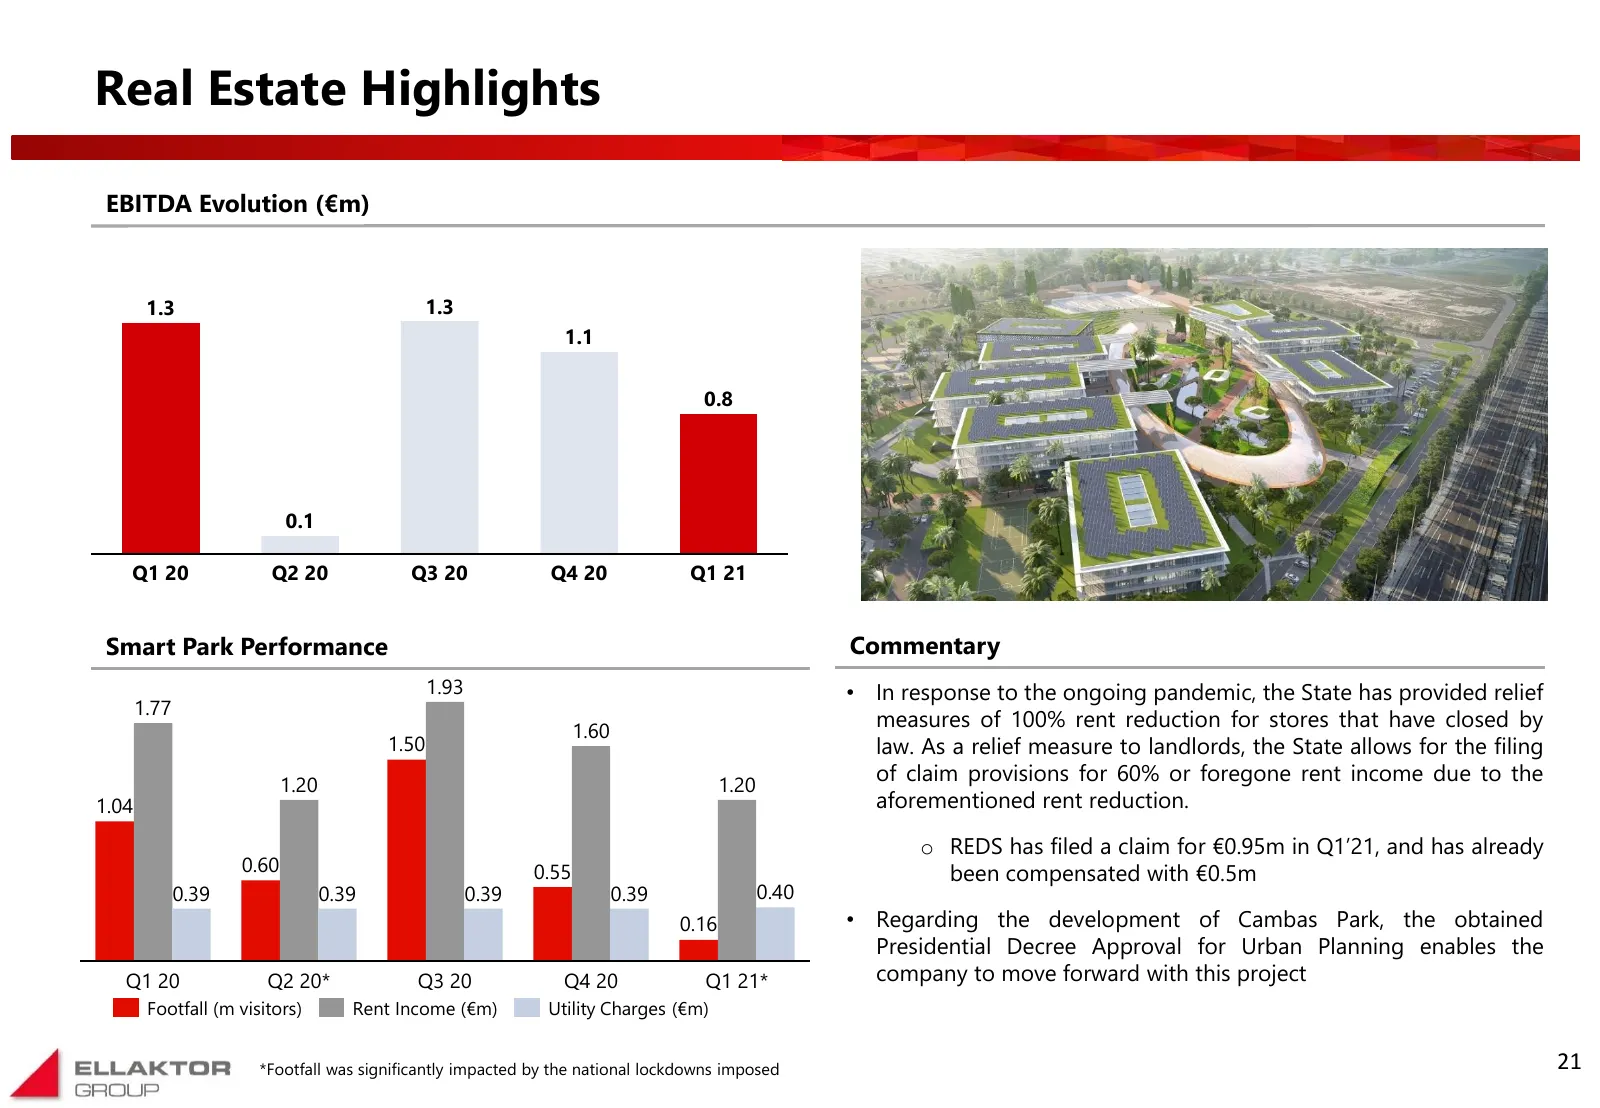
Real Estate Highlights EBITDA Evolution (€m) 1.3 1.3 1.1 0.8 0.1 Q1 20 Q2 20 Q3 20 Q4 20 Q1 21 Smart Park Performance Commentary 1.93 • In response to the ongoing pandemic, the State has provided relief 1.77 1.60 measures of 100% rent reduction for stores that have closed by 1.50 law. As a relief me
Slide 23: Content pages
Content pages Q1 2021 Results Highlights 3 Consolidated Balance Sheet & Cash Flow 12 Segmental Analysis 16 Appendix 23 22
Slide 24: P&L by segment
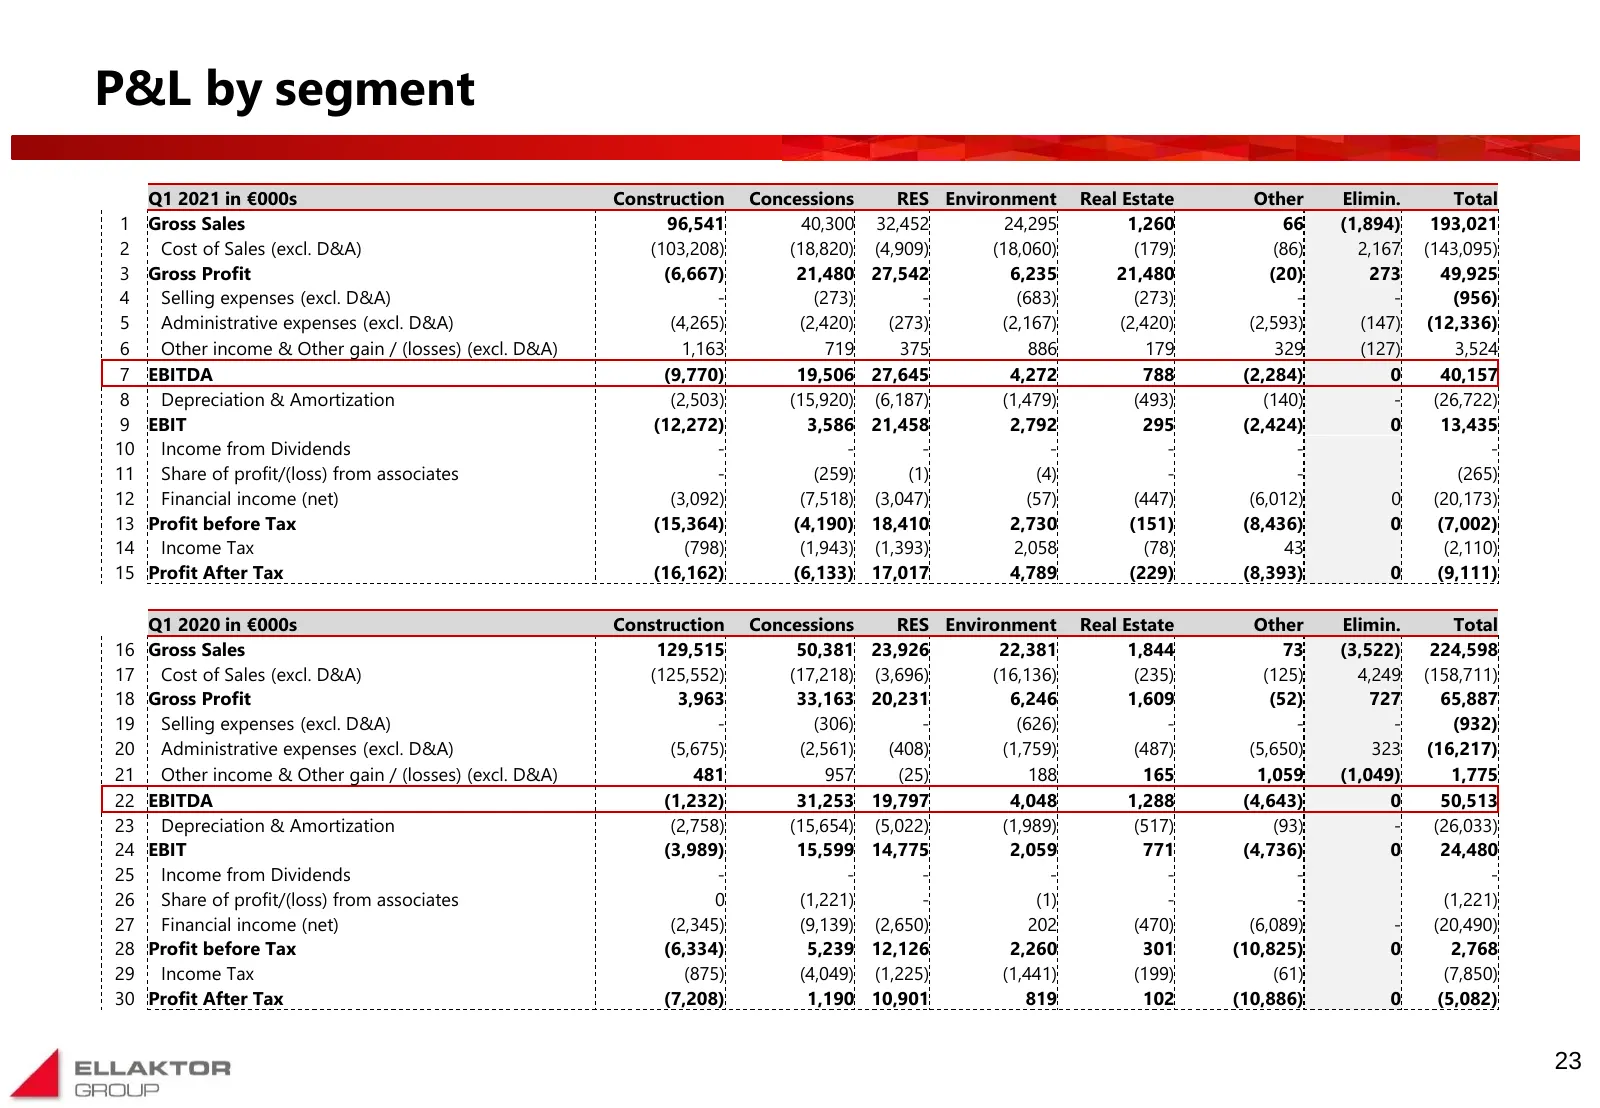
P&L by segment Q1 2021 in €000s Construction Concessions RES Environment Real Estate Other Elimin. Total 1 Gross Sales 96,541 40,300 32,452 24,295 1,260 66 (1,894) 193,021 2 Cost of Sales (excl. D&A) (103,208) (18,820) (4,909) (18,060) (179) (86) 2,167 (143,095) 3 Gross Profit (6,667) 21,480 27,542
Slide 25: Glossary / Alternative Performance Measures
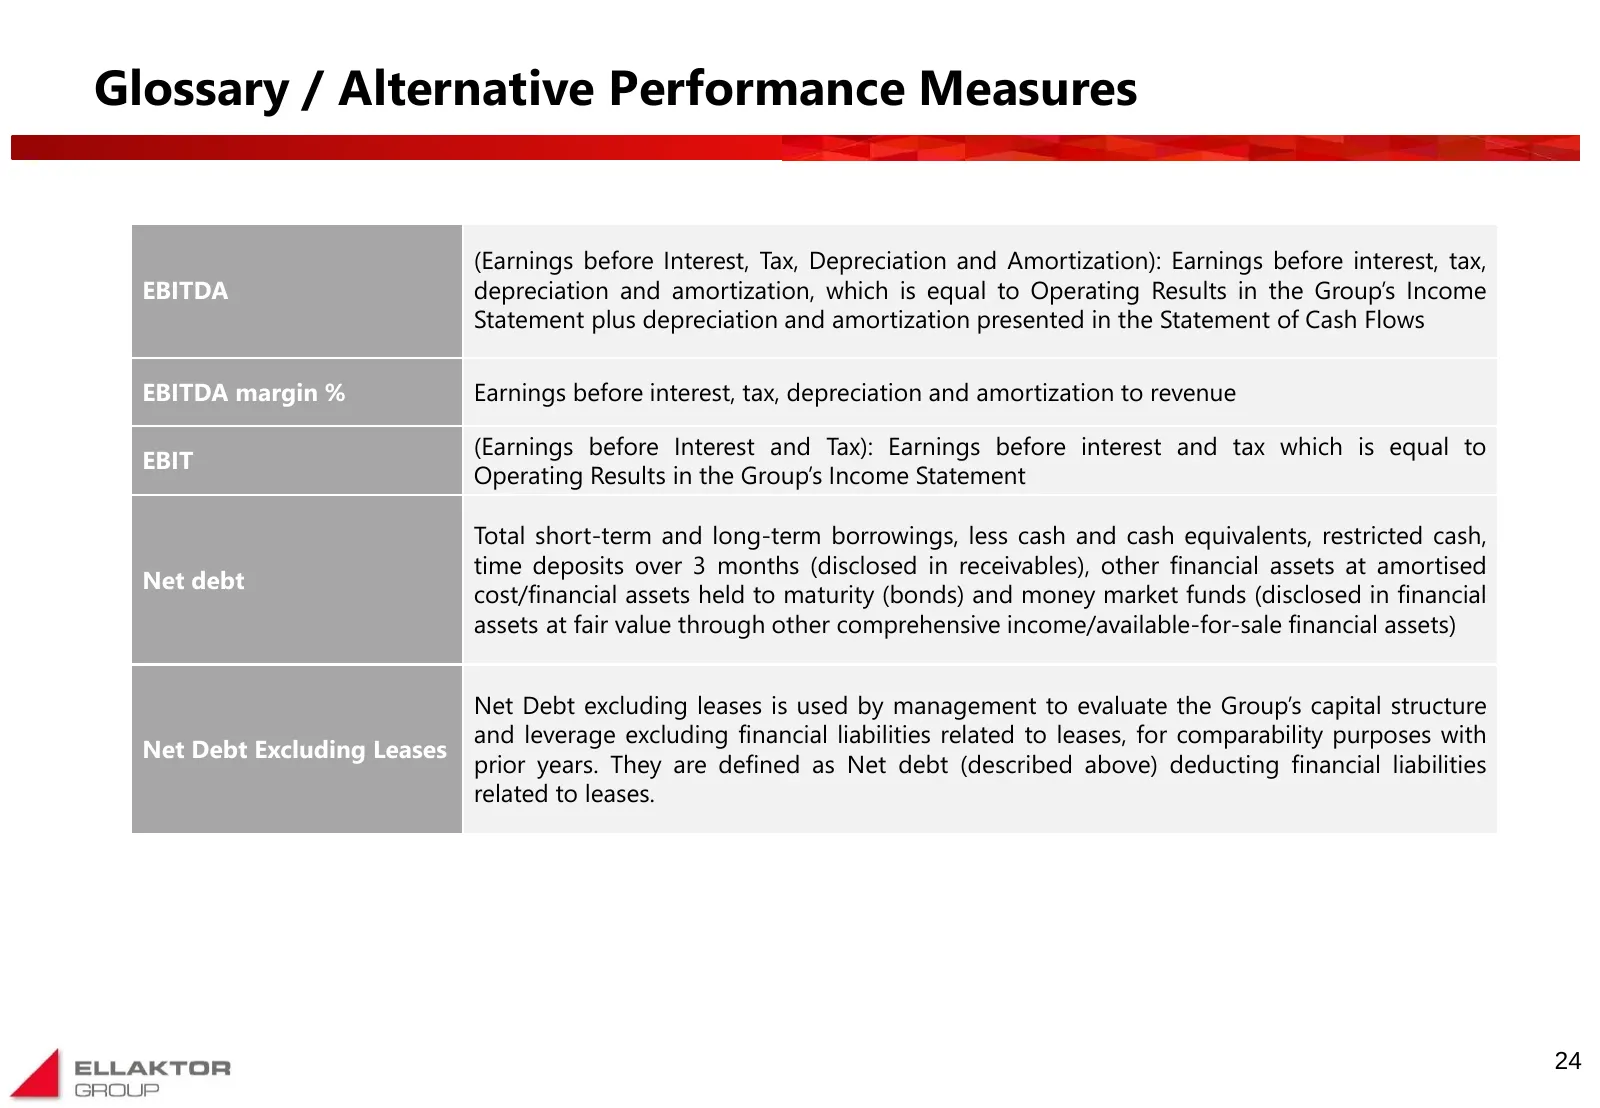
Glossary / Alternative Performance Measures (Earnings before Interest, Tax, Depreciation and Amortization): Earnings before interest, tax, EBITDA depreciation and amortization, which is equal to Operating Results in the Group’s Income Statement plus depreciation and amortization presented in the Sta
Slide 26: Contact details
Contact details George Poulopoulos Group CFO e-mail: gpoulopoulos@ellaktor.com Dimitrios Koutsoukos Director, Business Planning and Investor Relations e-mail: dkoutsoukos@ellaktor.com Investor Relations Desk e-mail: ir@ellaktor.com ELLAKTOR S.A. 25, Ermou St., 145 64 Nea Kifissia, Athens, Greece Tel
Source: Internet Archive copy of ellaktor.com
More decks from Ellaktor SA
 FY2025 Earnings Presentation23 slides · Apr 17, 2026
 FY2024 Earnings Presentation30 slides · Apr 24, 2025
 H1 2024 Earnings Presentation30 slides · Sep 12, 2024
 FY2023 Earnings Presentation32 slides · Apr 18, 2024
 9M 2023 Earnings Presentation31 slides · Nov 23, 2023
 9M 2023 Earnings Presentation48 slides · November 2023