INFICON Holding AG · SIX:IFCN
INFICON — Q2 2022 Earnings Presentation
20 slides from INFICON's earnings presentation, Jul 28, 2022
Slide 1: Q2 2022 Earnings Conference
Q2 2022 EARNINGS CONFERENCE July 28, 2022 Bad Ragaz, Switzerland
Slide 2: Speakers
Summary End Markets Outlook P&L / Balance Sheet Guidance Speakers Lukas Winkler, President and CEO Key figures Q2 2022 Target market business review Expectations 2022 Matthias Tröndle, Vice President and CFO Financials Q2 2022 Key financials half-year 2022 Guidance July 28, 2022 2
Slide 3: Q2 2022 – Key Figures
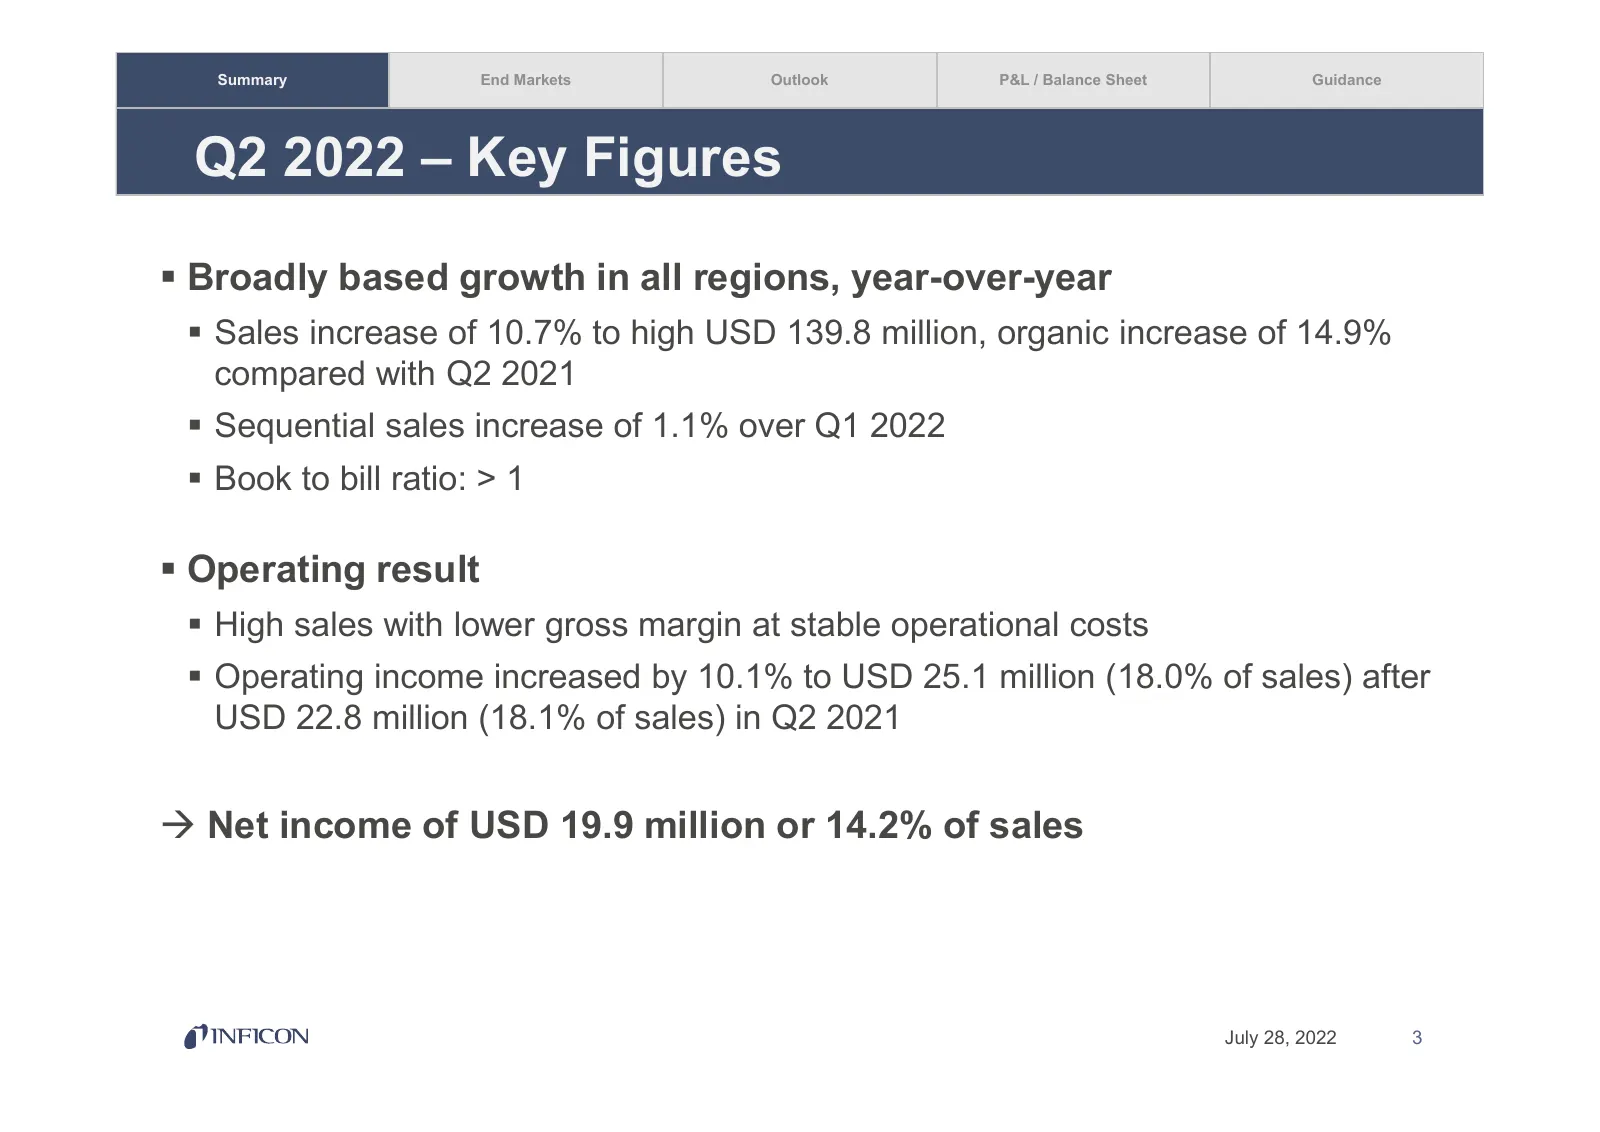
Summary End Markets Outlook P&L / Balance Sheet Guidance Q2 2022 – Key Figures Broadly based growth in all regions, year-over-year Sales increase of 10.7% to high USD 139.8 million, organic increase of 14.9% compared with Q2 2021 Sequential sales increase of 1.1% over Q1 2022 Book to bill ra
Slide 4: Net Sales by End Market
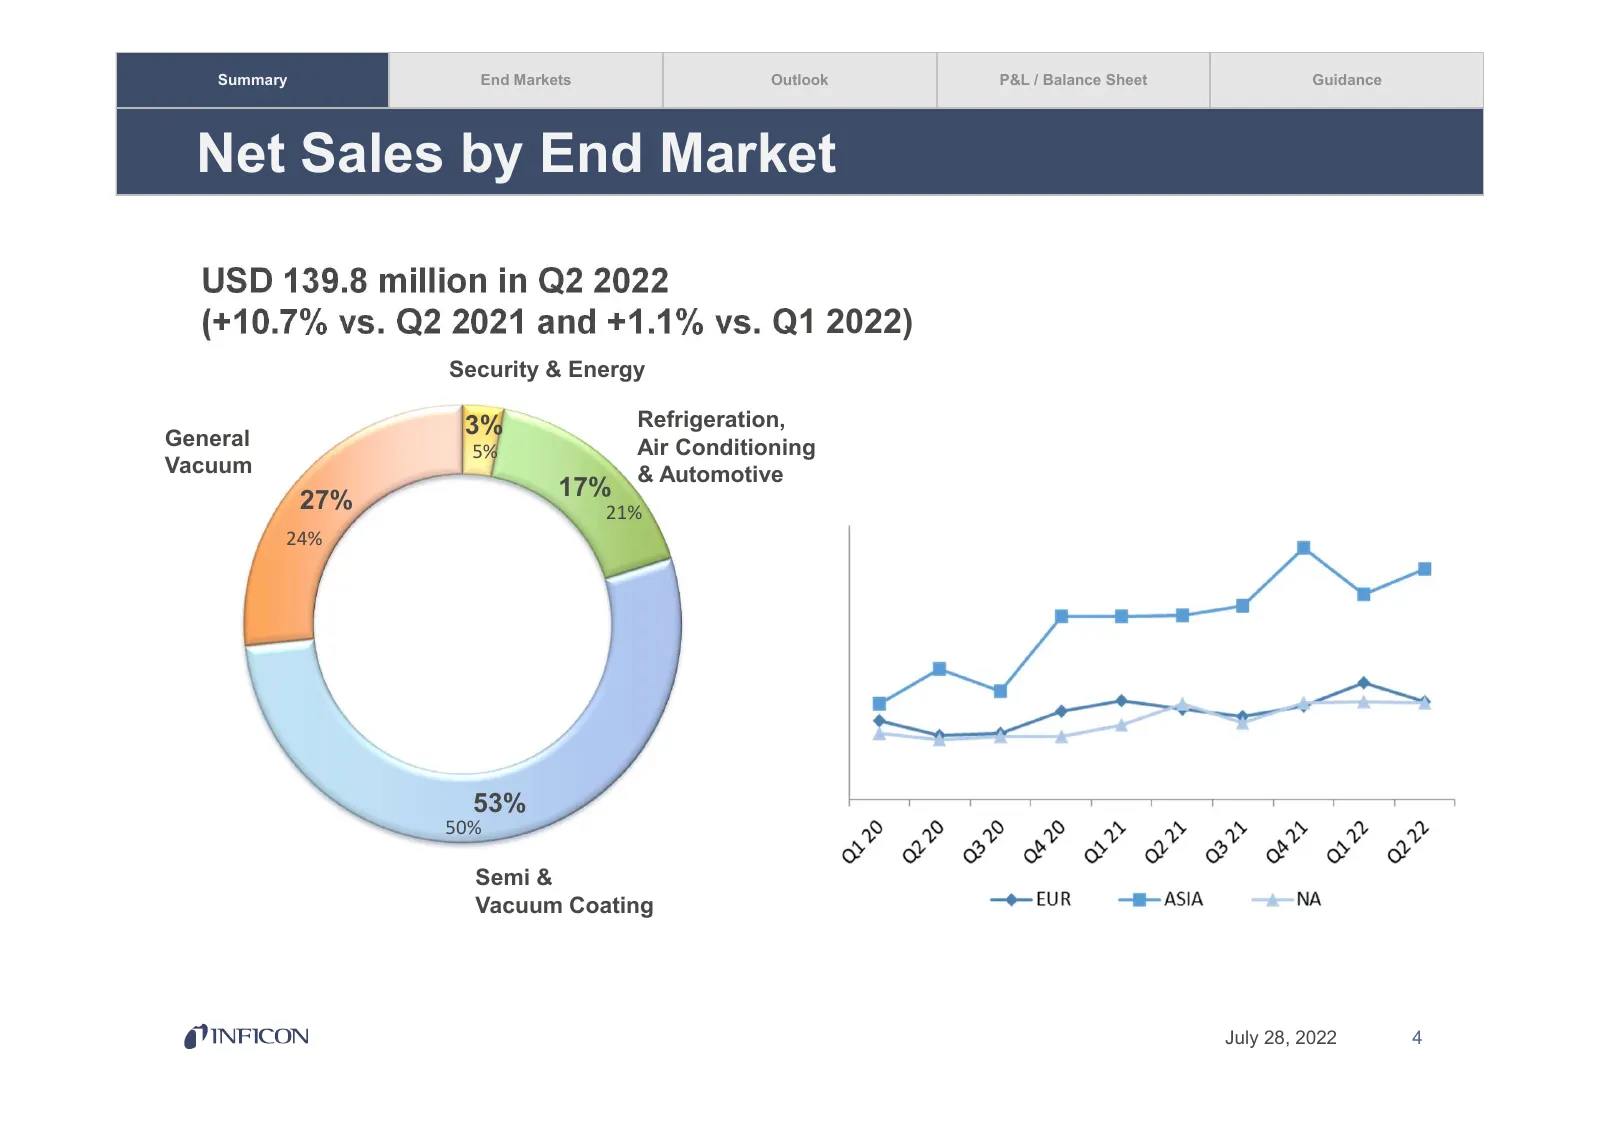
Summary End Markets Outlook P&L / Balance Sheet Guidance Net Sales by End Market USD 139.8 million in Q2 2022 (+10.7% vs. Q2 2021 and +1.1% vs. Q1 2022) Security & Energy 3% Refrigeration, General Air Conditioning 5% Vacuum & Automotive 17% 27% 21% 24% 53% 50% Semi & Vacuum Coating July 28, 2022 4
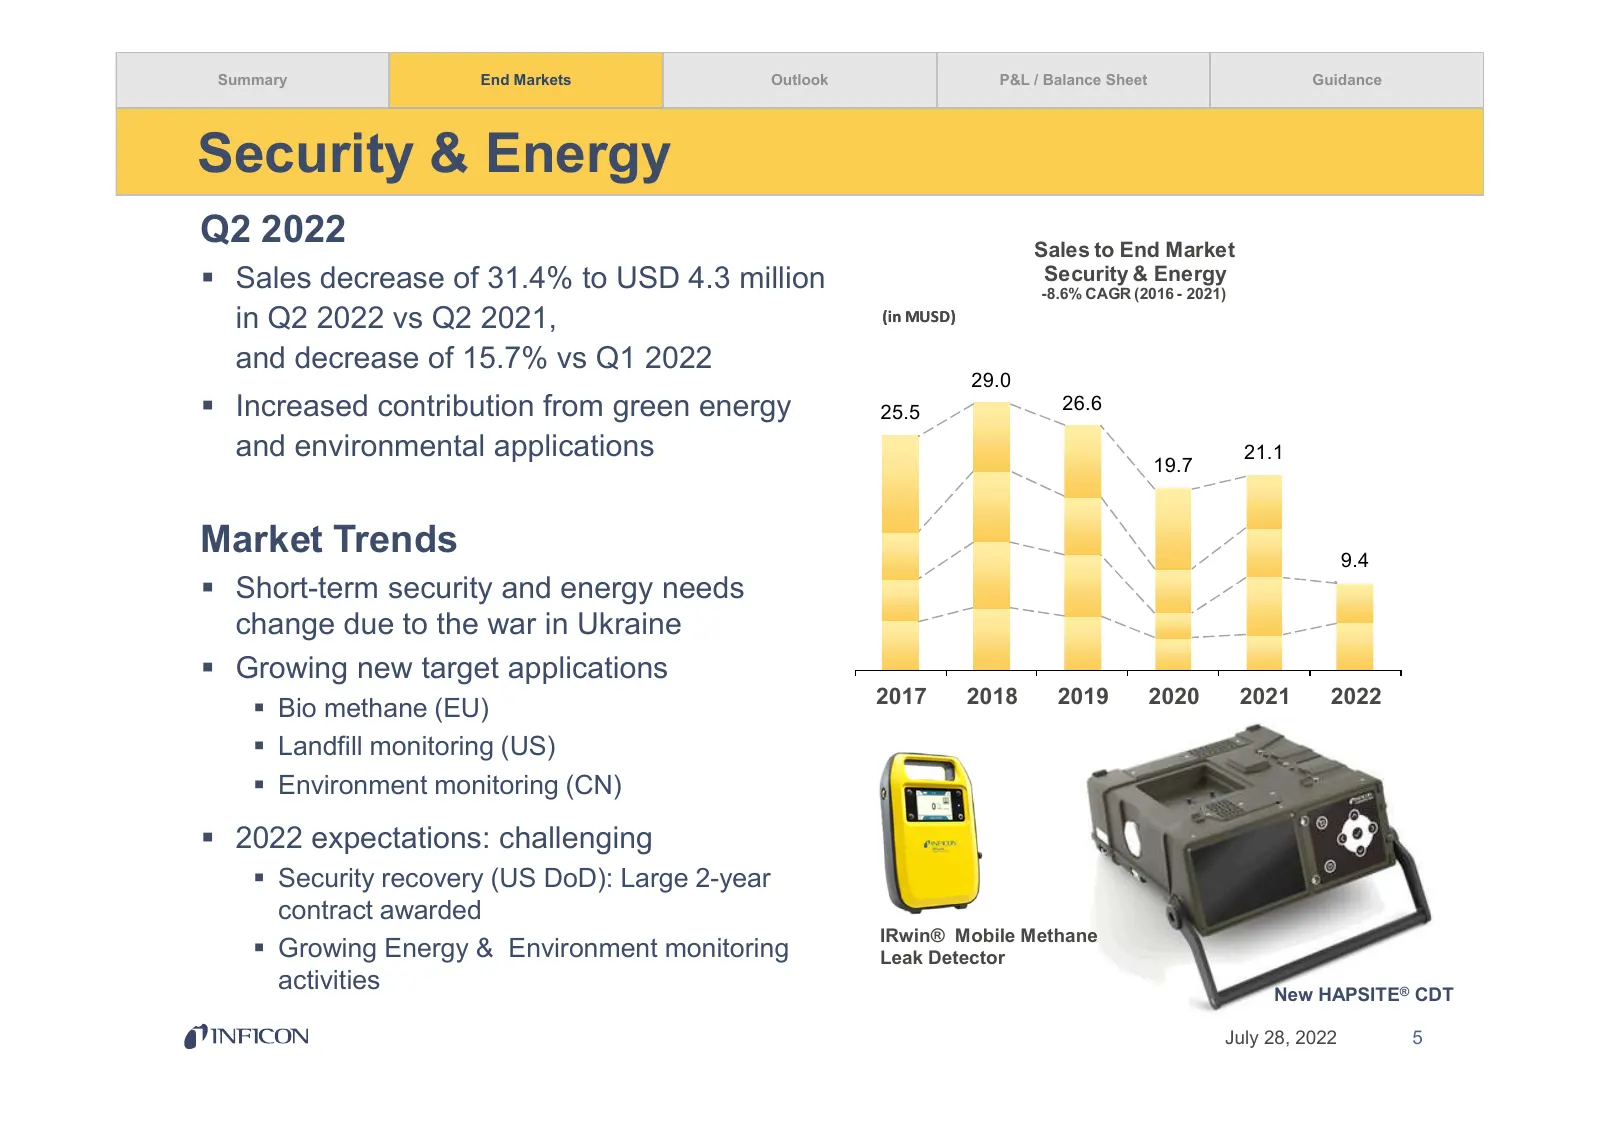
Slide 5: Security & Energy
Summary End Markets Outlook P&L / Balance Sheet Guidance Security & Energy Q2 2022 Sales to End Market Sales decrease of 31.4% to USD 4.3 million Security & Energy -8.6% CAGR (2016 - 2021) in Q2 2022 vs Q2 2021, (in MUSD) and decrease of 15.7% vs Q1 2022 29.0 Increased contribution from green en
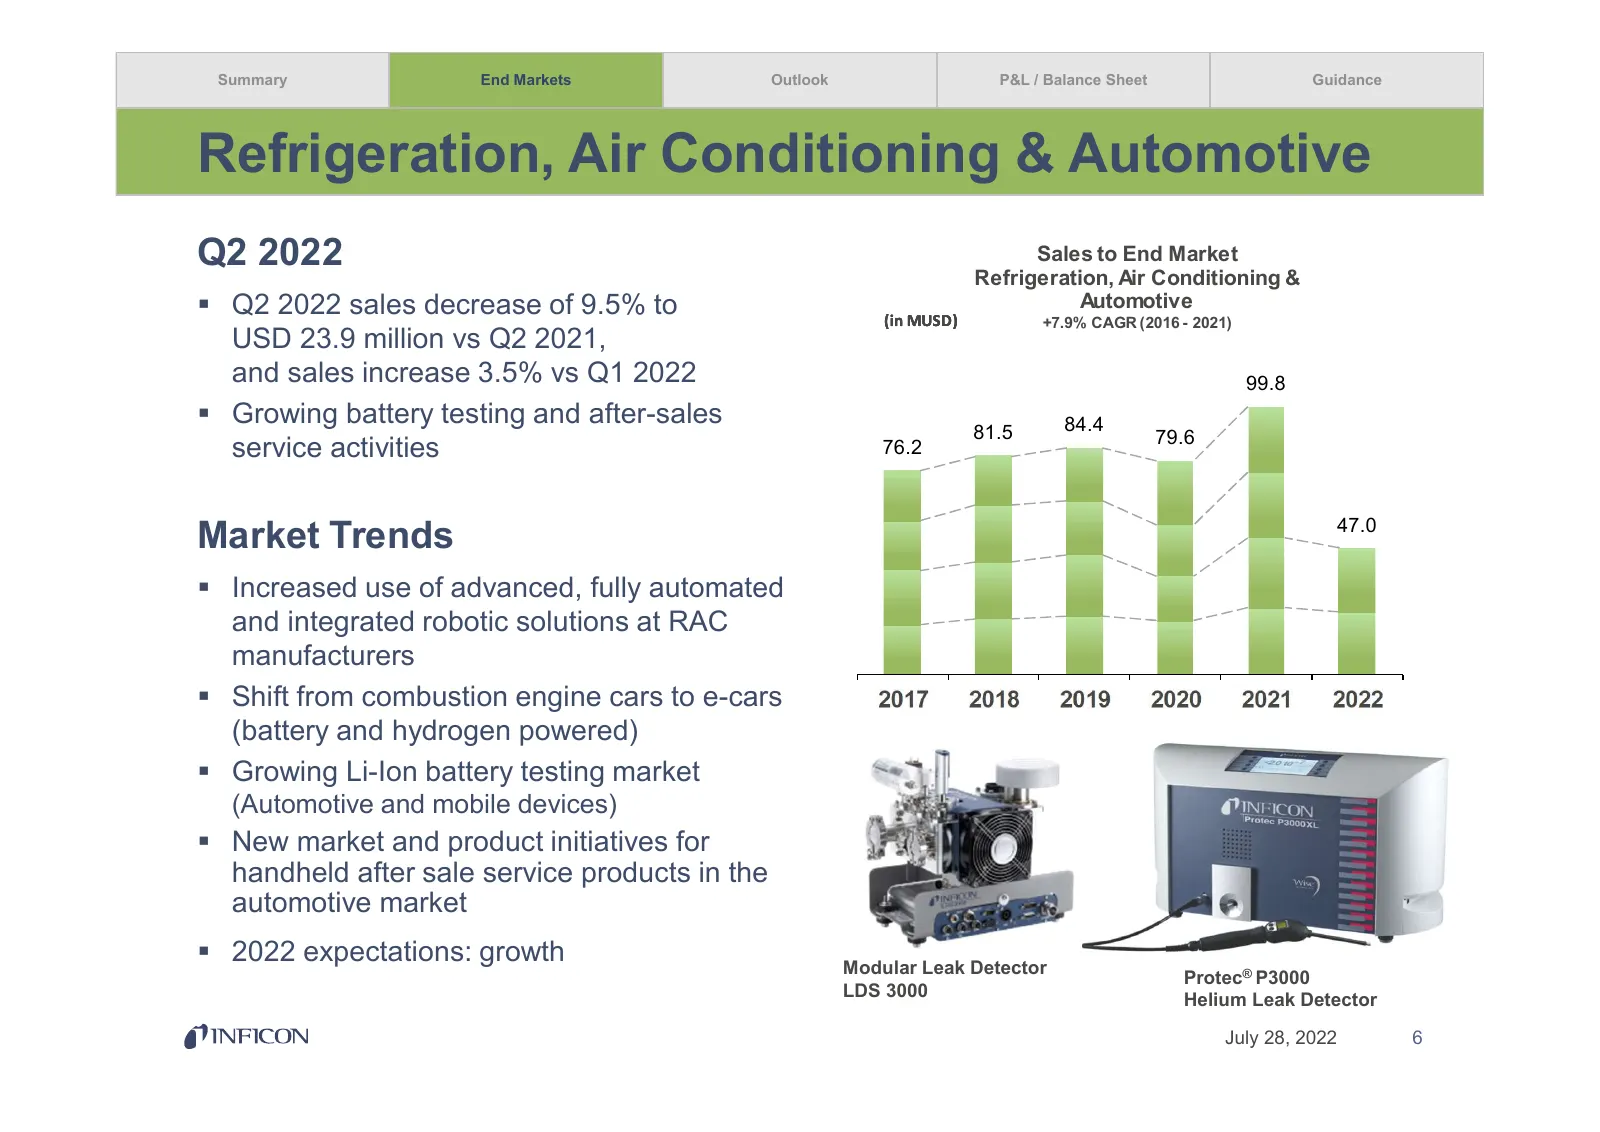
Slide 6: Refrigeration, Air Conditioning & Automotive
Summary End Markets Outlook P&L / Balance Sheet Guidance Refrigeration, Air Conditioning & Automotive Q2 2022 Sales to End Market Refrigeration, Air Conditioning & Q2 2022 sales decrease of 9.5% to (in MUSD) Automotive +7.9% CAGR (2016 - 2021) USD 23.9 million vs Q2 2021, and sales increase 3.5% v
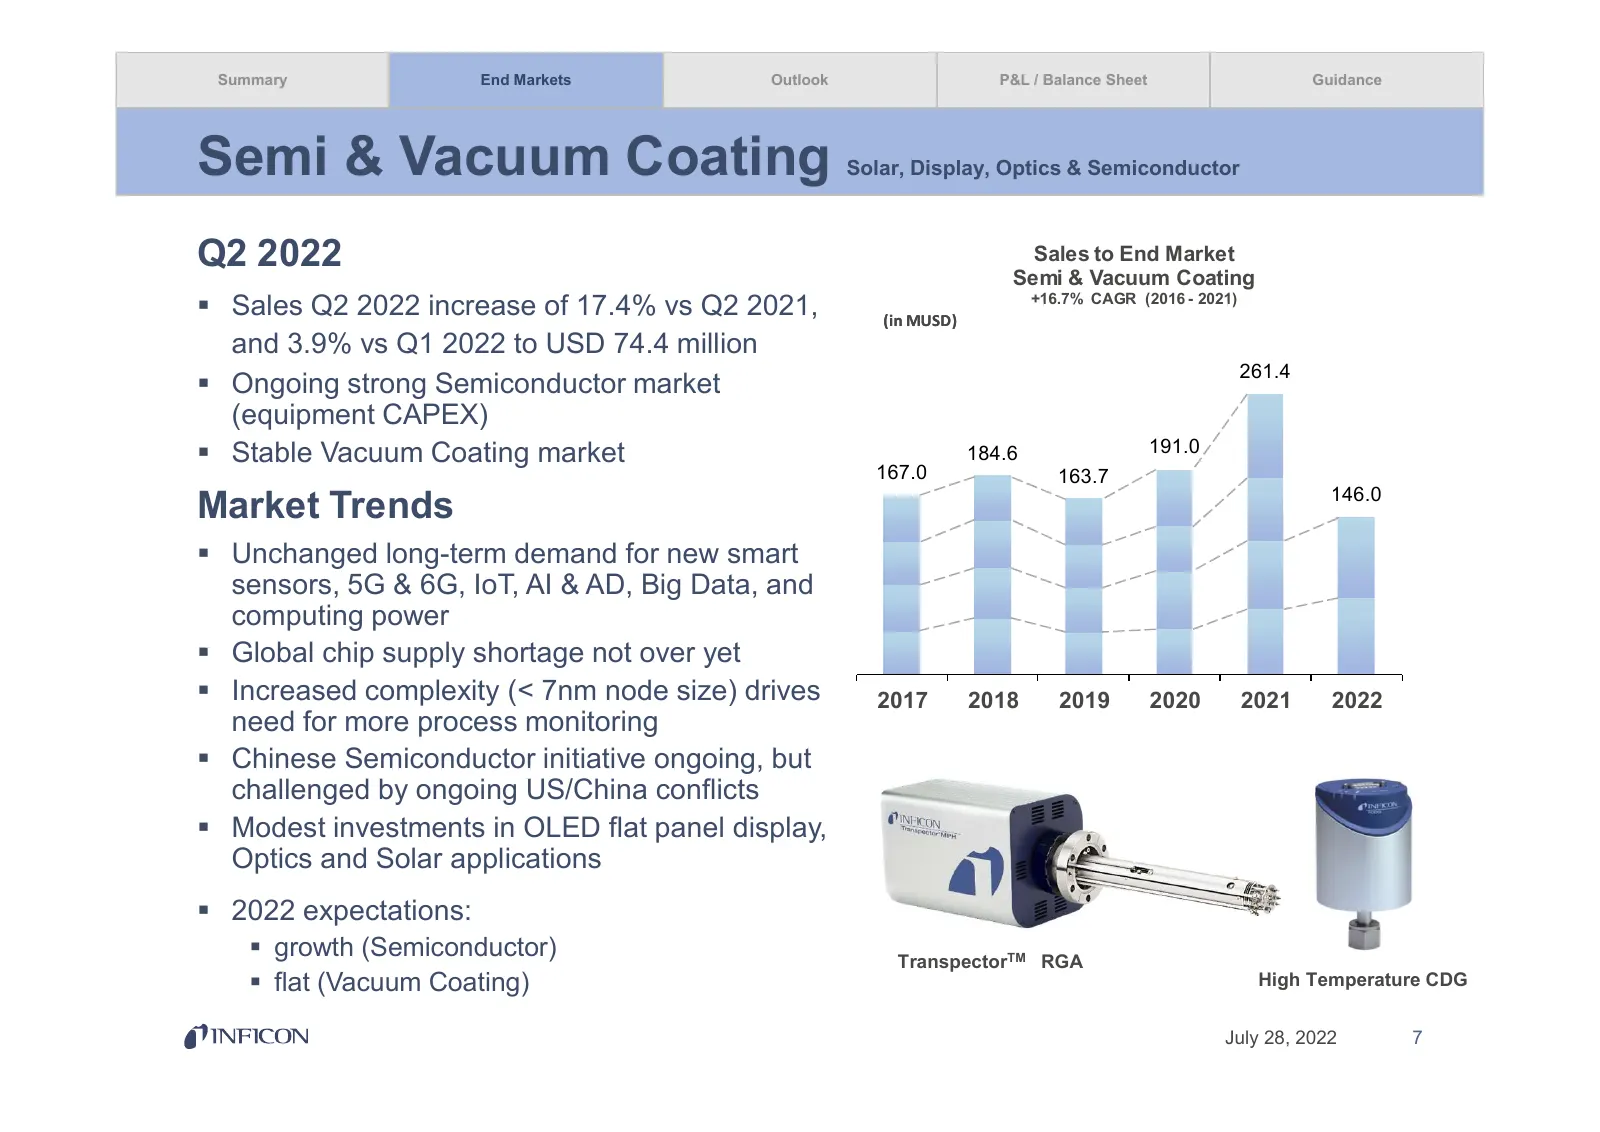
Slide 7: Semi & Vacuum Coating
Summary End Markets Outlook P&L / Balance Sheet Guidance Semi & Vacuum Coating Solar, Display, Optics & Semiconductor Q2 2022 Sales to End Market Semi & Vacuum Coating Sales Q2 2022 increase of 17.4% vs Q2 2021, (in MUSD) +16.7% CAGR (2016 - 2021) and 3.9% vs Q1 2022 to USD 74.4 million 261.4 On
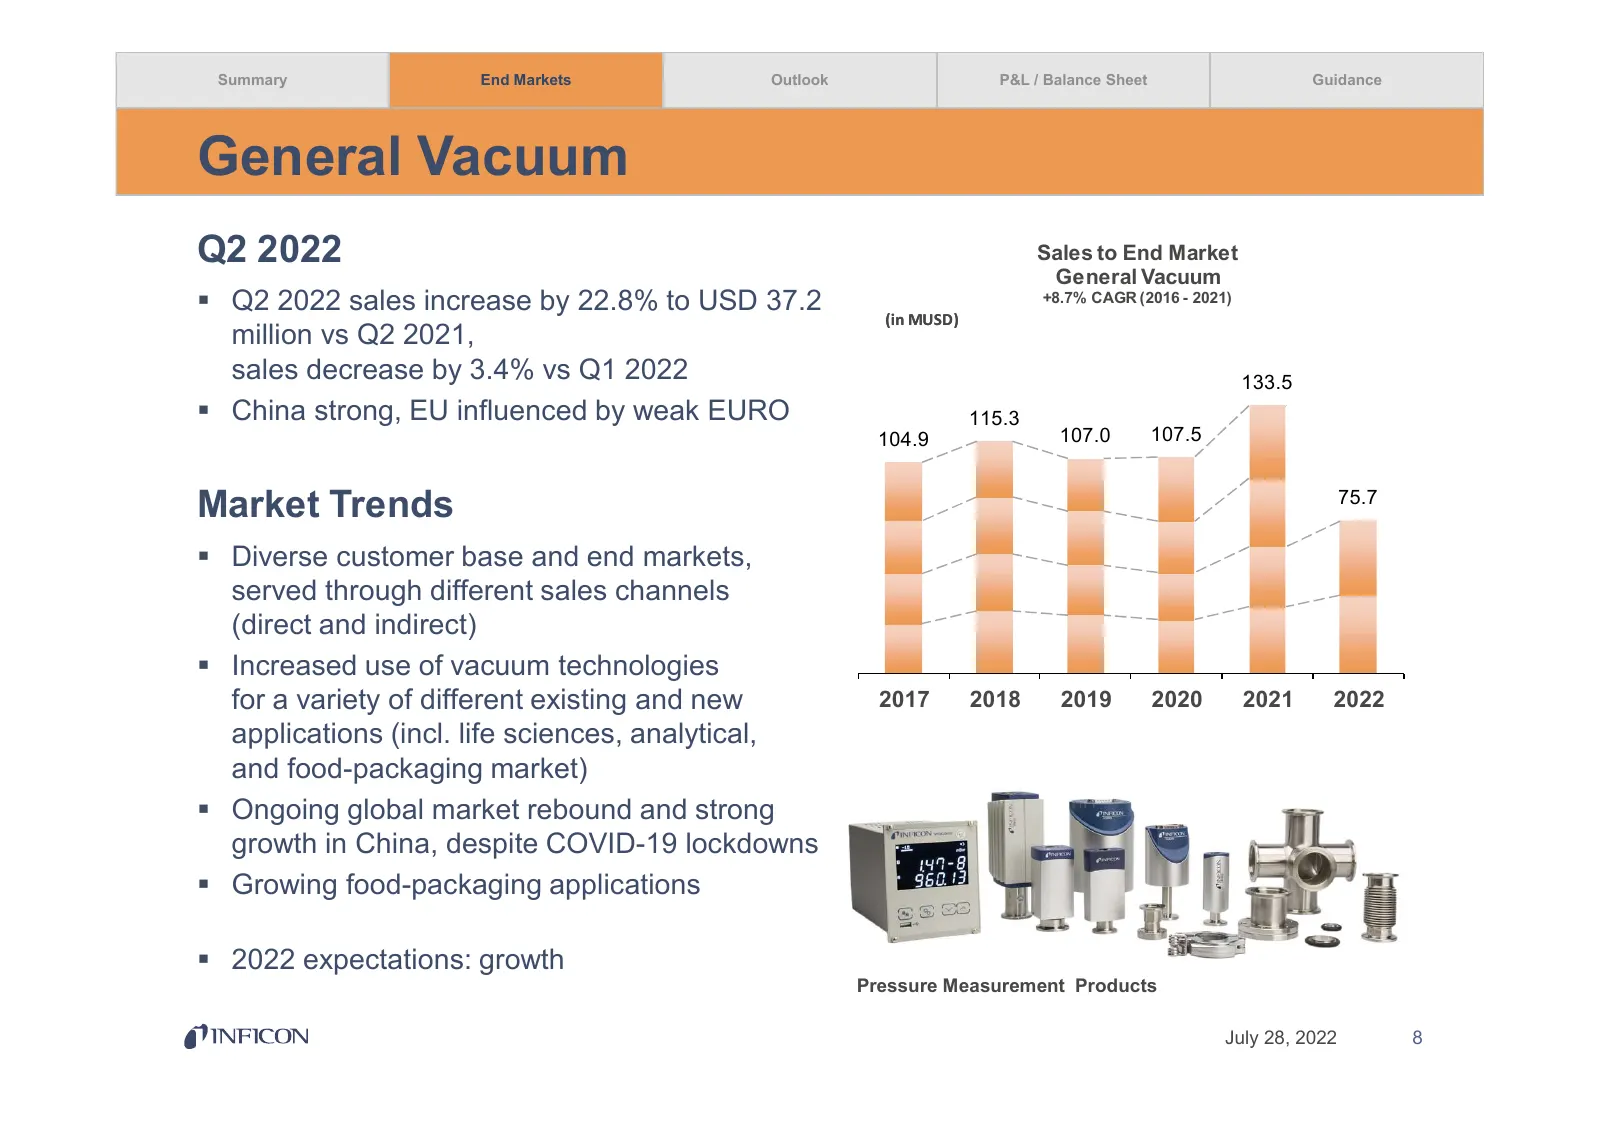
Slide 8: General Vacuum
Summary End Markets Outlook P&L / Balance Sheet Guidance General Vacuum Q2 2022 Sales to End Market General Vacuum Q2 2022 sales increase by 22.8% to USD 37.2 +8.7% CAGR (2016 - 2021) (in MUSD) million vs Q2 2021, sales decrease by 3.4% vs Q1 2022 133.5 China strong, EU influenced by weak EURO 1
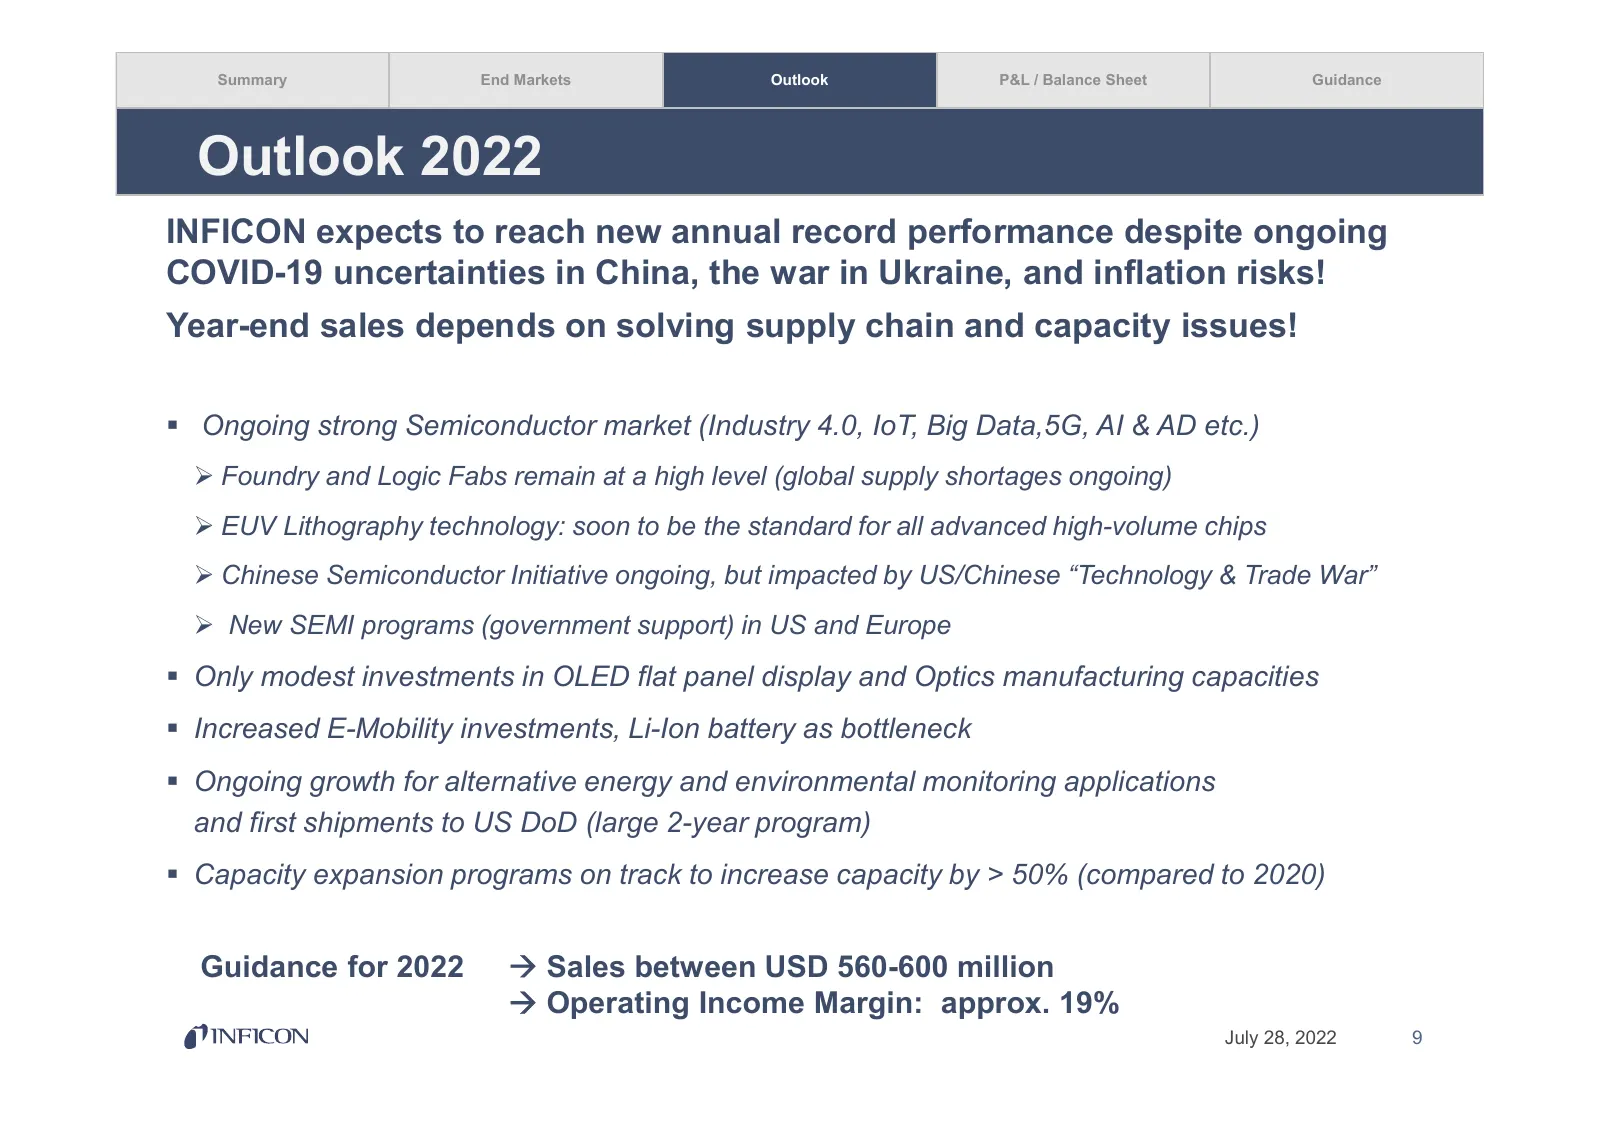
Slide 9: Outlook 2022
Summary End Markets Outlook P&L / Balance Sheet Guidance Outlook 2022 INFICON expects to reach new annual record performance despite ongoing COVID-19 uncertainties in China, the war in Ukraine, and inflation risks! Year-end sales depends on solving supply chain and capacity issues! Ongoing strong
Slide 10: Speaker Matthias Tröndle, Vice President and CFO
Summary End Markets Outlook P&L / Balance Sheet Guidance Speaker Matthias Tröndle, Vice President and CFO Financials Q2 2022 Key financials half-year 2022 Guidance July 28, 2022 10
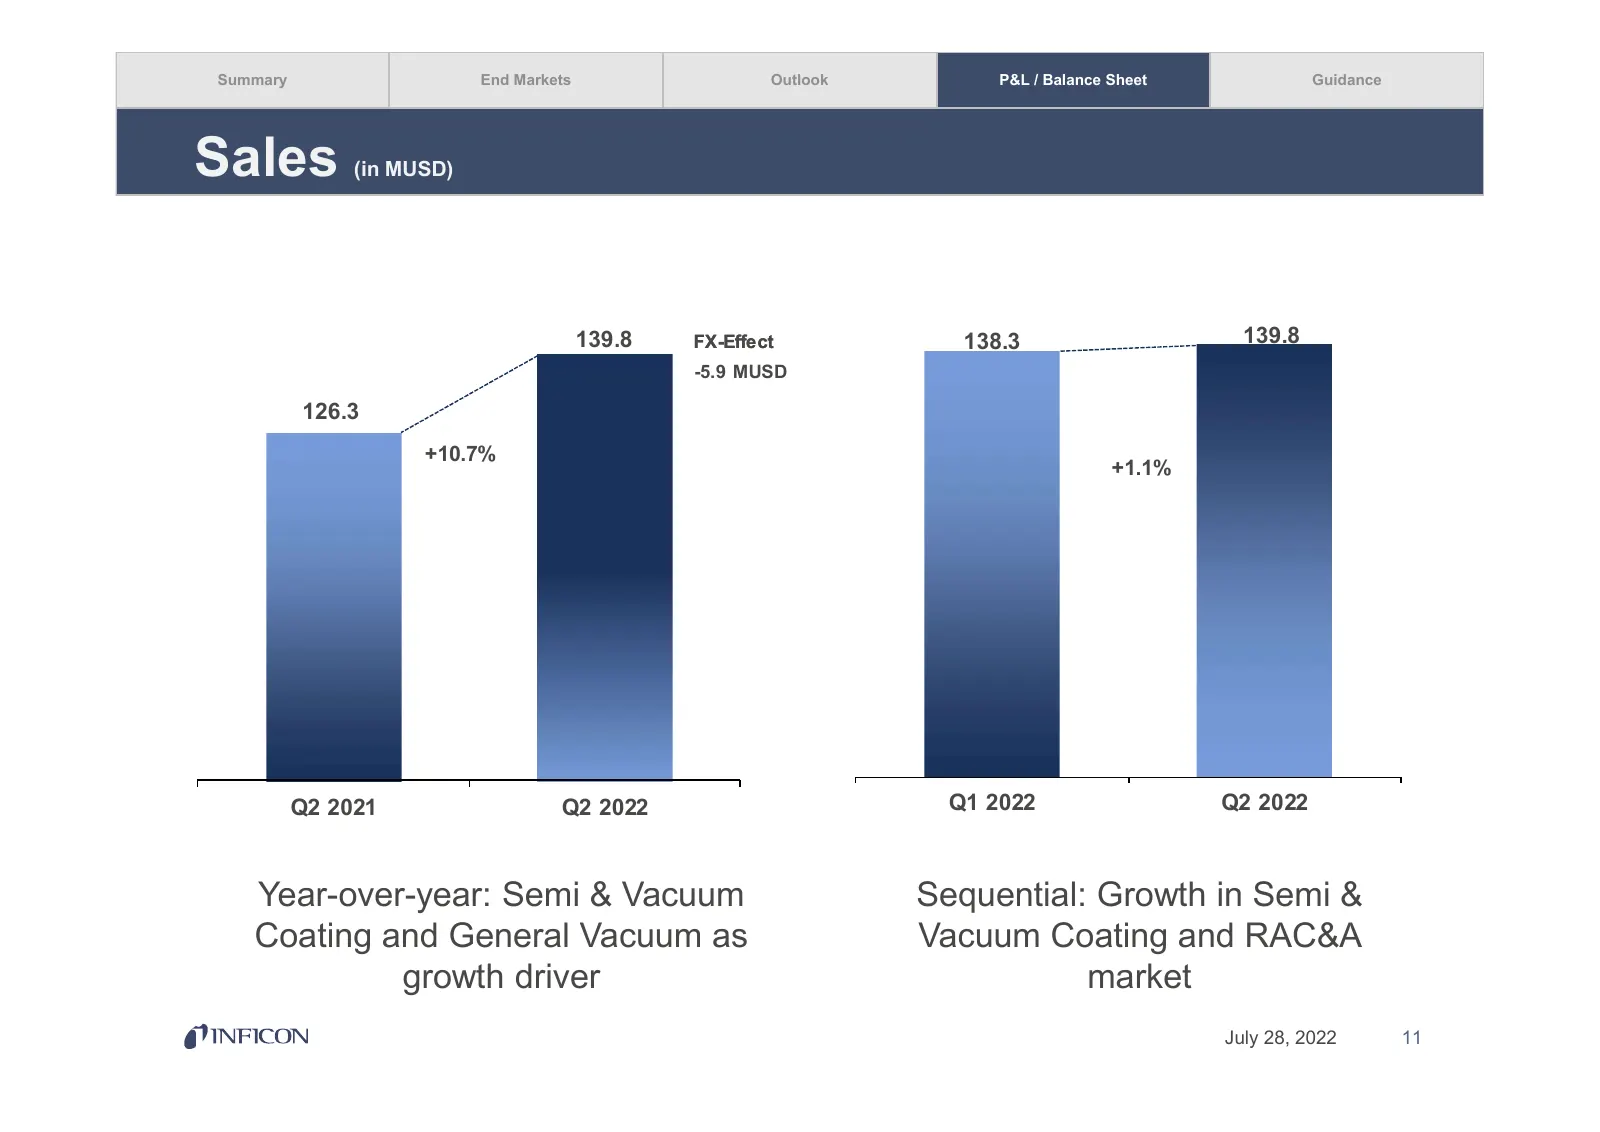
Slide 11: Sales
Summary End Markets Outlook P&L / Balance Sheet Guidance Sales (in MUSD) 139.8 FX-Effect 138.3 139.8 -5.9 MUSD 126.3 +10.7% +1.1% Q2 2021 Q2 2022 Q1 2022 Q2 2022 Year-over-year: Semi & Vacuum Sequential: Growth in Semi & Coating and General Vacuum as Vacuum Coating and RAC&A growth driver market Jul
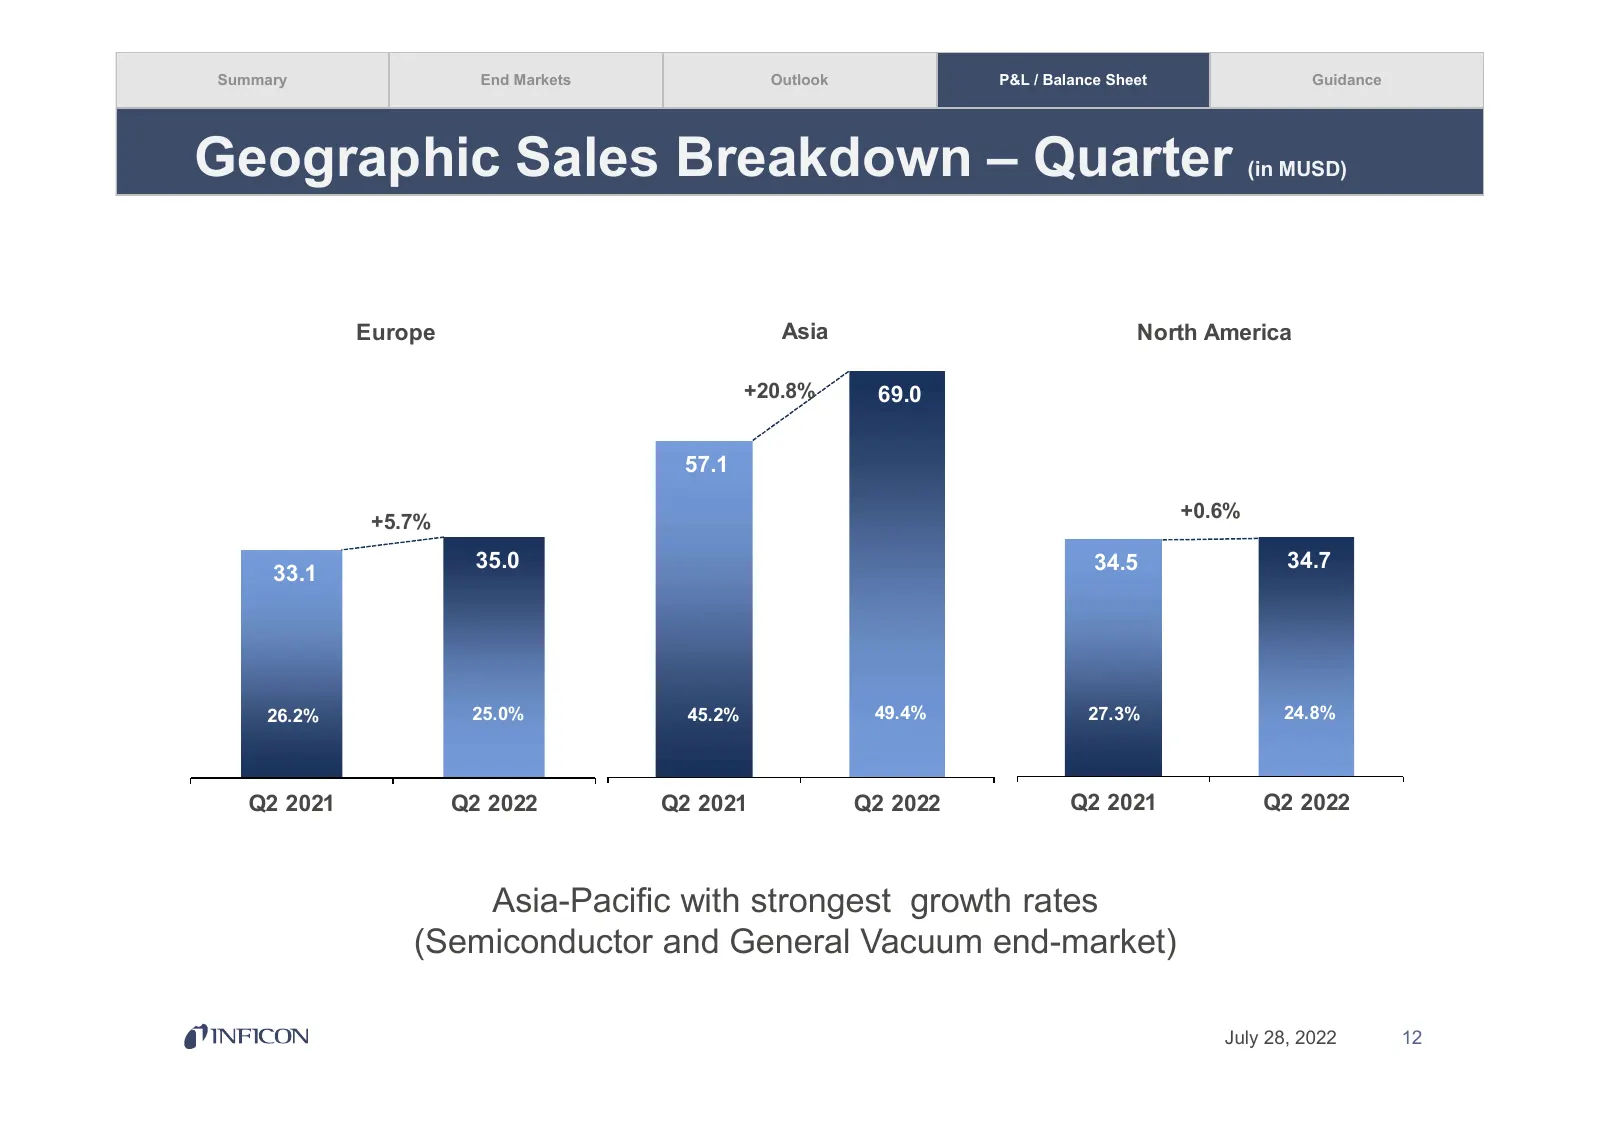
Slide 12: Geographic Sales Breakdown – Quarter
Summary End Markets Outlook P&L / Balance Sheet Guidance Geographic Sales Breakdown – Quarter (in MUSD) Europe Asia North America +20.8% 69.0 57.1 +0.6% +5.7% 35.0 34.5 34.7 33.1 26.2% 25.0% 45.2% 49.4% 27.3% 24.8% Q2 2021 Q2 2022 Q2 2021 Q2 2022 Q2 2021 Q2 2022 Asia-Pacific with strongest growth ra
Slide 13: Gross Profit, Costs, and Operating Income
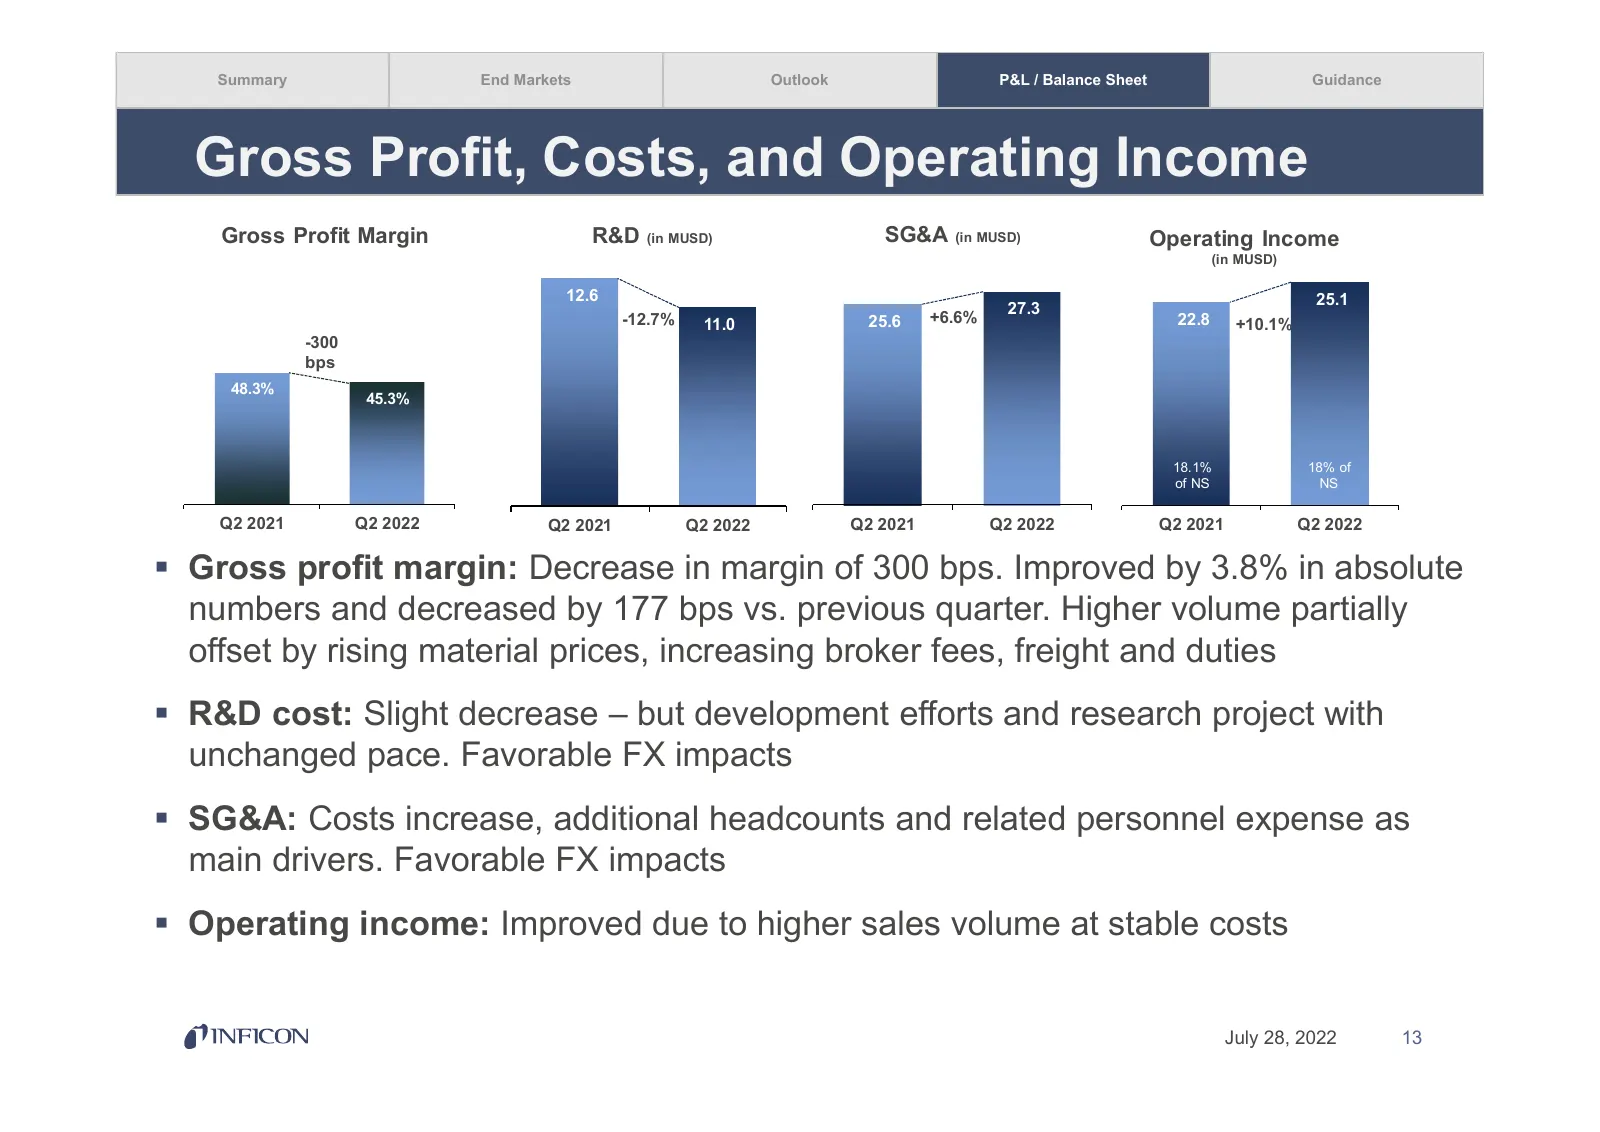
Summary End Markets Outlook P&L / Balance Sheet Guidance Gross Profit, Costs, and Operating Income Gross Profit Margin R&D (in MUSD) SG&A (in MUSD) Operating Income (in MUSD) 12.6 25.1 27.3 -12.7% 11.0 25.6 +6.6% 22.8 +10.1% -300 bps 48.3% 45.3% 18.1% 18% of of NS NS Q2 2021 Q2 2022 Q2 2021 Q2 2022
Slide 14: Net Income and EPS Development
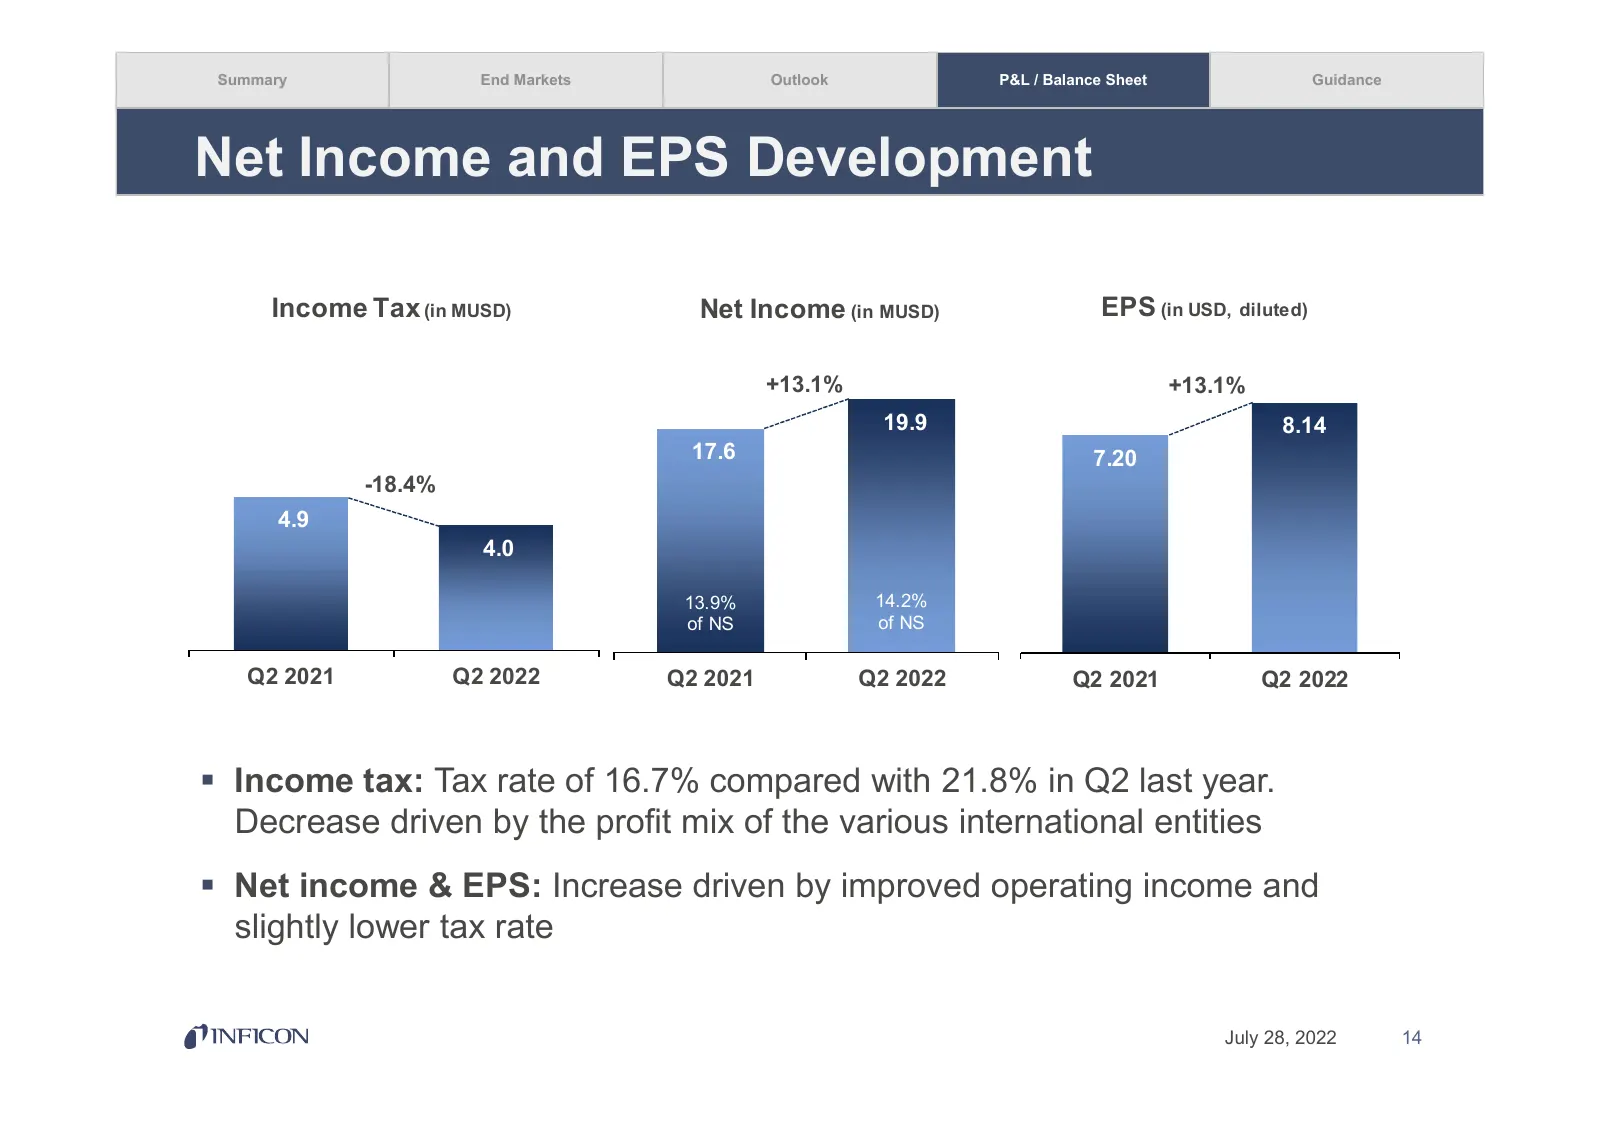
Summary End Markets Outlook P&L / Balance Sheet Guidance Net Income and EPS Development Income Tax (in MUSD) Net Income (in MUSD) EPS (in USD, diluted) +13.1% +13.1% 19.9 8.14 17.6 7.20 -18.4% 4.9 4.0 13.9% 14.2% of NS of NS Q2 2021 Q2 2022 Q2 2021 Q2 2022 Q2 2021 Q2 2022 Income tax: Tax rate of 1
Slide 15: Balance Sheet Highlights
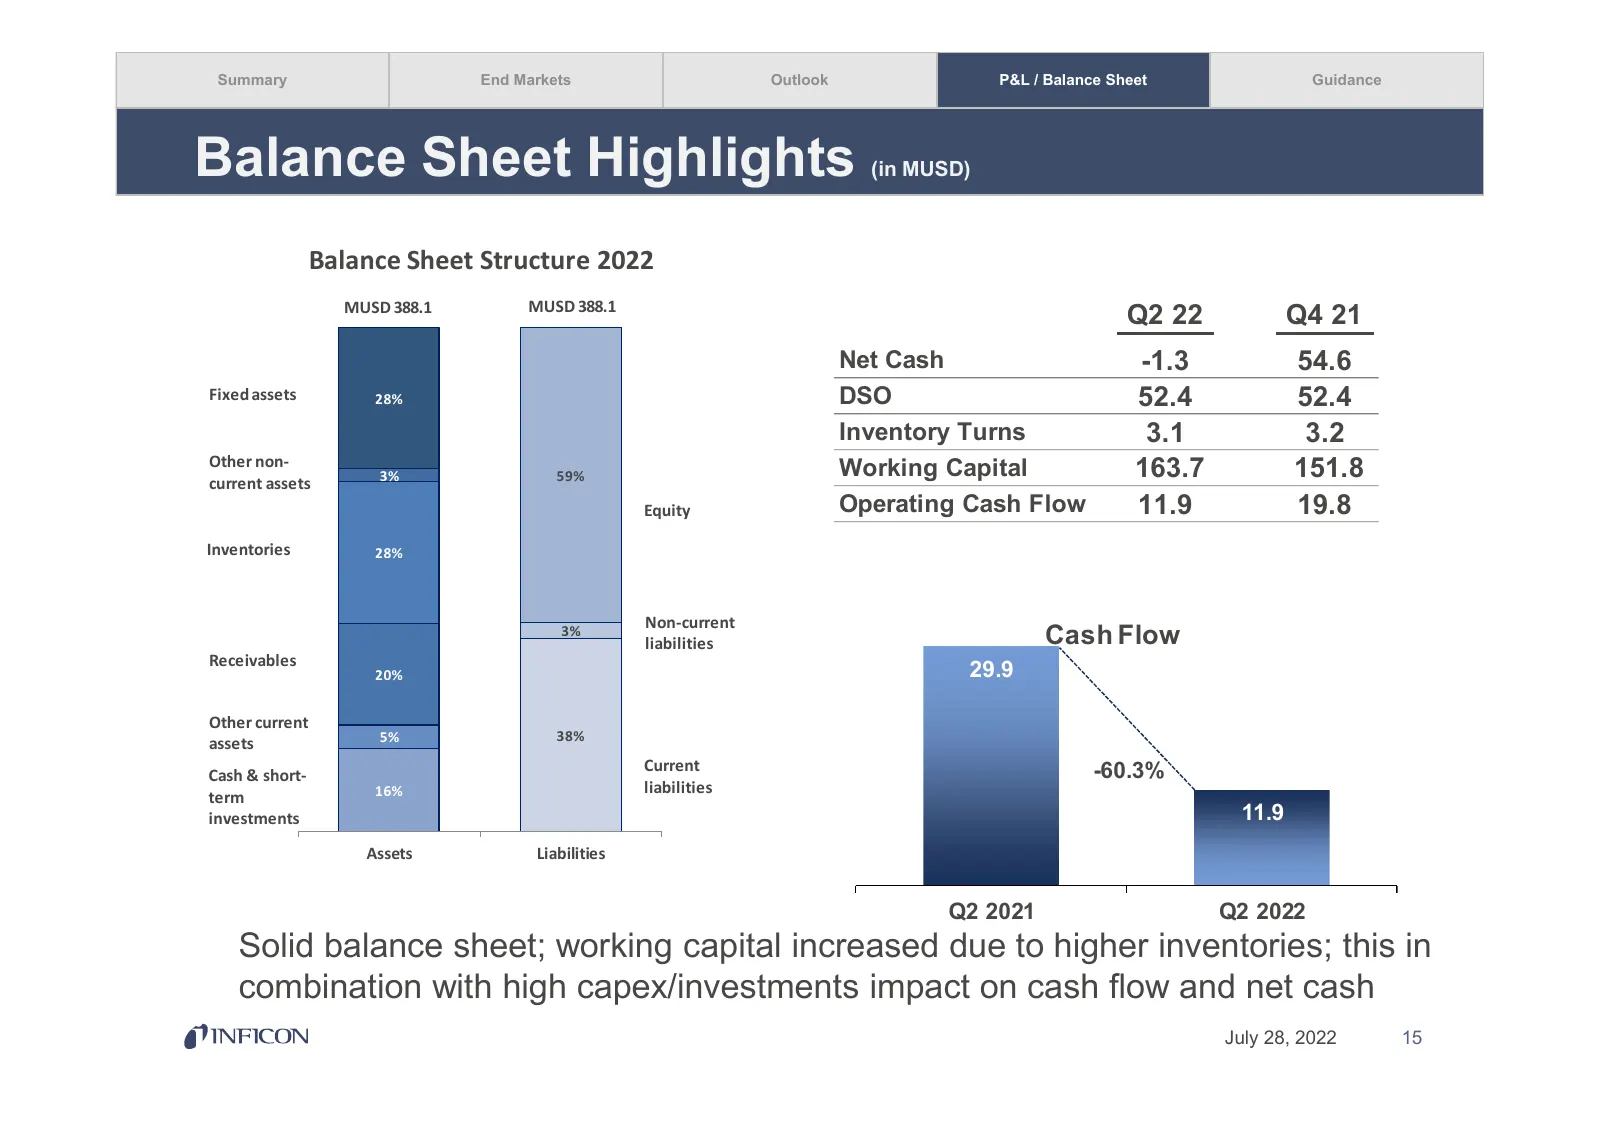
Summary End Markets Outlook P&L / Balance Sheet Guidance Balance Sheet Highlights (in MUSD) Balance Sheet Structure 2022 MUSD 388.1 MUSD 388.1 Q2 22 Q4 21 Net Cash -1.3 54.6 Fixed assets 28% DSO 52.4 52.4 Inventory Turns 3.1 3.2 Other non- current assets 3% 59% Working Capital 163.7 151.8 Equity Ope
Slide 16: Financial Performance Half-Year 2022
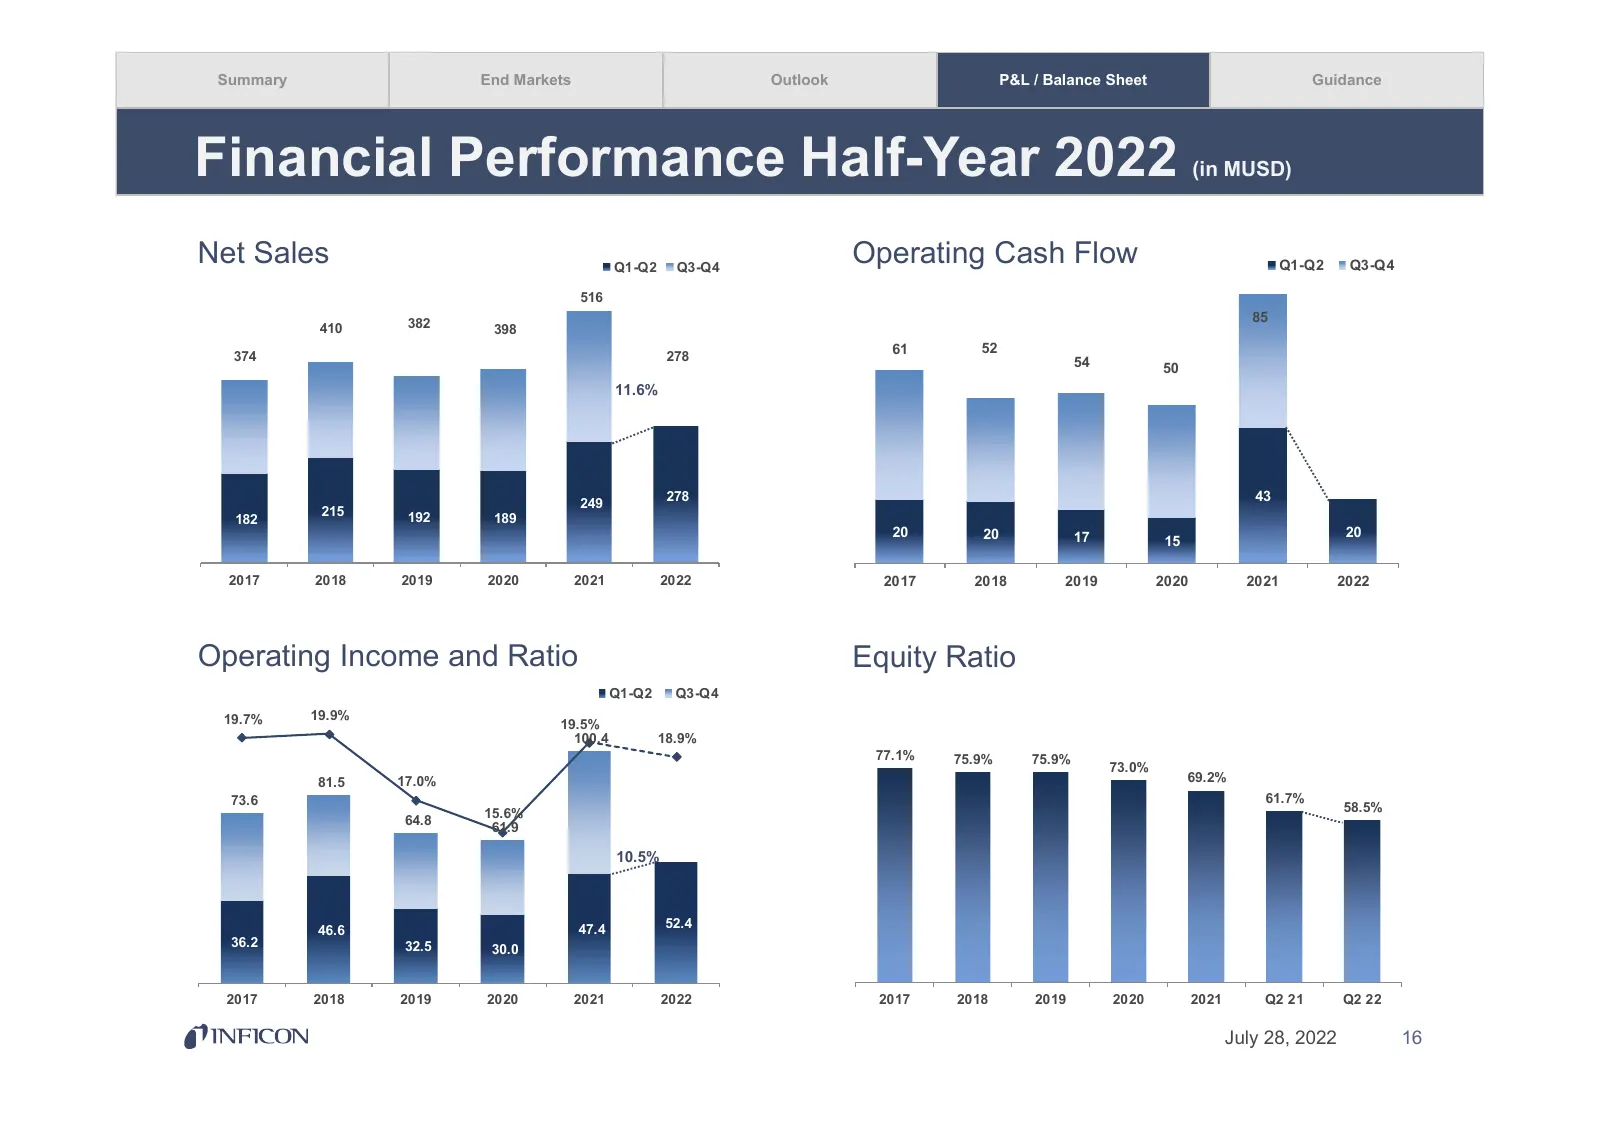
Summary End Markets Outlook P&L / Balance Sheet Guidance Financial Performance Half-Year 2022 (in MUSD) Net Sales Q1-Q2 Q3-Q4 Operating Cash Flow Q1-Q2 Q3-Q4 516 382 85 410 398 61 52 374 278 54 50 11.6% 249 278 43 215 192 189 182 20 20 17 20 15 2017 2018 2019 2020 2021 2022 2017 2018 2019 2020 2021
Slide 17: Guidance FY 2022 and Corporate Communication Calendar
Summary End Markets Outlook P&L / Balance Sheet Guidance GUIDANCE FY 2022 AND CORPORATE COMMUNICATION CALENDAR July 28, 2022 17
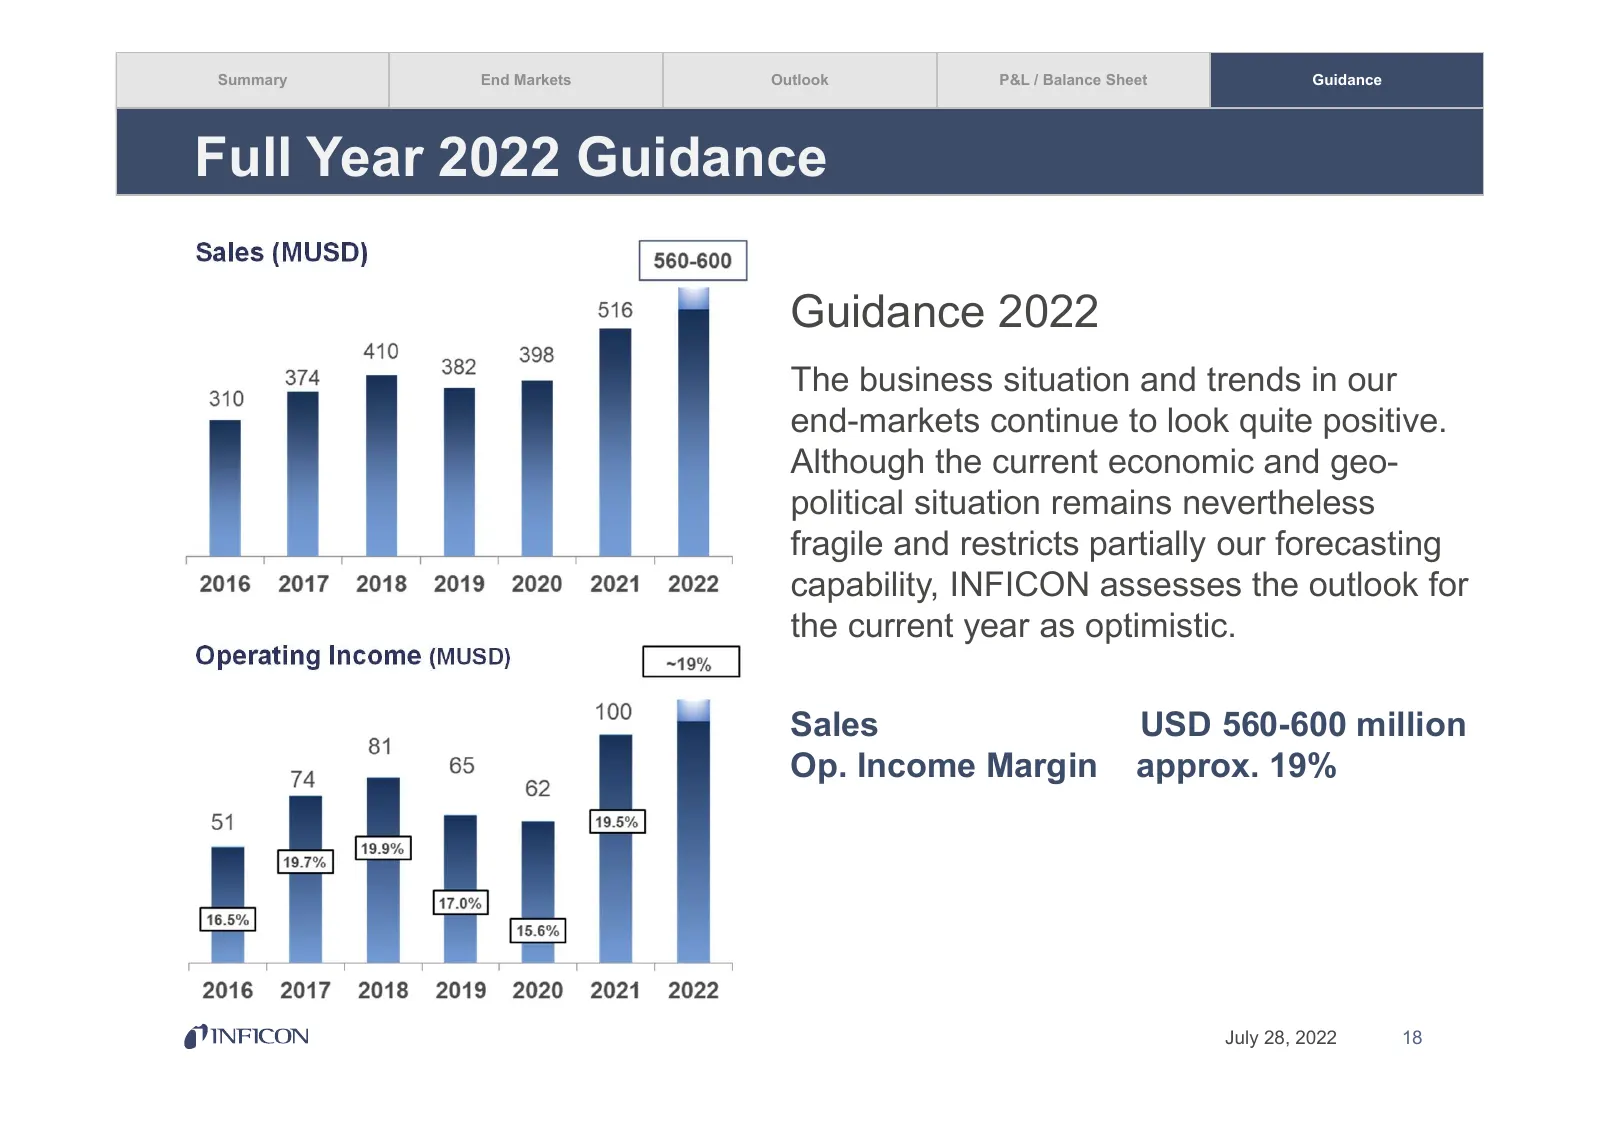
Slide 18: Full Year 2022 Guidance
Summary End Markets Outlook P&L / Balance Sheet Guidance Full Year 2022 Guidance Sales (MUSD) Guidance 2022 The business situation and trends in our end-markets continue to look quite positive. Although the current economic and geo- political situation remains nevertheless fragile and restricts part
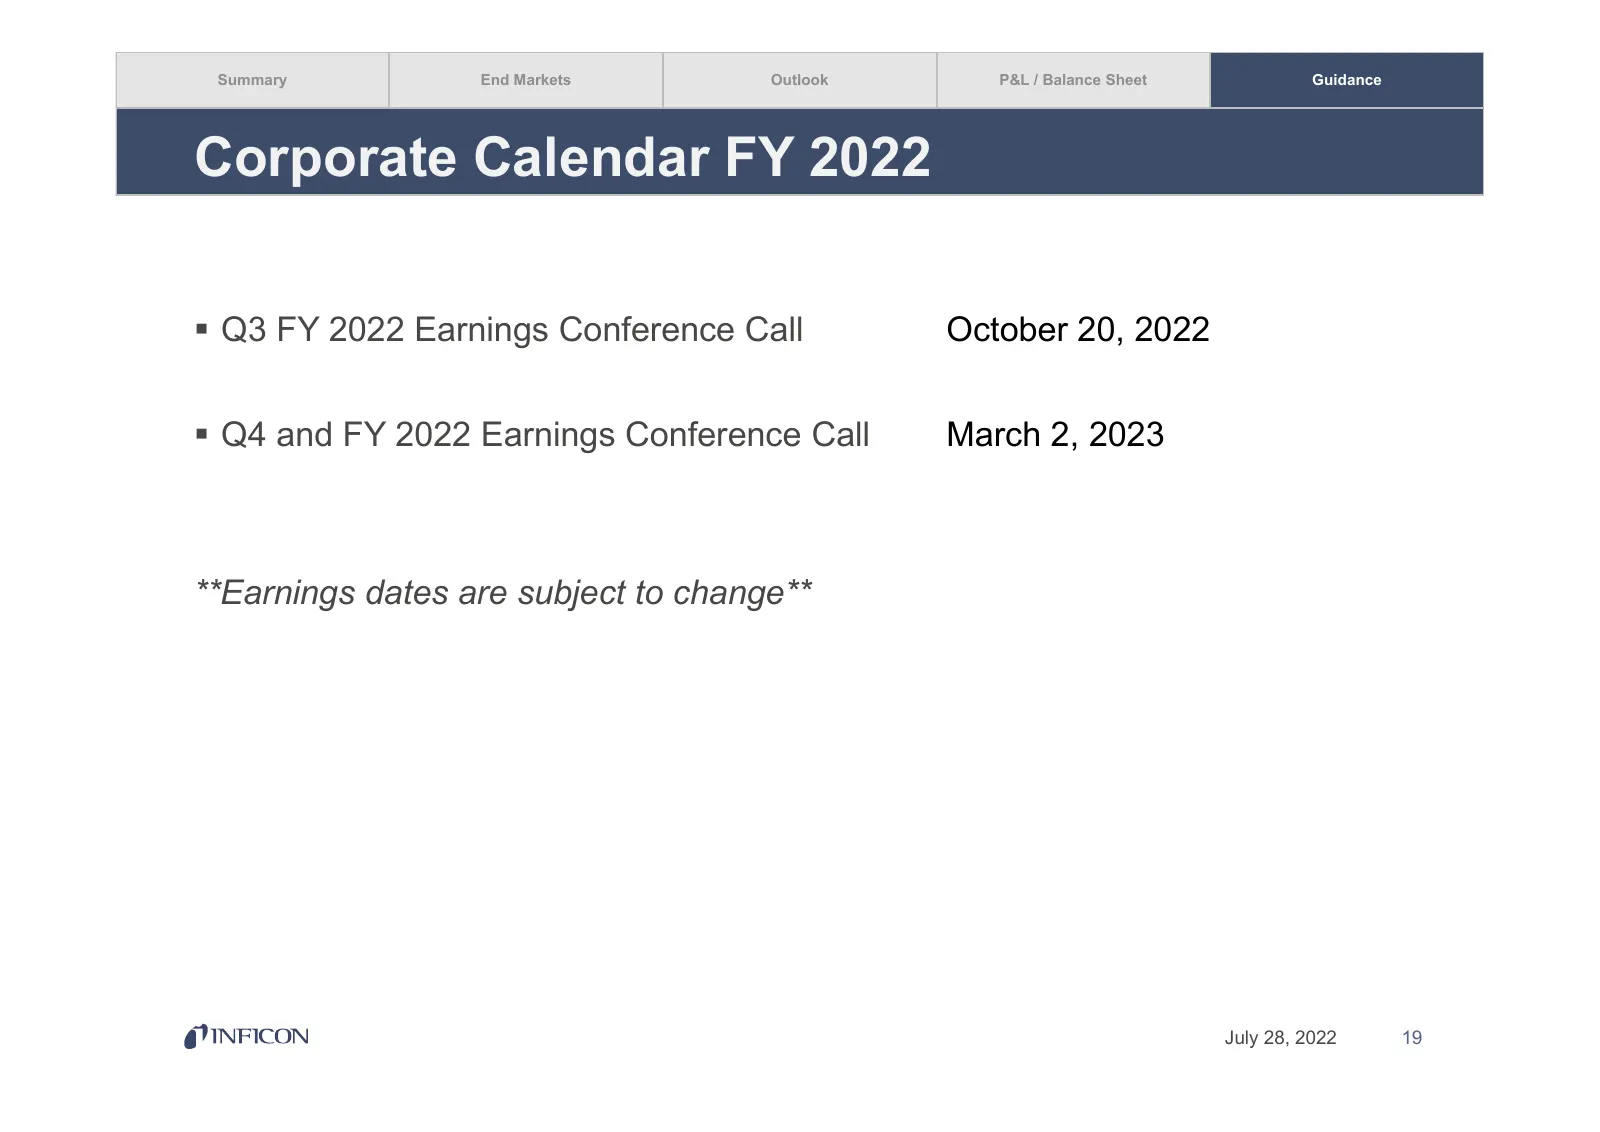
Slide 19: Corporate Calendar FY 2022
Summary End Markets Outlook P&L / Balance Sheet Guidance Corporate Calendar FY 2022 Q3 FY 2022 Earnings Conference Call October 20, 2022 Q4 and FY 2022 Earnings Conference Call March 2, 2023 **Earnings dates are subject to change** July 28, 2022 19
Slide 20: Thank You! Q&A
Q)INFICON Inspired by visions. Proven by success. THANK YOU! Q&A
Source: Internet Archive copy of ir.inficon.com
More decks from INFICON Holding AG
 Q3 2026 Earnings Presentation18 slides · Oct 27, 2026
 Q2 2026 Earnings Presentation20 slides · Jul 30, 2026
 Q1 2026 Earnings Presentation20 slides · Apr 24, 2026
 Q4 2025 Earnings Presentation32 slides · Mar 24, 2026
 Q1 2025 Earnings Presentation20 slides · Apr 24, 2025
 Technical Presentation (September 2024)44 slides · September 2024