Oaktree Specialty Lending Corporation · NASDAQ:OCSL
Oaktree Specialty Lending — Q4 2026 Earnings Presentation
19 slides from Oaktree Specialty Lending's earnings presentation, November 2026
Slide 1: Earnings Presentation Fourth Quarter 2026
Earnings Presentation NASDAQ: OCSL Fourth Quarter 2026
Slide 2: Forward Looking Statements & Legal Disclosures
Forward Looking Statements & Legal Disclosures Some of the statements in this presentation constitute Form 10-K for the fiscal year ended September 30, 2026. Other forward-looking statements because they relate to future factors that could cause actual results to differ materially Calculation of Ass
Slide 3: Financial Highlights for the Quarter Ended September 30, 2026
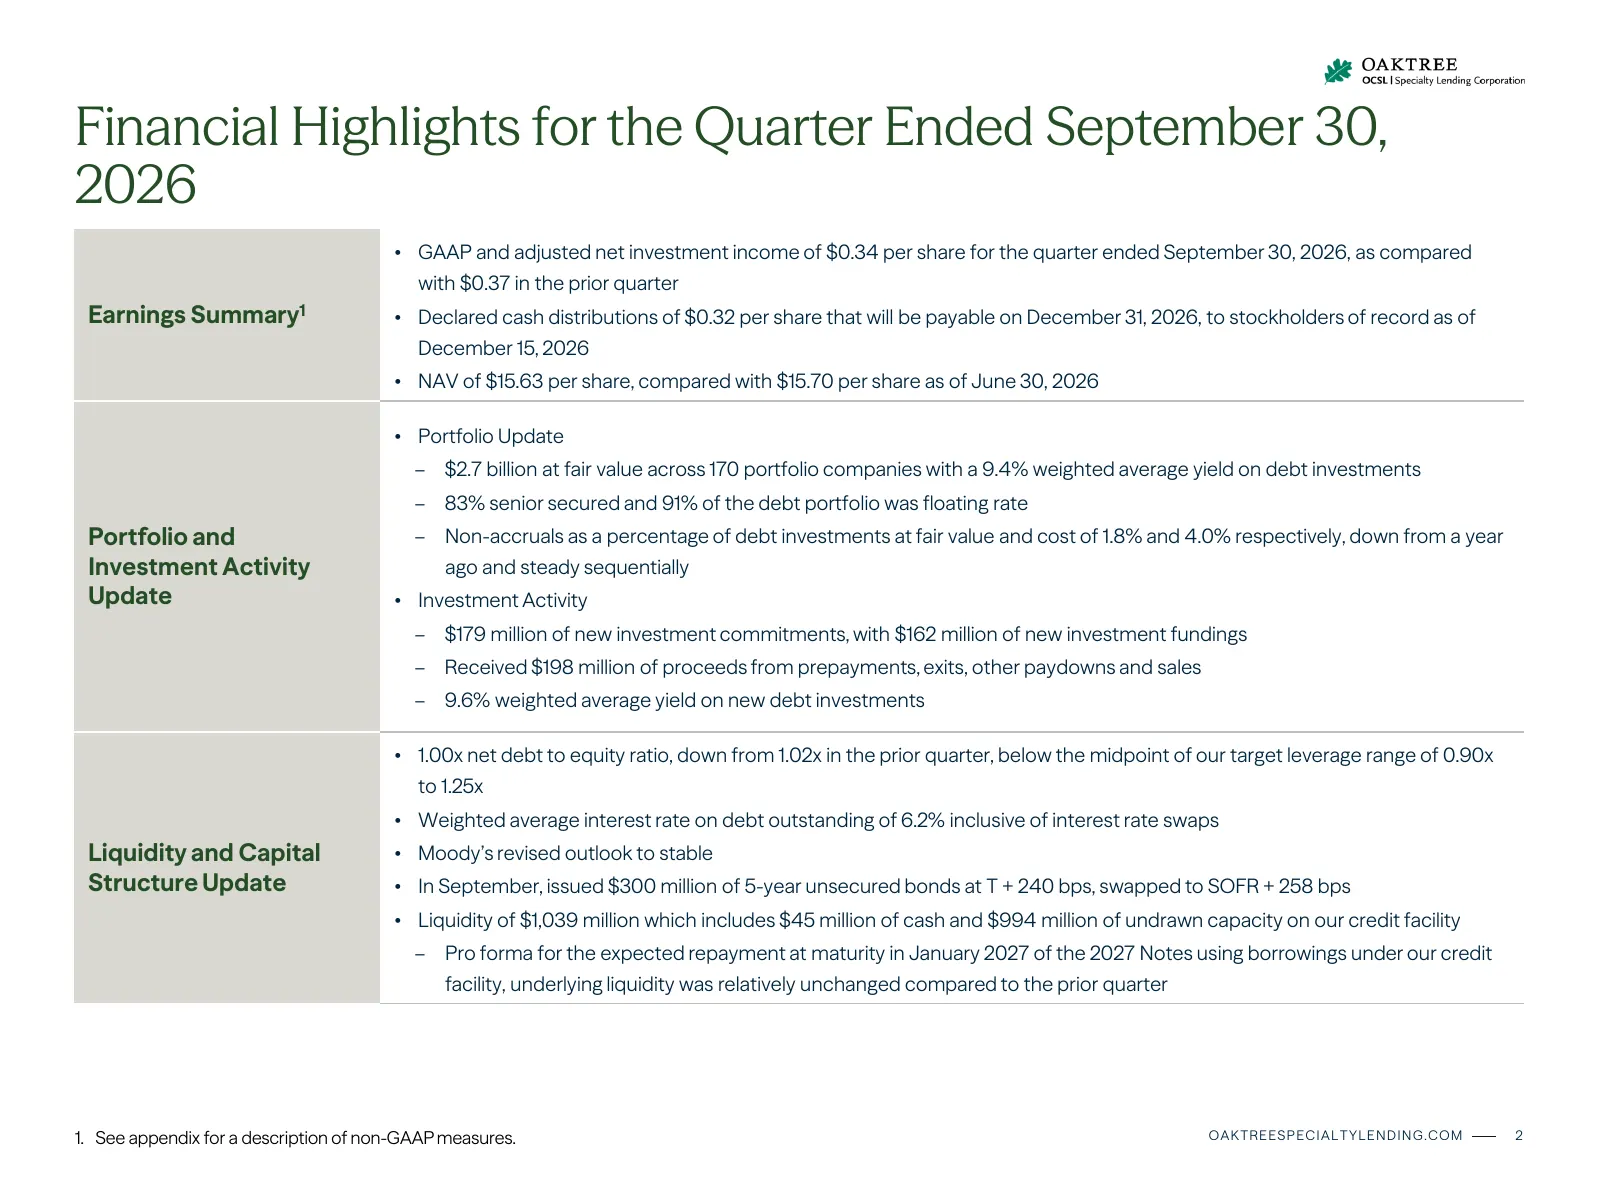
Financial Highlights for the Quarter Ended September 30, 2026 • GAAP and adjusted net investment income of $0.34 per share for the quarter ended September 30, 2026, as compared with $0.37 in the prior quarter Earnings Summary1 • Declared cash distributions of $0.32 per share that will be payable on
Slide 4: Portfolio Summary
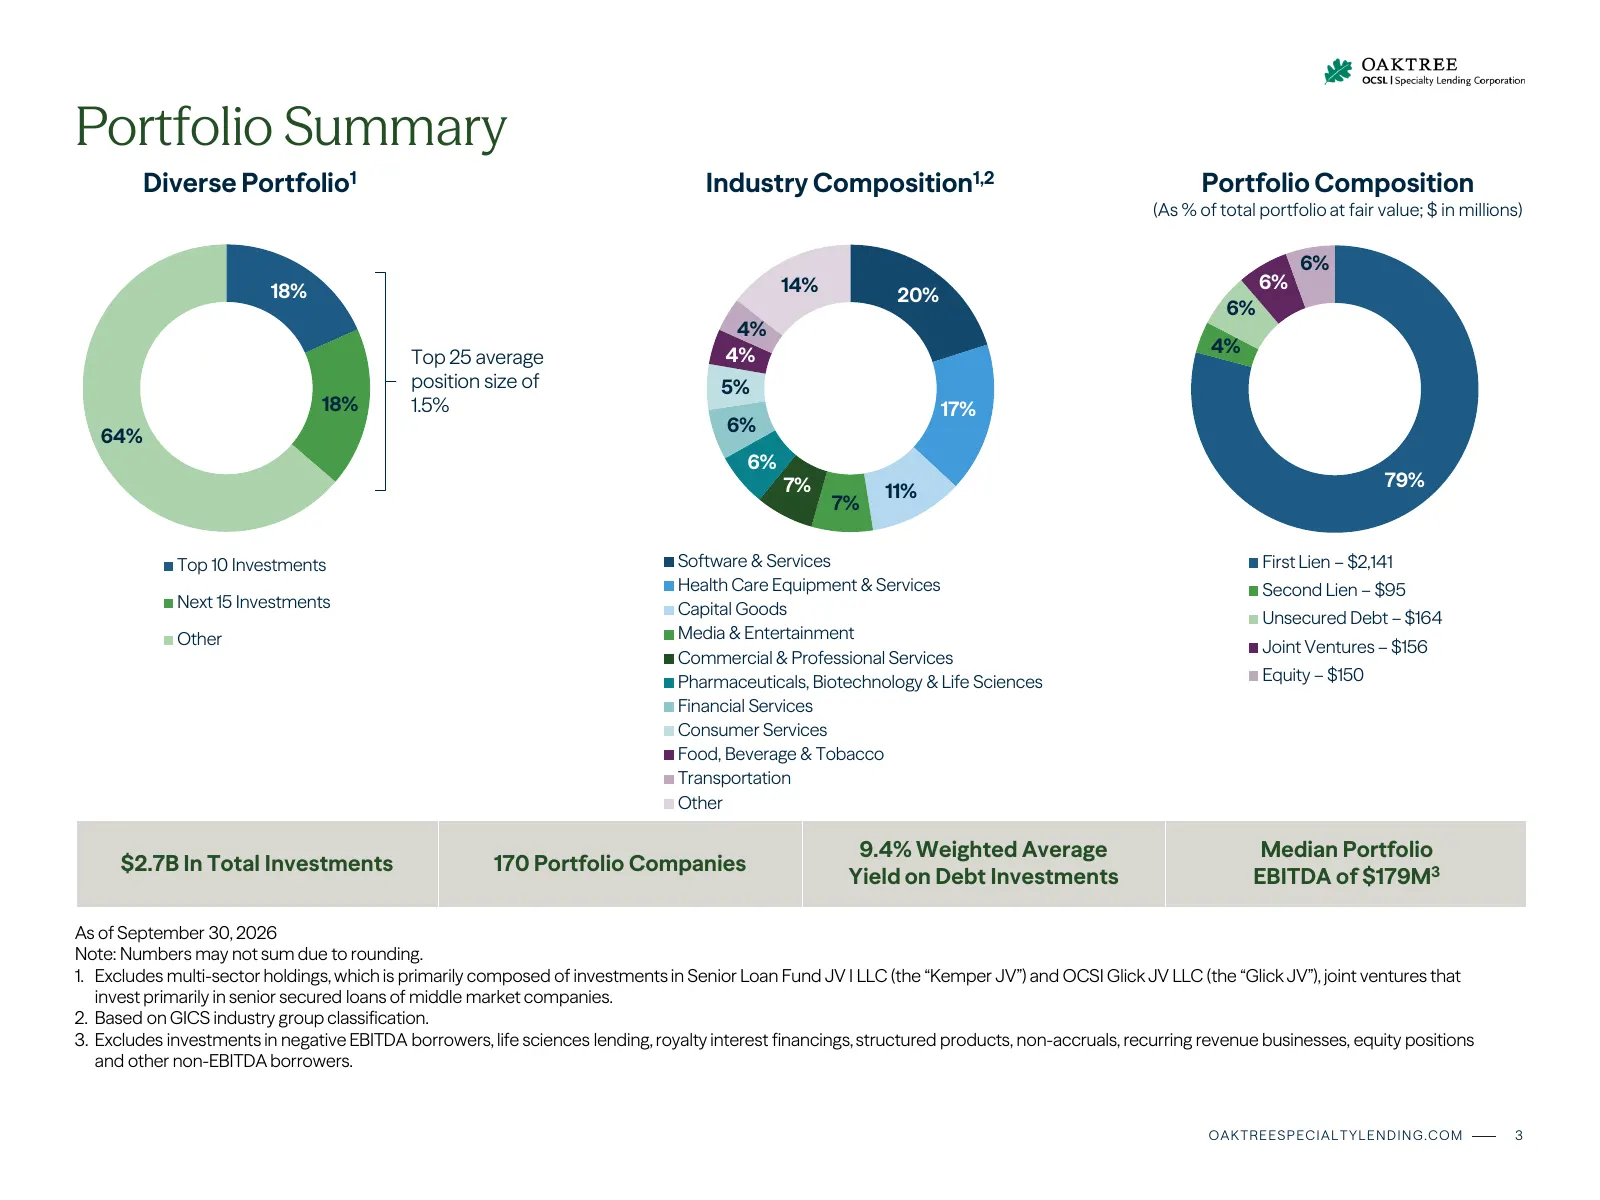
Portfolio Summary Diverse Portfolio1 Industry Composition1,2 Portfolio Composition (As % of total portfolio at fair value; $ in millions) 6% 18% 14% 6% 20% 6% 4% 4% 4% Top 25 average position size of 5% 18% 1.5% 17% 6% 64% 6% 7% 79% 11% 7% Top 10 Investments Software & Services First Lien – $2,141 H
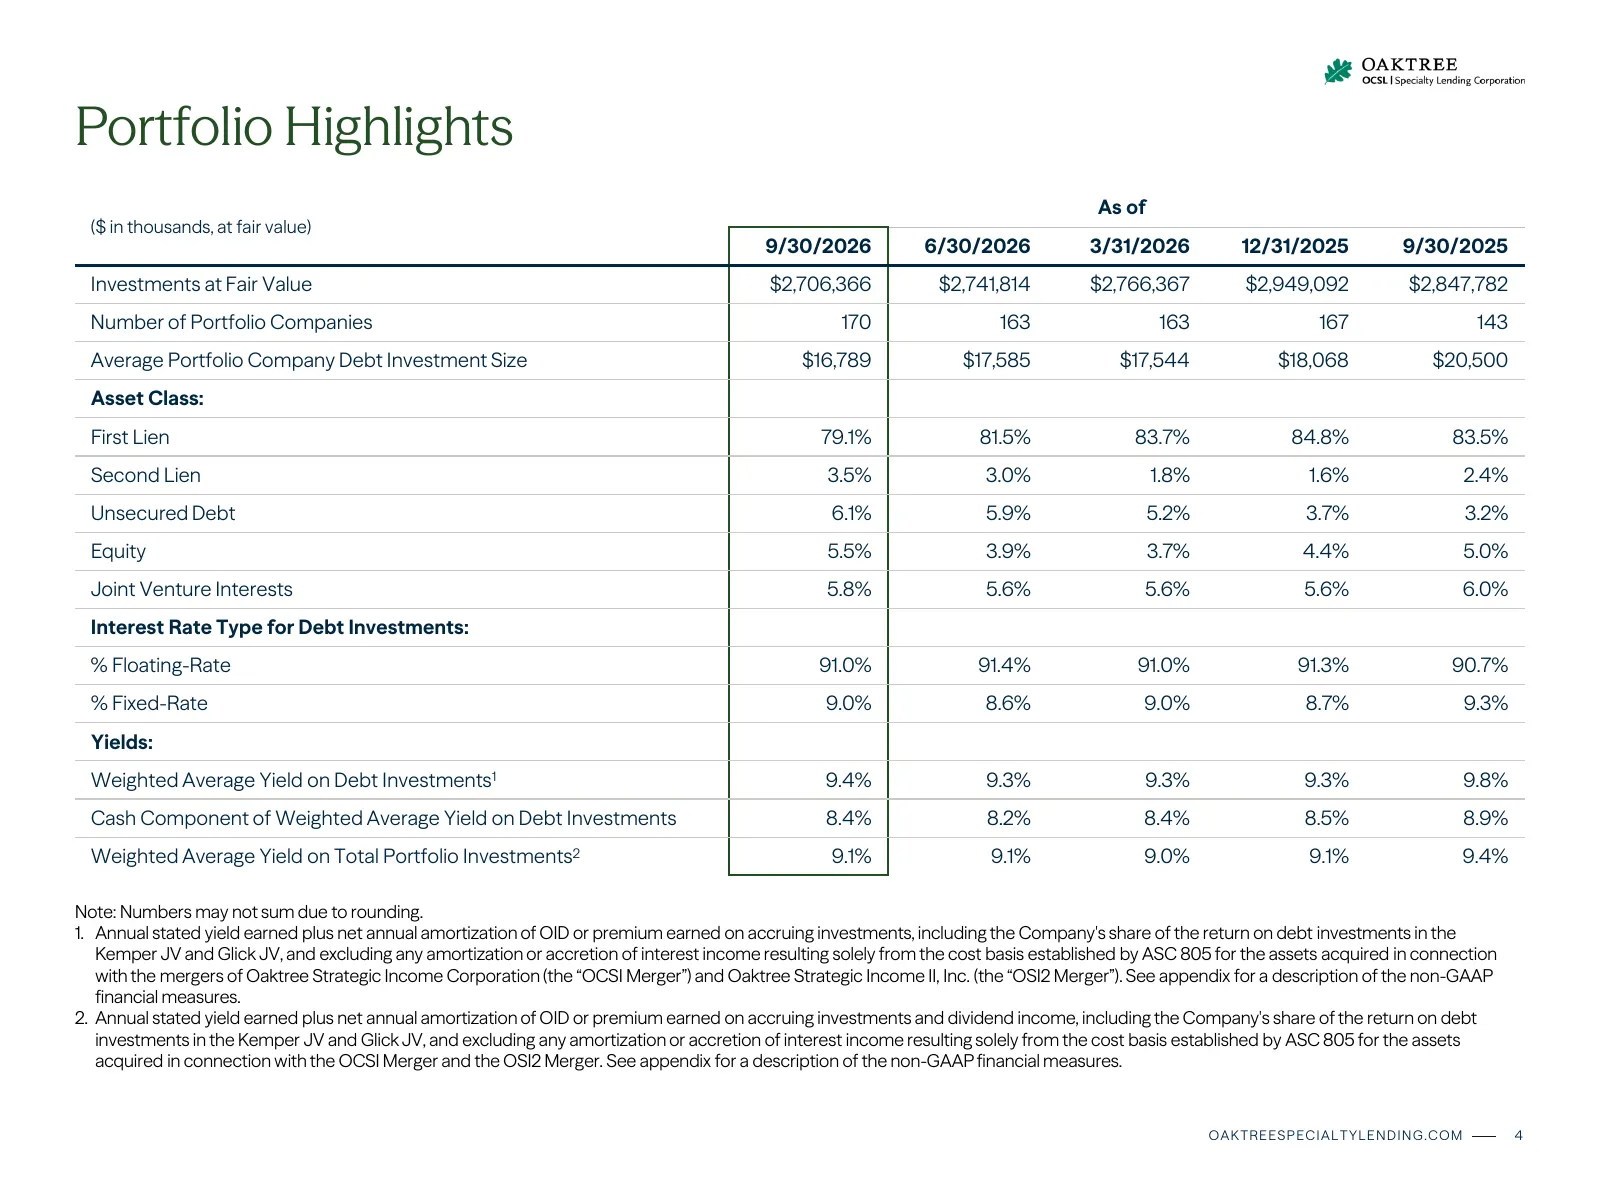
Slide 5: Portfolio Highlights
Portfolio Highlights As of ($ in thousands, at fair value) 9/30/2026 6/30/2026 3/31/2026 12/31/2025 9/30/2025 Investments at Fair Value $2,706,366 $2,741,814 $2,766,367 $2,949,092 $2,847,782 Number of Portfolio Companies 170 163 163 167 143 Average Portfolio Company Debt Investment Size $16,789 $17,
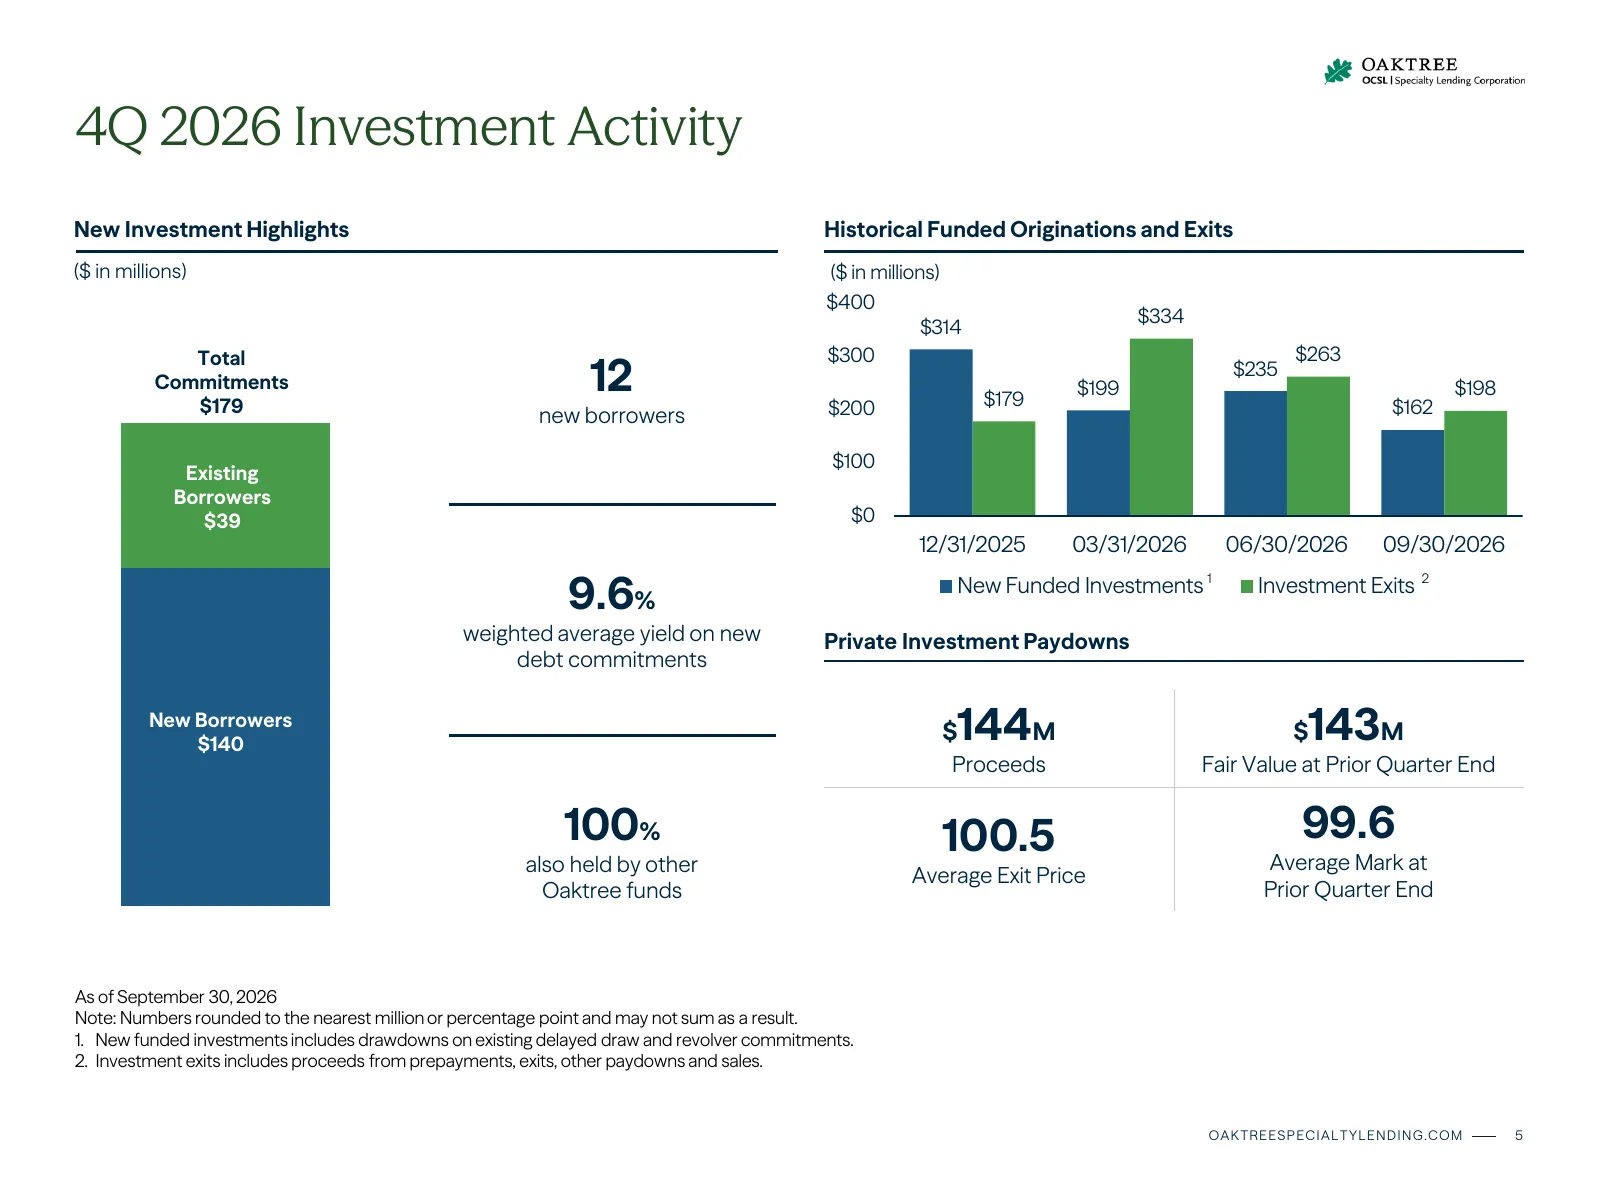
Slide 6: 4Q 2026 Investment Activity
4Q 2026 Investment Activity New Investment Highlights Historical Funded Originations and Exits ($ in millions) ($ in millions) $400 $334 $314 $300 $263 12 Total $235 Commitments $199 $198 $179 $200 $179 $162 new borrowers $100 Existing Borrowers $39 $0 12/31/2025 03/31/2026 06/30/2026 09/30/2026 9.6
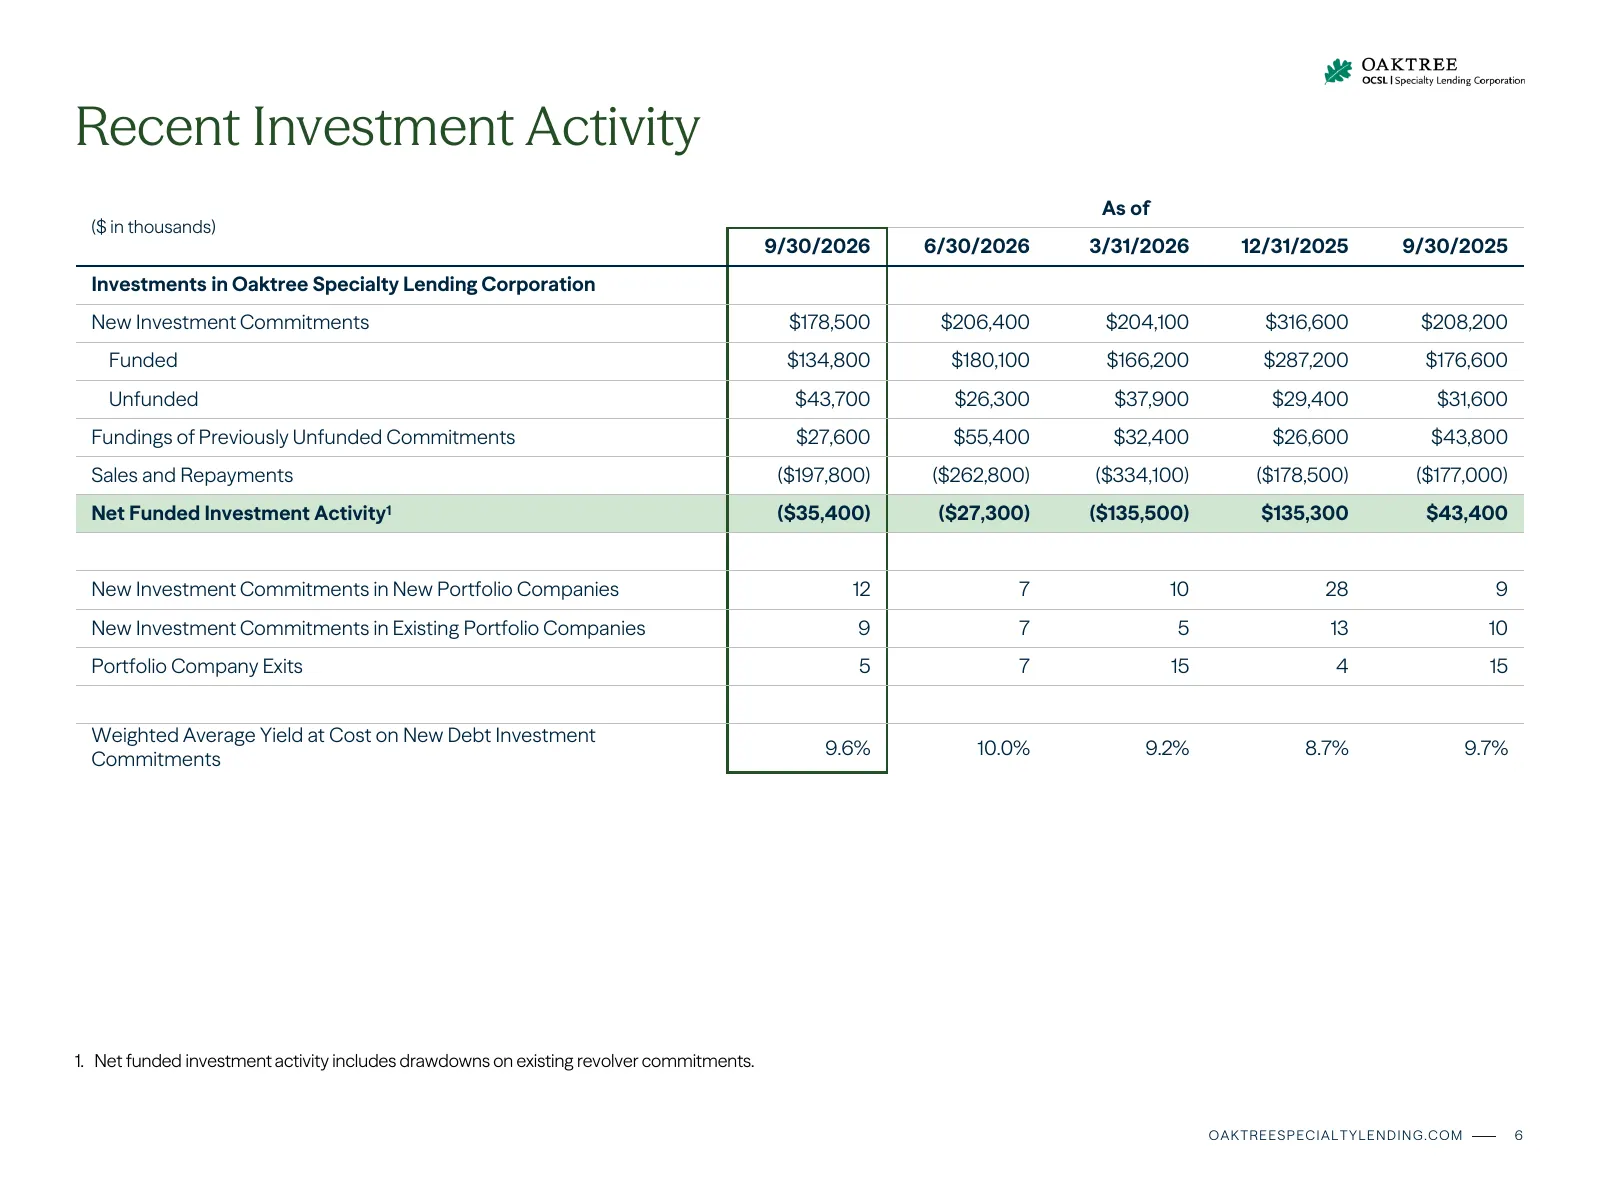
Slide 7: Recent Investment Activity
Recent Investment Activity As of ($ in thousands) 9/30/2026 6/30/2026 3/31/2026 12/31/2025 9/30/2025 Investments in Oaktree Specialty Lending Corporation New Investment Commitments $178,500 $206,400 $204,100 $316,600 $208,200 Funded $134,800 $180,100 $166,200 $287,200 $176,600 Unfunded $43,700 $26,3
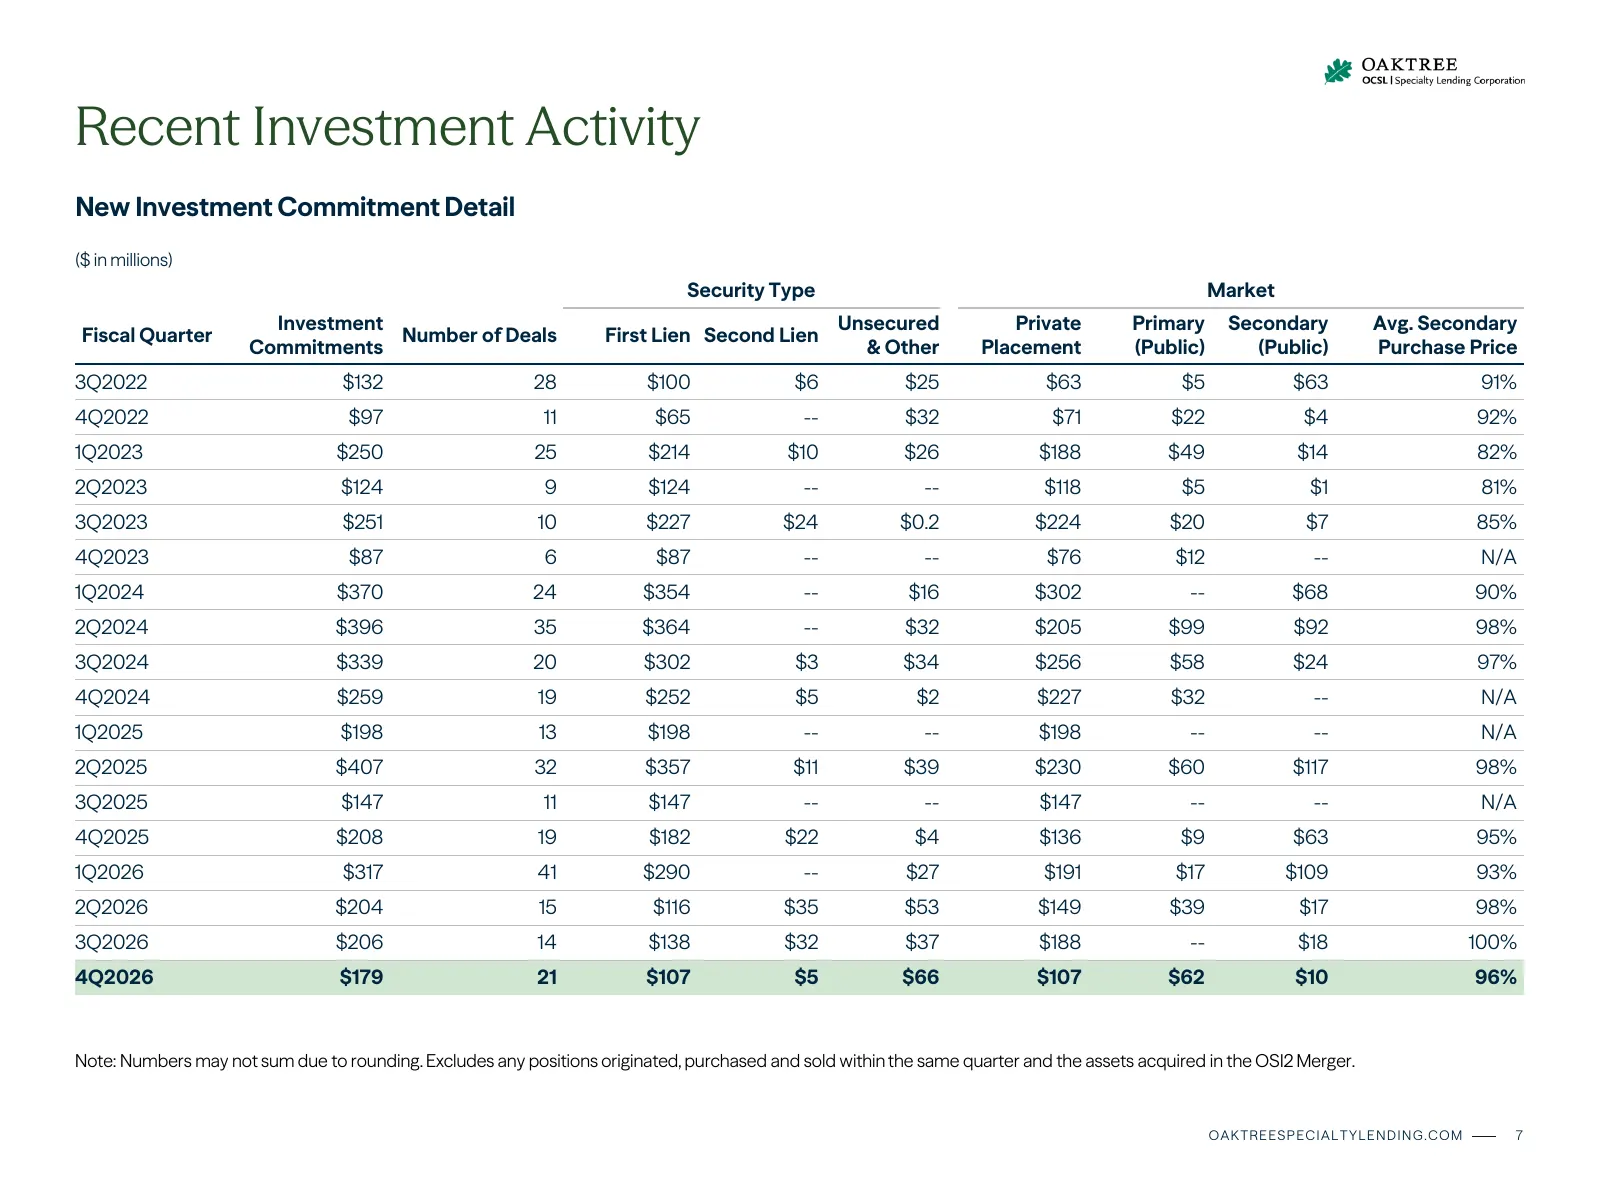
Slide 8: Recent Investment Activity
Recent Investment Activity New Investment Commitment Detail ($ in millions) Security Type Market Investment Unsecured Private Primary Secondary Avg. Secondary Fiscal Quarter Number of Deals First Lien Second Lien Commitments & Other Placement (Public) (Public) Purchase Price 3Q2022 $132 28 $100 $6 $
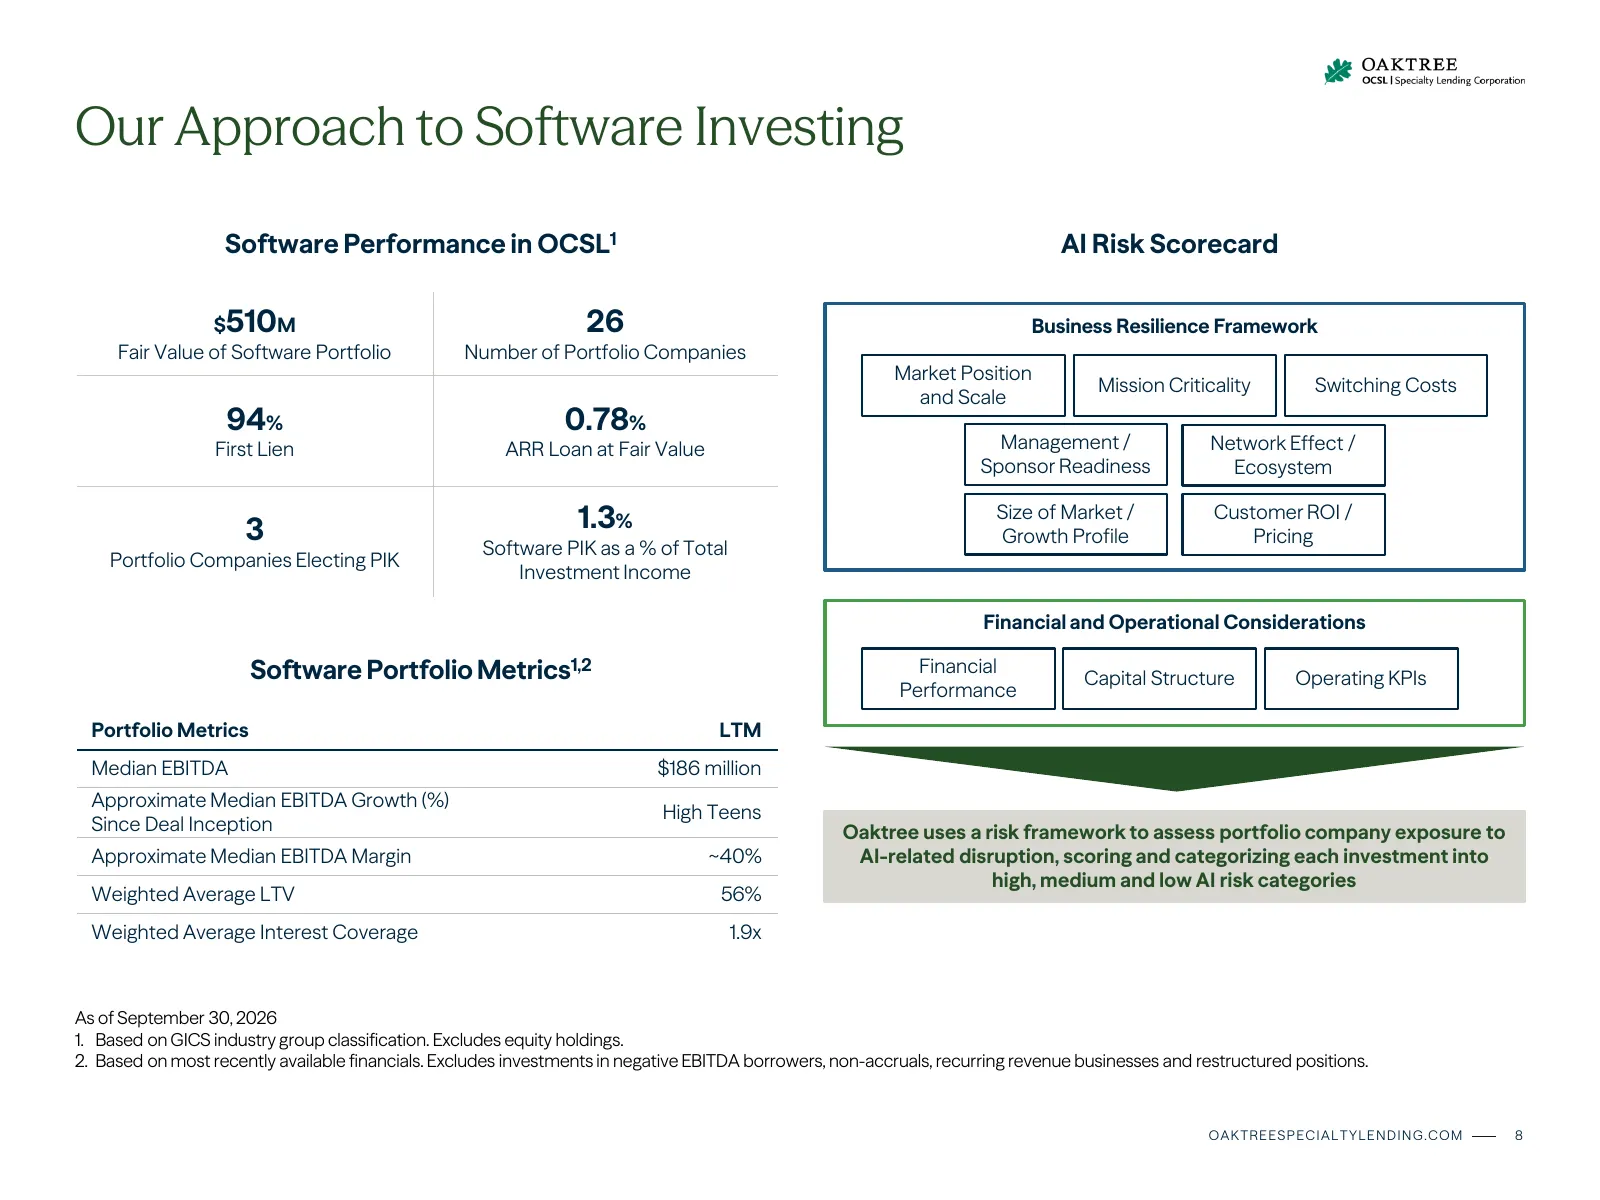
Slide 9: Our Approach to Software Investing
Our Approach to Software Investing Software Performance in OCSL1 AI Risk Scorecard $510M 26 Business Resilience Framework Fair Value of Software Portfolio Number of Portfolio Companies Market Position Mission Criticality Switching Costs and Scale 94% 0.78% First Lien ARR Loan at Fair Value Managemen
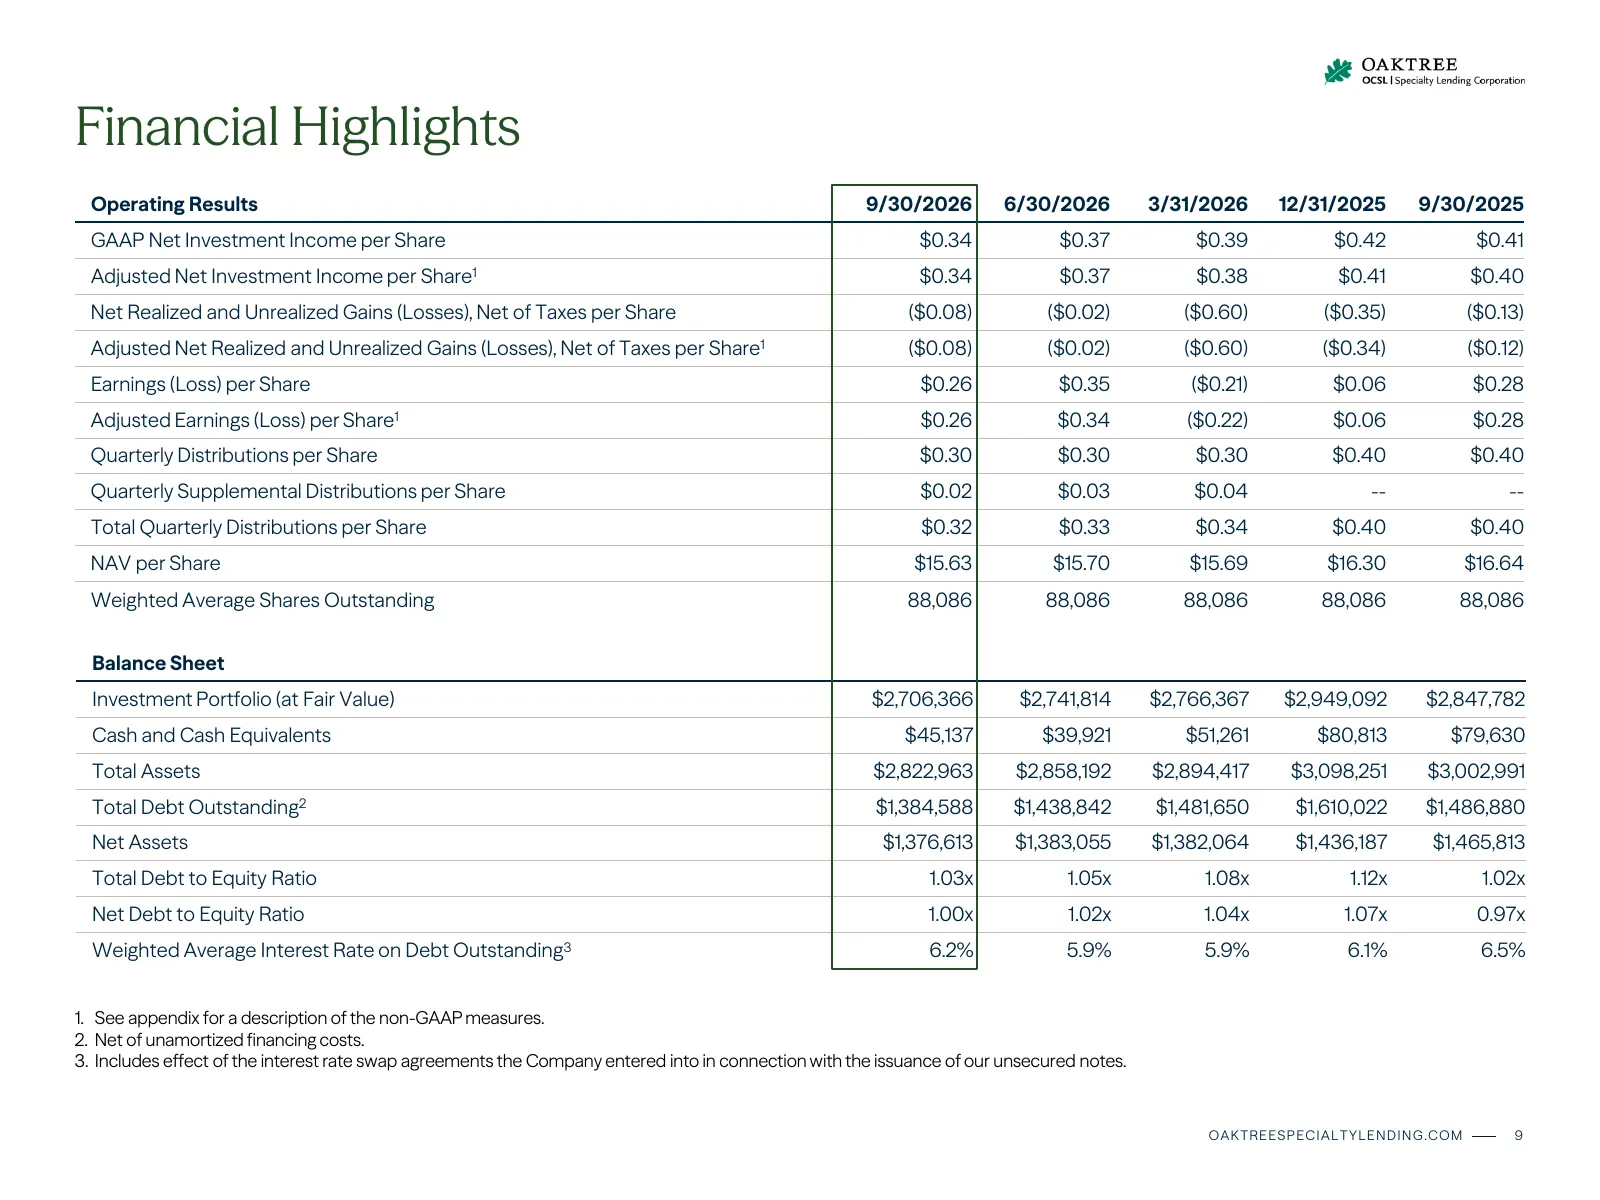
Slide 10: Financial Highlights
Financial Highlights Operating Results 9/30/2026 6/30/2026 3/31/2026 12/31/2025 9/30/2025 GAAP Net Investment Income per Share $0.34 $0.37 $0.39 $0.42 $0.41 Adjusted Net Investment Income per Share1 $0.34 $0.37 $0.38 $0.41 $0.40 Net Realized and Unrealized Gains (Losses), Net of Taxes per Share ($0.
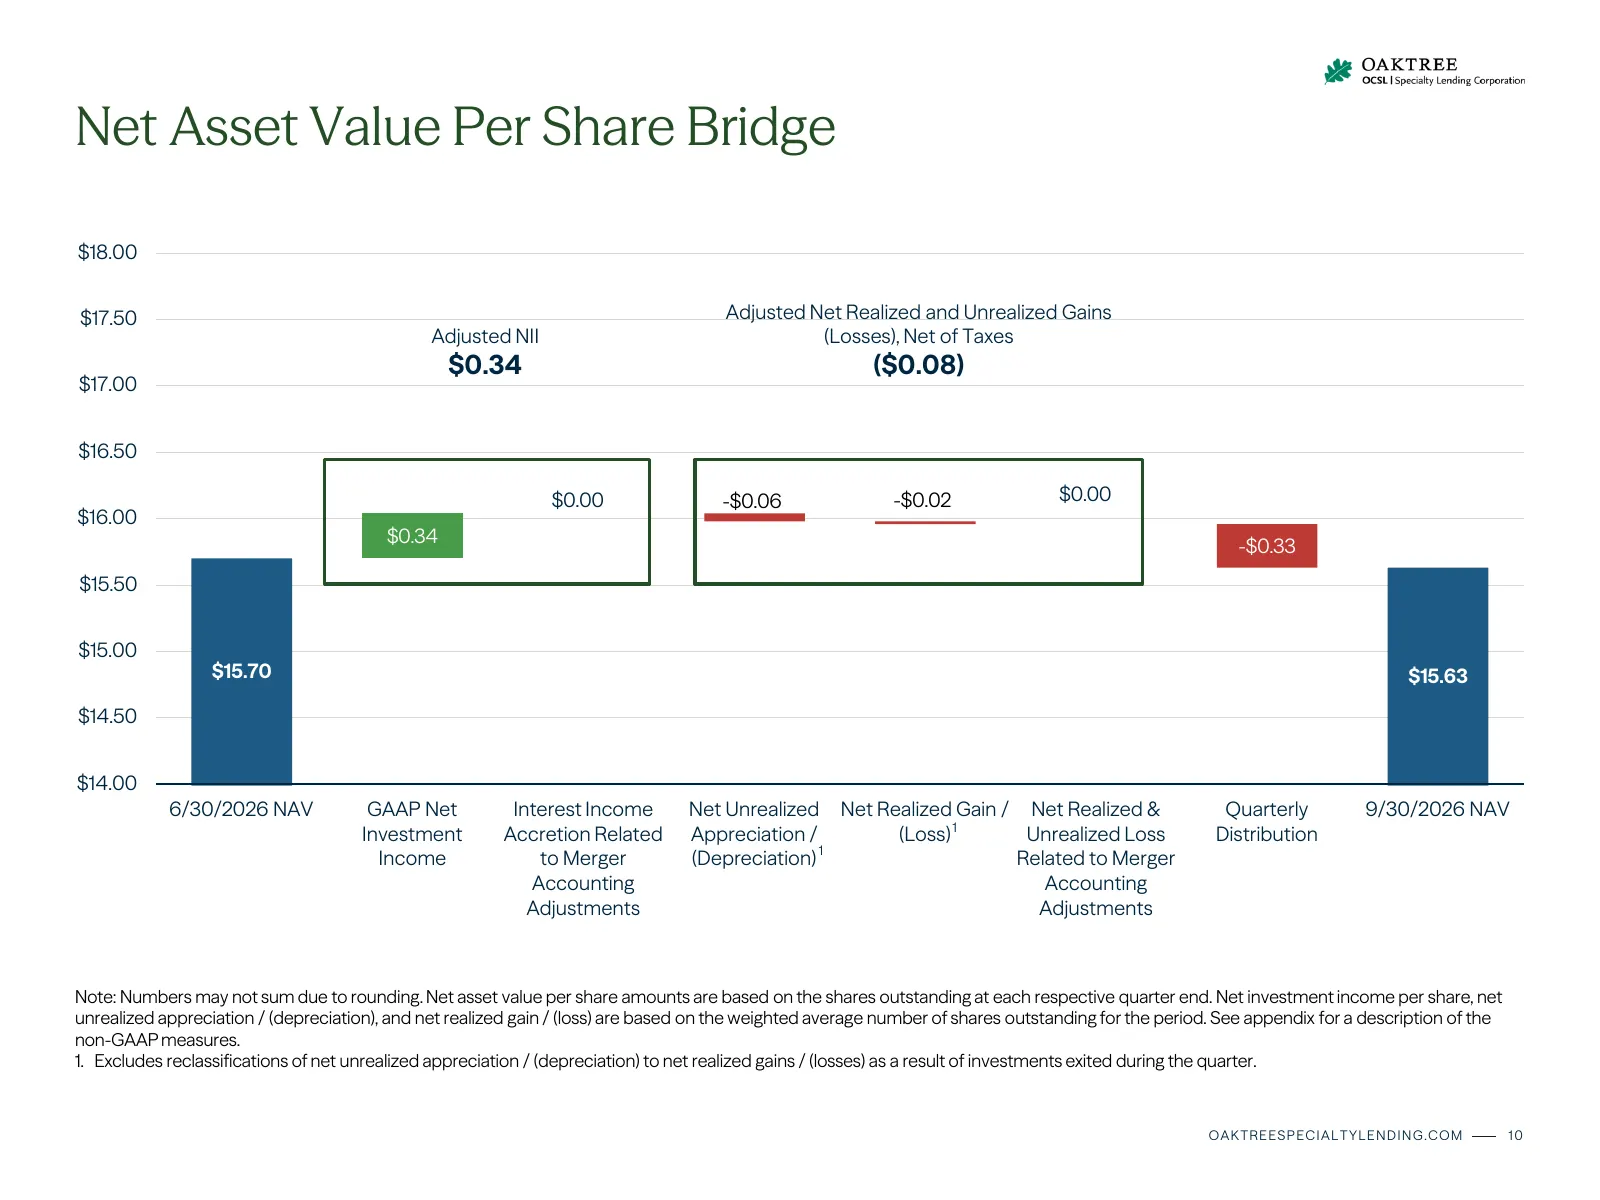
Slide 11: Net Asset Value Per Share Bridge
Net Asset Value Per Share Bridge $18.00 $17.50 Adjusted Net Realized and Unrealized Gains Adjusted NII (Losses), Net of Taxes $0.34 ($0.08) $17.00 $16.50 $0.00 -$0.06 -$0.02 $0.00 $16.00 $0.34 -$0.33 $15.50 $15.00 $15.70 $15.63 $14.50 $14.00 6/30/2026 NAV GAAP Net Interest Income Net Unrealized Net
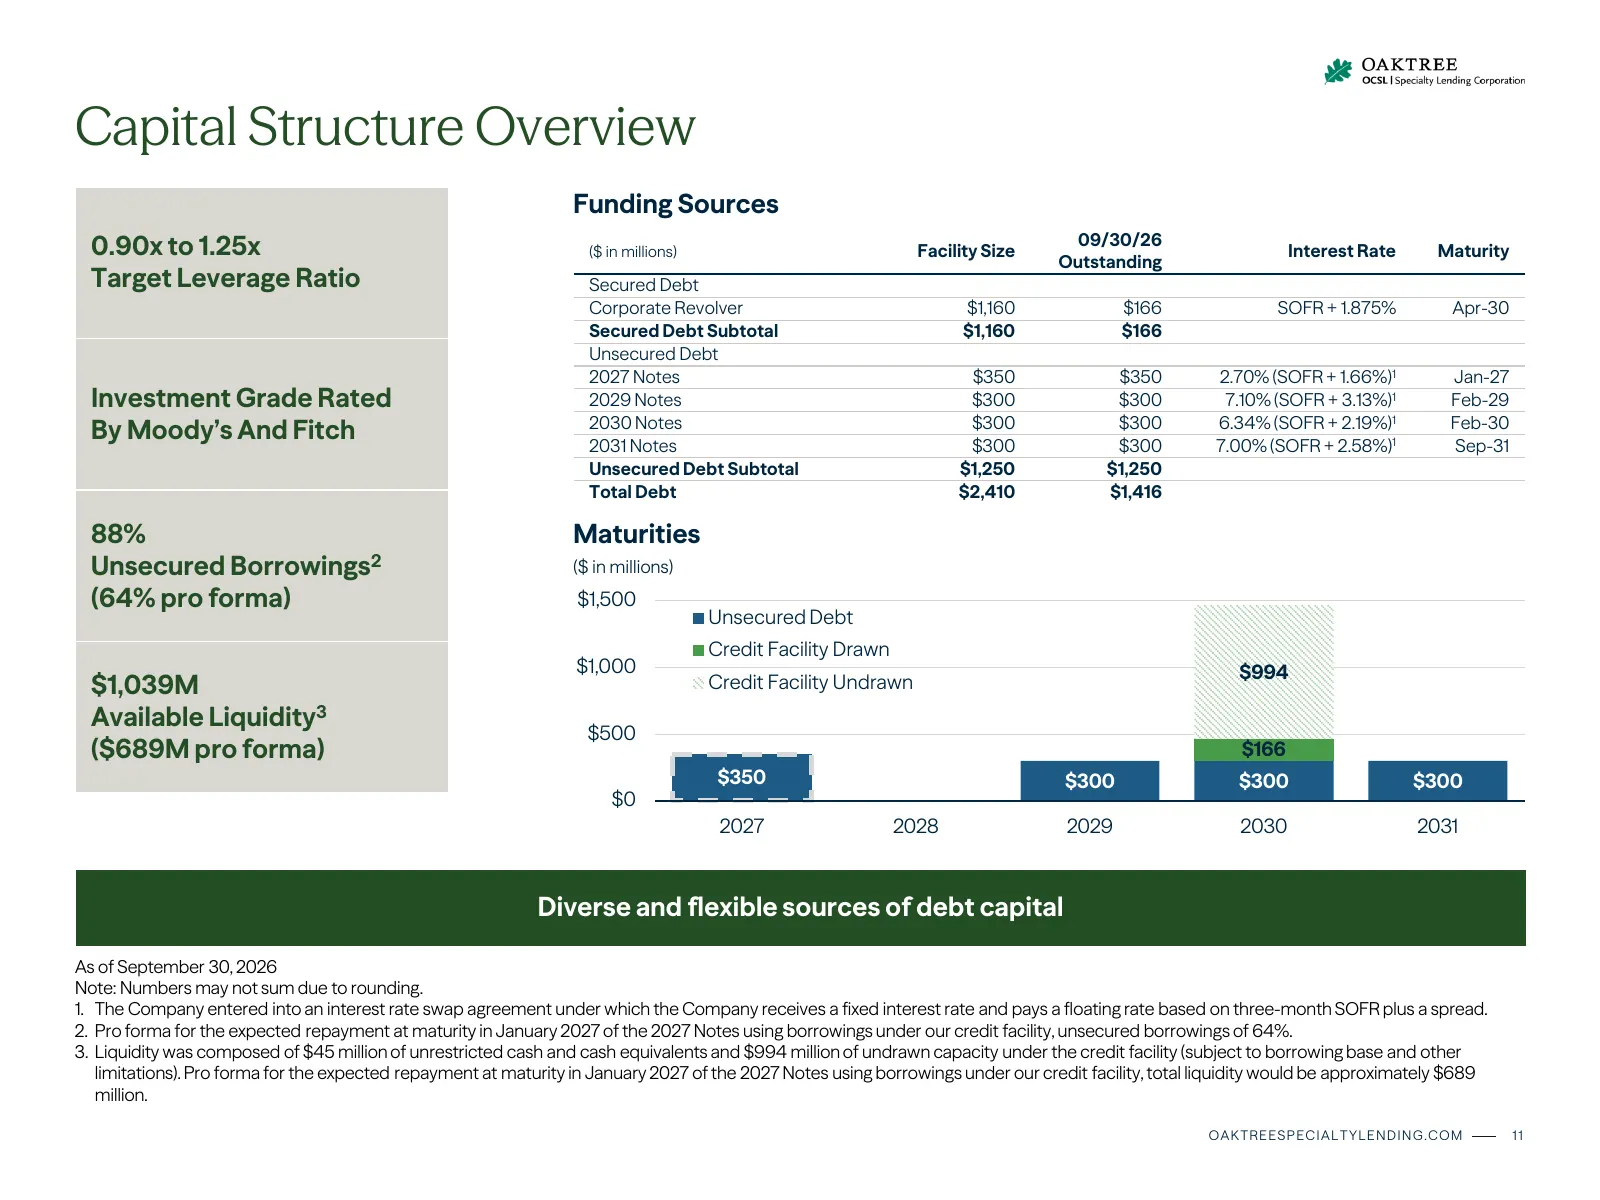
Slide 12: Capital Structure Overview
Capital Structure Overview Funding Sources 0.90x to 1.25x ($ in millions) Facility Size 09/30/26 Outstanding Interest Rate Maturity Target Leverage Ratio Secured Debt Corporate Revolver $1,160 $166 SOFR + 1.875% Apr-30 Secured Debt Subtotal $1,160 $166 Unsecured Debt 2027 Notes $350 $350 2.70% (SOFR
Slide 13: Funding and Liquidity Metrics
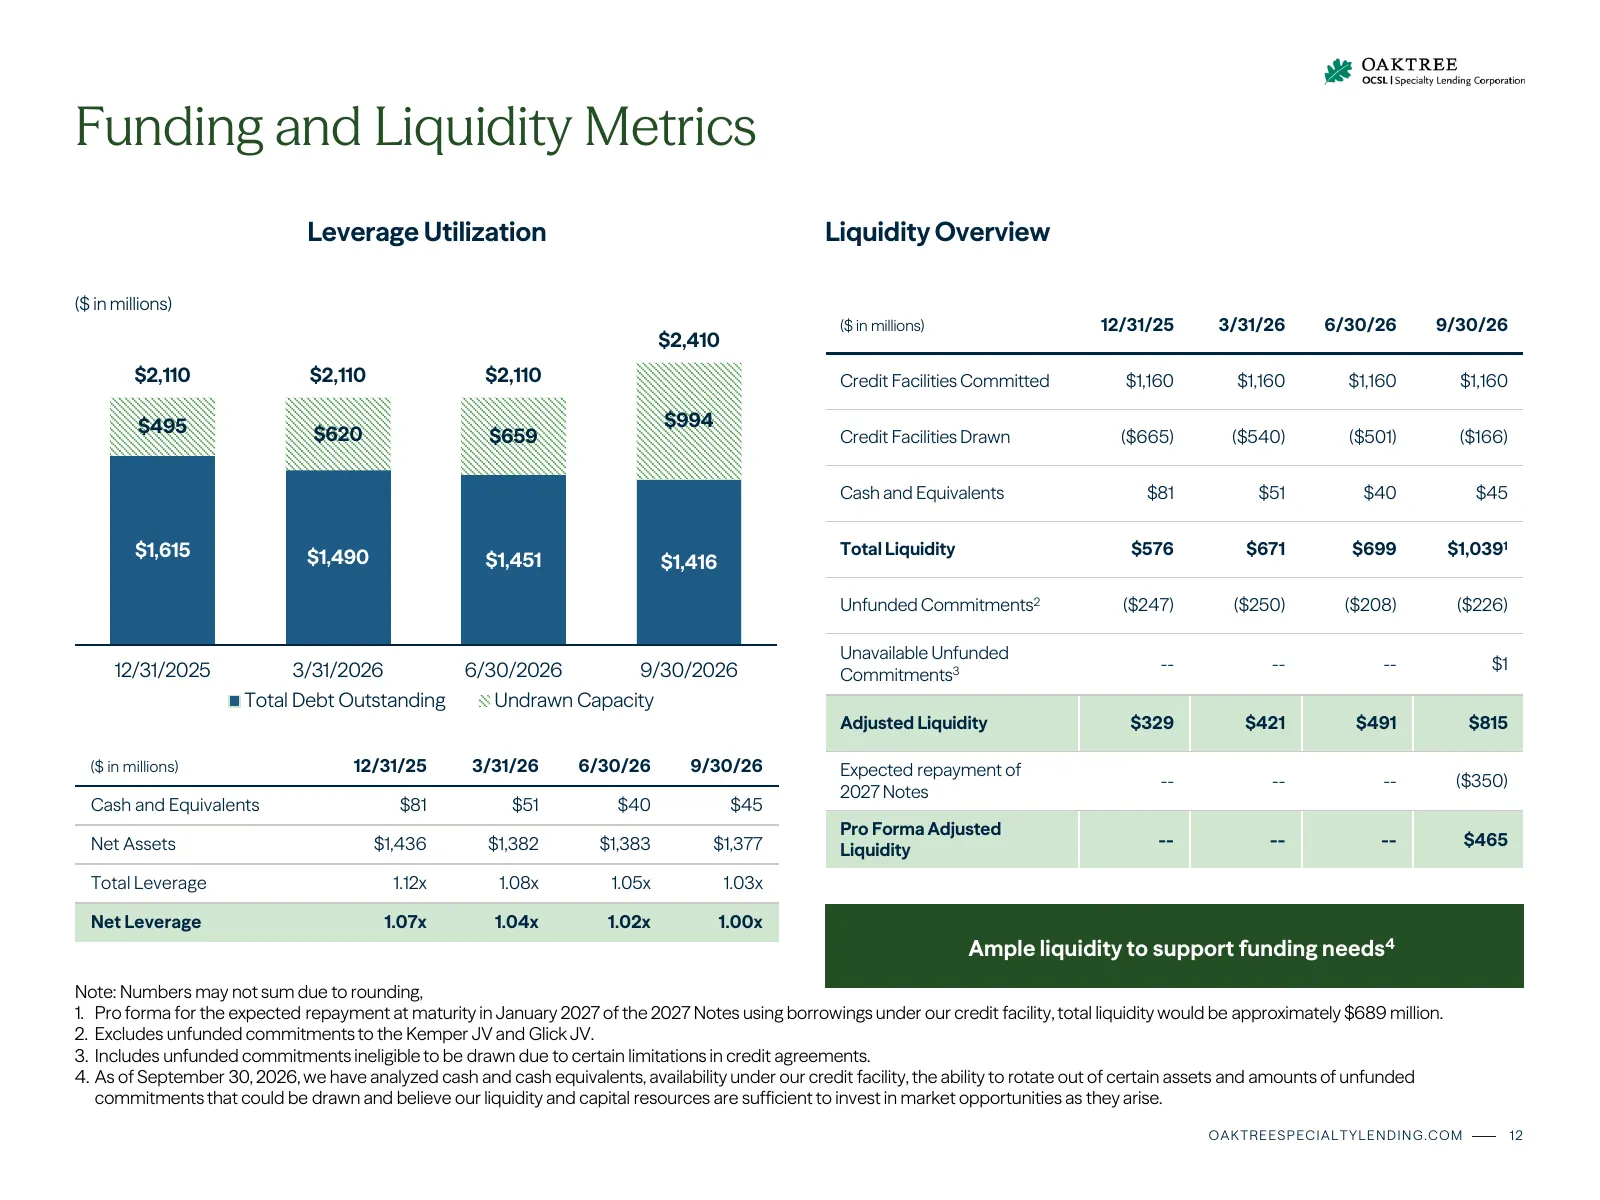
Funding and Liquidity Metrics Leverage Utilization Liquidity Overview ($ in millions) ($ in millions) 12/31/25 3/31/26 6/30/26 9/30/26 $2,410 $2,110 $2,110 $2,110 Credit Facilities Committed $1,160 $1,160 $1,160 $1,160 $495 $994 $620 $659 Credit Facilities Drawn ($665) ($540) ($501) ($166) Cash and
Slide 14: Strategic Joint Ventures are Accretive to Earnings
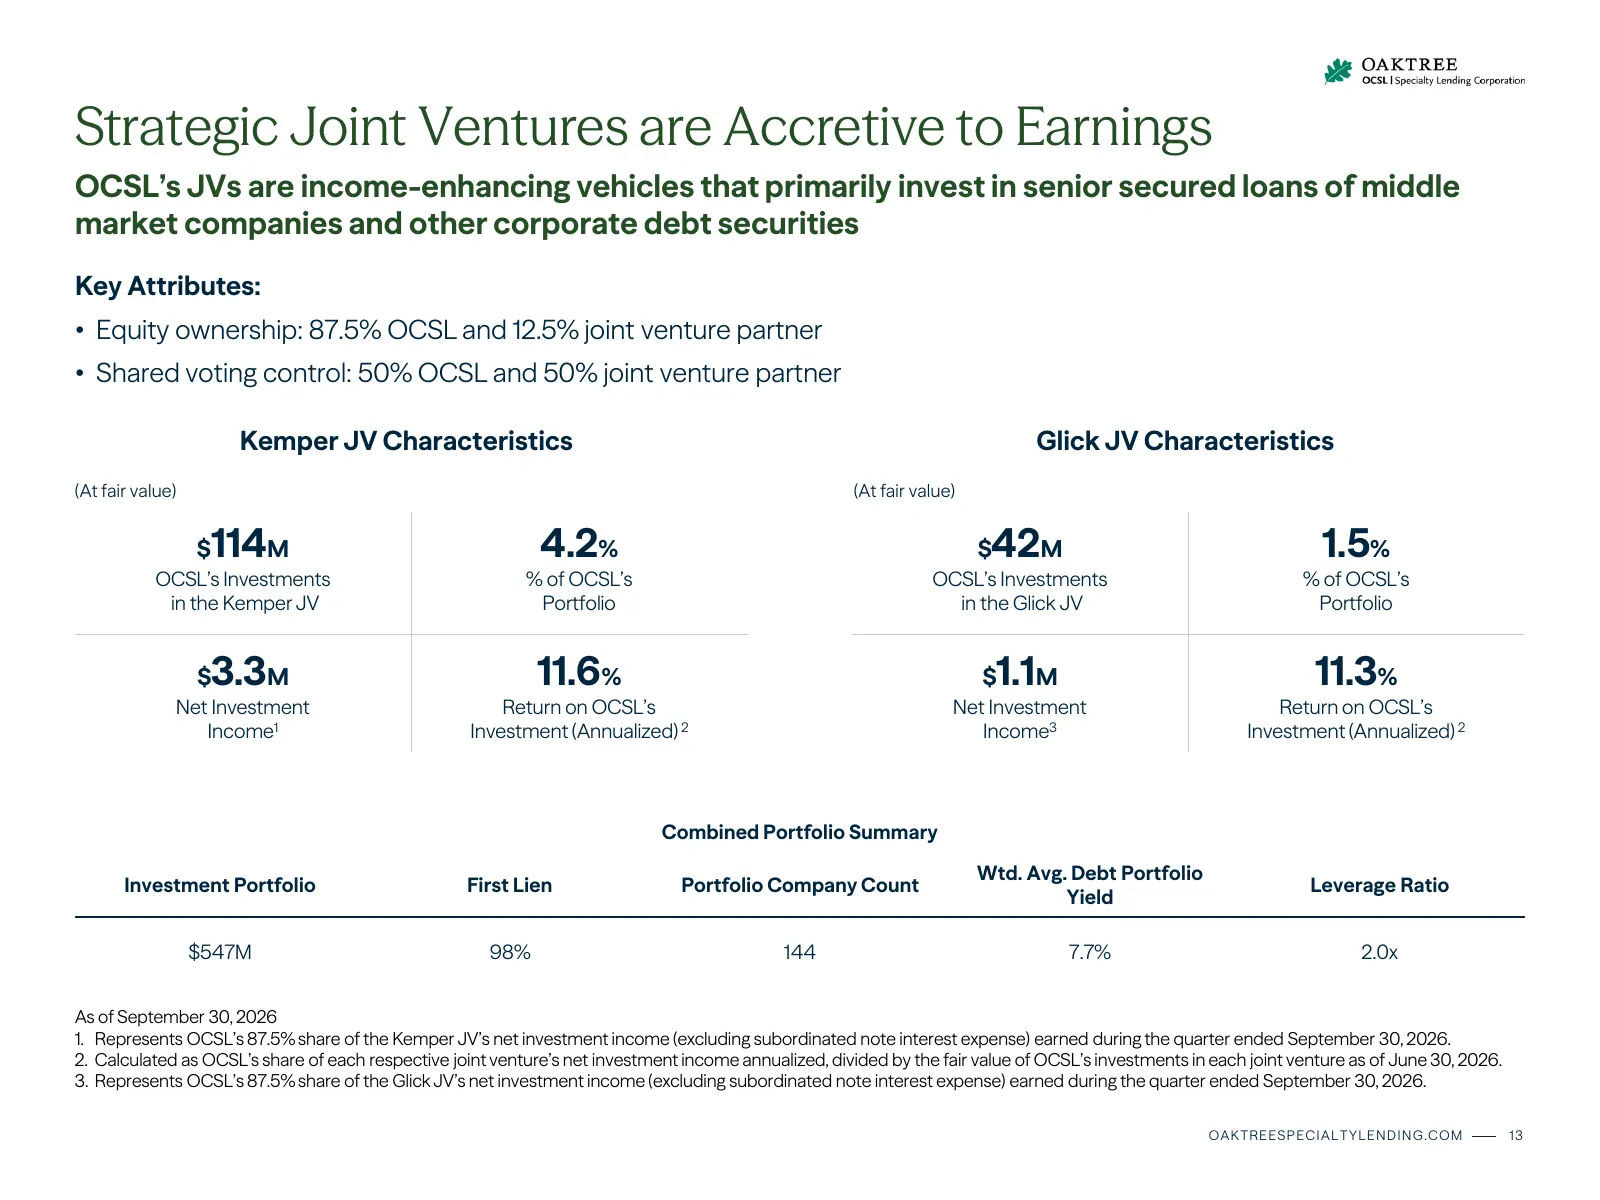
Strategic Joint Ventures are Accretive to Earnings OCSL’s JVs are income-enhancing vehicles that primarily invest in senior secured loans of middle market companies and other corporate debt securities Key Attributes: • Equity ownership: 87.5% OCSL and 12.5% joint venture partner • Shared voting cont
Slide 15: Appendix
Appendix
Slide 16: Quarterly Statement of Operations
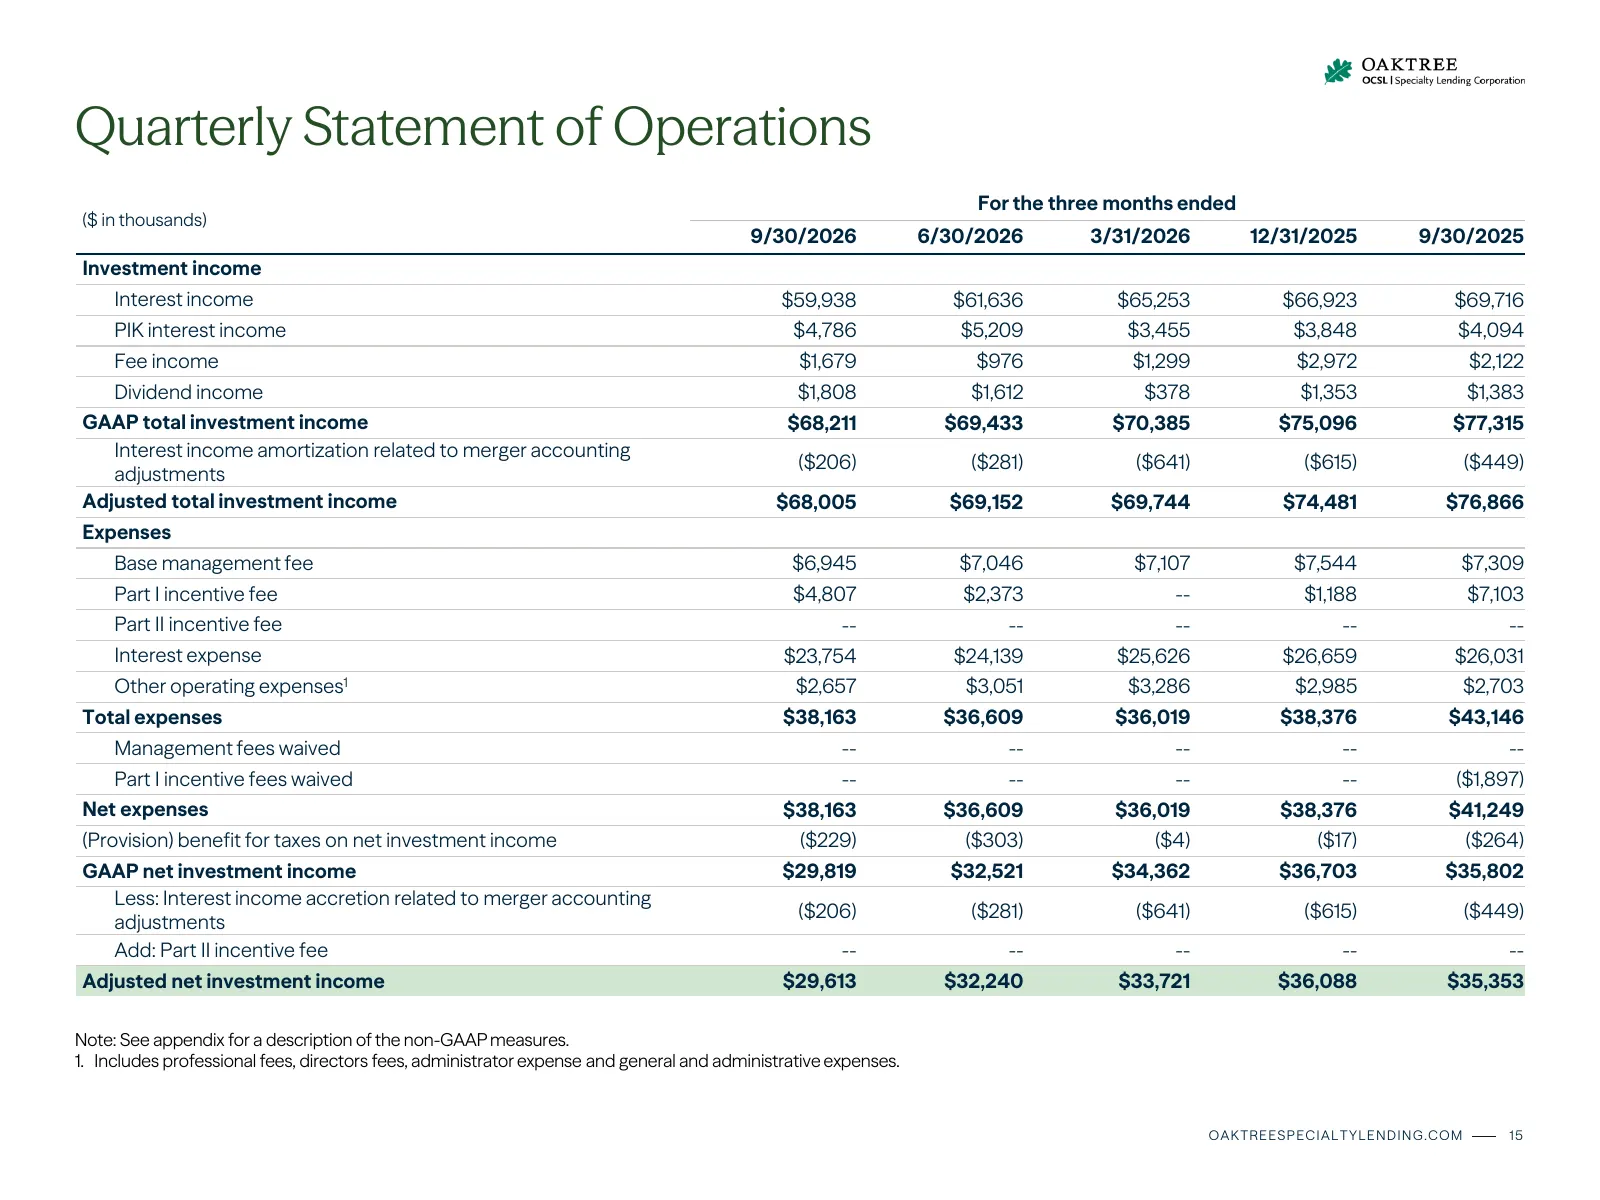
Quarterly Statement of Operations For the three months ended ($ in thousands) 9/30/2026 6/30/2026 3/31/2026 12/31/2025 9/30/2025 Investment income Interest income $59,938 $61,636 $65,253 $66,923 $69,716 PIK interest income $4,786 $5,209 $3,455 $3,848 $4,094 Fee income $1,679 $976 $1,299 $2,972 $2,12
Slide 17: Quarterly Statement of Operations (cont'd)
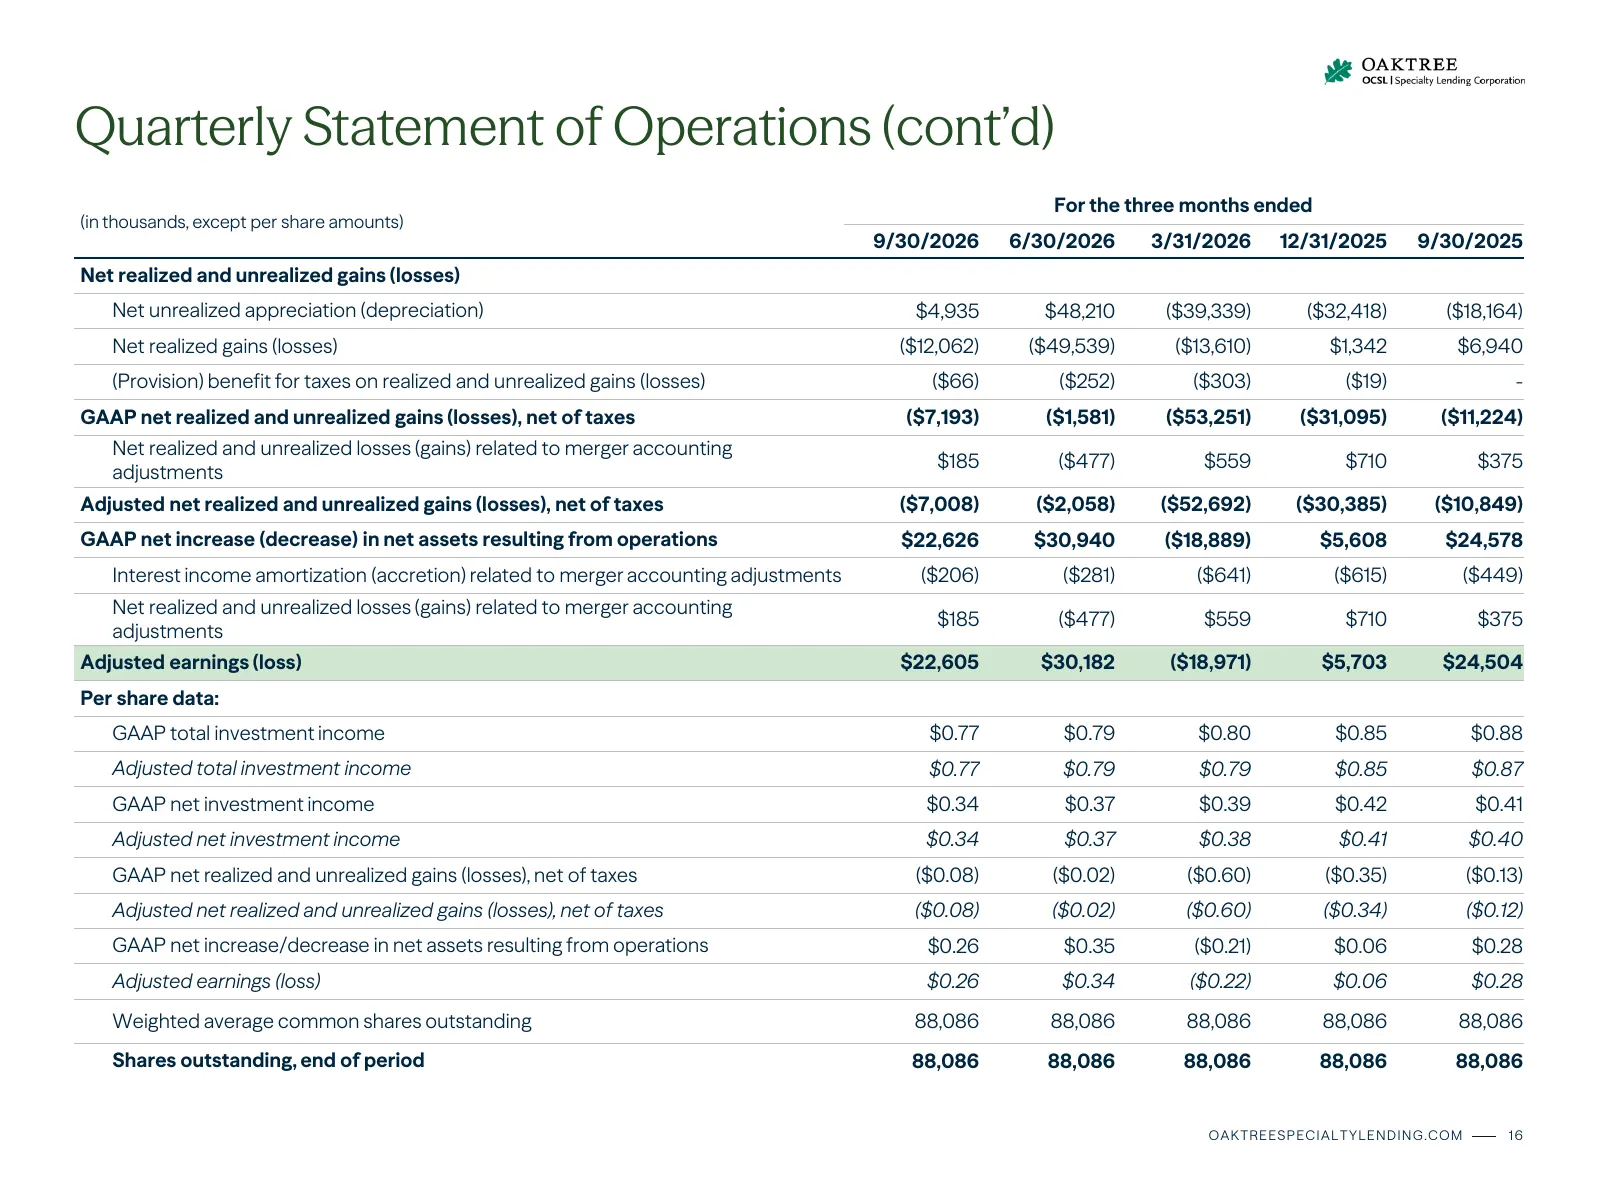
Quarterly Statement of Operations (cont’d) For the three months ended (in thousands, except per share amounts) 9/30/2026 6/30/2026 3/31/2026 12/31/2025 9/30/2025 Net realized and unrealized gains (losses) Net unrealized appreciation (depreciation) $4,935 $48,210 ($39,339) ($32,418) ($18,164) Net rea
Slide 18: Strategic Actions In Support of OCSL
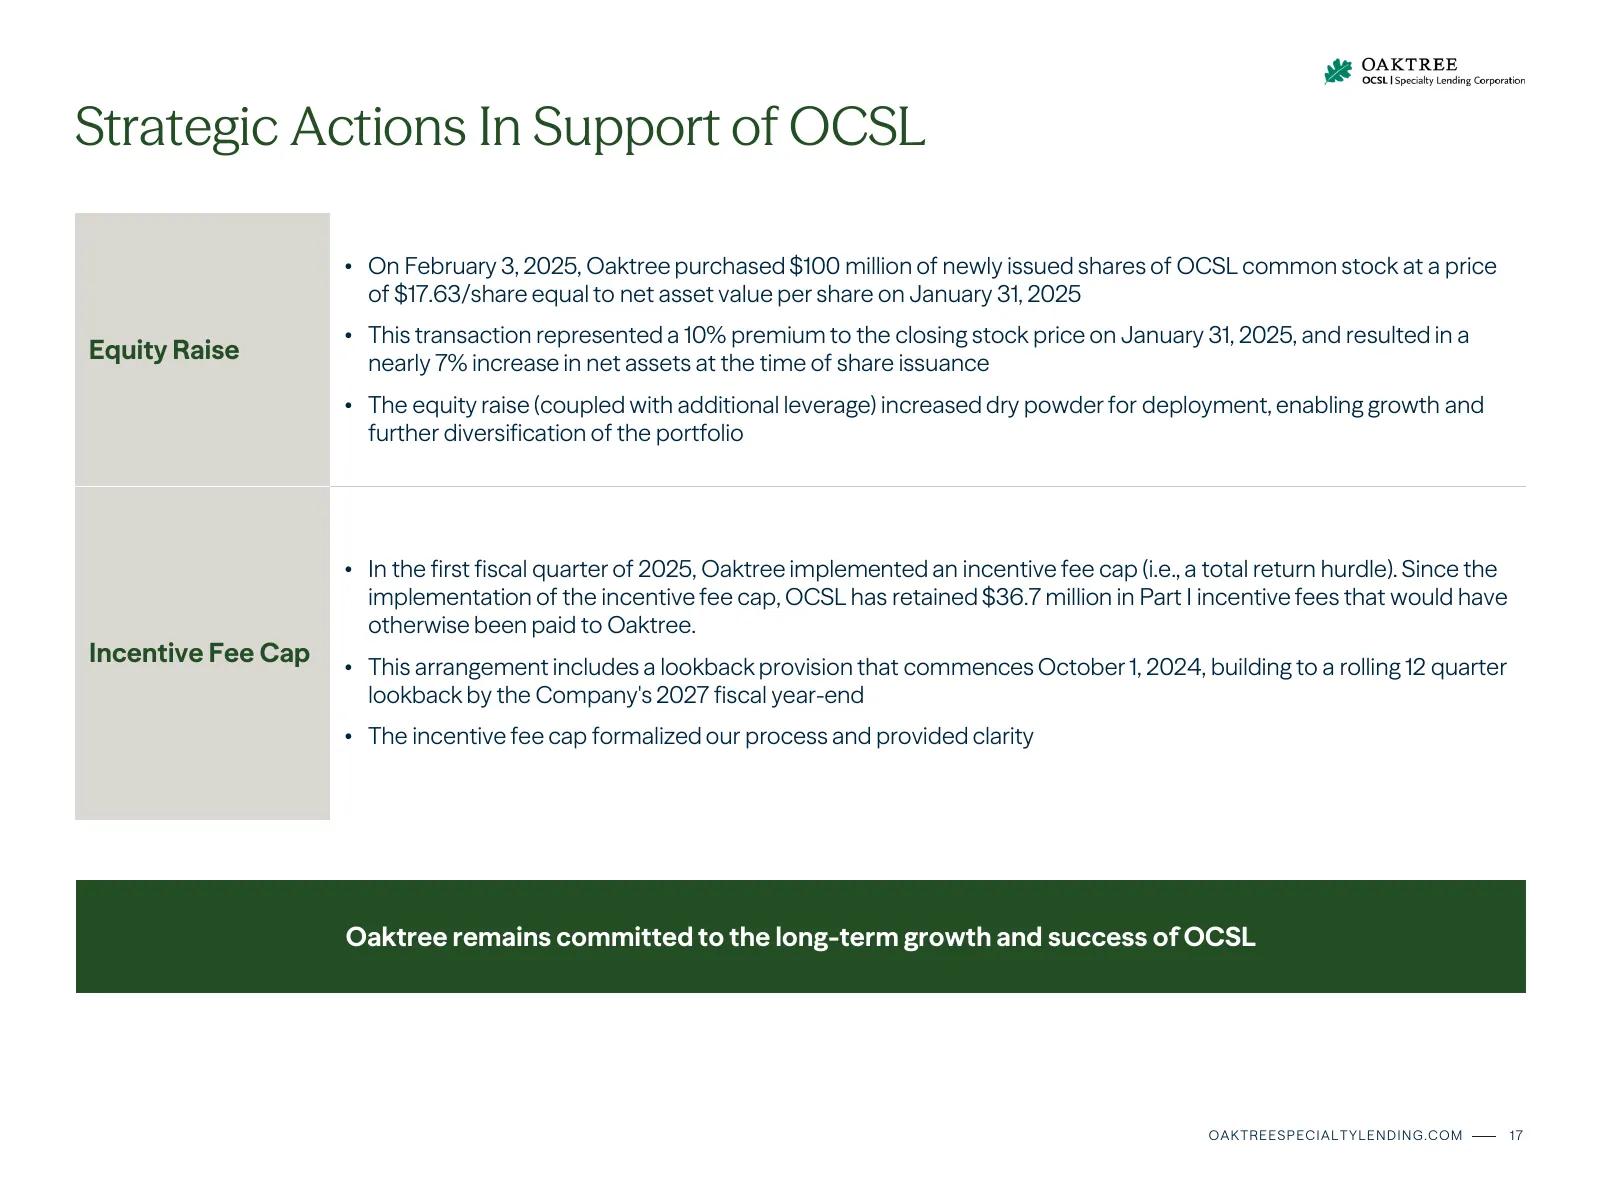
Strategic Actions In Support of OCSL • On February 3, 2025, Oaktree purchased $100 million of newly issued shares of OCSL common stock at a price of $17.63/share equal to net asset value per share on January 31, 2025 • This transaction represented a 10% premium to the closing stock price on January
Slide 19: Non-GAAP Disclosures
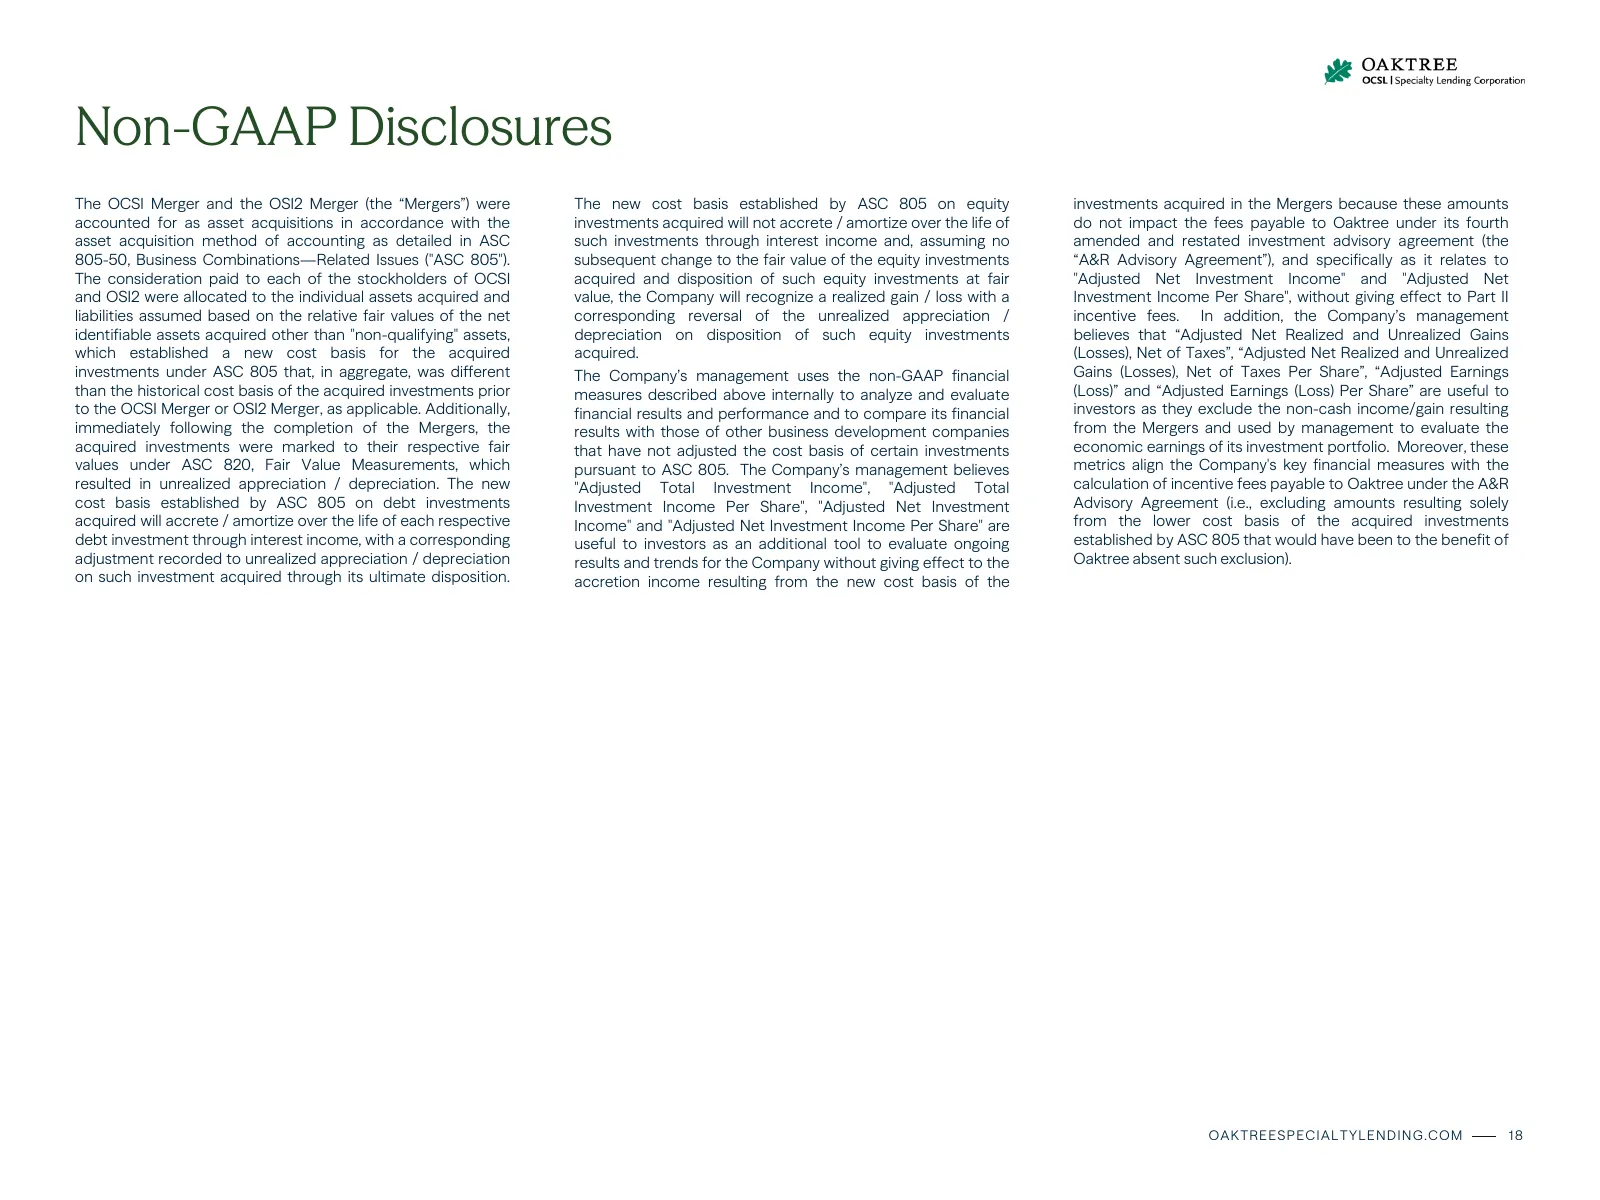
Non-GAAP Disclosures The OCSI Merger and the OSI2 Merger (the “Mergers”) were The new cost basis established by ASC 805 on equity investments acquired in the Mergers because these amounts accounted for as asset acquisitions in accordance with the investments acquired will not accrete / amortize over
Source: company website
More decks from Oaktree Specialty Lending Corporation
 Q3 2026 Earnings Presentation26 slides · Oct 16, 2026
 Q3 2026 Earnings Presentation20 slides · Aug 5, 2026
 Q2 2026 Earnings Presentation20 slides · May 5, 2026
 Q1 2026 Earnings Presentation20 slides · Feb 4, 2026
 Q4 2025 Earnings Presentation19 slides · Nov 18, 2025
 Q3 2025 Earnings Presentation19 slides · Aug 5, 2025