Arlington Asset Investment Corp
Arlington Asset Investment — Investor Presentation (May 2011)
12 slides from Arlington Asset Investment's investor presentation, May 9, 2011
Slide 1: Investor Presentation
ARLINGTON Investor Presentation ARLINGTON
Slide 2: Information Related to Forward-Looking Statements
Information Related to Forward-Looking Statements This presentation contains “forward-looking statements” within the meaning of the Private Securities Litigation Reform Act of 1995. These include statements regarding future results or expectations. Forward-looking statements can be identified by for
Slide 3: Overview: Tax-Advantaged Returns Plus Growth
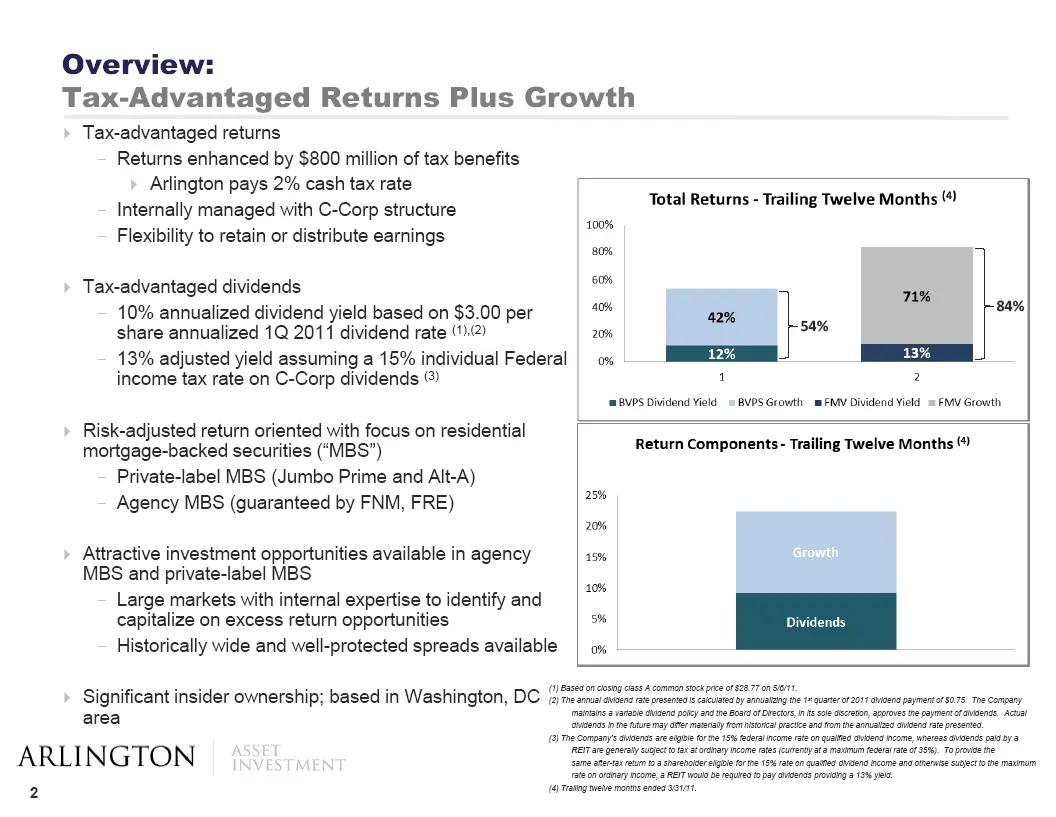
Overview: Tax-Advantaged Returns Plus Growth Tax-advantaged returns Returns enhanced by $800 million of tax benefits Arlington pays 2% cash tax rate Internally managed with C-Corp structure Total Returns - Trailing Twelve Months (4) Flexibility to retain or distribute earnings re 20% Tax-advantaged
Slide 4: Overview: Tax-Advantaged Returns Plus Growth
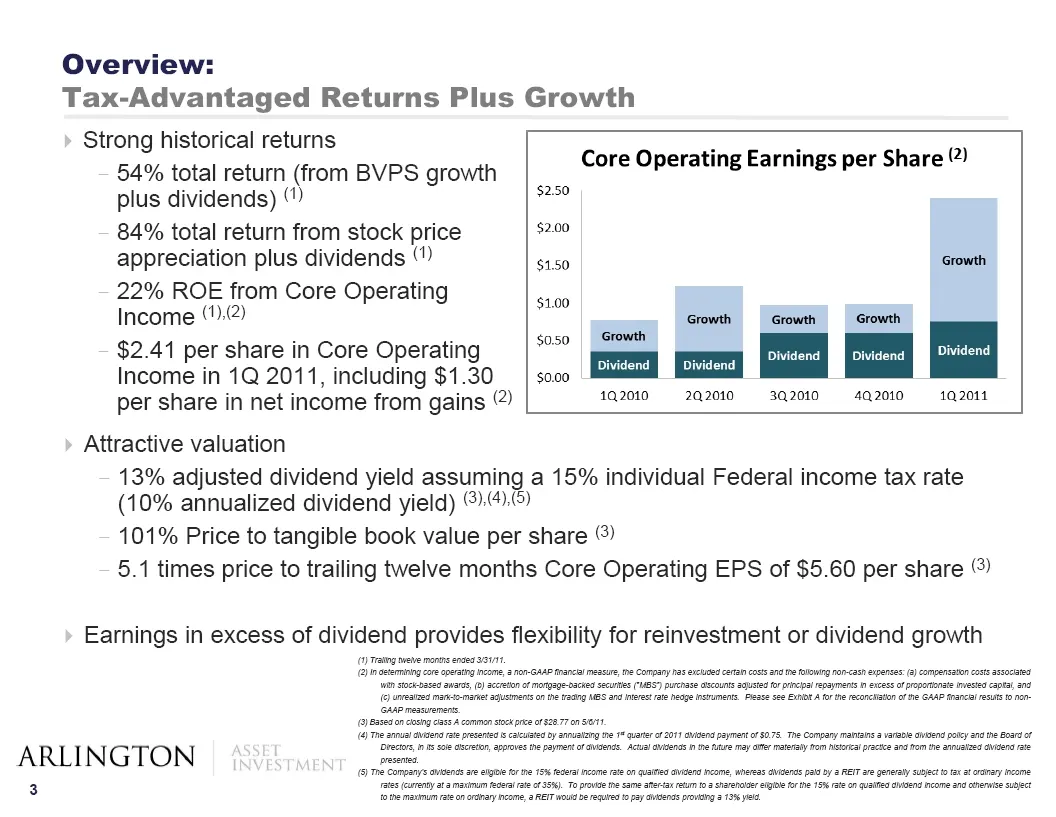
Overview: Tax-Advantaged Returns Plus Growth Strong historical returns . . 9 54% total return (from BVPS growth Core Operating Earnings per Share”) plus dividends) “’) $250 84% total return from stock price $2.00 appreciation plus dividends “') $1.50 Growth 22% ROE from Core Operating a Income “).(2
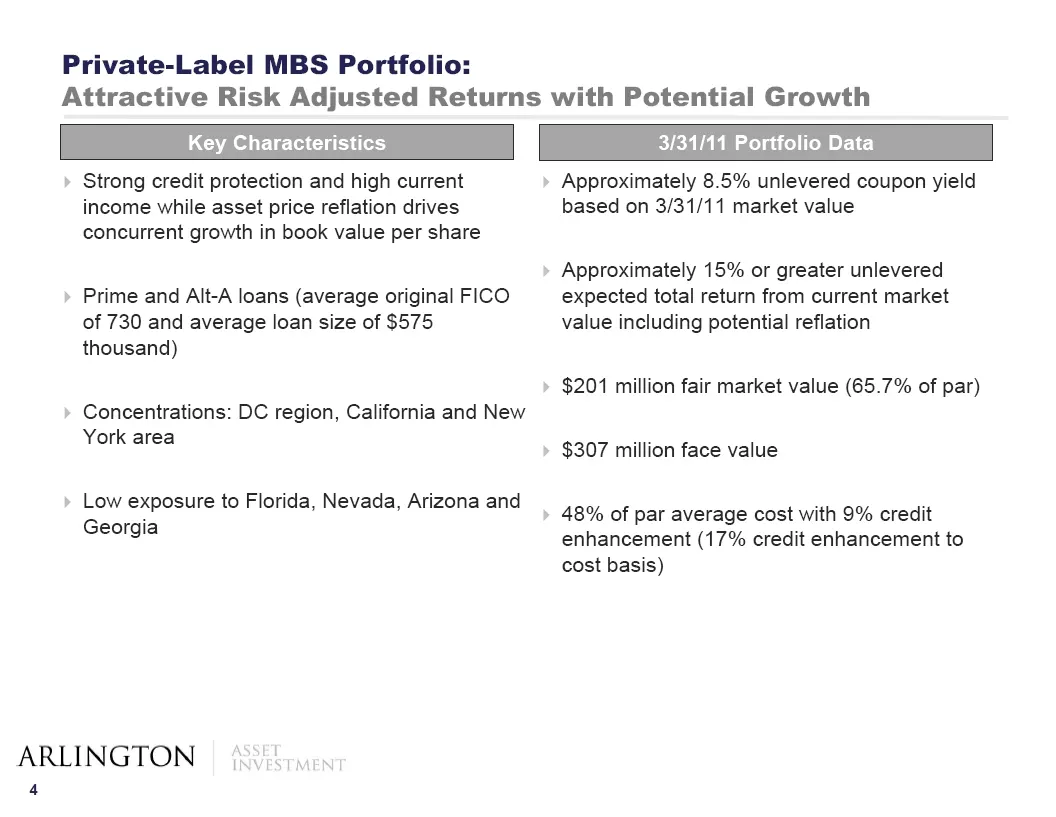
Slide 5: Private-Label MBS Portfolio: Attractive Risk Adjusted Returns with Potential Growth
Private-Label MBS Portfolio: Attractive Risk Adjusted Returns with Potential Growth Key Characteristics 3/31/11 Portfolio Data Strong credit protection and high current Approximately 8.5% unlevered coupon yield income while asset price reflation drives based on 3/31/11 market value concurrent growth
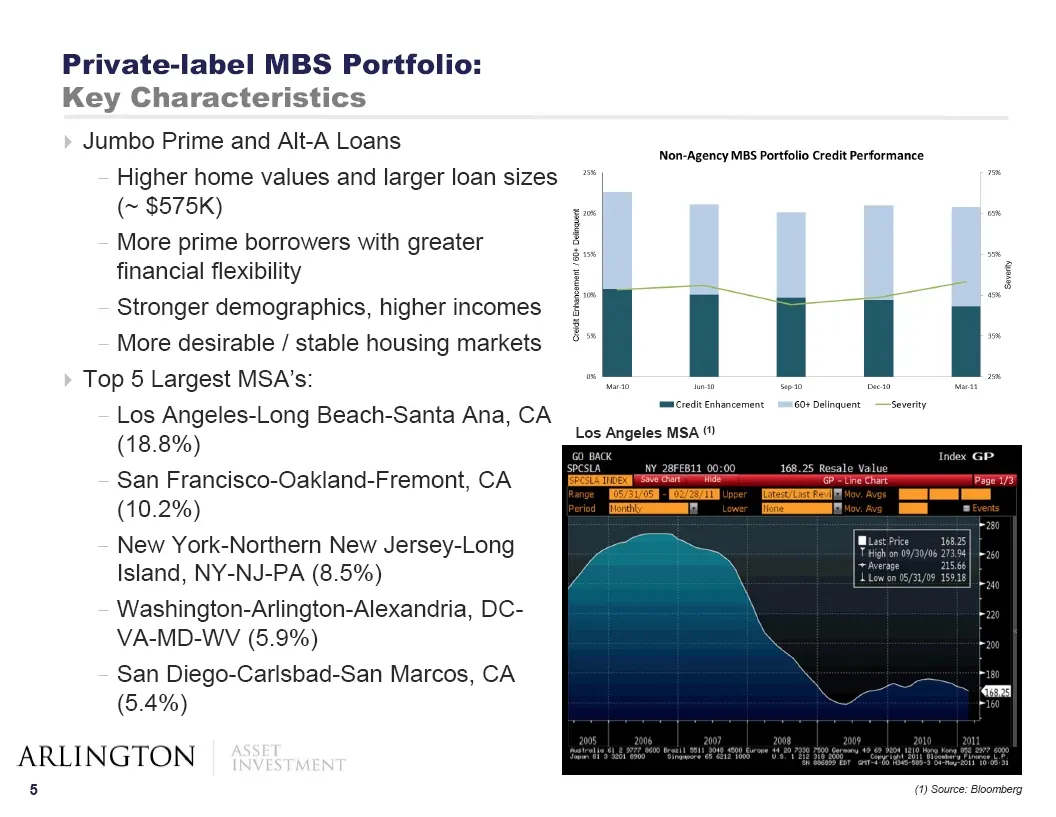
Slide 6: Private-label MBS Portfolio: Key Characteristics
Private-label MBS Portfolio: Key Characteristics Jumbo Prime and Alt-A Loans Higher home values and larger loan sizes (~ $575K) More prime borrowers with greater financial flexibility Stronger demographics, higher incomes More desirable / stable housing markets Non-Agency MBS Portfolio Credit Perfor
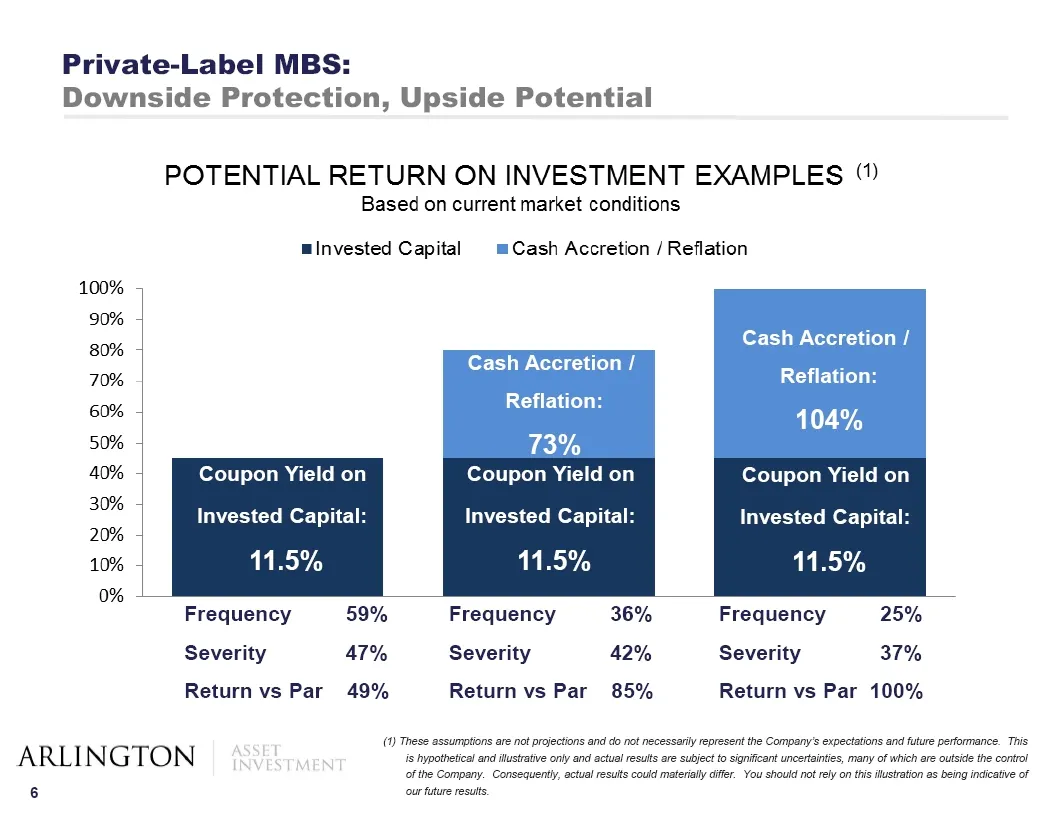
Slide 7: Private-Label MBS: Downside Protection, Upside Potential
Private-Label MBS: Downside Protection, Upside Potential POTENTIAL RETURN ON INVESTMENT EXAMPLES “) Based on current market conditions mlnvested Capital | =Cash Accretion / Reflation 100% 90% Cash Accretion / 80% Cash Accretion / 70% 60% Reflation: 50% 73% 40% Coupon Yield on Coupon Yield on Coupon
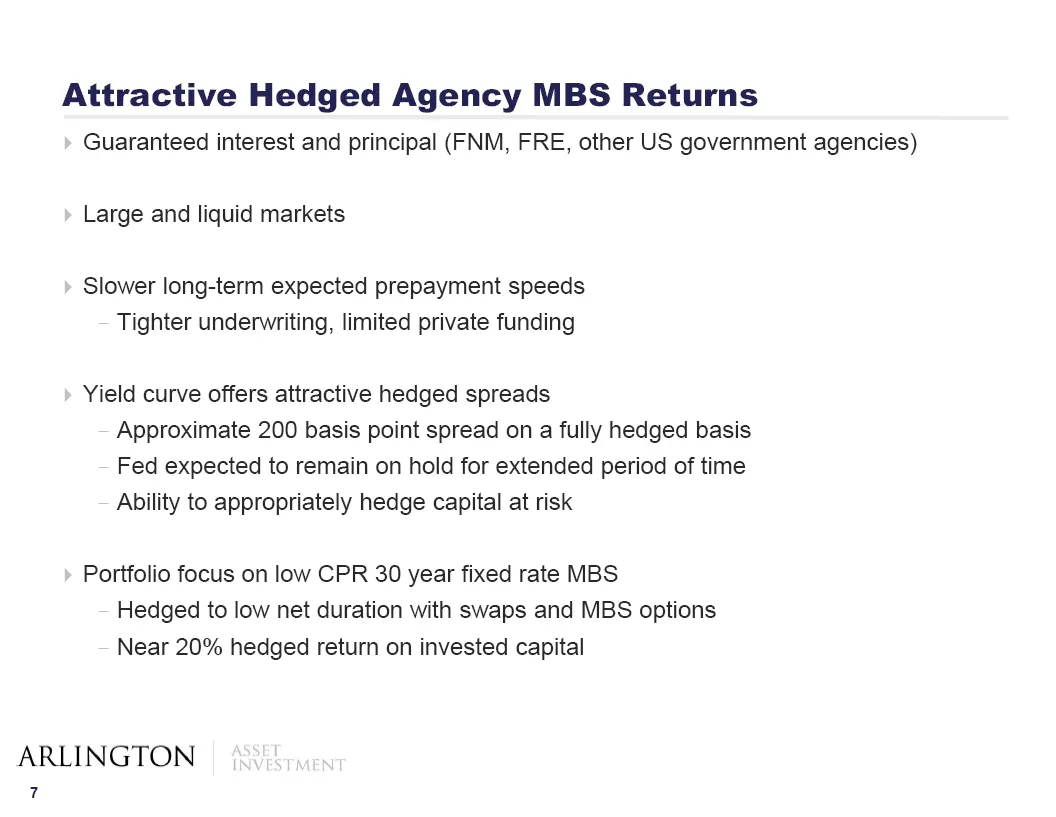
Slide 8: Attractive Hedged Agency MBS Returns
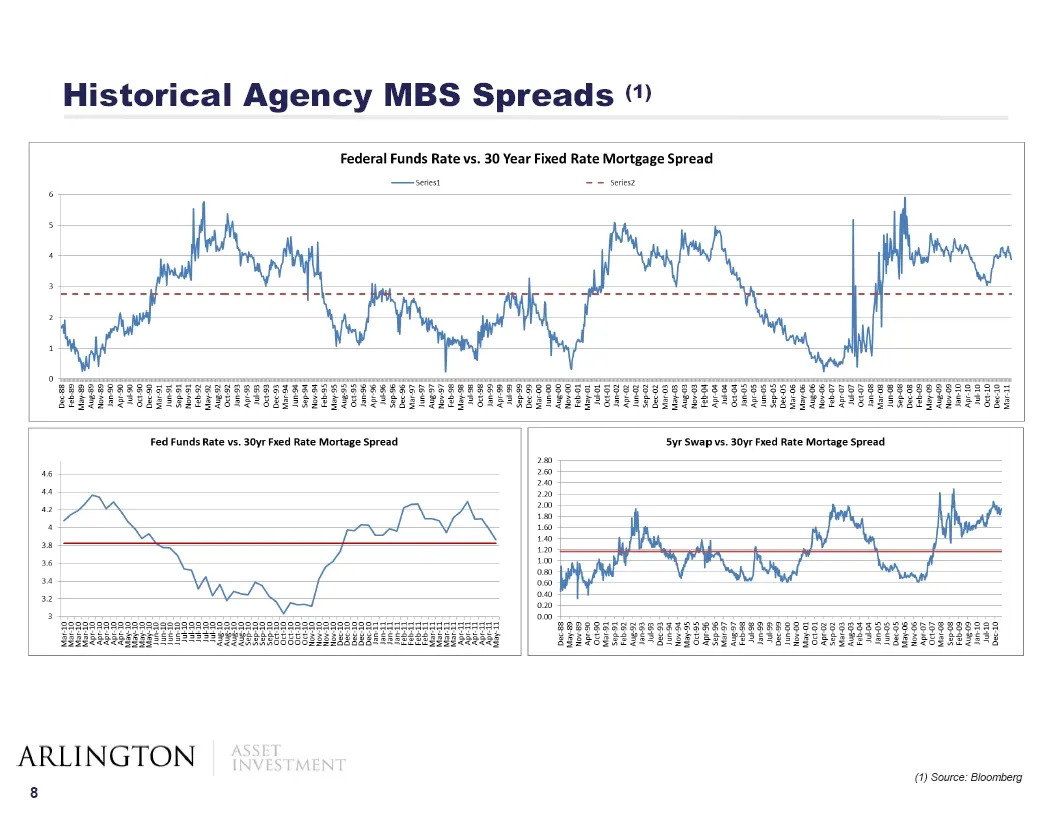
Attractive Hedged Agency MBS Returns Guaranteed interest and principal (FNM, FRE, other US government agencies) Large and liquid markets Slower long-term expected prepayment speeds Tighter underwriting, limited private funding Yield curve offers attractive hedged spreads Approximate 200 basis point
Slide 9: Historical Agency MBS Spreads
Historical Agency MBS Spreads “) Federal Funds Rate vs. 30 Year Fixed Rate Mortgage Spread ARLINGTON ens 8 (1) Source: Bloomberg
Slide 10: MBS Portfolio Reallocation: Drives EPS and Potential Book Value per Share Growth
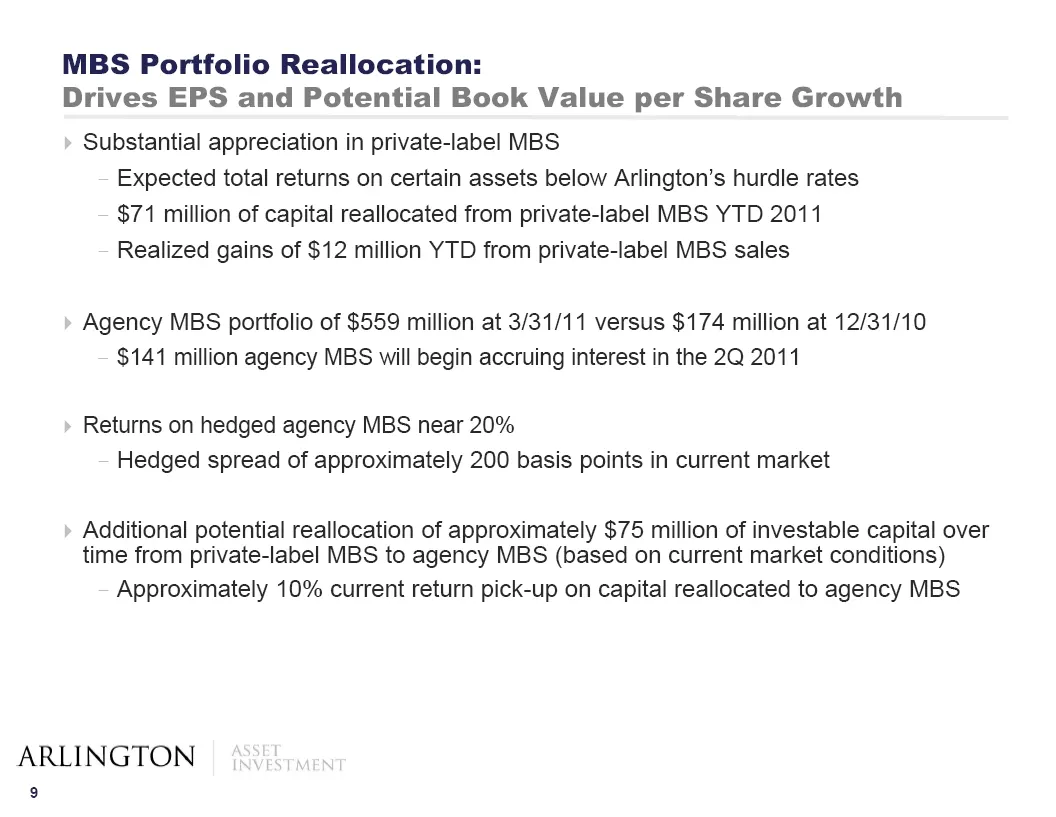
MBS Portfolio Reallocation: Drives EPS and Potential Book Value per Share Growth Substantial appreciation in private-label MBS Expected total returns on certain assets below Arlington’s hurdle rates $71 million of capital reallocated from private-label MBS YTD 2011 Realized gains of $12 million YTD
Slide 11: Attractive Cash Returns Plus Growth
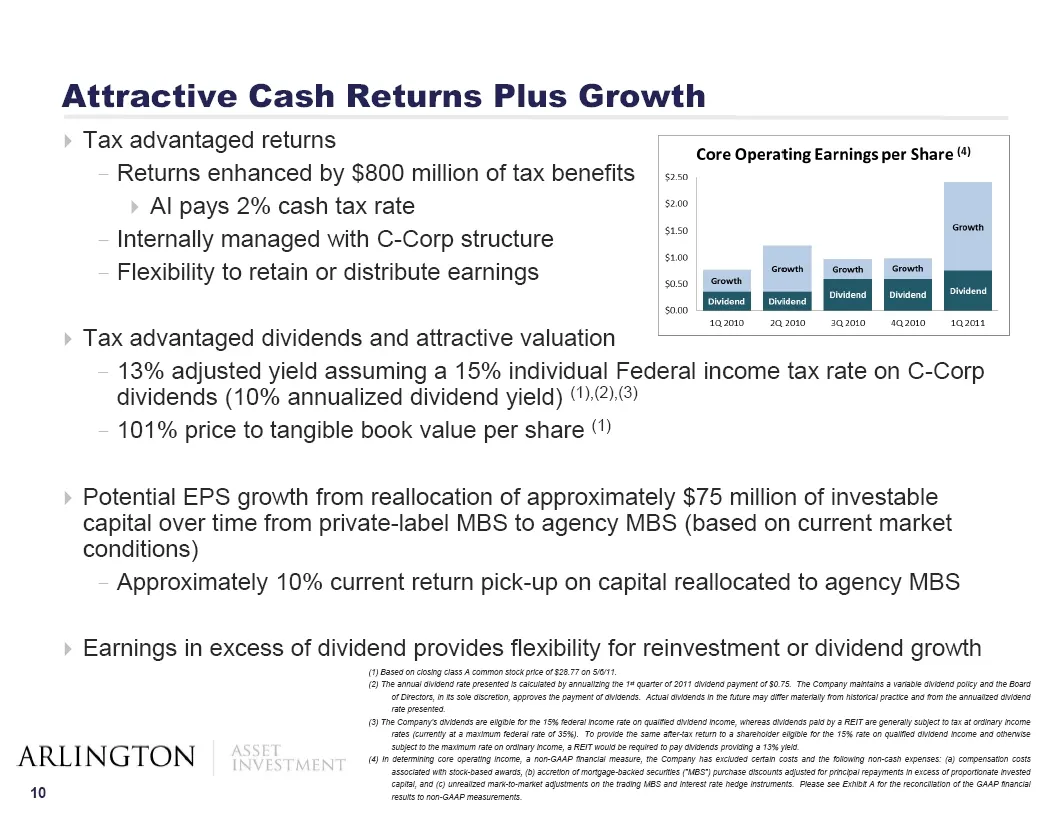
Attractive Cash Returns Plus Growth Tax advantaged returns Returns enhanced by $800 million of tax benefits 9» Al pays 2% cash tax rate S200 Core Operating Earnings per Share “) Internally managed with C-Corp structure sso Grove 5100 Flexibility to retain or distribute earnings oo | ee a ee Tax adva
Slide 12: Exhibit A
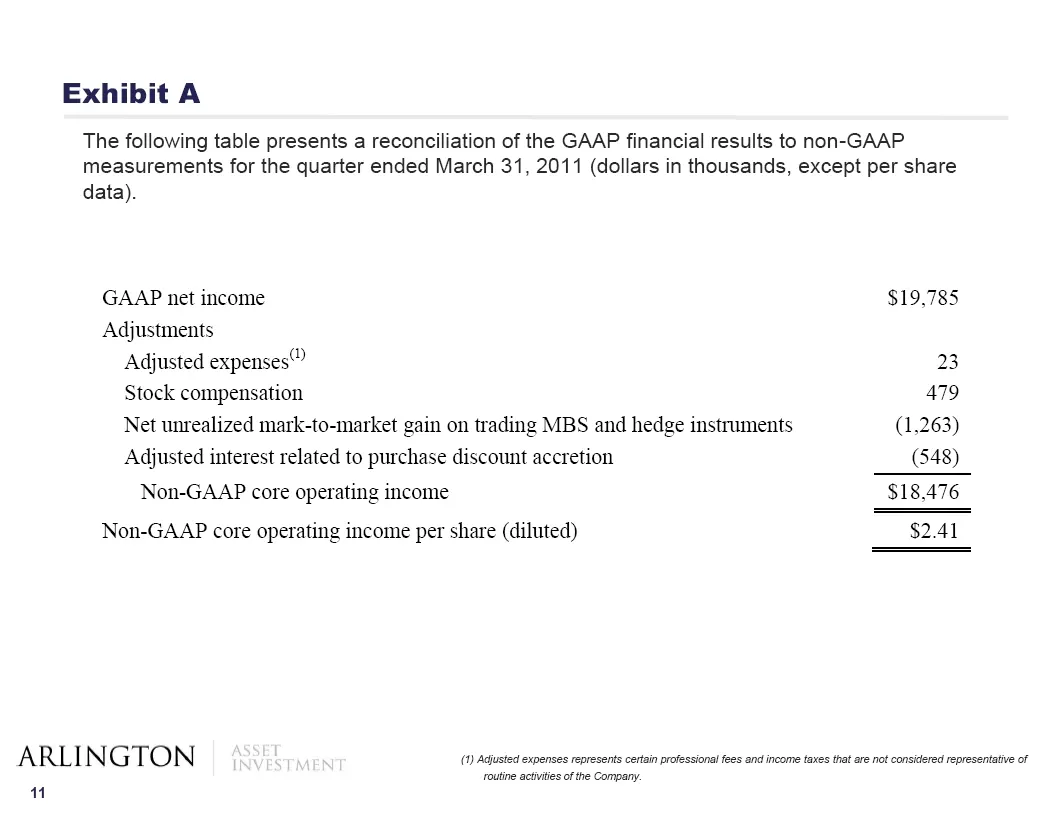
Exhibit A The following table presents a reconciliation of the GAAP financial results to non-GAAP measurements for the quarter ended March 31, 2011 (dollars in thousands, except per share data). GAAP net income $19,785 Adjustments Adjusted expenses” 23 Stock compensation 479 Net unrealized mark-to-m
Source: SEC EDGAR · 8-K filed May 9, 2011
More decks from Arlington Asset Investment Corp
 Q3 2023 Earnings Presentation12 slides · Nov 13, 2023
 Q2 2023 Earnings Presentation12 slides · Aug 14, 2023
 Q1 2023 Earnings Presentation16 slides · May 15, 2023
 Q4 2022 Earnings Presentation20 slides · Mar 31, 2023
 Q3 2022 Earnings Presentation29 slides · Nov 15, 2022
 Q2 2022 Earnings Presentation31 slides · Aug 10, 2022