Sembcorp Industries Ltd. · SGX:U96
Sembcorp Industries — H1 2013 Earnings Presentation
23 slides from Sembcorp Industries's earnings presentation, Aug 6, 2013
Slide 1: 1H2013 Results Announcement
1H2013 Results Announcement August 6, 2013 © Sembcorp Industries 2013 Scope of Presentation • CEO’s Report • Financial Review • Group Outlook © Sembcorp Industries 2013 2
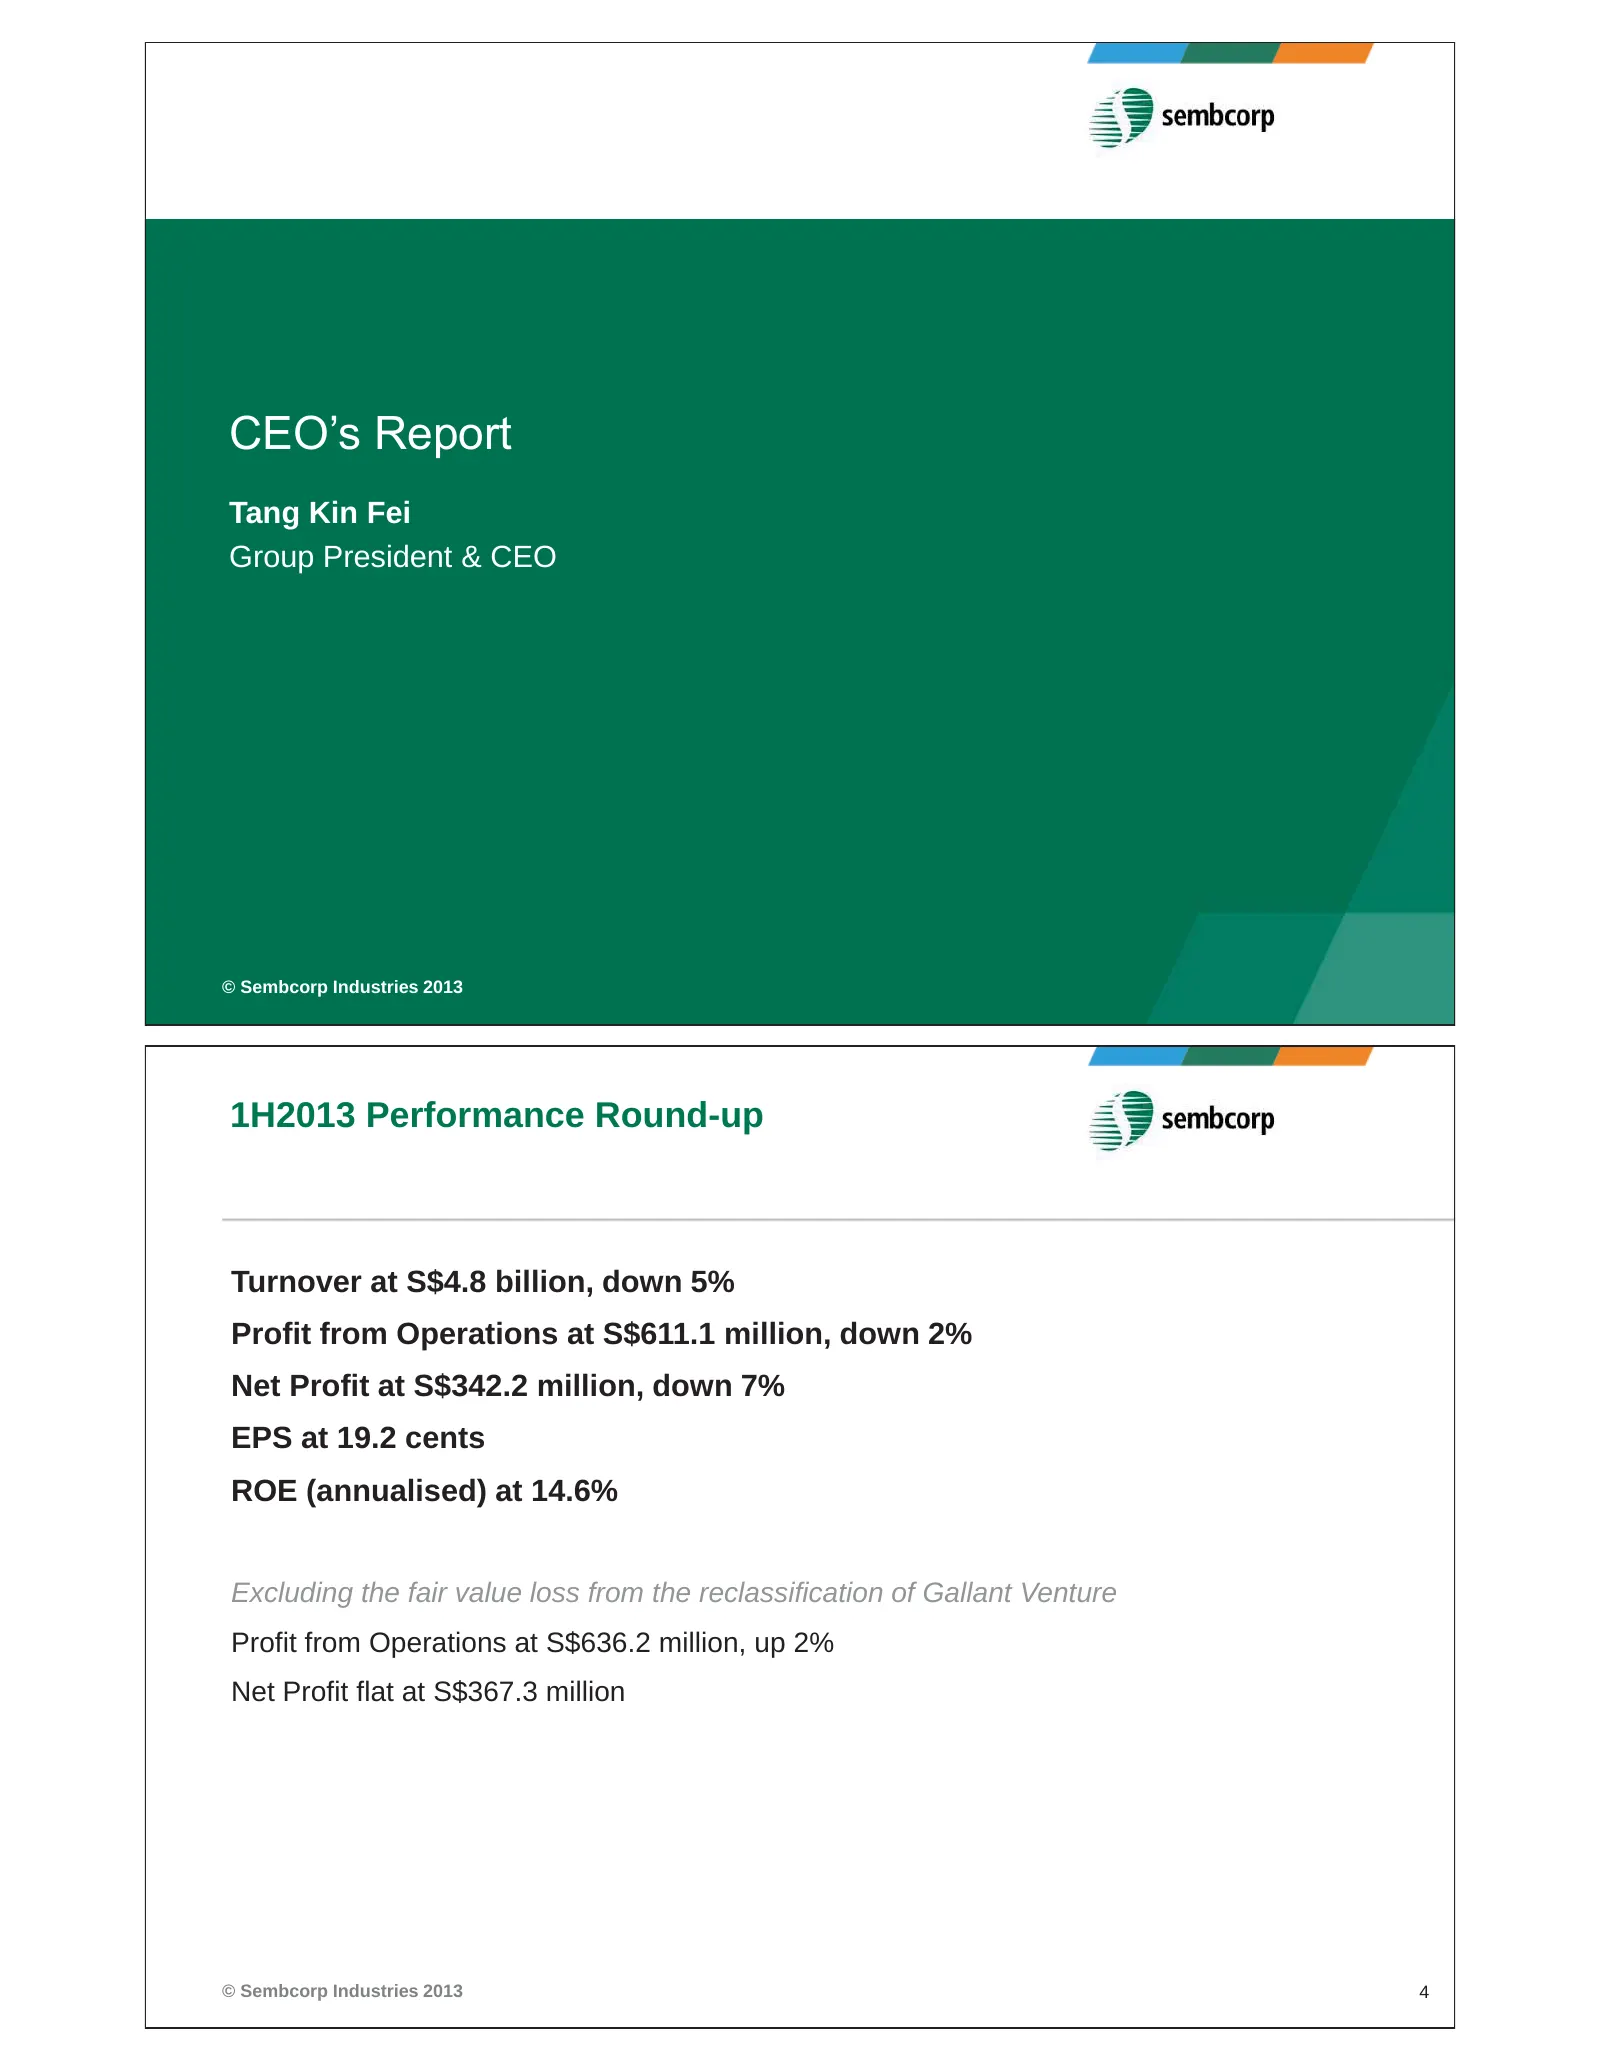
Slide 2: CEO's Report: 1H2013 Performance Round-up
CEO’s Report Tang Kin Fei Group President & CEO © Sembcorp Industries 2013 1H2013 Performance Round-up Turnover at S$4.8 billion, down 5% Profit from Operations at S$611.1 million, down 2% Net Profit at S$342.2 million, down 7% EPS at 19.2 cents ROE (annualised) at 14.6% Excluding the fair value los
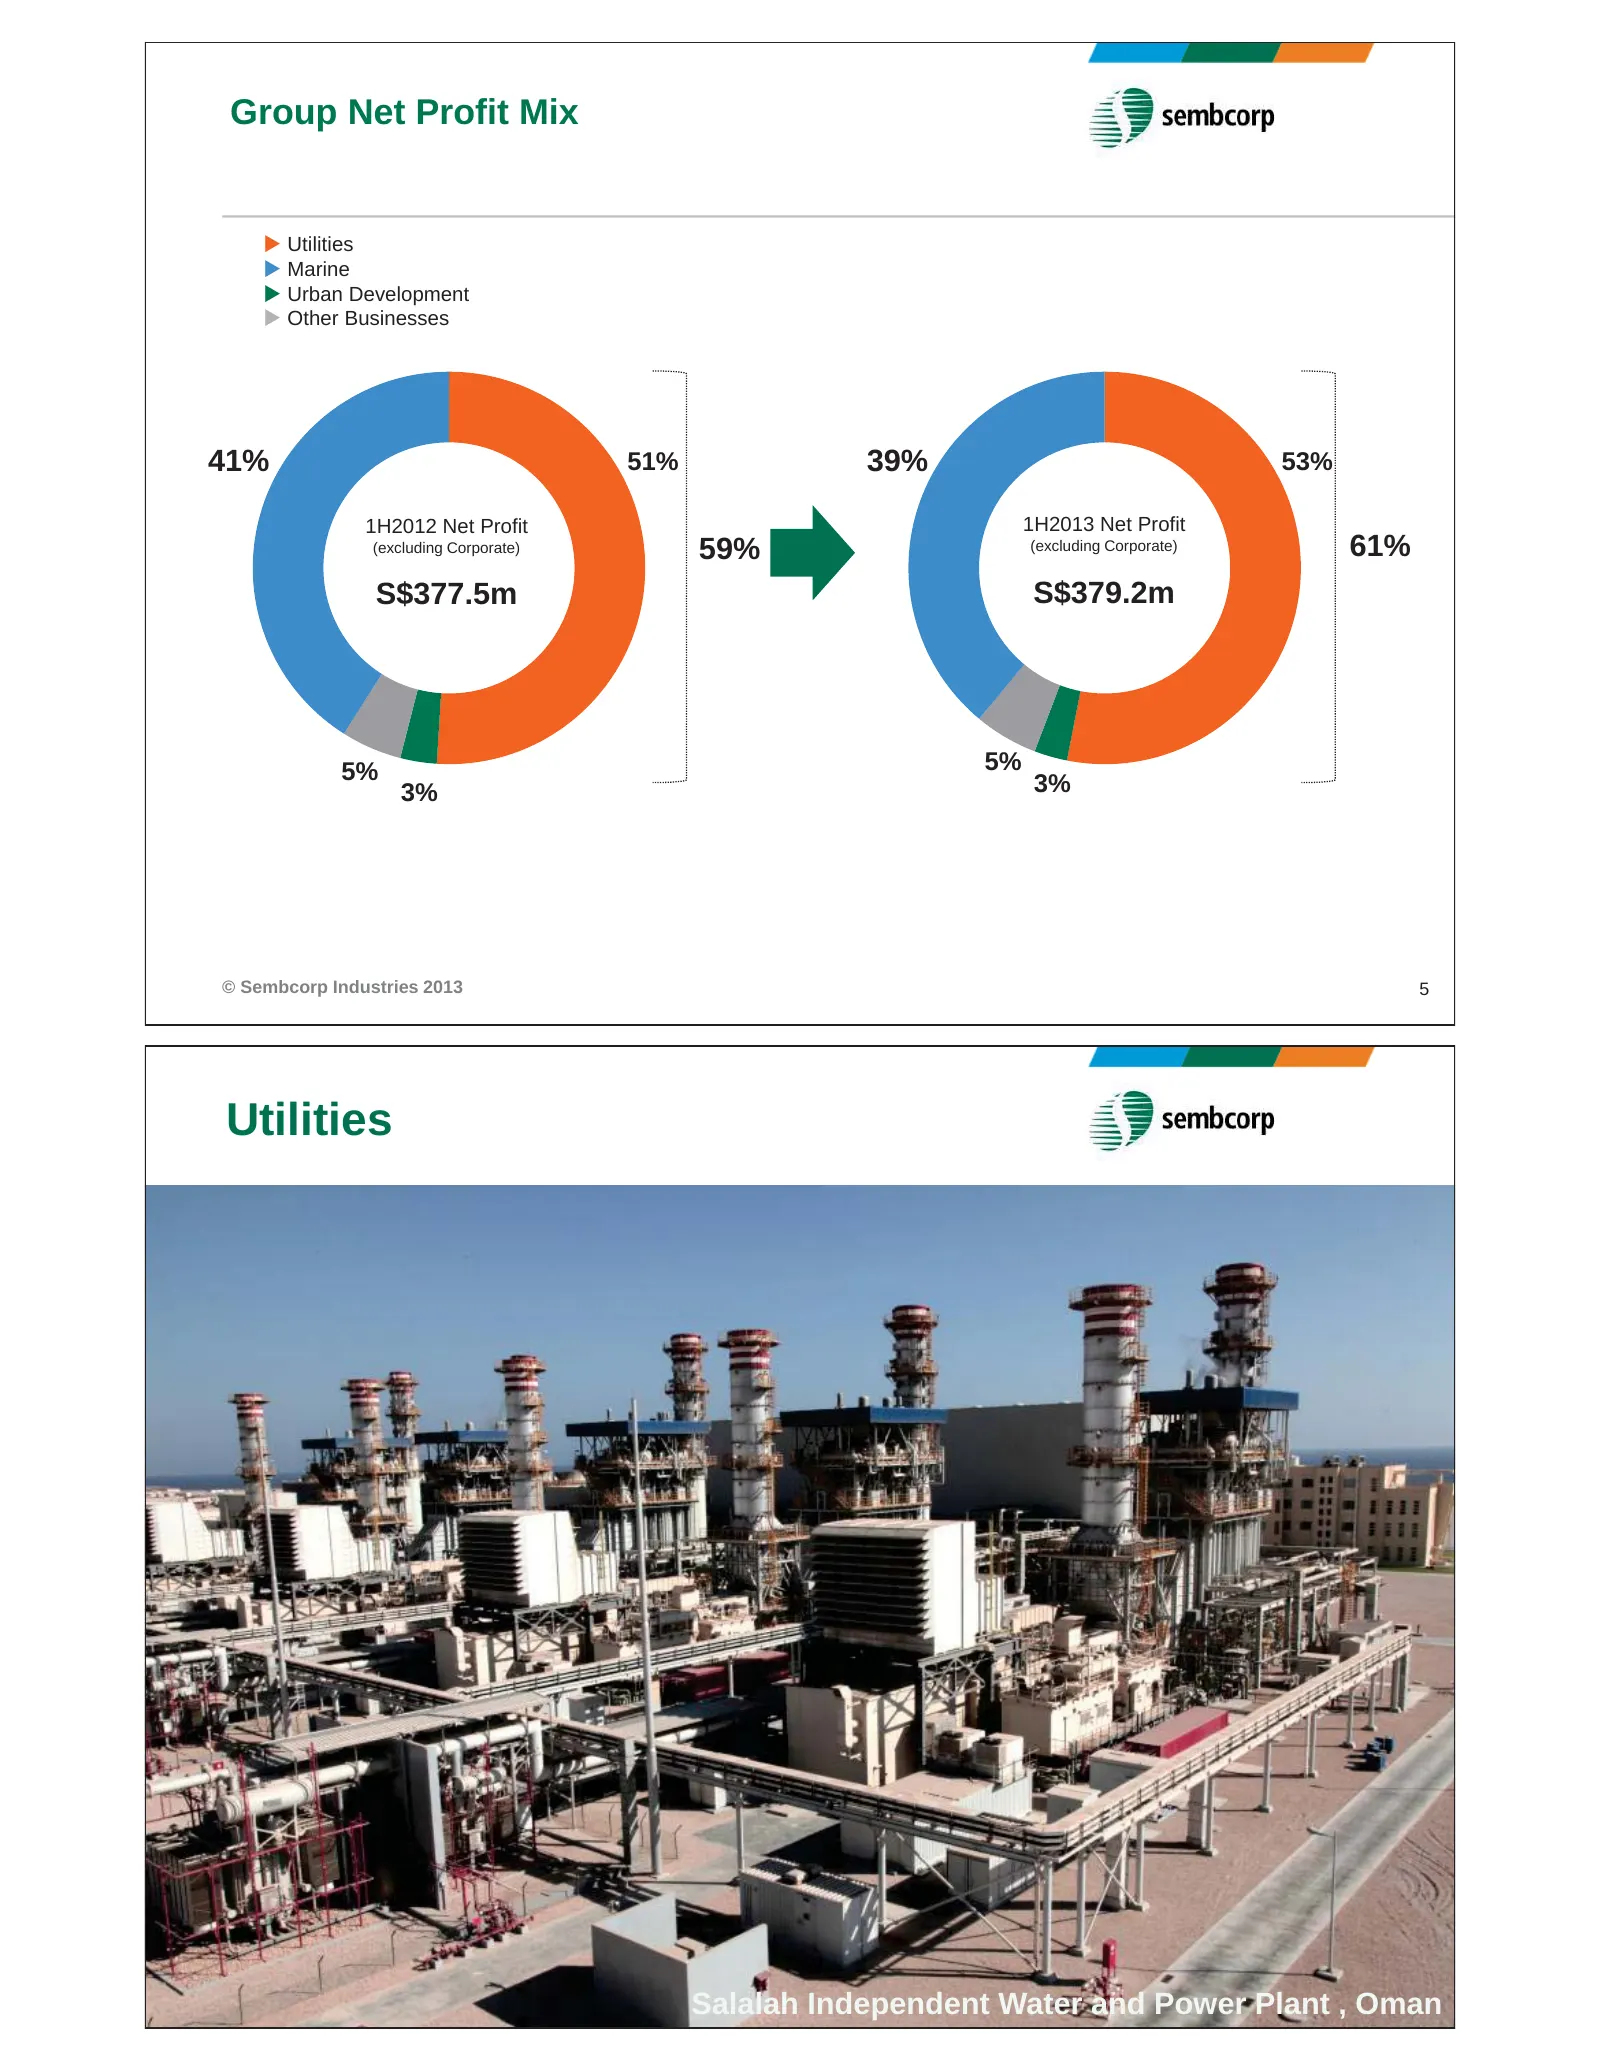
Slide 3: Group Net Profit Mix
Group Net Profit Mix X Utilities X Marine X Urban Development X Other Businesses 41% 51% 39% 53% 1H2012 Net Profit 1H2013 Net Profit (excluding Corporate) 59% (excluding Corporate) 61% S$377.5m S$379.2m 5% 5% 3% 3% © Sembcorp Industries 2013 5 Utilities © Sembcorp Industries 2013 6 Salalah Independe
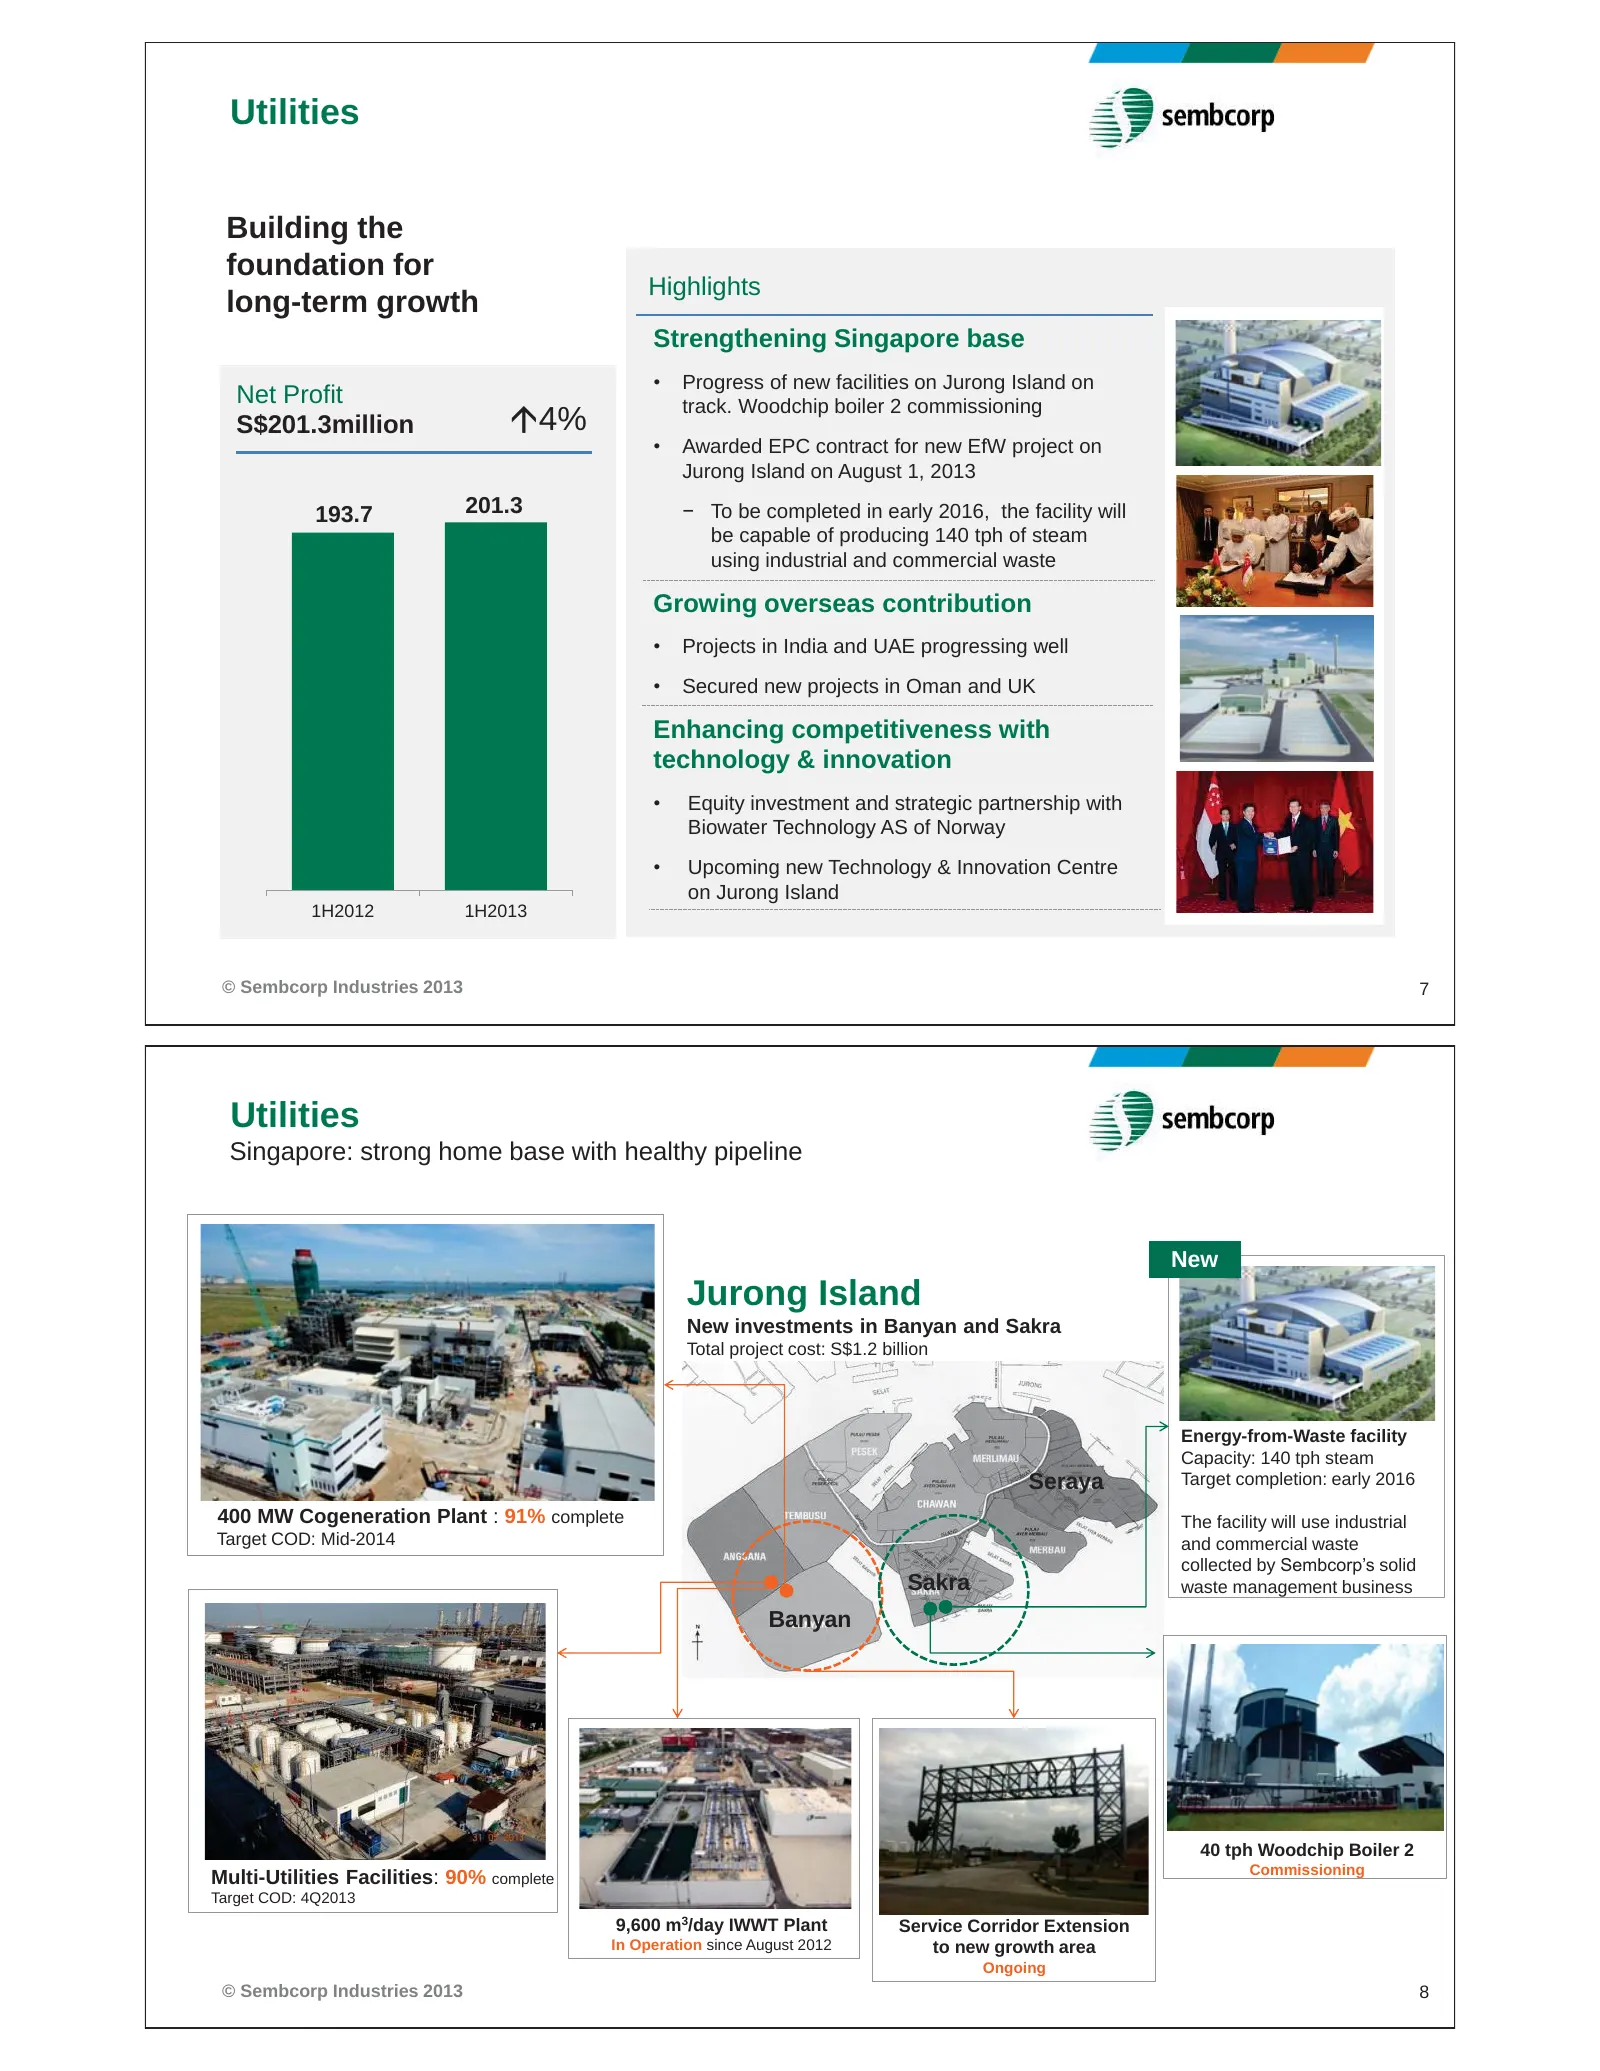
Slide 4: Utilities Highlights
Utilities Building the foundation for Highlights long-term growth Strengthening Singapore base • Progress of new facilities on Jurong Island on Net Profit track. Woodchip boiler 2 commissioning S$201.3million Ç4% • Awarded EPC contract for new EfW project on Jurong Island on August 1, 2013 193.7 201
Slide 5: Growing overseas contribution in key markets
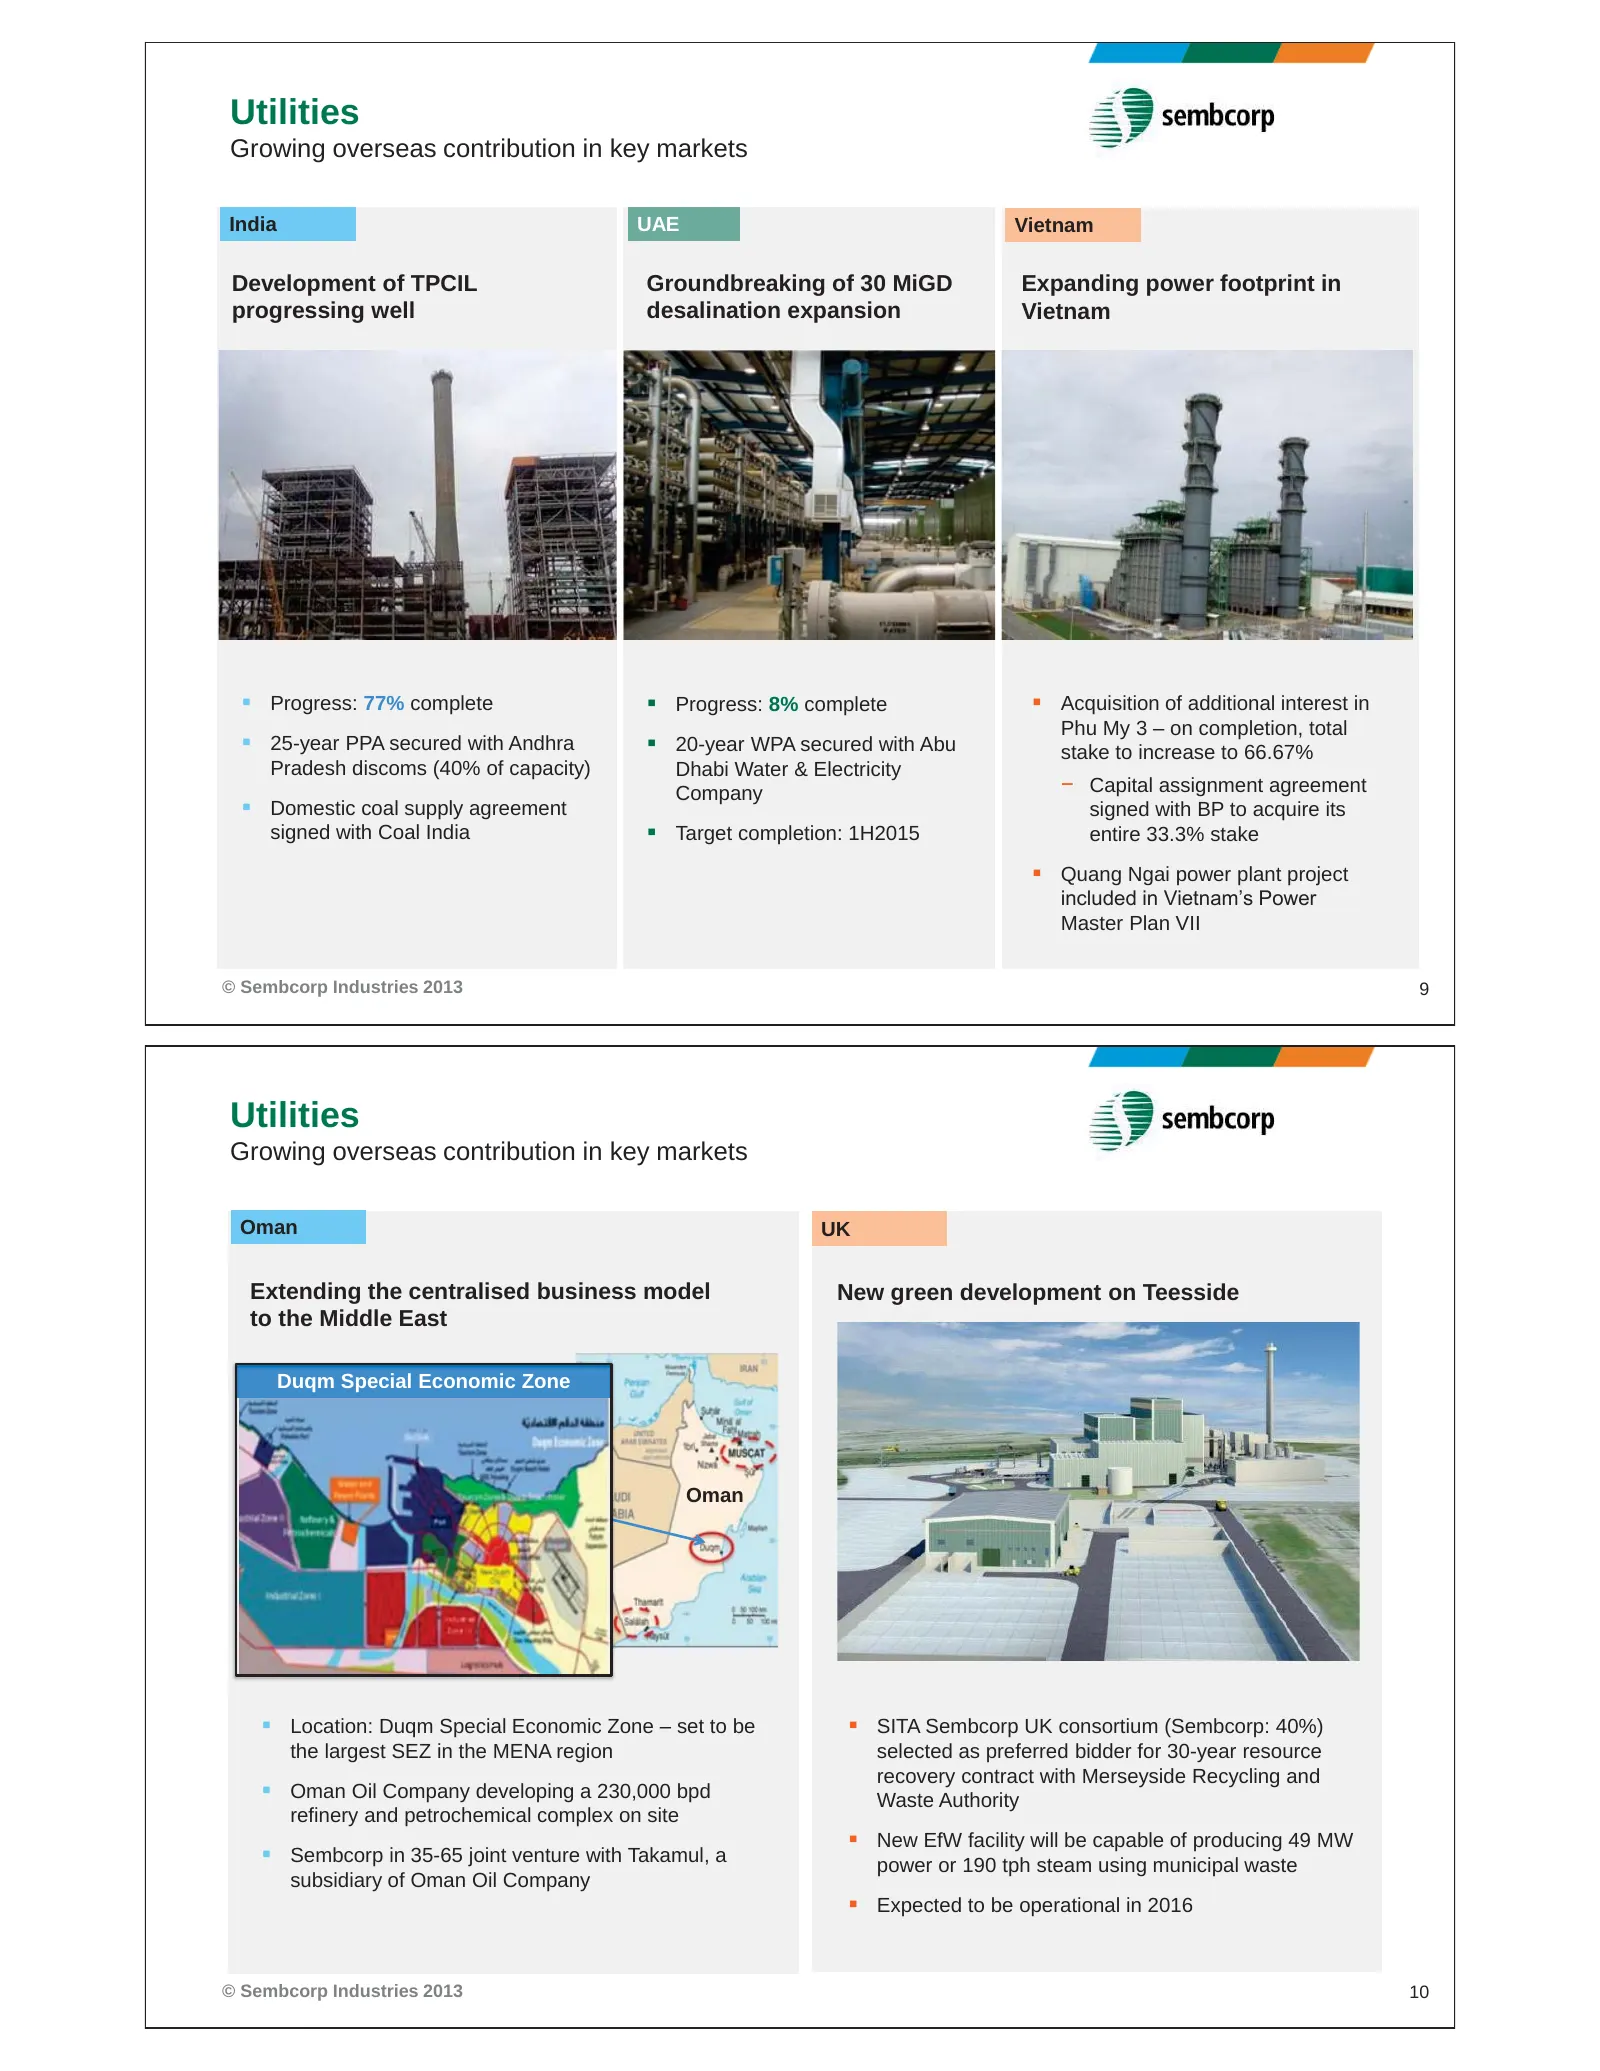
Utilities Growing overseas contribution in key markets India UAE Vietnam Development of TPCIL Groundbreaking of 30 MiGD Expanding power footprint in progressing well desalination expansion Vietnam Progress: 77% complete Progress: 8% complete Acquisition of additional interest in Phu My 3 – on
Slide 6: Technology & Innovation
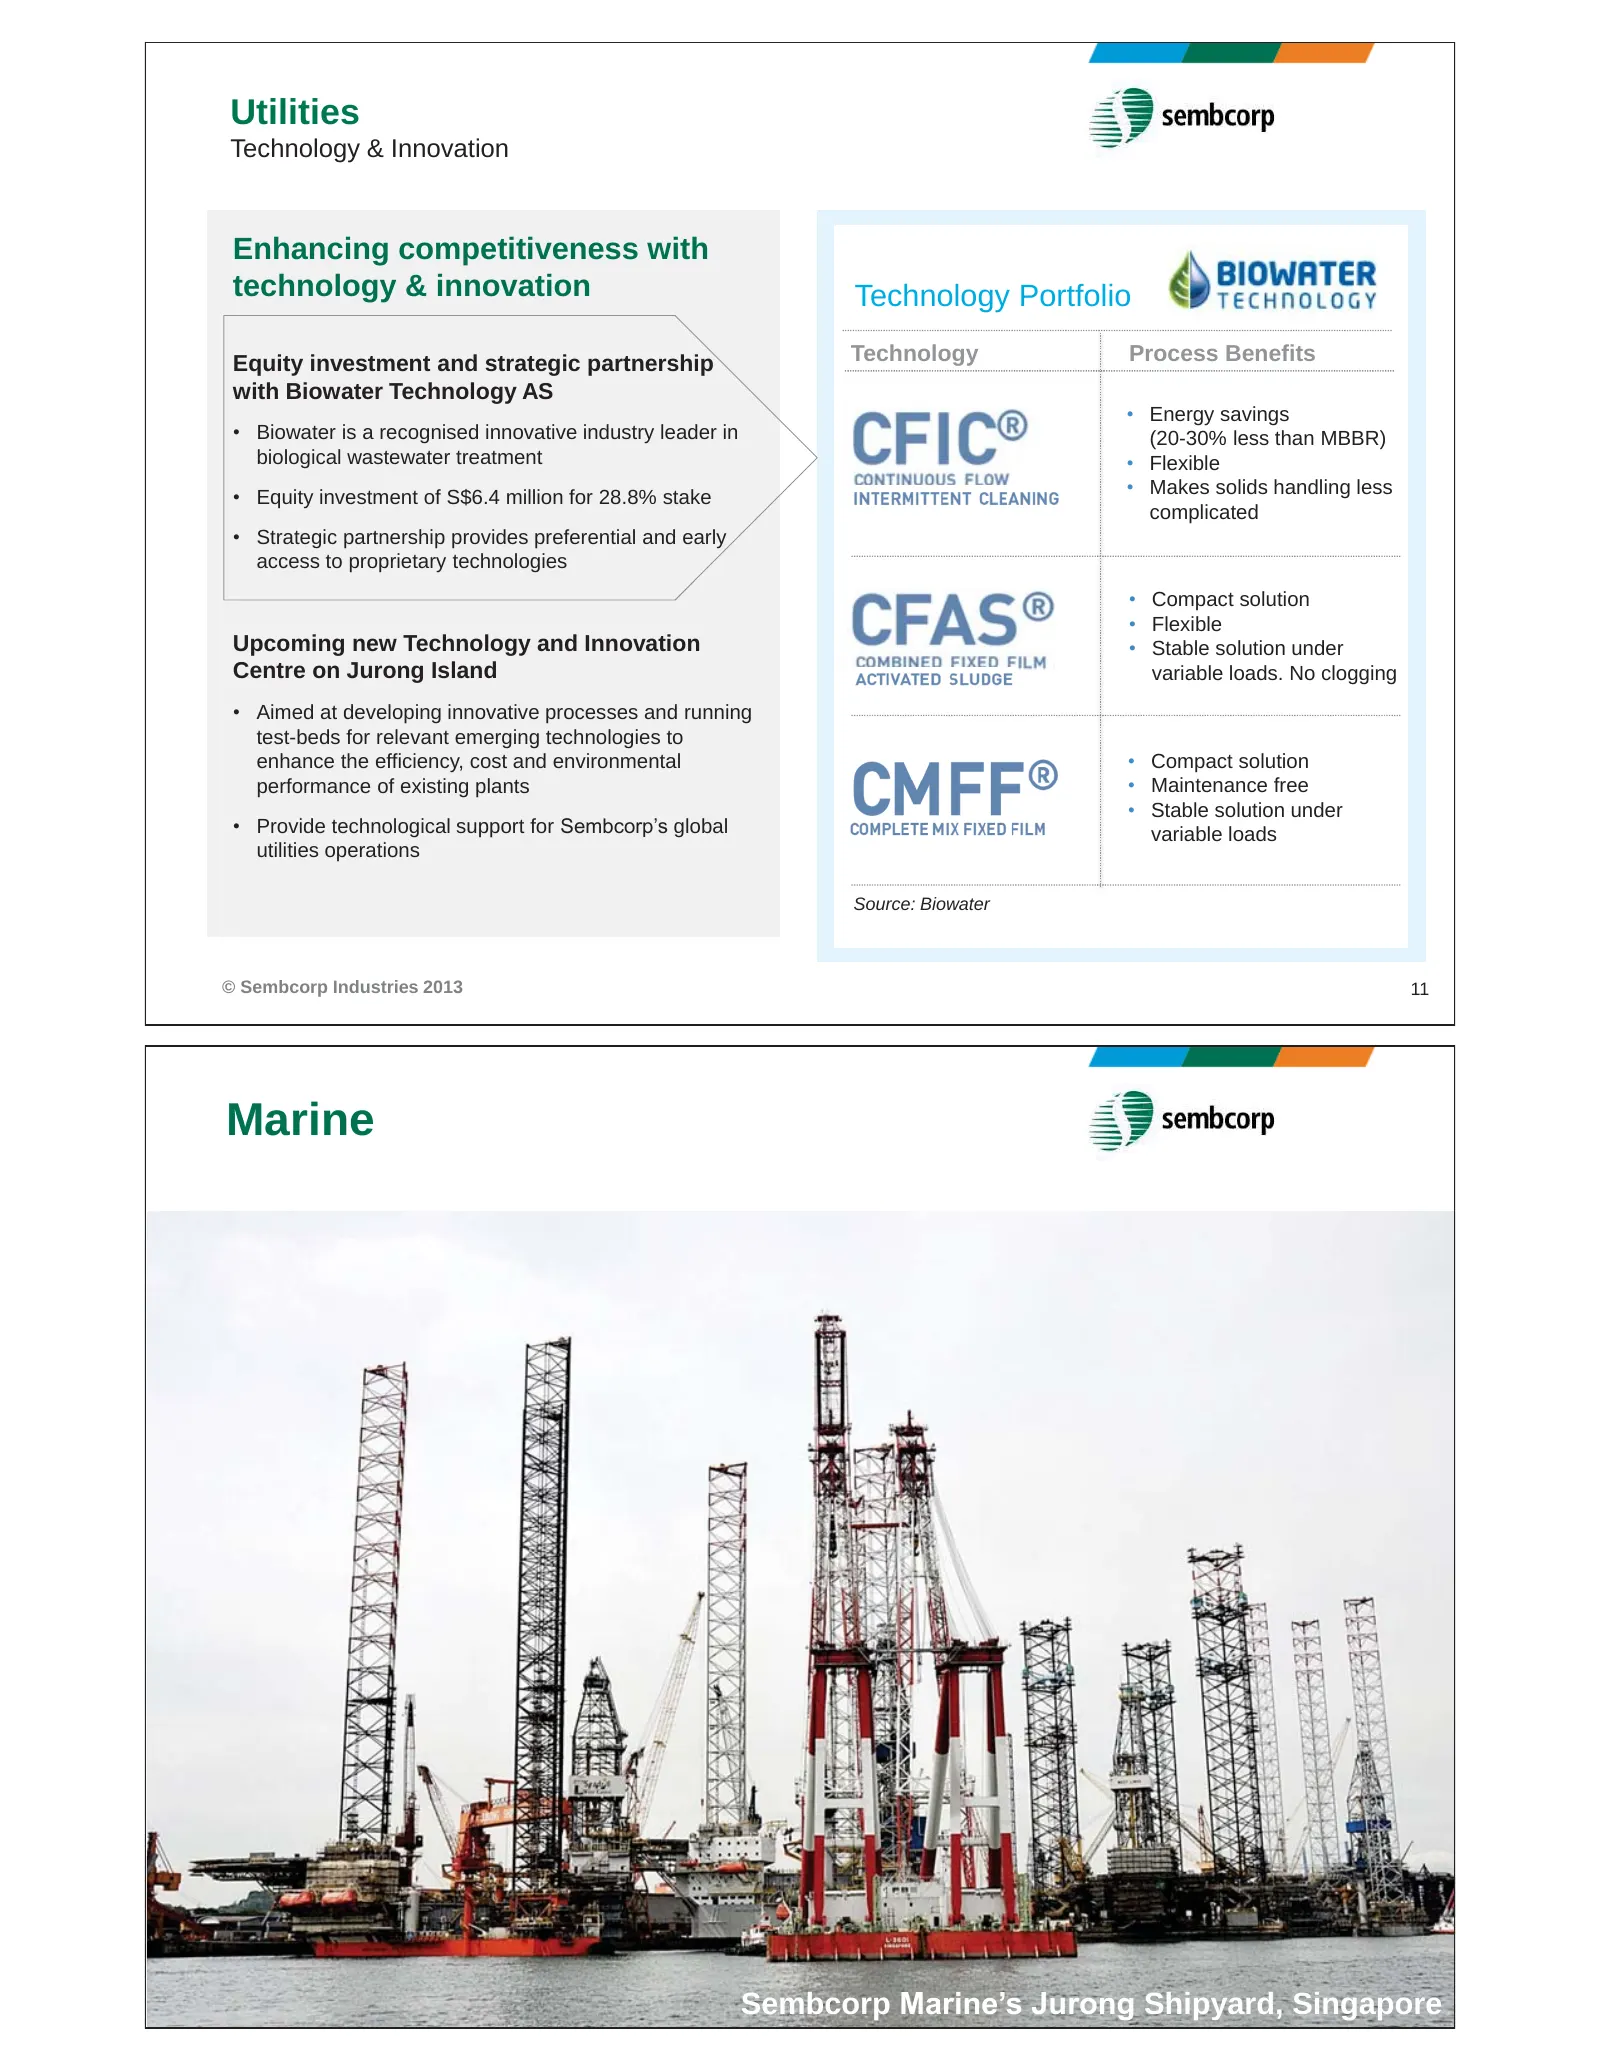
Utilities Technology & Innovation Enhancing competitiveness with technology & innovation Technology Portfolio Equity investment and strategic partnership Technology Process Benefits with Biowater Technology AS • Energy savings • Biowater is a recognised innovative industry leader in (20-30% less tha
Slide 7: Marine: Strong orderbook
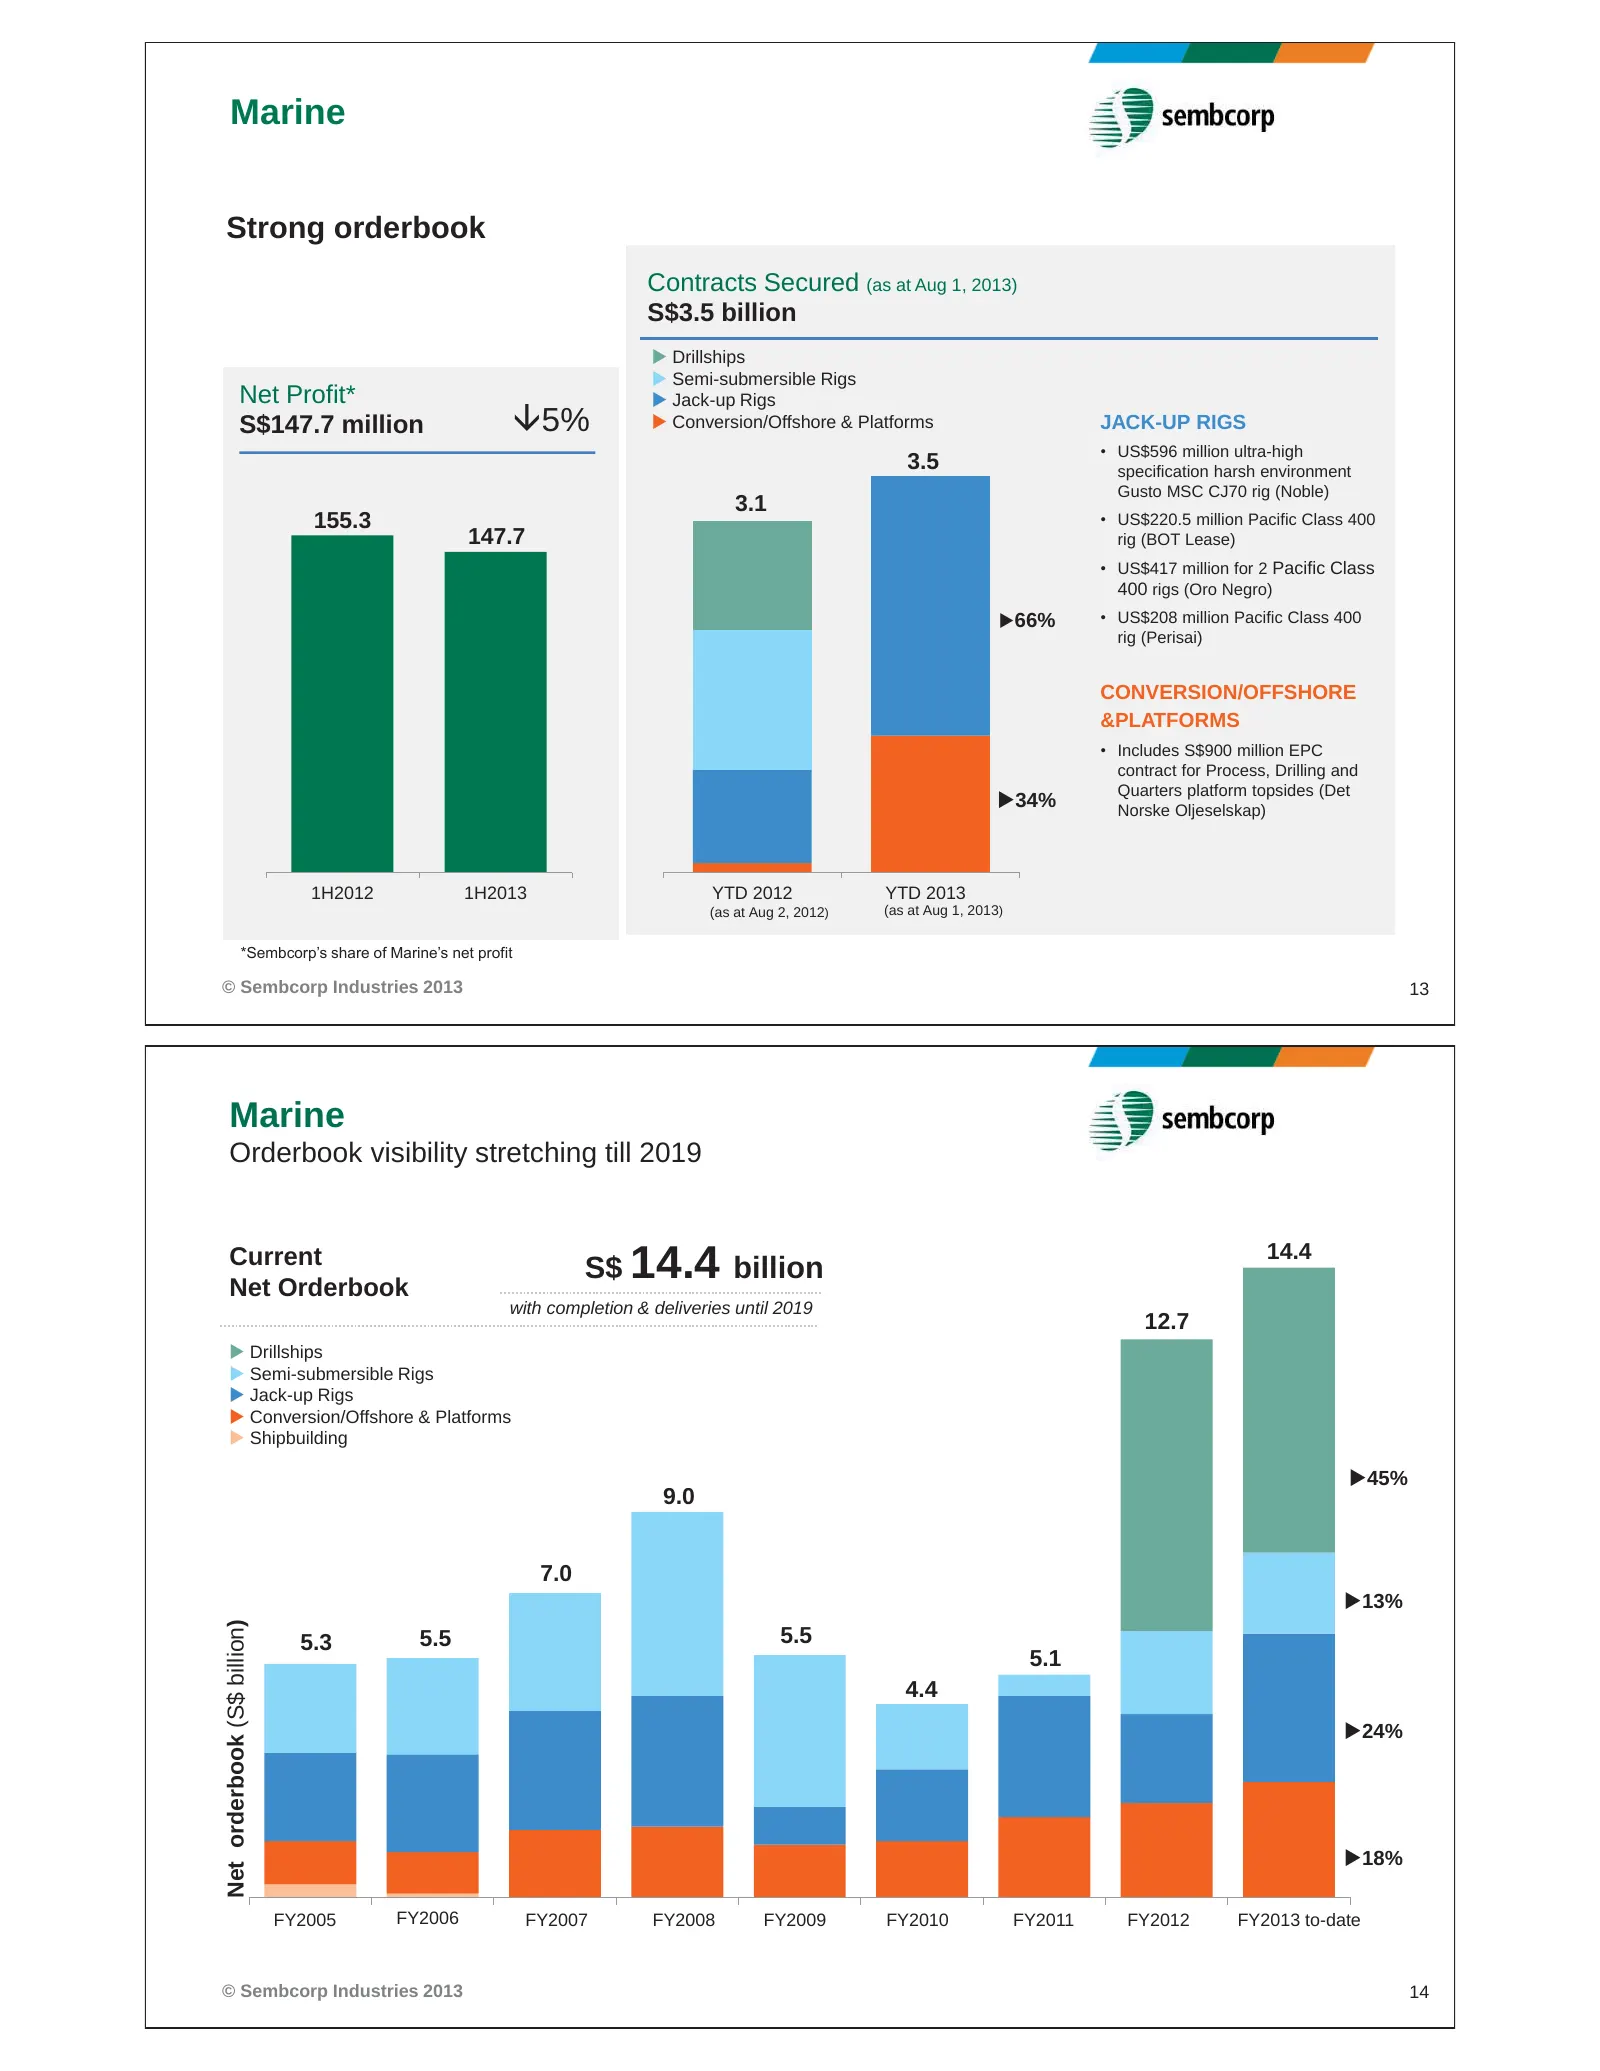
Marine Strong orderbook Contracts Secured (as at Aug 1, 2013) S$3.5 billion X Drillships X Semi-submersible Rigs Net Profit* X Jack-up Rigs S$147.7 million È5% X Conversion/Offshore & Platforms JACK-UP RIGS • US$596 million ultra-high 3.5 specification harsh environment Gusto MSC CJ70 rig (Noble) 3.
Slide 8: Marine: Strategically Positioned for Sustainable Growth
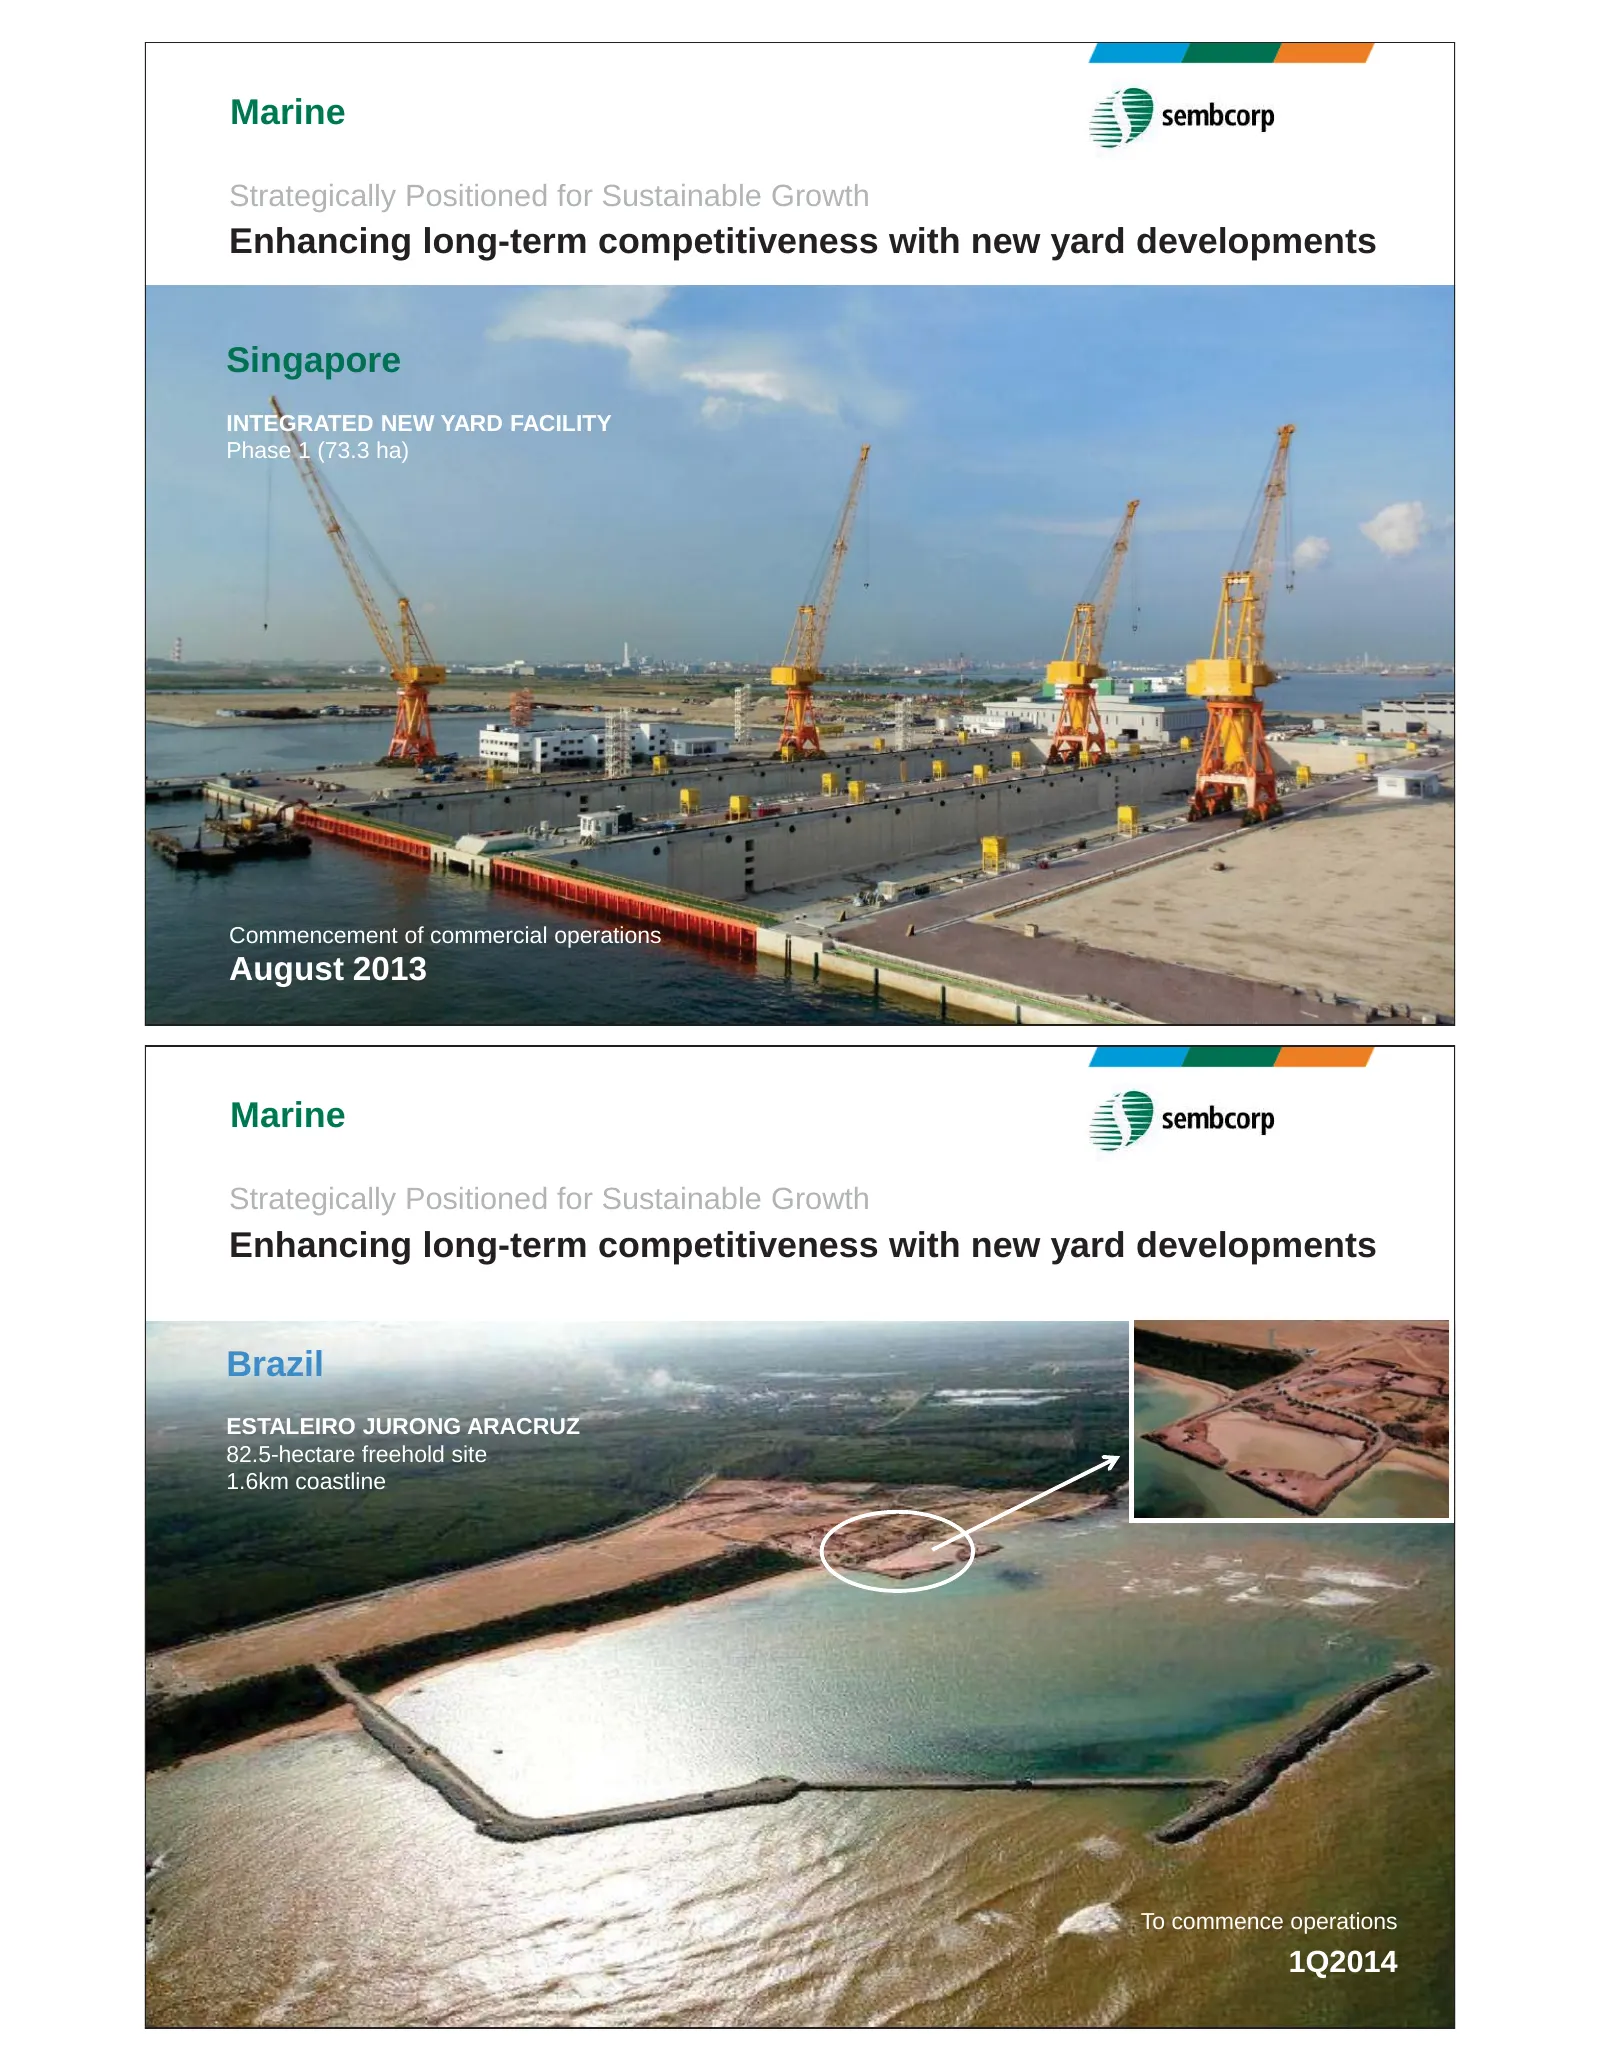
Marine Strategically Positioned for Sustainable Growth Enhancing long-term competitiveness with new yard developments Singapore INTEGRATED NEW YARD FACILITY Phase 1 (73.3 ha) Commencement of commercial operations August 2013 © Sembcorp Industries 2013 15 Marine Strategically Positioned for Sustainab
Slide 9: Urban Development
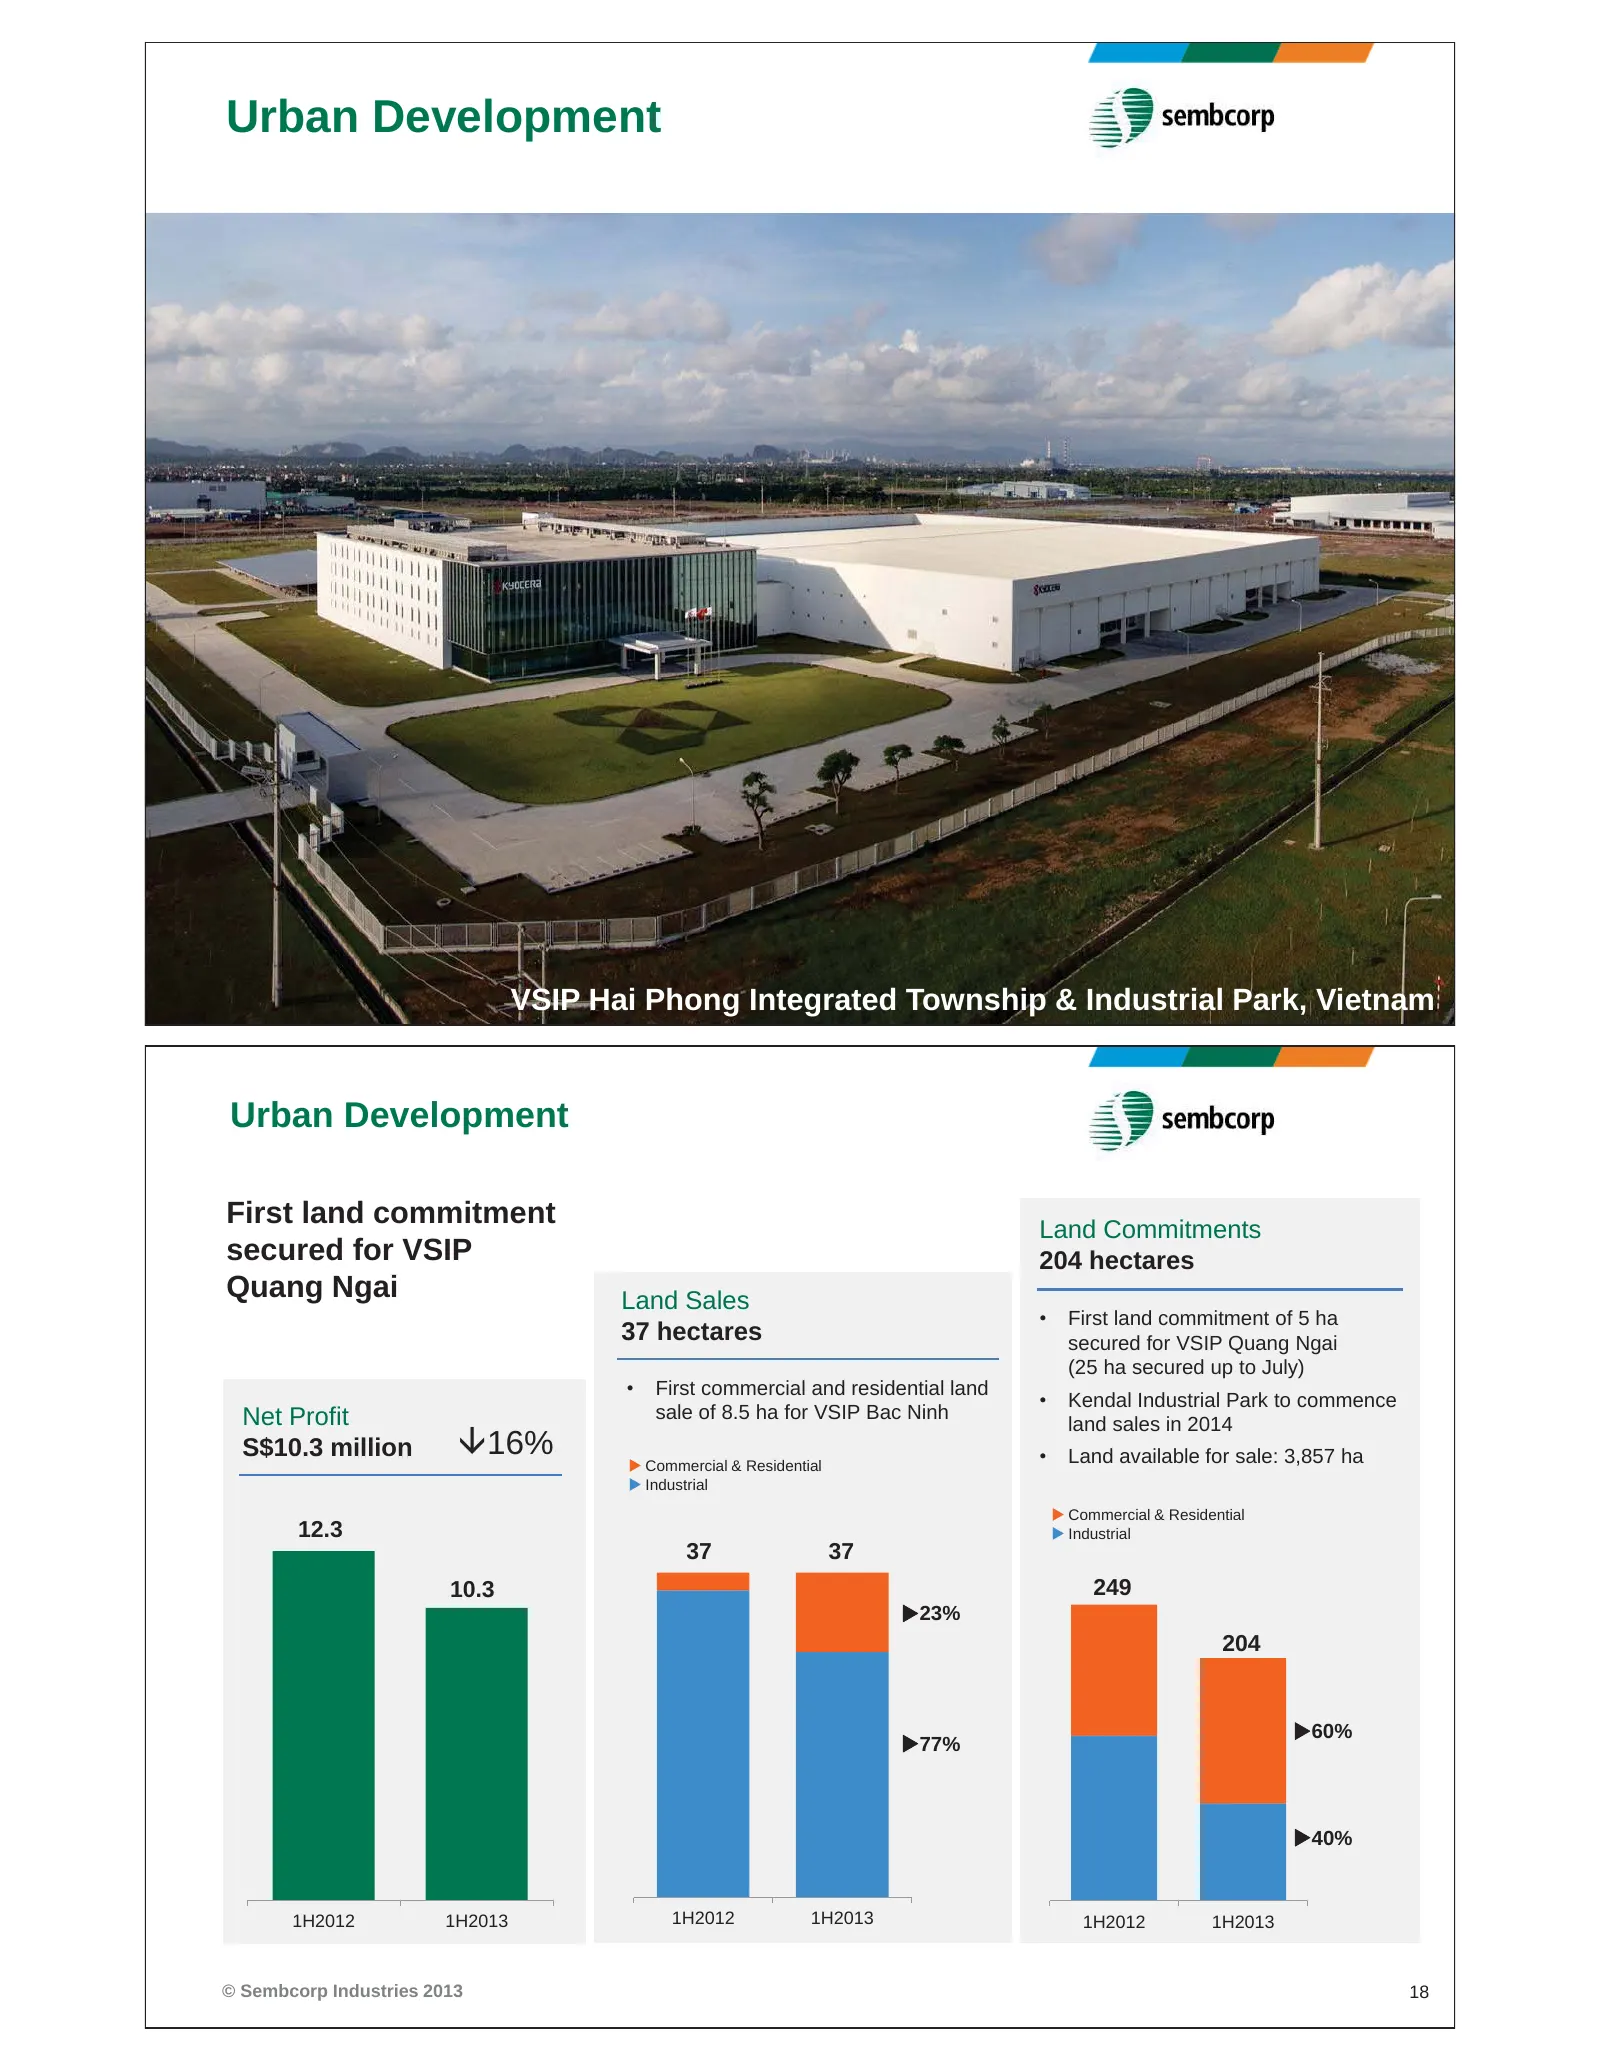
Urban Development © Sembcorp Industries 2013 17 VSIP Hai Phong Integrated Township & Industrial Park, Vietnam Urban Development First land commitment Land Commitments secured for VSIP 204 hectares Quang Ngai Land Sales • First land commitment of 5 ha 37 hectares secured for VSIP Quang Ngai (25 ha se
Slide 10: Urban Development: Positioned in key growth areas
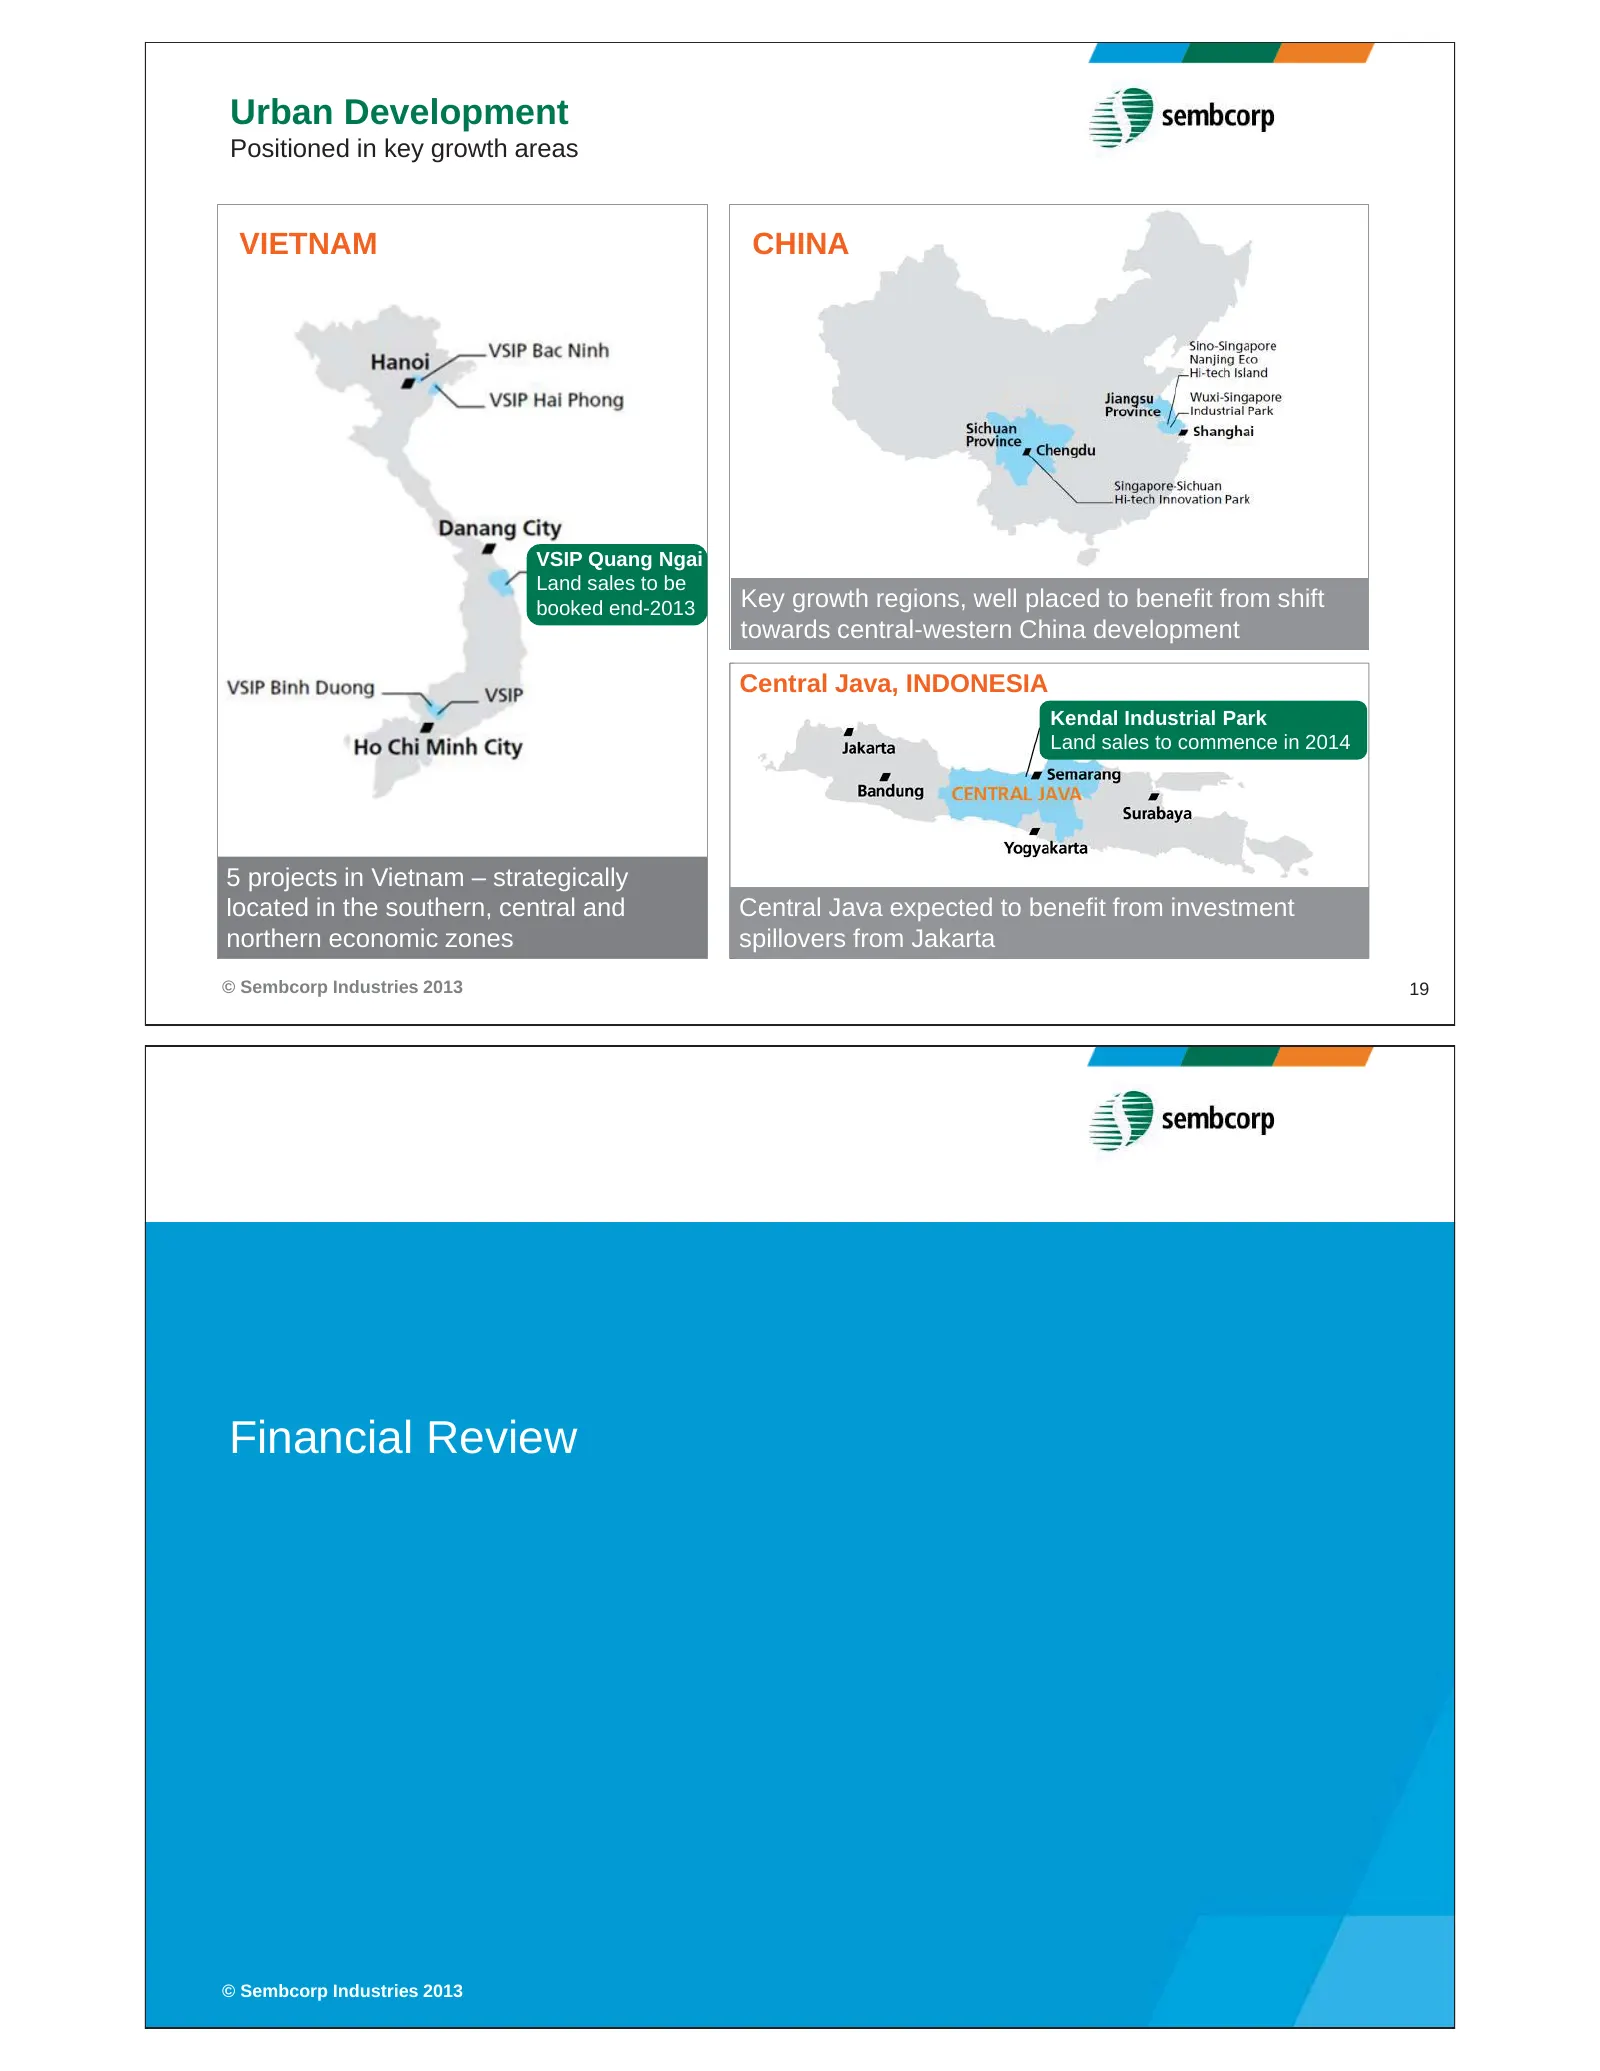
Urban Development Positioned in key growth areas VIETNAM CHINA VSIP Quang Ngai Land sales to be booked end-2013 Key growth regions, well placed to benefit from shift towards central-western China development Central Java, INDONESIA Kendal Industrial Park Land sales to commence in 2014 5 projects in
Slide 11: Group Profit & Loss; Group Turnover
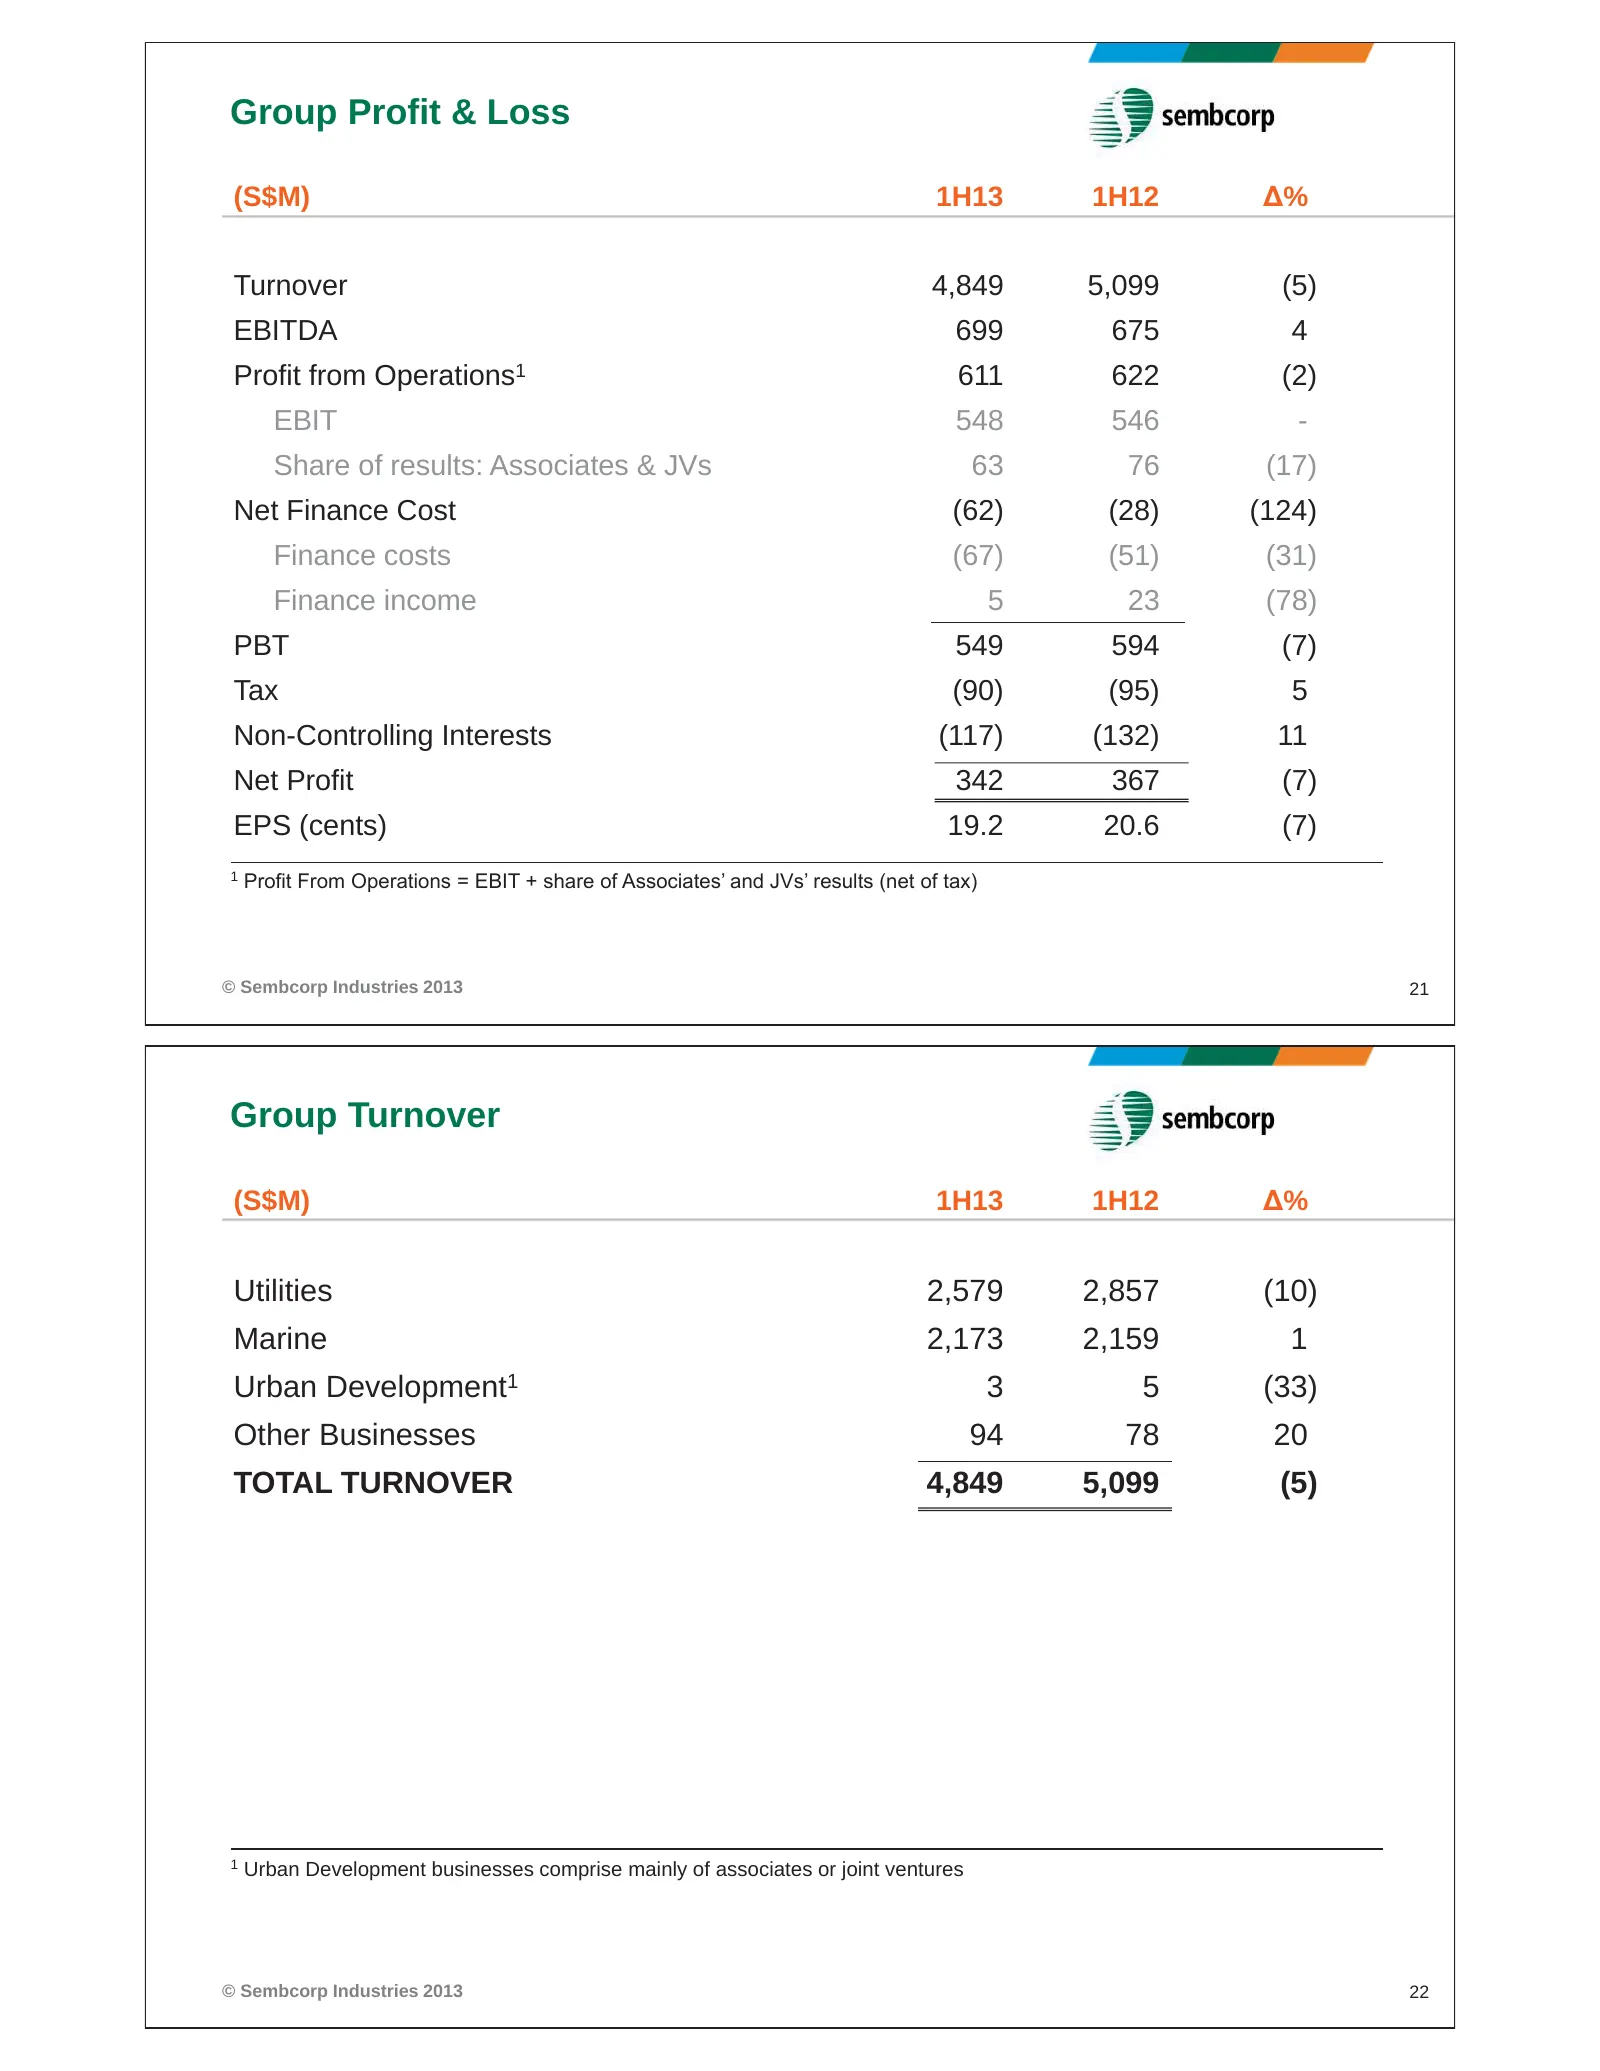
Group Profit & Loss (S$M) 1H13 1H12 Δ% Turnover 4,849 5,099 (5) EBITDA 699 675 4 Profit from Operations1 611 622 (2) EBIT 548 546 - Share of results: Associates & JVs 63 76 (17) Net Finance Cost (62) (28) (124) Finance costs (67) (51) (31) Finance income 5 23 (78) PBT 549 594 (7) Tax (90) (95) 5 Non
Slide 12: Group Profit from Operations and Net Profit
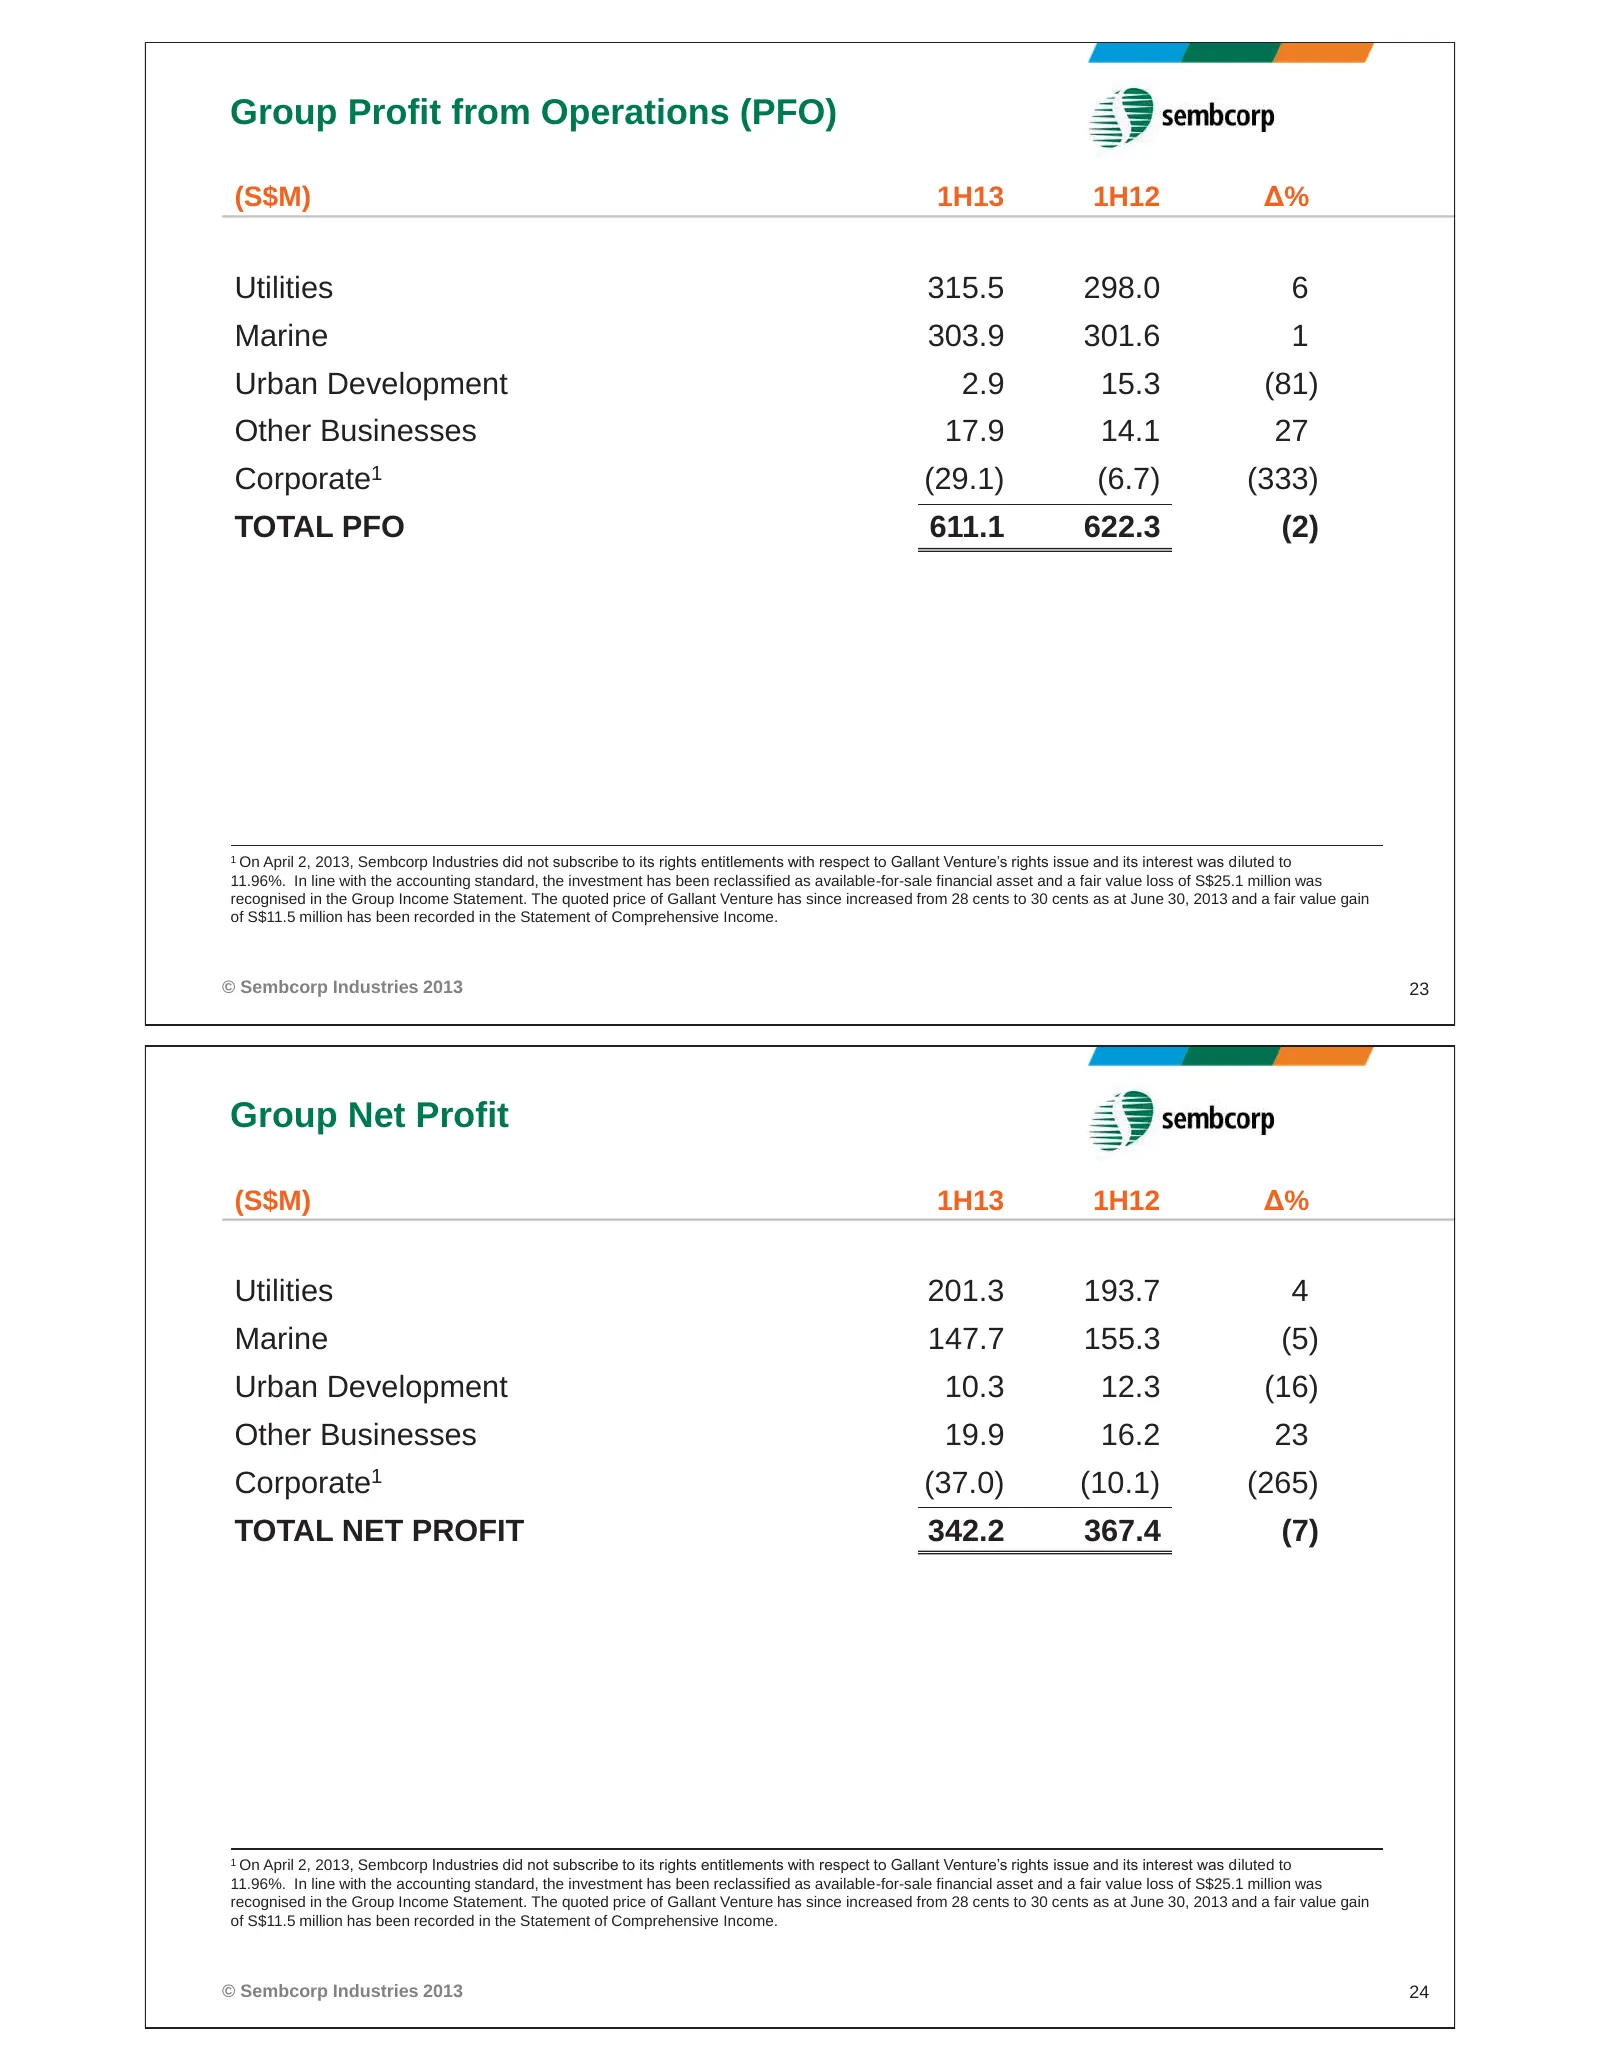
Group Profit from Operations (PFO) (S$M) 1H13 1H12 Δ% Utilities 315.5 298.0 6 Marine 303.9 301.6 1 Urban Development 2.9 15.3 (81) Other Businesses 17.9 14.1 27 Corporate1 (29.1) (6.7) (333) TOTAL PFO 611.1 622.3 (2) 1 On April 2, 2013, Sembcorp Industries did not subscribe to its rights entitlement
Slide 13: Utilities Net Profit
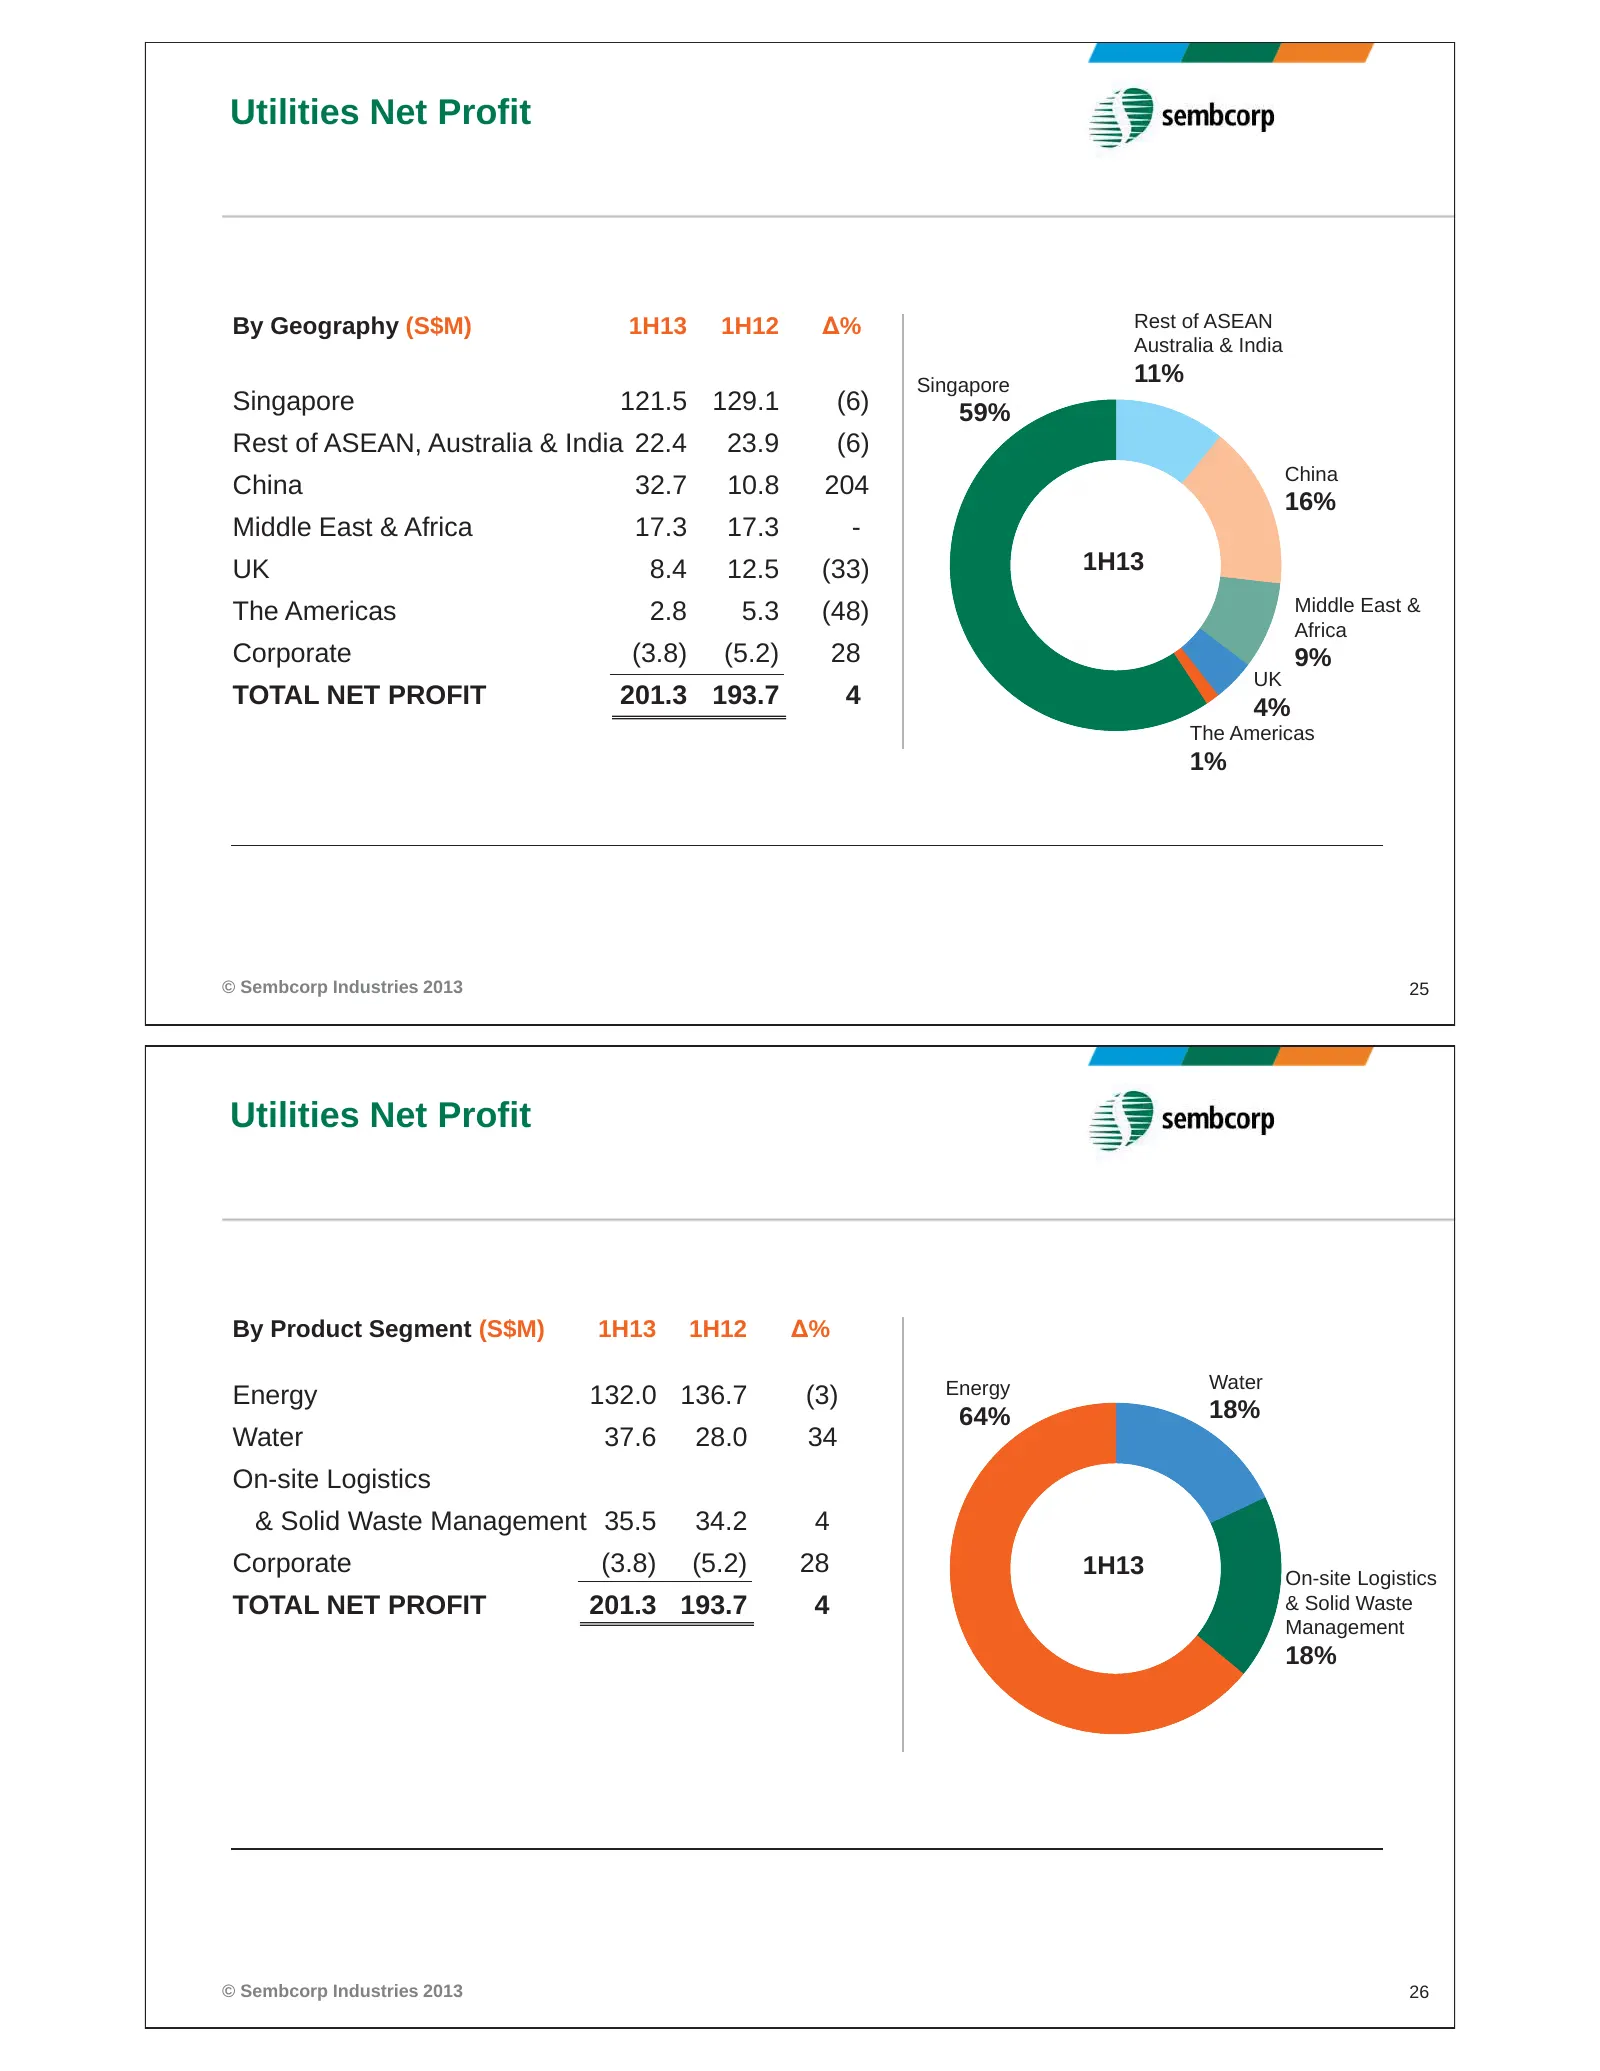
Utilities Net Profit By Geography (S$M) 1H13 1H12 Δ% Rest of ASEAN Australia & India Singapore 11% Singapore 121.5 129.1 (6) 59% Rest of ASEAN, Australia & India 22.4 23.9 (6) China China 32.7 10.8 204 16% Middle East & Africa 17.3 17.3 - UK 8.4 12.5 (33) 1H13 The Americas 2.8 5.3 (48) Middle East &
Slide 14: Group Capex, Equity Investment and Free Cash Flow
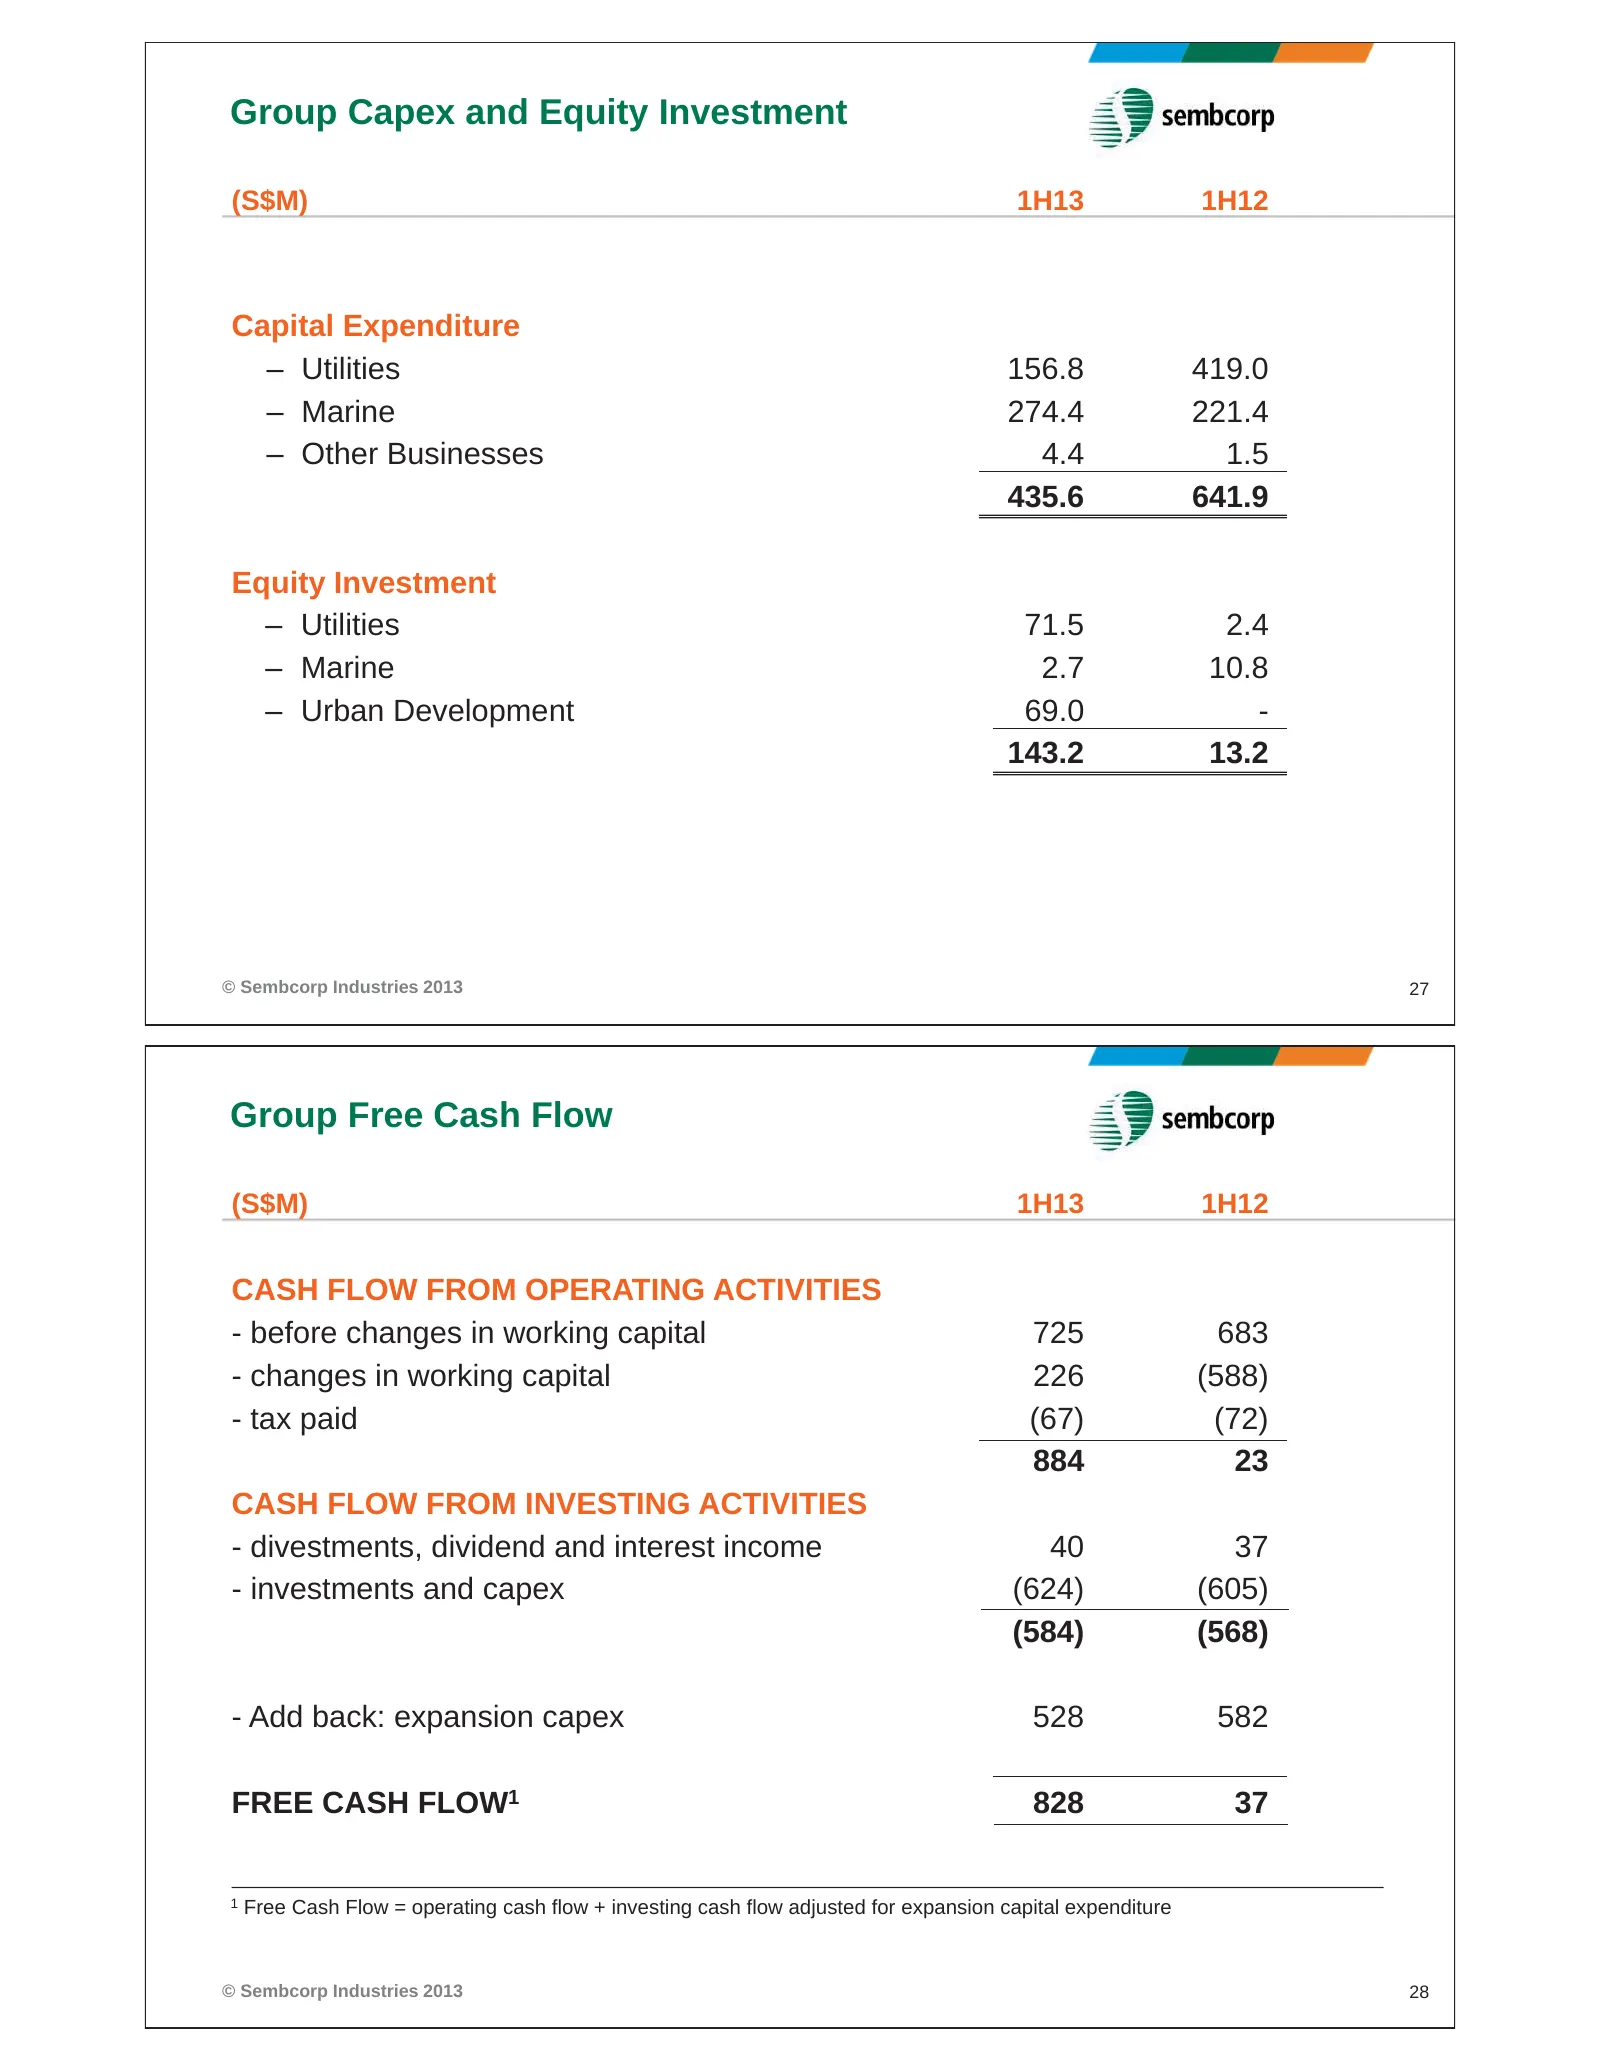
Group Capex and Equity Investment (S$M) 1H13 1H12 Capital Expenditure – Utilities 156.8 419.0 – Marine 274.4 221.4 – Other Businesses 4.4 1.5 435.6 641.9 Equity Investment – Utilities 71.5 2.4 – Marine 2.7 10.8 – Urban Development 69.0 - 143.2 13.2 © Sembcorp Industries 2013 27 Group Free Cash Flow
Slide 15: Group Borrowings
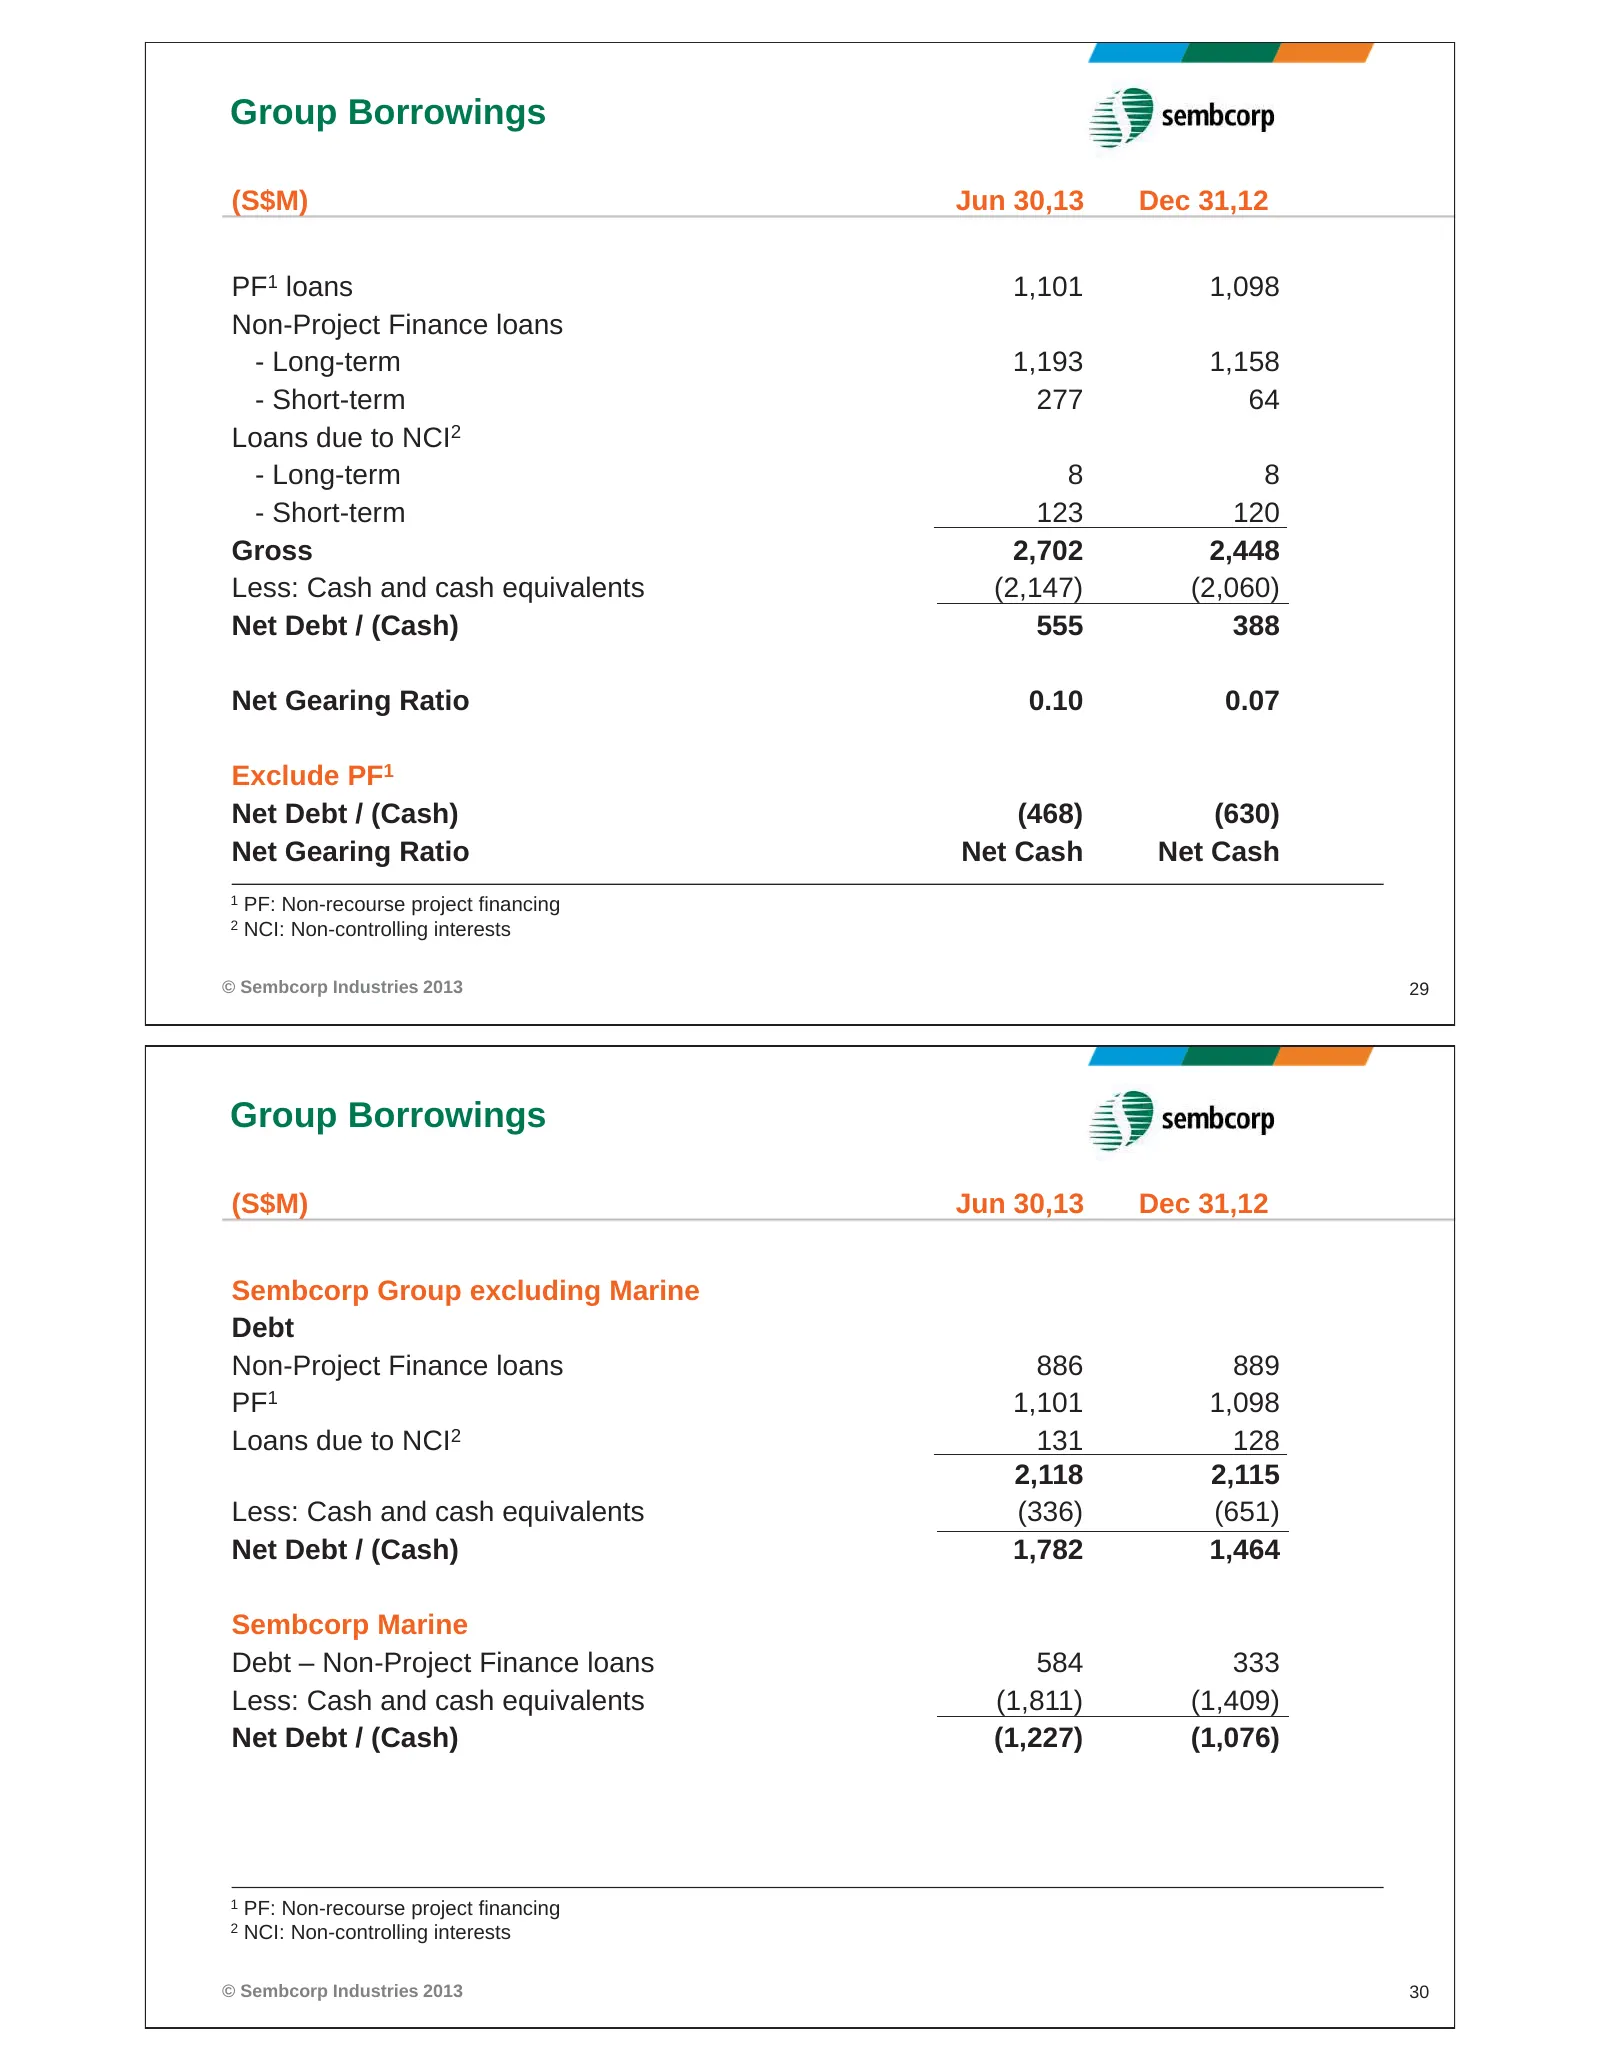
Group Borrowings (S$M) Jun 30,13 Dec 31,12 PF1 loans 1,101 1,098 Non-Project Finance loans - Long-term 1,193 1,158 - Short-term 277 64 Loans due to NCI2 - Long-term 8 8 - Short-term 123 120 Gross 2,702 2,448 Less: Cash and cash equivalents (2,147) (2,060) Net Debt / (Cash) 555 388 Net Gearing Ratio
Slide 16: Financial Indicators and Group Outlook
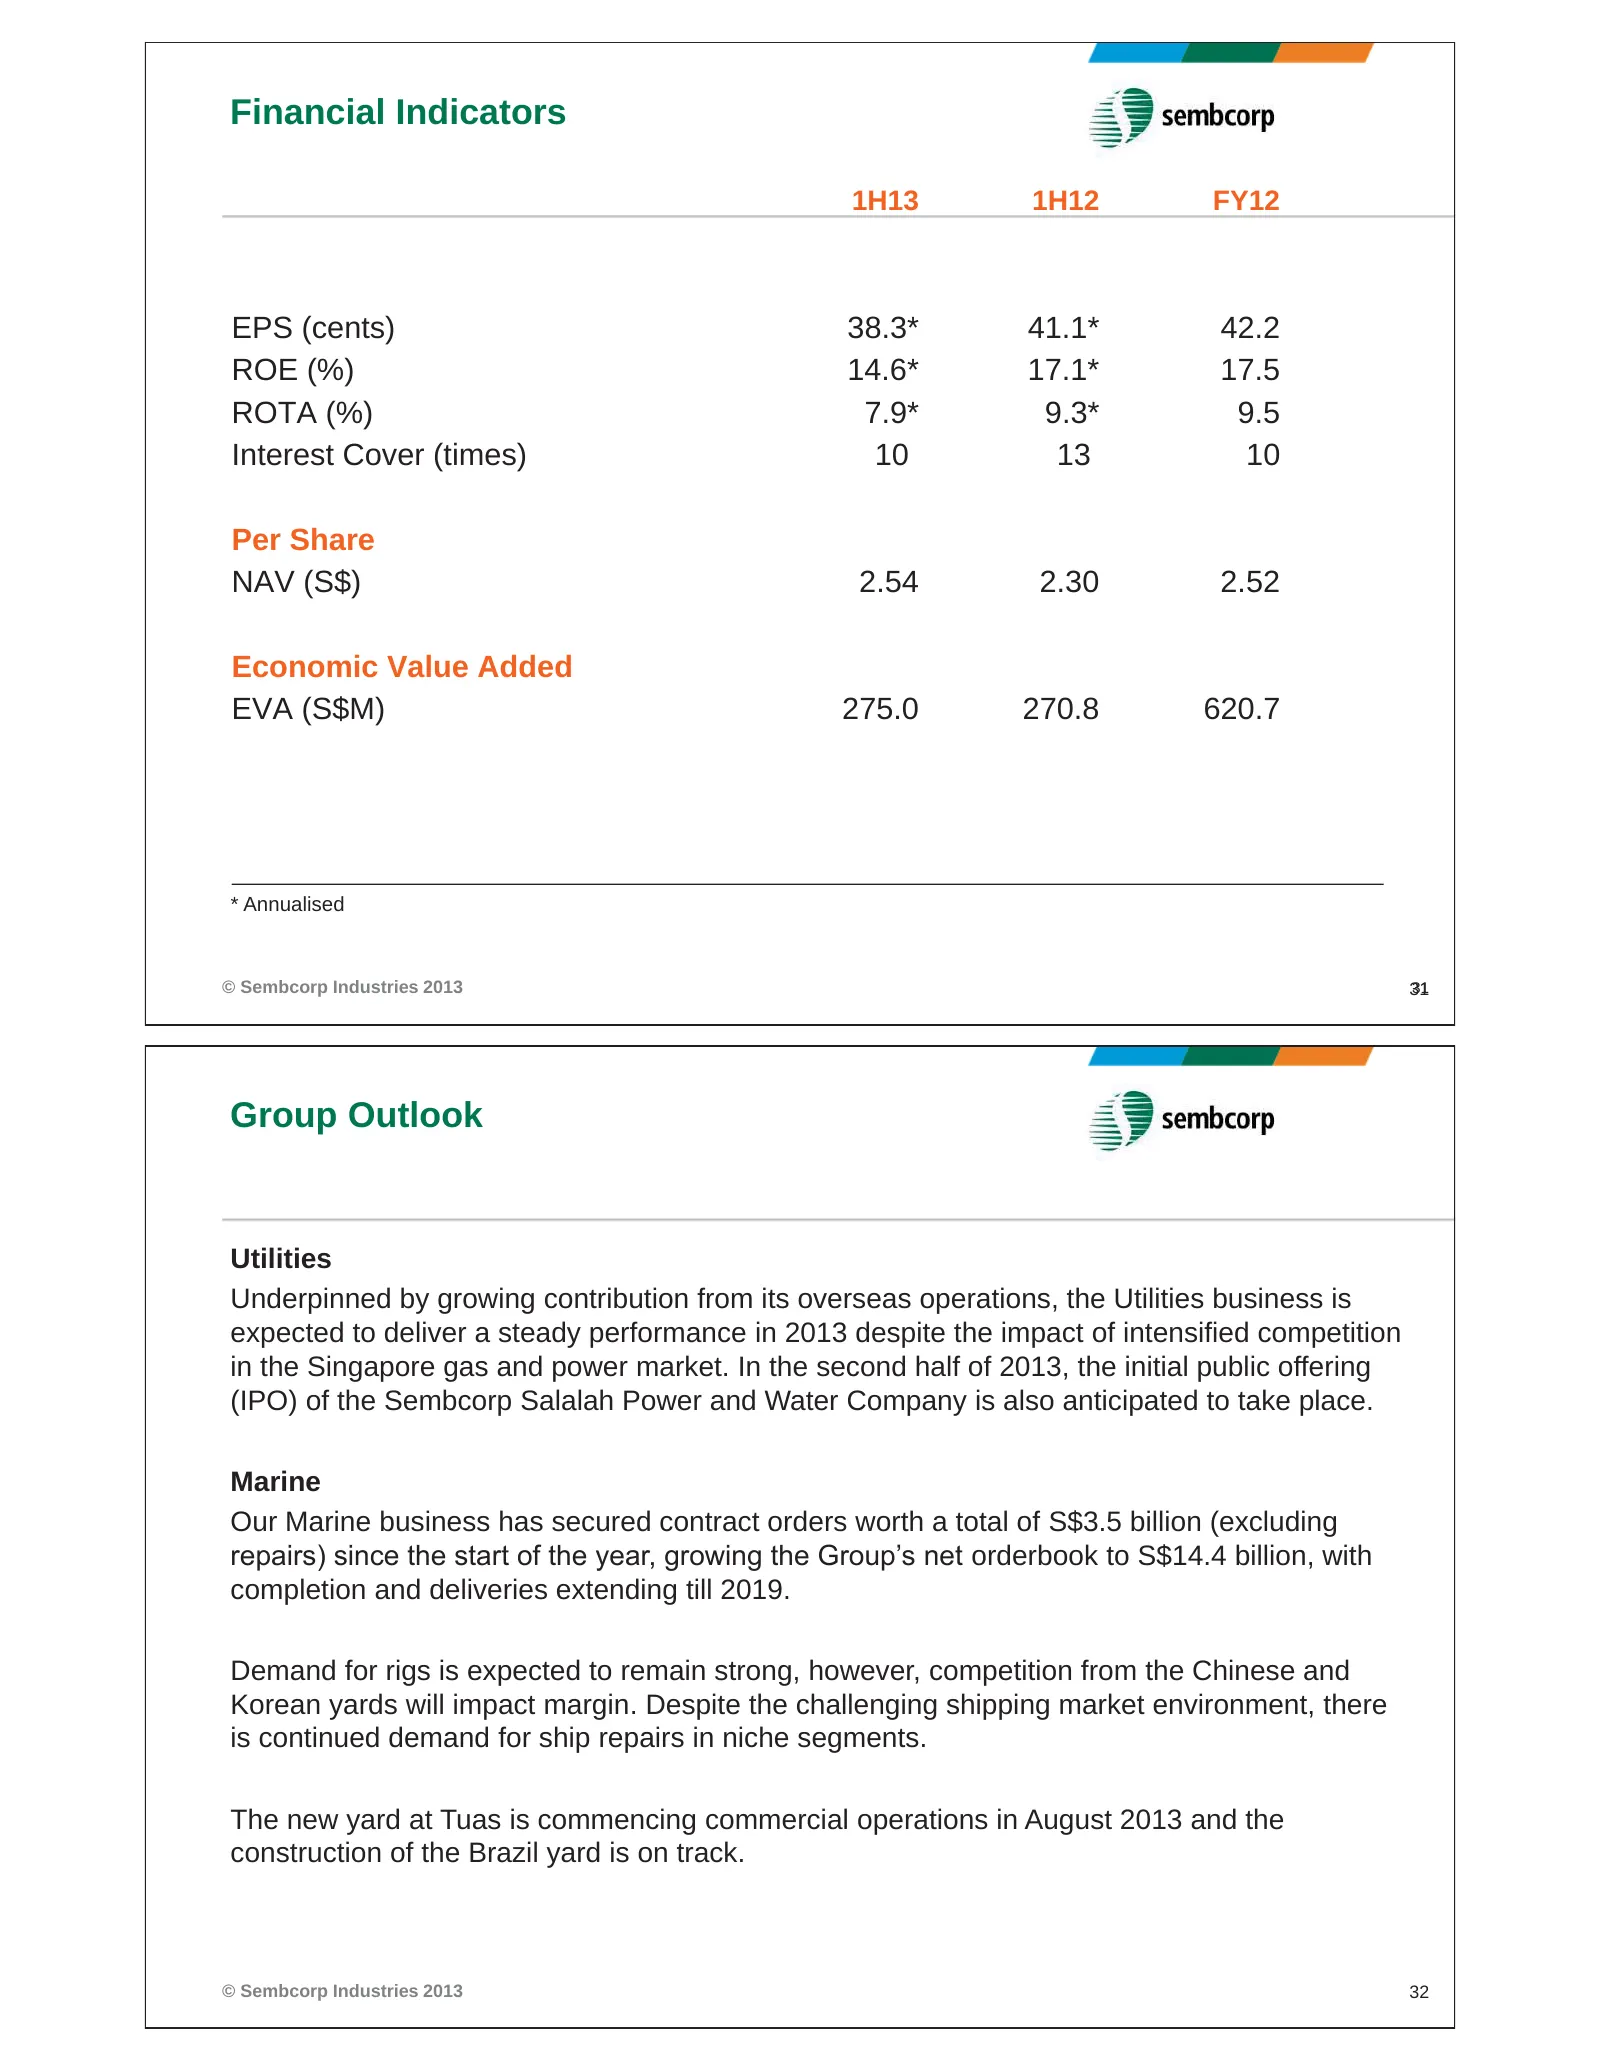
Financial Indicators 1H13 1H12 FY12 EPS (cents) 38.3* 41.1* 42.2 ROE (%) 14.6* 17.1* 17.5 ROTA (%) 7.9* 9.3* 9.5 Interest Cover (times) 10 13 10 Per Share NAV (S$) 2.54 2.30 2.52 Economic Value Added EVA (S$M) 275.0 270.8 620.7 * Annualised © Sembcorp Industries 2013 31 31 Group Outlook Utilities Un
Slide 17: Group Outlook: Urban Development and Group
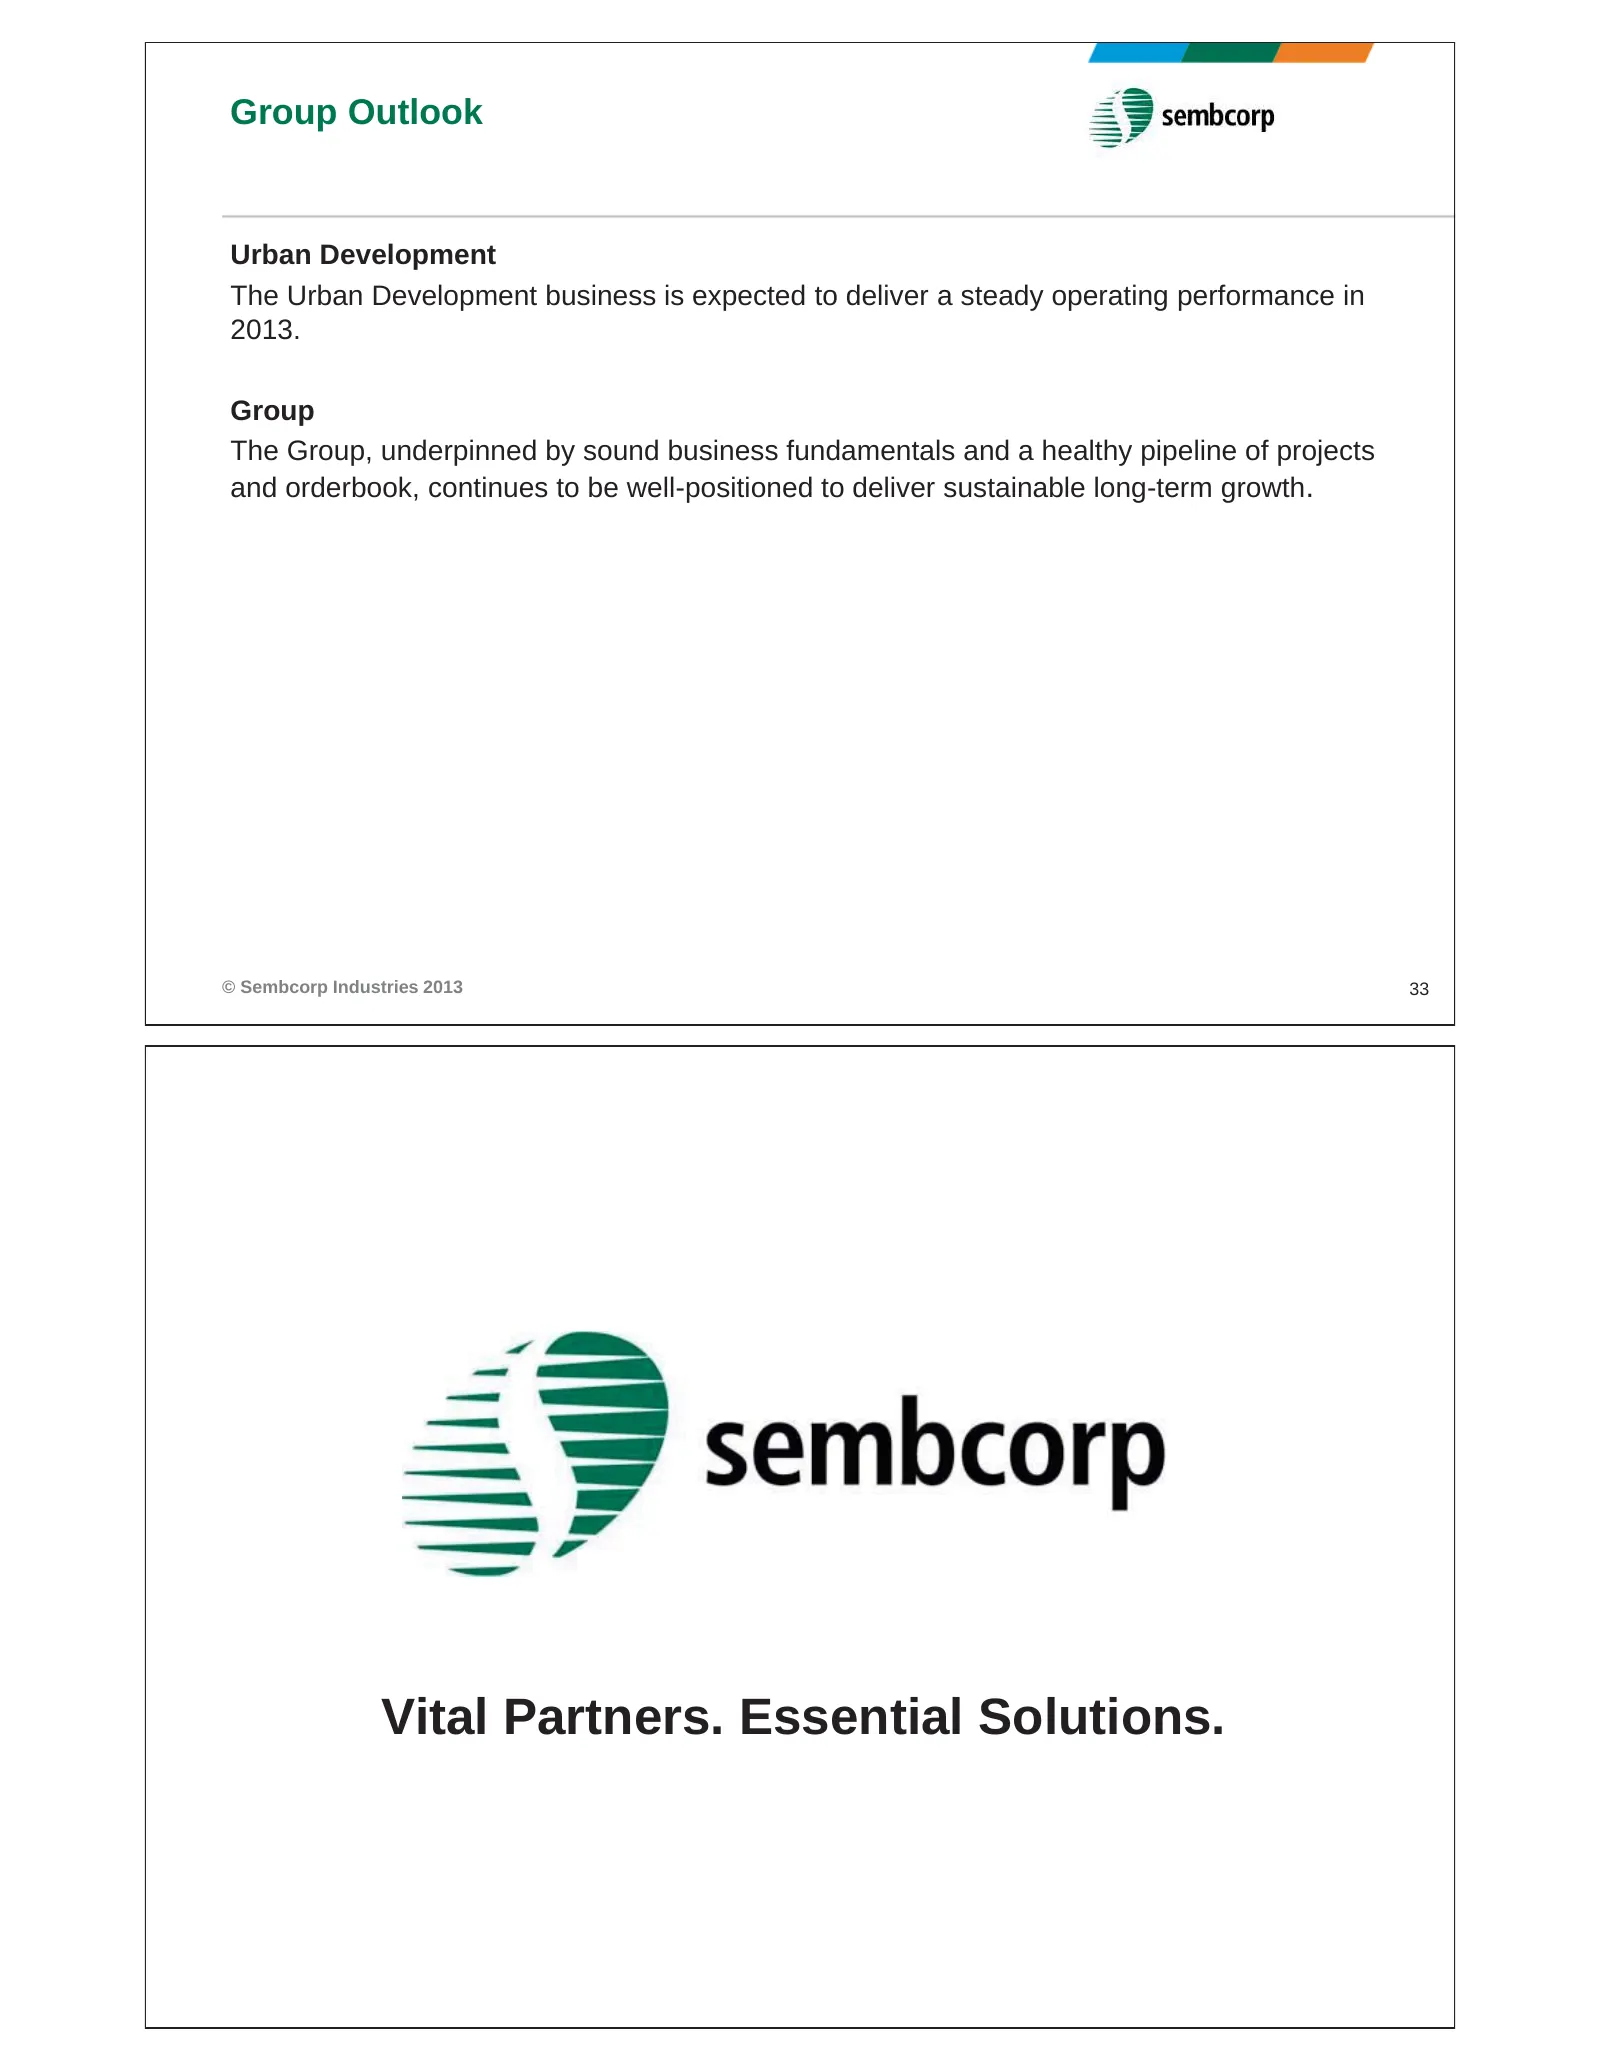
Group Outlook Urban Development The Urban Development business is expected to deliver a steady operating performance in 2013. Group The Group, underpinned by sound business fundamentals and a healthy pipeline of projects and orderbook, continues to be well-positioned to deliver sustainable long-term
Slide 18: Appendix: Disclaimer
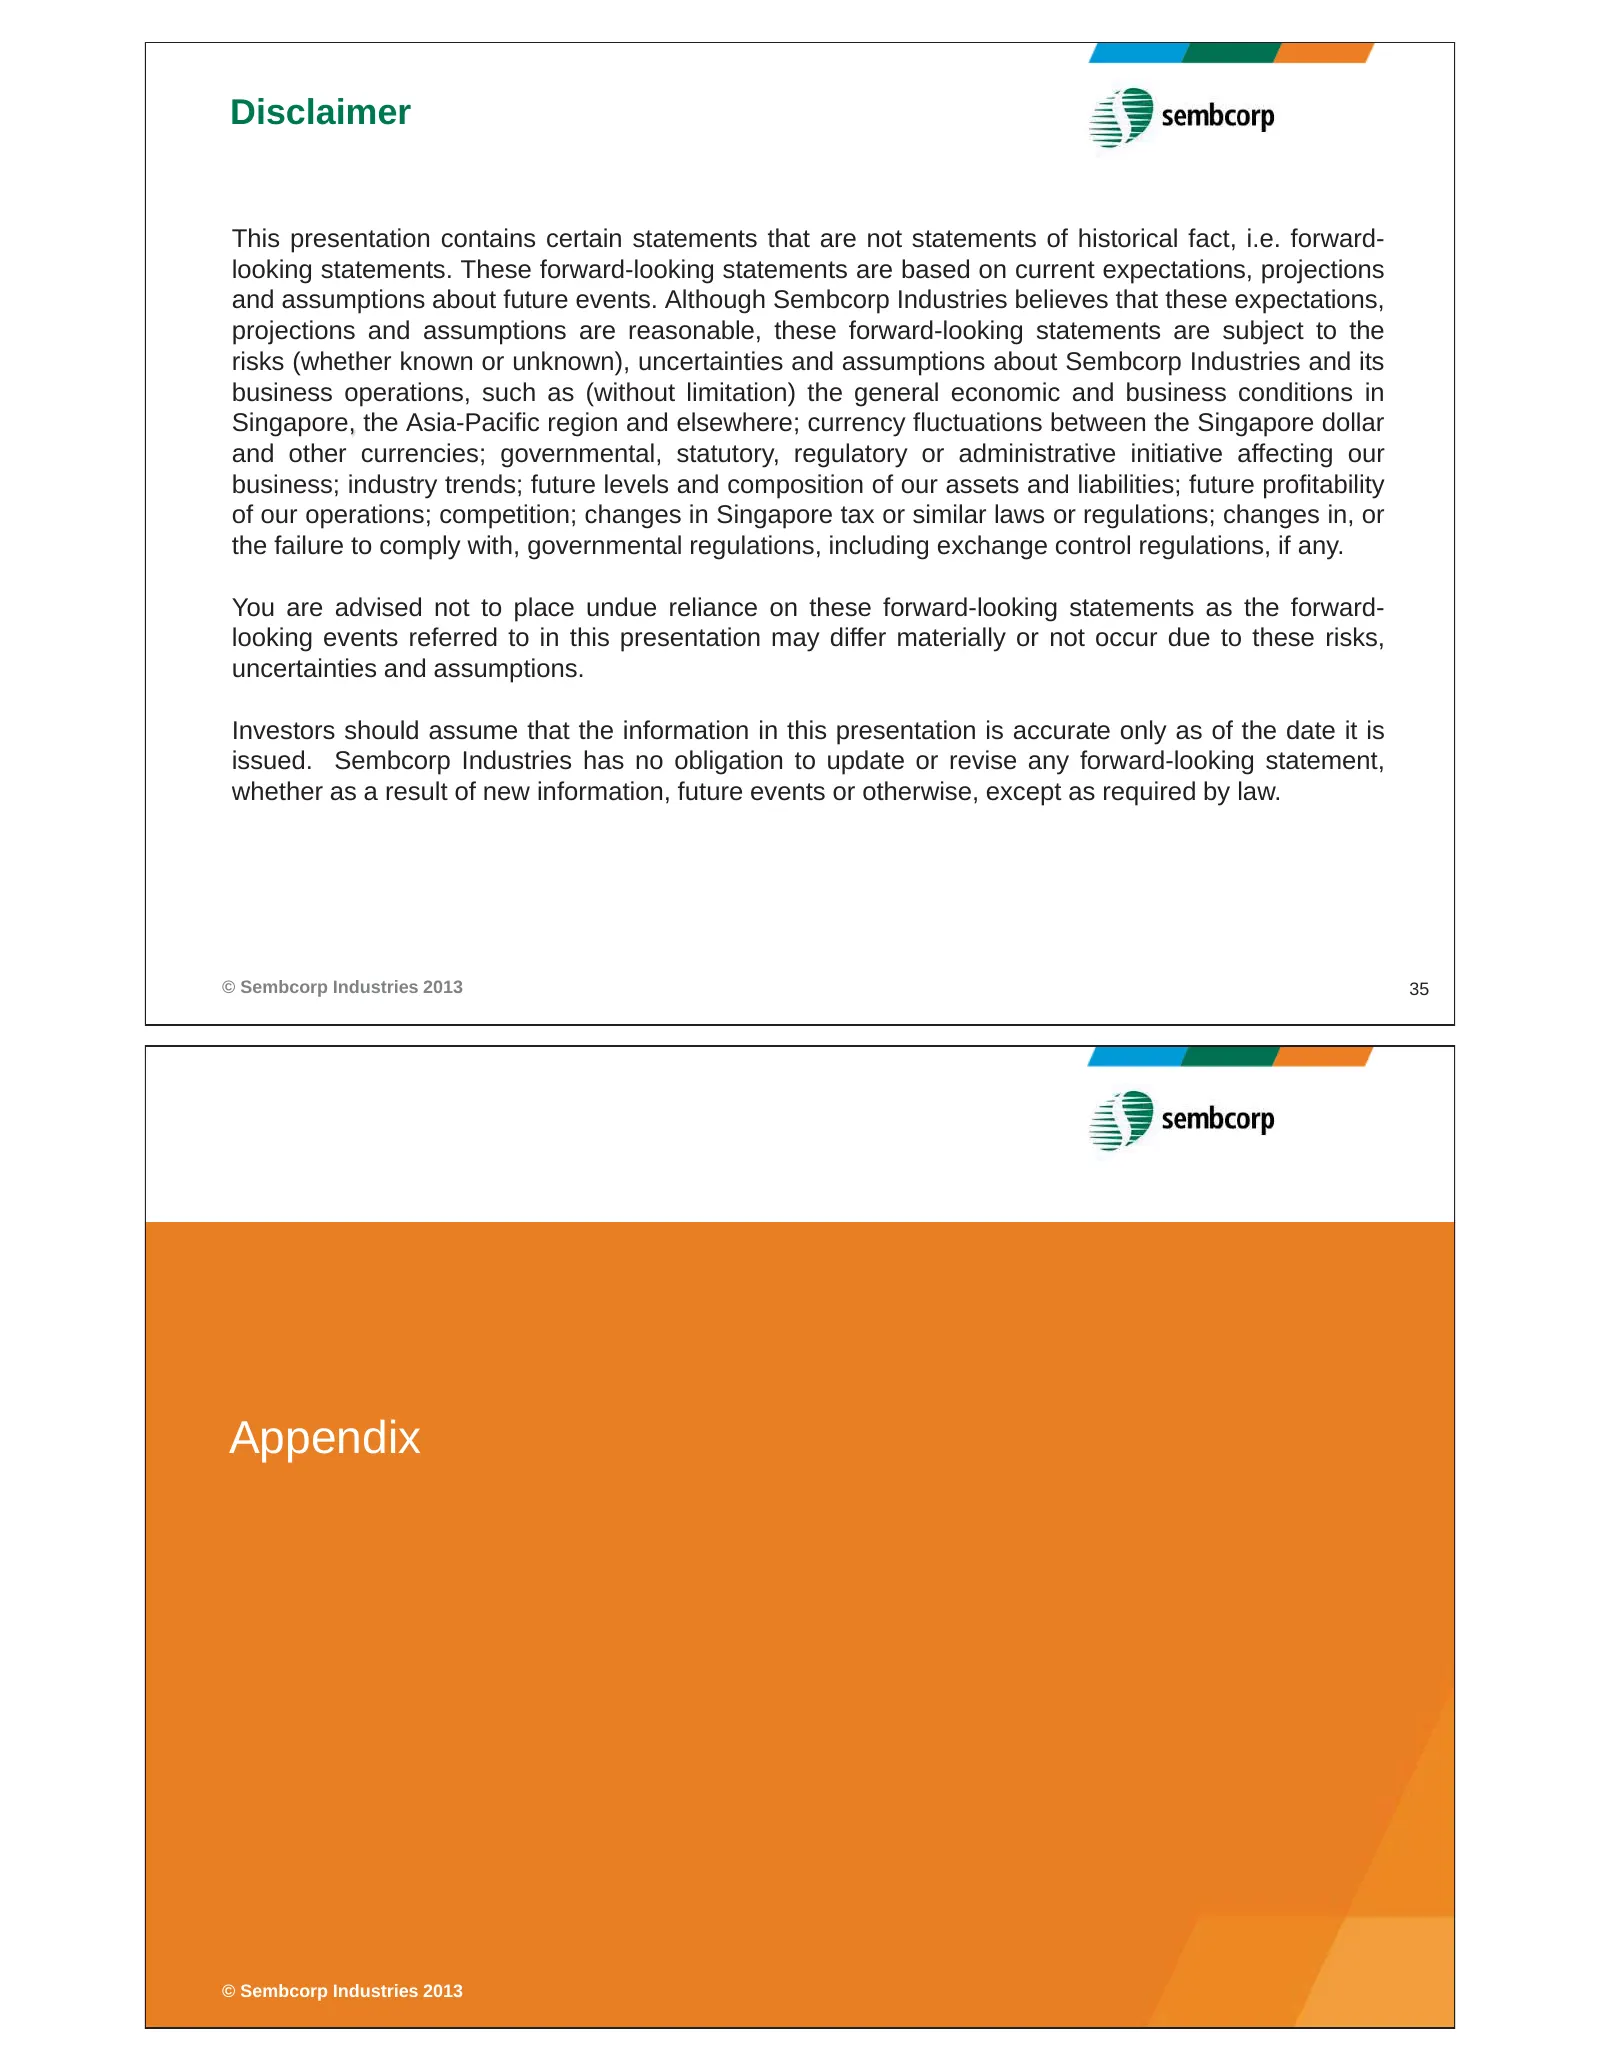
Disclaimer This presentation contains certain statements that are not statements of historical fact, i.e. forward- looking statements. These forward-looking statements are based on current expectations, projections and assumptions about future events. Although Sembcorp Industries believes that these
Slide 19: Group Profit & Loss (2Q13)
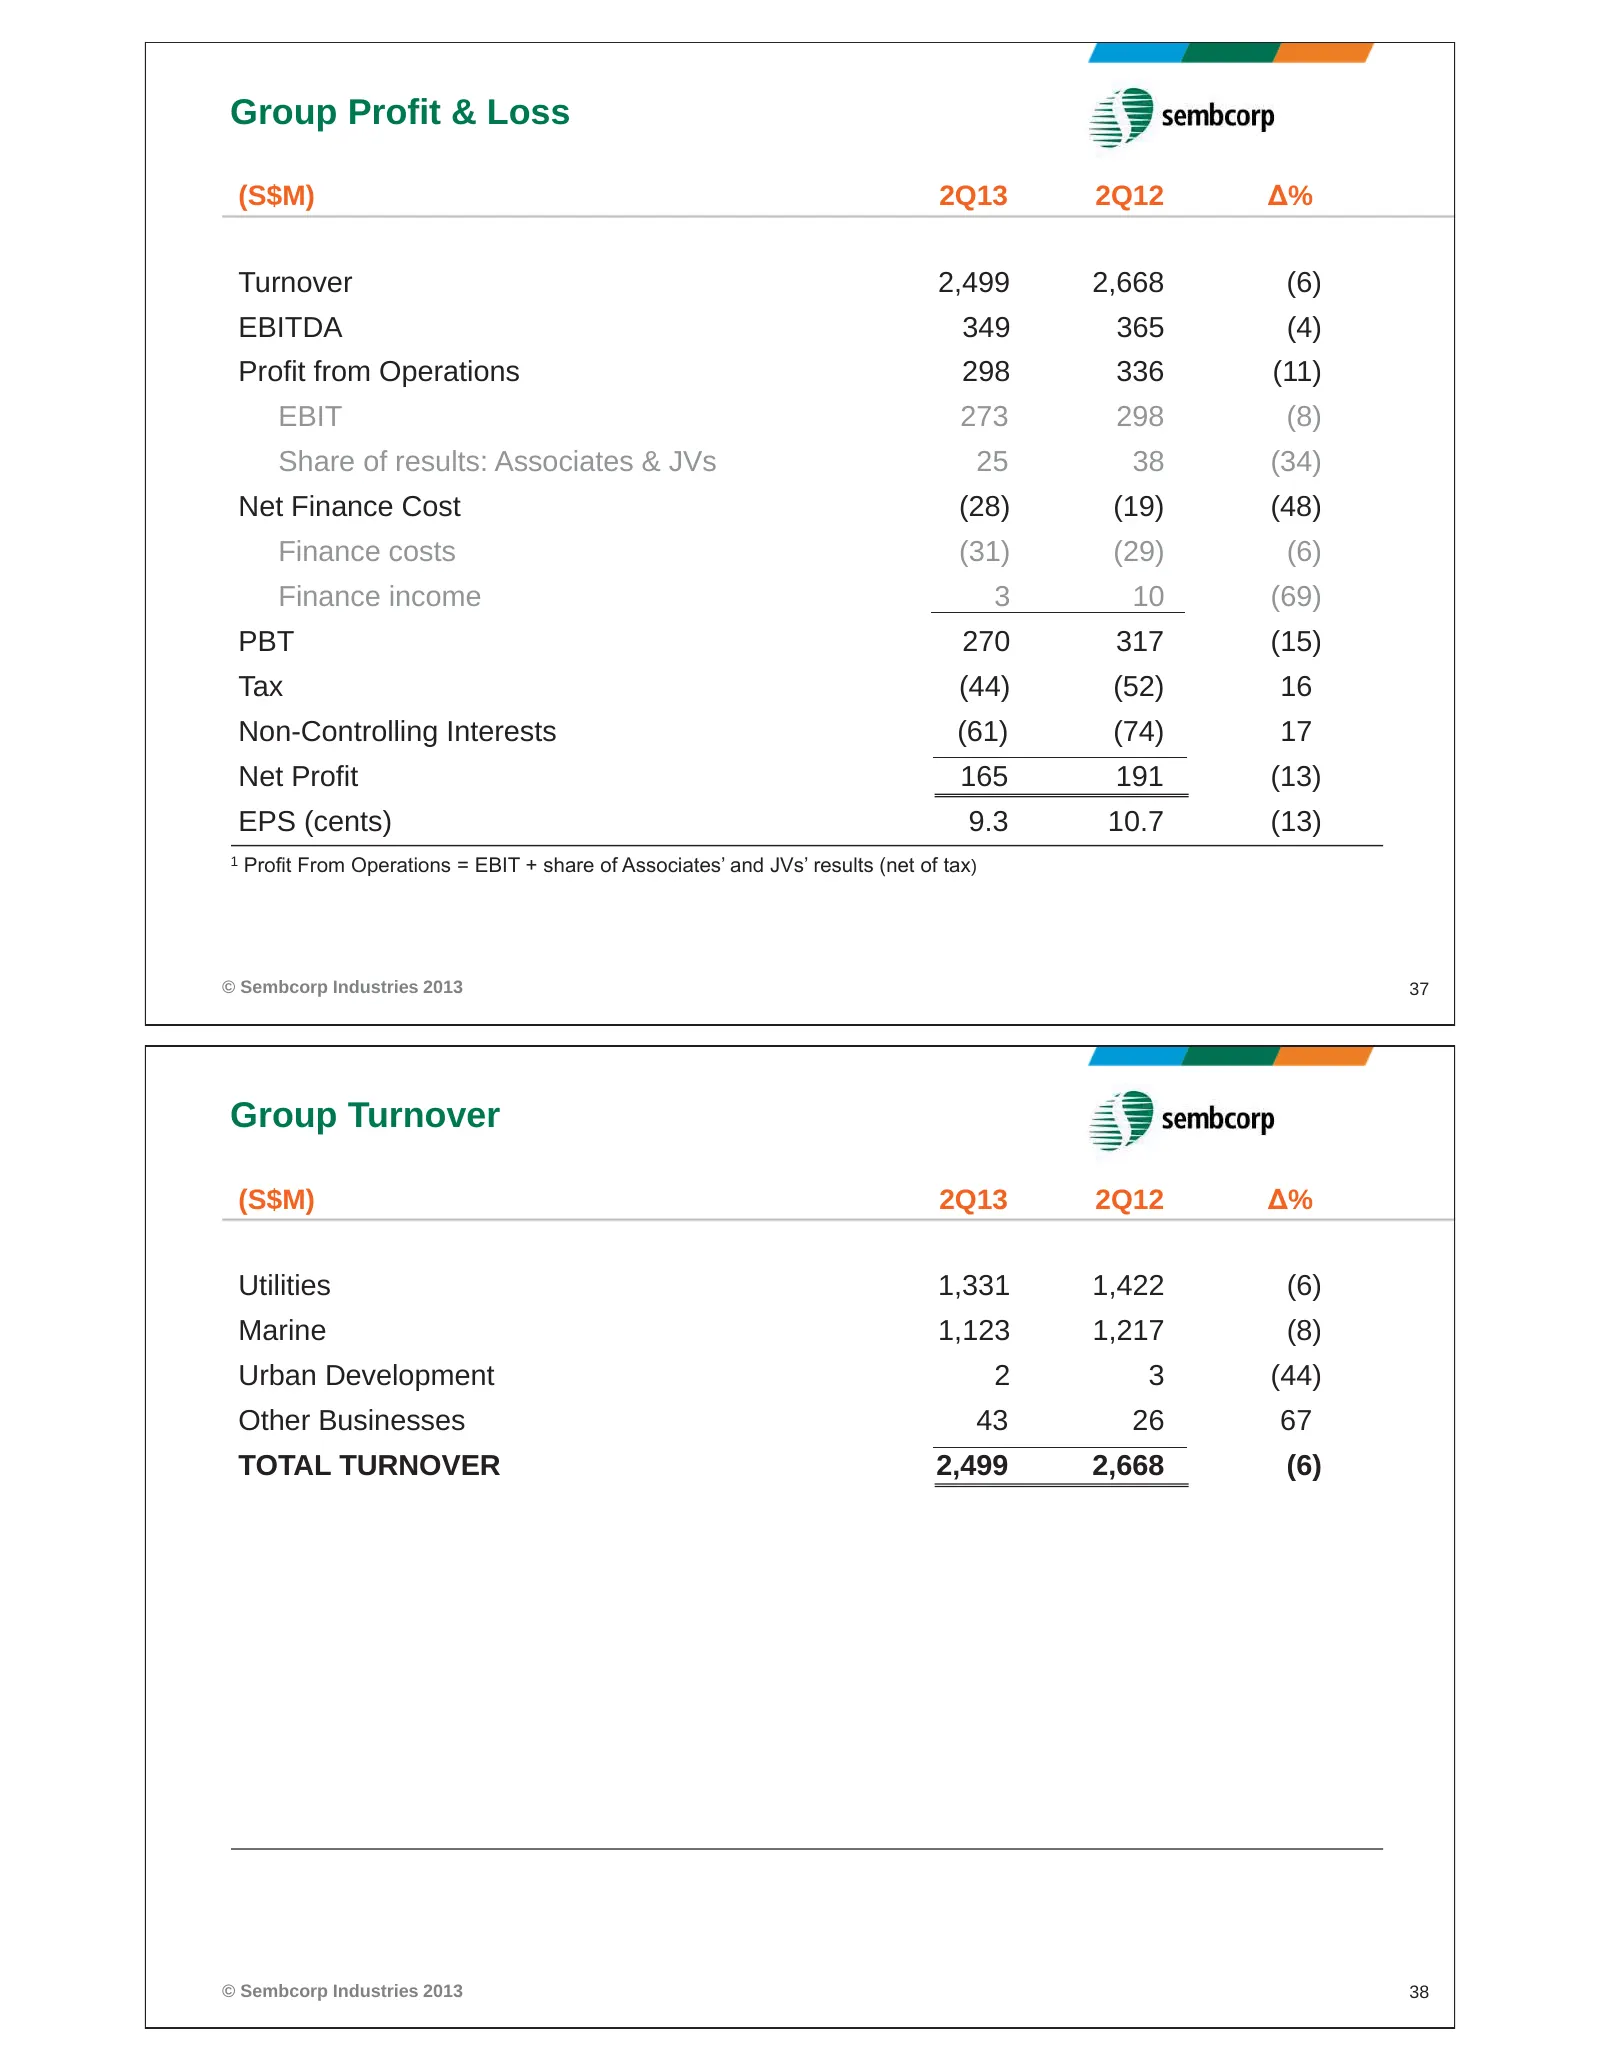
Group Profit & Loss (S$M) 2Q13 2Q12 Δ% Turnover 2,499 2,668 (6) EBITDA 349 365 (4) Profit from Operations 298 336 (11) EBIT 273 298 (8) Share of results: Associates & JVs 25 38 (34) Net Finance Cost (28) (19) (48) Finance costs (31) (29) (6) Finance income 3 10 (69) PBT 270 317 (15) Tax (44) (52) 16
Slide 20: Group Profit from Operations and Net Profit (2Q13)
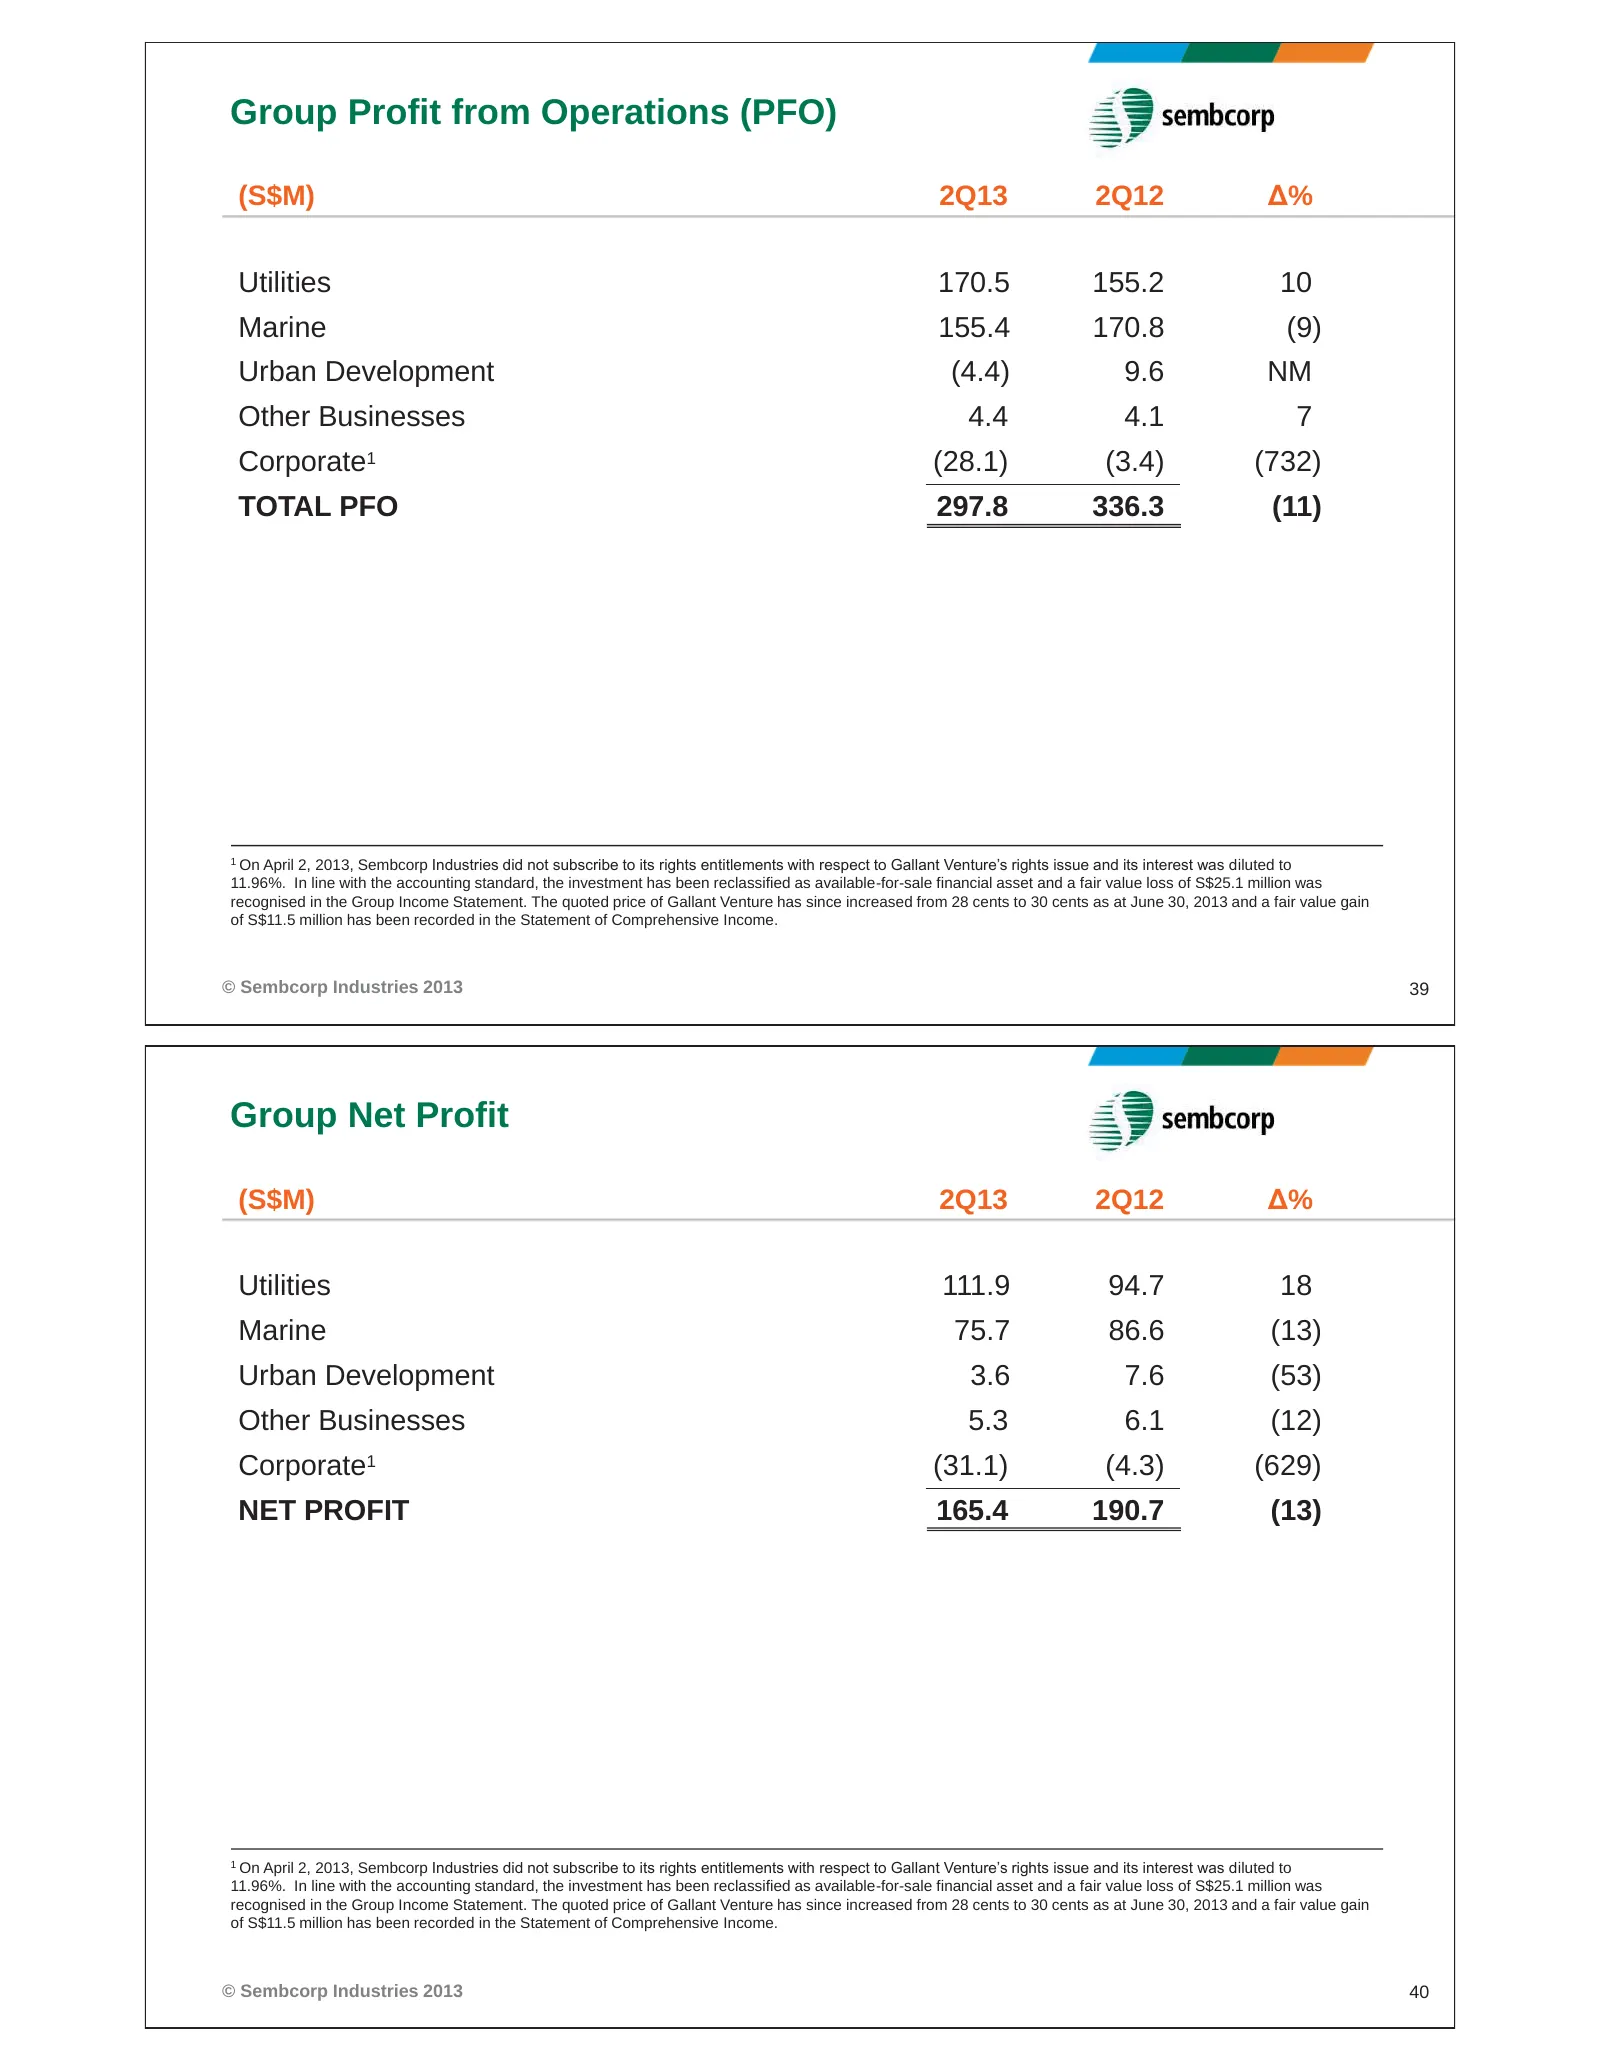
Group Profit from Operations (PFO) (S$M) 2Q13 2Q12 Δ% Utilities 170.5 155.2 10 Marine 155.4 170.8 (9) Urban Development (4.4) 9.6 NM Other Businesses 4.4 4.1 7 Corporate1 (28.1) (3.4) (732) TOTAL PFO 297.8 336.3 (11) 1 On April 2, 2013, Sembcorp Industries did not subscribe to its rights entitlement
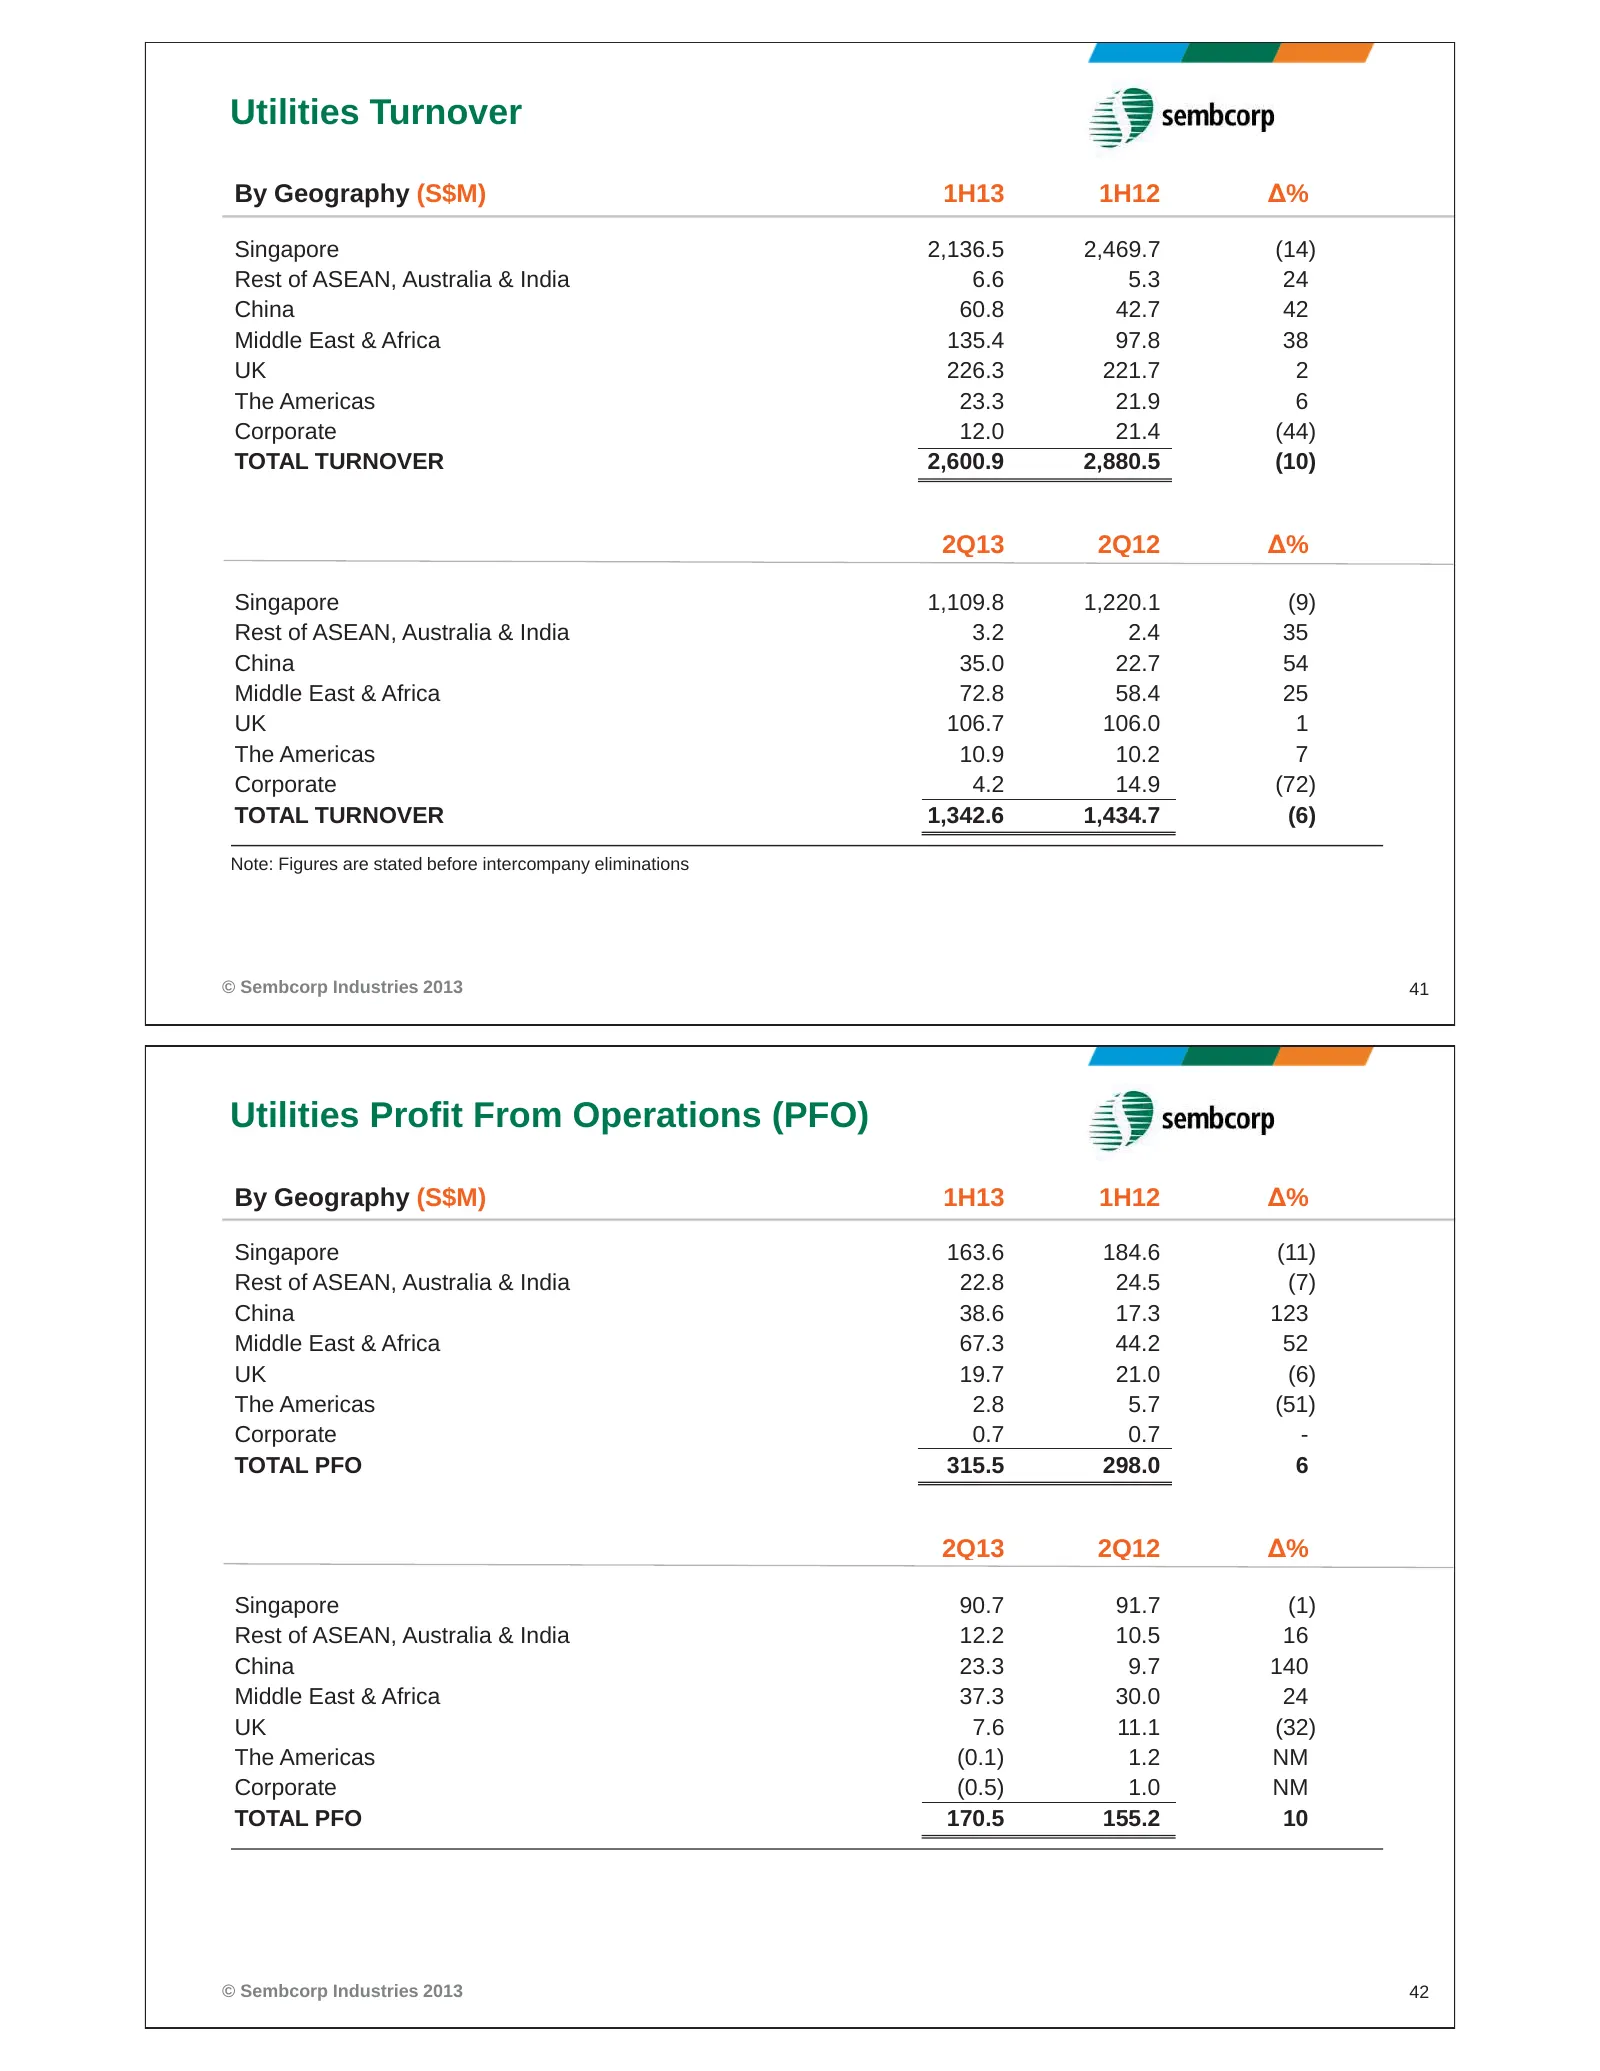
Slide 21: Utilities Turnover and Profit From Operations by Geography
Utilities Turnover By Geography (S$M) 1H13 1H12 Δ% Singapore 2,136.5 2,469.7 (14) Rest of ASEAN, Australia & India 6.6 5.3 24 China 60.8 42.7 42 Middle East & Africa 135.4 97.8 38 UK 226.3 221.7 2 The Americas 23.3 21.9 6 Corporate 12.0 21.4 (44) TOTAL TURNOVER 2,600.9 2,880.5 (10) 2Q13 2Q12 Δ% Sing
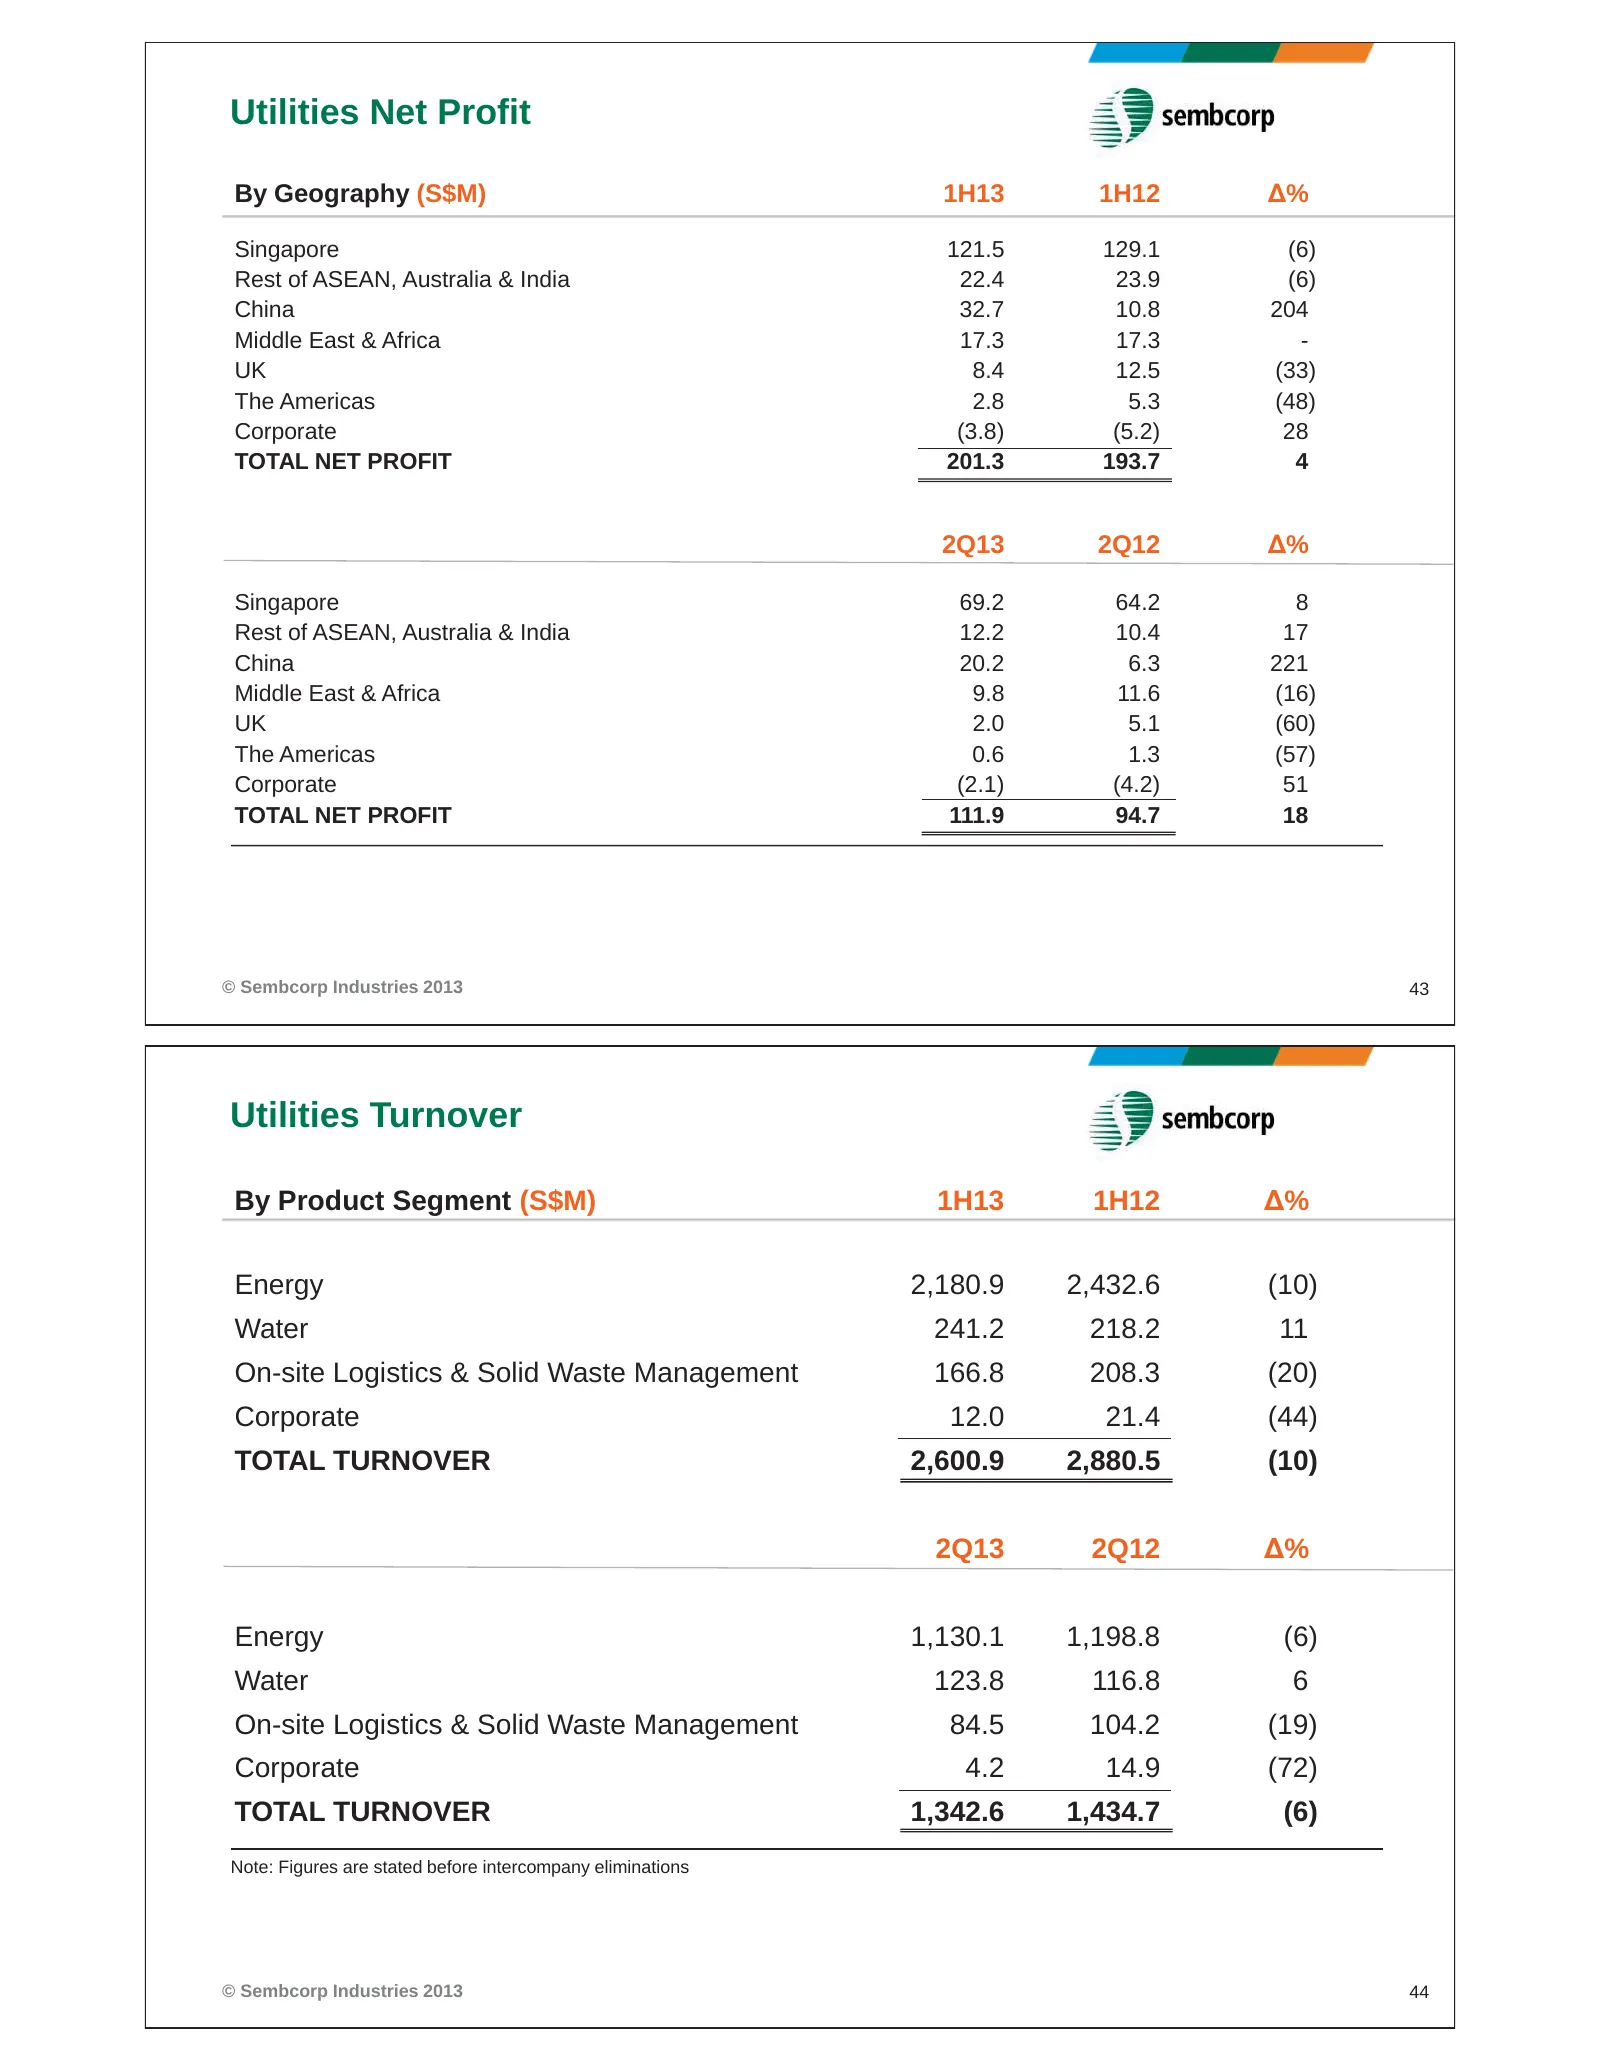
Slide 22: Utilities Net Profit and Turnover
Utilities Net Profit By Geography (S$M) 1H13 1H12 Δ% Singapore 121.5 129.1 (6) Rest of ASEAN, Australia & India 22.4 23.9 (6) China 32.7 10.8 204 Middle East & Africa 17.3 17.3 - UK 8.4 12.5 (33) The Americas 2.8 5.3 (48) Corporate (3.8) (5.2) 28 TOTAL NET PROFIT 201.3 193.7 4 2Q13 2Q12 Δ% Singapore
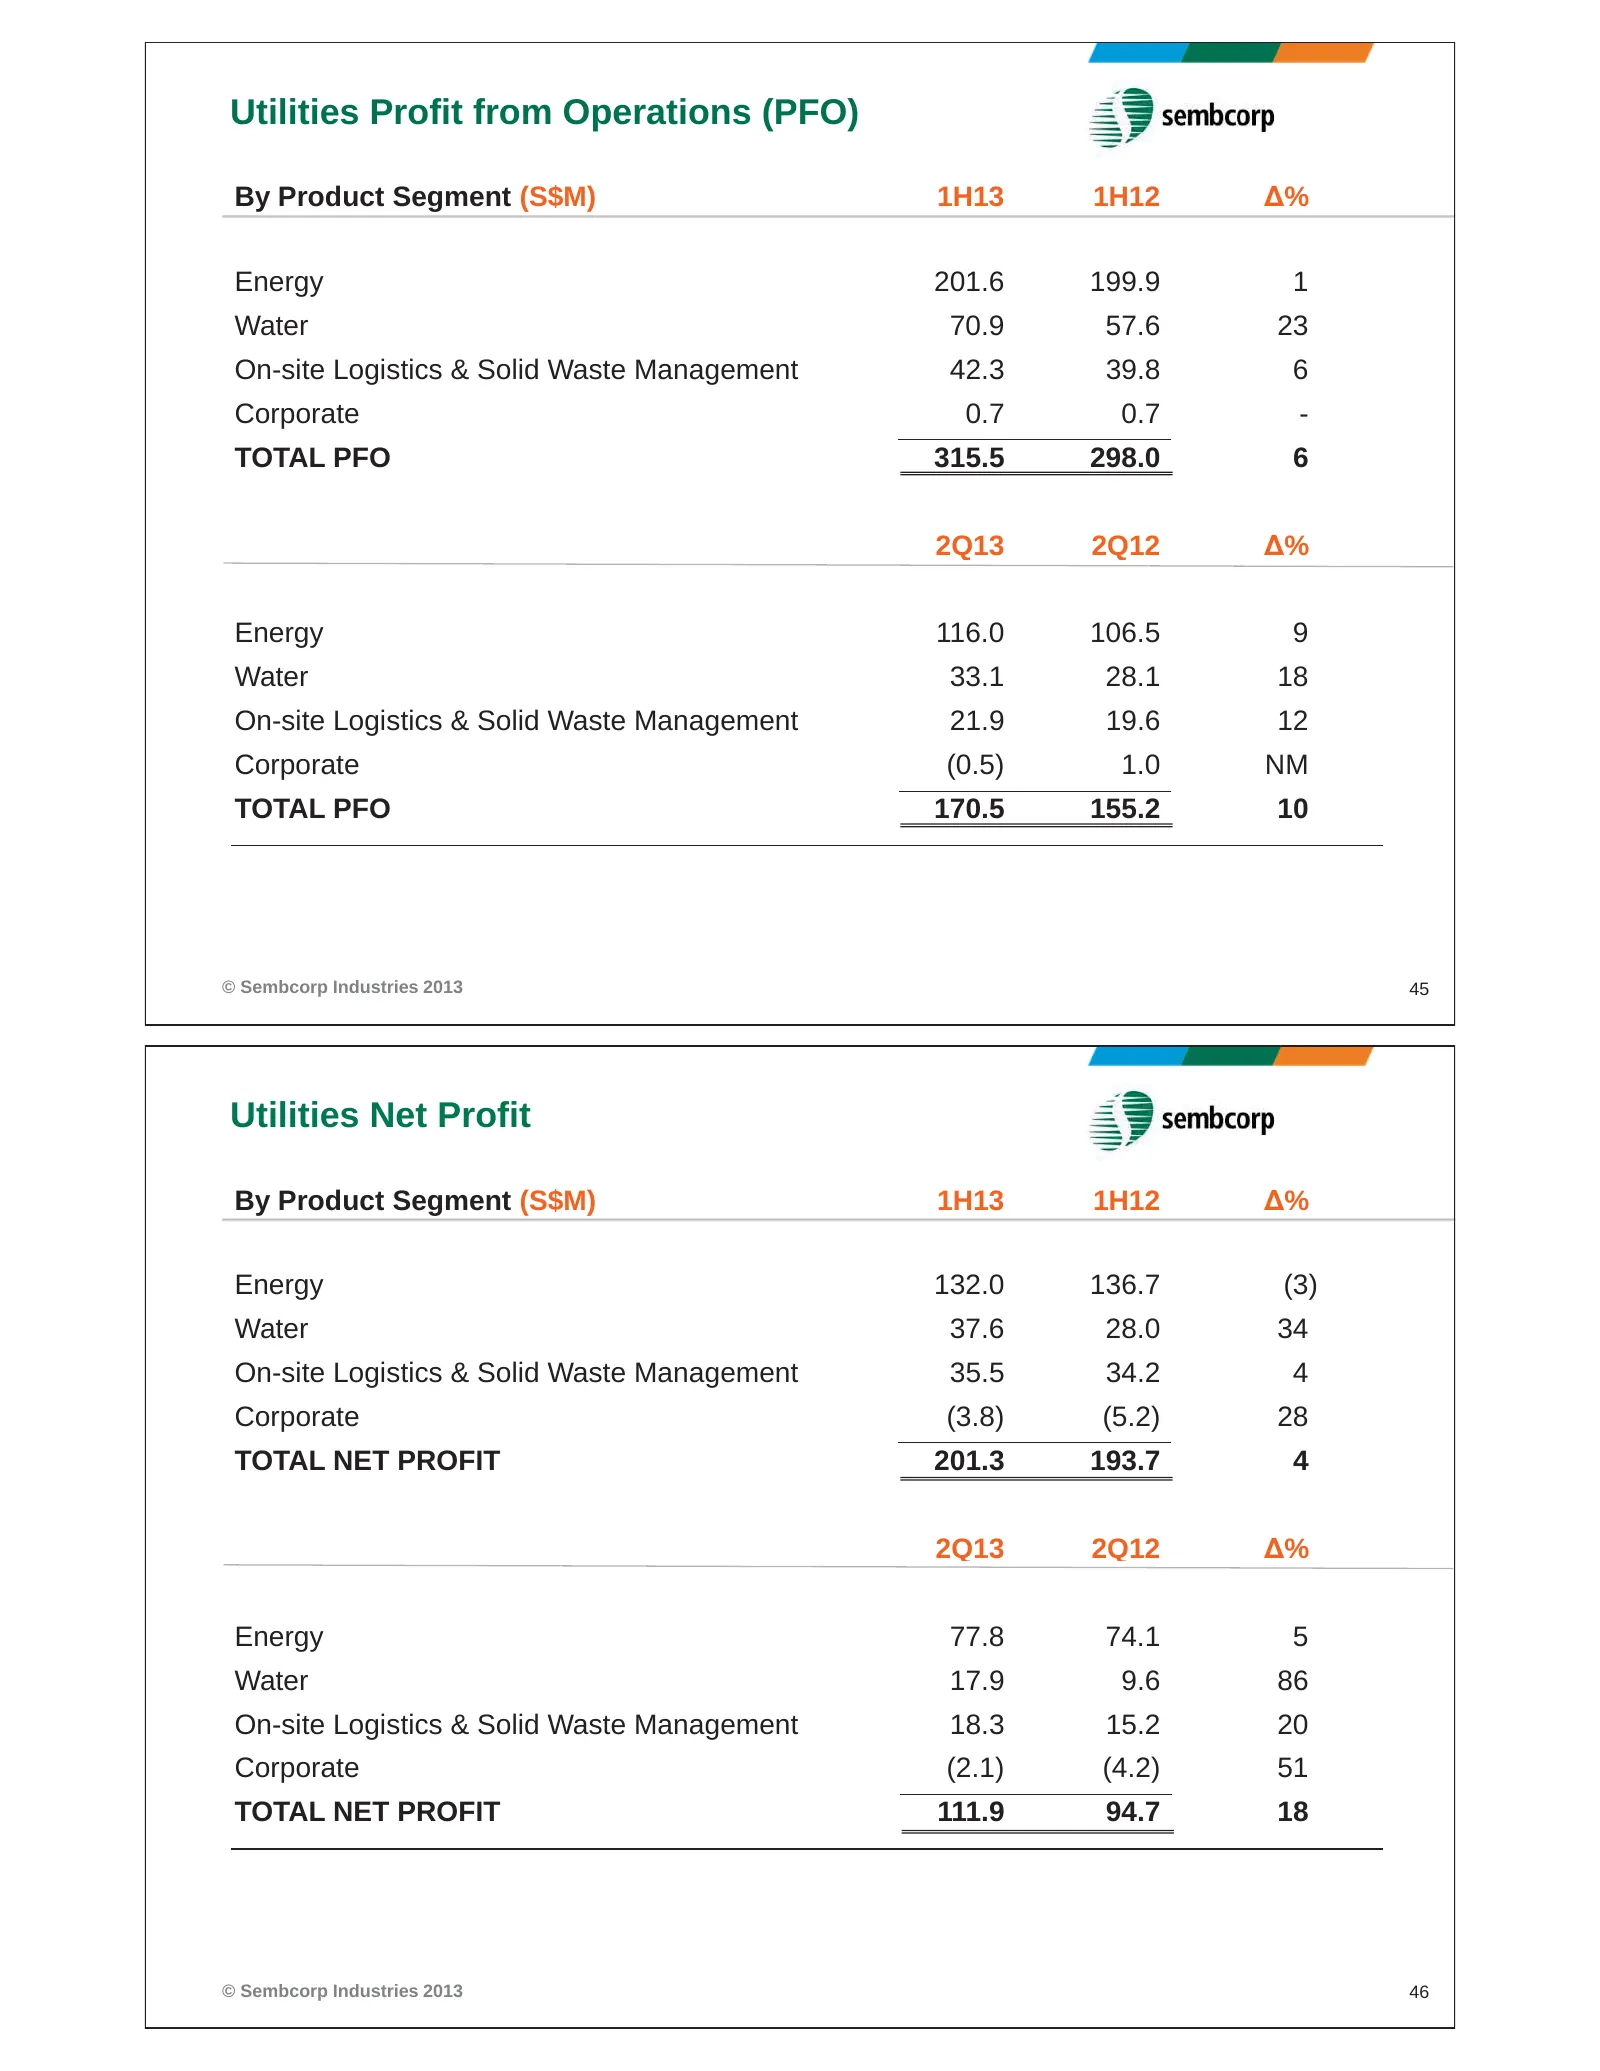
Slide 23: Utilities PFO and Net Profit by Product Segment
Utilities Profit from Operations (PFO) By Product Segment (S$M) 1H13 1H12 Δ% Energy 201.6 199.9 1 Water 70.9 57.6 23 On-site Logistics & Solid Waste Management 42.3 39.8 6 Corporate 0.7 0.7 - TOTAL PFO 315.5 298.0 6 2Q13 2Q12 Δ% Energy 116.0 106.5 9 Water 33.1 28.1 18 On-site Logistics & Solid Waste
Source: Internet Archive copy of sembcorp.com
More decks from Sembcorp Industries Ltd.
 H1 2026 Earnings Presentation26 slides · Aug 13, 2026
 Investor Presentation (June 2026)52 slides · June 2026
 Shareholder Meeting (April 2026)11 slides · Apr 29, 2026
 FY2025 Earnings Presentation35 slides · Feb 25, 2026
 Merger or Acquisition (January 2026)13 slides · Jan 30, 2026
 Merger or Acquisition (December 2025)24 slides · Dec 11, 2025