ESSA Bancorp — Shareholder Meeting (February 2019)
29 slides from ESSA Bancorp's shareholder meeting presentation, Feb 28, 2019
Slide 1: 2018 Annual Meeting
2018 Annual Meeting February 28, 2019 Exhibit 99.1
Slide 2: Forward Looking Statements
Forward Looking Statements Certain statements contained herein are “forward-looking statements” within the meaning of Section 27A of the Securities Act of 1933 and Section 21E of the Securities Exchange Act of 1934. Such forward-looking statements may be identified by reference to a future period or
Slide 3: 2018: Demonstrating Results
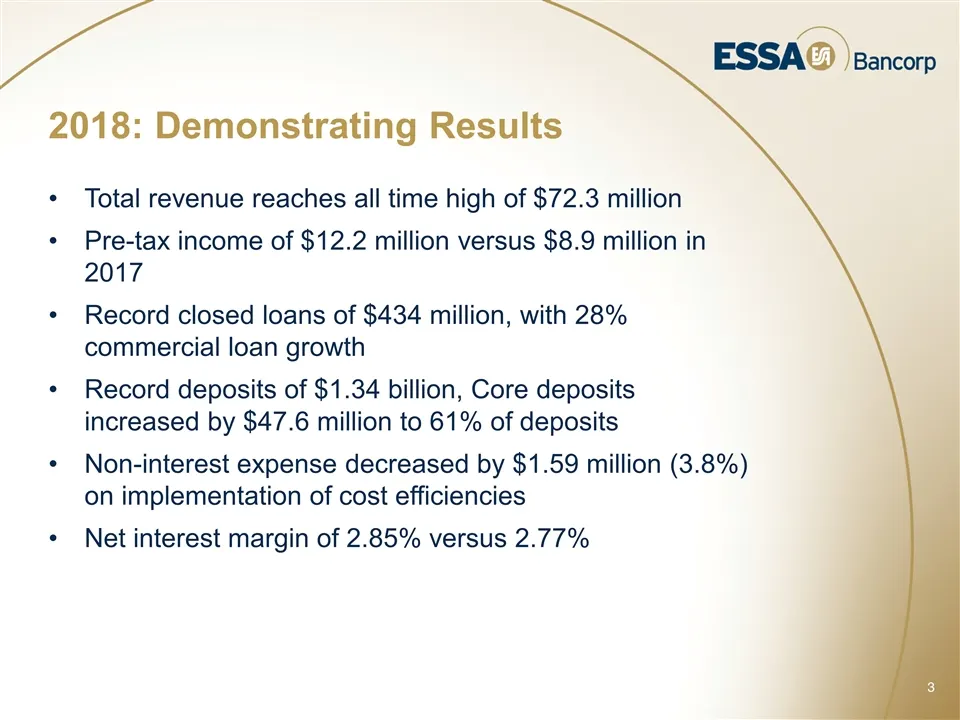
2018: Demonstrating Results Total revenue reaches all time high of $72.3 million Pre-tax income of $12.2 million versus $8.9 million in 2017 Record closed loans of $434 million, with 28% commercial loan growth Record deposits of $1.34 billion, Core deposits increased by $47.6 million to 61% of depos
Slide 4: Key Data At-A-Glance: Impact of the Tax Cuts and Jobs Act
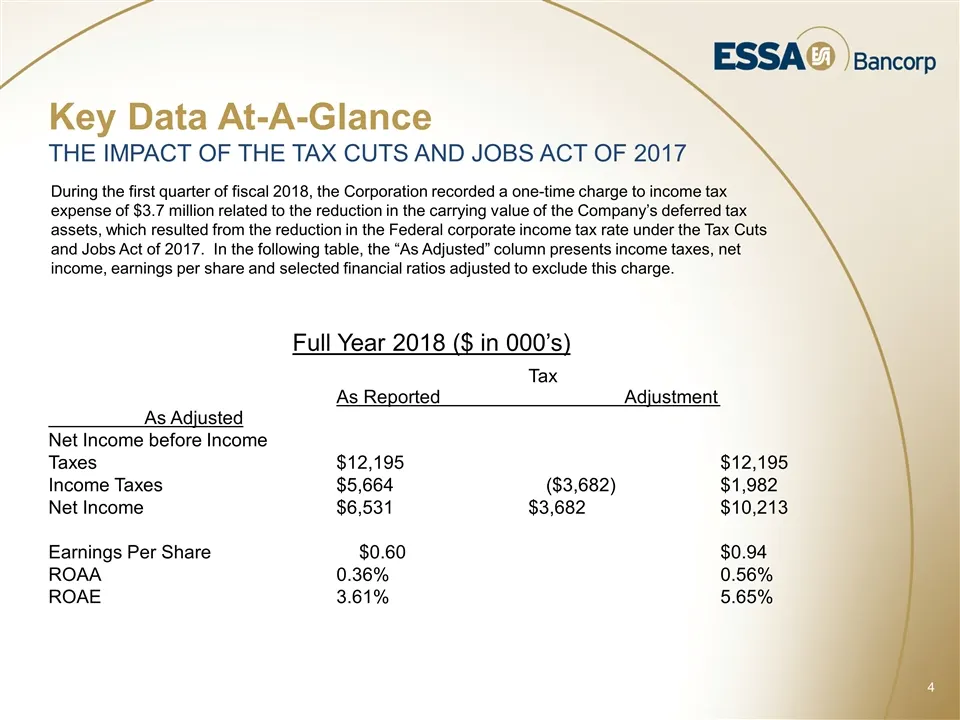
During the first quarter of fiscal 2018, the Corporation recorded a one-time charge to income tax expense of $3.7 million related to the reduction in the carrying value of the Company’s deferred tax assets, which resulted from the reduction in the Federal corporate income tax rate under the Tax Cuts
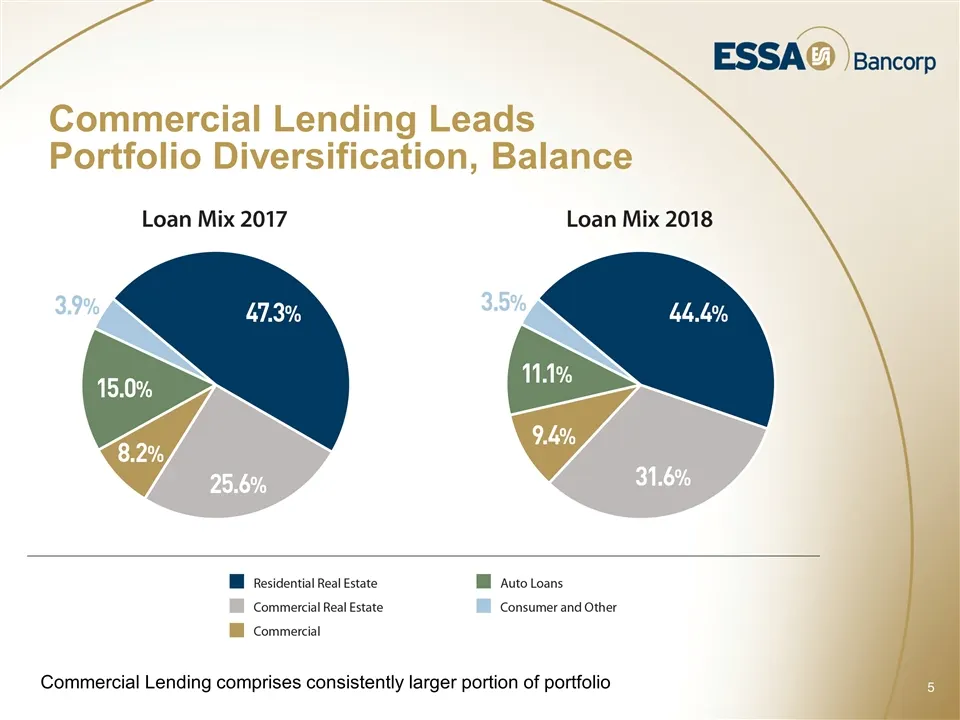
Slide 5: Commercial Lending Leads Portfolio Diversification, Balance
Commercial Lending Leads Portfolio Diversification, Balance Commercial Lending comprises consistently larger portion of portfolio
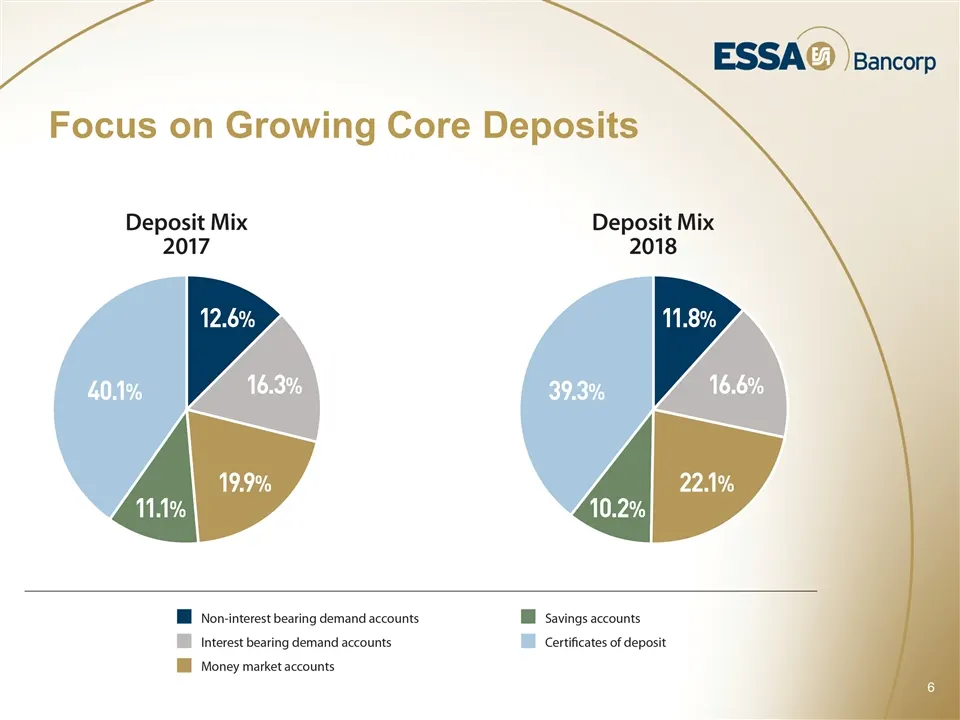
Slide 6: Focus on Growing Core Deposits
Focus on Growing Core Deposits
Slide 7: ESSA Bancorp Performance Trends
ESSA Bancorp Performance Trends
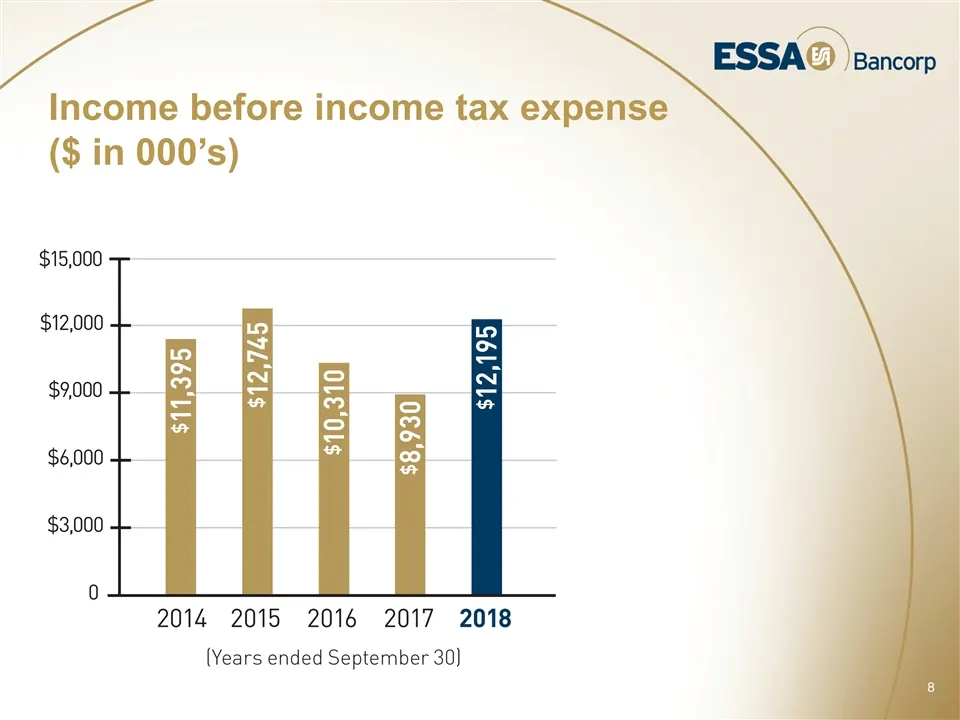
Slide 8: Income before income tax expense
Income before income tax expense ($ in 000’s)
Slide 9: Net Interest Income
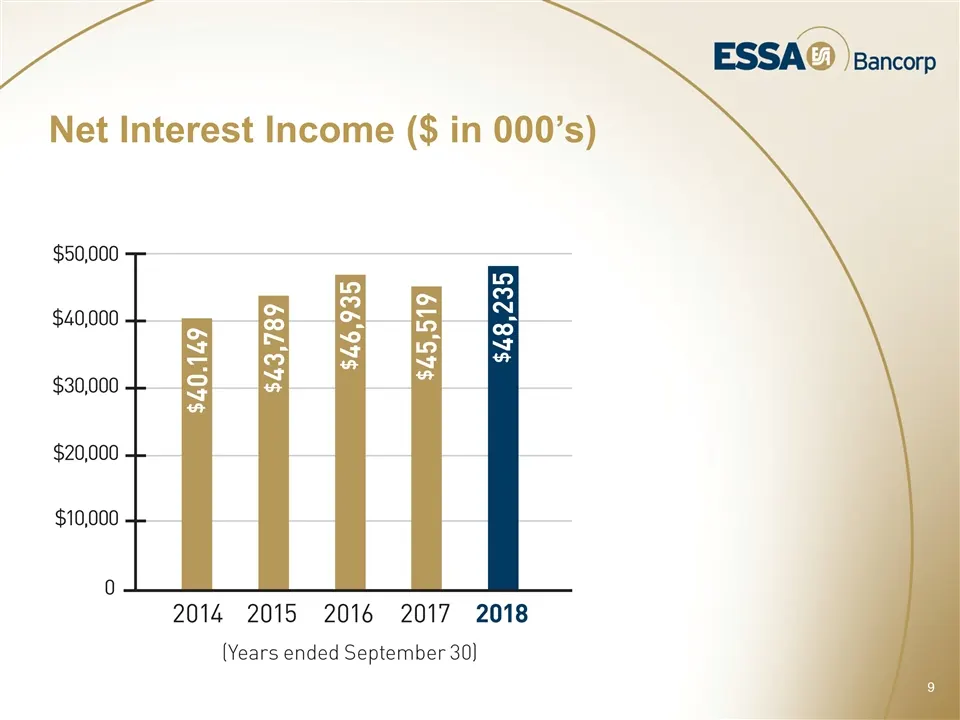
Net Interest Income ($ in 000’s)
Slide 10: Non Interest Expense
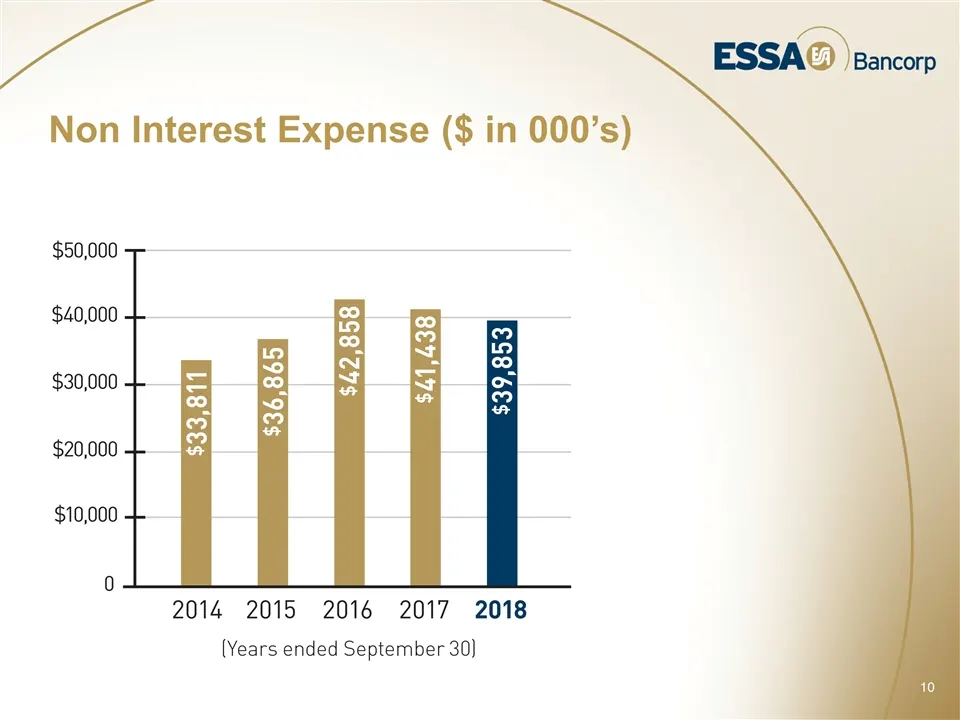
Non Interest Expense ($ in 000’s)
Slide 11: Efficiency Ratio
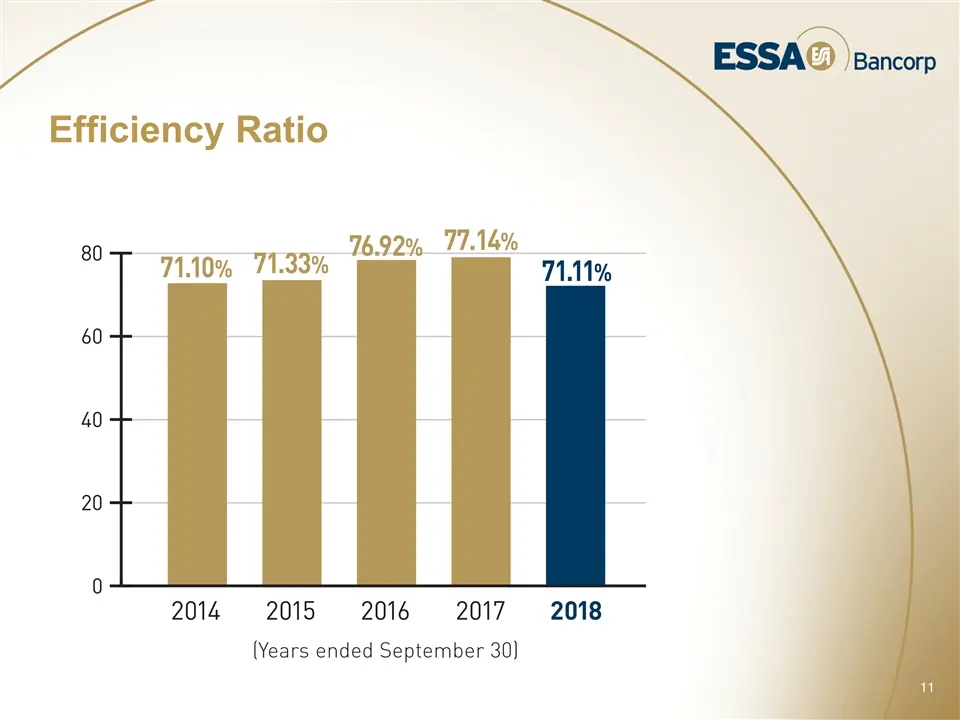
in Efficiency Ratio ESSA® ) Bancorp 76.92% 77.14% 71.10% 71.33% 71.11% 2014 = =2015 2016 2017 = 2018 (Years ended September 30)
Slide 12: Total Assets Reflect Loan Growth
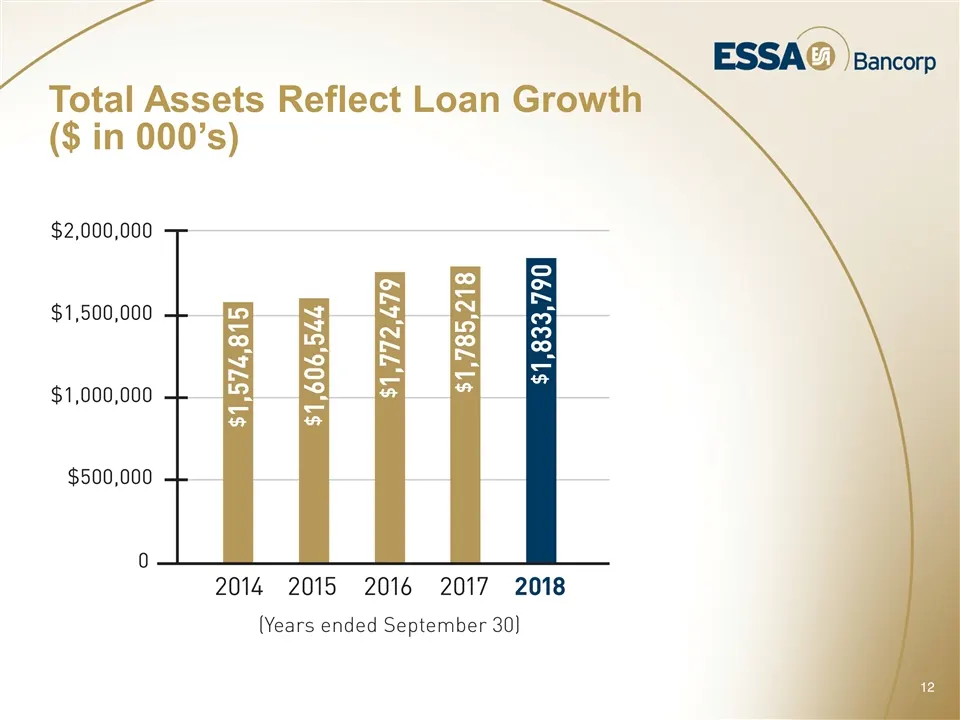
Total Assets Reflect Loan Growth ($ in 000’s)
Slide 13: Commercial Lending Drives Net Loans
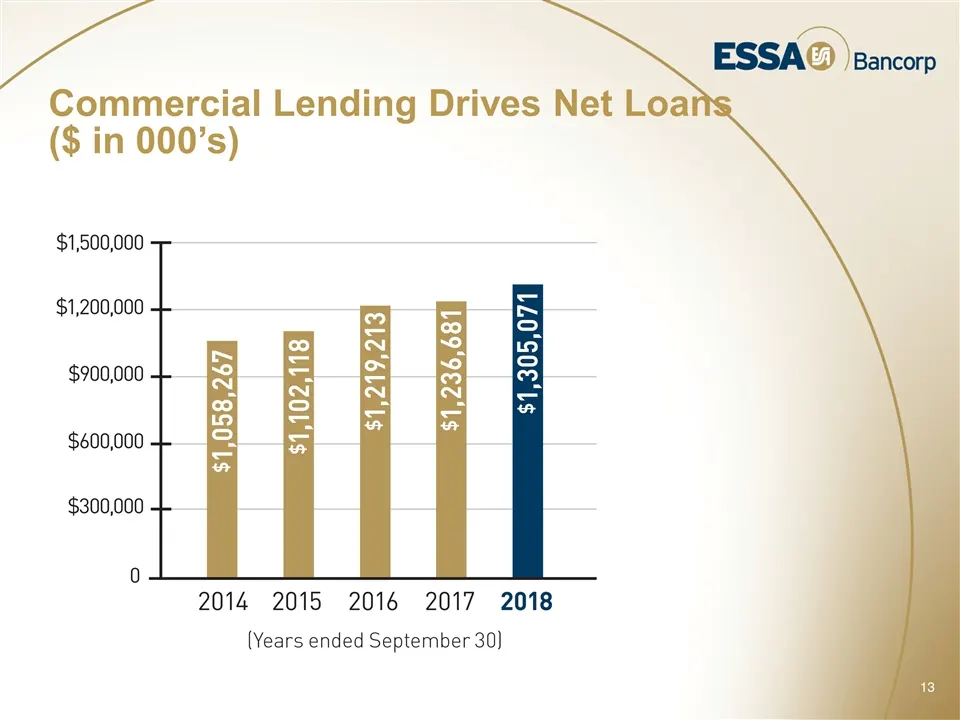
Commercial Lending Drives Net Loans ($ in 000’s)
Slide 14: Total Deposits Reflect Core Deposit Growth
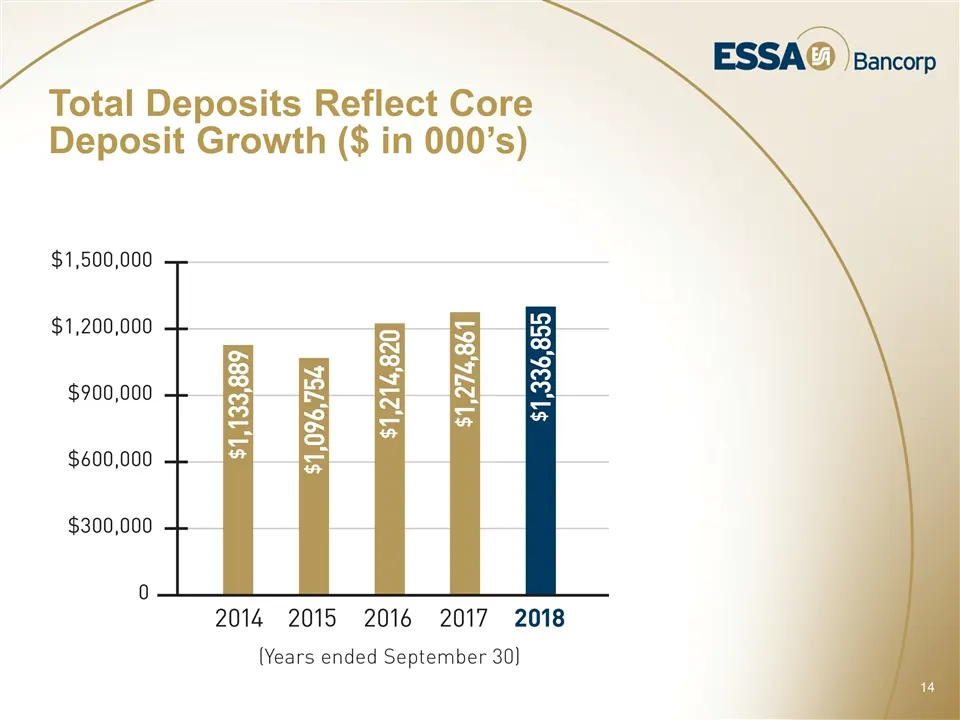
Total Deposits Reflect Core Deposit Growth ($ in 000’s)
Slide 15: NPAs / Total Assets Trend Positively Following Acquisitions, Loan Growth
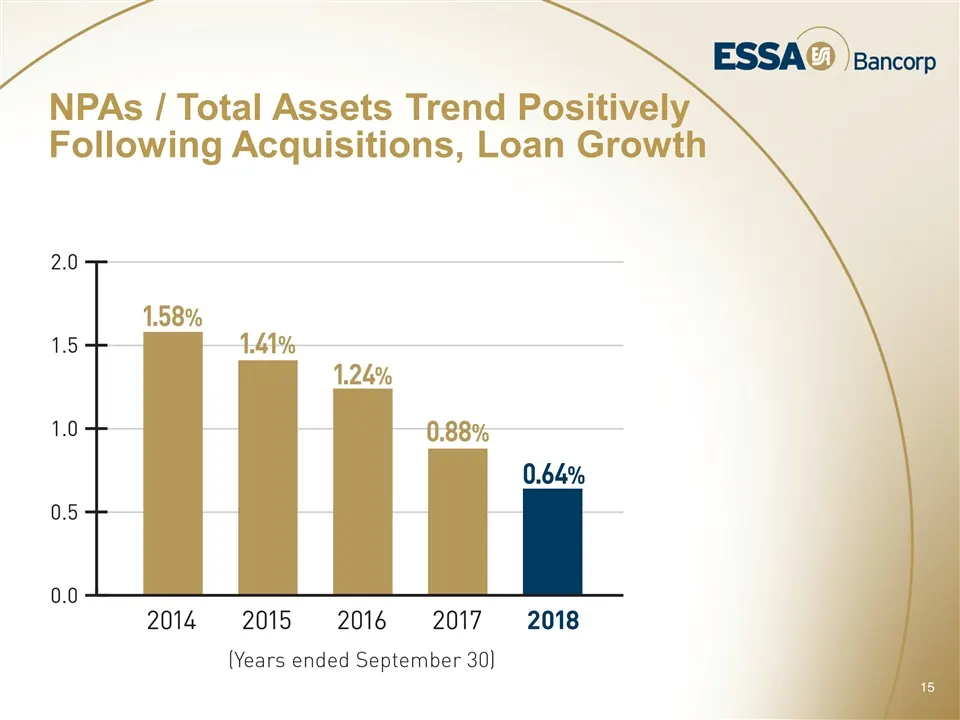
NPAs / Total Assets Trend Positively Following Acquisitions, Loan Growth
Slide 16: Maintaining Capital Strength
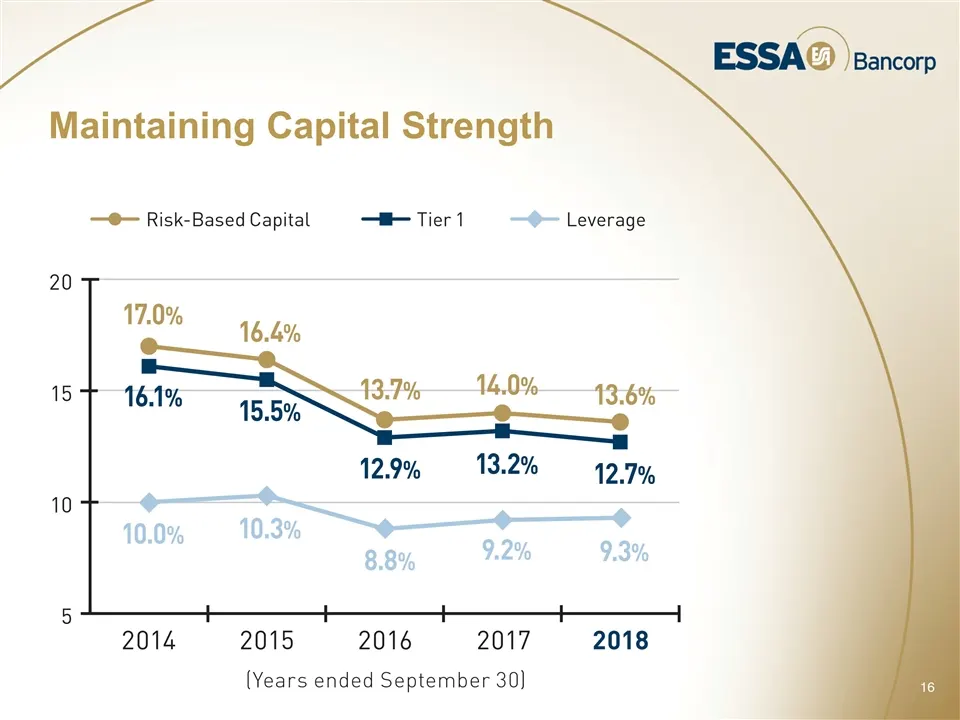
Maintaining Capital Strength
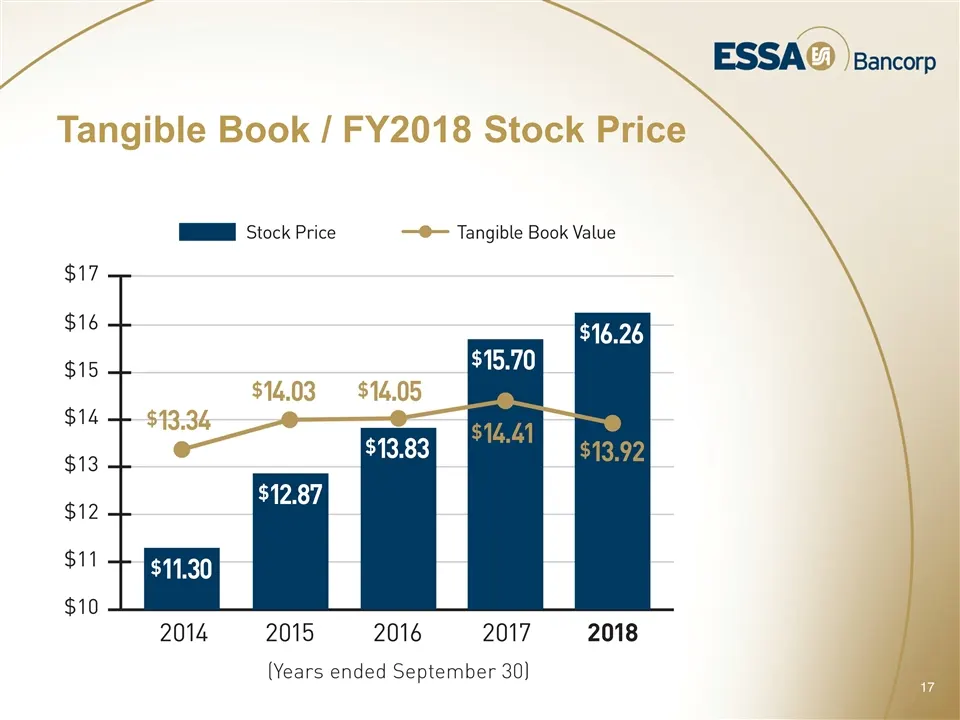
Slide 17: Tangible Book / FY2018 Stock Price
Tangible Book / FY2018 Stock Price
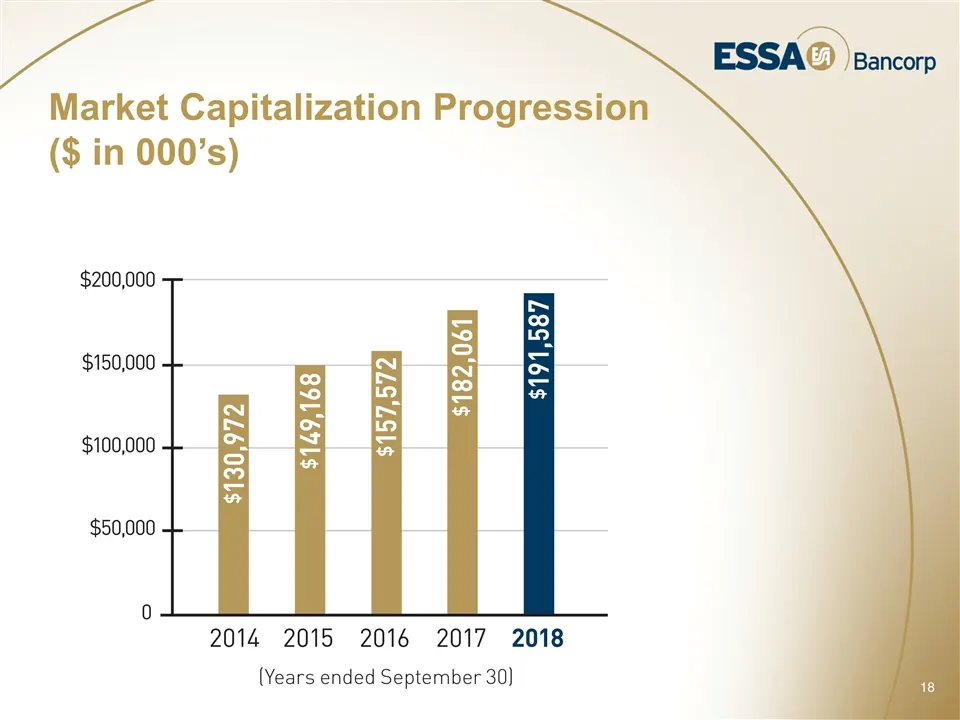
Slide 18: Market Capitalization Progression
Market Capitalization Progression ($ in 000’s)
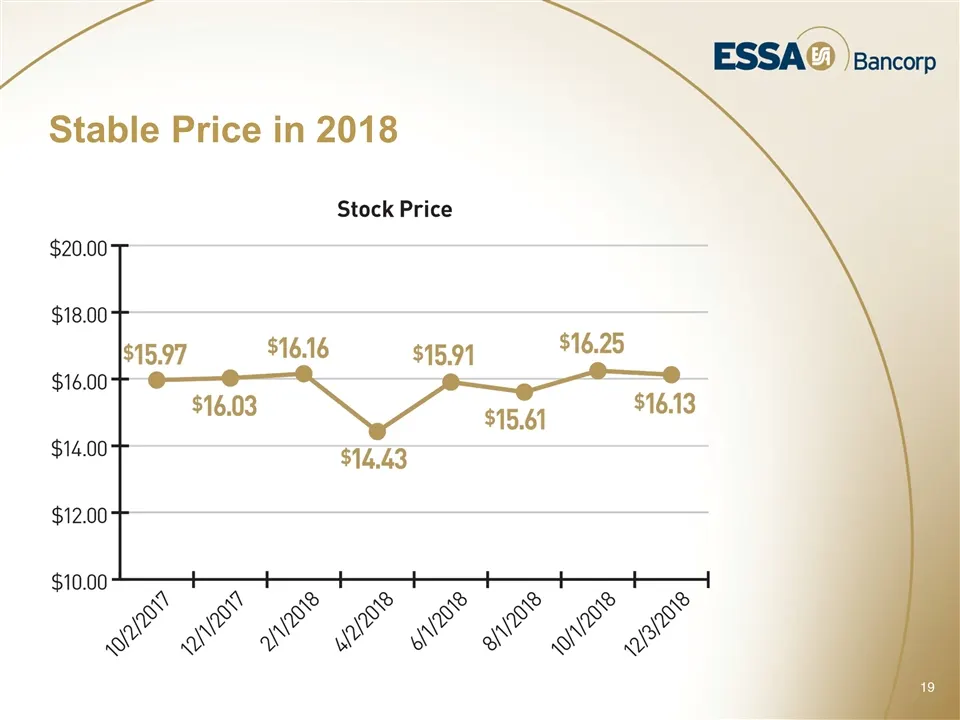
Slide 19: Stable Price in 2018
wi Stable Price in 2018 ESSA® ) Bancorp Stock Price $20.00 $18.00 S597 $16.16 $15.91 $16.25 $16.00 $164 $16.03 $15.61 6.13 $14.00 $14.43 $12.00 $10.00 at aA? St we? et wt we? we Se Pe GB BG Gg WM & we my w ye yw’ ANY w Ss
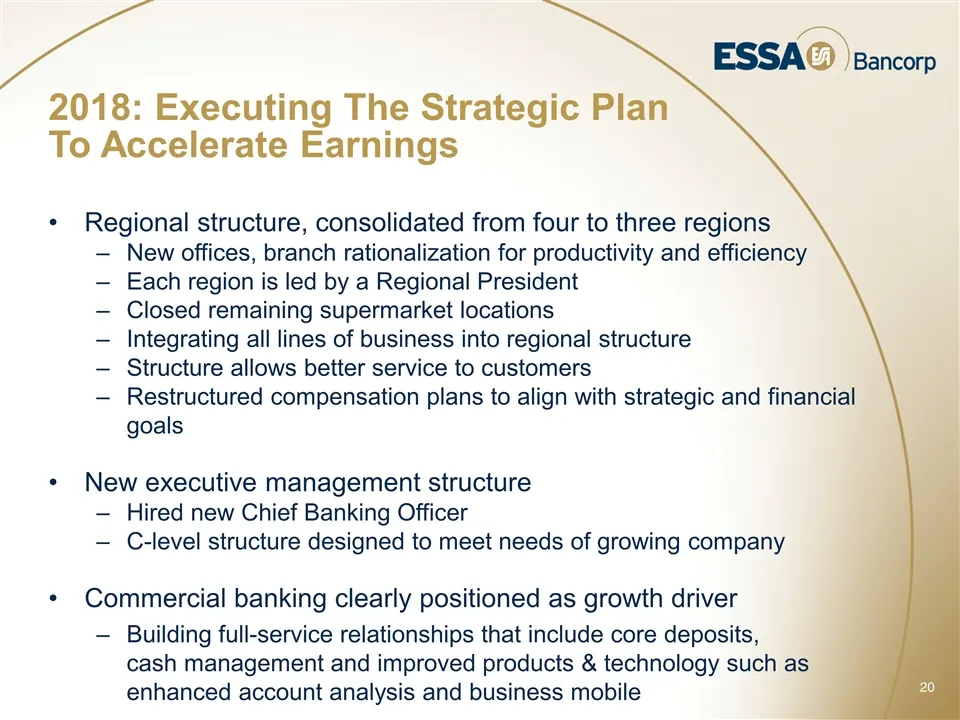
Slide 20: 2018: Executing The Strategic Plan To Accelerate Earnings
2018: Executing The Strategic Plan To Accelerate Earnings Regional structure, consolidated from four to three regions New offices, branch rationalization for productivity and efficiency Each region is led by a Regional President Closed remaining supermarket locations Integrating all lines of busines
Slide 21: 2018: Executing The Strategic Plan (cont'd)
2018: Executing The Strategic Plan (cont’d) Improving technology to drive efficiency Invested in end to end commercial lending system Underwriting/Approval/Loan Tracking Improves back-office efficiency Marketing Customer Information File (MCIF) System Cost Accounting System Improved financial modeli
Slide 22: Solidly Positioned In Three Regions
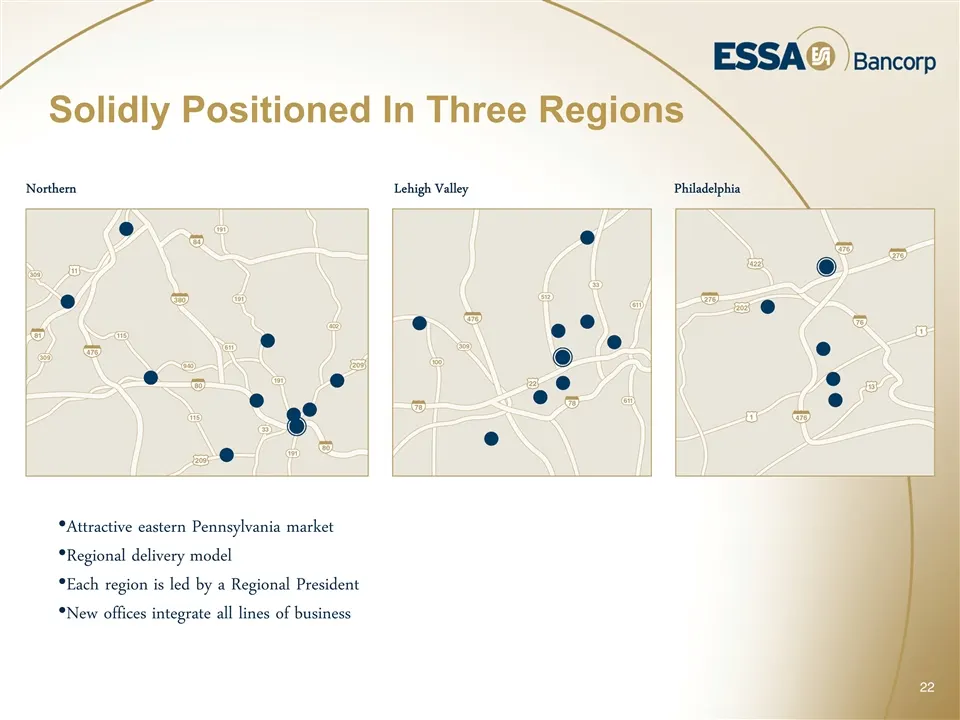
Solidly Positioned In Three Regions Northern Lehigh Valley Philadelphia Attractive eastern Pennsylvania market Regional delivery model Each region is led by a Regional President New offices integrate all lines of business
Slide 23: Regional Offices Support Productivity, Commercial Banking Focus
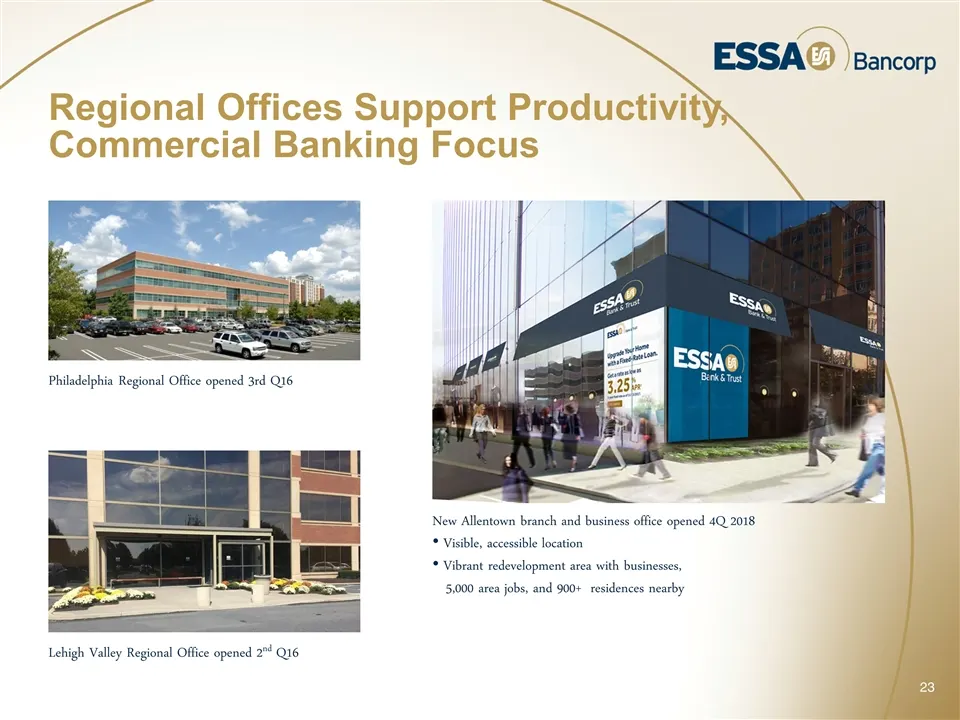
Regional Offices Support Productivity, Commercial Banking Focus Philadelphia Regional Office opened 3rd Q16 New Allentown branch and business office opened 4Q 2018 Visible, accessible location Vibrant redevelopment area with businesses, 5,000 area jobs, and 900+ residences nearby Lehigh Valley Regio
Slide 24: Strategic Initiatives In FY2019
Continued organic loan growth. Net total loans increased by $29.2 million in 1st Q19. Develop into a high-performing financial institution Focus on generating lower-cost deposits and increase core deposits Drive to improve efficiency ratio Continued commercial loan focus Continued growth in non-inte
Slide 25: Outlook, Key Initiatives In FY2019
Maintain strong enterprise wide risk management profile with a focus on loan quality Utilize technological, operational, and modeling capabilities to enhance earnings performance Outlook, Key Initiatives In FY2019
Slide 26: CRA Initiatives
CRA Initiatives Slate Belt Rising Neighborhood partnership program $75K investment over 3 years Community Action Committee of the Lehigh Valley (CACLV) Match savings program to help low and moderate income individuals save for home ownership Revitalizing Allentown “Jordan Heights” neighborhood Housi
Slide 27: CRA Initiatives (cont'd)
CRA Initiatives (cont’d) Habitat for Humanity of Monroe County Loan servicing, payments, taxes, etc. Court-Assisted Re-Entry (CARE) Program Supervision to Aid Re-Entry (STAR) Program Small Business Financing (Loans < $1 million) 139 small business loans Pocono Alliance match savings program and fina

Slide 28: Deposit-Driven Promotional Messaging
Deposit-Driven Promotional Messaging
Slide 29: 2018 Annual Meeting
2018 Annual Meeting February 28, 2019
Source: SEC EDGAR · 8-K filed Feb 28, 2019
More decks from ESSA Bancorp Inc
 Merger or Acquisition (April 2025)26 slides · Apr 15, 2025
 Merger or Acquisition (January 2025)25 slides · Jan 10, 2025
 Shareholder Meeting (March 2024)15 slides · Mar 7, 2024
 Shareholder Meeting (March 2023)15 slides · Mar 9, 2023
 Investor Presentation (June 2022)10 slides · Jun 15, 2022
 Shareholder Meeting (March 2022)18 slides · Mar 3, 2022