American National Group Inc · NYSE:ANG/PD
American National — American Equity Investment Life Holding — Q1 2020 Earnings Presentation
22 slides from American National's earnings presentation, May 6, 2020
Slide 1: Investments & Capital Update 1Q 2020
Investment Update 1Q 2020 Investments & Capital Update As of March 31, 2020
Slide 2: Forward Looking Statements
Forward Looking Statements The Private Securities Litigation Reform Act of 1995 provides a “safe harbor” to encourage companies to provide prospective information, so long as those informational statements are identified as forward-looking and are accompanied by meaningful cautionary statements iden
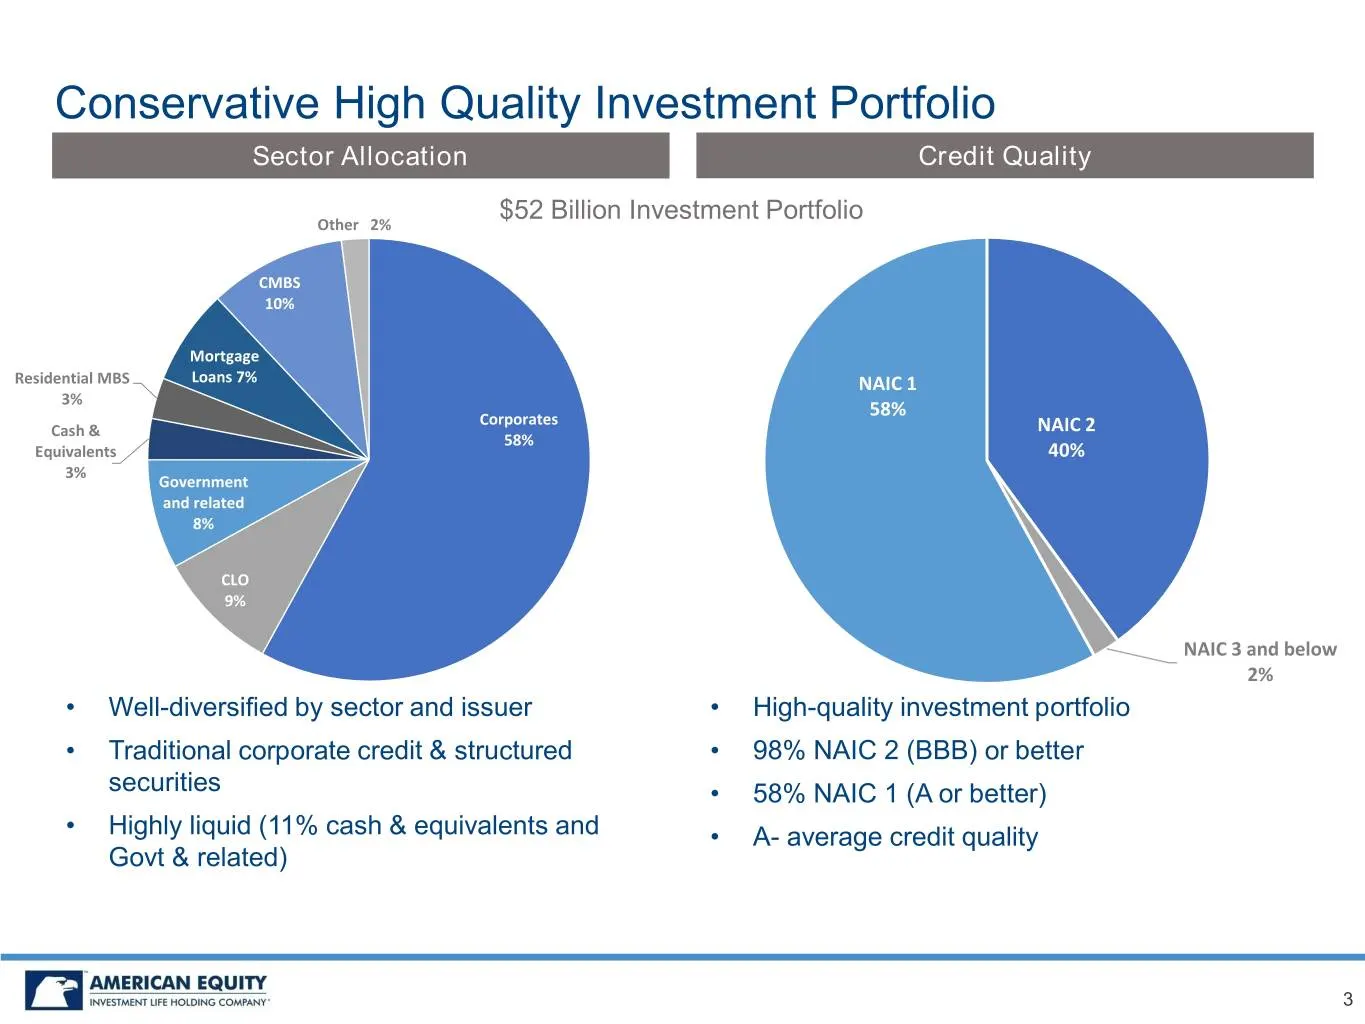
Slide 3: Conservative High Quality Investment Portfolio
Conservative High Quality Investment Portfolio Sector Allocation Credit Quality $52 Billion Investment Portfolio Other 2% CMBS 10% Mortgage Residential MBS Loans 7% NAIC 1 3% Corporates 58% Cash & NAIC 2 58% Equivalents 40% 3% Government and related 8% CLO 9% NAIC 3 and below 2% • Well-diversified b
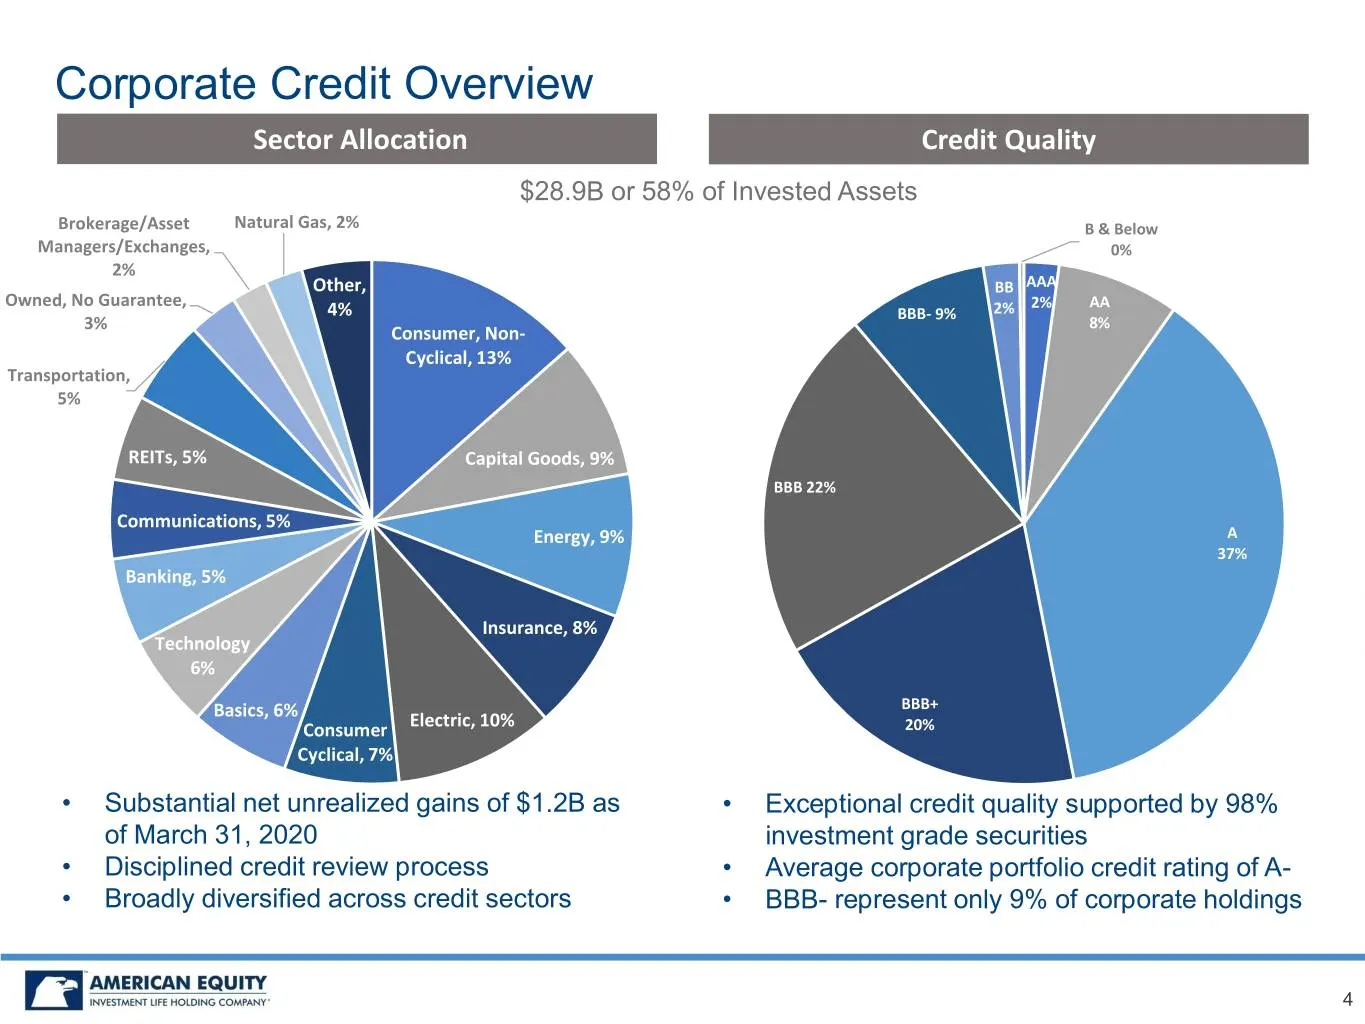
Slide 4: Corporate Credit Overview
Corporate Credit Overview Sector Allocation Credit Quality $28.9B or 58% of Invested Assets Brokerage/Asset Natural Gas, 2% B & Below Managers/Exchanges, 0% 2% Other, BB AAA Owned, No Guarantee, 2% AA 4% BBB- 9% 2% 3% 8% Consumer, Non- Cyclical, 13% Transportation, 5% REITs, 5% Capital Goods, 9% BBB
Slide 5: Corporate Credit: Energy Overview
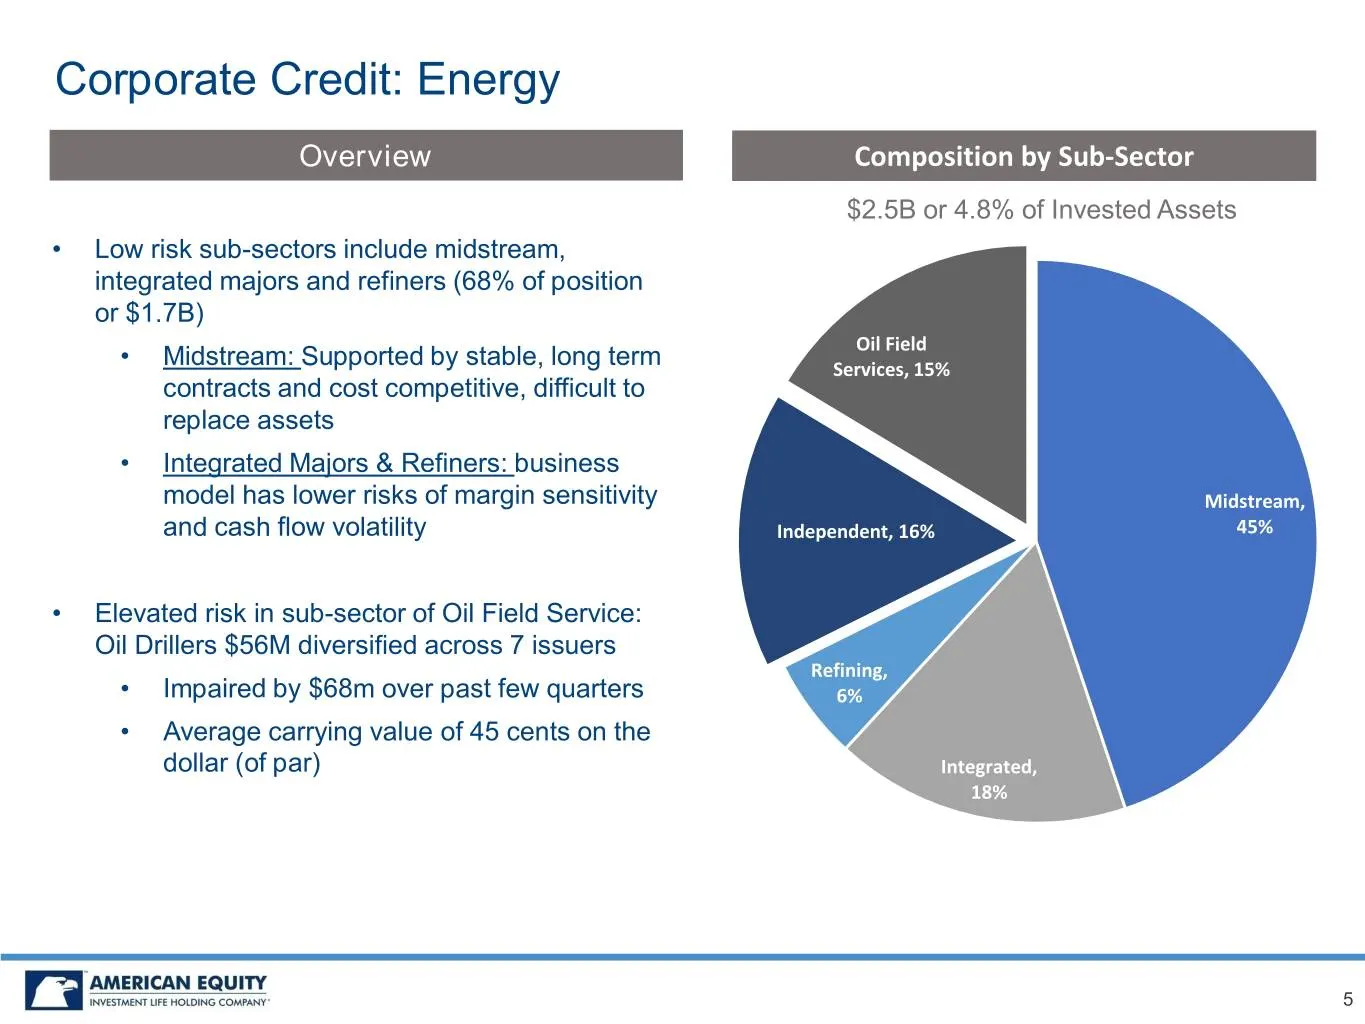
Corporate Credit: Energy Overview Composition by Sub-Sector $2.5B or 4.8% of Invested Assets • Low risk sub-sectors include midstream, integrated majors and refiners (68% of position or $1.7B) Oil Field • Midstream: Supported by stable, long term Services, 15% contracts and cost competitive, difficu
Slide 6: Corporate Credit: Retail/Lodging & Leisure
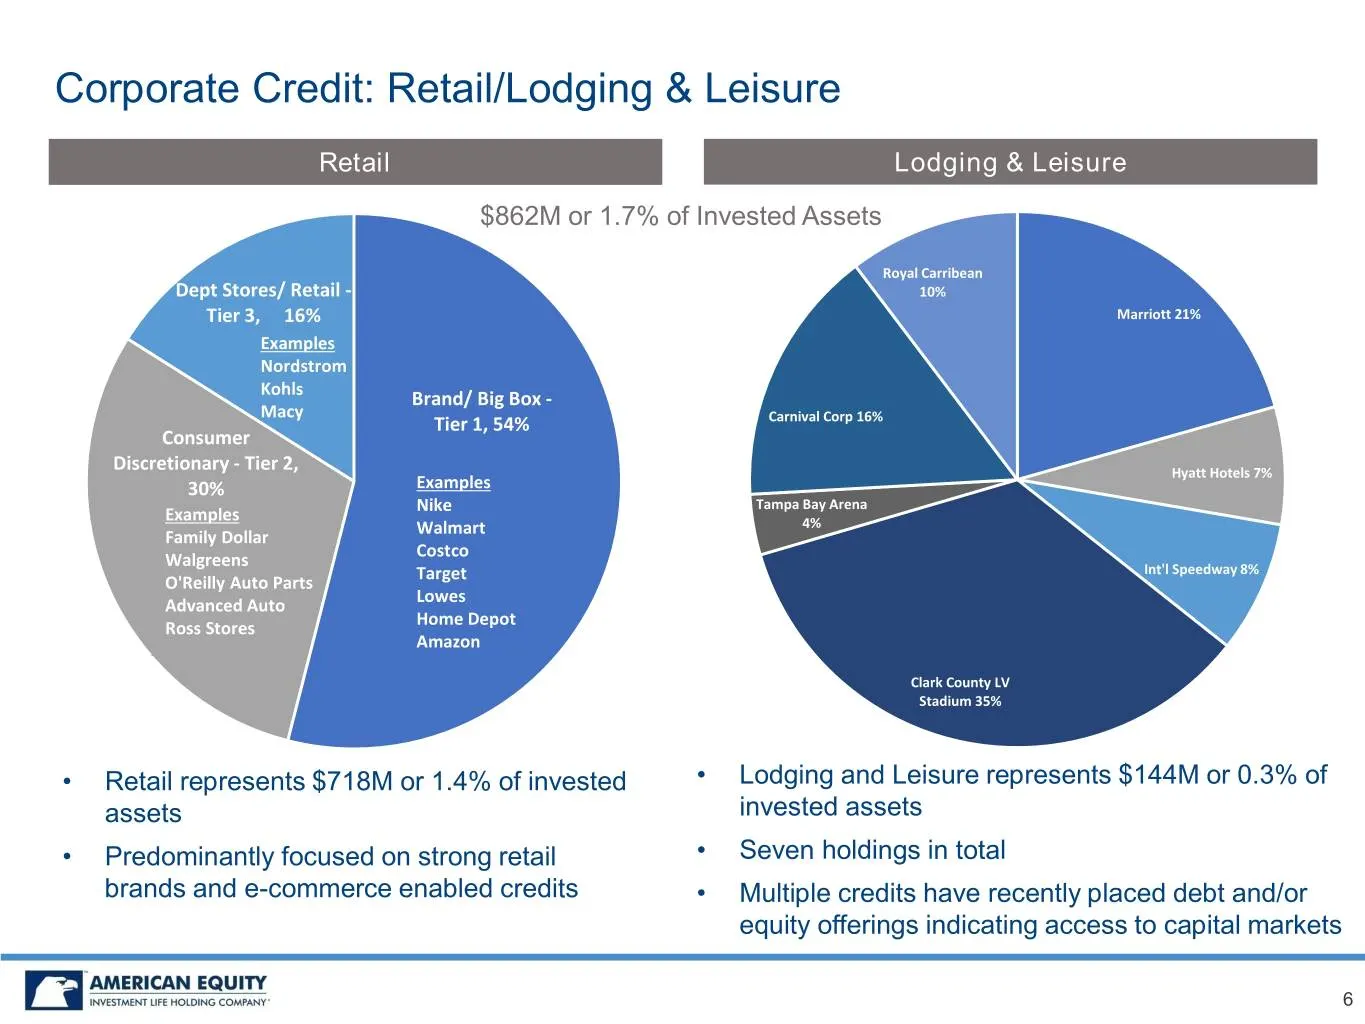
Corporate Credit: Retail/Lodging & Leisure Retail Lodging & Leisure $862M or 1.7% of Invested Assets Royal Carribean Dept Stores/ Retail - 10% Tier 3, 16% Marriott 21% Examples Nordstrom Kohls Brand/ Big Box - Macy Tier 1, 54% Carnival Corp 16% Consumer Discretionary - Tier 2, Hyatt Hotels 7% 30% Ex
Slide 7: Corporate Credit: Aircraft/Lessors/Commercial Aerospace
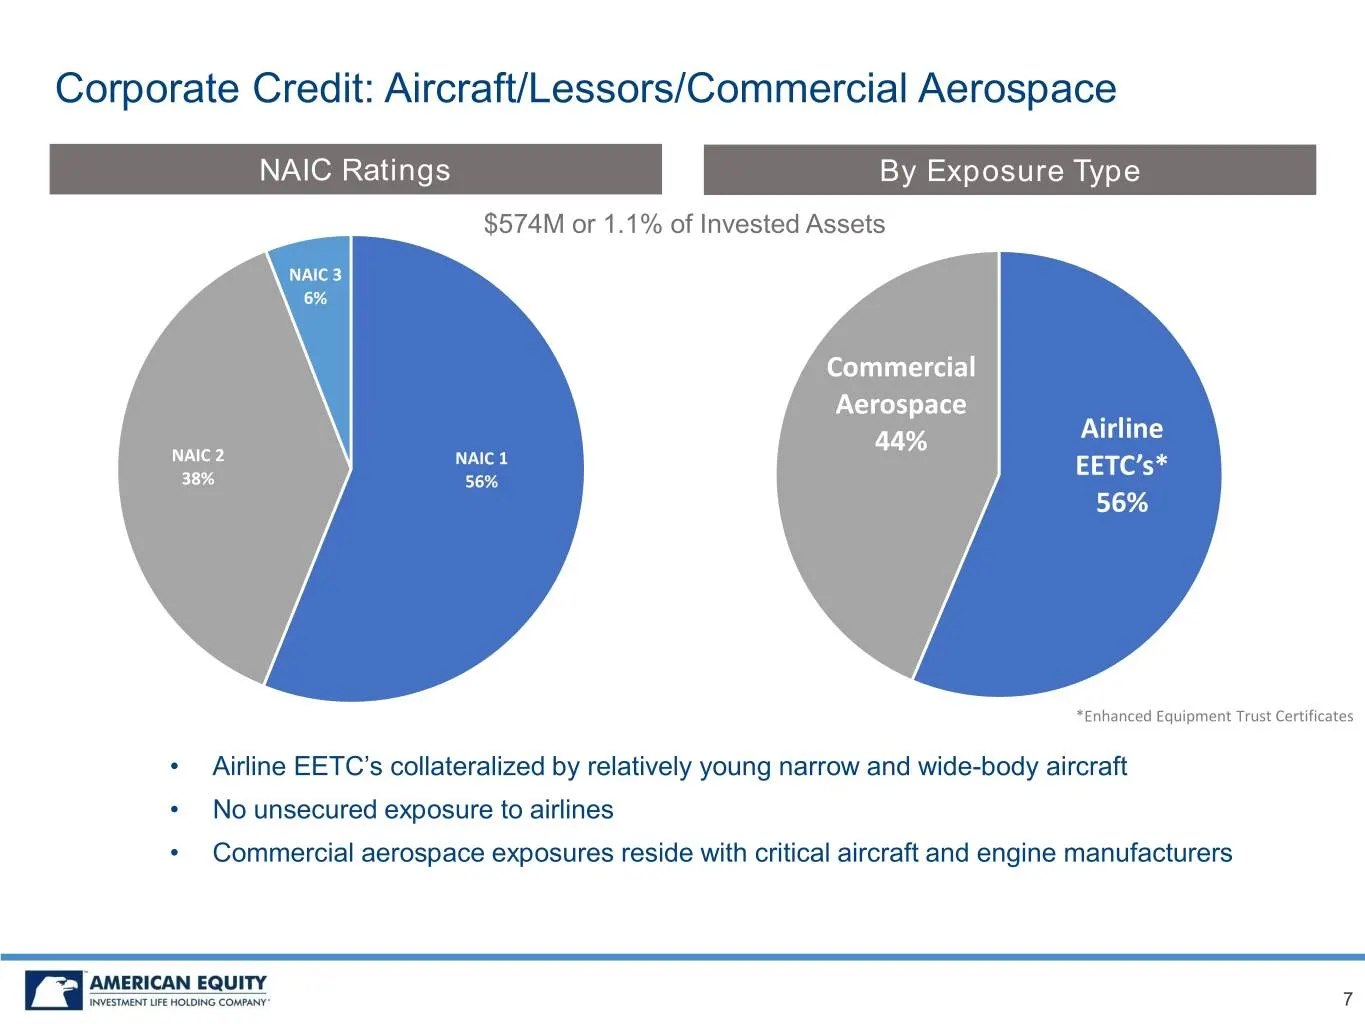
Corporate Credit: Aircraft/Lessors/Commercial Aerospace NAIC Ratings By Exposure Type $574M or 1.1% of Invested Assets NAIC 3 6% Commercial Aerospace 44% Airline NAIC 2 NAIC 1 38% 56% EETC’s* 56% *Enhanced Equipment Trust Certificates • Airline EETC’s collateralized by relatively young narrow and wi
Slide 8: CLO Overview
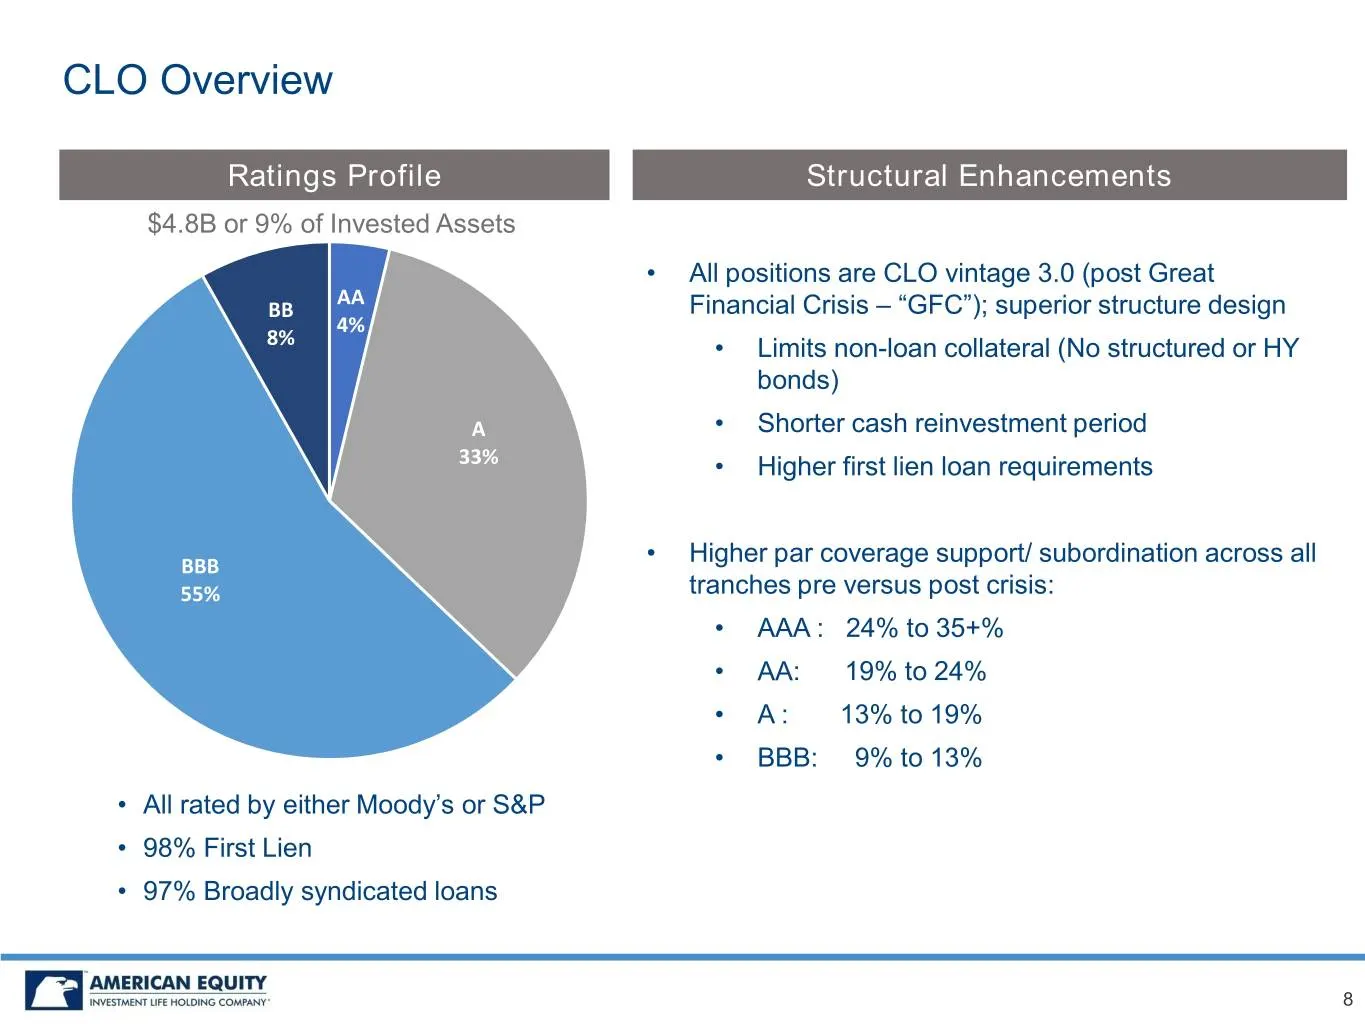
CLO Overview Ratings Profile Structural Enhancements $4.8B or 9% of Invested Assets • All positions are CLO vintage 3.0 (post Great AA BB Financial Crisis – “GFC”); superior structure design 4% 8% • Limits non-loan collateral (No structured or HY bonds) A • Shorter cash reinvestment period 33% • Hig
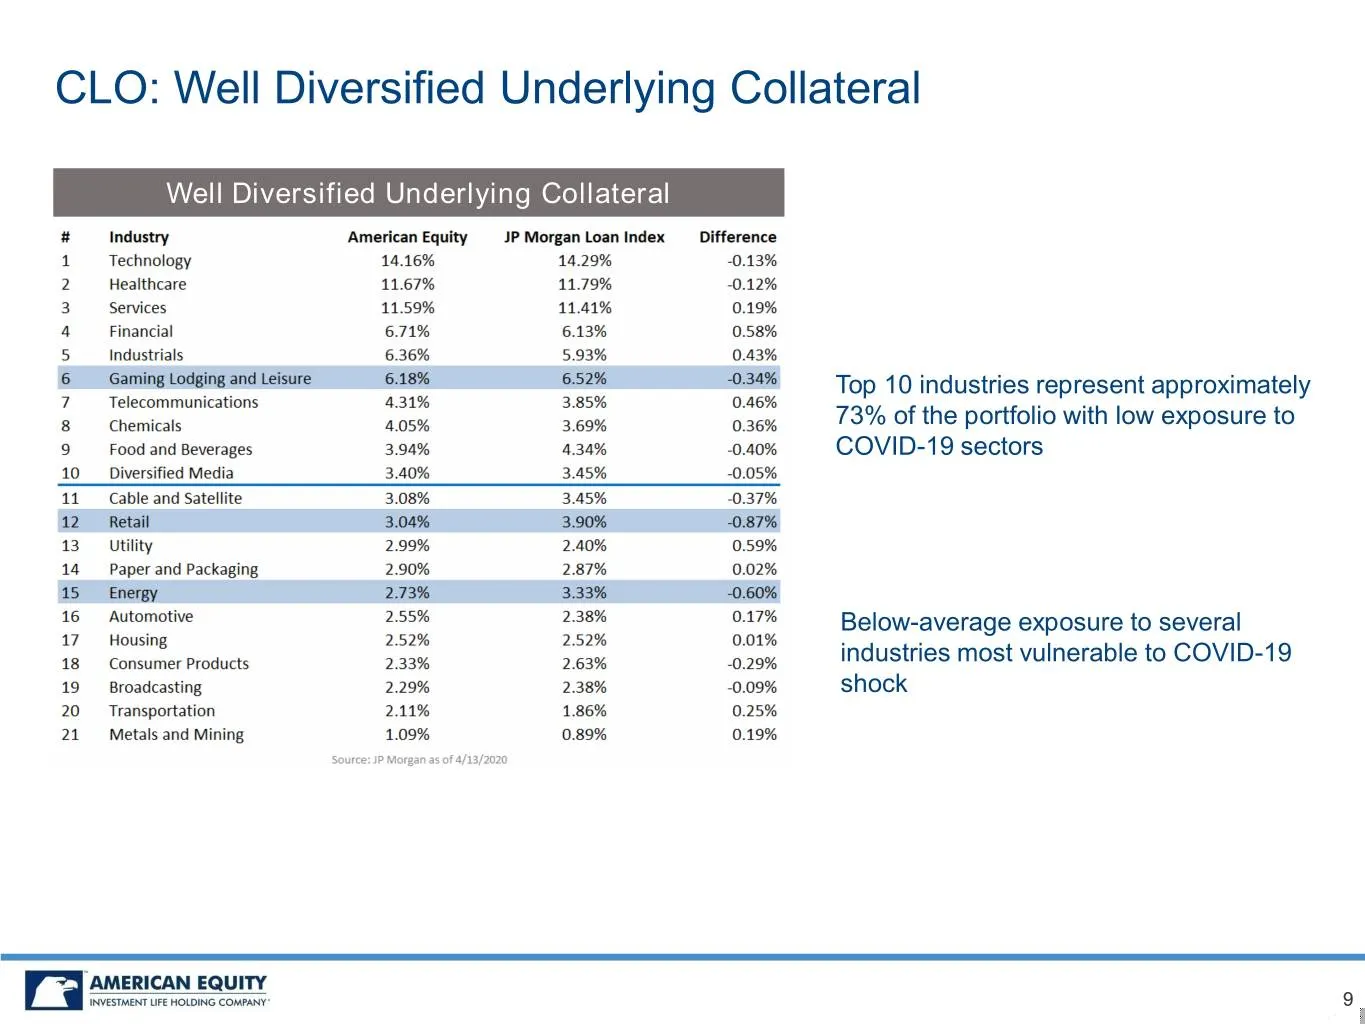
Slide 9: CLO: Well Diversified Underlying Collateral
CLO: Well Diversified Underlying Collateral Well Diversified Underlying Collateral Top 10 industries represent approximately 73% of the portfolio with low exposure to COVID-19 sectors Below-average exposure to several industries most vulnerable to COVID-19 shock 9
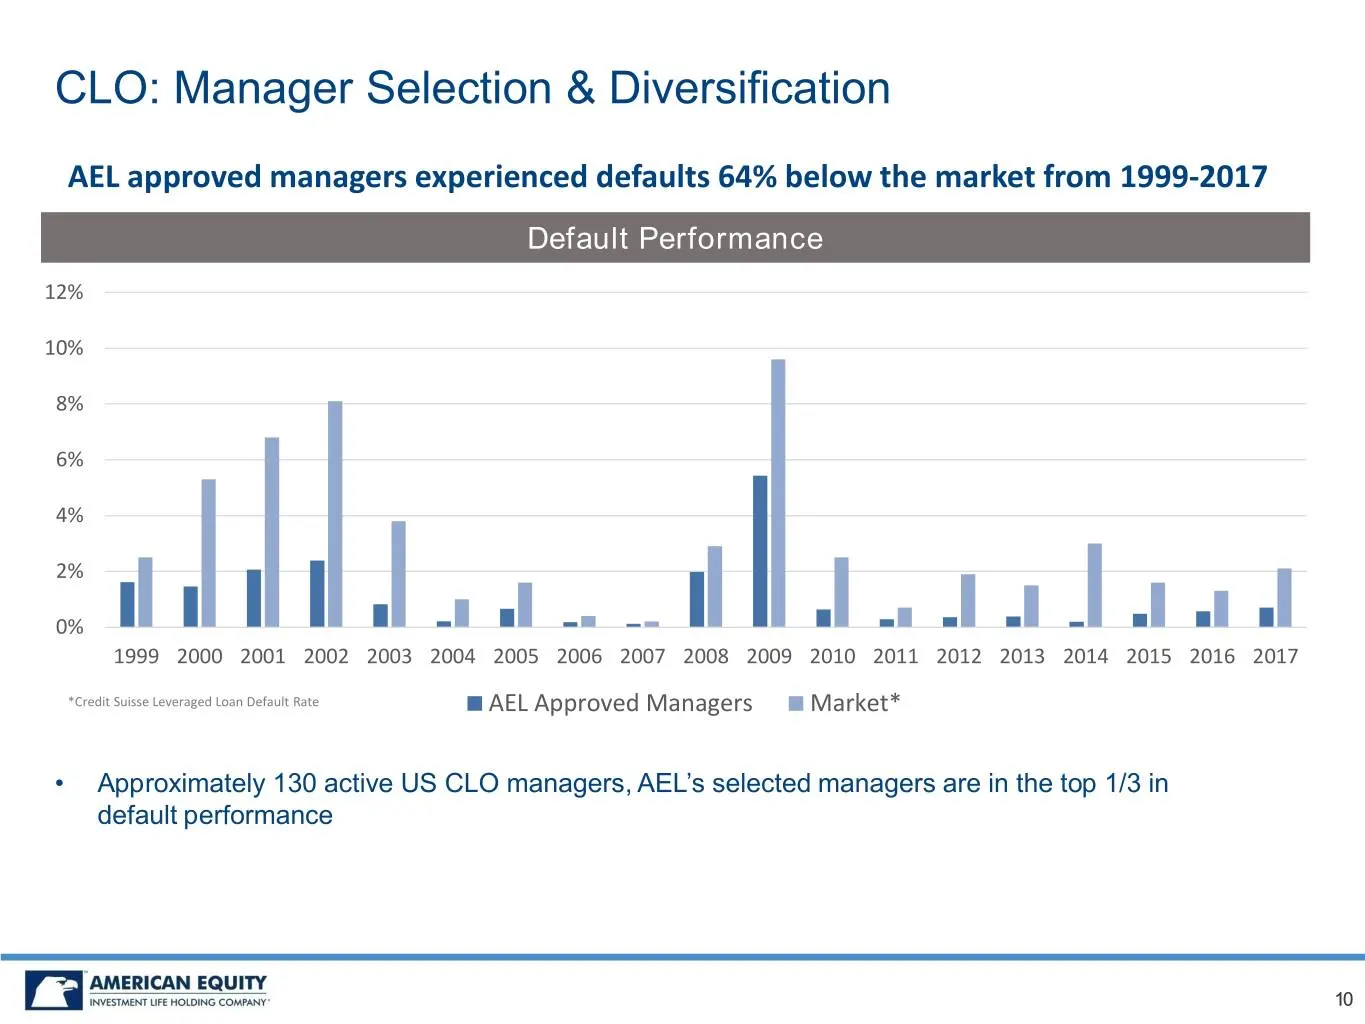
Slide 10: CLO: Manager Selection & Diversification
CLO: Manager Selection & Diversification AEL approved managers experienced defaults 64% below the market from 1999-2017 Default Performance 12% 10% 8% 6% 4% 2% 0% 1999 2000 2001 2002 2003 2004 2005 2006 2007 2008 2009 2010 2011 2012 2013 2014 2015 2016 2017 *Credit Suisse Leveraged Loan Default Rate
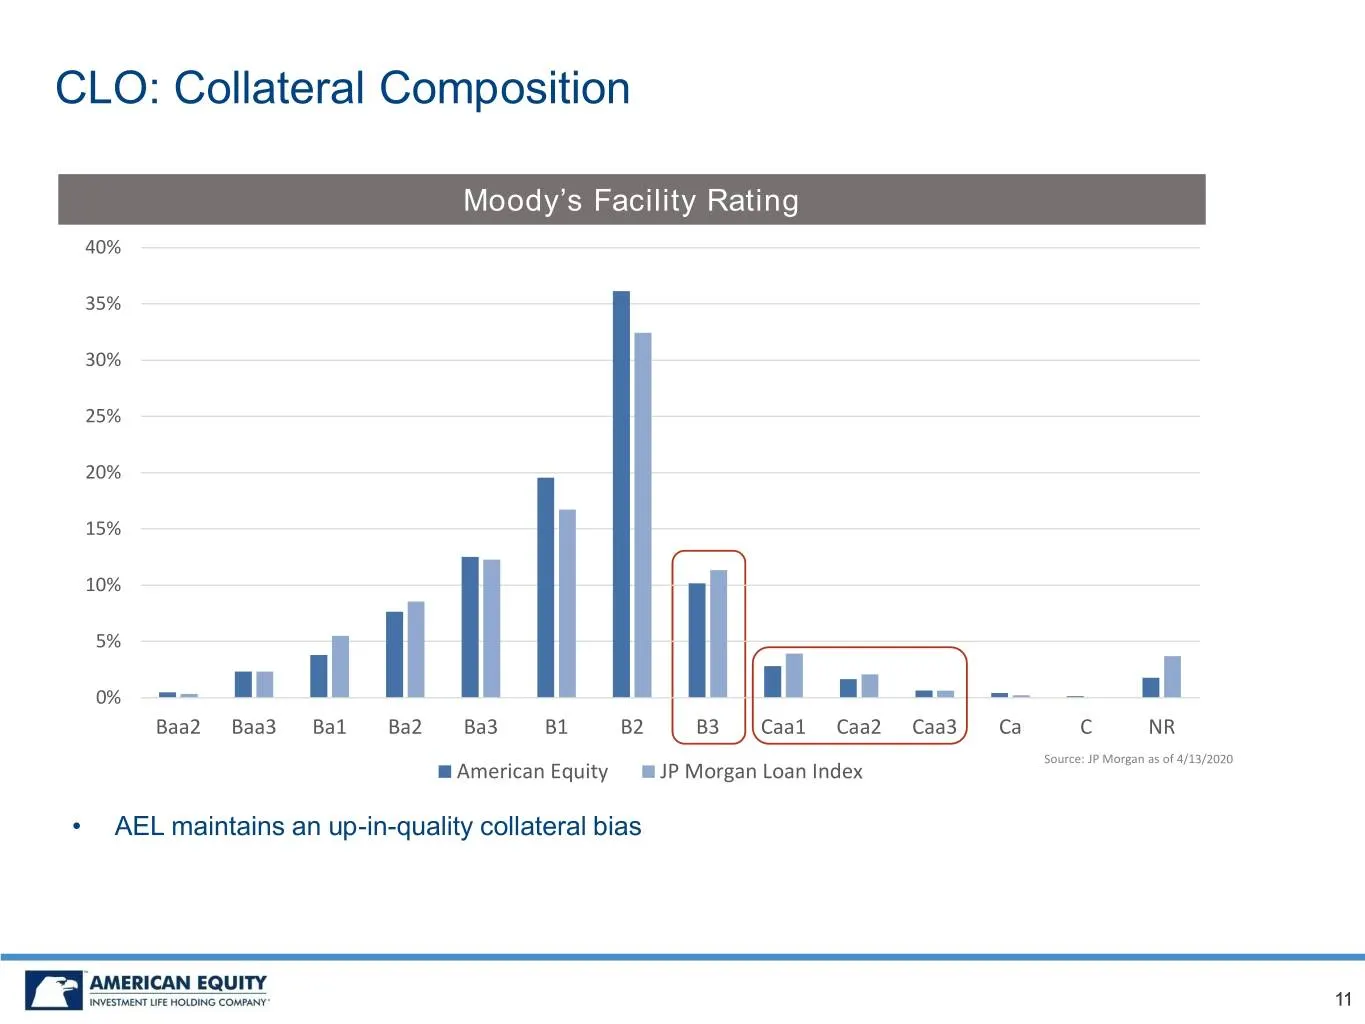
Slide 11: CLO: Collateral Composition
CLO: Collateral Composition Moody’s Facility Rating 40% 35% 30% 25% 20% 15% 10% 5% 0% Baa2 Baa3 Ba1 Ba2 Ba3 B1 B2 B3 Caa1 Caa2 Caa3 Ca C NR Source: JP Morgan as of 4/13/2020 American Equity JP Morgan Loan Index • AEL maintains an up-in-quality collateral bias 11
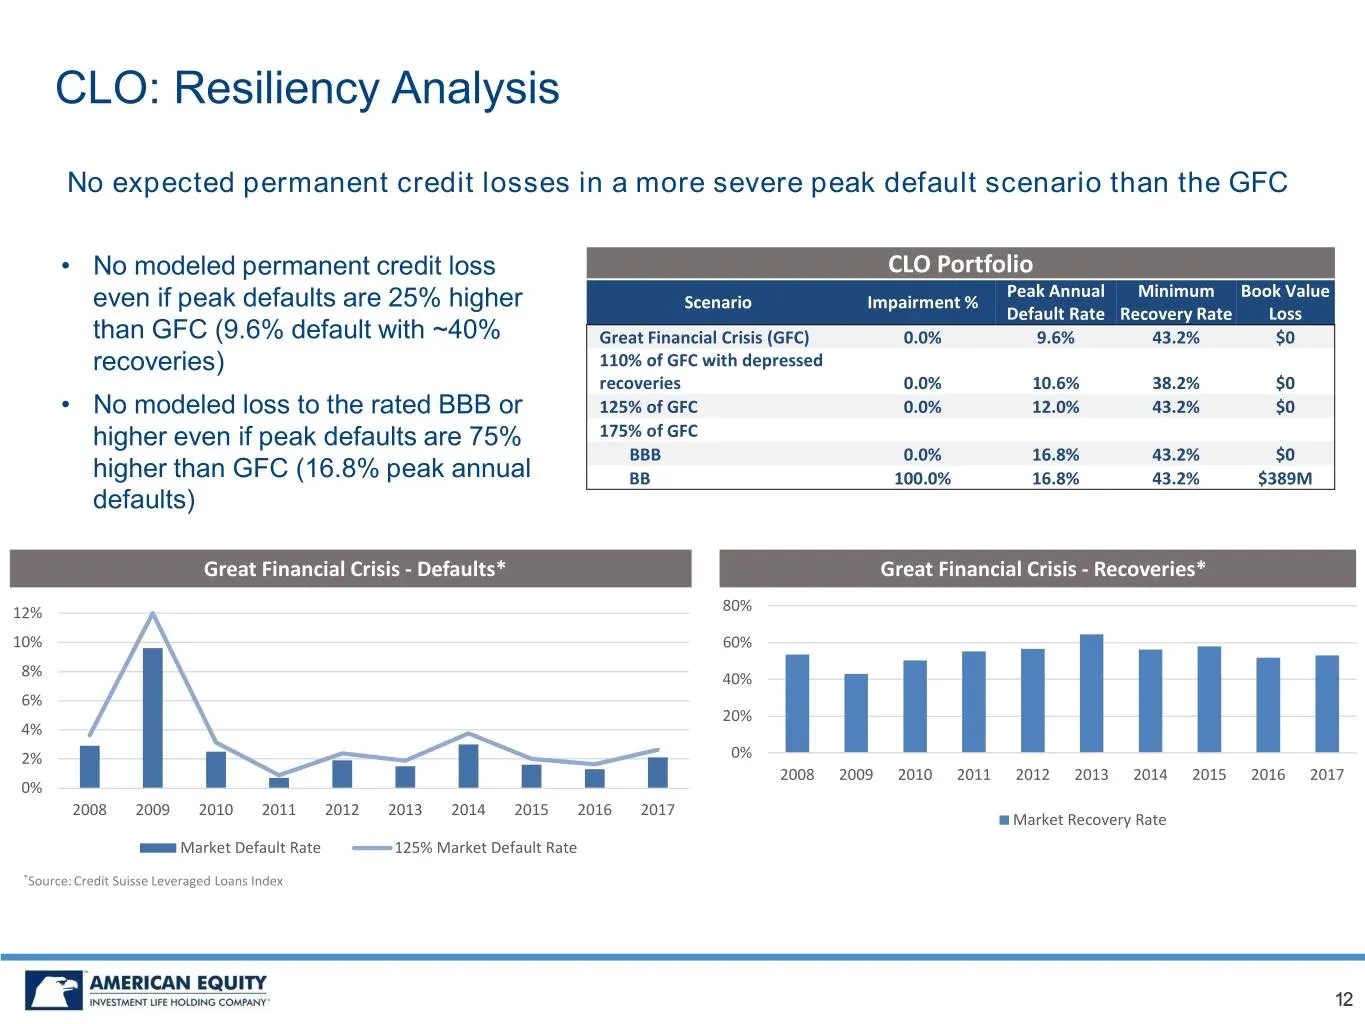
Slide 12: CLO: Resiliency Analysis
CLO: Resiliency Analysis No expected permanent credit losses in a more severe peak default scenario than the GFC • No modeled permanent credit loss CLO Portfolio Peak Annual Minimum Book Value even if peak defaults are 25% higher Scenario Impairment % Default Rate Recovery Rate Loss than GFC (9.6% d
Slide 13: Non-Agency CMBS Overview
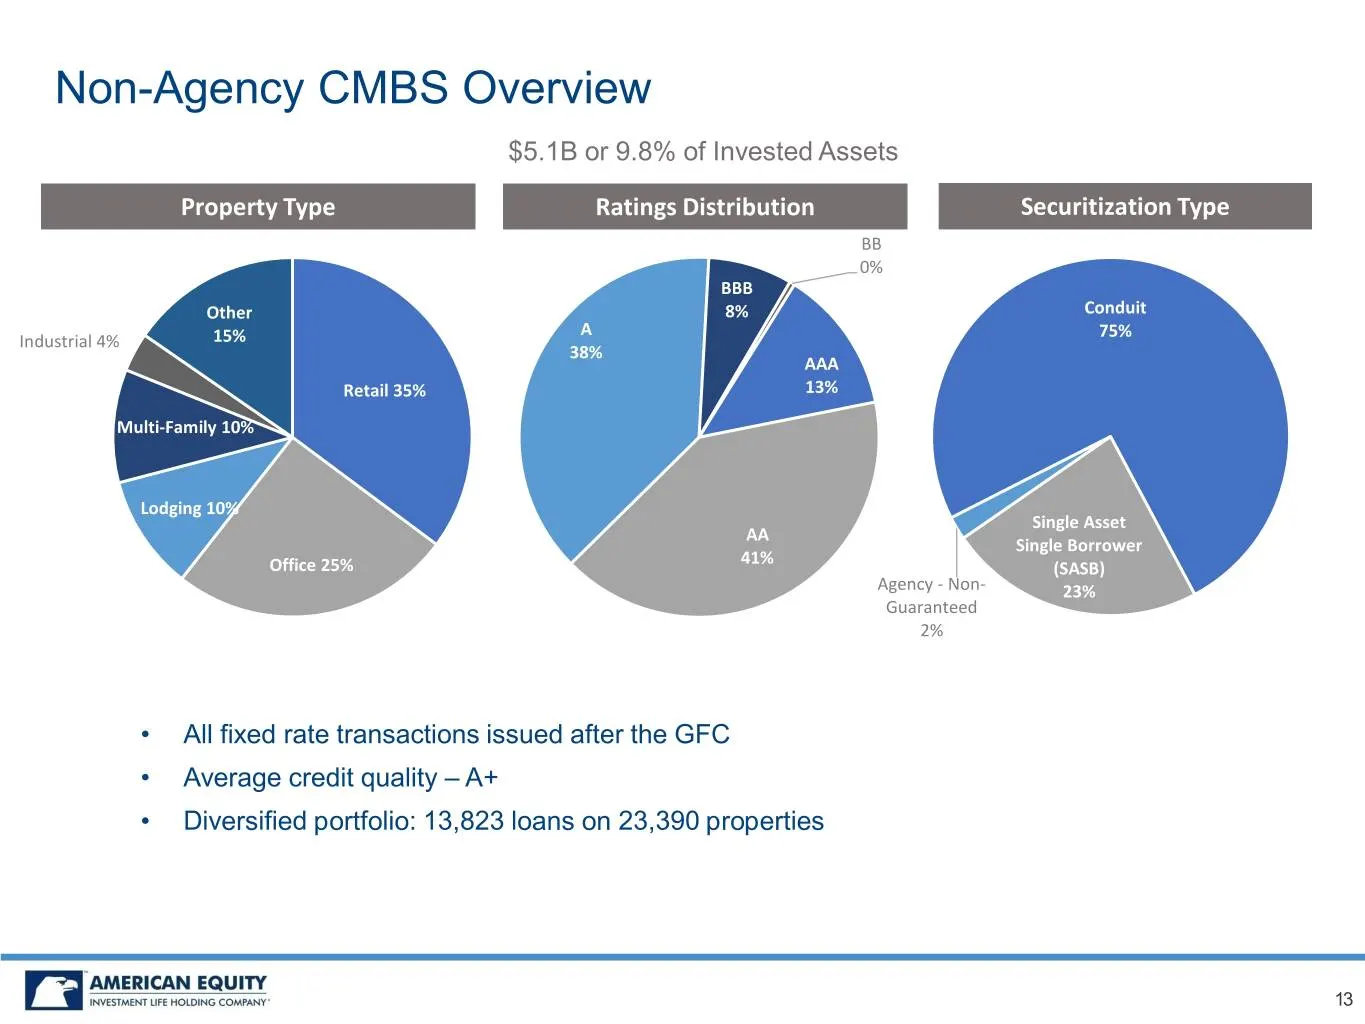
Non-Agency CMBS Overview $5.1B or 9.8% of Invested Assets Property Type Ratings Distribution Securitization Type BB 0% BBB Other 8% Conduit A 75% Industrial 4% 15% 38% AAA Retail 35% 13% Multi-Family 10% Lodging 10% Single Asset AA Single Borrower 41% Office 25% (SASB) Agency - Non- 23% Guaranteed 2
Slide 14: Non-Agency CMBS: Single Asset Single Borrower (SASB)
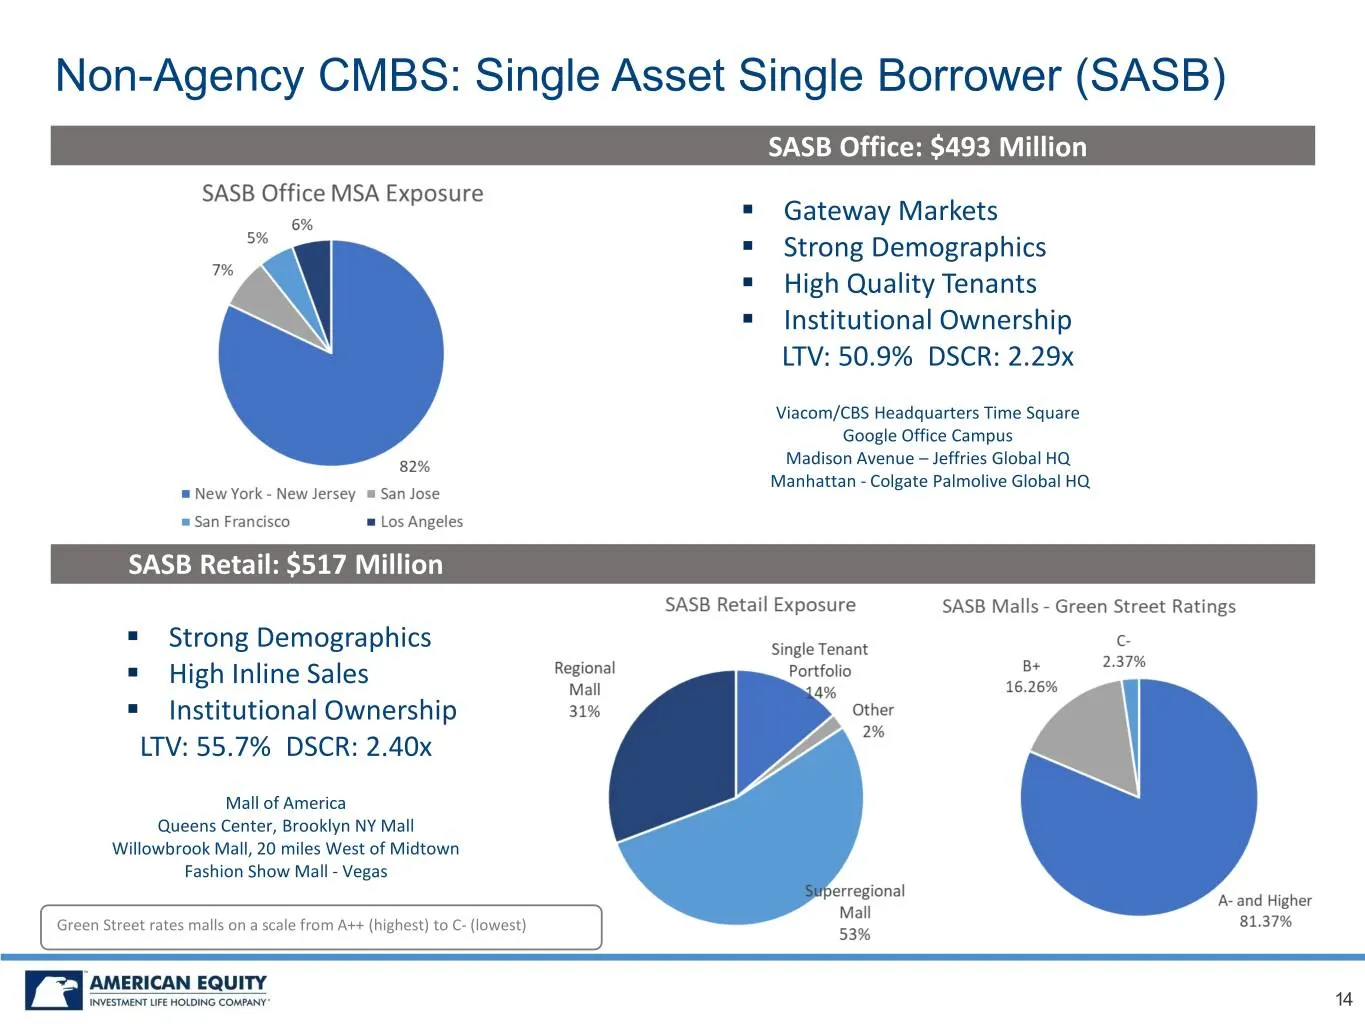
Non-Agency CMBS: Single Asset Single Borrower (SASB) SASB Office: $493 Million . Gateway Markets . Strong Demographics . High Quality Tenants . Institutional Ownership LTV: 50.9% DSCR: 2.29x Viacom/CBS Headquarters Time Square Google Office Campus Madison Avenue – Jeffries Global HQ Manhattan - Colg
Slide 15: Non-Agency CMBS: Lodging & Retail
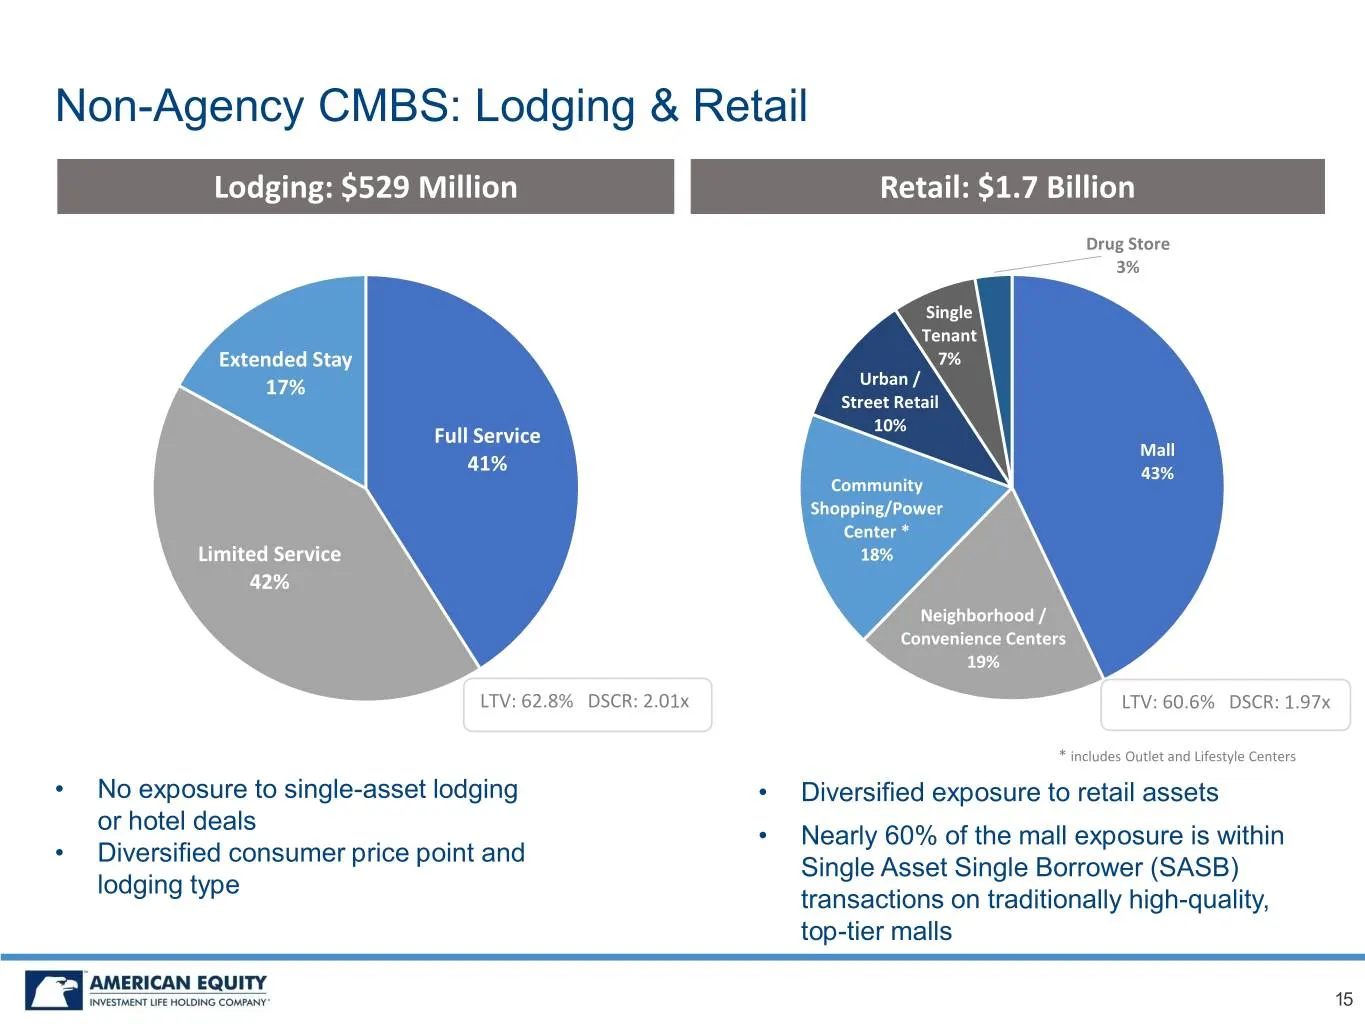
Non-Agency CMBS: Lodging & Retail Lodging: $529 Million Retail: $1.7 Billion Drug Store 3% Single Tenant Extended Stay 7% 17% Urban / Street Retail Full Service 10% Mall 41% 43% Community Shopping/Power Center * Limited Service 18% 42% Neighborhood / Convenience Centers 19% LTV: 62.8% DSCR: 2.01x LT
Slide 16: Non-Agency CMBS: Disciplined Investment Process
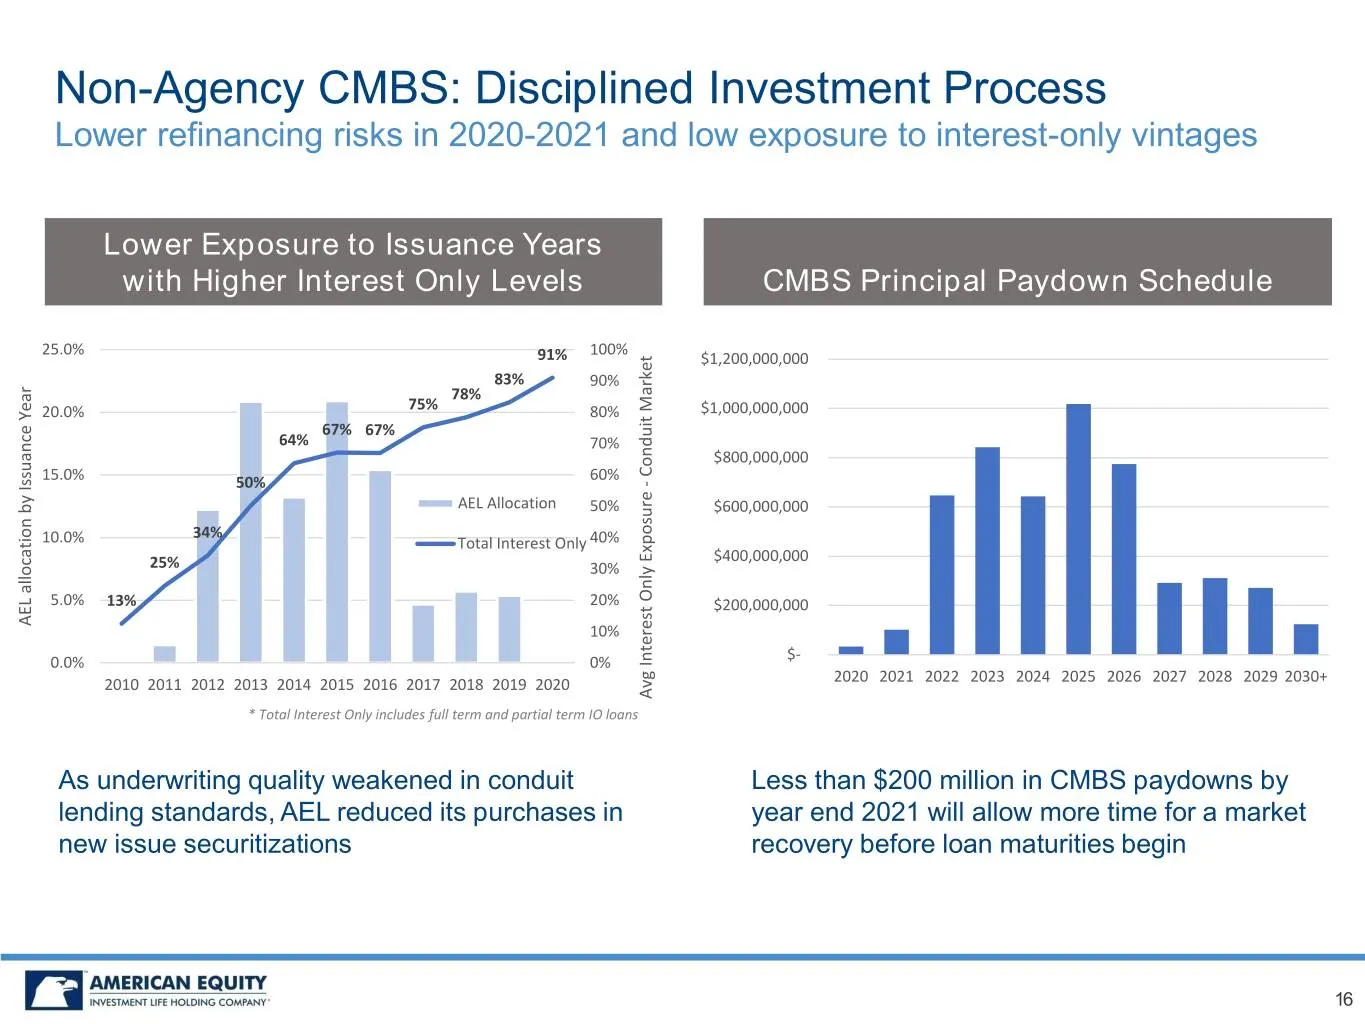
Non-Agency CMBS: Disciplined Investment Process Lower refinancing risks in 2020-2021 and low exposure to interest-only vintages Lower Exposure to Issuance Years with Higher Interest Only Levels CMBS Principal Paydown Schedule 25.0% 100% 91% $1,200,000,000 83% 90% 78% 20.0% 75% 80% $1,000,000,000 67%
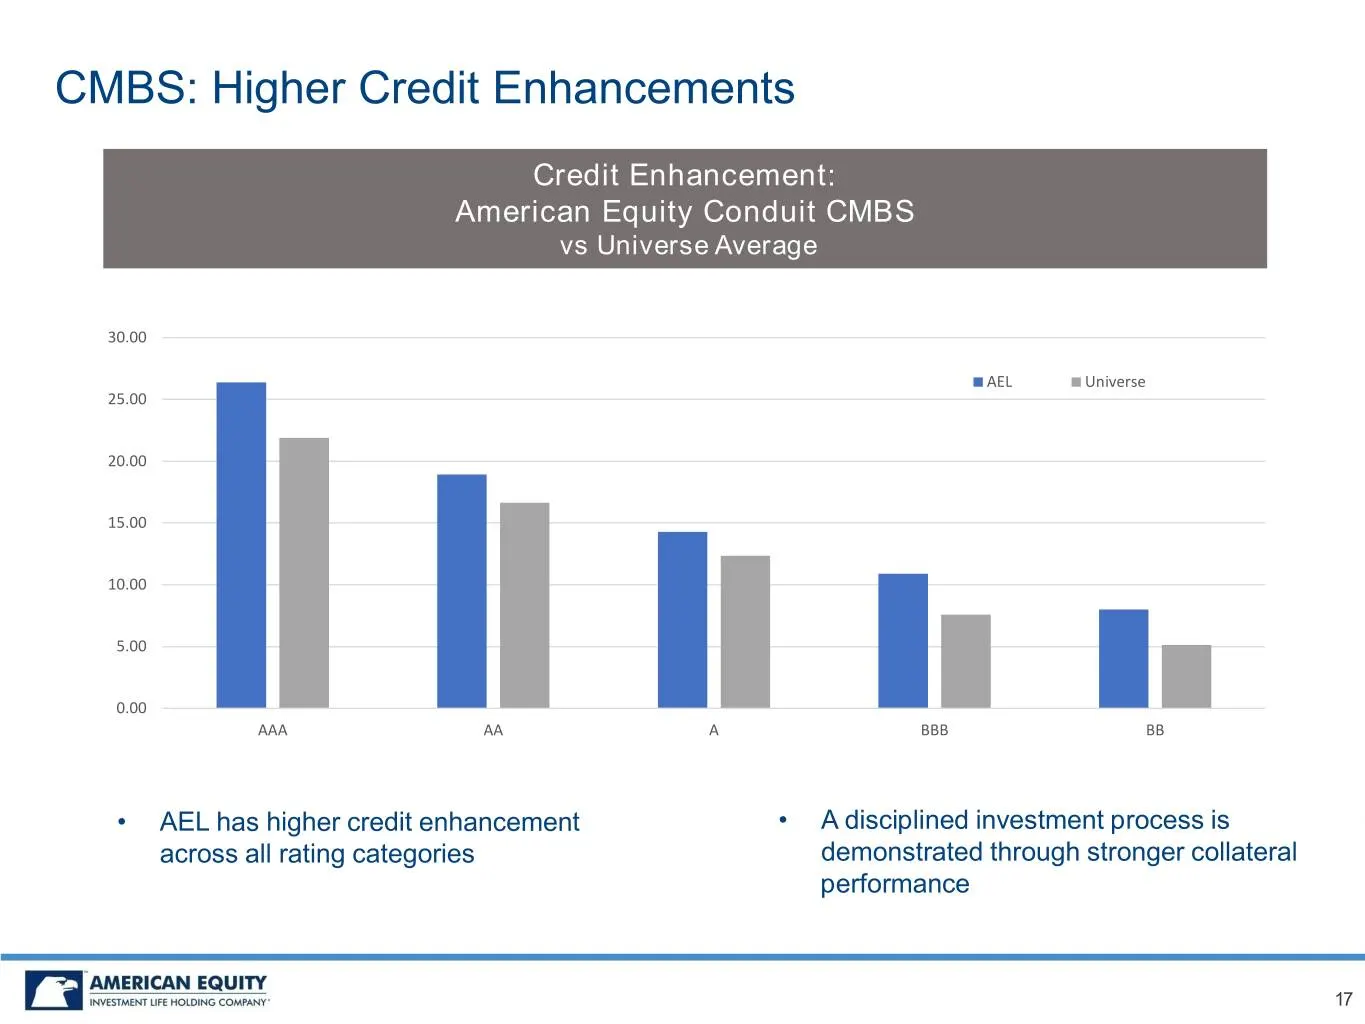
Slide 17: CMBS: Higher Credit Enhancements
CMBS: Higher Credit Enhancements Credit Enhancement: American Equity Conduit CMBS vs Universe Average 30.00 AEL Universe 25.00 20.00 15.00 10.00 5.00 0.00 AAA AA A BBB BB • AEL has higher credit enhancement • A disciplined investment process is across all rating categories demonstrated through stron
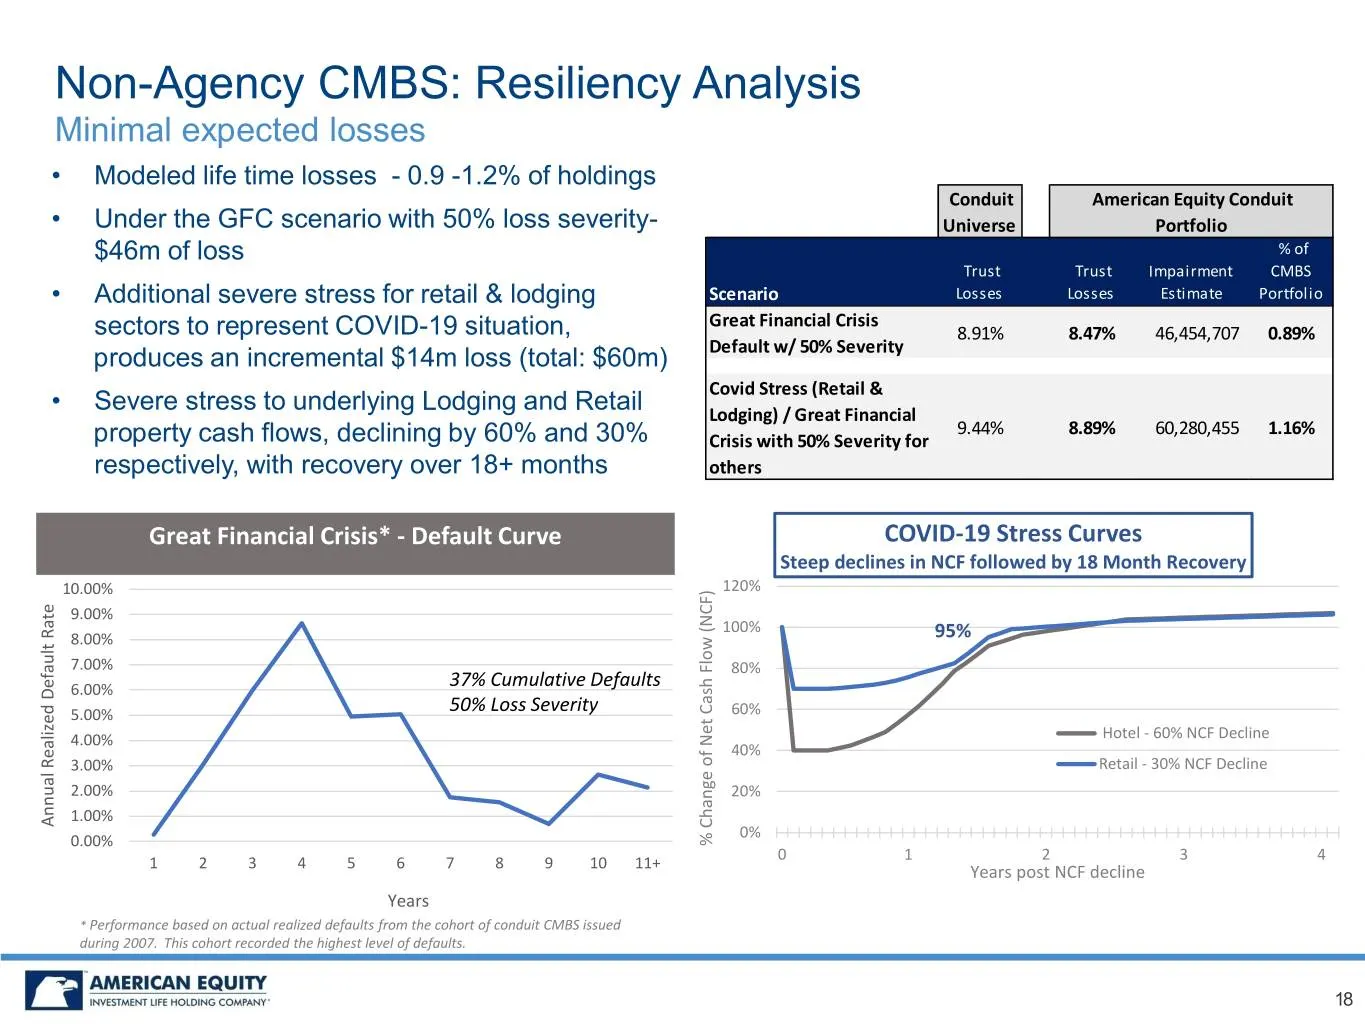
Slide 18: Non-Agency CMBS: Resiliency Analysis
Non-Agency CMBS: Resiliency Analysis Minimal expected losses • Modeled life time losses - 0.9 -1.2% of holdings Conduit American Equity Conduit • Under the GFC scenario with 50% loss severity- Universe Portfolio $46m of loss % of Trust Trust Impairment CMBS • Additional severe stress for retail & lo
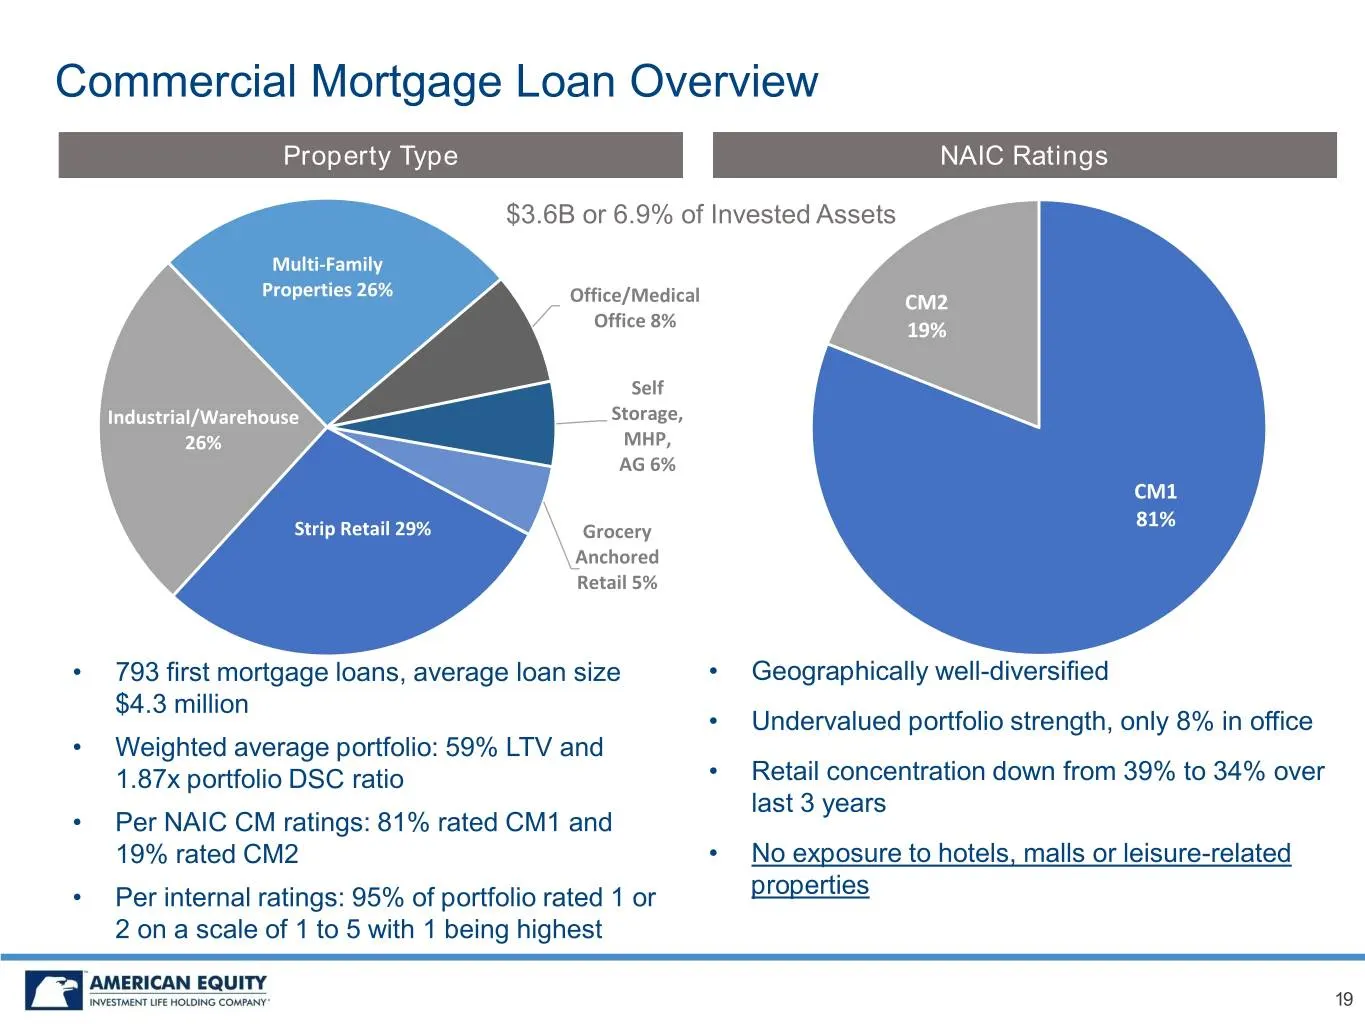
Slide 19: Commercial Mortgage Loan Overview
Commercial Mortgage Loan Overview Property Type NAIC Ratings $3.6B or 6.9% of Invested Assets Multi-Family Properties 26% Office/Medical CM2 Office 8% 19% Self Industrial/Warehouse Storage, 26% MHP, AG 6% CM1 81% Strip Retail 29% Grocery Anchored Retail 5% • 793 first mortgage loans, average loan si
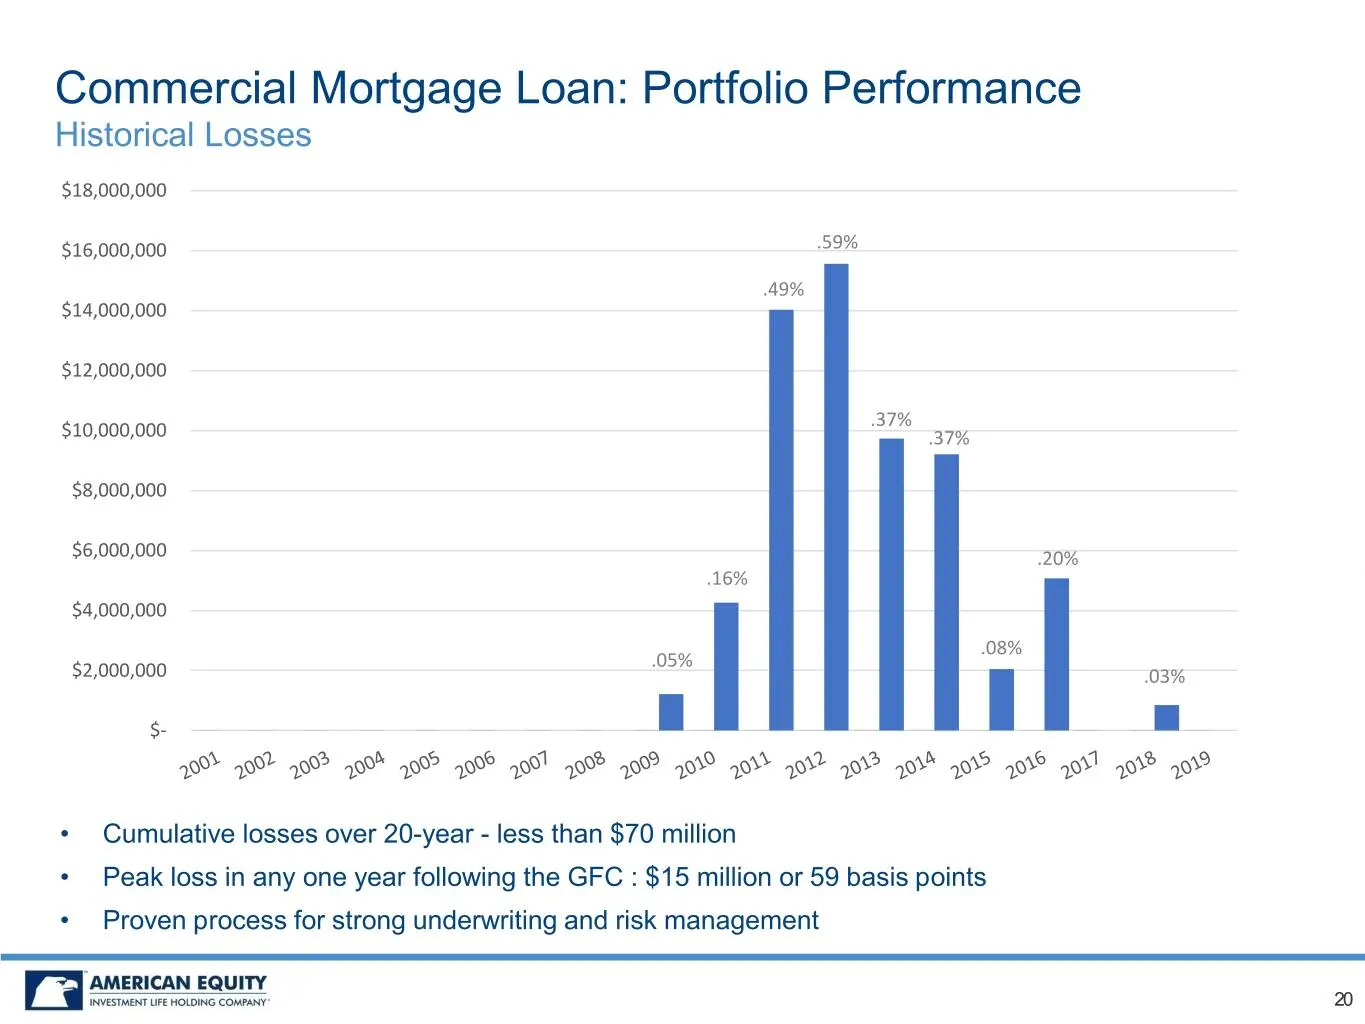
Slide 20: Commercial Mortgage Loan: Portfolio Performance
Commercial Mortgage Loan: Portfolio Performance Historical Losses $18,000,000 $16,000,000 .59% .49% $14,000,000 $12,000,000 .37% $10,000,000 .37% $8,000,000 $6,000,000 .20% .16% $4,000,000 .08% .05% $2,000,000 .03% $- • Cumulative losses over 20-year - less than $70 million • Peak loss in any one ye
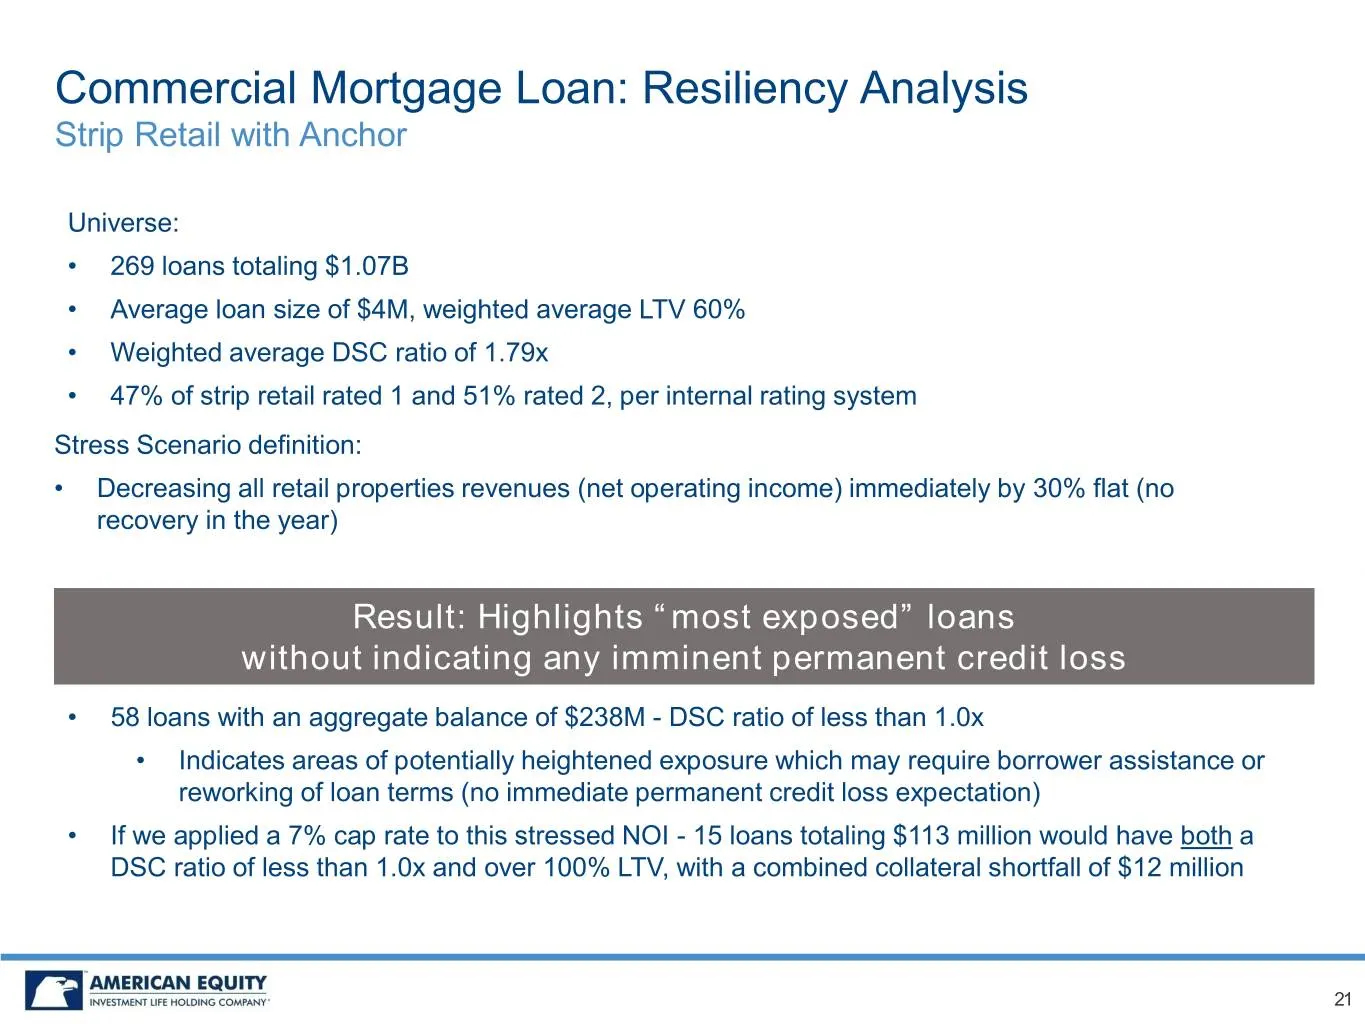
Slide 21: Commercial Mortgage Loan: Resiliency Analysis
Commercial Mortgage Loan: Resiliency Analysis Strip Retail with Anchor Universe: • 269 loans totaling $1.07B • Average loan size of $4M, weighted average LTV 60% • Weighted average DSC ratio of 1.79x • 47% of strip retail rated 1 and 51% rated 2, per internal rating system Stress Scenario definition
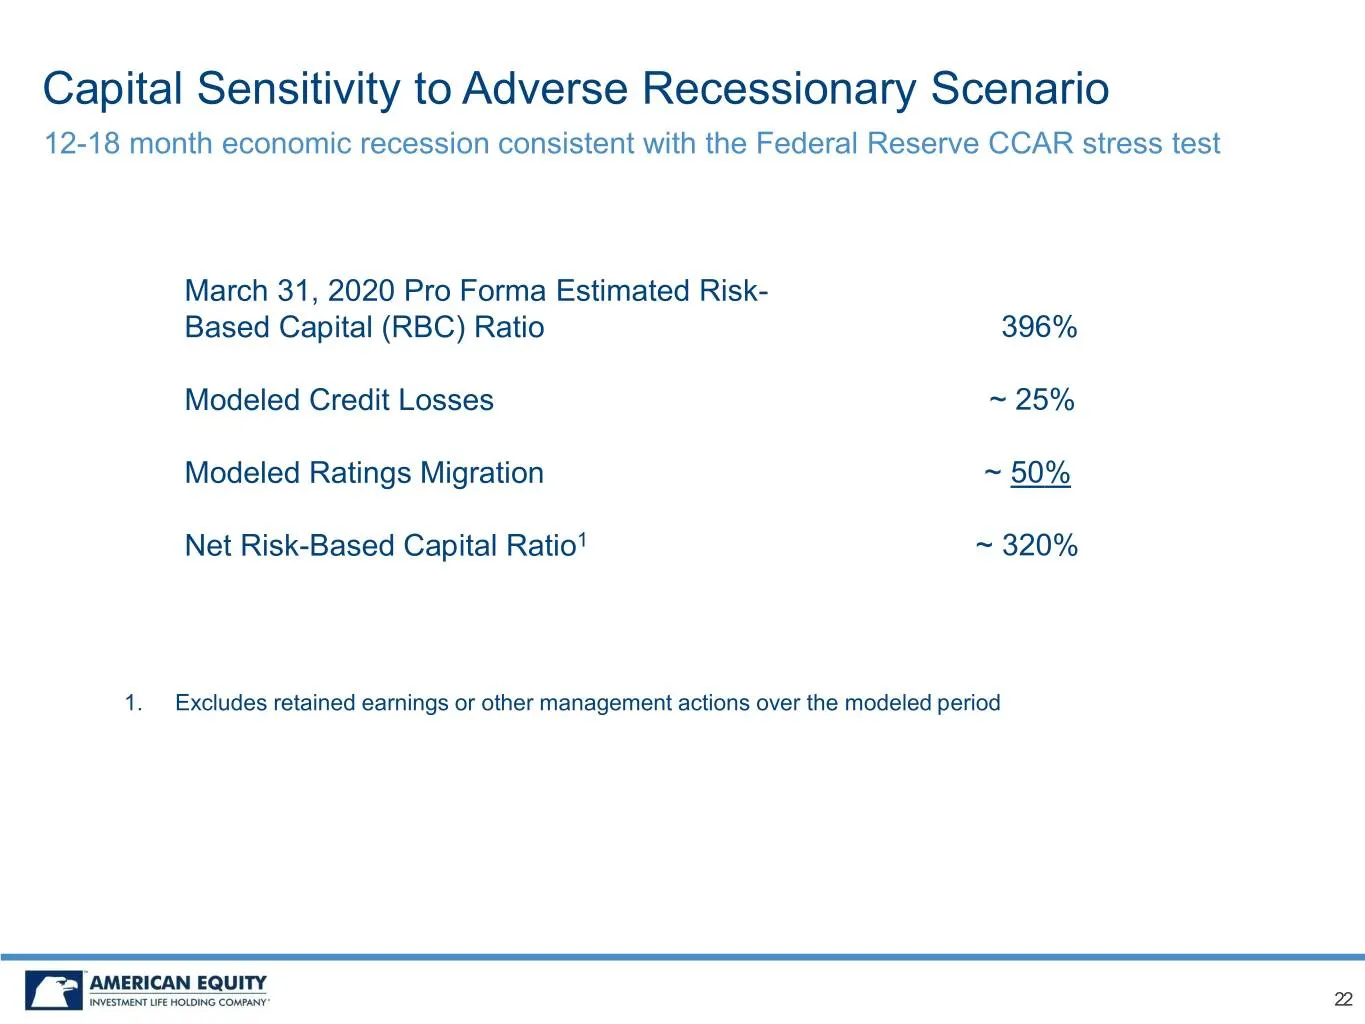
Slide 22: Capital Sensitivity to Adverse Recessionary Scenario
Capital Sensitivity to Adverse Recessionary Scenario 12-18 month economic recession consistent with the Federal Reserve CCAR stress test March 31, 2020 Pro Forma Estimated Risk- Based Capital (RBC) Ratio 396% Modeled Credit Losses ~ 25% Modeled Ratings Migration ~ 50% Net Risk-Based Capital Ratio1 ~
Source: SEC EDGAR · 8-K filed May 6, 2020
More decks from American National Group Inc
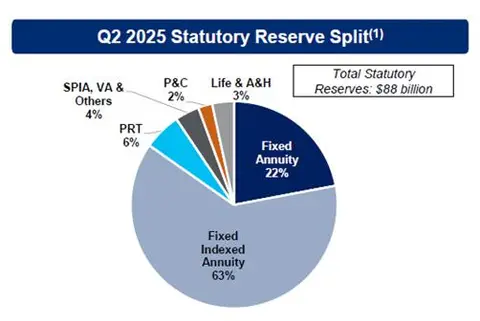 Q2 2025 Earnings Presentation5 slides · Aug 18, 2025
 American Equity Investment Life Holding — Investor Day (December 2022)27 slides · Dec 7, 2022
 American Equity Investment Life Holding — FY2021 Earnings Presentation8 slides · Feb 17, 2022
 American Equity Investment Life Holding — Investor Presentation (December 2020)21 slides · Dec 9, 2020
 American Equity Investment Life Holding — Merger or Acquisition (October 2020)11 slides · Oct 26, 2020
 American Equity Investment Life Holding — Merger or Acquisition (October 2020)8 slides · Oct 19, 2020